Cities with the Highest Percentage of Population Employed in Mining, Quarrying, & Extraction in New Mexico
RELATED REPORTS & OPTIONS
Mining, Quarrying, & Extraction
New Mexico
Compare Cities
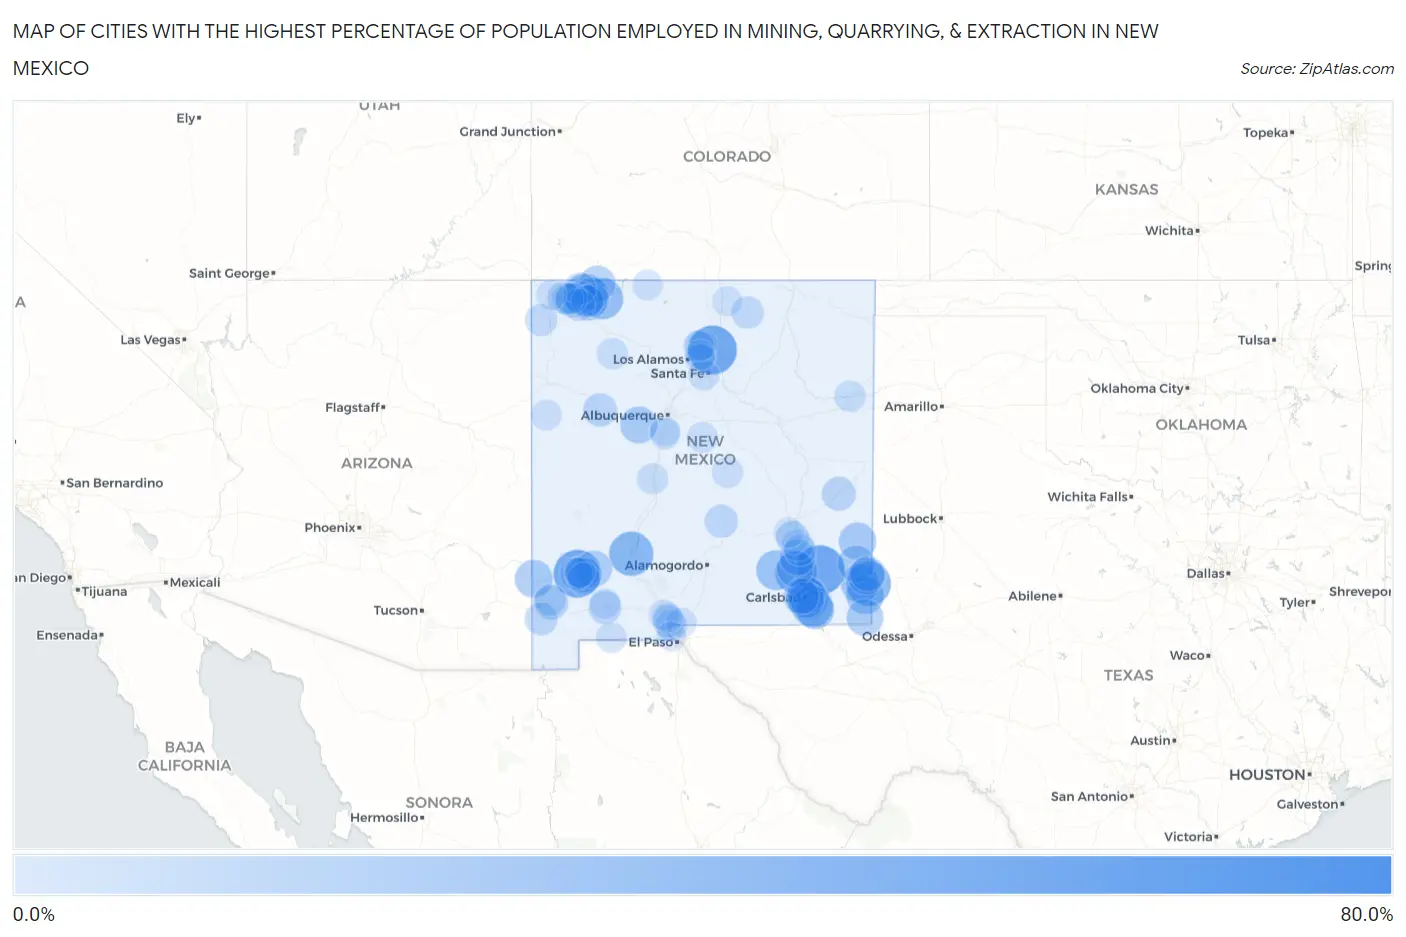
Map of Cities with the Highest Percentage of Population Employed in Mining, Quarrying, & Extraction in New Mexico
0.0%
80.0%
Cities with the Highest Percentage of Population Employed in Mining, Quarrying, & Extraction in New Mexico
| City | % Employed | vs State | vs National | |
| 1. | Casas Adobes | 66.7% | 2.1%(+64.5)#1 | 0.44%(+66.2)#19 |
| 2. | Loco Hills | 48.6% | 2.1%(+46.5)#2 | 0.44%(+48.2)#45 |
| 3. | Cordova | 46.8% | 2.1%(+44.7)#3 | 0.44%(+46.4)#48 |
| 4. | Rosedale | 44.4% | 2.1%(+42.3)#4 | 0.44%(+44.0)#51 |
| 5. | Nadine | 36.2% | 2.1%(+34.1)#5 | 0.44%(+35.8)#81 |
| 6. | Las Palomas | 35.4% | 2.1%(+33.3)#6 | 0.44%(+35.0)#84 |
| 7. | Flora Vista | 30.7% | 2.1%(+28.6)#7 | 0.44%(+30.3)#108 |
| 8. | Atoka | 30.5% | 2.1%(+28.4)#8 | 0.44%(+30.1)#110 |
| 9. | Livingston Wheeler | 29.6% | 2.1%(+27.5)#9 | 0.44%(+29.2)#120 |
| 10. | Blanco | 28.3% | 2.1%(+26.1)#10 | 0.44%(+27.8)#132 |
| 11. | Loving | 27.9% | 2.1%(+25.8)#11 | 0.44%(+27.4)#138 |
| 12. | Hope | 25.0% | 2.1%(+22.9)#12 | 0.44%(+24.6)#168 |
| 13. | Monument | 21.0% | 2.1%(+18.9)#13 | 0.44%(+20.5)#227 |
| 14. | Malaga | 20.9% | 2.1%(+18.8)#14 | 0.44%(+20.4)#231 |
| 15. | Eunice | 20.6% | 2.1%(+18.5)#15 | 0.44%(+20.2)#233 |
| 16. | Virden | 19.8% | 2.1%(+17.6)#16 | 0.44%(+19.3)#253 |
| 17. | La Huerta | 19.3% | 2.1%(+17.2)#17 | 0.44%(+18.9)#263 |
| 18. | Catalpa Canyon | 19.2% | 2.1%(+17.1)#18 | 0.44%(+18.8)#265 |
| 19. | Tatum | 18.8% | 2.1%(+16.6)#19 | 0.44%(+18.3)#278 |
| 20. | Highland Meadows | 17.6% | 2.1%(+15.5)#20 | 0.44%(+17.1)#307 |
| 21. | Lovington | 17.5% | 2.1%(+15.4)#21 | 0.44%(+17.1)#309 |
| 22. | Jal | 17.3% | 2.1%(+15.2)#22 | 0.44%(+16.9)#319 |
| 23. | Angustura | 17.2% | 2.1%(+15.1)#23 | 0.44%(+16.8)#326 |
| 24. | Hobbs | 17.2% | 2.1%(+15.0)#24 | 0.44%(+16.7)#331 |
| 25. | Mimbres | 17.0% | 2.1%(+14.9)#25 | 0.44%(+16.5)#337 |
| 26. | Artesia | 16.1% | 2.1%(+14.0)#26 | 0.44%(+15.7)#369 |
| 27. | Cedar Hill | 16.1% | 2.1%(+13.9)#27 | 0.44%(+15.6)#370 |
| 28. | Lindrith | 15.9% | 2.1%(+13.8)#28 | 0.44%(+15.4)#378 |
| 29. | West Hammond | 15.5% | 2.1%(+13.4)#29 | 0.44%(+15.0)#388 |
| 30. | Lake Arthur | 14.9% | 2.1%(+12.8)#30 | 0.44%(+14.5)#415 |
| 31. | Carlsbad | 14.9% | 2.1%(+12.8)#31 | 0.44%(+14.4)#417 |
| 32. | Happy Valley | 14.4% | 2.1%(+12.3)#32 | 0.44%(+14.0)#447 |
| 33. | North Hobbs | 13.3% | 2.1%(+11.2)#33 | 0.44%(+12.9)#507 |
| 34. | Bayard | 13.1% | 2.1%(+11.0)#34 | 0.44%(+12.7)#521 |
| 35. | Upper Fruitland | 12.1% | 2.1%(+9.95)#35 | 0.44%(+11.6)#592 |
| 36. | Little Walnut | 11.7% | 2.1%(+9.54)#36 | 0.44%(+11.2)#623 |
| 37. | Santa Clara | 11.6% | 2.1%(+9.44)#37 | 0.44%(+11.1)#628 |
| 38. | Lordsburg | 11.2% | 2.1%(+9.09)#38 | 0.44%(+10.8)#660 |
| 39. | Elida | 10.5% | 2.1%(+8.36)#39 | 0.44%(+10.0)#718 |
| 40. | South River | 10.4% | 2.1%(+8.28)#40 | 0.44%(+9.96)#725 |
| 41. | Grants | 9.6% | 2.1%(+7.46)#41 | 0.44%(+9.13)#793 |
| 42. | Hyde Park | 9.0% | 2.1%(+6.90)#42 | 0.44%(+8.57)#862 |
| 43. | Aztec | 8.9% | 2.1%(+6.78)#43 | 0.44%(+8.46)#876 |
| 44. | Farmington | 8.8% | 2.1%(+6.73)#44 | 0.44%(+8.40)#883 |
| 45. | Midway | 8.7% | 2.1%(+6.58)#45 | 0.44%(+8.26)#901 |
| 46. | Deming | 8.6% | 2.1%(+6.44)#46 | 0.44%(+8.11)#933 |
| 47. | Bloomfield | 8.5% | 2.1%(+6.37)#47 | 0.44%(+8.04)#936 |
| 48. | Nogal | 8.5% | 2.1%(+6.33)#48 | 0.44%(+8.01)#938 |
| 49. | Cotton City | 8.1% | 2.1%(+5.95)#49 | 0.44%(+7.62)#990 |
| 50. | Crouch Mesa | 7.9% | 2.1%(+5.78)#50 | 0.44%(+7.45)#1,017 |
| 51. | Waterflow | 7.9% | 2.1%(+5.74)#51 | 0.44%(+7.41)#1,021 |
| 52. | Haystack | 7.5% | 2.1%(+5.38)#52 | 0.44%(+7.06)#1,079 |
| 53. | Silver City | 7.2% | 2.1%(+5.04)#53 | 0.44%(+6.72)#1,118 |
| 54. | Eagle Nest | 7.0% | 2.1%(+4.92)#54 | 0.44%(+6.60)#1,149 |
| 55. | Sanostee | 6.8% | 2.1%(+4.66)#55 | 0.44%(+6.34)#1,195 |
| 56. | Hurley | 6.8% | 2.1%(+4.65)#56 | 0.44%(+6.33)#1,197 |
| 57. | Center Point | 6.7% | 2.1%(+4.59)#57 | 0.44%(+6.27)#1,207 |
| 58. | Berino | 6.5% | 2.1%(+4.42)#58 | 0.44%(+6.10)#1,241 |
| 59. | La Plata | 6.5% | 2.1%(+4.40)#59 | 0.44%(+6.08)#1,245 |
| 60. | Dexter | 6.2% | 2.1%(+4.07)#60 | 0.44%(+5.75)#1,318 |
| 61. | Napi Headquarters | 6.2% | 2.1%(+4.06)#61 | 0.44%(+5.74)#1,319 |
| 62. | Lee Acres | 5.7% | 2.1%(+3.58)#62 | 0.44%(+5.26)#1,412 |
| 63. | Glen Acres | 5.6% | 2.1%(+3.52)#63 | 0.44%(+5.19)#1,434 |
| 64. | Nenahnezad | 5.6% | 2.1%(+3.51)#64 | 0.44%(+5.18)#1,440 |
| 65. | Hagerman | 5.5% | 2.1%(+3.34)#65 | 0.44%(+5.01)#1,484 |
| 66. | Kirtland | 5.1% | 2.1%(+2.99)#66 | 0.44%(+4.67)#1,578 |
| 67. | Alcalde | 4.4% | 2.1%(+2.33)#67 | 0.44%(+4.00)#1,785 |
| 68. | Logan | 4.2% | 2.1%(+2.11)#68 | 0.44%(+3.79)#1,853 |
| 69. | Anthony | 4.2% | 2.1%(+2.08)#69 | 0.44%(+3.76)#1,866 |
| 70. | Pueblo Pintado | 3.9% | 2.1%(+1.80)#70 | 0.44%(+3.48)#1,979 |
| 71. | Thunder Mountain | 3.9% | 2.1%(+1.77)#71 | 0.44%(+3.44)#1,994 |
| 72. | Lemitar | 3.8% | 2.1%(+1.70)#72 | 0.44%(+3.38)#2,033 |
| 73. | Corona | 3.7% | 2.1%(+1.59)#73 | 0.44%(+3.26)#2,080 |
| 74. | Agua Fria | 3.5% | 2.1%(+1.38)#74 | 0.44%(+3.06)#2,192 |
| 75. | San Jose Cdp Rio Arriba County | 3.4% | 2.1%(+1.25)#75 | 0.44%(+2.92)#2,269 |
| 76. | Valencia | 3.3% | 2.1%(+1.18)#76 | 0.44%(+2.85)#2,309 |
| 77. | Estancia | 3.3% | 2.1%(+1.14)#77 | 0.44%(+2.82)#2,334 |
| 78. | Chamita | 3.2% | 2.1%(+1.06)#78 | 0.44%(+2.74)#2,378 |
| 79. | Crestview | 3.2% | 2.1%(+1.06)#79 | 0.44%(+2.73)#2,384 |
| 80. | Arenas Valley | 3.1% | 2.1%(+0.938)#80 | 0.44%(+2.62)#2,455 |
| 81. | Black Rock | 2.8% | 2.1%(+0.721)#81 | 0.44%(+2.40)#2,595 |
| 82. | Isleta | 2.7% | 2.1%(+0.626)#82 | 0.44%(+2.30)#2,655 |
| 83. | Totah Vista | 2.7% | 2.1%(+0.622)#83 | 0.44%(+2.30)#2,659 |
| 84. | Torreon Cdp Sandoval County | 2.6% | 2.1%(+0.480)#84 | 0.44%(+2.16)#2,788 |
| 85. | Columbus | 2.4% | 2.1%(+0.328)#85 | 0.44%(+2.00)#2,897 |
| 86. | Dulce | 2.4% | 2.1%(+0.294)#86 | 0.44%(+1.97)#2,923 |
| 87. | Keeler Farm | 2.3% | 2.1%(+0.155)#87 | 0.44%(+1.83)#3,030 |
| 88. | San Miguel | 2.1% | 2.1%(-0.005)#88 | 0.44%(+1.67)#3,168 |
| 89. | Santa Fe Foothills | 1.9% | 2.1%(-0.266)#89 | 0.44%(+1.41)#3,407 |
| 90. | Sundance | 1.9% | 2.1%(-0.266)#90 | 0.44%(+1.41)#3,409 |
| 91. | Roswell | 1.8% | 2.1%(-0.312)#91 | 0.44%(+1.37)#3,458 |
| 92. | Chaparral | 1.8% | 2.1%(-0.334)#92 | 0.44%(+1.34)#3,481 |
| 93. | El Rancho | 1.7% | 2.1%(-0.371)#93 | 0.44%(+1.31)#3,513 |
| 94. | Shiprock | 1.7% | 2.1%(-0.460)#94 | 0.44%(+1.22)#3,621 |
| 95. | Vado | 1.6% | 2.1%(-0.512)#95 | 0.44%(+1.16)#3,695 |
| 96. | La Mesilla | 1.6% | 2.1%(-0.558)#96 | 0.44%(+1.12)#3,750 |
| 97. | Questa | 1.5% | 2.1%(-0.604)#97 | 0.44%(+1.07)#3,812 |
| 98. | Tano Road | 1.5% | 2.1%(-0.612)#98 | 0.44%(+1.07)#3,820 |
| 99. | Sunland Park | 1.4% | 2.1%(-0.741)#99 | 0.44%(+0.936)#3,980 |
| 100. | Bosque Farms | 1.3% | 2.1%(-0.771)#100 | 0.44%(+0.907)#4,017 |
Common Questions
What are the Top 10 Cities with the Highest Percentage of Population Employed in Mining, Quarrying, & Extraction in New Mexico?
Top 10 Cities with the Highest Percentage of Population Employed in Mining, Quarrying, & Extraction in New Mexico are:
#1
48.6%
#2
46.8%
#3
44.4%
#4
36.2%
#5
35.4%
#6
30.7%
#7
30.5%
#8
29.6%
#9
28.3%
#10
27.9%
What city has the Highest Percentage of Population Employed in Mining, Quarrying, & Extraction in New Mexico?
Loco Hills has the Highest Percentage of Population Employed in Mining, Quarrying, & Extraction in New Mexico with 48.6%.
What is the Percentage of Population Employed in Mining, Quarrying, & Extraction in the State of New Mexico?
Percentage of Population Employed in Mining, Quarrying, & Extraction in New Mexico is 2.1%.
What is the Percentage of Population Employed in Mining, Quarrying, & Extraction in the United States?
Percentage of Population Employed in Mining, Quarrying, & Extraction in the United States is 0.44%.