San Lorenzo, NM Map & Demographics
San Lorenzo Map
San Lorenzo Overview
$20,948
PER CAPITA INCOME
$67,344
AVG FAMILY INCOME
$67,344
AVG HOUSEHOLD INCOME
0.32
INEQUALITY / GINI INDEX
260
TOTAL POPULATION
61
MALE POPULATION
199
FEMALE POPULATION
30.65
MALES / 100 FEMALES
326.23
FEMALES / 100 MALES
44.6
MEDIAN AGE
5.4
AVG FAMILY SIZE
5.4
AVG HOUSEHOLD SIZE
40
LABOR FORCE [ PEOPLE ]
23.0%
PERCENT IN LABOR FORCE
San Lorenzo Area Codes
Income in San Lorenzo
Income Overview in San Lorenzo
Per Capita Income in San Lorenzo is $20,948, while median incomes of families and households are $67,344 and $67,344 respectively.
| Characteristic | Number | Measure |
| Per Capita Income | 260 | $20,948 |
| Median Family Income | 48 | $67,344 |
| Mean Family Income | 48 | $104,469 |
| Median Household Income | 48 | $67,344 |
| Mean Household Income | 48 | $104,469 |
| Income Deficit | 48 | $0 |
| Wage / Income Gap (%) | 260 | 0.00% |
| Wage / Income Gap ($) | 260 | 100.00¢ per $1 |
| Gini / Inequality Index | 260 | 0.32 |
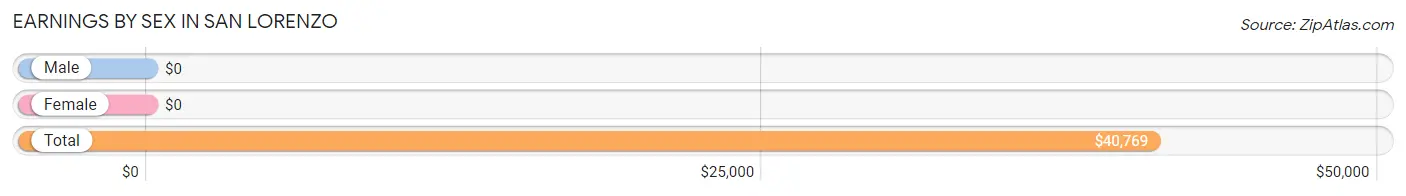
Earnings by Sex in San Lorenzo
| Sex | Number | Average Earnings |
| Male | 11 (27.5%) | $0 |
| Female | 29 (72.5%) | $0 |
| Total | 40 (100.0%) | $40,769 |
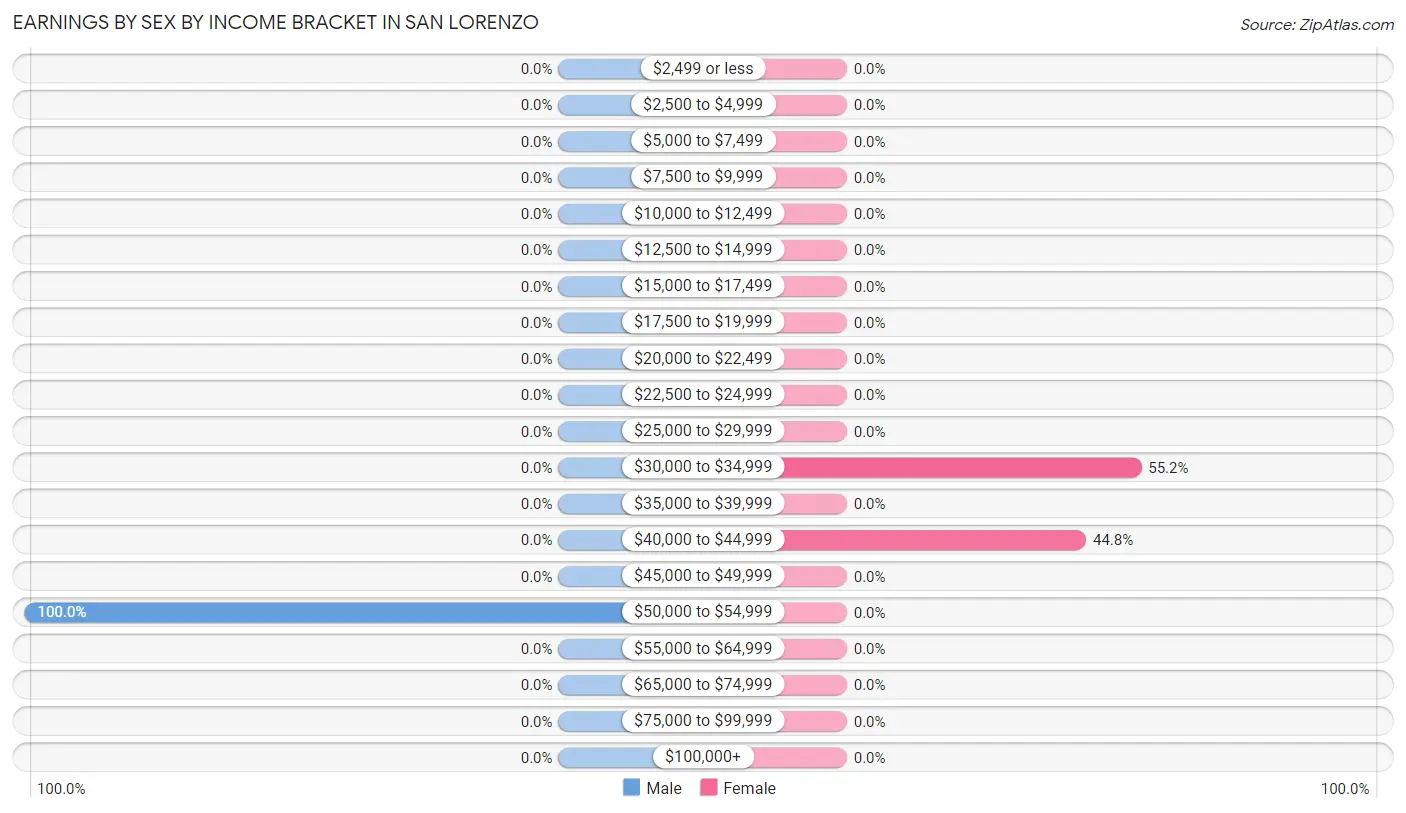
Earnings by Sex by Income Bracket in San Lorenzo
The most common earnings brackets in San Lorenzo are $50,000 to $54,999 for men (11 | 100.0%) and $30,000 to $34,999 for women (16 | 55.2%).
| Income | Male | Female |
| $2,499 or less | 0 (0.0%) | 0 (0.0%) |
| $2,500 to $4,999 | 0 (0.0%) | 0 (0.0%) |
| $5,000 to $7,499 | 0 (0.0%) | 0 (0.0%) |
| $7,500 to $9,999 | 0 (0.0%) | 0 (0.0%) |
| $10,000 to $12,499 | 0 (0.0%) | 0 (0.0%) |
| $12,500 to $14,999 | 0 (0.0%) | 0 (0.0%) |
| $15,000 to $17,499 | 0 (0.0%) | 0 (0.0%) |
| $17,500 to $19,999 | 0 (0.0%) | 0 (0.0%) |
| $20,000 to $22,499 | 0 (0.0%) | 0 (0.0%) |
| $22,500 to $24,999 | 0 (0.0%) | 0 (0.0%) |
| $25,000 to $29,999 | 0 (0.0%) | 0 (0.0%) |
| $30,000 to $34,999 | 0 (0.0%) | 16 (55.2%) |
| $35,000 to $39,999 | 0 (0.0%) | 0 (0.0%) |
| $40,000 to $44,999 | 0 (0.0%) | 13 (44.8%) |
| $45,000 to $49,999 | 0 (0.0%) | 0 (0.0%) |
| $50,000 to $54,999 | 11 (100.0%) | 0 (0.0%) |
| $55,000 to $64,999 | 0 (0.0%) | 0 (0.0%) |
| $65,000 to $74,999 | 0 (0.0%) | 0 (0.0%) |
| $75,000 to $99,999 | 0 (0.0%) | 0 (0.0%) |
| $100,000+ | 0 (0.0%) | 0 (0.0%) |
| Total | 11 (100.0%) | 29 (100.0%) |
Earnings by Sex by Educational Attainment in San Lorenzo
| Educational Attainment | Male Income | Female Income |
| Less than High School | - | - |
| High School Diploma | - | - |
| College or Associate's Degree | - | - |
| Bachelor's Degree | - | - |
| Graduate Degree | - | - |
| Total | - | - |
Family Income in San Lorenzo
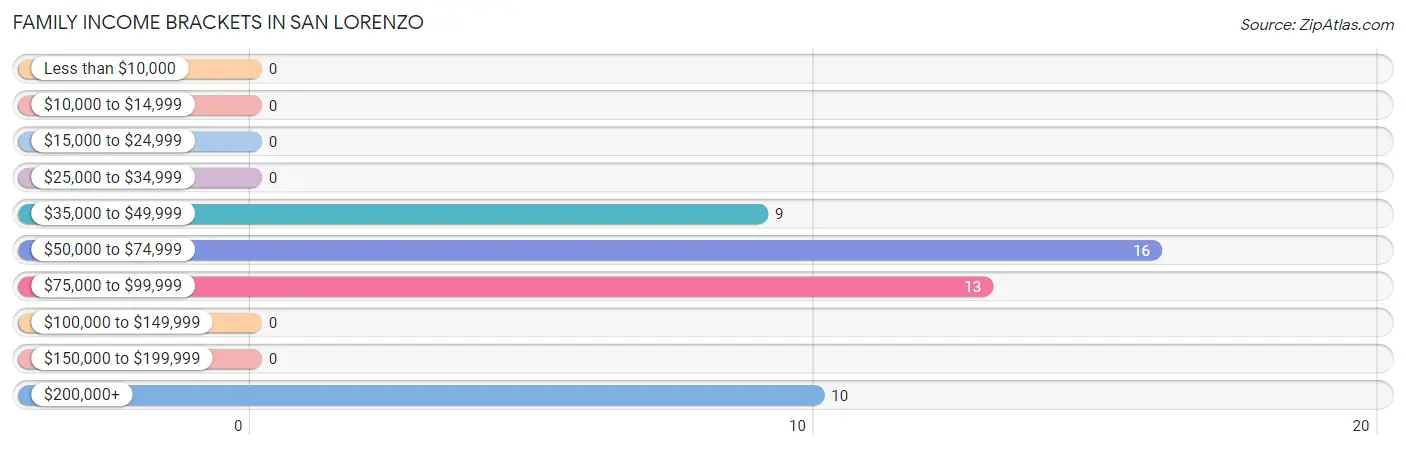
Family Income Brackets in San Lorenzo
According to the San Lorenzo family income data, there are 16 families falling into the $50,000 to $74,999 income range, which is the most common income bracket and makes up 33.3% of all families.
| Income Bracket | # Families | % Families |
| Less than $10,000 | 0 | 0.0% |
| $10,000 to $14,999 | 0 | 0.0% |
| $15,000 to $24,999 | 0 | 0.0% |
| $25,000 to $34,999 | 0 | 0.0% |
| $35,000 to $49,999 | 9 | 18.8% |
| $50,000 to $74,999 | 16 | 33.3% |
| $75,000 to $99,999 | 13 | 27.1% |
| $100,000 to $149,999 | 0 | 0.0% |
| $150,000 to $199,999 | 0 | 0.0% |
| $200,000+ | 10 | 20.8% |
Family Income by Famaliy Size in San Lorenzo
| Income Bracket | # Families | Median Income |
| 2-Person Families | 19 (39.6%) | $0 |
| 3-Person Families | 0 (0.0%) | $0 |
| 4-Person Families | 16 (33.3%) | $0 |
| 5-Person Families | 0 (0.0%) | $0 |
| 6-Person Families | 0 (0.0%) | $0 |
| 7+ Person Families | 13 (27.1%) | $0 |
| Total | 48 (100.0%) | $67,344 |
Family Income by Number of Earners in San Lorenzo
| Number of Earners | # Families | Median Income |
| No Earners | 19 (39.6%) | $0 |
| 1 Earner | 16 (33.3%) | $0 |
| 2 Earners | 13 (27.1%) | $0 |
| 3+ Earners | 0 (0.0%) | $0 |
| Total | 48 (100.0%) | $67,344 |
Household Income in San Lorenzo
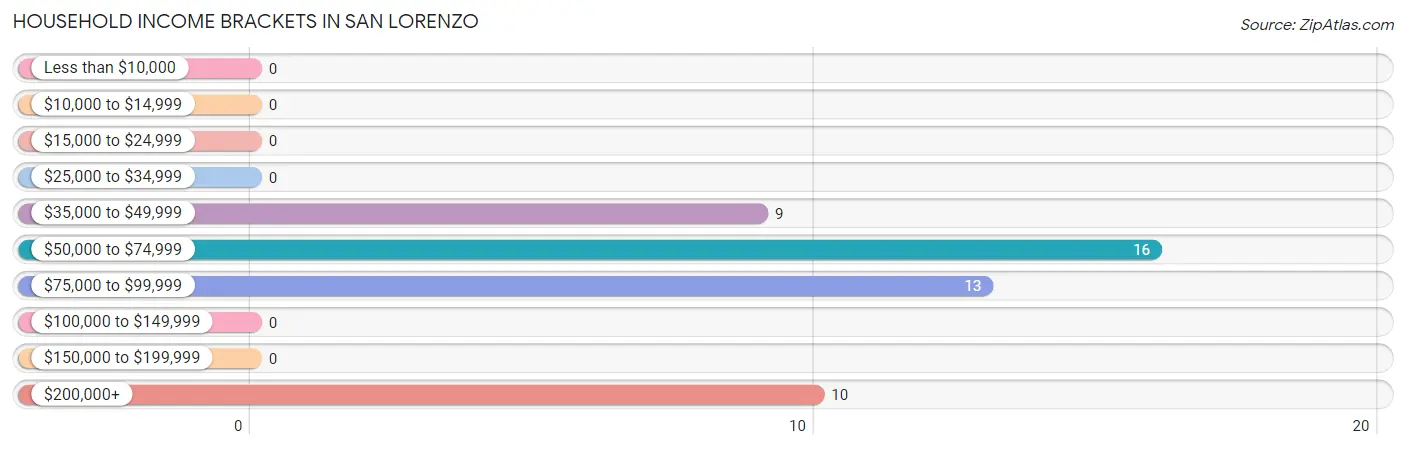
Household Income Brackets in San Lorenzo
With 16 households falling in the category, the $50,000 to $74,999 income range is the most frequent in San Lorenzo, accounting for 33.3% of all households.
| Income Bracket | # Households | % Households |
| Less than $10,000 | 0 | 0.0% |
| $10,000 to $14,999 | 0 | 0.0% |
| $15,000 to $24,999 | 0 | 0.0% |
| $25,000 to $34,999 | 0 | 0.0% |
| $35,000 to $49,999 | 9 | 18.8% |
| $50,000 to $74,999 | 16 | 33.3% |
| $75,000 to $99,999 | 13 | 27.1% |
| $100,000 to $149,999 | 0 | 0.0% |
| $150,000 to $199,999 | 0 | 0.0% |
| $200,000+ | 10 | 20.8% |
Household Income by Householder Age in San Lorenzo
| Income Bracket | # Households | Median Income |
| 15 to 24 Years | 0 (0.0%) | $0 |
| 25 to 44 Years | 13 (27.1%) | $0 |
| 45 to 64 Years | 16 (33.3%) | $0 |
| 65+ Years | 19 (39.6%) | $0 |
| Total | 48 (100.0%) | $67,344 |
Poverty in San Lorenzo
Income Below Poverty by Sex and Age in San Lorenzo
| Age Bracket | Male | Female |
| Under 5 Years | 0 (0.0%) | 0 (0.0%) |
| 5 Years | 0 (0.0%) | 0 (0.0%) |
| 6 to 11 Years | 0 (0.0%) | 0 (0.0%) |
| 12 to 14 Years | 0 (0.0%) | 0 (0.0%) |
| 15 Years | 0 (0.0%) | 0 (0.0%) |
| 16 and 17 Years | 0 (0.0%) | 0 (0.0%) |
| 18 to 24 Years | 0 (0.0%) | 0 (0.0%) |
| 25 to 34 Years | 0 (0.0%) | 0 (0.0%) |
| 35 to 44 Years | 0 (0.0%) | 0 (0.0%) |
| 45 to 54 Years | 0 (0.0%) | 0 (0.0%) |
| 55 to 64 Years | 0 (0.0%) | 0 (0.0%) |
| 65 to 74 Years | 0 (0.0%) | 0 (0.0%) |
| 75 Years and over | 0 (0.0%) | 0 (0.0%) |
| Total | 0 (0.0%) | 0 (0.0%) |
Income Above Poverty by Sex and Age in San Lorenzo
According to the poverty statistics in San Lorenzo, males aged 35 to 44 years and females aged under 5 years are the age groups that are most secure financially, with 100.0% of males and 100.0% of females in these age groups living above the poverty line.
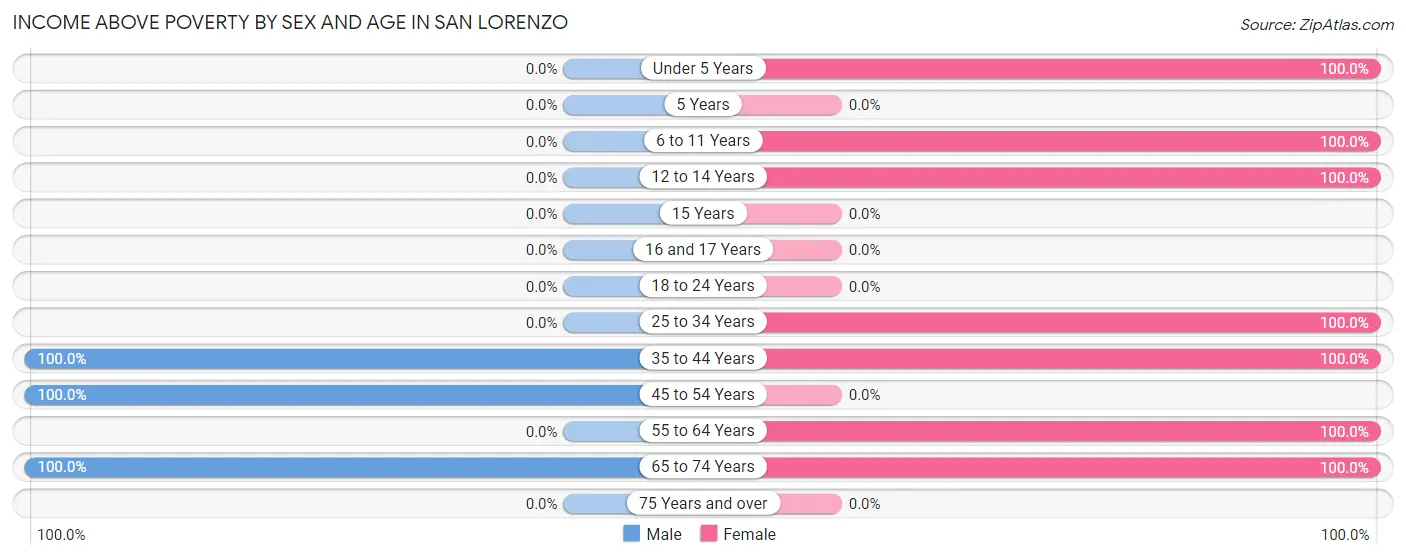
| Age Bracket | Male | Female |
| Under 5 Years | 0 (0.0%) | 25 (100.0%) |
| 5 Years | 0 (0.0%) | 0 (0.0%) |
| 6 to 11 Years | 0 (0.0%) | 30 (100.0%) |
| 12 to 14 Years | 0 (0.0%) | 31 (100.0%) |
| 15 Years | 0 (0.0%) | 0 (0.0%) |
| 16 and 17 Years | 0 (0.0%) | 0 (0.0%) |
| 18 to 24 Years | 0 (0.0%) | 0 (0.0%) |
| 25 to 34 Years | 0 (0.0%) | 13 (100.0%) |
| 35 to 44 Years | 11 (100.0%) | 36 (100.0%) |
| 45 to 54 Years | 30 (100.0%) | 0 (0.0%) |
| 55 to 64 Years | 0 (0.0%) | 16 (100.0%) |
| 65 to 74 Years | 20 (100.0%) | 48 (100.0%) |
| 75 Years and over | 0 (0.0%) | 0 (0.0%) |
| Total | 61 (100.0%) | 199 (100.0%) |
Income Below Poverty Among Married-Couple Families in San Lorenzo
| Children | Above Poverty | Below Poverty |
| No Children | 19 (100.0%) | 0 (0.0%) |
| 1 or 2 Children | 0 (0.0%) | 0 (0.0%) |
| 3 or 4 Children | 0 (0.0%) | 0 (0.0%) |
| 5 or more Children | 13 (100.0%) | 0 (0.0%) |
| Total | 32 (100.0%) | 0 (0.0%) |
Income Below Poverty Among Single-Parent Households in San Lorenzo
| Children | Single Father | Single Mother |
| No Children | 0 (0.0%) | 0 (0.0%) |
| 1 or 2 Children | 0 (0.0%) | 0 (0.0%) |
| 3 or 4 Children | 0 (0.0%) | 0 (0.0%) |
| 5 or more Children | 0 (0.0%) | 0 (0.0%) |
| Total | 0 (0.0%) | 0 (0.0%) |
Income Below Poverty Among Married-Couple vs Single-Parent Households in San Lorenzo
| Children | Married-Couple Families | Single-Parent Households |
| No Children | 0 (0.0%) | 0 (0.0%) |
| 1 or 2 Children | 0 (0.0%) | 0 (0.0%) |
| 3 or 4 Children | 0 (0.0%) | 0 (0.0%) |
| 5 or more Children | 0 (0.0%) | 0 (0.0%) |
| Total | 0 (0.0%) | 0 (0.0%) |
Race in San Lorenzo
The most populous races in San Lorenzo are Hispanic or Latino (222 | 85.4%), Some other Race (112 | 43.1%), and Two or more Races (110 | 42.3%).
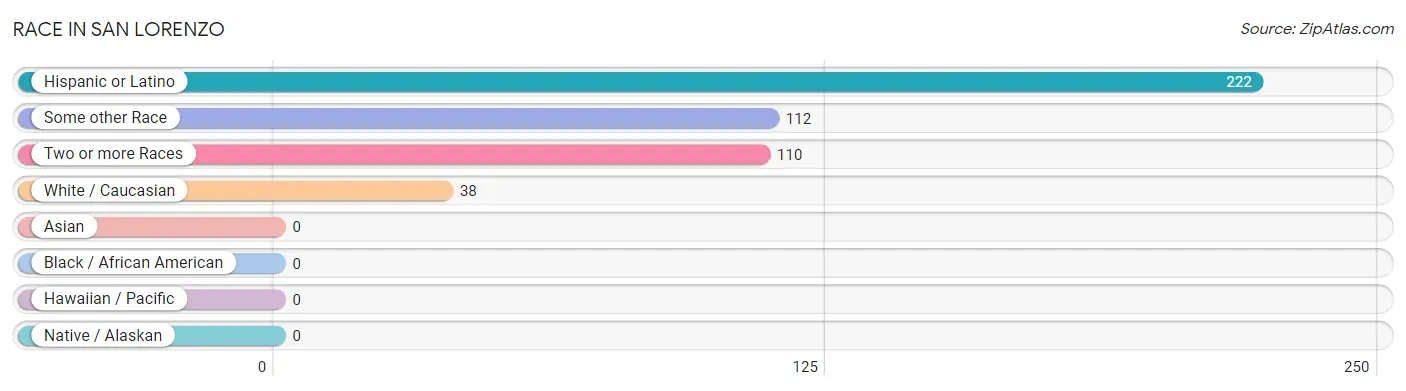
| Race | # Population | % Population |
| Asian | 0 | 0.0% |
| Black / African American | 0 | 0.0% |
| Hawaiian / Pacific | 0 | 0.0% |
| Hispanic or Latino | 222 | 85.4% |
| Native / Alaskan | 0 | 0.0% |
| White / Caucasian | 38 | 14.6% |
| Two or more Races | 110 | 42.3% |
| Some other Race | 112 | 43.1% |
| Total | 260 | 100.0% |
Ancestry in San Lorenzo
The most populous ancestries reported in San Lorenzo are Mexican (222 | 85.4%), American (11 | 4.2%), Scottish (9 | 3.5%), English (8 | 3.1%), and German (8 | 3.1%), together accounting for 99.2% of all San Lorenzo residents.
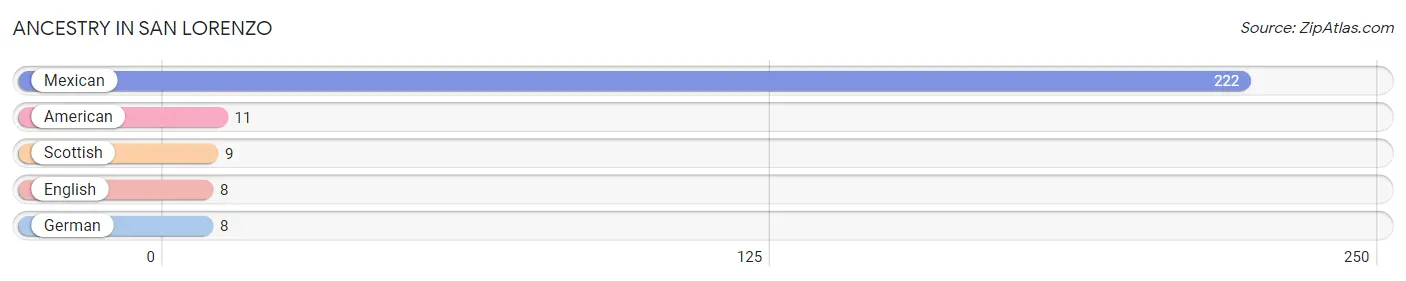
| Ancestry | # Population | % Population |
| American | 11 | 4.2% |
| English | 8 | 3.1% |
| German | 8 | 3.1% |
| Mexican | 222 | 85.4% |
| Scottish | 9 | 3.5% | View All 5 Rows |
Immigrants in San Lorenzo

| Immigration Origin | # Population | % Population | View All 0 Rows |
Sex and Age in San Lorenzo
Sex and Age in San Lorenzo
The most populous age groups in San Lorenzo are 50 to 54 Years (30 | 49.2%) for men and 70 to 74 Years (38 | 19.1%) for women.
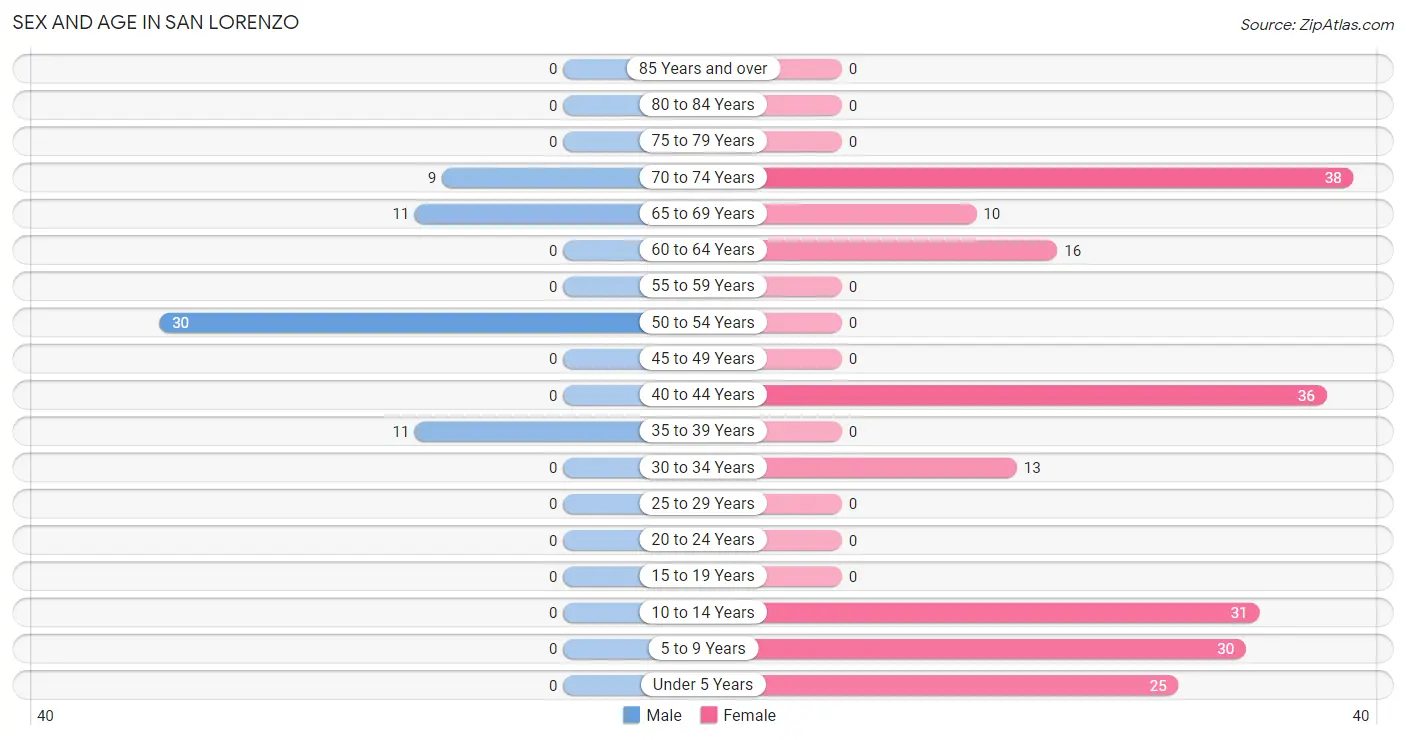
| Age Bracket | Male | Female |
| Under 5 Years | 0 (0.0%) | 25 (12.6%) |
| 5 to 9 Years | 0 (0.0%) | 30 (15.1%) |
| 10 to 14 Years | 0 (0.0%) | 31 (15.6%) |
| 15 to 19 Years | 0 (0.0%) | 0 (0.0%) |
| 20 to 24 Years | 0 (0.0%) | 0 (0.0%) |
| 25 to 29 Years | 0 (0.0%) | 0 (0.0%) |
| 30 to 34 Years | 0 (0.0%) | 13 (6.5%) |
| 35 to 39 Years | 11 (18.0%) | 0 (0.0%) |
| 40 to 44 Years | 0 (0.0%) | 36 (18.1%) |
| 45 to 49 Years | 0 (0.0%) | 0 (0.0%) |
| 50 to 54 Years | 30 (49.2%) | 0 (0.0%) |
| 55 to 59 Years | 0 (0.0%) | 0 (0.0%) |
| 60 to 64 Years | 0 (0.0%) | 16 (8.0%) |
| 65 to 69 Years | 11 (18.0%) | 10 (5.0%) |
| 70 to 74 Years | 9 (14.7%) | 38 (19.1%) |
| 75 to 79 Years | 0 (0.0%) | 0 (0.0%) |
| 80 to 84 Years | 0 (0.0%) | 0 (0.0%) |
| 85 Years and over | 0 (0.0%) | 0 (0.0%) |
| Total | 61 (100.0%) | 199 (100.0%) |
Families and Households in San Lorenzo
Median Family Size in San Lorenzo
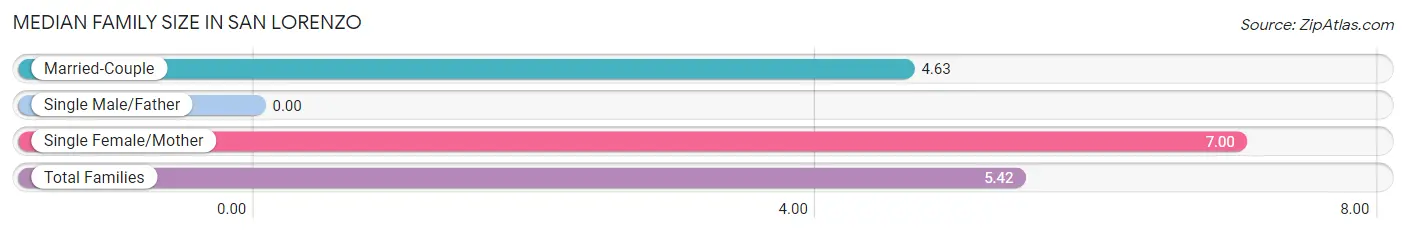
| Family Type | # Families | Family Size |
| Married-Couple | 32 (66.7%) | 4.63 |
| Single Male/Father | 0 (0.0%) | - |
| Single Female/Mother | 16 (33.3%) | 7.00 |
| Total Families | 48 (100.0%) | 5.42 |
Median Household Size in San Lorenzo
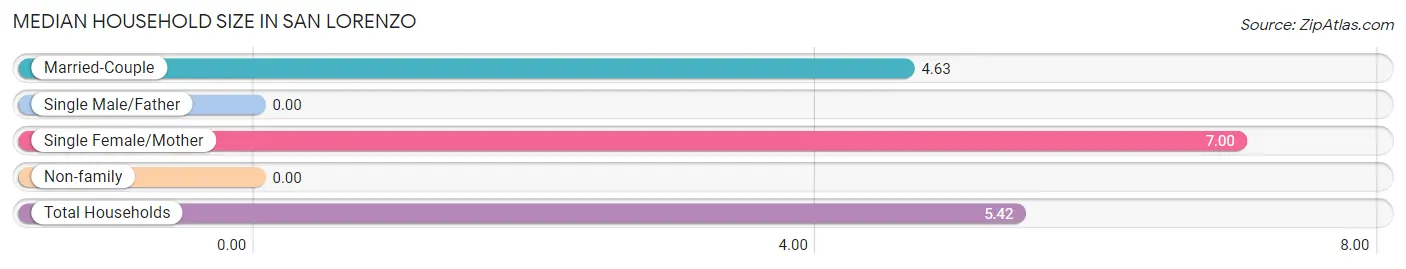
| Household Type | # Households | Household Size |
| Married-Couple | 32 (66.7%) | 4.63 |
| Single Male/Father | 0 (0.0%) | - |
| Single Female/Mother | 16 (33.3%) | 7.00 |
| Non-family | 0 (0.0%) | - |
| Total Households | 48 (100.0%) | 5.42 |
Household Size by Marriage Status in San Lorenzo
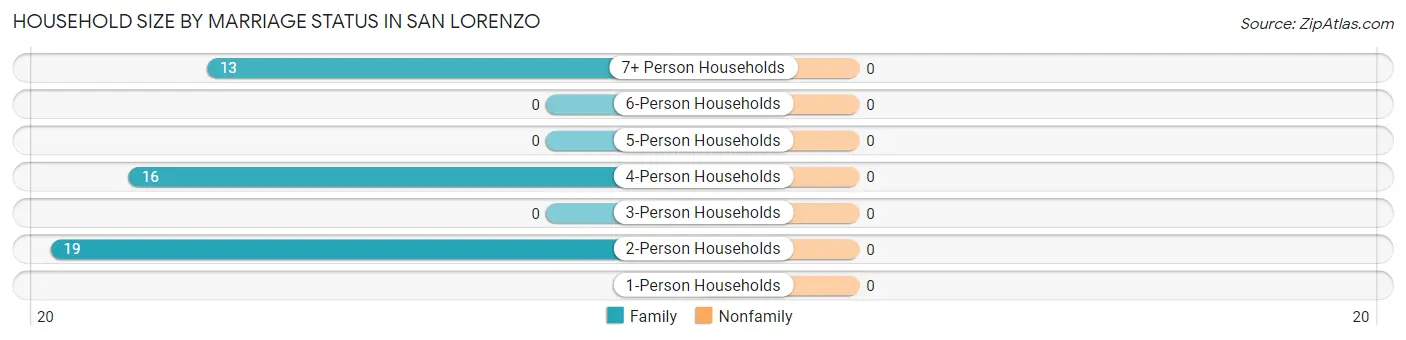
| Household Size | Family Households | Nonfamily Households |
| 1-Person Households | - | 0 (0.0%) |
| 2-Person Households | 19 (39.6%) | 0 (0.0%) |
| 3-Person Households | 0 (0.0%) | 0 (0.0%) |
| 4-Person Households | 16 (33.3%) | 0 (0.0%) |
| 5-Person Households | 0 (0.0%) | 0 (0.0%) |
| 6-Person Households | 0 (0.0%) | 0 (0.0%) |
| 7+ Person Households | 13 (27.1%) | 0 (0.0%) |
| Total | 48 (100.0%) | 0 (0.0%) |
Female Fertility in San Lorenzo
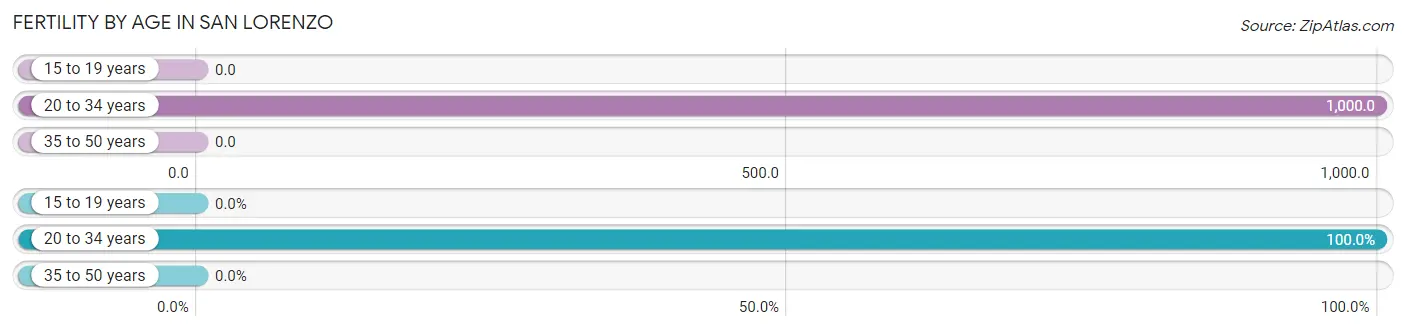
Fertility by Age in San Lorenzo
Average fertility rate in San Lorenzo is 265.0 births per 1,000 women. Women in the age bracket of 20 to 34 years have the highest fertility rate with 1,000.0 births per 1,000 women. Women in the age bracket of 20 to 34 years acount for 100.0% of all women with births.
| Age Bracket | Women with Births | Births / 1,000 Women |
| 15 to 19 years | 0 (0.0%) | 0.0 |
| 20 to 34 years | 13 (100.0%) | 1,000.0 |
| 35 to 50 years | 0 (0.0%) | 0.0 |
| Total | 13 (100.0%) | 265.0 |
Fertility by Age by Marriage Status in San Lorenzo
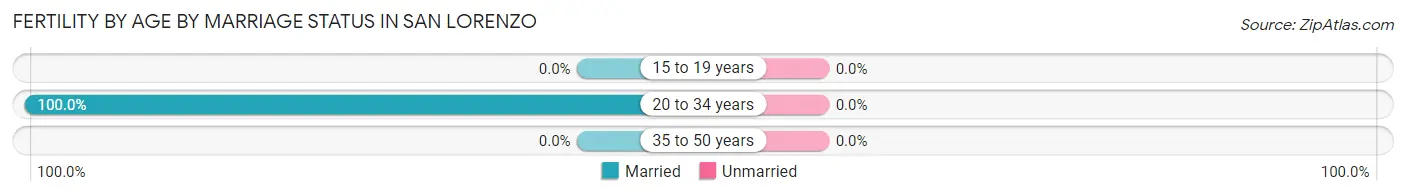
| Age Bracket | Married | Unmarried |
| 15 to 19 years | 0 (0.0%) | 0 (0.0%) |
| 20 to 34 years | 13 (100.0%) | 0 (0.0%) |
| 35 to 50 years | 0 (0.0%) | 0 (0.0%) |
| Total | 13 (100.0%) | 0 (0.0%) |
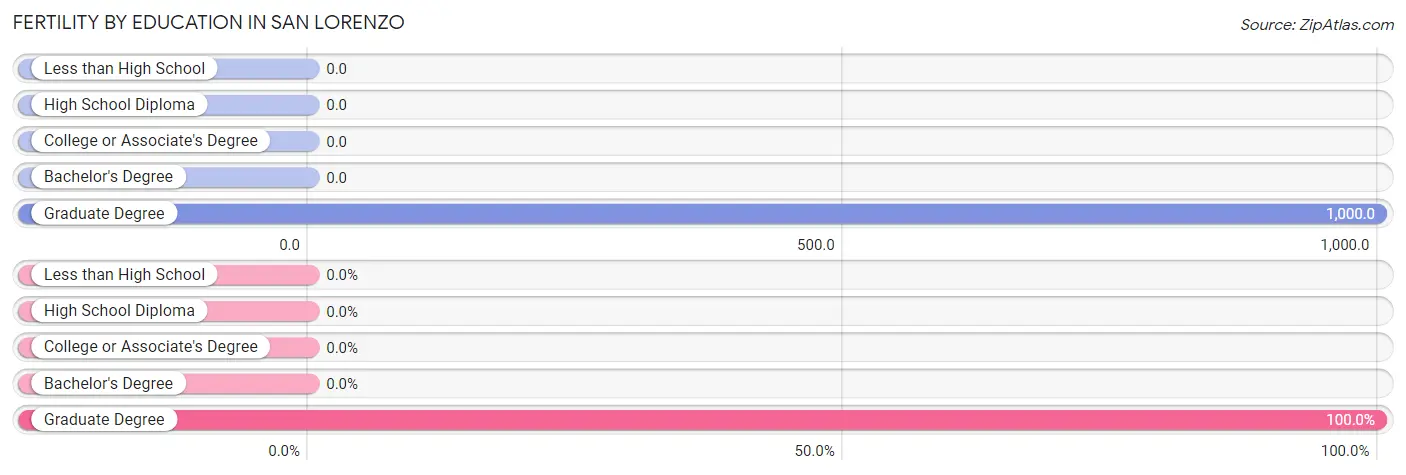
Fertility by Education in San Lorenzo
| Educational Attainment | Women with Births | Births / 1,000 Women |
| Less than High School | 0 (0.0%) | 0.0 |
| High School Diploma | 0 (0.0%) | 0.0 |
| College or Associate's Degree | 0 (0.0%) | 0.0 |
| Bachelor's Degree | 0 (0.0%) | 0.0 |
| Graduate Degree | 13 (100.0%) | 1,000.0 |
| Total | 13 (100.0%) | 265.0 |
Fertility by Education by Marriage Status in San Lorenzo
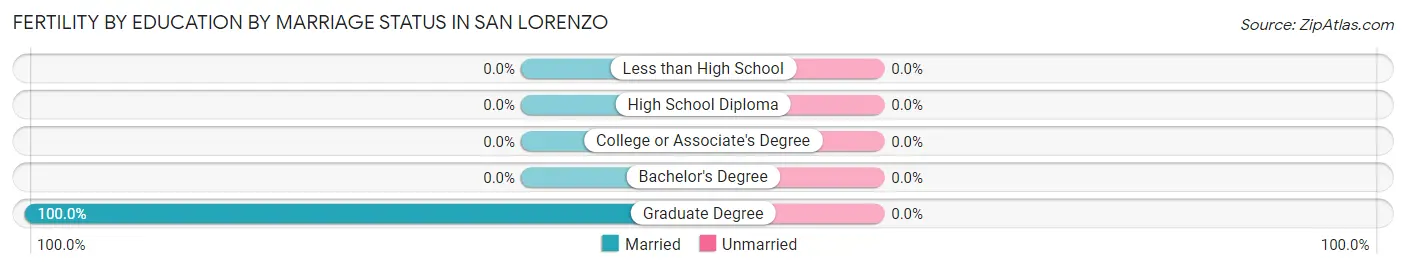
| Educational Attainment | Married | Unmarried |
| Less than High School | 0 (0.0%) | 0 (0.0%) |
| High School Diploma | 0 (0.0%) | 0 (0.0%) |
| College or Associate's Degree | 0 (0.0%) | 0 (0.0%) |
| Bachelor's Degree | 0 (0.0%) | 0 (0.0%) |
| Graduate Degree | 13 (100.0%) | 0 (0.0%) |
| Total | 13 (100.0%) | 0 (0.0%) |
Employment Characteristics in San Lorenzo
Employment by Class of Employer in San Lorenzo
Among the 27 employed individuals in San Lorenzo, private company employees (16 | 59.3%), and local government employees (11 | 40.7%) make up the most common classes of employment.
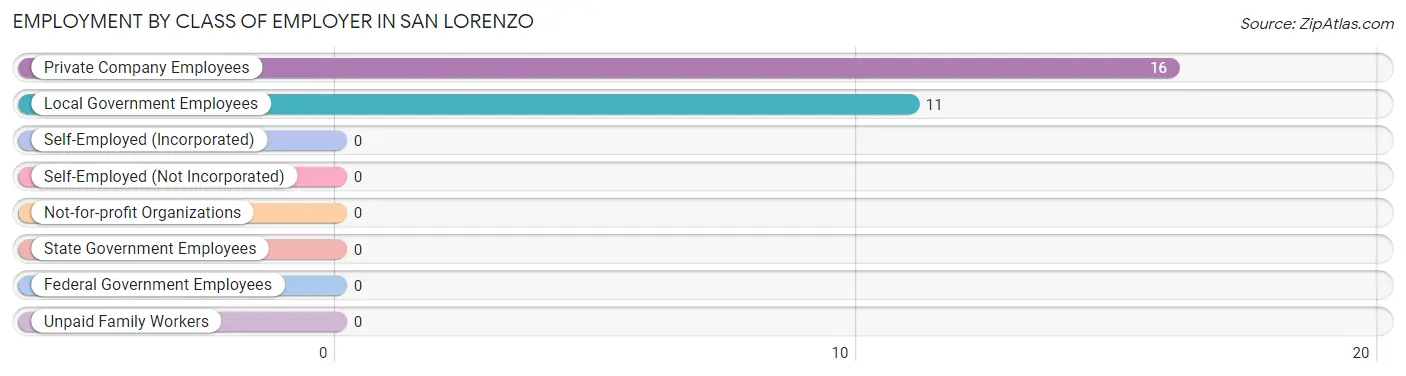
| Employer Class | # Employees | % Employees |
| Private Company Employees | 16 | 59.3% |
| Self-Employed (Incorporated) | 0 | 0.0% |
| Self-Employed (Not Incorporated) | 0 | 0.0% |
| Not-for-profit Organizations | 0 | 0.0% |
| Local Government Employees | 11 | 40.7% |
| State Government Employees | 0 | 0.0% |
| Federal Government Employees | 0 | 0.0% |
| Unpaid Family Workers | 0 | 0.0% |
| Total | 27 | 100.0% |
Employment Status by Age in San Lorenzo
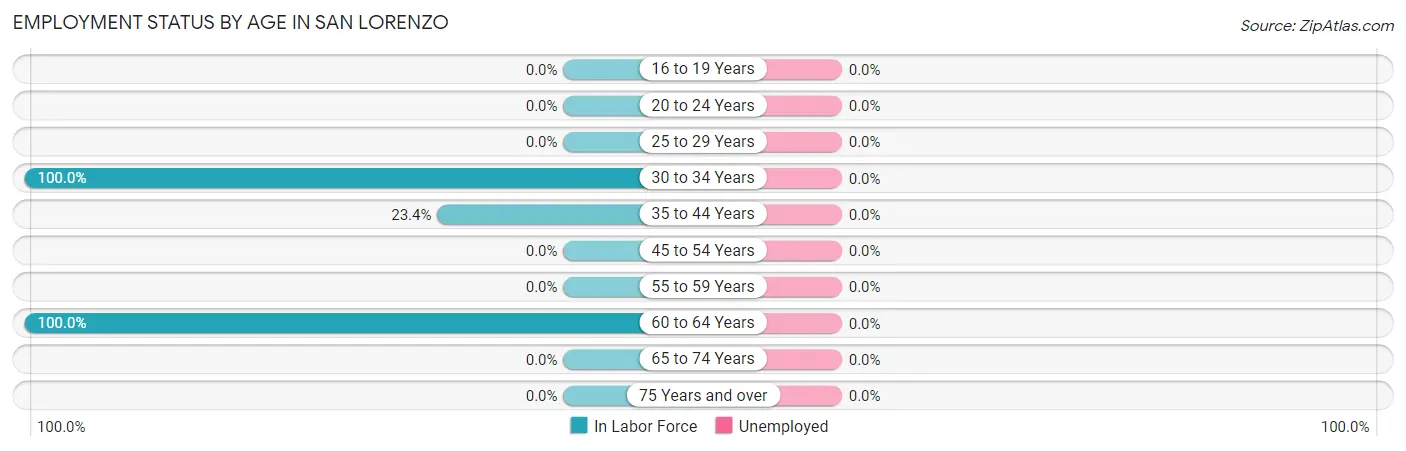
| Age Bracket | In Labor Force | Unemployed |
| 16 to 19 Years | 0 (0.0%) | 0 (0.0%) |
| 20 to 24 Years | 0 (0.0%) | 0 (0.0%) |
| 25 to 29 Years | 0 (0.0%) | 0 (0.0%) |
| 30 to 34 Years | 13 (100.0%) | 0 (0.0%) |
| 35 to 44 Years | 11 (23.4%) | 0 (0.0%) |
| 45 to 54 Years | 0 (0.0%) | 0 (0.0%) |
| 55 to 59 Years | 0 (0.0%) | 0 (0.0%) |
| 60 to 64 Years | 16 (100.0%) | 0 (0.0%) |
| 65 to 74 Years | 0 (0.0%) | 0 (0.0%) |
| 75 Years and over | 0 (0.0%) | 0 (0.0%) |
| Total | 40 (23.0%) | 0 (0.0%) |
Employment Status by Educational Attainment in San Lorenzo
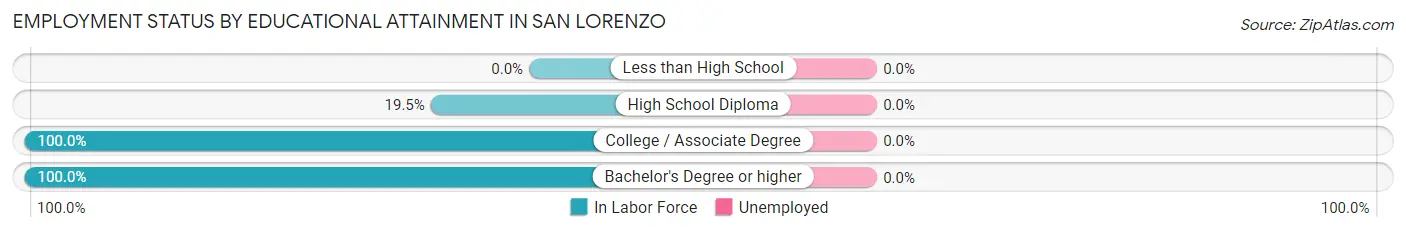
| Educational Attainment | In Labor Force | Unemployed |
| Less than High School | 0 (0.0%) | 0 (0.0%) |
| High School Diploma | 16 (19.5%) | 0 (0.0%) |
| College / Associate Degree | 11 (100.0%) | 0 (0.0%) |
| Bachelor's Degree or higher | 13 (100.0%) | 0 (0.0%) |
| Total | 40 (37.7%) | 0 (0.0%) |
Employment Occupations by Sex in San Lorenzo
Management, Business, Science and Arts Occupations
The most common Management, Business, Science and Arts occupations in San Lorenzo are Management (16 | 40.0%), Health Diagnosing & Treating (13 | 32.5%), and Health Technologists (13 | 32.5%).
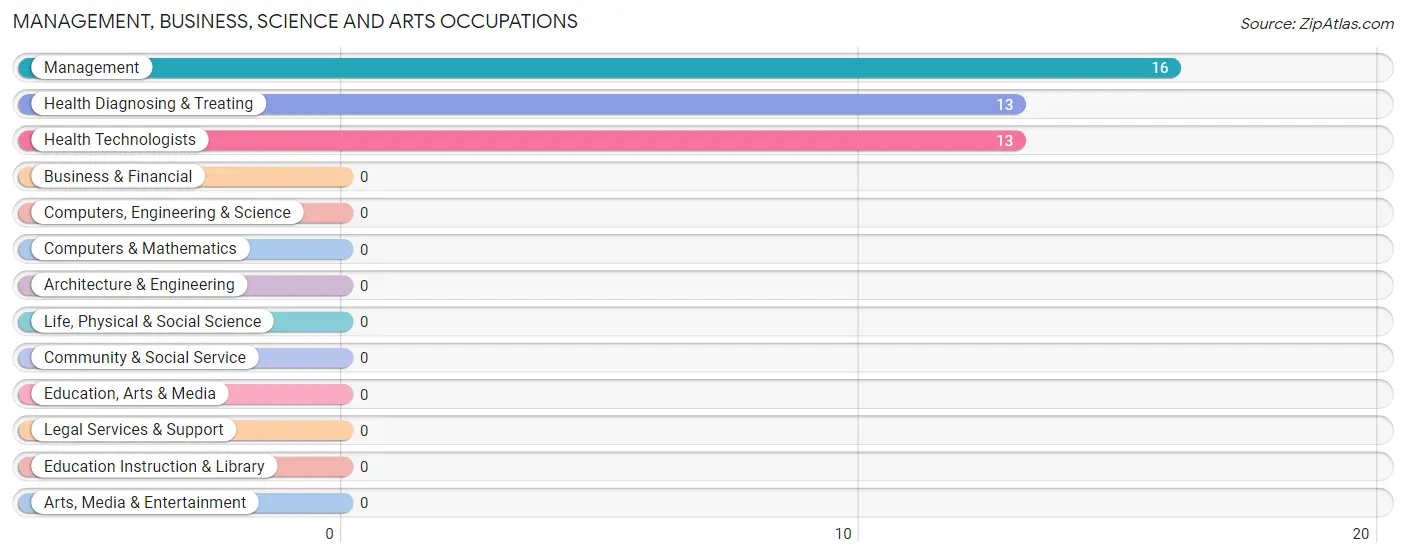
Management, Business, Science and Arts Occupations by Sex
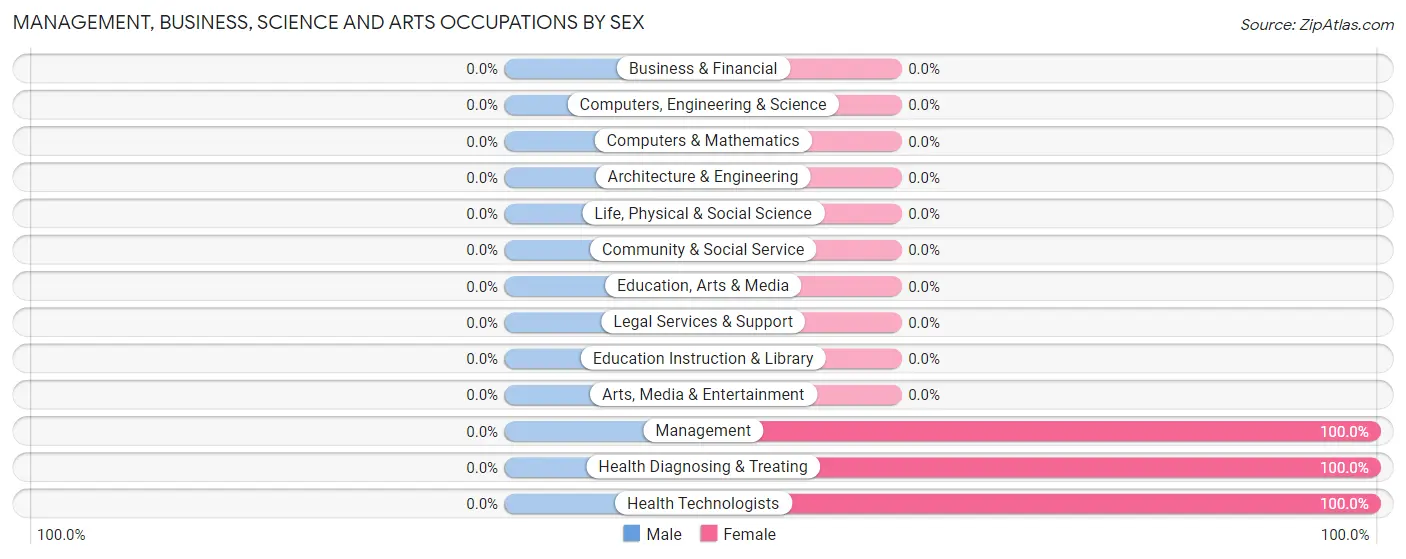
| Occupation | Male | Female |
| Management | 0 (0.0%) | 16 (100.0%) |
| Business & Financial | 0 (0.0%) | 0 (0.0%) |
| Computers, Engineering & Science | 0 (0.0%) | 0 (0.0%) |
| Computers & Mathematics | 0 (0.0%) | 0 (0.0%) |
| Architecture & Engineering | 0 (0.0%) | 0 (0.0%) |
| Life, Physical & Social Science | 0 (0.0%) | 0 (0.0%) |
| Community & Social Service | 0 (0.0%) | 0 (0.0%) |
| Education, Arts & Media | 0 (0.0%) | 0 (0.0%) |
| Legal Services & Support | 0 (0.0%) | 0 (0.0%) |
| Education Instruction & Library | 0 (0.0%) | 0 (0.0%) |
| Arts, Media & Entertainment | 0 (0.0%) | 0 (0.0%) |
| Health Diagnosing & Treating | 0 (0.0%) | 13 (100.0%) |
| Health Technologists | 0 (0.0%) | 13 (100.0%) |
| Total (Category) | 0 (0.0%) | 29 (100.0%) |
| Total (Overall) | 11 (27.5%) | 29 (72.5%) |
Services Occupations
The most common Services occupations in San Lorenzo are Security & Protection (11 | 27.5%), and Law Enforcement (11 | 27.5%).
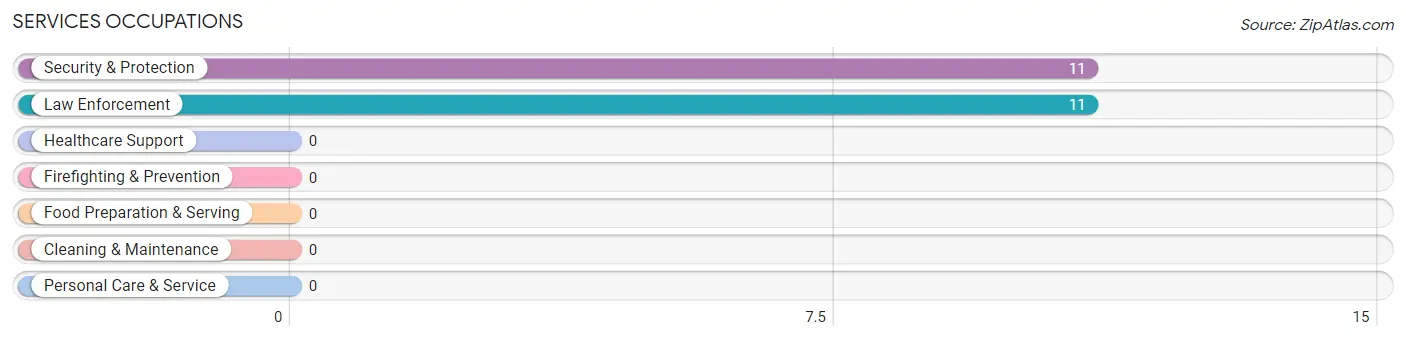
Services Occupations by Sex
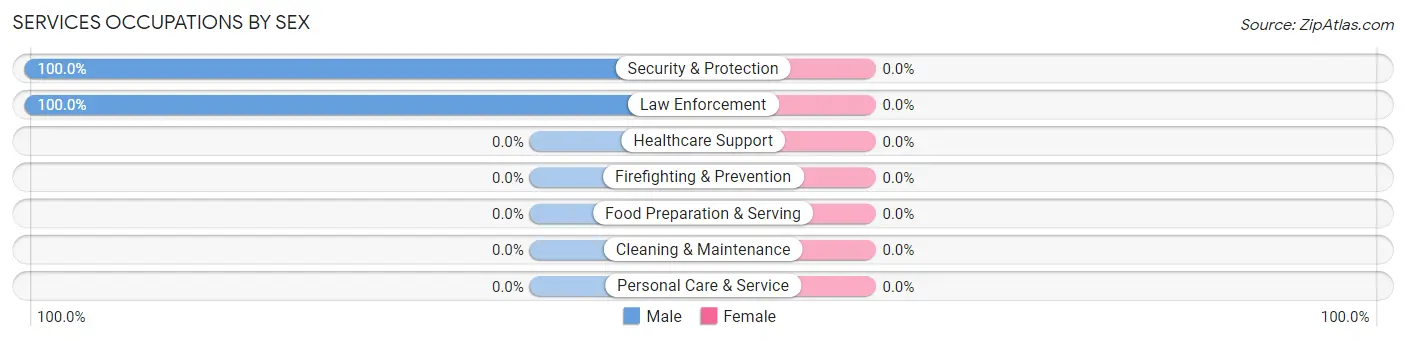
| Occupation | Male | Female |
| Healthcare Support | 0 (0.0%) | 0 (0.0%) |
| Security & Protection | 11 (100.0%) | 0 (0.0%) |
| Firefighting & Prevention | 0 (0.0%) | 0 (0.0%) |
| Law Enforcement | 11 (100.0%) | 0 (0.0%) |
| Food Preparation & Serving | 0 (0.0%) | 0 (0.0%) |
| Cleaning & Maintenance | 0 (0.0%) | 0 (0.0%) |
| Personal Care & Service | 0 (0.0%) | 0 (0.0%) |
| Total (Category) | 11 (100.0%) | 0 (0.0%) |
| Total (Overall) | 11 (27.5%) | 29 (72.5%) |
Sales and Office Occupations
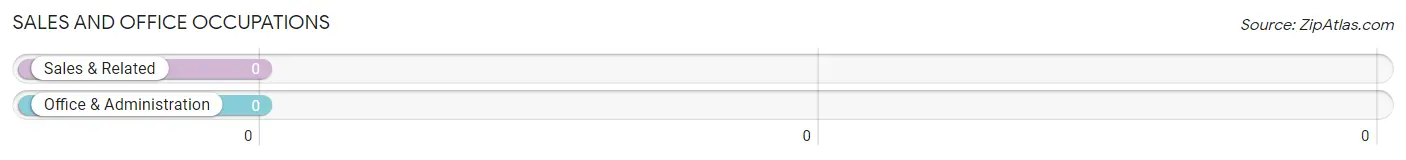
Sales and Office Occupations by Sex
| Occupation | Male | Female |
| Sales & Related | 0 (0.0%) | 0 (0.0%) |
| Office & Administration | 0 (0.0%) | 0 (0.0%) |
| Total (Category) | 0 (0.0%) | 0 (0.0%) |
| Total (Overall) | 11 (27.5%) | 29 (72.5%) |
Natural Resources, Construction and Maintenance Occupations
Natural Resources, Construction and Maintenance Occupations by Sex
| Occupation | Male | Female |
| Farming, Fishing & Forestry | 0 (0.0%) | 0 (0.0%) |
| Construction & Extraction | 0 (0.0%) | 0 (0.0%) |
| Installation, Maintenance & Repair | 0 (0.0%) | 0 (0.0%) |
| Total (Category) | 0 (0.0%) | 0 (0.0%) |
| Total (Overall) | 11 (27.5%) | 29 (72.5%) |
Production, Transportation and Moving Occupations
Production, Transportation and Moving Occupations by Sex
| Occupation | Male | Female |
| Production | 0 (0.0%) | 0 (0.0%) |
| Transportation | 0 (0.0%) | 0 (0.0%) |
| Material Moving | 0 (0.0%) | 0 (0.0%) |
| Total (Category) | 0 (0.0%) | 0 (0.0%) |
| Total (Overall) | 11 (27.5%) | 29 (72.5%) |
Employment Industries by Sex in San Lorenzo
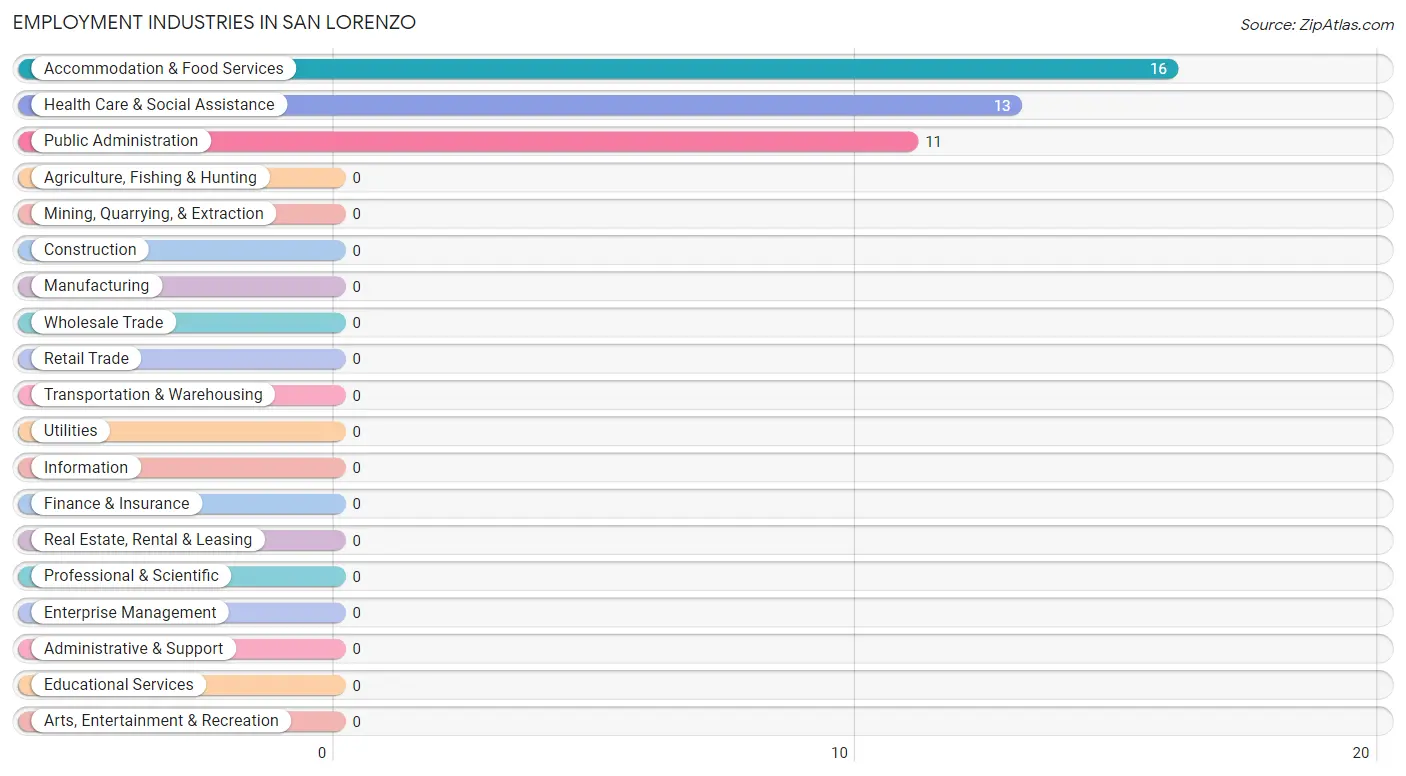
Employment Industries in San Lorenzo
The major employment industries in San Lorenzo include Accommodation & Food Services (16 | 40.0%), Health Care & Social Assistance (13 | 32.5%), and Public Administration (11 | 27.5%).
Employment Industries by Sex in San Lorenzo
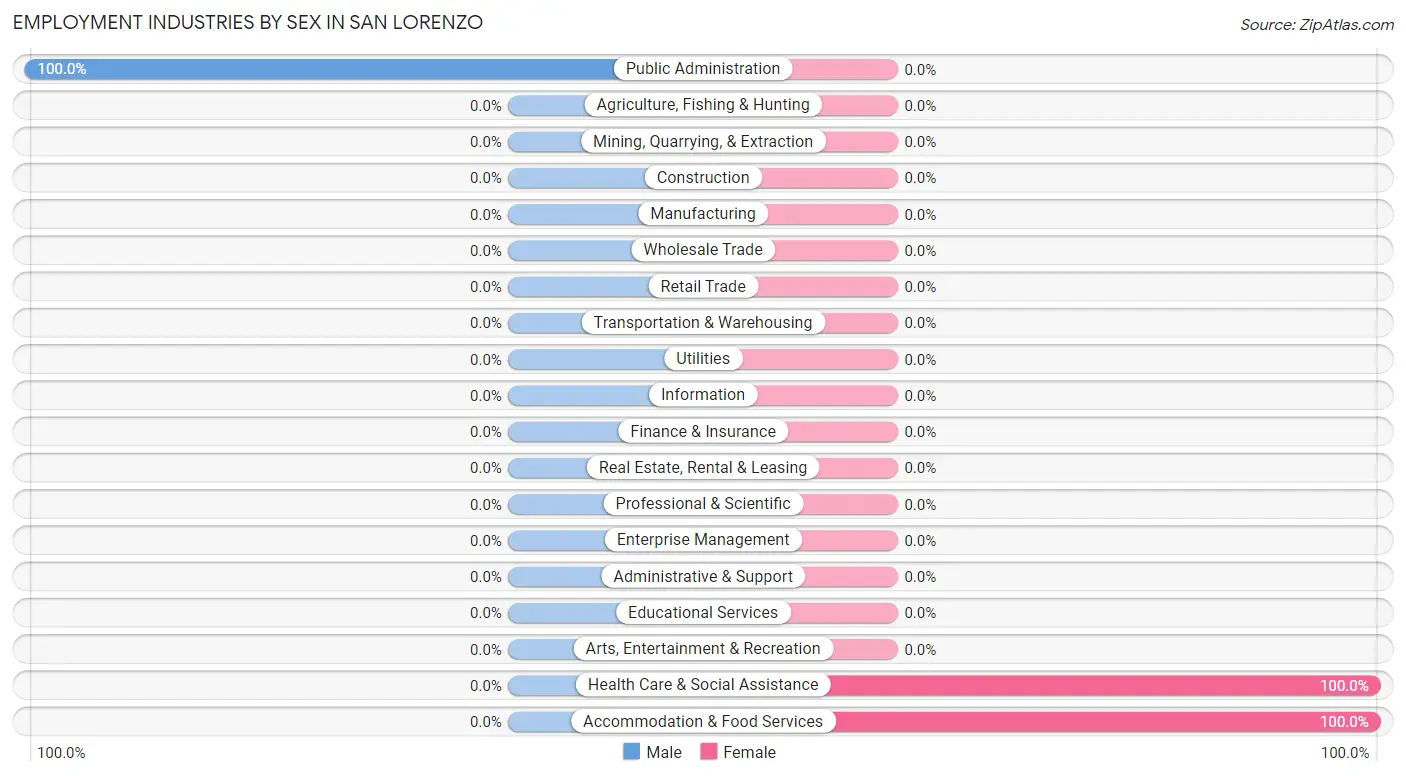
| Industry | Male | Female |
| Agriculture, Fishing & Hunting | 0 (0.0%) | 0 (0.0%) |
| Mining, Quarrying, & Extraction | 0 (0.0%) | 0 (0.0%) |
| Construction | 0 (0.0%) | 0 (0.0%) |
| Manufacturing | 0 (0.0%) | 0 (0.0%) |
| Wholesale Trade | 0 (0.0%) | 0 (0.0%) |
| Retail Trade | 0 (0.0%) | 0 (0.0%) |
| Transportation & Warehousing | 0 (0.0%) | 0 (0.0%) |
| Utilities | 0 (0.0%) | 0 (0.0%) |
| Information | 0 (0.0%) | 0 (0.0%) |
| Finance & Insurance | 0 (0.0%) | 0 (0.0%) |
| Real Estate, Rental & Leasing | 0 (0.0%) | 0 (0.0%) |
| Professional & Scientific | 0 (0.0%) | 0 (0.0%) |
| Enterprise Management | 0 (0.0%) | 0 (0.0%) |
| Administrative & Support | 0 (0.0%) | 0 (0.0%) |
| Educational Services | 0 (0.0%) | 0 (0.0%) |
| Health Care & Social Assistance | 0 (0.0%) | 13 (100.0%) |
| Arts, Entertainment & Recreation | 0 (0.0%) | 0 (0.0%) |
| Accommodation & Food Services | 0 (0.0%) | 16 (100.0%) |
| Public Administration | 11 (100.0%) | 0 (0.0%) |
| Total | 11 (27.5%) | 29 (72.5%) |
Education in San Lorenzo
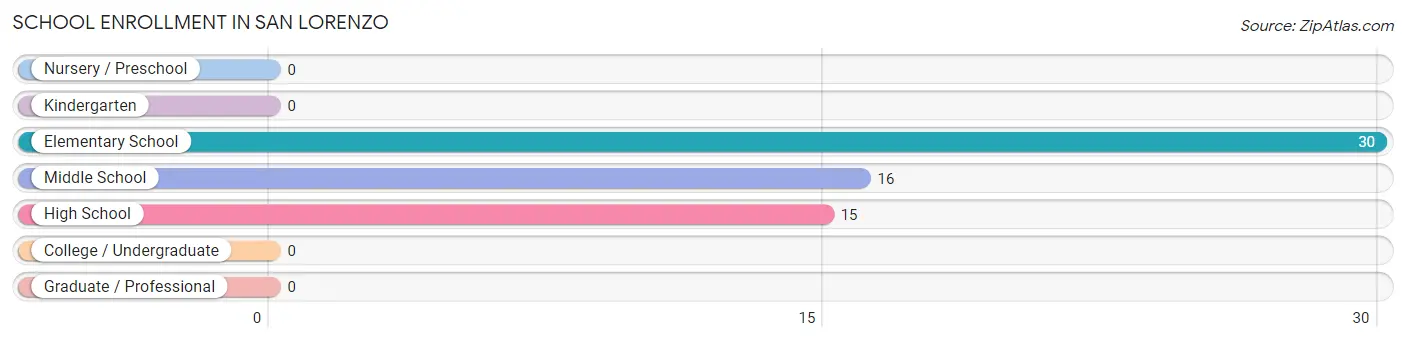
School Enrollment in San Lorenzo
The most common levels of schooling among the 61 students in San Lorenzo are elementary school (30 | 49.2%), middle school (16 | 26.2%), and high school (15 | 24.6%).
| School Level | # Students | % Students |
| Nursery / Preschool | 0 | 0.0% |
| Kindergarten | 0 | 0.0% |
| Elementary School | 30 | 49.2% |
| Middle School | 16 | 26.2% |
| High School | 15 | 24.6% |
| College / Undergraduate | 0 | 0.0% |
| Graduate / Professional | 0 | 0.0% |
| Total | 61 | 100.0% |
School Enrollment by Age by Funding Source in San Lorenzo
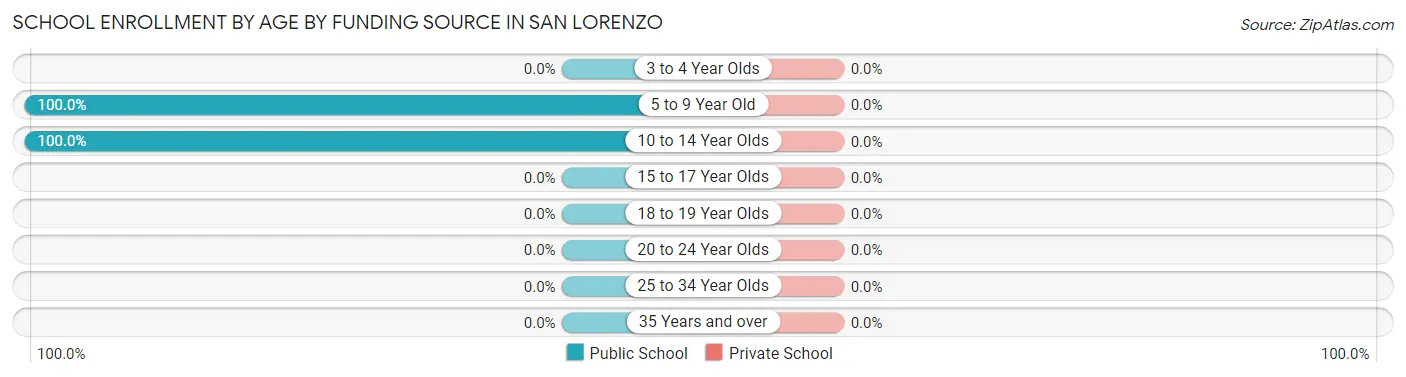
| Age Bracket | Public School | Private School |
| 3 to 4 Year Olds | 0 (0.0%) | 0 (0.0%) |
| 5 to 9 Year Old | 30 (100.0%) | 0 (0.0%) |
| 10 to 14 Year Olds | 31 (100.0%) | 0 (0.0%) |
| 15 to 17 Year Olds | 0 (0.0%) | 0 (0.0%) |
| 18 to 19 Year Olds | 0 (0.0%) | 0 (0.0%) |
| 20 to 24 Year Olds | 0 (0.0%) | 0 (0.0%) |
| 25 to 34 Year Olds | 0 (0.0%) | 0 (0.0%) |
| 35 Years and over | 0 (0.0%) | 0 (0.0%) |
| Total | 61 (100.0%) | 0 (0.0%) |
Educational Attainment by Field of Study in San Lorenzo
Social sciences (18 | 30.5%), science & technology (13 | 22.0%), liberal arts & history (11 | 18.6%), bio, nature & agricultural (9 | 15.2%), and computers & mathematics (8 | 13.6%) are the most common fields of study among 59 individuals in San Lorenzo who have obtained a bachelor's degree or higher.
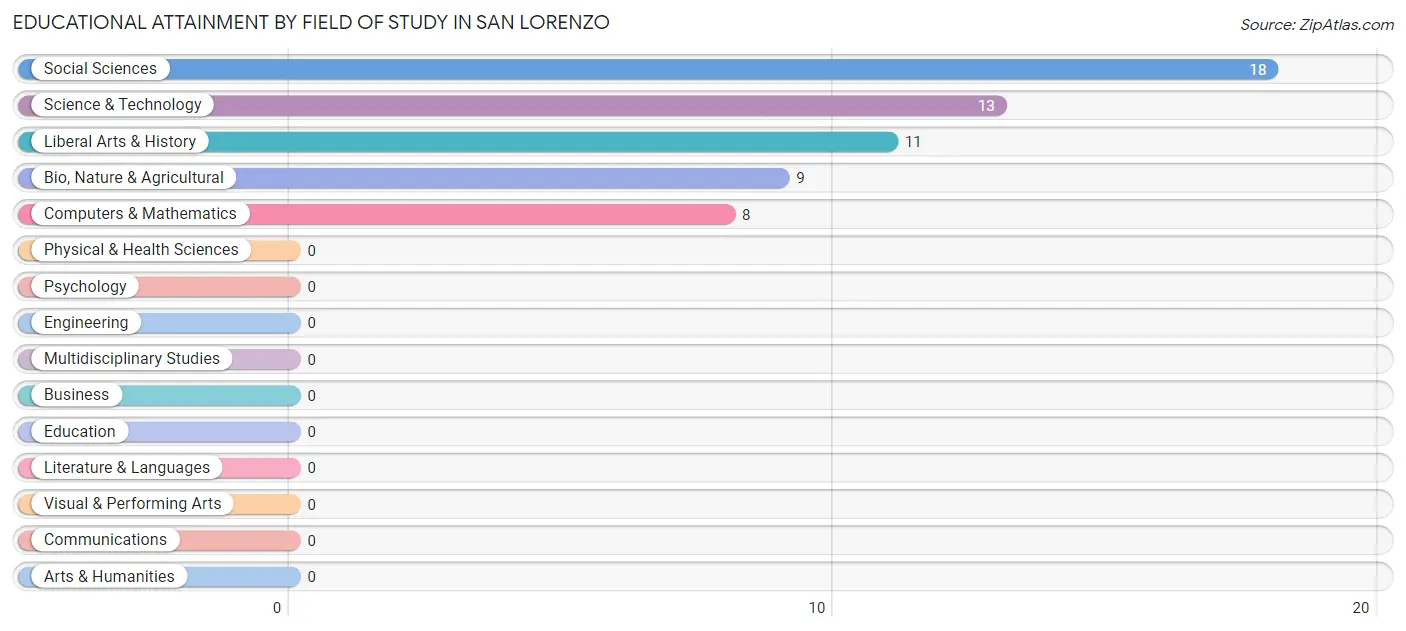
| Field of Study | # Graduates | % Graduates |
| Computers & Mathematics | 8 | 13.6% |
| Bio, Nature & Agricultural | 9 | 15.2% |
| Physical & Health Sciences | 0 | 0.0% |
| Psychology | 0 | 0.0% |
| Social Sciences | 18 | 30.5% |
| Engineering | 0 | 0.0% |
| Multidisciplinary Studies | 0 | 0.0% |
| Science & Technology | 13 | 22.0% |
| Business | 0 | 0.0% |
| Education | 0 | 0.0% |
| Literature & Languages | 0 | 0.0% |
| Liberal Arts & History | 11 | 18.6% |
| Visual & Performing Arts | 0 | 0.0% |
| Communications | 0 | 0.0% |
| Arts & Humanities | 0 | 0.0% |
| Total | 59 | 100.0% |
Transportation & Commute in San Lorenzo
Vehicle Availability by Sex in San Lorenzo
The most prevalent vehicle ownership categories in San Lorenzo are males with 5 or more vehicles (11, accounting for 100.0%) and females with 5 or more vehicles (0, making up 68.8%).
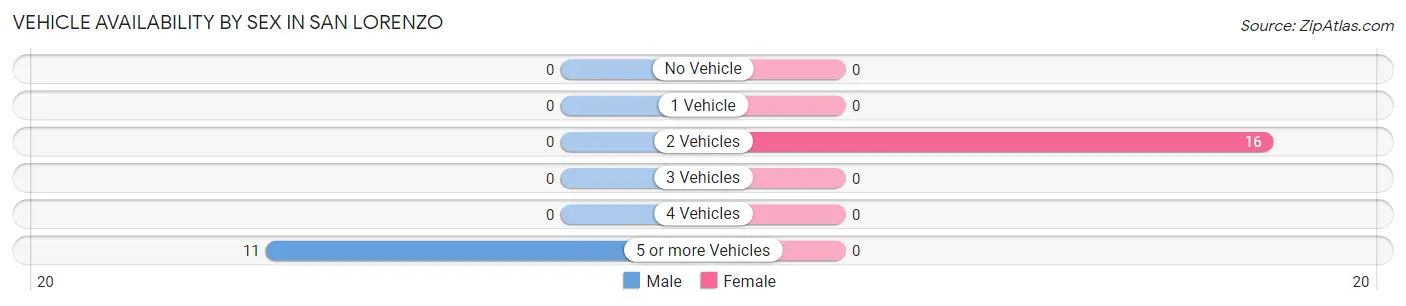
| Vehicles Available | Male | Female |
| No Vehicle | 0 (0.0%) | 0 (0.0%) |
| 1 Vehicle | 0 (0.0%) | 0 (0.0%) |
| 2 Vehicles | 0 (0.0%) | 16 (100.0%) |
| 3 Vehicles | 0 (0.0%) | 0 (0.0%) |
| 4 Vehicles | 0 (0.0%) | 0 (0.0%) |
| 5 or more Vehicles | 11 (100.0%) | 0 (0.0%) |
| Total | 11 (100.0%) | 16 (100.0%) |
Commute Time in San Lorenzo
The most frequently occuring commute durations in San Lorenzo are 5 to 9 minutes (16 commuters, 59.3%), 30 to 34 minutes (11 commuters, 40.7%), and less than 5 minutes (0 commuters, 0.0%).
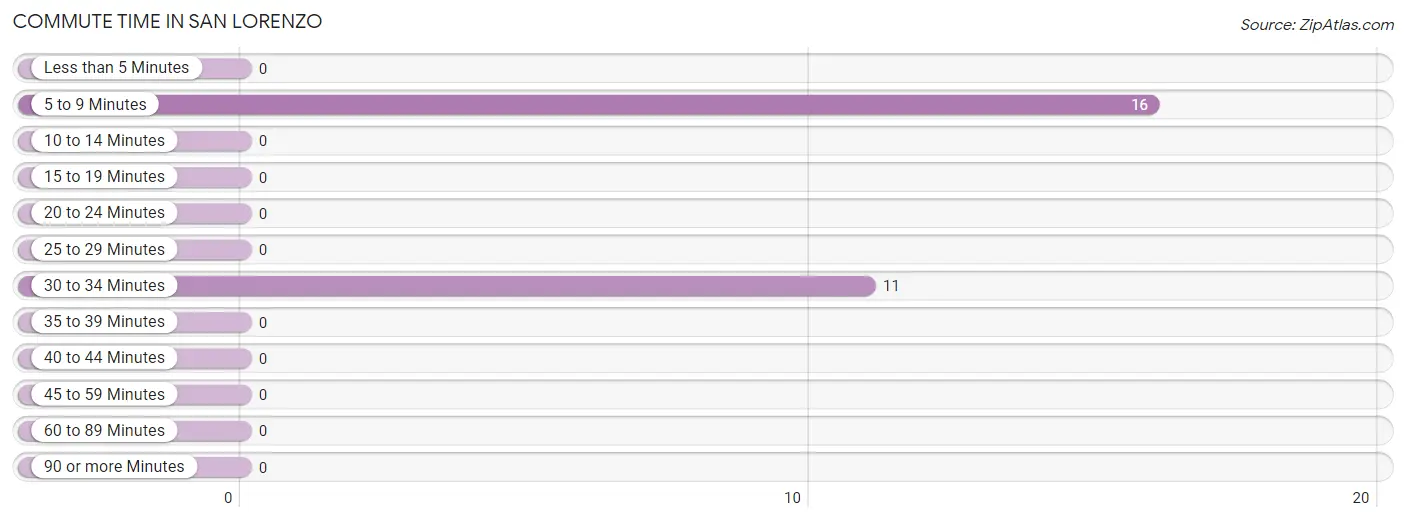
| Commute Time | # Commuters | % Commuters |
| Less than 5 Minutes | 0 | 0.0% |
| 5 to 9 Minutes | 16 | 59.3% |
| 10 to 14 Minutes | 0 | 0.0% |
| 15 to 19 Minutes | 0 | 0.0% |
| 20 to 24 Minutes | 0 | 0.0% |
| 25 to 29 Minutes | 0 | 0.0% |
| 30 to 34 Minutes | 11 | 40.7% |
| 35 to 39 Minutes | 0 | 0.0% |
| 40 to 44 Minutes | 0 | 0.0% |
| 45 to 59 Minutes | 0 | 0.0% |
| 60 to 89 Minutes | 0 | 0.0% |
| 90 or more Minutes | 0 | 0.0% |
Commute Time by Sex in San Lorenzo
The most common commute times in San Lorenzo are 30 to 34 minutes (11 commuters, 100.0%) for males and 5 to 9 minutes (16 commuters, 100.0%) for females.
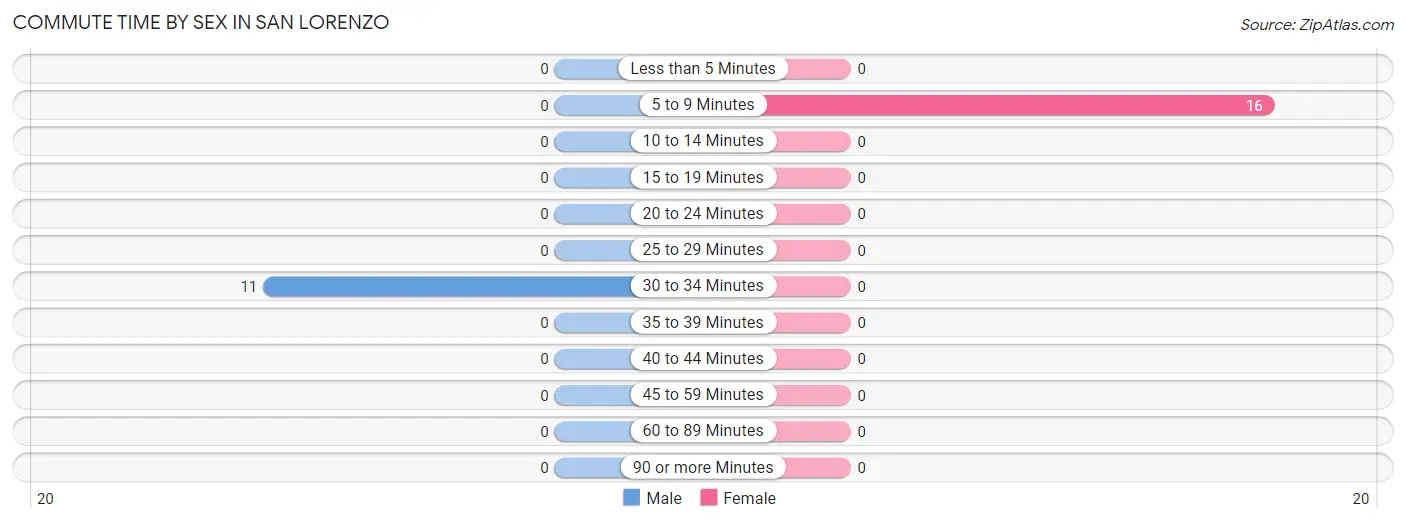
| Commute Time | Male | Female |
| Less than 5 Minutes | 0 (0.0%) | 0 (0.0%) |
| 5 to 9 Minutes | 0 (0.0%) | 16 (100.0%) |
| 10 to 14 Minutes | 0 (0.0%) | 0 (0.0%) |
| 15 to 19 Minutes | 0 (0.0%) | 0 (0.0%) |
| 20 to 24 Minutes | 0 (0.0%) | 0 (0.0%) |
| 25 to 29 Minutes | 0 (0.0%) | 0 (0.0%) |
| 30 to 34 Minutes | 11 (100.0%) | 0 (0.0%) |
| 35 to 39 Minutes | 0 (0.0%) | 0 (0.0%) |
| 40 to 44 Minutes | 0 (0.0%) | 0 (0.0%) |
| 45 to 59 Minutes | 0 (0.0%) | 0 (0.0%) |
| 60 to 89 Minutes | 0 (0.0%) | 0 (0.0%) |
| 90 or more Minutes | 0 (0.0%) | 0 (0.0%) |
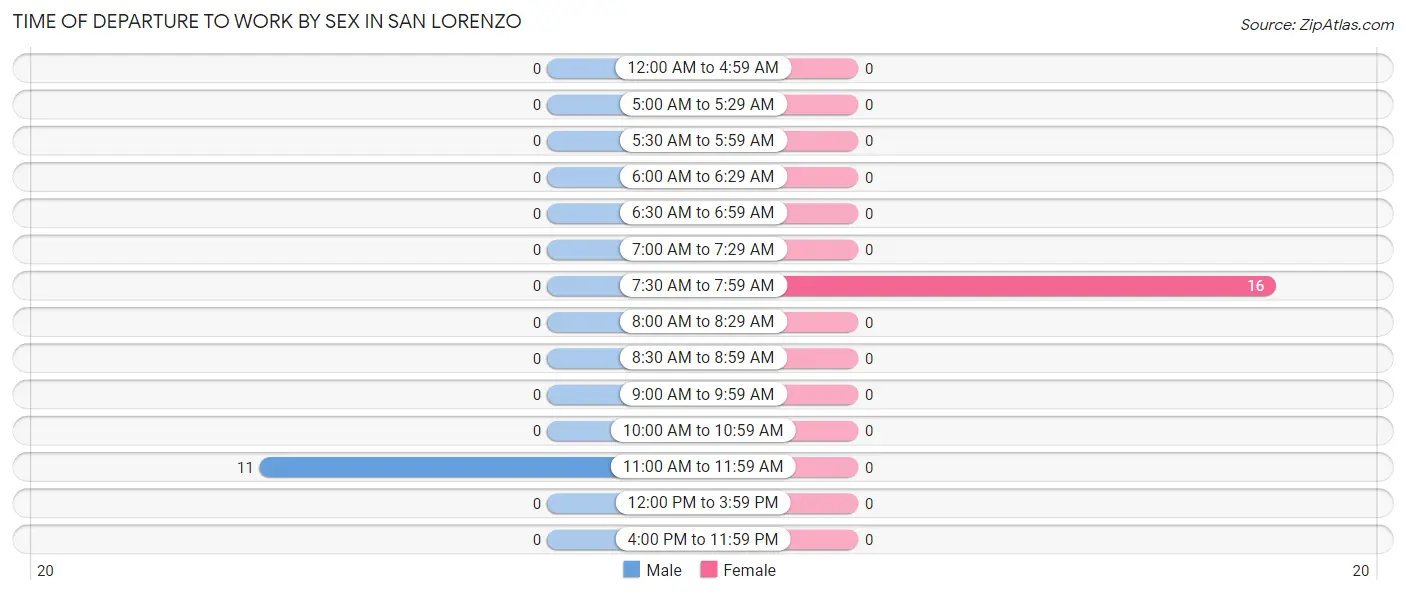
Time of Departure to Work by Sex in San Lorenzo
The most frequent times of departure to work in San Lorenzo are 11:00 AM to 11:59 AM (11, 100.0%) for males and 7:30 AM to 7:59 AM (16, 100.0%) for females.
| Time of Departure | Male | Female |
| 12:00 AM to 4:59 AM | 0 (0.0%) | 0 (0.0%) |
| 5:00 AM to 5:29 AM | 0 (0.0%) | 0 (0.0%) |
| 5:30 AM to 5:59 AM | 0 (0.0%) | 0 (0.0%) |
| 6:00 AM to 6:29 AM | 0 (0.0%) | 0 (0.0%) |
| 6:30 AM to 6:59 AM | 0 (0.0%) | 0 (0.0%) |
| 7:00 AM to 7:29 AM | 0 (0.0%) | 0 (0.0%) |
| 7:30 AM to 7:59 AM | 0 (0.0%) | 16 (100.0%) |
| 8:00 AM to 8:29 AM | 0 (0.0%) | 0 (0.0%) |
| 8:30 AM to 8:59 AM | 0 (0.0%) | 0 (0.0%) |
| 9:00 AM to 9:59 AM | 0 (0.0%) | 0 (0.0%) |
| 10:00 AM to 10:59 AM | 0 (0.0%) | 0 (0.0%) |
| 11:00 AM to 11:59 AM | 11 (100.0%) | 0 (0.0%) |
| 12:00 PM to 3:59 PM | 0 (0.0%) | 0 (0.0%) |
| 4:00 PM to 11:59 PM | 0 (0.0%) | 0 (0.0%) |
| Total | 11 (100.0%) | 16 (100.0%) |
Housing Occupancy in San Lorenzo
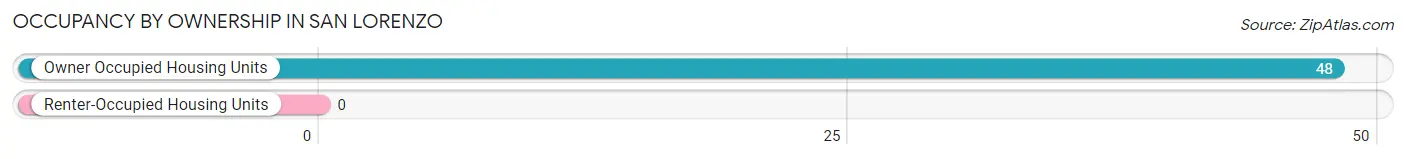
Occupancy by Ownership in San Lorenzo
Of the total 48 dwellings in San Lorenzo, owner-occupied units account for 48 (100.0%), while renter-occupied units make up 0 (0.0%).
| Occupancy | # Housing Units | % Housing Units |
| Owner Occupied Housing Units | 48 | 100.0% |
| Renter-Occupied Housing Units | 0 | 0.0% |
| Total Occupied Housing Units | 48 | 100.0% |
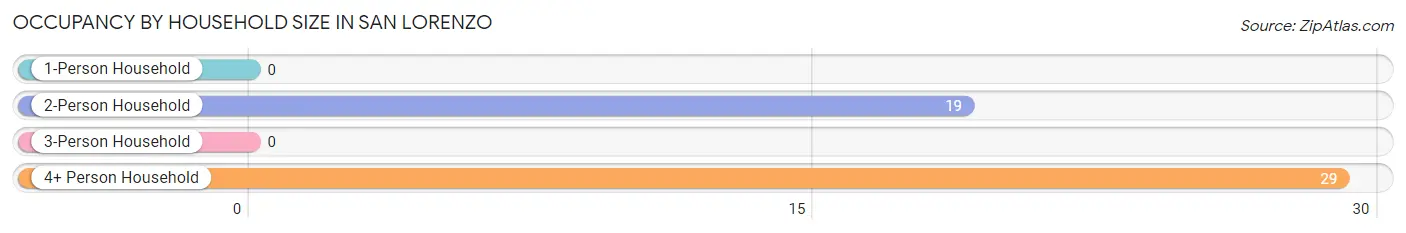
Occupancy by Household Size in San Lorenzo
| Household Size | # Housing Units | % Housing Units |
| 1-Person Household | 0 | 0.0% |
| 2-Person Household | 19 | 39.6% |
| 3-Person Household | 0 | 0.0% |
| 4+ Person Household | 29 | 60.4% |
| Total Housing Units | 48 | 100.0% |
Occupancy by Ownership by Household Size in San Lorenzo
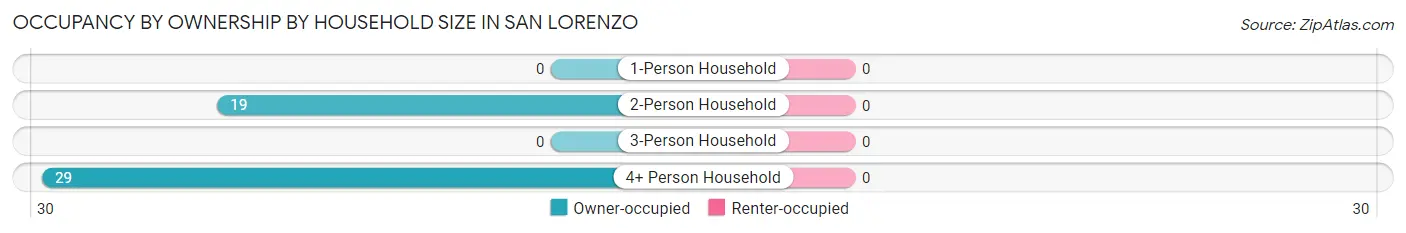
| Household Size | Owner-occupied | Renter-occupied |
| 1-Person Household | 0 (0.0%) | 0 (0.0%) |
| 2-Person Household | 19 (100.0%) | 0 (0.0%) |
| 3-Person Household | 0 (0.0%) | 0 (0.0%) |
| 4+ Person Household | 29 (100.0%) | 0 (0.0%) |
| Total Housing Units | 48 (100.0%) | 0 (0.0%) |
Occupancy by Educational Attainment in San Lorenzo
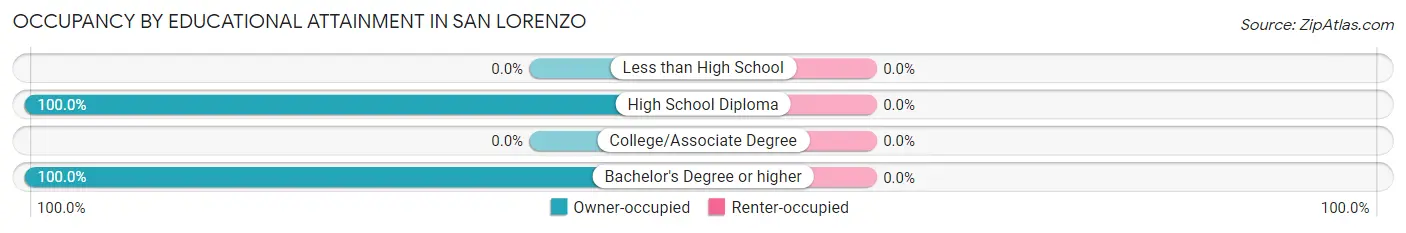
| Household Size | Owner-occupied | Renter-occupied |
| Less than High School | 0 (0.0%) | 0 (0.0%) |
| High School Diploma | 16 (100.0%) | 0 (0.0%) |
| College/Associate Degree | 0 (0.0%) | 0 (0.0%) |
| Bachelor's Degree or higher | 32 (100.0%) | 0 (0.0%) |
Occupancy by Age of Householder in San Lorenzo
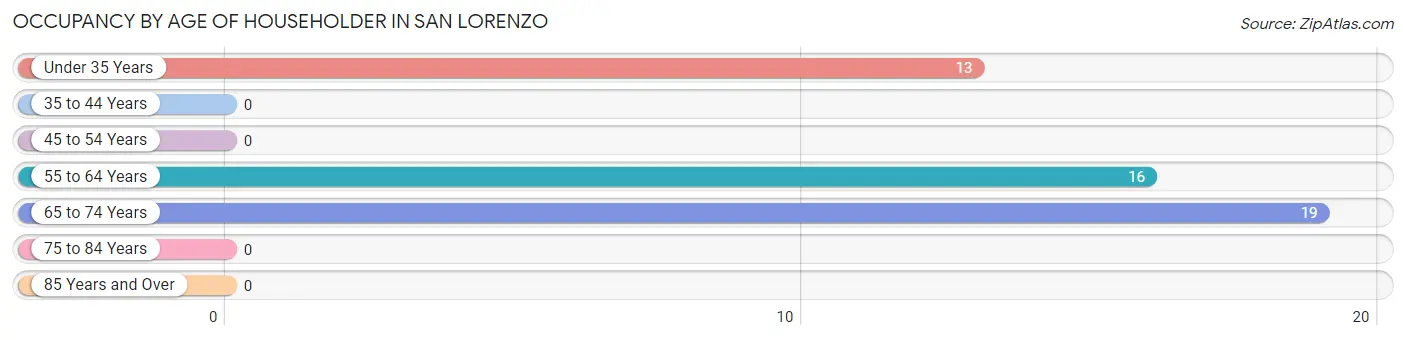
| Age Bracket | # Households | % Households |
| Under 35 Years | 13 | 27.1% |
| 35 to 44 Years | 0 | 0.0% |
| 45 to 54 Years | 0 | 0.0% |
| 55 to 64 Years | 16 | 33.3% |
| 65 to 74 Years | 19 | 39.6% |
| 75 to 84 Years | 0 | 0.0% |
| 85 Years and Over | 0 | 0.0% |
| Total | 48 | 100.0% |
Housing Finances in San Lorenzo
Median Income by Occupancy in San Lorenzo
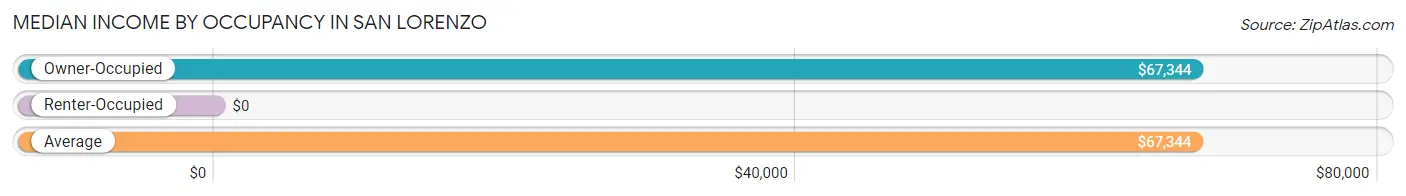
| Occupancy Type | # Households | Median Income |
| Owner-Occupied | 48 (100.0%) | $67,344 |
| Renter-Occupied | 0 (0.0%) | $0 |
| Average | 48 (100.0%) | $67,344 |
Occupancy by Householder Income Bracket in San Lorenzo
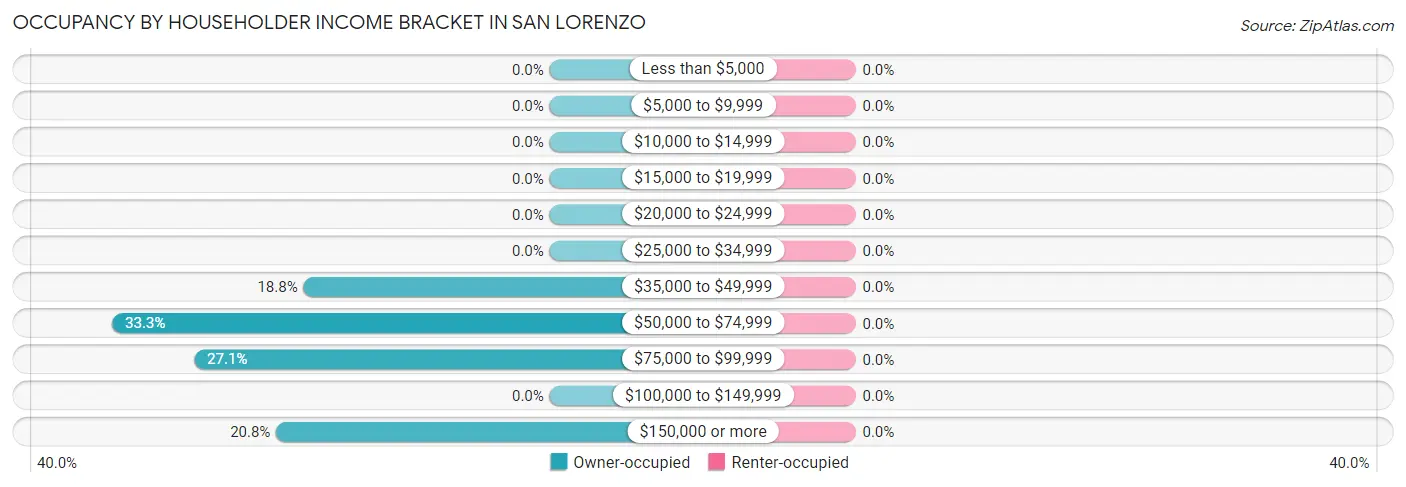
| Income Bracket | Owner-occupied | Renter-occupied |
| Less than $5,000 | 0 (0.0%) | 0 (0.0%) |
| $5,000 to $9,999 | 0 (0.0%) | 0 (0.0%) |
| $10,000 to $14,999 | 0 (0.0%) | 0 (0.0%) |
| $15,000 to $19,999 | 0 (0.0%) | 0 (0.0%) |
| $20,000 to $24,999 | 0 (0.0%) | 0 (0.0%) |
| $25,000 to $34,999 | 0 (0.0%) | 0 (0.0%) |
| $35,000 to $49,999 | 9 (18.8%) | 0 (0.0%) |
| $50,000 to $74,999 | 16 (33.3%) | 0 (0.0%) |
| $75,000 to $99,999 | 13 (27.1%) | 0 (0.0%) |
| $100,000 to $149,999 | 0 (0.0%) | 0 (0.0%) |
| $150,000 or more | 10 (20.8%) | 0 (0.0%) |
| Total | 48 (100.0%) | 0 (0.0%) |
Monthly Housing Cost Tiers in San Lorenzo
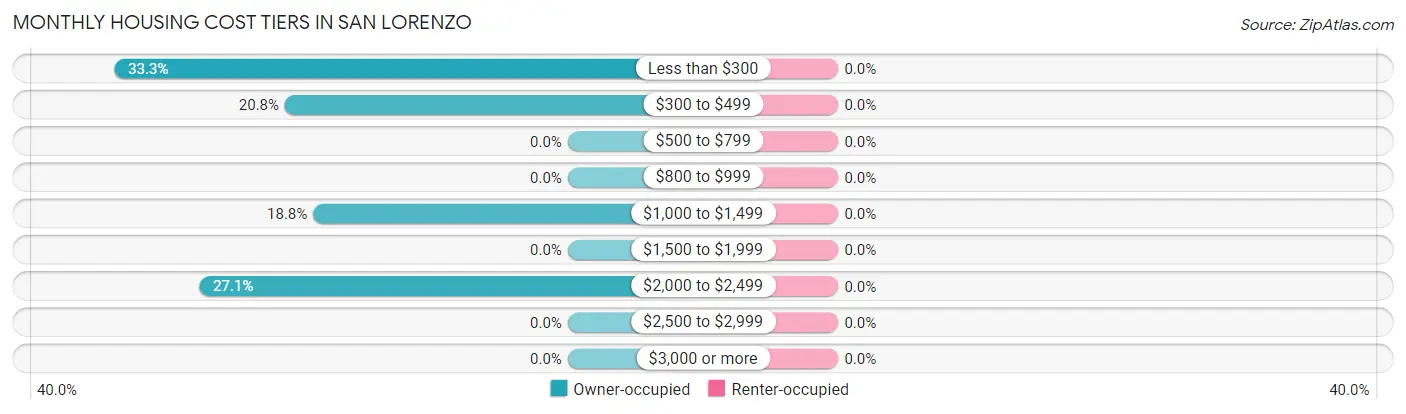
| Monthly Cost | Owner-occupied | Renter-occupied |
| Less than $300 | 16 (33.3%) | 0 (0.0%) |
| $300 to $499 | 10 (20.8%) | 0 (0.0%) |
| $500 to $799 | 0 (0.0%) | 0 (0.0%) |
| $800 to $999 | 0 (0.0%) | 0 (0.0%) |
| $1,000 to $1,499 | 9 (18.8%) | 0 (0.0%) |
| $1,500 to $1,999 | 0 (0.0%) | 0 (0.0%) |
| $2,000 to $2,499 | 13 (27.1%) | 0 (0.0%) |
| $2,500 to $2,999 | 0 (0.0%) | 0 (0.0%) |
| $3,000 or more | 0 (0.0%) | 0 (0.0%) |
| Total | 48 (100.0%) | 0 (0.0%) |
Physical Housing Characteristics in San Lorenzo
Housing Structures in San Lorenzo
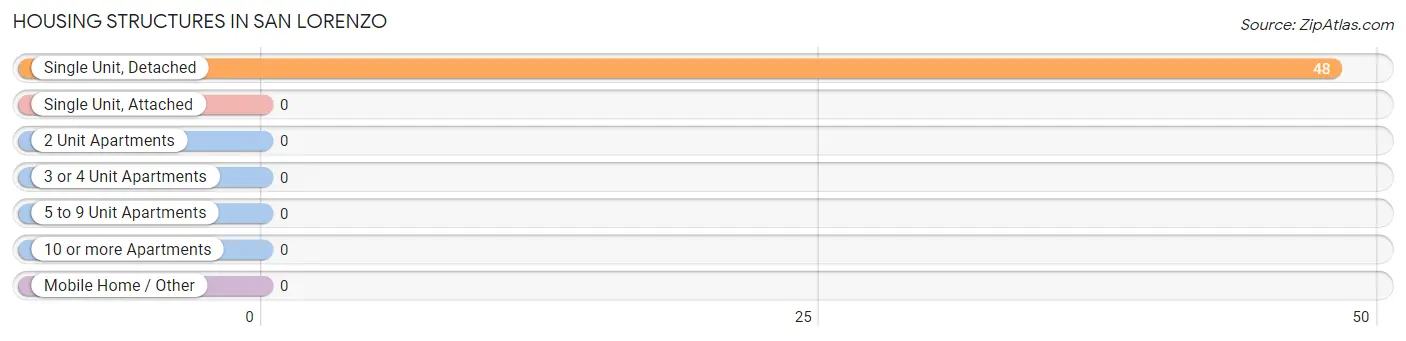
| Structure Type | # Housing Units | % Housing Units |
| Single Unit, Detached | 48 | 100.0% |
| Single Unit, Attached | 0 | 0.0% |
| 2 Unit Apartments | 0 | 0.0% |
| 3 or 4 Unit Apartments | 0 | 0.0% |
| 5 to 9 Unit Apartments | 0 | 0.0% |
| 10 or more Apartments | 0 | 0.0% |
| Mobile Home / Other | 0 | 0.0% |
| Total | 48 | 100.0% |
Housing Structures by Occupancy in San Lorenzo
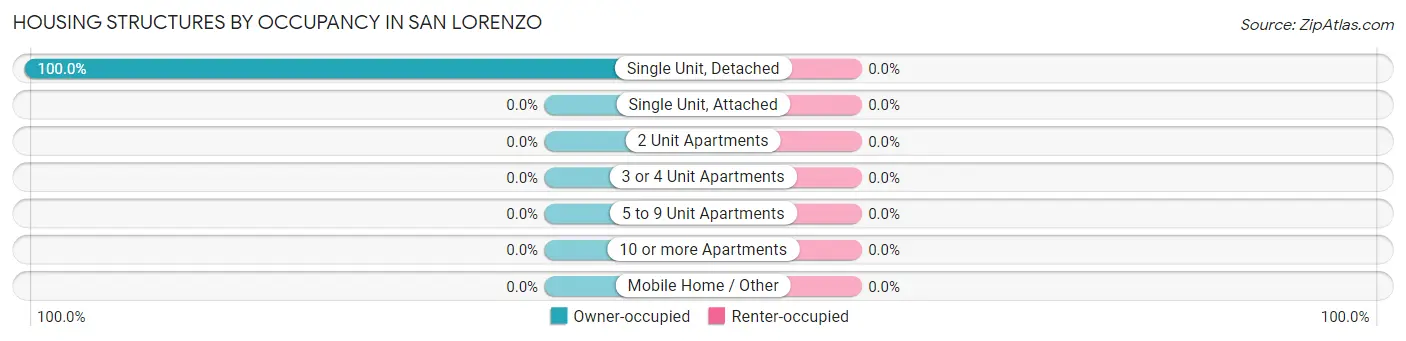
| Structure Type | Owner-occupied | Renter-occupied |
| Single Unit, Detached | 48 (100.0%) | 0 (0.0%) |
| Single Unit, Attached | 0 (0.0%) | 0 (0.0%) |
| 2 Unit Apartments | 0 (0.0%) | 0 (0.0%) |
| 3 or 4 Unit Apartments | 0 (0.0%) | 0 (0.0%) |
| 5 to 9 Unit Apartments | 0 (0.0%) | 0 (0.0%) |
| 10 or more Apartments | 0 (0.0%) | 0 (0.0%) |
| Mobile Home / Other | 0 (0.0%) | 0 (0.0%) |
| Total | 48 (100.0%) | 0 (0.0%) |
Housing Structures by Number of Rooms in San Lorenzo
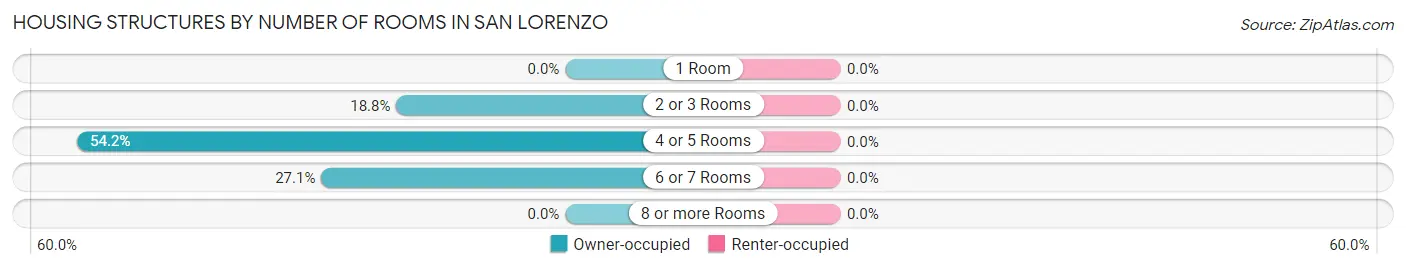
| Number of Rooms | Owner-occupied | Renter-occupied |
| 1 Room | 0 (0.0%) | 0 (0.0%) |
| 2 or 3 Rooms | 9 (18.8%) | 0 (0.0%) |
| 4 or 5 Rooms | 26 (54.2%) | 0 (0.0%) |
| 6 or 7 Rooms | 13 (27.1%) | 0 (0.0%) |
| 8 or more Rooms | 0 (0.0%) | 0 (0.0%) |
| Total | 48 (100.0%) | 0 (0.0%) |
Housing Structure by Heating Type in San Lorenzo
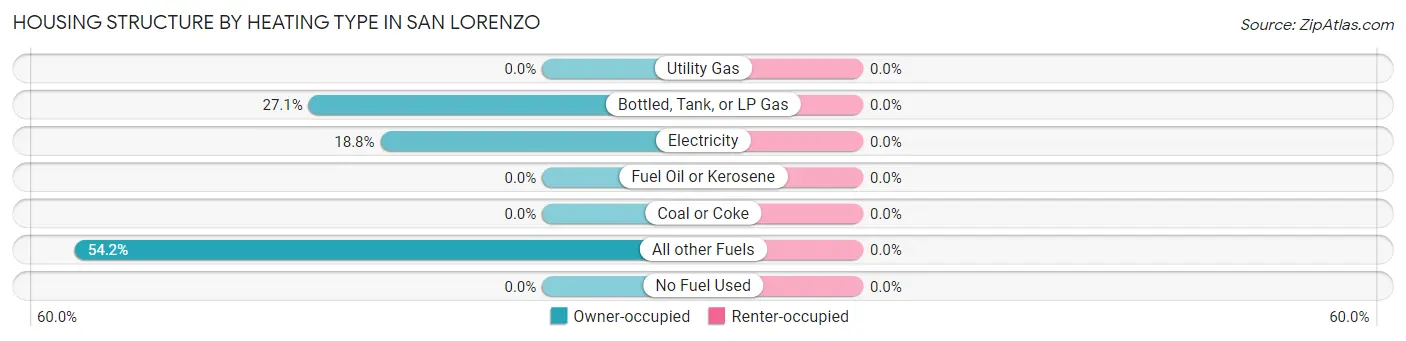
| Heating Type | Owner-occupied | Renter-occupied |
| Utility Gas | 0 (0.0%) | 0 (0.0%) |
| Bottled, Tank, or LP Gas | 13 (27.1%) | 0 (0.0%) |
| Electricity | 9 (18.8%) | 0 (0.0%) |
| Fuel Oil or Kerosene | 0 (0.0%) | 0 (0.0%) |
| Coal or Coke | 0 (0.0%) | 0 (0.0%) |
| All other Fuels | 26 (54.2%) | 0 (0.0%) |
| No Fuel Used | 0 (0.0%) | 0 (0.0%) |
| Total | 48 (100.0%) | 0 (0.0%) |
Household Vehicle Usage in San Lorenzo
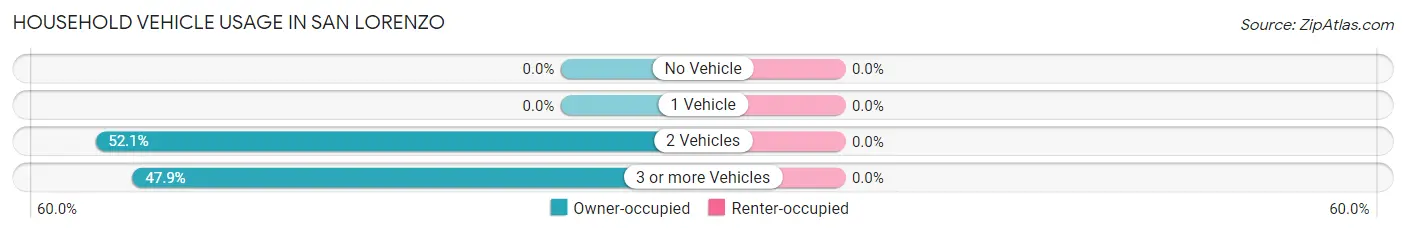
| Vehicles per Household | Owner-occupied | Renter-occupied |
| No Vehicle | 0 (0.0%) | 0 (0.0%) |
| 1 Vehicle | 0 (0.0%) | 0 (0.0%) |
| 2 Vehicles | 25 (52.1%) | 0 (0.0%) |
| 3 or more Vehicles | 23 (47.9%) | 0 (0.0%) |
| Total | 48 (100.0%) | 0 (0.0%) |
Real Estate & Mortgages in San Lorenzo
Real Estate and Mortgage Overview in San Lorenzo
| Characteristic | Without Mortgage | With Mortgage |
| Housing Units | 26 | 22 |
| Median Property Value | - | - |
| Median Household Income | - | - |
| Monthly Housing Costs | - | - |
| Real Estate Taxes | - | - |
Property Value by Mortgage Status in San Lorenzo
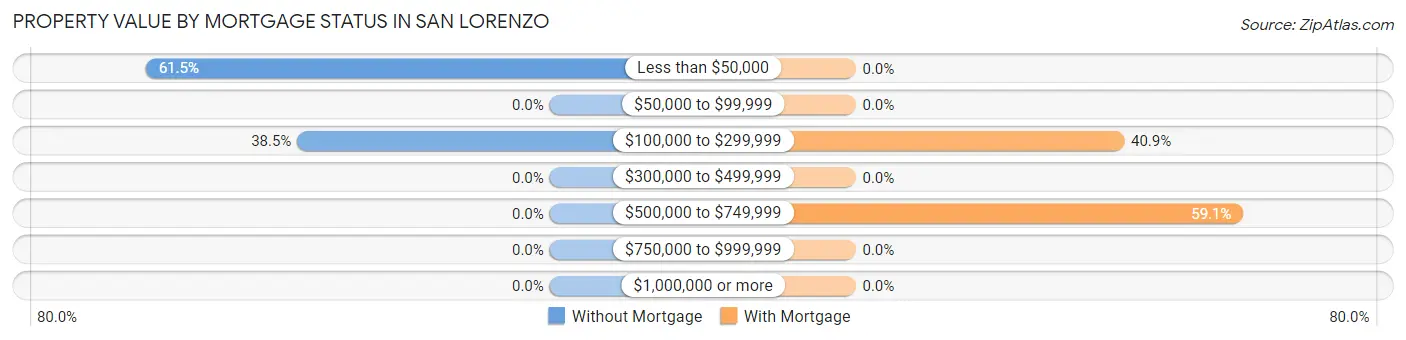
| Property Value | Without Mortgage | With Mortgage |
| Less than $50,000 | 16 (61.5%) | 0 (0.0%) |
| $50,000 to $99,999 | 0 (0.0%) | 0 (0.0%) |
| $100,000 to $299,999 | 10 (38.5%) | 9 (40.9%) |
| $300,000 to $499,999 | 0 (0.0%) | 0 (0.0%) |
| $500,000 to $749,999 | 0 (0.0%) | 13 (59.1%) |
| $750,000 to $999,999 | 0 (0.0%) | 0 (0.0%) |
| $1,000,000 or more | 0 (0.0%) | 0 (0.0%) |
| Total | 26 (100.0%) | 22 (100.0%) |
Household Income by Mortgage Status in San Lorenzo
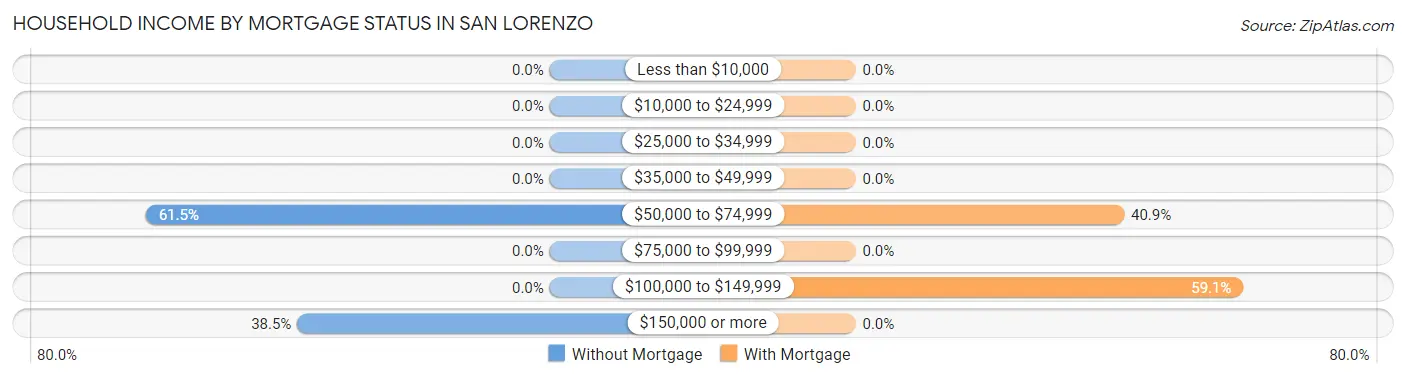
| Household Income | Without Mortgage | With Mortgage |
| Less than $10,000 | 0 (0.0%) | 0 (0.0%) |
| $10,000 to $24,999 | 0 (0.0%) | 0 (0.0%) |
| $25,000 to $34,999 | 0 (0.0%) | 0 (0.0%) |
| $35,000 to $49,999 | 0 (0.0%) | 0 (0.0%) |
| $50,000 to $74,999 | 16 (61.5%) | 9 (40.9%) |
| $75,000 to $99,999 | 0 (0.0%) | 0 (0.0%) |
| $100,000 to $149,999 | 0 (0.0%) | 13 (59.1%) |
| $150,000 or more | 10 (38.5%) | 0 (0.0%) |
| Total | 26 (100.0%) | 22 (100.0%) |
Property Value to Household Income Ratio in San Lorenzo
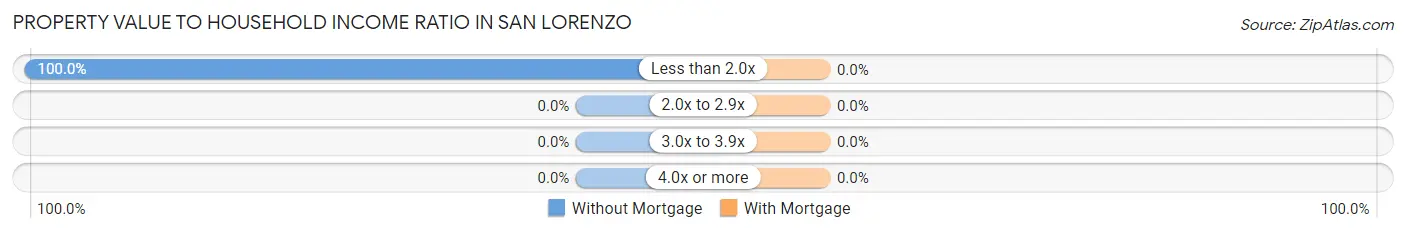
| Value-to-Income Ratio | Without Mortgage | With Mortgage |
| Less than 2.0x | 26 (100.0%) | 0 (0.0%) |
| 2.0x to 2.9x | 0 (0.0%) | 0 (0.0%) |
| 3.0x to 3.9x | 0 (0.0%) | 0 (0.0%) |
| 4.0x or more | 0 (0.0%) | 0 (0.0%) |
| Total | 26 (100.0%) | 22 (100.0%) |
Real Estate Taxes by Mortgage Status in San Lorenzo
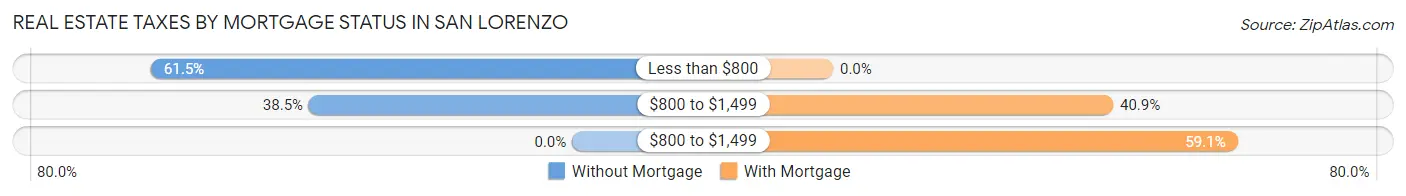
| Property Taxes | Without Mortgage | With Mortgage |
| Less than $800 | 16 (61.5%) | 0 (0.0%) |
| $800 to $1,499 | 10 (38.5%) | 9 (40.9%) |
| $800 to $1,499 | 0 (0.0%) | 13 (59.1%) |
| Total | 26 (100.0%) | 22 (100.0%) |
Health & Disability in San Lorenzo
Health Insurance Coverage by Age in San Lorenzo
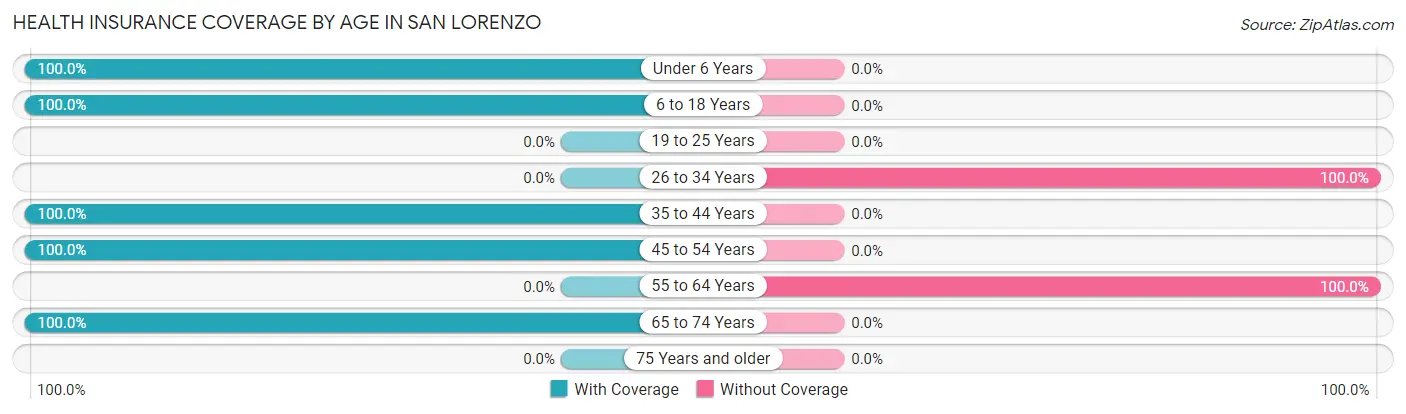
| Age Bracket | With Coverage | Without Coverage |
| Under 6 Years | 25 (100.0%) | 0 (0.0%) |
| 6 to 18 Years | 61 (100.0%) | 0 (0.0%) |
| 19 to 25 Years | 0 (0.0%) | 0 (0.0%) |
| 26 to 34 Years | 0 (0.0%) | 13 (100.0%) |
| 35 to 44 Years | 47 (100.0%) | 0 (0.0%) |
| 45 to 54 Years | 30 (100.0%) | 0 (0.0%) |
| 55 to 64 Years | 0 (0.0%) | 16 (100.0%) |
| 65 to 74 Years | 68 (100.0%) | 0 (0.0%) |
| 75 Years and older | 0 (0.0%) | 0 (0.0%) |
| Total | 231 (88.8%) | 29 (11.2%) |
Health Insurance Coverage by Citizenship Status in San Lorenzo
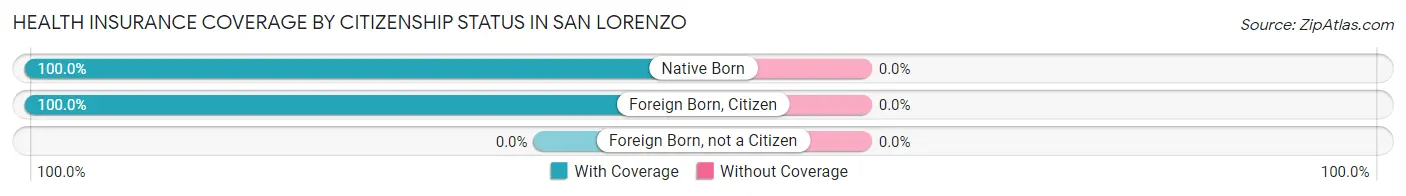
| Citizenship Status | With Coverage | Without Coverage |
| Native Born | 25 (100.0%) | 0 (0.0%) |
| Foreign Born, Citizen | 61 (100.0%) | 0 (0.0%) |
| Foreign Born, not a Citizen | 0 (0.0%) | 0 (0.0%) |
Health Insurance Coverage by Household Income in San Lorenzo
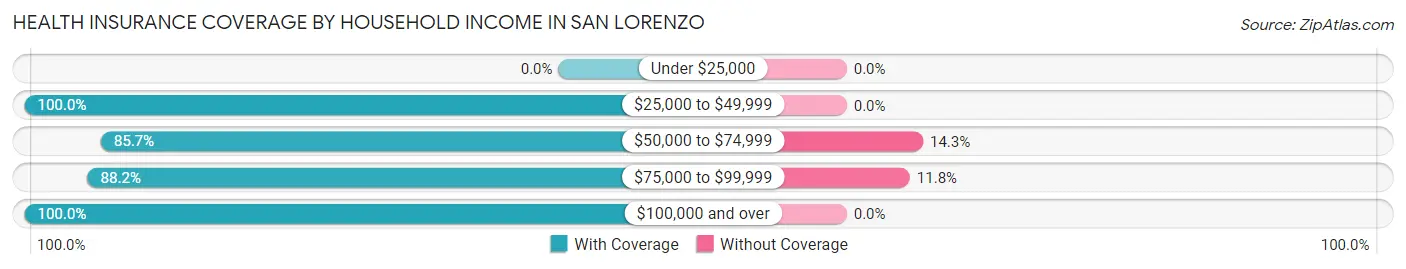
| Household Income | With Coverage | Without Coverage |
| Under $25,000 | 0 (0.0%) | 0 (0.0%) |
| $25,000 to $49,999 | 17 (100.0%) | 0 (0.0%) |
| $50,000 to $74,999 | 96 (85.7%) | 16 (14.3%) |
| $75,000 to $99,999 | 97 (88.2%) | 13 (11.8%) |
| $100,000 and over | 21 (100.0%) | 0 (0.0%) |
Public vs Private Health Insurance Coverage by Age in San Lorenzo
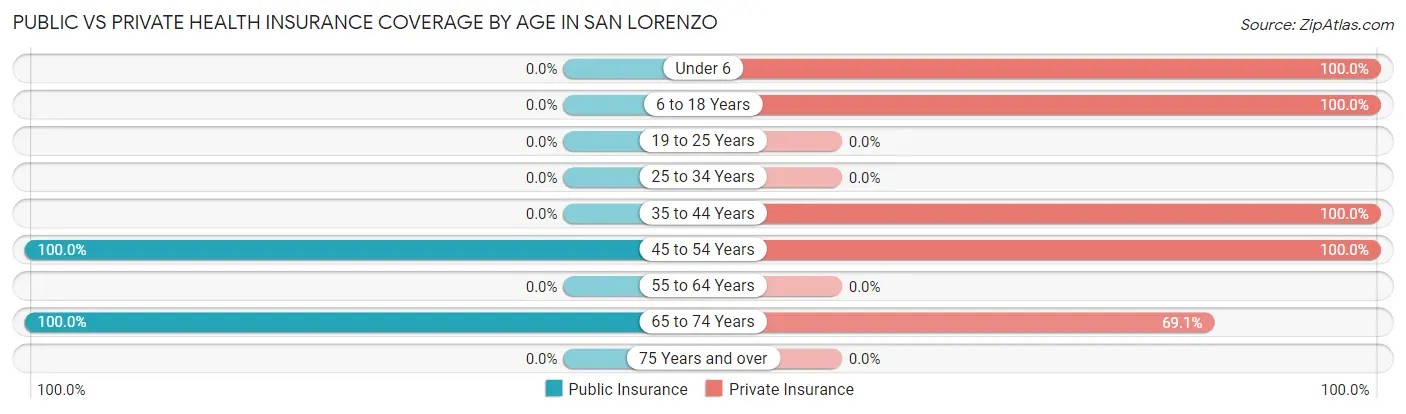
| Age Bracket | Public Insurance | Private Insurance |
| Under 6 | 0 (0.0%) | 25 (100.0%) |
| 6 to 18 Years | 0 (0.0%) | 61 (100.0%) |
| 19 to 25 Years | 0 (0.0%) | 0 (0.0%) |
| 25 to 34 Years | 0 (0.0%) | 0 (0.0%) |
| 35 to 44 Years | 0 (0.0%) | 47 (100.0%) |
| 45 to 54 Years | 30 (100.0%) | 30 (100.0%) |
| 55 to 64 Years | 0 (0.0%) | 0 (0.0%) |
| 65 to 74 Years | 68 (100.0%) | 47 (69.1%) |
| 75 Years and over | 0 (0.0%) | 0 (0.0%) |
| Total | 98 (37.7%) | 210 (80.8%) |
Disability Status by Sex by Age in San Lorenzo
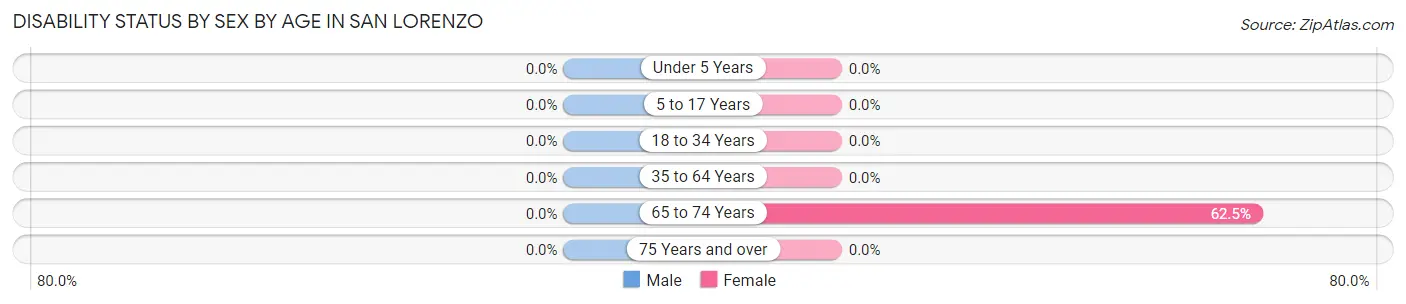
| Age Bracket | Male | Female |
| Under 5 Years | 0 (0.0%) | 0 (0.0%) |
| 5 to 17 Years | 0 (0.0%) | 0 (0.0%) |
| 18 to 34 Years | 0 (0.0%) | 0 (0.0%) |
| 35 to 64 Years | 0 (0.0%) | 0 (0.0%) |
| 65 to 74 Years | 0 (0.0%) | 30 (62.5%) |
| 75 Years and over | 0 (0.0%) | 0 (0.0%) |
Disability Class by Sex by Age in San Lorenzo
Disability Class: Hearing Difficulty
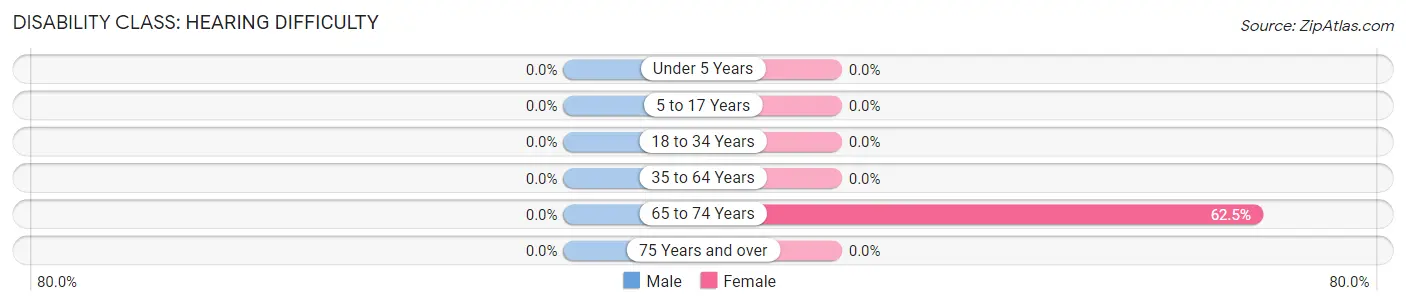
| Age Bracket | Male | Female |
| Under 5 Years | 0 (0.0%) | 0 (0.0%) |
| 5 to 17 Years | 0 (0.0%) | 0 (0.0%) |
| 18 to 34 Years | 0 (0.0%) | 0 (0.0%) |
| 35 to 64 Years | 0 (0.0%) | 0 (0.0%) |
| 65 to 74 Years | 0 (0.0%) | 30 (62.5%) |
| 75 Years and over | 0 (0.0%) | 0 (0.0%) |
Disability Class: Vision Difficulty
| Age Bracket | Male | Female |
| Under 5 Years | 0 (0.0%) | 0 (0.0%) |
| 5 to 17 Years | 0 (0.0%) | 0 (0.0%) |
| 18 to 34 Years | 0 (0.0%) | 0 (0.0%) |
| 35 to 64 Years | 0 (0.0%) | 0 (0.0%) |
| 65 to 74 Years | 0 (0.0%) | 0 (0.0%) |
| 75 Years and over | 0 (0.0%) | 0 (0.0%) |
Disability Class: Cognitive Difficulty
| Age Bracket | Male | Female |
| 5 to 17 Years | 0 (0.0%) | 0 (0.0%) |
| 18 to 34 Years | 0 (0.0%) | 0 (0.0%) |
| 35 to 64 Years | 0 (0.0%) | 0 (0.0%) |
| 65 to 74 Years | 0 (0.0%) | 0 (0.0%) |
| 75 Years and over | 0 (0.0%) | 0 (0.0%) |
Disability Class: Ambulatory Difficulty
| Age Bracket | Male | Female |
| 5 to 17 Years | 0 (0.0%) | 0 (0.0%) |
| 18 to 34 Years | 0 (0.0%) | 0 (0.0%) |
| 35 to 64 Years | 0 (0.0%) | 0 (0.0%) |
| 65 to 74 Years | 0 (0.0%) | 0 (0.0%) |
| 75 Years and over | 0 (0.0%) | 0 (0.0%) |
Disability Class: Self-Care Difficulty
| Age Bracket | Male | Female |
| 5 to 17 Years | 0 (0.0%) | 0 (0.0%) |
| 18 to 34 Years | 0 (0.0%) | 0 (0.0%) |
| 35 to 64 Years | 0 (0.0%) | 0 (0.0%) |
| 65 to 74 Years | 0 (0.0%) | 0 (0.0%) |
| 75 Years and over | 0 (0.0%) | 0 (0.0%) |
Technology Access in San Lorenzo
Computing Device Access in San Lorenzo
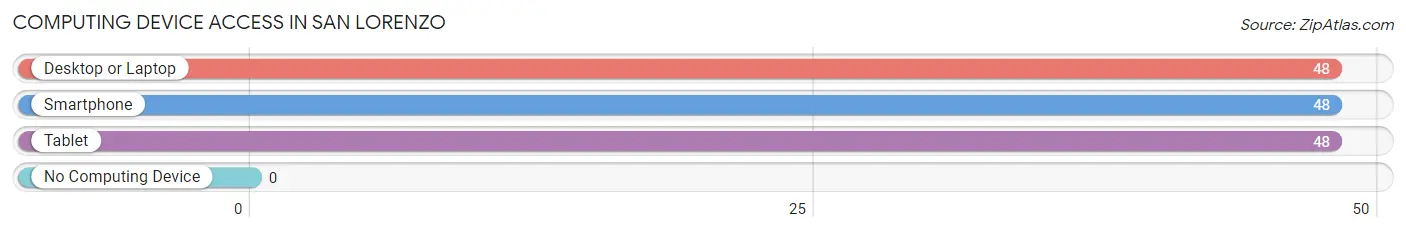
| Device Type | # Households | % Households |
| Desktop or Laptop | 48 | 100.0% |
| Smartphone | 48 | 100.0% |
| Tablet | 48 | 100.0% |
| No Computing Device | 0 | 0.0% |
| Total | 48 | 100.0% |
Internet Access in San Lorenzo
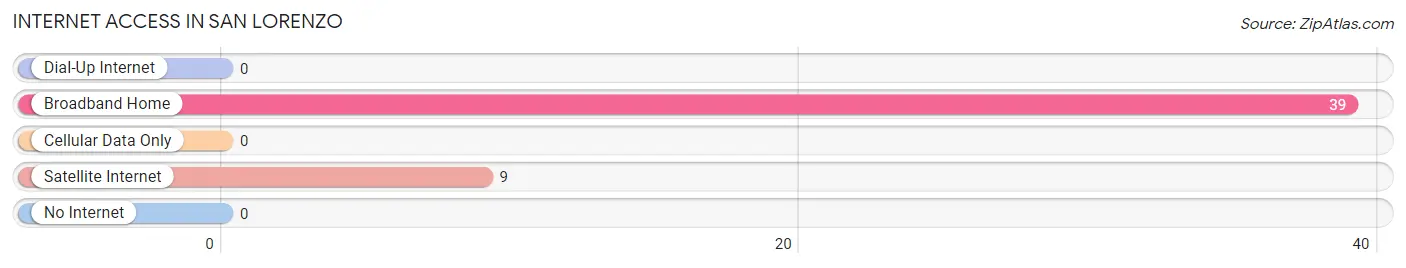
| Internet Type | # Households | % Households |
| Dial-Up Internet | 0 | 0.0% |
| Broadband Home | 39 | 81.2% |
| Cellular Data Only | 0 | 0.0% |
| Satellite Internet | 9 | 18.8% |
| No Internet | 0 | 0.0% |
| Total | 48 | 100.0% |
San Lorenzo Summary
San Lorenzo, New Mexico is a small unincorporated community located in the San Miguel County of the state of New Mexico. It is situated in the foothills of the Sangre de Cristo Mountains, approximately 25 miles south of Las Vegas, New Mexico. The community is located along the banks of the Gallinas River, and is surrounded by the San Miguel Mountains to the east and the San Juan Mountains to the west.
History
San Lorenzo was first established in the late 1800s as a small farming community. The area was originally inhabited by the Tewa Indians, who were later displaced by Spanish settlers. The first settlers in the area were ranchers and farmers, who established small homesteads and ranches. The area was also home to a number of small mining operations, which provided employment for many of the local residents.
In the early 1900s, the town of San Lorenzo was officially established. The town was named after the nearby San Lorenzo de Picuris Pueblo, which is located just a few miles away. The town quickly grew in size and by the 1920s, it had become a bustling community with a population of over 500 people.
Geography
San Lorenzo is located in the foothills of the Sangre de Cristo Mountains, approximately 25 miles south of Las Vegas, New Mexico. The community is situated along the banks of the Gallinas River, and is surrounded by the San Miguel Mountains to the east and the San Juan Mountains to the west. The area is characterized by rolling hills, open plains, and rugged mountains. The climate in the area is semi-arid, with hot summers and cold winters.
Economy
The economy of San Lorenzo is largely based on agriculture and ranching. The area is home to a number of small farms and ranches, which produce a variety of crops and livestock. The area is also home to a number of small businesses, including restaurants, stores, and other services.
Demographics
As of the 2010 census, the population of San Lorenzo was 545. The racial makeup of the town was 94.3% White, 0.7% African American, 0.7% Native American, 0.7% Asian, 0.7% from other races, and 2.7% from two or more races. The median household income in the town was $31,250, and the median family income was $37,500. The per capita income in the town was $14,818.
Conclusion
San Lorenzo, New Mexico is a small unincorporated community located in the San Miguel County of the state of New Mexico. It is situated in the foothills of the Sangre de Cristo Mountains, approximately 25 miles south of Las Vegas, New Mexico. The community is located along the banks of the Gallinas River, and is surrounded by the San Miguel Mountains to the east and the San Juan Mountains to the west. The economy of San Lorenzo is largely based on agriculture and ranching, and the town has a population of 545 as of the 2010 census.
Common Questions
What is Per Capita Income in San Lorenzo?
Per Capita income in San Lorenzo is $20,948.
What is the Median Family Income in San Lorenzo?
Median Family Income in San Lorenzo is $67,344.
What is the Median Household income in San Lorenzo?
Median Household Income in San Lorenzo is $67,344.
What is Inequality or Gini Index in San Lorenzo?
Inequality or Gini Index in San Lorenzo is 0.32.
What is the Total Population of San Lorenzo?
Total Population of San Lorenzo is 260.
What is the Total Male Population of San Lorenzo?
Total Male Population of San Lorenzo is 61.
What is the Total Female Population of San Lorenzo?
Total Female Population of San Lorenzo is 199.
What is the Ratio of Males per 100 Females in San Lorenzo?
There are 30.65 Males per 100 Females in San Lorenzo.
What is the Ratio of Females per 100 Males in San Lorenzo?
There are 326.23 Females per 100 Males in San Lorenzo.
What is the Median Population Age in San Lorenzo?
Median Population Age in San Lorenzo is 44.6 Years.
What is the Average Family Size in San Lorenzo
Average Family Size in San Lorenzo is 5.4 People.
What is the Average Household Size in San Lorenzo
Average Household Size in San Lorenzo is 5.4 People.
How Large is the Labor Force in San Lorenzo?
There are 40 People in the Labor Forcein in San Lorenzo.
What is the Percentage of People in the Labor Force in San Lorenzo?
23.0% of People are in the Labor Force in San Lorenzo.