La Cueva, NM Map & Demographics
La Cueva Map
La Cueva Overview
$32,272
PER CAPITA INCOME
$83,646
AVG FAMILY INCOME
$53,462
AVG HOUSEHOLD INCOME
0.40
INEQUALITY / GINI INDEX
694
TOTAL POPULATION
359
MALE POPULATION
335
FEMALE POPULATION
107.16
MALES / 100 FEMALES
93.31
FEMALES / 100 MALES
49.4
MEDIAN AGE
2.3
AVG FAMILY SIZE
2.0
AVG HOUSEHOLD SIZE
481
LABOR FORCE [ PEOPLE ]
69.3%
PERCENT IN LABOR FORCE
Income in La Cueva
Income Overview in La Cueva
Per Capita Income in La Cueva is $32,272, while median incomes of families and households are $83,646 and $53,462 respectively.
| Characteristic | Number | Measure |
| Per Capita Income | 694 | $32,272 |
| Median Family Income | 185 | $83,646 |
| Mean Family Income | 185 | $76,237 |
| Median Household Income | 342 | $53,462 |
| Mean Household Income | 342 | $61,829 |
| Income Deficit | 185 | $0 |
| Wage / Income Gap (%) | 694 | 0.00% |
| Wage / Income Gap ($) | 694 | 100.00¢ per $1 |
| Gini / Inequality Index | 694 | 0.40 |
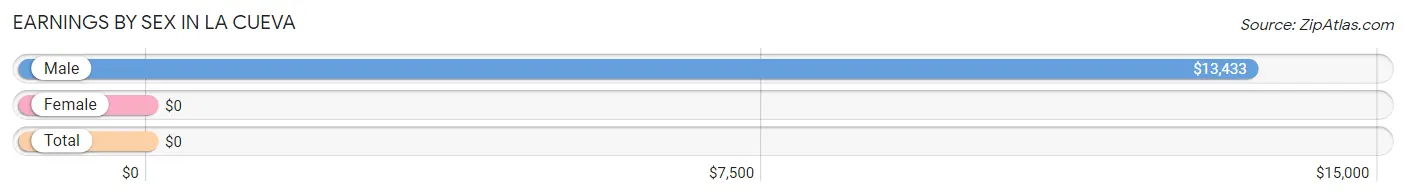
Earnings by Sex in La Cueva
| Sex | Number | Average Earnings |
| Male | 304 (56.5%) | $13,433 |
| Female | 234 (43.5%) | $0 |
| Total | 538 (100.0%) | $0 |
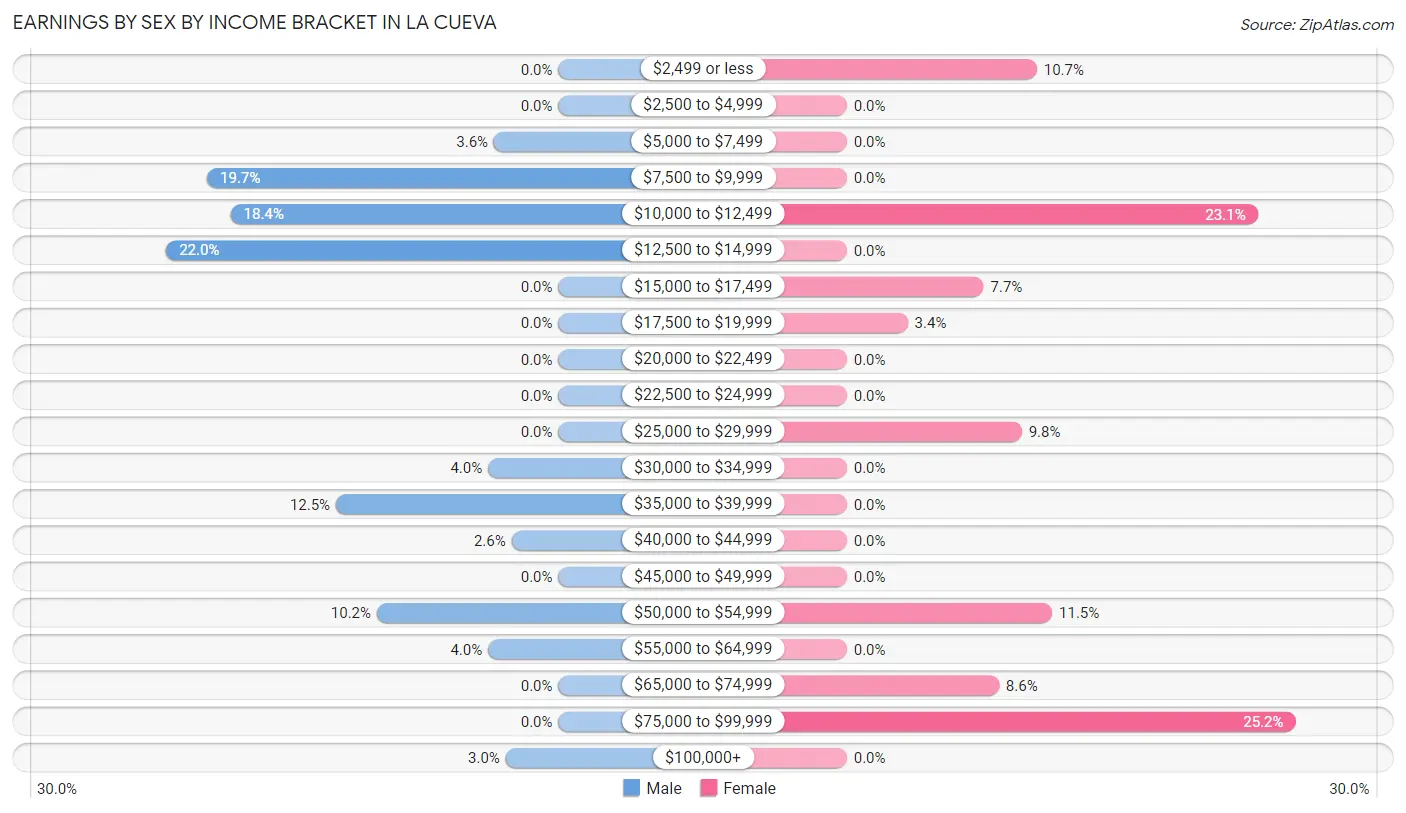
Earnings by Sex by Income Bracket in La Cueva
The most common earnings brackets in La Cueva are $12,500 to $14,999 for men (67 | 22.0%) and $75,000 to $99,999 for women (59 | 25.2%).
| Income | Male | Female |
| $2,499 or less | 0 (0.0%) | 25 (10.7%) |
| $2,500 to $4,999 | 0 (0.0%) | 0 (0.0%) |
| $5,000 to $7,499 | 11 (3.6%) | 0 (0.0%) |
| $7,500 to $9,999 | 60 (19.7%) | 0 (0.0%) |
| $10,000 to $12,499 | 56 (18.4%) | 54 (23.1%) |
| $12,500 to $14,999 | 67 (22.0%) | 0 (0.0%) |
| $15,000 to $17,499 | 0 (0.0%) | 18 (7.7%) |
| $17,500 to $19,999 | 0 (0.0%) | 8 (3.4%) |
| $20,000 to $22,499 | 0 (0.0%) | 0 (0.0%) |
| $22,500 to $24,999 | 0 (0.0%) | 0 (0.0%) |
| $25,000 to $29,999 | 0 (0.0%) | 23 (9.8%) |
| $30,000 to $34,999 | 12 (4.0%) | 0 (0.0%) |
| $35,000 to $39,999 | 38 (12.5%) | 0 (0.0%) |
| $40,000 to $44,999 | 8 (2.6%) | 0 (0.0%) |
| $45,000 to $49,999 | 0 (0.0%) | 0 (0.0%) |
| $50,000 to $54,999 | 31 (10.2%) | 27 (11.5%) |
| $55,000 to $64,999 | 12 (4.0%) | 0 (0.0%) |
| $65,000 to $74,999 | 0 (0.0%) | 20 (8.6%) |
| $75,000 to $99,999 | 0 (0.0%) | 59 (25.2%) |
| $100,000+ | 9 (3.0%) | 0 (0.0%) |
| Total | 304 (100.0%) | 234 (100.0%) |
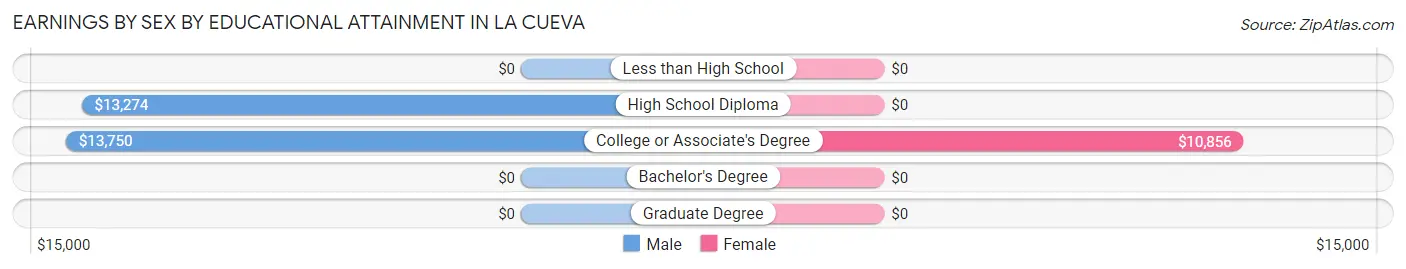
Earnings by Sex by Educational Attainment in La Cueva
| Educational Attainment | Male Income | Female Income |
| Less than High School | - | - |
| High School Diploma | $13,274 | $0 |
| College or Associate's Degree | $13,750 | $10,856 |
| Bachelor's Degree | - | - |
| Graduate Degree | - | - |
| Total | - | - |
Family Income in La Cueva
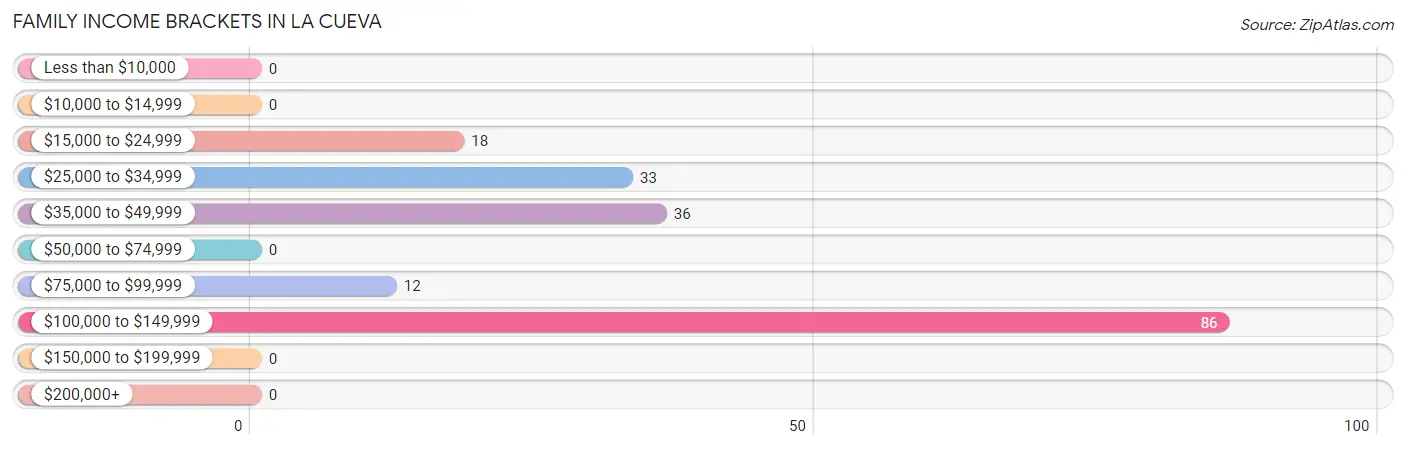
Family Income Brackets in La Cueva
According to the La Cueva family income data, there are 86 families falling into the $100,000 to $149,999 income range, which is the most common income bracket and makes up 46.5% of all families.
| Income Bracket | # Families | % Families |
| Less than $10,000 | 0 | 0.0% |
| $10,000 to $14,999 | 0 | 0.0% |
| $15,000 to $24,999 | 18 | 9.7% |
| $25,000 to $34,999 | 33 | 17.8% |
| $35,000 to $49,999 | 36 | 19.5% |
| $50,000 to $74,999 | 0 | 0.0% |
| $75,000 to $99,999 | 12 | 6.5% |
| $100,000 to $149,999 | 86 | 46.5% |
| $150,000 to $199,999 | 0 | 0.0% |
| $200,000+ | 0 | 0.0% |
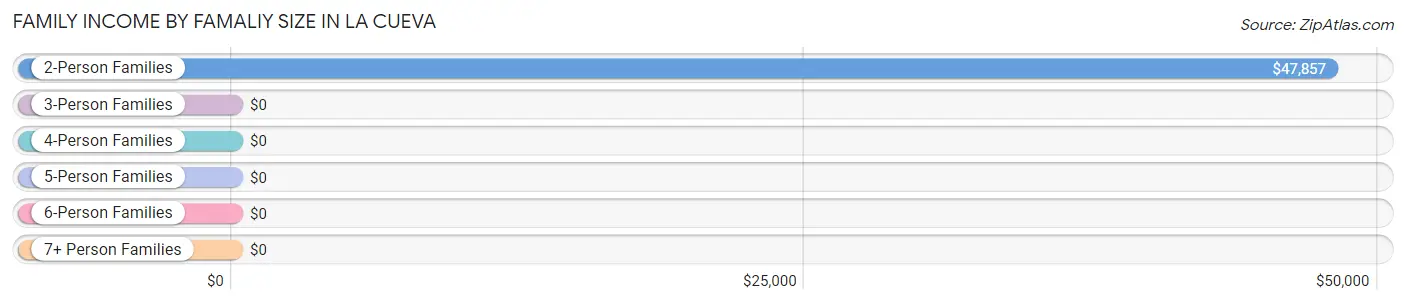
Family Income by Famaliy Size in La Cueva
2-person families (126 | 68.1%) account for the highest median family income in La Cueva with $47,857 per family, while 2-person families (126 | 68.1%) have the highest median income of $23,928 per family member.
| Income Bracket | # Families | Median Income |
| 2-Person Families | 126 (68.1%) | $47,857 |
| 3-Person Families | 59 (31.9%) | $0 |
| 4-Person Families | 0 (0.0%) | $0 |
| 5-Person Families | 0 (0.0%) | $0 |
| 6-Person Families | 0 (0.0%) | $0 |
| 7+ Person Families | 0 (0.0%) | $0 |
| Total | 185 (100.0%) | $83,646 |
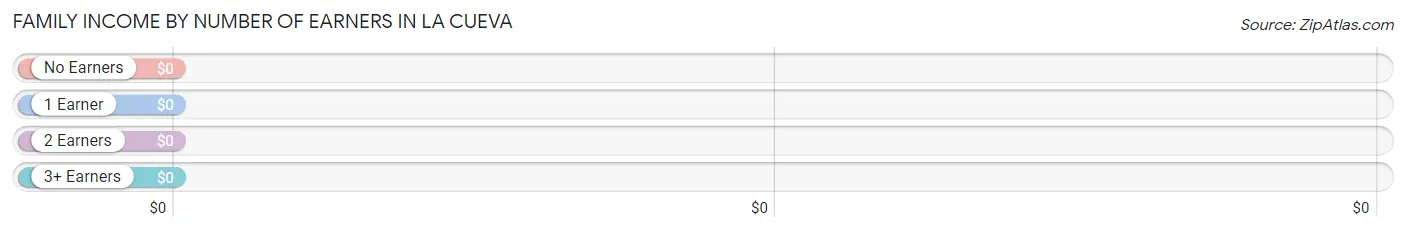
Family Income by Number of Earners in La Cueva
| Number of Earners | # Families | Median Income |
| No Earners | 26 (14.1%) | $0 |
| 1 Earner | 40 (21.6%) | $0 |
| 2 Earners | 60 (32.4%) | $0 |
| 3+ Earners | 59 (31.9%) | $0 |
| Total | 185 (100.0%) | $83,646 |
Household Income in La Cueva
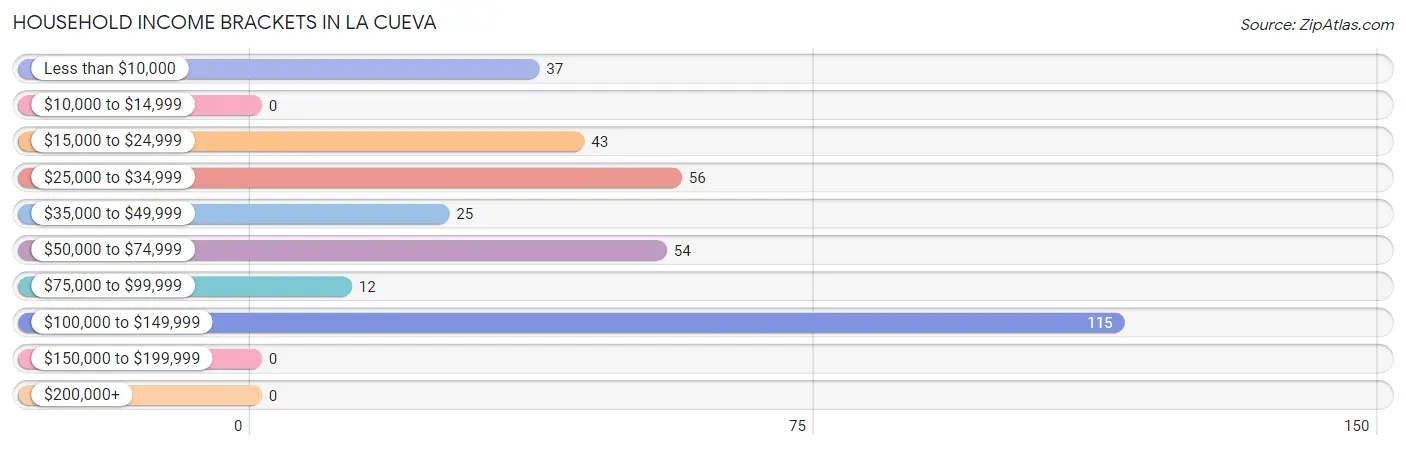
Household Income Brackets in La Cueva
With 115 households falling in the category, the $100,000 to $149,999 income range is the most frequent in La Cueva, accounting for 33.6% of all households.
| Income Bracket | # Households | % Households |
| Less than $10,000 | 37 | 10.8% |
| $10,000 to $14,999 | 0 | 0.0% |
| $15,000 to $24,999 | 43 | 12.6% |
| $25,000 to $34,999 | 56 | 16.4% |
| $35,000 to $49,999 | 25 | 7.3% |
| $50,000 to $74,999 | 54 | 15.8% |
| $75,000 to $99,999 | 12 | 3.5% |
| $100,000 to $149,999 | 115 | 33.6% |
| $150,000 to $199,999 | 0 | 0.0% |
| $200,000+ | 0 | 0.0% |
Household Income by Householder Age in La Cueva
| Income Bracket | # Households | Median Income |
| 15 to 24 Years | 0 (0.0%) | $0 |
| 25 to 44 Years | 61 (17.8%) | $0 |
| 45 to 64 Years | 165 (48.2%) | $0 |
| 65+ Years | 116 (33.9%) | $0 |
| Total | 342 (100.0%) | $53,462 |
Poverty in La Cueva
Income Below Poverty by Sex and Age in La Cueva
With 8.9% poverty level for males and 30.1% for females among the residents of La Cueva, 75 year old and over males and 55 to 64 year old females are the most vulnerable to poverty, with 24 males (100.0%) and 29 females (51.8%) in their respective age groups living below the poverty level.
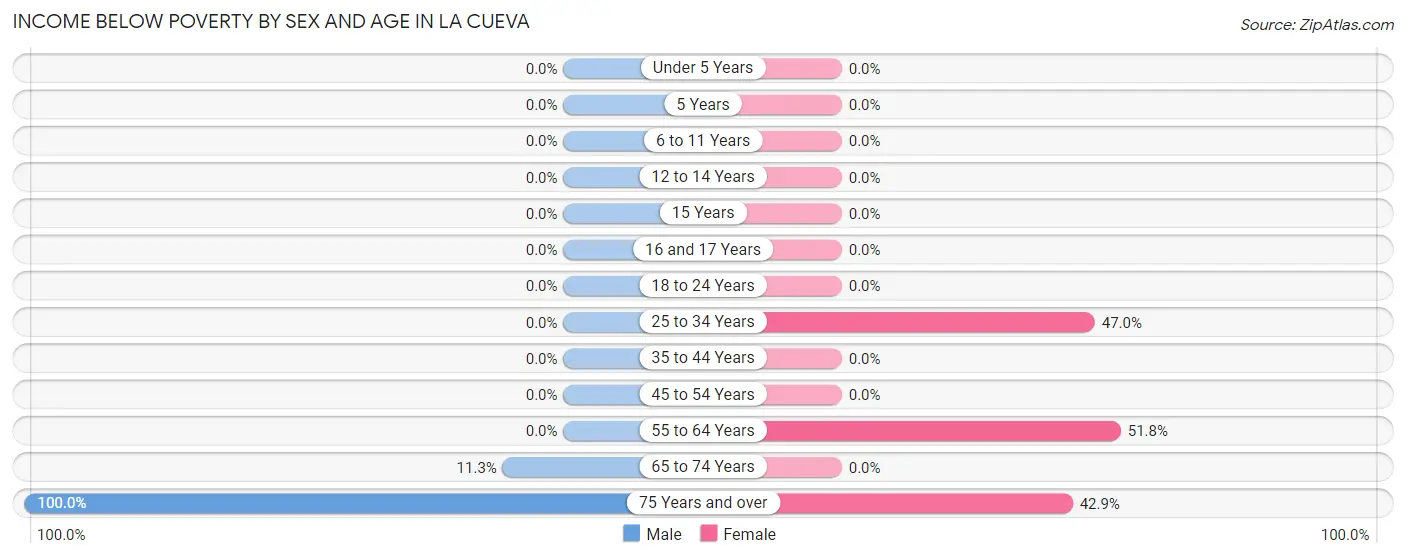
| Age Bracket | Male | Female |
| Under 5 Years | 0 (0.0%) | 0 (0.0%) |
| 5 Years | 0 (0.0%) | 0 (0.0%) |
| 6 to 11 Years | 0 (0.0%) | 0 (0.0%) |
| 12 to 14 Years | 0 (0.0%) | 0 (0.0%) |
| 15 Years | 0 (0.0%) | 0 (0.0%) |
| 16 and 17 Years | 0 (0.0%) | 0 (0.0%) |
| 18 to 24 Years | 0 (0.0%) | 0 (0.0%) |
| 25 to 34 Years | 0 (0.0%) | 54 (47.0%) |
| 35 to 44 Years | 0 (0.0%) | 0 (0.0%) |
| 45 to 54 Years | 0 (0.0%) | 0 (0.0%) |
| 55 to 64 Years | 0 (0.0%) | 29 (51.8%) |
| 65 to 74 Years | 8 (11.3%) | 0 (0.0%) |
| 75 Years and over | 24 (100.0%) | 18 (42.9%) |
| Total | 32 (8.9%) | 101 (30.1%) |
Income Above Poverty by Sex and Age in La Cueva
According to the poverty statistics in La Cueva, males aged 16 and 17 years and females aged 45 to 54 years are the age groups that are most secure financially, with 100.0% of males and 100.0% of females in these age groups living above the poverty line.
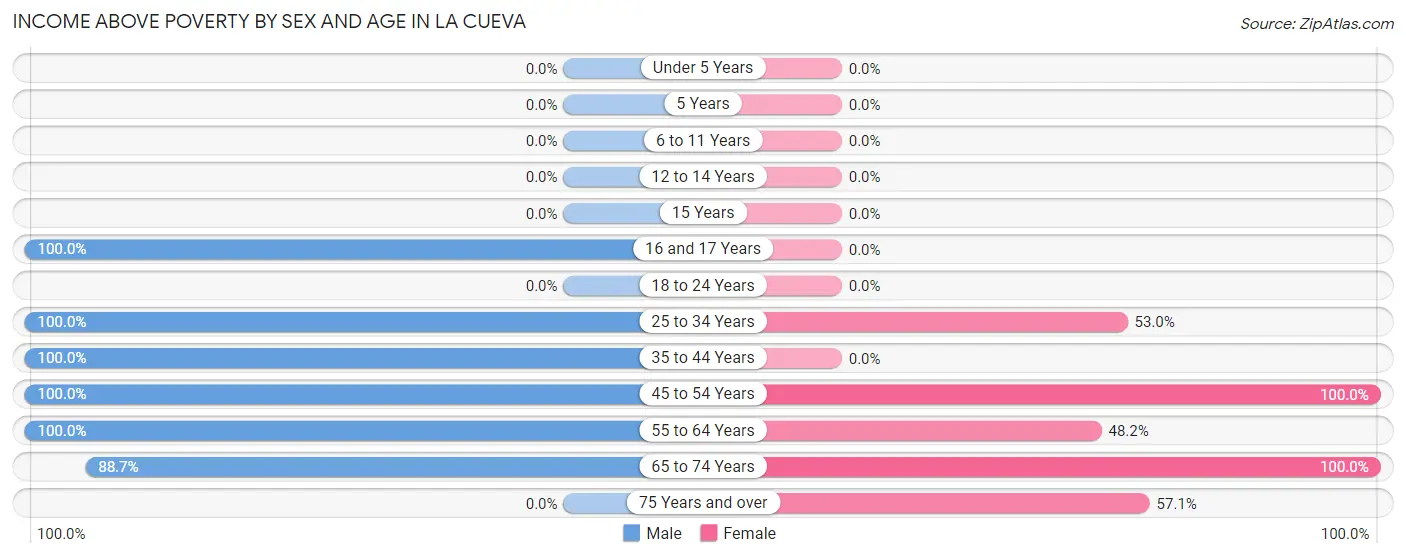
| Age Bracket | Male | Female |
| Under 5 Years | 0 (0.0%) | 0 (0.0%) |
| 5 Years | 0 (0.0%) | 0 (0.0%) |
| 6 to 11 Years | 0 (0.0%) | 0 (0.0%) |
| 12 to 14 Years | 0 (0.0%) | 0 (0.0%) |
| 15 Years | 0 (0.0%) | 0 (0.0%) |
| 16 and 17 Years | 48 (100.0%) | 0 (0.0%) |
| 18 to 24 Years | 0 (0.0%) | 0 (0.0%) |
| 25 to 34 Years | 50 (100.0%) | 61 (53.0%) |
| 35 to 44 Years | 56 (100.0%) | 0 (0.0%) |
| 45 to 54 Years | 54 (100.0%) | 84 (100.0%) |
| 55 to 64 Years | 56 (100.0%) | 27 (48.2%) |
| 65 to 74 Years | 63 (88.7%) | 38 (100.0%) |
| 75 Years and over | 0 (0.0%) | 24 (57.1%) |
| Total | 327 (91.1%) | 234 (69.9%) |
Income Below Poverty Among Married-Couple Families in La Cueva
The poverty statistics for married-couple families in La Cueva show that 12.1% or 18 of the total 149 families live below the poverty line. Families with no children have the highest poverty rate of 20.0%, comprising of 18 families. On the other hand, families with 1 or 2 children have the lowest poverty rate of 0.0%, which includes 0 families.
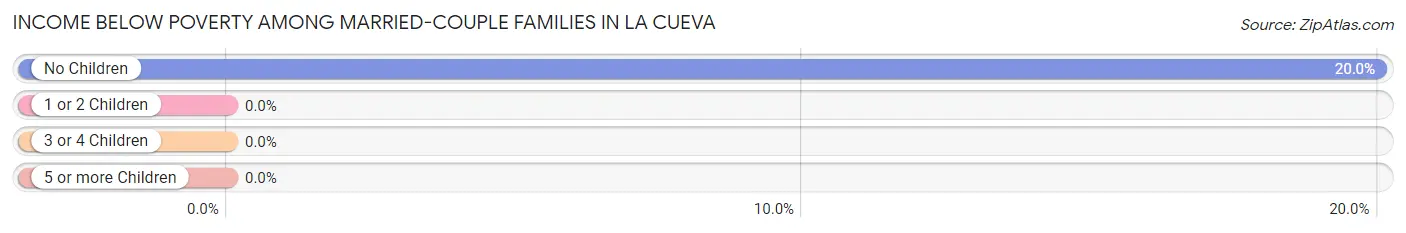
| Children | Above Poverty | Below Poverty |
| No Children | 72 (80.0%) | 18 (20.0%) |
| 1 or 2 Children | 59 (100.0%) | 0 (0.0%) |
| 3 or 4 Children | 0 (0.0%) | 0 (0.0%) |
| 5 or more Children | 0 (0.0%) | 0 (0.0%) |
| Total | 131 (87.9%) | 18 (12.1%) |
Income Below Poverty Among Single-Parent Households in La Cueva
| Children | Single Father | Single Mother |
| No Children | 0 (0.0%) | 0 (0.0%) |
| 1 or 2 Children | 0 (0.0%) | 0 (0.0%) |
| 3 or 4 Children | 0 (0.0%) | 0 (0.0%) |
| 5 or more Children | 0 (0.0%) | 0 (0.0%) |
| Total | 0 (0.0%) | 0 (0.0%) |
Income Below Poverty Among Married-Couple vs Single-Parent Households in La Cueva
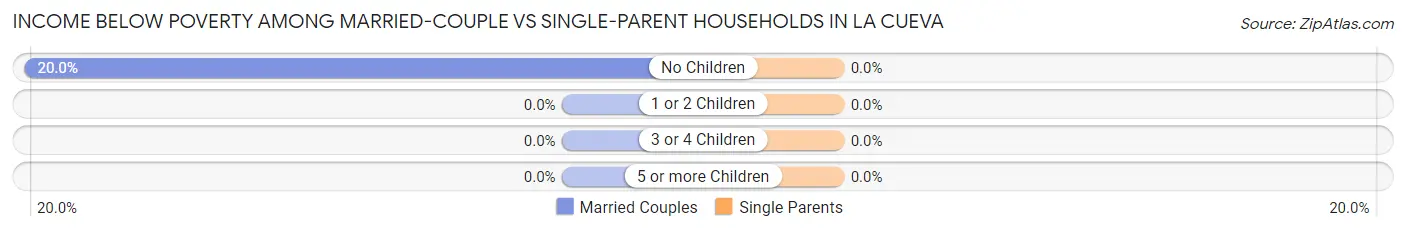
| Children | Married-Couple Families | Single-Parent Households |
| No Children | 18 (20.0%) | 0 (0.0%) |
| 1 or 2 Children | 0 (0.0%) | 0 (0.0%) |
| 3 or 4 Children | 0 (0.0%) | 0 (0.0%) |
| 5 or more Children | 0 (0.0%) | 0 (0.0%) |
| Total | 18 (12.1%) | 0 (0.0%) |
Race in La Cueva
The most populous races in La Cueva are White / Caucasian (396 | 57.1%), Hispanic or Latino (385 | 55.5%), and Two or more Races (278 | 40.1%).
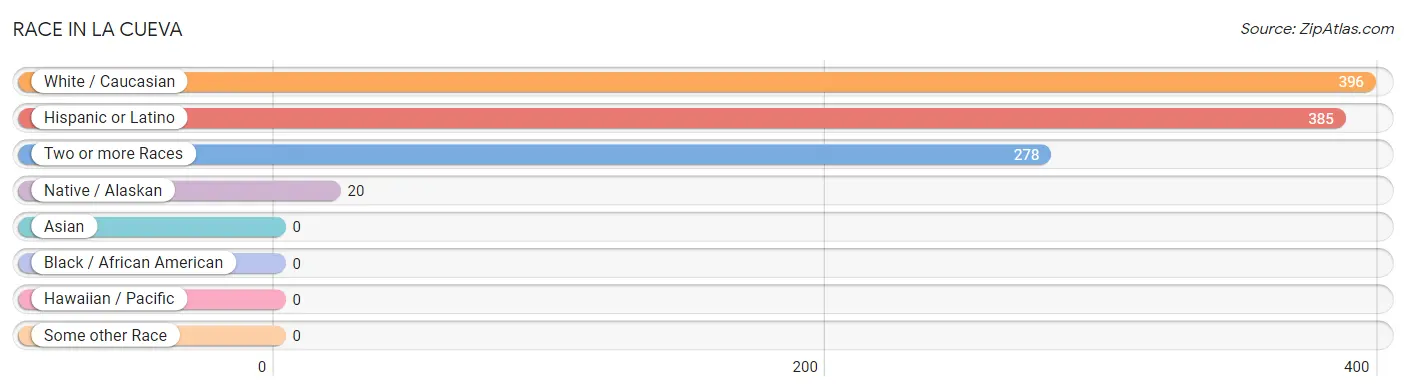
| Race | # Population | % Population |
| Asian | 0 | 0.0% |
| Black / African American | 0 | 0.0% |
| Hawaiian / Pacific | 0 | 0.0% |
| Hispanic or Latino | 385 | 55.5% |
| Native / Alaskan | 20 | 2.9% |
| White / Caucasian | 396 | 57.1% |
| Two or more Races | 278 | 40.1% |
| Some other Race | 0 | 0.0% |
| Total | 694 | 100.0% |
Ancestry in La Cueva
The most populous ancestries reported in La Cueva are Mexican (216 | 31.1%), English (78 | 11.2%), Irish (67 | 9.7%), Spanish (62 | 8.9%), and Dutch (46 | 6.6%), together accounting for 67.6% of all La Cueva residents.
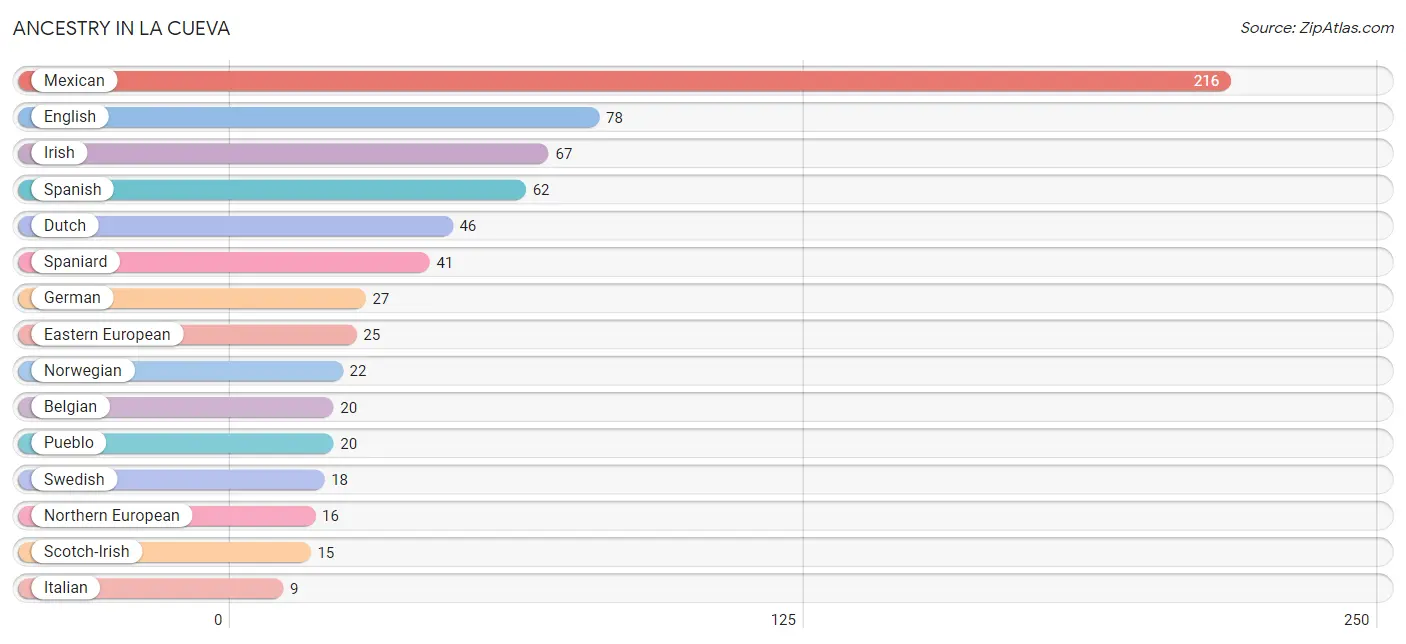
| Ancestry | # Population | % Population |
| Belgian | 20 | 2.9% |
| Dutch | 46 | 6.6% |
| Eastern European | 25 | 3.6% |
| English | 78 | 11.2% |
| German | 27 | 3.9% |
| Irish | 67 | 9.7% |
| Italian | 9 | 1.3% |
| Mexican | 216 | 31.1% |
| Northern European | 16 | 2.3% |
| Norwegian | 22 | 3.2% |
| Pueblo | 20 | 2.9% |
| Scotch-Irish | 15 | 2.2% |
| Spaniard | 41 | 5.9% |
| Spanish | 62 | 8.9% |
| Swedish | 18 | 2.6% | View All 15 Rows |
Immigrants in La Cueva

| Immigration Origin | # Population | % Population | View All 0 Rows |
Sex and Age in La Cueva
Sex and Age in La Cueva
The most populous age groups in La Cueva are 40 to 44 Years (56 | 15.6%) for men and 30 to 34 Years (61 | 18.2%) for women.
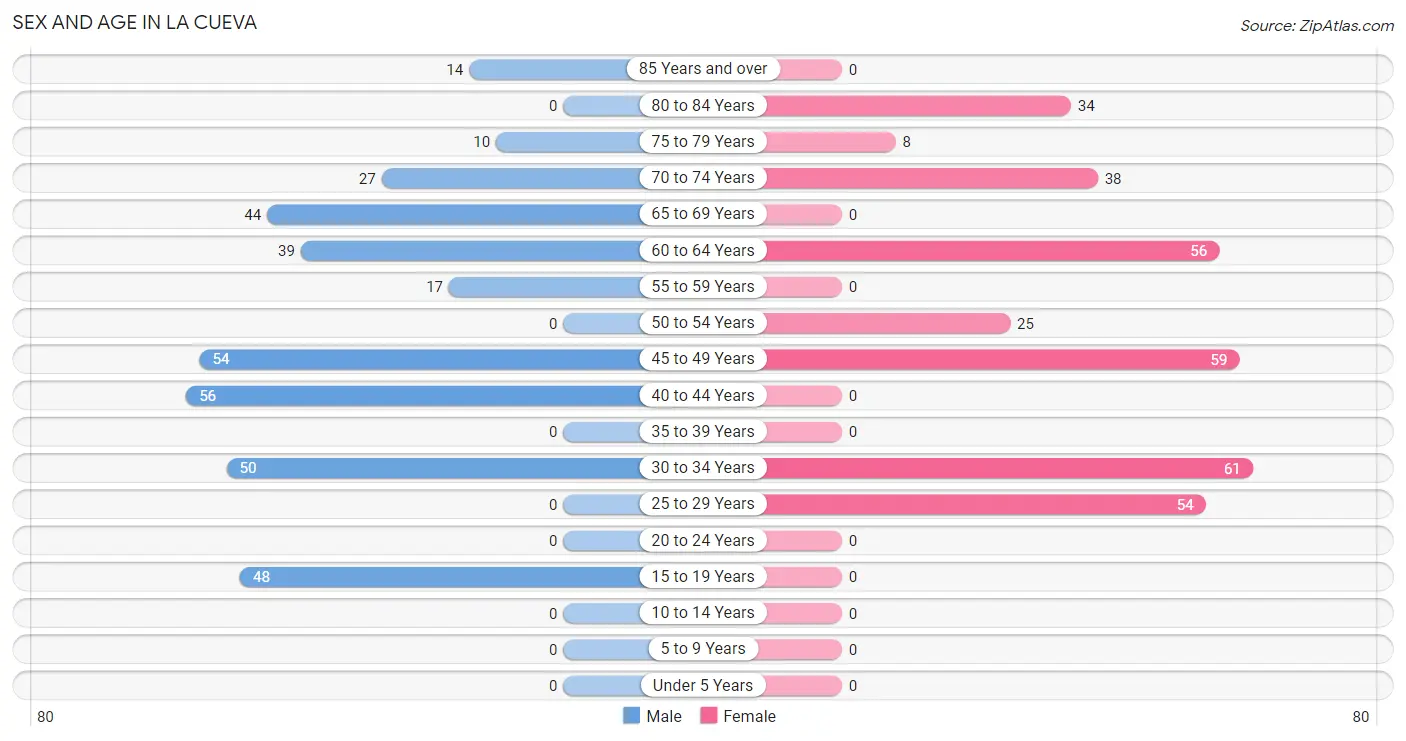
| Age Bracket | Male | Female |
| Under 5 Years | 0 (0.0%) | 0 (0.0%) |
| 5 to 9 Years | 0 (0.0%) | 0 (0.0%) |
| 10 to 14 Years | 0 (0.0%) | 0 (0.0%) |
| 15 to 19 Years | 48 (13.4%) | 0 (0.0%) |
| 20 to 24 Years | 0 (0.0%) | 0 (0.0%) |
| 25 to 29 Years | 0 (0.0%) | 54 (16.1%) |
| 30 to 34 Years | 50 (13.9%) | 61 (18.2%) |
| 35 to 39 Years | 0 (0.0%) | 0 (0.0%) |
| 40 to 44 Years | 56 (15.6%) | 0 (0.0%) |
| 45 to 49 Years | 54 (15.0%) | 59 (17.6%) |
| 50 to 54 Years | 0 (0.0%) | 25 (7.5%) |
| 55 to 59 Years | 17 (4.7%) | 0 (0.0%) |
| 60 to 64 Years | 39 (10.9%) | 56 (16.7%) |
| 65 to 69 Years | 44 (12.3%) | 0 (0.0%) |
| 70 to 74 Years | 27 (7.5%) | 38 (11.3%) |
| 75 to 79 Years | 10 (2.8%) | 8 (2.4%) |
| 80 to 84 Years | 0 (0.0%) | 34 (10.2%) |
| 85 Years and over | 14 (3.9%) | 0 (0.0%) |
| Total | 359 (100.0%) | 335 (100.0%) |
Families and Households in La Cueva
Median Family Size in La Cueva
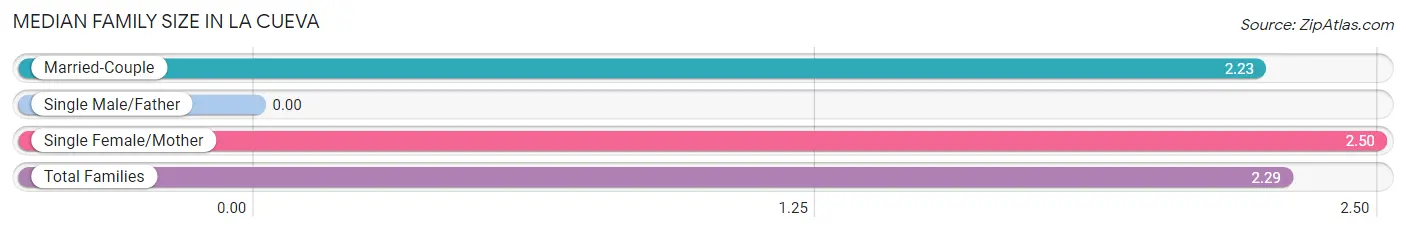
| Family Type | # Families | Family Size |
| Married-Couple | 149 (80.5%) | 2.23 |
| Single Male/Father | 0 (0.0%) | - |
| Single Female/Mother | 36 (19.5%) | 2.50 |
| Total Families | 185 (100.0%) | 2.29 |
Median Household Size in La Cueva
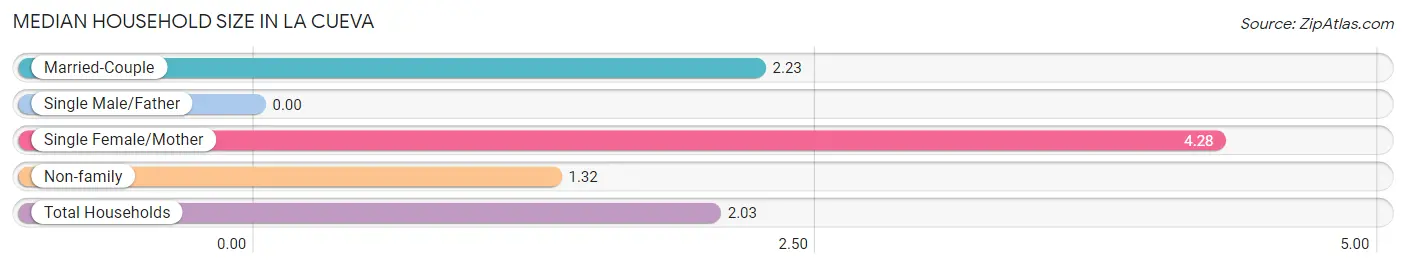
| Household Type | # Households | Household Size |
| Married-Couple | 149 (43.6%) | 2.23 |
| Single Male/Father | 0 (0.0%) | - |
| Single Female/Mother | 36 (10.5%) | 4.28 |
| Non-family | 157 (45.9%) | 1.32 |
| Total Households | 342 (100.0%) | 2.03 |
Household Size by Marriage Status in La Cueva
Out of a total of 342 households in La Cueva, 185 (54.1%) are family households, while 157 (45.9%) are nonfamily households. The most numerous type of family households are 3-person households, comprising 95, and the most common type of nonfamily households are 1-person households, comprising 119.
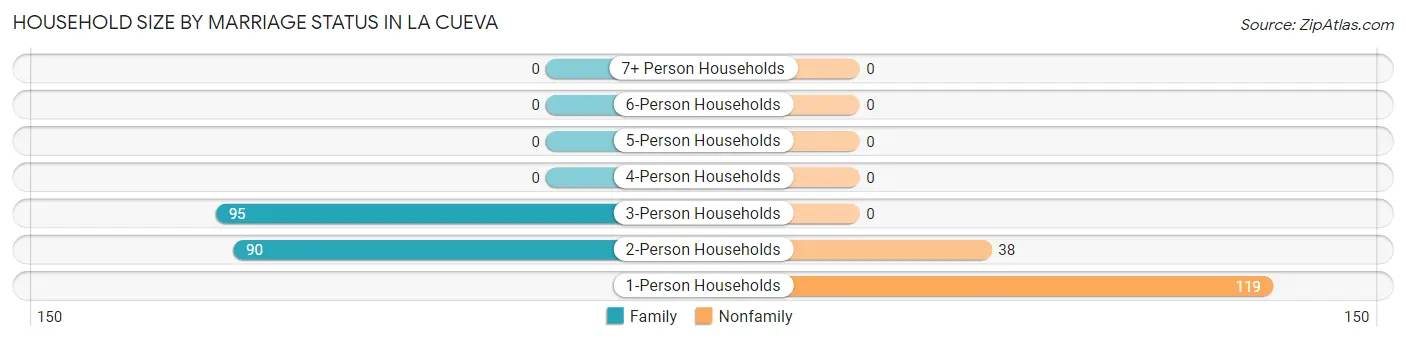
| Household Size | Family Households | Nonfamily Households |
| 1-Person Households | - | 119 (34.8%) |
| 2-Person Households | 90 (26.3%) | 38 (11.1%) |
| 3-Person Households | 95 (27.8%) | 0 (0.0%) |
| 4-Person Households | 0 (0.0%) | 0 (0.0%) |
| 5-Person Households | 0 (0.0%) | 0 (0.0%) |
| 6-Person Households | 0 (0.0%) | 0 (0.0%) |
| 7+ Person Households | 0 (0.0%) | 0 (0.0%) |
| Total | 185 (54.1%) | 157 (45.9%) |
Female Fertility in La Cueva
Fertility by Age in La Cueva
| Age Bracket | Women with Births | Births / 1,000 Women |
| 15 to 19 years | 0 (0.0%) | 0.0 |
| 20 to 34 years | 0 (0.0%) | 0.0 |
| 35 to 50 years | 0 (0.0%) | 0.0 |
| Total | 0 (0.0%) | 0.0 |
Fertility by Age by Marriage Status in La Cueva
| Age Bracket | Married | Unmarried |
| 15 to 19 years | 0 (0.0%) | 0 (0.0%) |
| 20 to 34 years | 0 (0.0%) | 0 (0.0%) |
| 35 to 50 years | 0 (0.0%) | 0 (0.0%) |
| Total | 0 (0.0%) | 0 (0.0%) |
Fertility by Education in La Cueva
| Educational Attainment | Women with Births | Births / 1,000 Women |
| Less than High School | 0 (0.0%) | 0.0 |
| High School Diploma | 0 (0.0%) | 0.0 |
| College or Associate's Degree | 0 (0.0%) | 0.0 |
| Bachelor's Degree | 0 (0.0%) | 0.0 |
| Graduate Degree | 0 (0.0%) | 0.0 |
| Total | 0 (0.0%) | 0.0 |
Fertility by Education by Marriage Status in La Cueva
| Educational Attainment | Married | Unmarried |
| Less than High School | 0 (0.0%) | 0 (0.0%) |
| High School Diploma | 0 (0.0%) | 0 (0.0%) |
| College or Associate's Degree | 0 (0.0%) | 0 (0.0%) |
| Bachelor's Degree | 0 (0.0%) | 0 (0.0%) |
| Graduate Degree | 0 (0.0%) | 0 (0.0%) |
| Total | 0 (0.0%) | 0 (0.0%) |
Employment Characteristics in La Cueva
Employment by Class of Employer in La Cueva
Among the 481 employed individuals in La Cueva, private company employees (173 | 36.0%), self-employed (incorporated) (147 | 30.6%), and self-employed (not incorporated) (56 | 11.6%) make up the most common classes of employment.
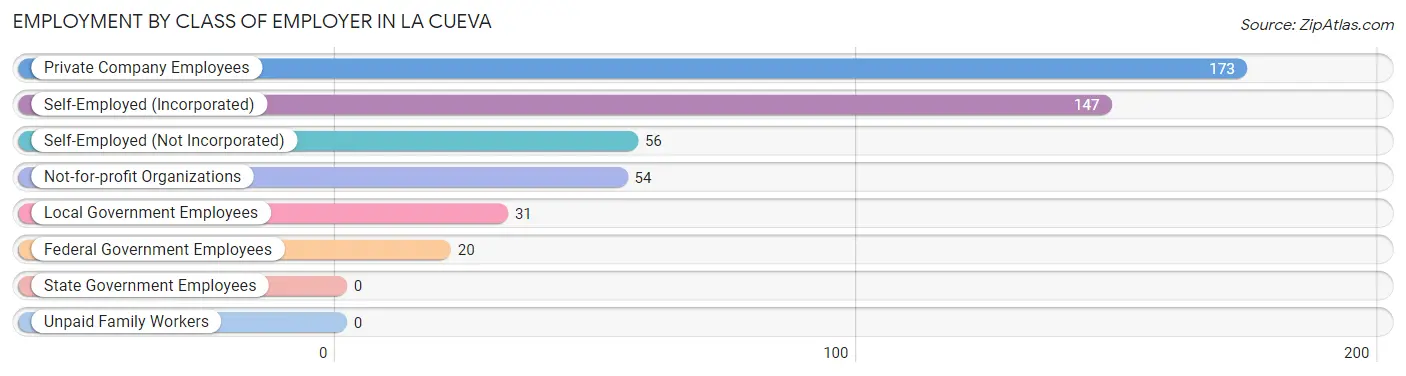
| Employer Class | # Employees | % Employees |
| Private Company Employees | 173 | 36.0% |
| Self-Employed (Incorporated) | 147 | 30.6% |
| Self-Employed (Not Incorporated) | 56 | 11.6% |
| Not-for-profit Organizations | 54 | 11.2% |
| Local Government Employees | 31 | 6.4% |
| State Government Employees | 0 | 0.0% |
| Federal Government Employees | 20 | 4.2% |
| Unpaid Family Workers | 0 | 0.0% |
| Total | 481 | 100.0% |
Employment Status by Age in La Cueva
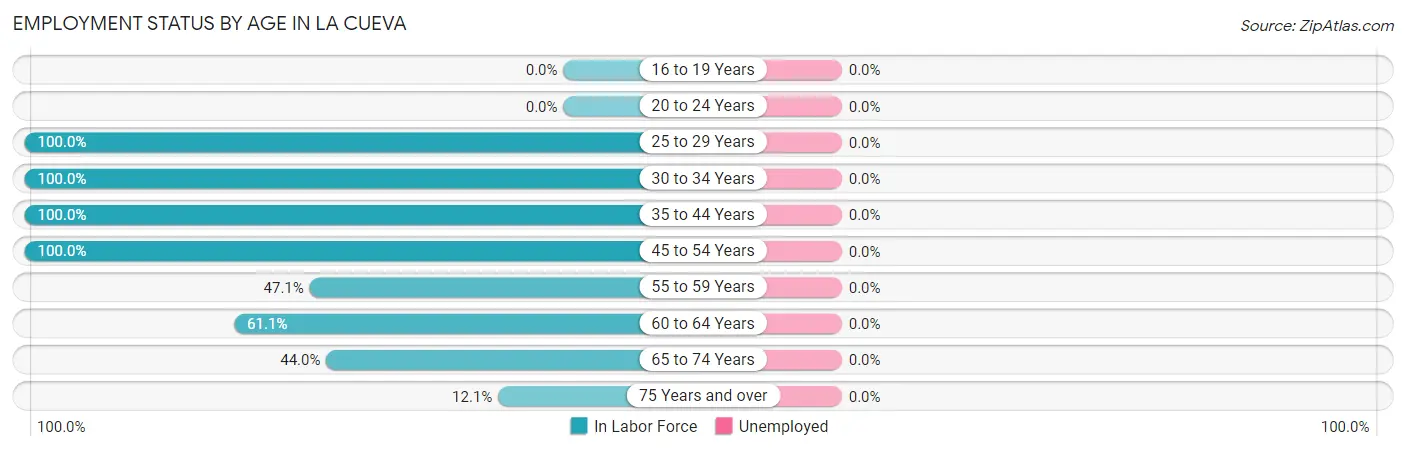
| Age Bracket | In Labor Force | Unemployed |
| 16 to 19 Years | 0 (0.0%) | 0 (0.0%) |
| 20 to 24 Years | 0 (0.0%) | 0 (0.0%) |
| 25 to 29 Years | 54 (100.0%) | 0 (0.0%) |
| 30 to 34 Years | 111 (100.0%) | 0 (0.0%) |
| 35 to 44 Years | 56 (100.0%) | 0 (0.0%) |
| 45 to 54 Years | 138 (100.0%) | 0 (0.0%) |
| 55 to 59 Years | 8 (47.1%) | 0 (0.0%) |
| 60 to 64 Years | 58 (61.1%) | 0 (0.0%) |
| 65 to 74 Years | 48 (44.0%) | 0 (0.0%) |
| 75 Years and over | 8 (12.1%) | 0 (0.0%) |
| Total | 481 (69.3%) | 0 (0.0%) |
Employment Status by Educational Attainment in La Cueva
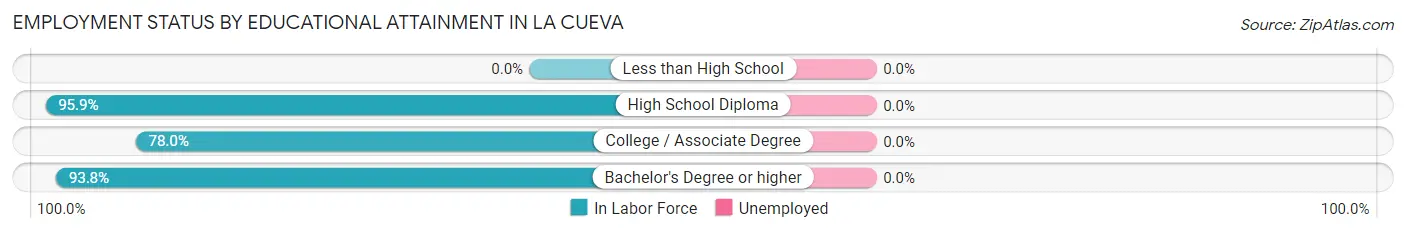
| Educational Attainment | In Labor Force | Unemployed |
| Less than High School | 0 (0.0%) | 0 (0.0%) |
| High School Diploma | 187 (95.9%) | 0 (0.0%) |
| College / Associate Degree | 103 (78.0%) | 0 (0.0%) |
| Bachelor's Degree or higher | 135 (93.8%) | 0 (0.0%) |
| Total | 425 (90.2%) | 0 (0.0%) |
Employment Occupations by Sex in La Cueva
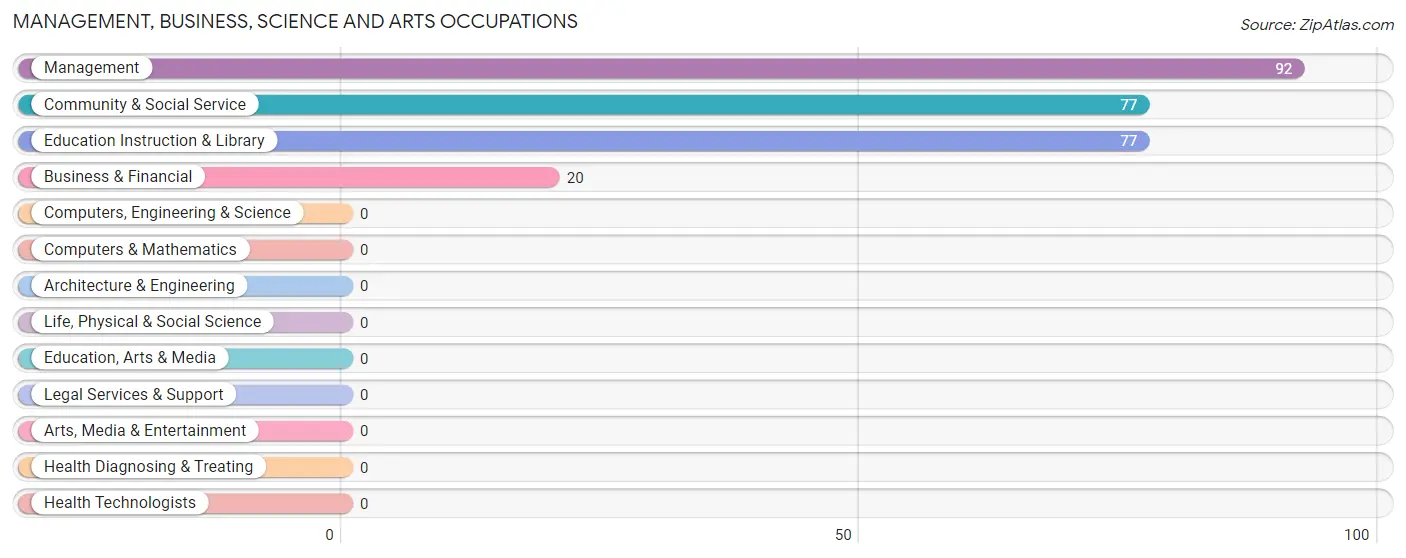
Management, Business, Science and Arts Occupations
The most common Management, Business, Science and Arts occupations in La Cueva are Management (92 | 19.1%), Community & Social Service (77 | 16.0%), Education Instruction & Library (77 | 16.0%), and Business & Financial (20 | 4.2%).
Management, Business, Science and Arts Occupations by Sex
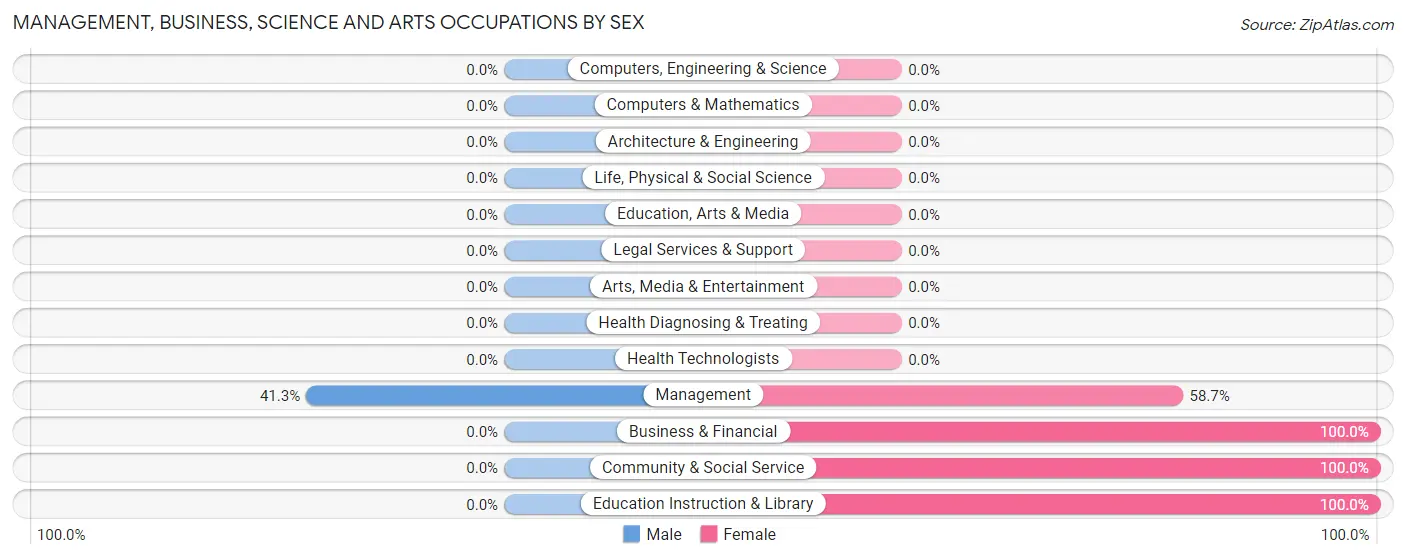
| Occupation | Male | Female |
| Management | 38 (41.3%) | 54 (58.7%) |
| Business & Financial | 0 (0.0%) | 20 (100.0%) |
| Computers, Engineering & Science | 0 (0.0%) | 0 (0.0%) |
| Computers & Mathematics | 0 (0.0%) | 0 (0.0%) |
| Architecture & Engineering | 0 (0.0%) | 0 (0.0%) |
| Life, Physical & Social Science | 0 (0.0%) | 0 (0.0%) |
| Community & Social Service | 0 (0.0%) | 77 (100.0%) |
| Education, Arts & Media | 0 (0.0%) | 0 (0.0%) |
| Legal Services & Support | 0 (0.0%) | 0 (0.0%) |
| Education Instruction & Library | 0 (0.0%) | 77 (100.0%) |
| Arts, Media & Entertainment | 0 (0.0%) | 0 (0.0%) |
| Health Diagnosing & Treating | 0 (0.0%) | 0 (0.0%) |
| Health Technologists | 0 (0.0%) | 0 (0.0%) |
| Total (Category) | 38 (20.1%) | 151 (79.9%) |
| Total (Overall) | 247 (51.3%) | 234 (48.6%) |
Services Occupations
The most common Services occupations in La Cueva are Security & Protection (31 | 6.4%), and Law Enforcement (31 | 6.4%).
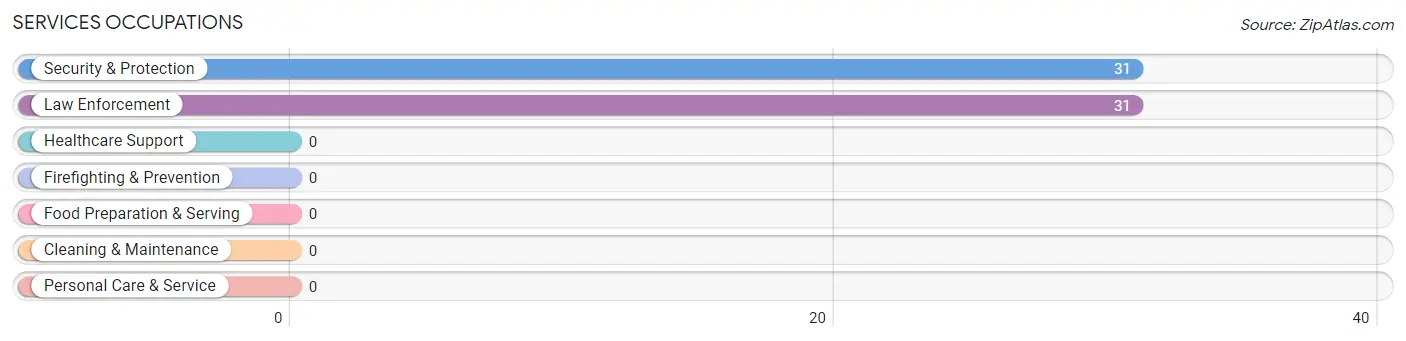
Services Occupations by Sex
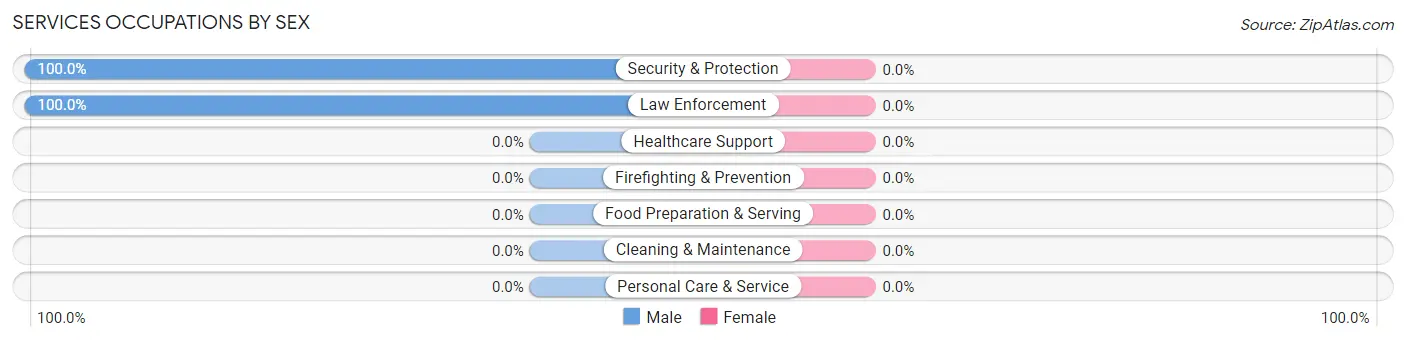
| Occupation | Male | Female |
| Healthcare Support | 0 (0.0%) | 0 (0.0%) |
| Security & Protection | 31 (100.0%) | 0 (0.0%) |
| Firefighting & Prevention | 0 (0.0%) | 0 (0.0%) |
| Law Enforcement | 31 (100.0%) | 0 (0.0%) |
| Food Preparation & Serving | 0 (0.0%) | 0 (0.0%) |
| Cleaning & Maintenance | 0 (0.0%) | 0 (0.0%) |
| Personal Care & Service | 0 (0.0%) | 0 (0.0%) |
| Total (Category) | 31 (100.0%) | 0 (0.0%) |
| Total (Overall) | 247 (51.3%) | 234 (48.6%) |
Sales and Office Occupations
The most common Sales and Office occupations in La Cueva are Sales & Related (108 | 22.5%), and Office & Administration (20 | 4.2%).

Sales and Office Occupations by Sex
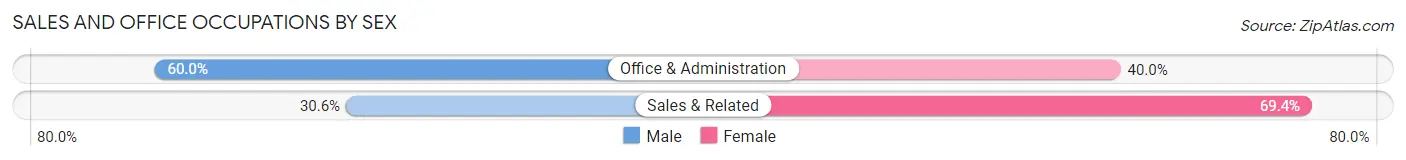
| Occupation | Male | Female |
| Sales & Related | 33 (30.6%) | 75 (69.4%) |
| Office & Administration | 12 (60.0%) | 8 (40.0%) |
| Total (Category) | 45 (35.2%) | 83 (64.8%) |
| Total (Overall) | 247 (51.3%) | 234 (48.6%) |
Natural Resources, Construction and Maintenance Occupations
The most common Natural Resources, Construction and Maintenance occupations in La Cueva are , and Construction & Extraction (80 | 16.6%).
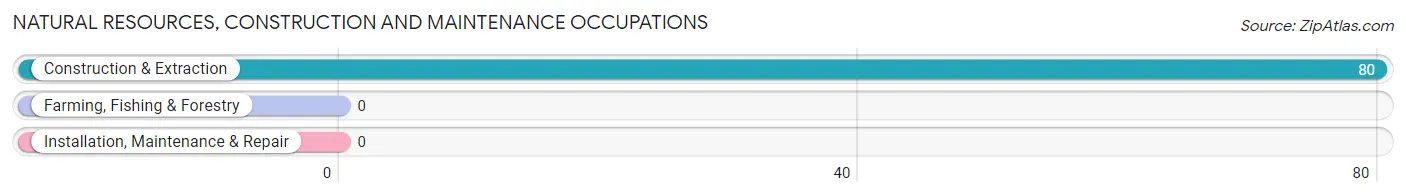
Natural Resources, Construction and Maintenance Occupations by Sex
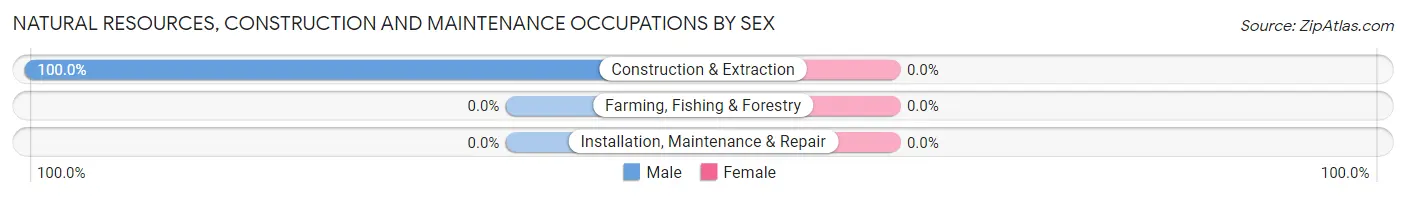
| Occupation | Male | Female |
| Farming, Fishing & Forestry | 0 (0.0%) | 0 (0.0%) |
| Construction & Extraction | 80 (100.0%) | 0 (0.0%) |
| Installation, Maintenance & Repair | 0 (0.0%) | 0 (0.0%) |
| Total (Category) | 80 (100.0%) | 0 (0.0%) |
| Total (Overall) | 247 (51.3%) | 234 (48.6%) |
Production, Transportation and Moving Occupations
The most common Production, Transportation and Moving occupations in La Cueva are Material Moving (42 | 8.7%), and Production (11 | 2.3%).
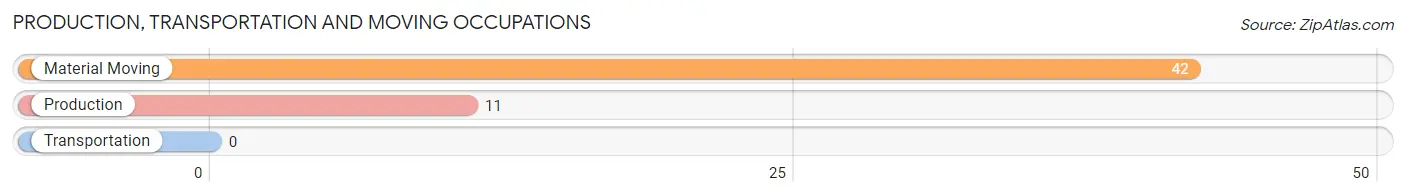
Production, Transportation and Moving Occupations by Sex
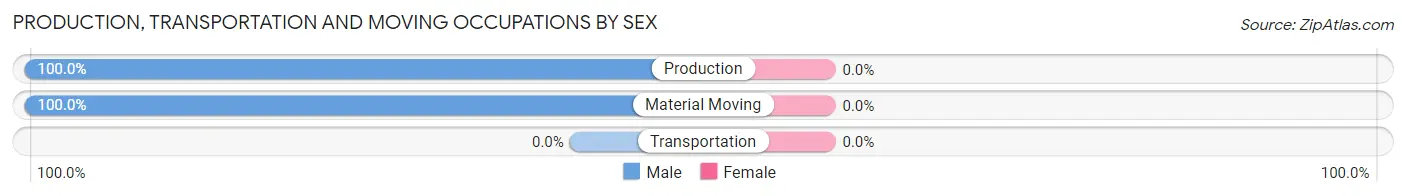
| Occupation | Male | Female |
| Production | 11 (100.0%) | 0 (0.0%) |
| Transportation | 0 (0.0%) | 0 (0.0%) |
| Material Moving | 42 (100.0%) | 0 (0.0%) |
| Total (Category) | 53 (100.0%) | 0 (0.0%) |
| Total (Overall) | 247 (51.3%) | 234 (48.6%) |
Employment Industries by Sex in La Cueva
Employment Industries in La Cueva
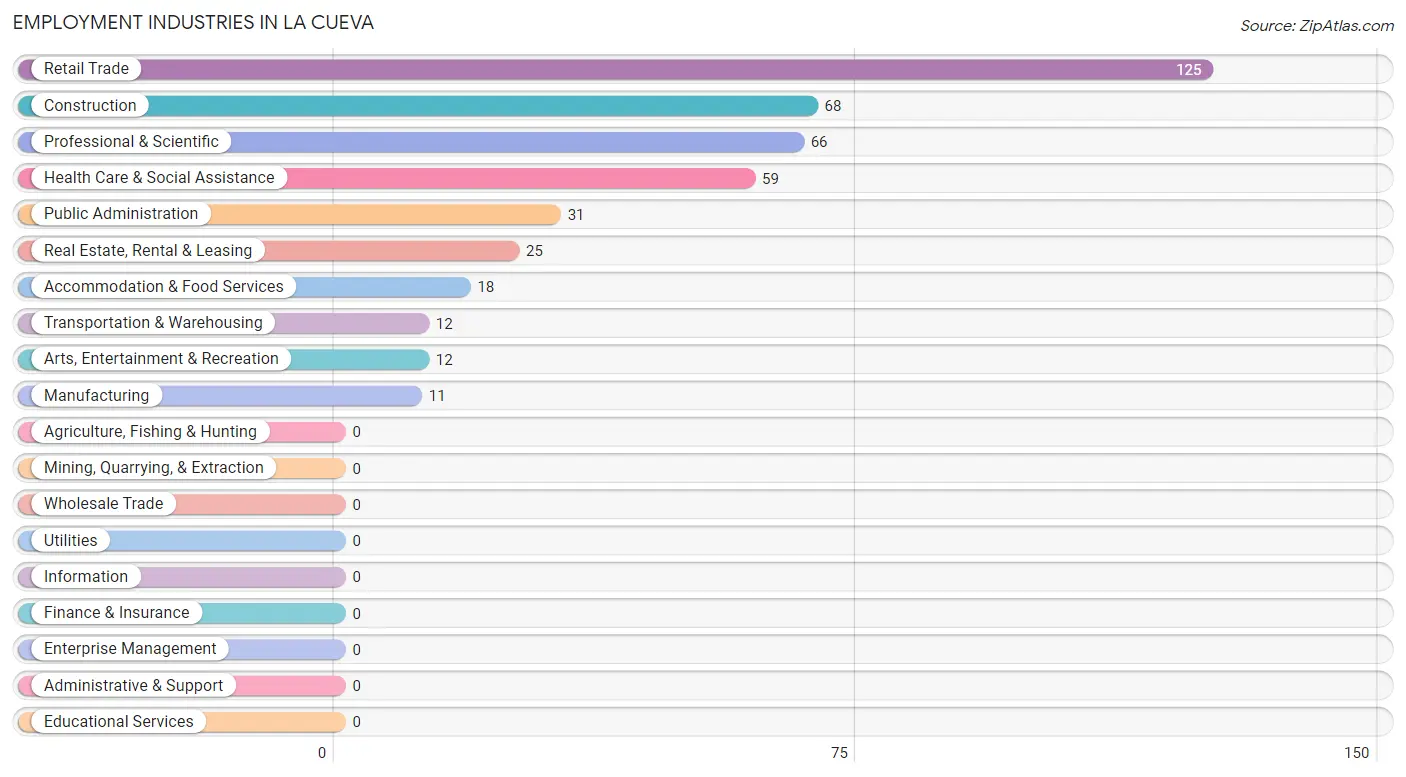
The major employment industries in La Cueva include Retail Trade (125 | 26.0%), Construction (68 | 14.1%), Professional & Scientific (66 | 13.7%), Health Care & Social Assistance (59 | 12.3%), and Public Administration (31 | 6.4%).
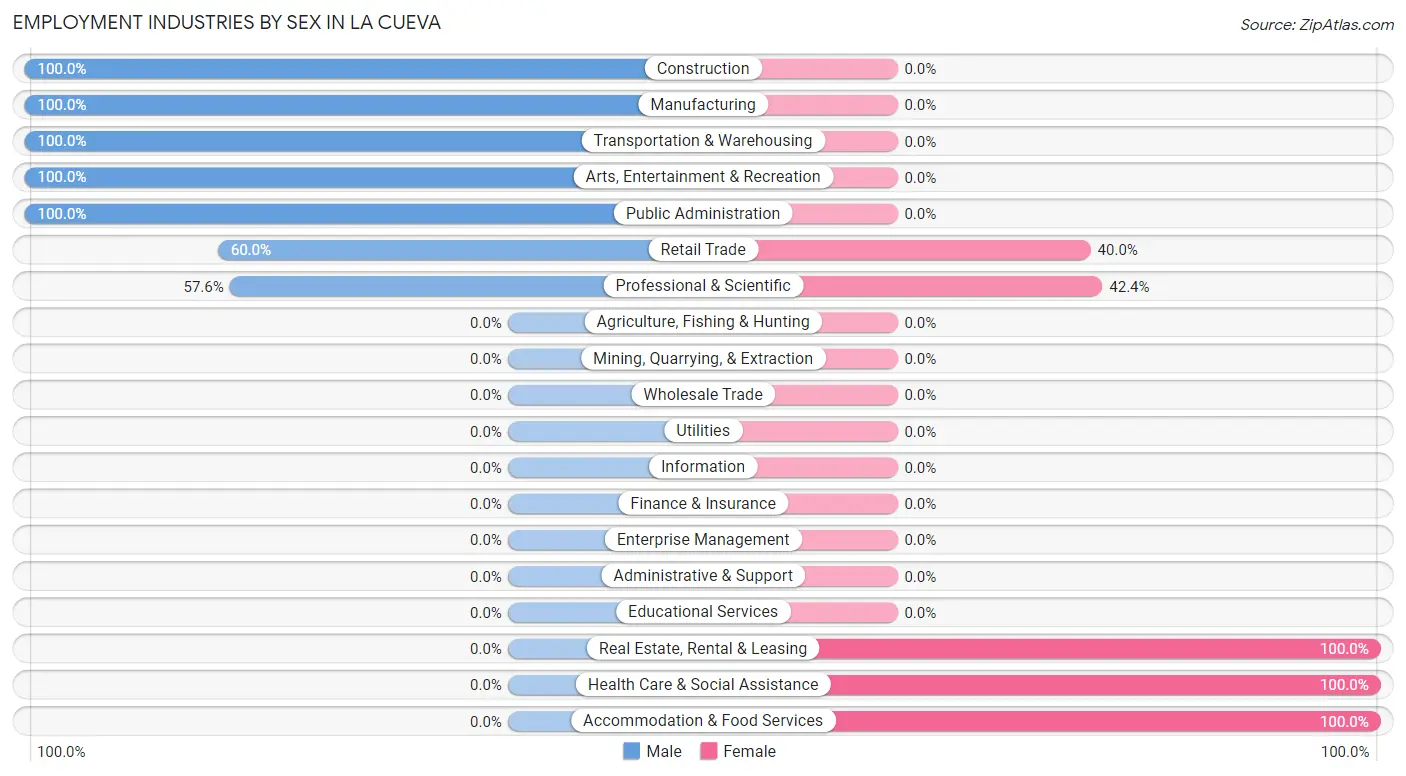
Employment Industries by Sex in La Cueva
The La Cueva industries that see more men than women are Construction (100.0%), Manufacturing (100.0%), and Transportation & Warehousing (100.0%), whereas the industries that tend to have a higher number of women are Real Estate, Rental & Leasing (100.0%), Health Care & Social Assistance (100.0%), and Accommodation & Food Services (100.0%).
| Industry | Male | Female |
| Agriculture, Fishing & Hunting | 0 (0.0%) | 0 (0.0%) |
| Mining, Quarrying, & Extraction | 0 (0.0%) | 0 (0.0%) |
| Construction | 68 (100.0%) | 0 (0.0%) |
| Manufacturing | 11 (100.0%) | 0 (0.0%) |
| Wholesale Trade | 0 (0.0%) | 0 (0.0%) |
| Retail Trade | 75 (60.0%) | 50 (40.0%) |
| Transportation & Warehousing | 12 (100.0%) | 0 (0.0%) |
| Utilities | 0 (0.0%) | 0 (0.0%) |
| Information | 0 (0.0%) | 0 (0.0%) |
| Finance & Insurance | 0 (0.0%) | 0 (0.0%) |
| Real Estate, Rental & Leasing | 0 (0.0%) | 25 (100.0%) |
| Professional & Scientific | 38 (57.6%) | 28 (42.4%) |
| Enterprise Management | 0 (0.0%) | 0 (0.0%) |
| Administrative & Support | 0 (0.0%) | 0 (0.0%) |
| Educational Services | 0 (0.0%) | 0 (0.0%) |
| Health Care & Social Assistance | 0 (0.0%) | 59 (100.0%) |
| Arts, Entertainment & Recreation | 12 (100.0%) | 0 (0.0%) |
| Accommodation & Food Services | 0 (0.0%) | 18 (100.0%) |
| Public Administration | 31 (100.0%) | 0 (0.0%) |
| Total | 247 (51.3%) | 234 (48.6%) |
Education in La Cueva
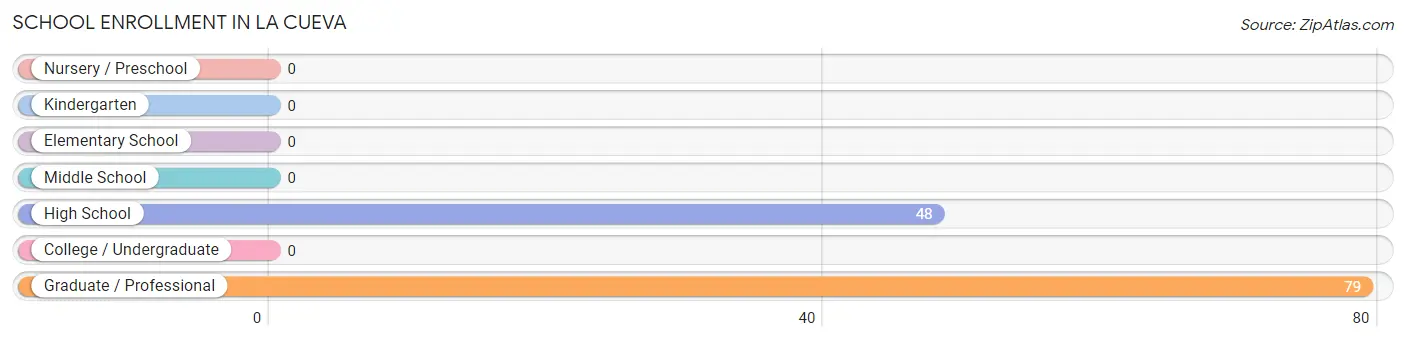
School Enrollment in La Cueva
The most common levels of schooling among the 127 students in La Cueva are graduate / professional (79 | 62.2%), and high school (48 | 37.8%).
| School Level | # Students | % Students |
| Nursery / Preschool | 0 | 0.0% |
| Kindergarten | 0 | 0.0% |
| Elementary School | 0 | 0.0% |
| Middle School | 0 | 0.0% |
| High School | 48 | 37.8% |
| College / Undergraduate | 0 | 0.0% |
| Graduate / Professional | 79 | 62.2% |
| Total | 127 | 100.0% |
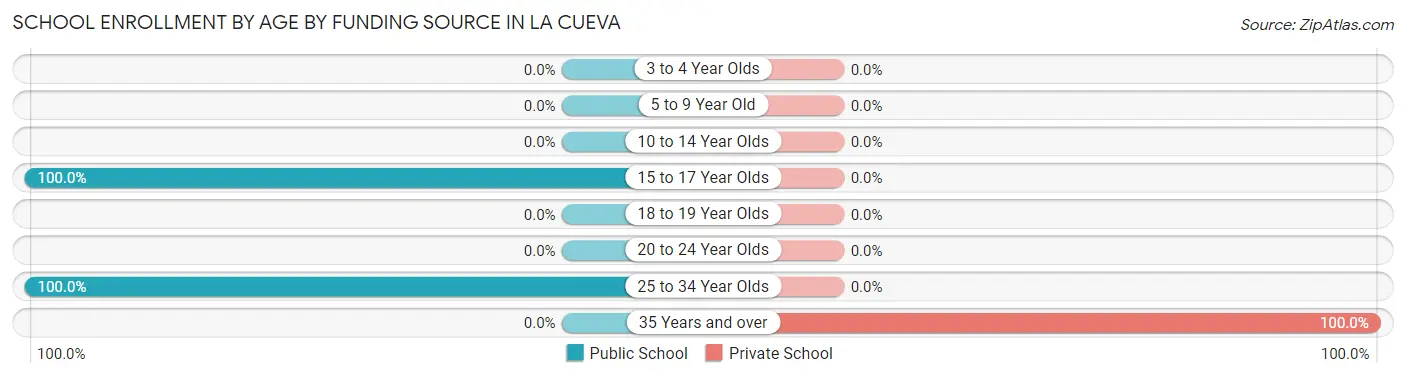
School Enrollment by Age by Funding Source in La Cueva
Out of a total of 127 students who are enrolled in schools in La Cueva, 59 (46.5%) attend a private institution, while the remaining 68 (53.5%) are enrolled in public schools. The age group of 35 years and over has the highest likelihood of being enrolled in private schools, with 59 (100.0% in the age bracket) enrolled. Conversely, the age group of 15 to 17 year olds has the lowest likelihood of being enrolled in a private school, with 48 (100.0% in the age bracket) attending a public institution.
| Age Bracket | Public School | Private School |
| 3 to 4 Year Olds | 0 (0.0%) | 0 (0.0%) |
| 5 to 9 Year Old | 0 (0.0%) | 0 (0.0%) |
| 10 to 14 Year Olds | 0 (0.0%) | 0 (0.0%) |
| 15 to 17 Year Olds | 48 (100.0%) | 0 (0.0%) |
| 18 to 19 Year Olds | 0 (0.0%) | 0 (0.0%) |
| 20 to 24 Year Olds | 0 (0.0%) | 0 (0.0%) |
| 25 to 34 Year Olds | 20 (100.0%) | 0 (0.0%) |
| 35 Years and over | 0 (0.0%) | 59 (100.0%) |
| Total | 68 (53.5%) | 59 (46.5%) |
Educational Attainment by Field of Study in La Cueva
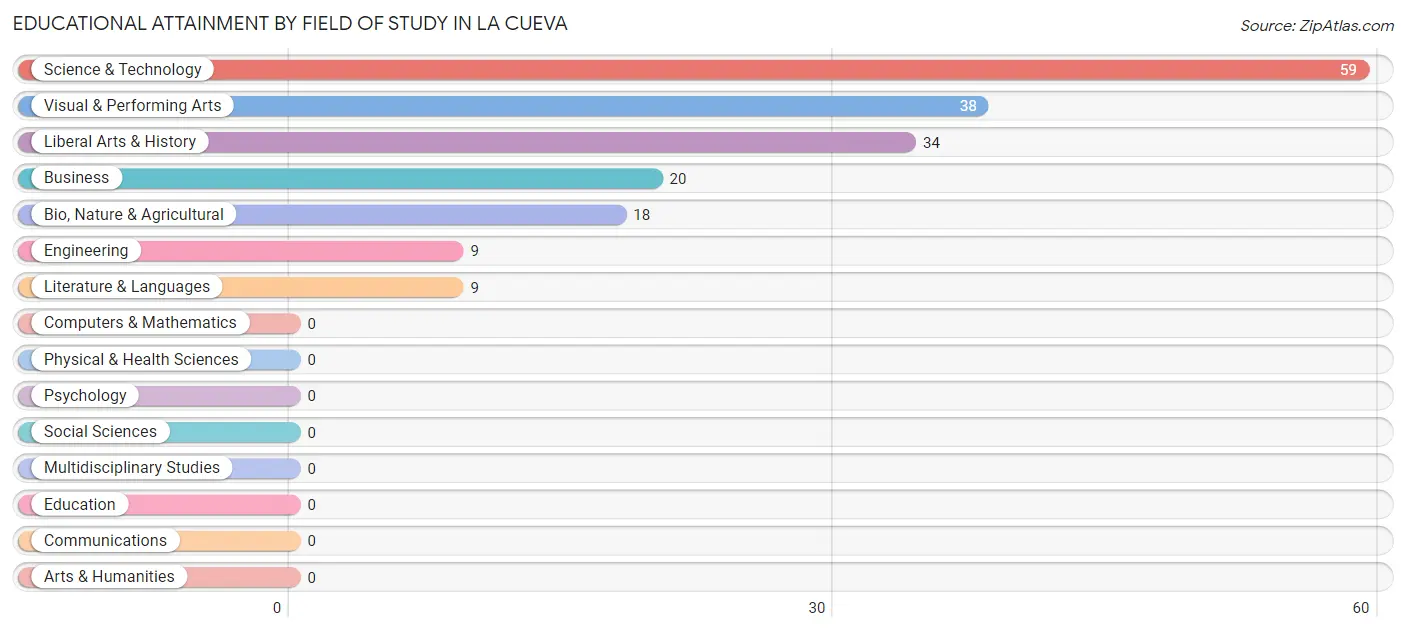
Science & technology (59 | 31.6%), visual & performing arts (38 | 20.3%), liberal arts & history (34 | 18.2%), business (20 | 10.7%), and bio, nature & agricultural (18 | 9.6%) are the most common fields of study among 187 individuals in La Cueva who have obtained a bachelor's degree or higher.
| Field of Study | # Graduates | % Graduates |
| Computers & Mathematics | 0 | 0.0% |
| Bio, Nature & Agricultural | 18 | 9.6% |
| Physical & Health Sciences | 0 | 0.0% |
| Psychology | 0 | 0.0% |
| Social Sciences | 0 | 0.0% |
| Engineering | 9 | 4.8% |
| Multidisciplinary Studies | 0 | 0.0% |
| Science & Technology | 59 | 31.6% |
| Business | 20 | 10.7% |
| Education | 0 | 0.0% |
| Literature & Languages | 9 | 4.8% |
| Liberal Arts & History | 34 | 18.2% |
| Visual & Performing Arts | 38 | 20.3% |
| Communications | 0 | 0.0% |
| Arts & Humanities | 0 | 0.0% |
| Total | 187 | 100.0% |
Transportation & Commute in La Cueva
Vehicle Availability by Sex in La Cueva
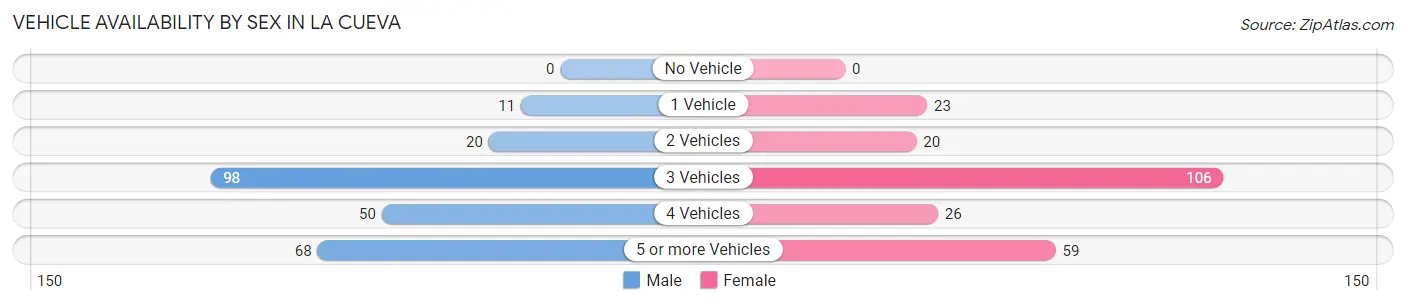
The most prevalent vehicle ownership categories in La Cueva are males with 3 vehicles (98, accounting for 39.7%) and females with 3 vehicles (106, making up 41.9%).
| Vehicles Available | Male | Female |
| No Vehicle | 0 (0.0%) | 0 (0.0%) |
| 1 Vehicle | 11 (4.4%) | 23 (9.8%) |
| 2 Vehicles | 20 (8.1%) | 20 (8.6%) |
| 3 Vehicles | 98 (39.7%) | 106 (45.3%) |
| 4 Vehicles | 50 (20.2%) | 26 (11.1%) |
| 5 or more Vehicles | 68 (27.5%) | 59 (25.2%) |
| Total | 247 (100.0%) | 234 (100.0%) |
Commute Time in La Cueva
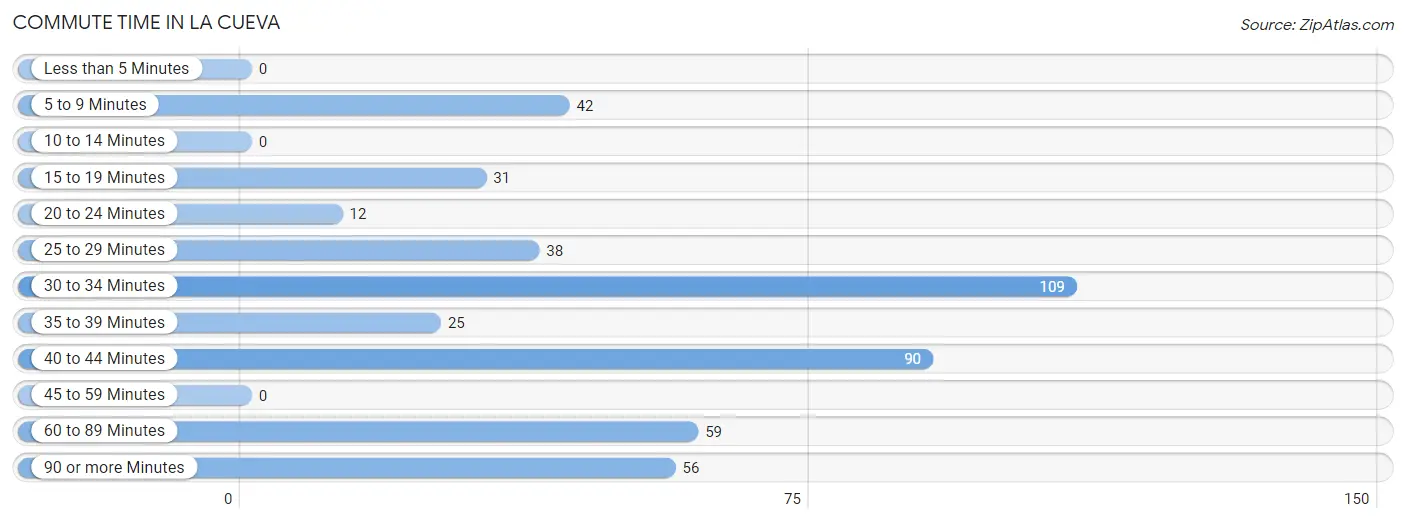
The most frequently occuring commute durations in La Cueva are 30 to 34 minutes (109 commuters, 23.6%), 40 to 44 minutes (90 commuters, 19.5%), and 60 to 89 minutes (59 commuters, 12.8%).
| Commute Time | # Commuters | % Commuters |
| Less than 5 Minutes | 0 | 0.0% |
| 5 to 9 Minutes | 42 | 9.1% |
| 10 to 14 Minutes | 0 | 0.0% |
| 15 to 19 Minutes | 31 | 6.7% |
| 20 to 24 Minutes | 12 | 2.6% |
| 25 to 29 Minutes | 38 | 8.2% |
| 30 to 34 Minutes | 109 | 23.6% |
| 35 to 39 Minutes | 25 | 5.4% |
| 40 to 44 Minutes | 90 | 19.5% |
| 45 to 59 Minutes | 0 | 0.0% |
| 60 to 89 Minutes | 59 | 12.8% |
| 90 or more Minutes | 56 | 12.1% |
Commute Time by Sex in La Cueva
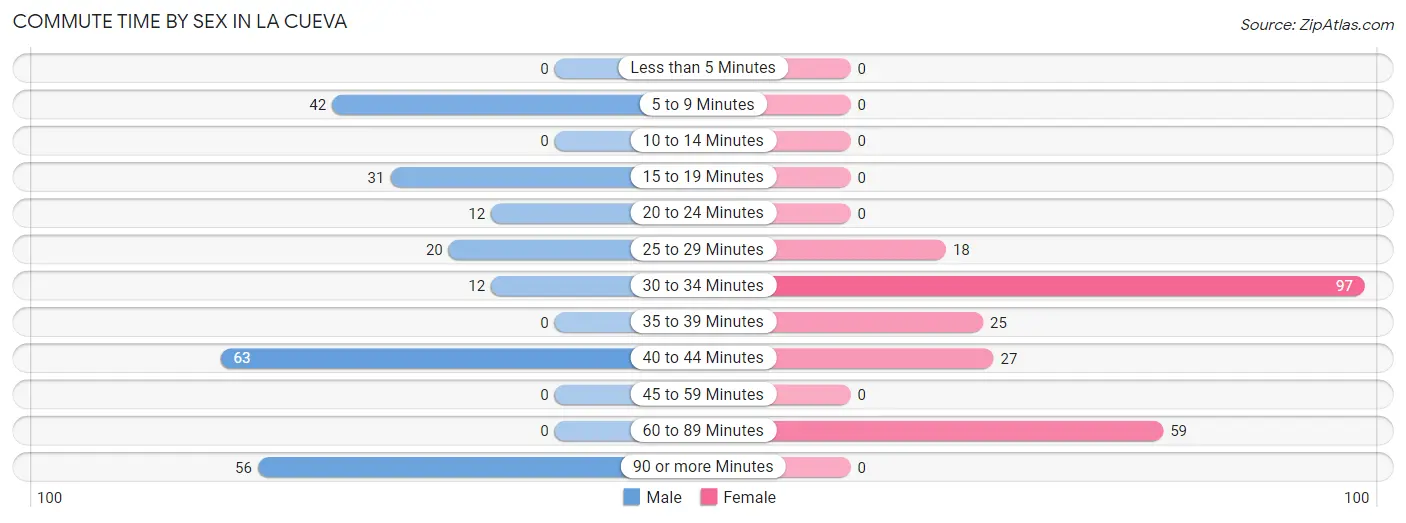
The most common commute times in La Cueva are 40 to 44 minutes (63 commuters, 26.7%) for males and 30 to 34 minutes (97 commuters, 42.9%) for females.
| Commute Time | Male | Female |
| Less than 5 Minutes | 0 (0.0%) | 0 (0.0%) |
| 5 to 9 Minutes | 42 (17.8%) | 0 (0.0%) |
| 10 to 14 Minutes | 0 (0.0%) | 0 (0.0%) |
| 15 to 19 Minutes | 31 (13.1%) | 0 (0.0%) |
| 20 to 24 Minutes | 12 (5.1%) | 0 (0.0%) |
| 25 to 29 Minutes | 20 (8.5%) | 18 (8.0%) |
| 30 to 34 Minutes | 12 (5.1%) | 97 (42.9%) |
| 35 to 39 Minutes | 0 (0.0%) | 25 (11.1%) |
| 40 to 44 Minutes | 63 (26.7%) | 27 (11.9%) |
| 45 to 59 Minutes | 0 (0.0%) | 0 (0.0%) |
| 60 to 89 Minutes | 0 (0.0%) | 59 (26.1%) |
| 90 or more Minutes | 56 (23.7%) | 0 (0.0%) |
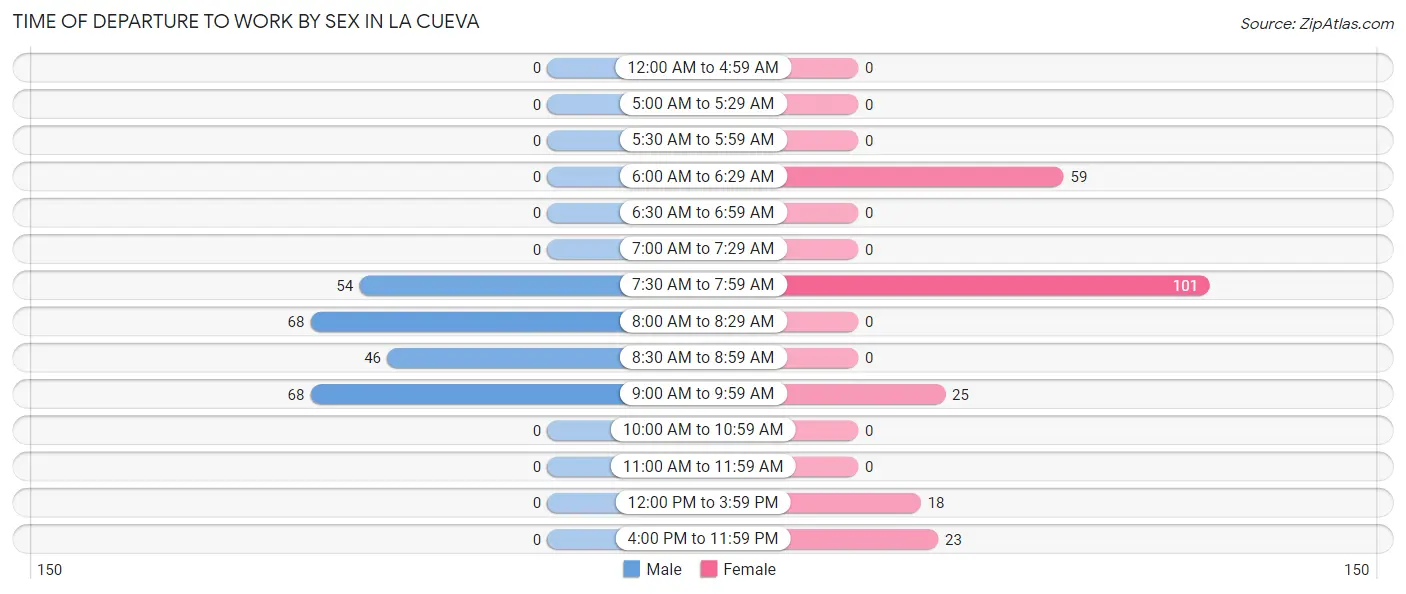
Time of Departure to Work by Sex in La Cueva
The most frequent times of departure to work in La Cueva are 8:00 AM to 8:29 AM (68, 28.8%) for males and 7:30 AM to 7:59 AM (101, 44.7%) for females.
| Time of Departure | Male | Female |
| 12:00 AM to 4:59 AM | 0 (0.0%) | 0 (0.0%) |
| 5:00 AM to 5:29 AM | 0 (0.0%) | 0 (0.0%) |
| 5:30 AM to 5:59 AM | 0 (0.0%) | 0 (0.0%) |
| 6:00 AM to 6:29 AM | 0 (0.0%) | 59 (26.1%) |
| 6:30 AM to 6:59 AM | 0 (0.0%) | 0 (0.0%) |
| 7:00 AM to 7:29 AM | 0 (0.0%) | 0 (0.0%) |
| 7:30 AM to 7:59 AM | 54 (22.9%) | 101 (44.7%) |
| 8:00 AM to 8:29 AM | 68 (28.8%) | 0 (0.0%) |
| 8:30 AM to 8:59 AM | 46 (19.5%) | 0 (0.0%) |
| 9:00 AM to 9:59 AM | 68 (28.8%) | 25 (11.1%) |
| 10:00 AM to 10:59 AM | 0 (0.0%) | 0 (0.0%) |
| 11:00 AM to 11:59 AM | 0 (0.0%) | 0 (0.0%) |
| 12:00 PM to 3:59 PM | 0 (0.0%) | 18 (8.0%) |
| 4:00 PM to 11:59 PM | 0 (0.0%) | 23 (10.2%) |
| Total | 236 (100.0%) | 226 (100.0%) |
Housing Occupancy in La Cueva
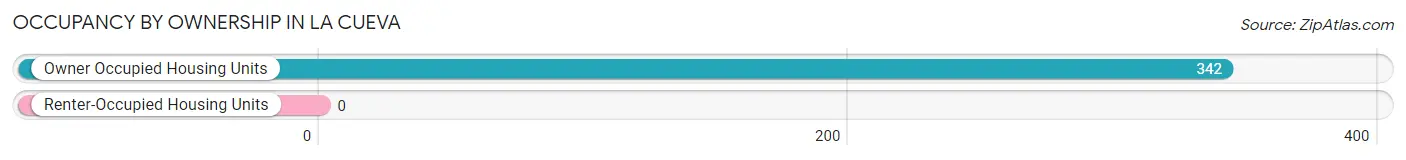
Occupancy by Ownership in La Cueva
Of the total 342 dwellings in La Cueva, owner-occupied units account for 342 (100.0%), while renter-occupied units make up 0 (0.0%).
| Occupancy | # Housing Units | % Housing Units |
| Owner Occupied Housing Units | 342 | 100.0% |
| Renter-Occupied Housing Units | 0 | 0.0% |
| Total Occupied Housing Units | 342 | 100.0% |
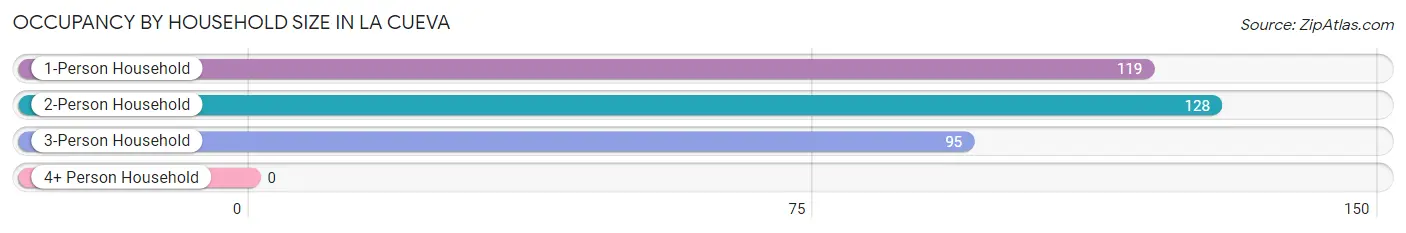
Occupancy by Household Size in La Cueva
| Household Size | # Housing Units | % Housing Units |
| 1-Person Household | 119 | 34.8% |
| 2-Person Household | 128 | 37.4% |
| 3-Person Household | 95 | 27.8% |
| 4+ Person Household | 0 | 0.0% |
| Total Housing Units | 342 | 100.0% |
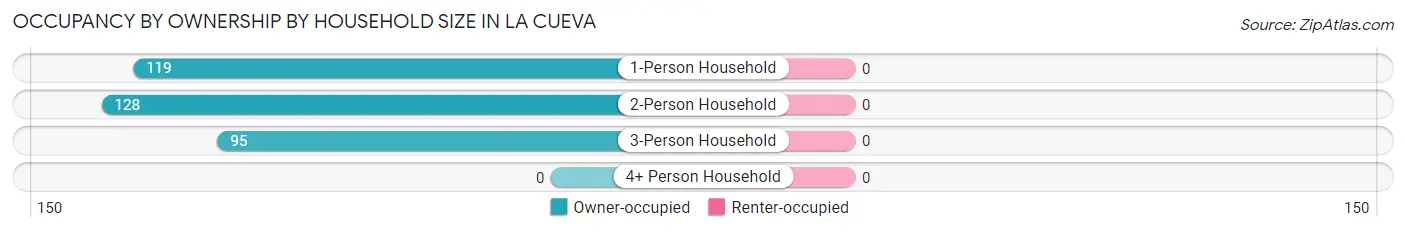
Occupancy by Ownership by Household Size in La Cueva
| Household Size | Owner-occupied | Renter-occupied |
| 1-Person Household | 119 (100.0%) | 0 (0.0%) |
| 2-Person Household | 128 (100.0%) | 0 (0.0%) |
| 3-Person Household | 95 (100.0%) | 0 (0.0%) |
| 4+ Person Household | 0 (0.0%) | 0 (0.0%) |
| Total Housing Units | 342 (100.0%) | 0 (0.0%) |
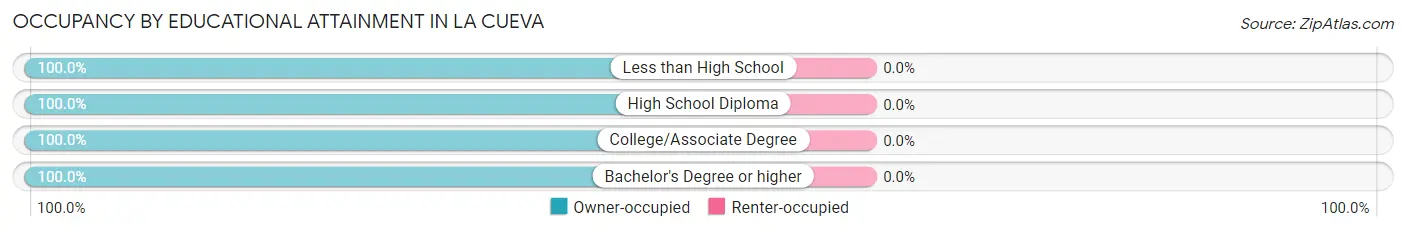
Occupancy by Educational Attainment in La Cueva
| Household Size | Owner-occupied | Renter-occupied |
| Less than High School | 18 (100.0%) | 0 (0.0%) |
| High School Diploma | 117 (100.0%) | 0 (0.0%) |
| College/Associate Degree | 76 (100.0%) | 0 (0.0%) |
| Bachelor's Degree or higher | 131 (100.0%) | 0 (0.0%) |
Occupancy by Age of Householder in La Cueva
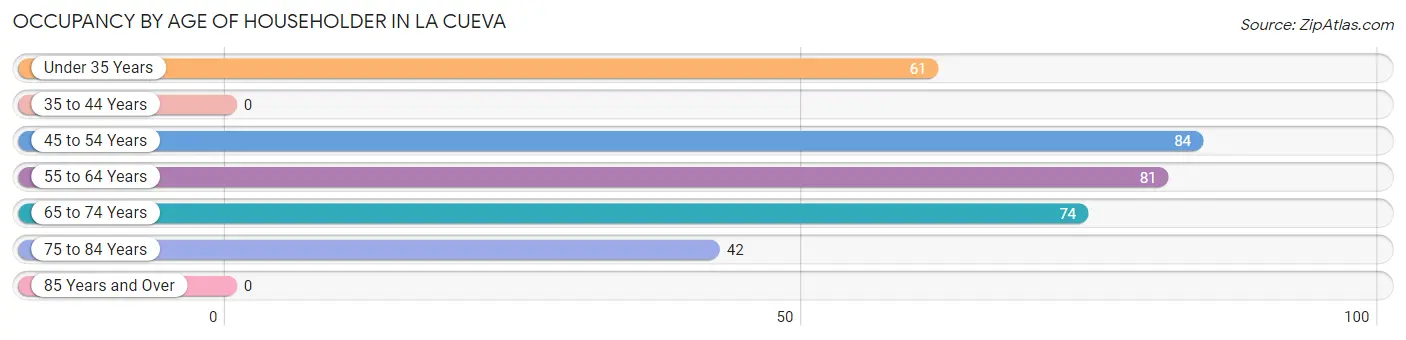
| Age Bracket | # Households | % Households |
| Under 35 Years | 61 | 17.8% |
| 35 to 44 Years | 0 | 0.0% |
| 45 to 54 Years | 84 | 24.6% |
| 55 to 64 Years | 81 | 23.7% |
| 65 to 74 Years | 74 | 21.6% |
| 75 to 84 Years | 42 | 12.3% |
| 85 Years and Over | 0 | 0.0% |
| Total | 342 | 100.0% |
Housing Finances in La Cueva
Median Income by Occupancy in La Cueva
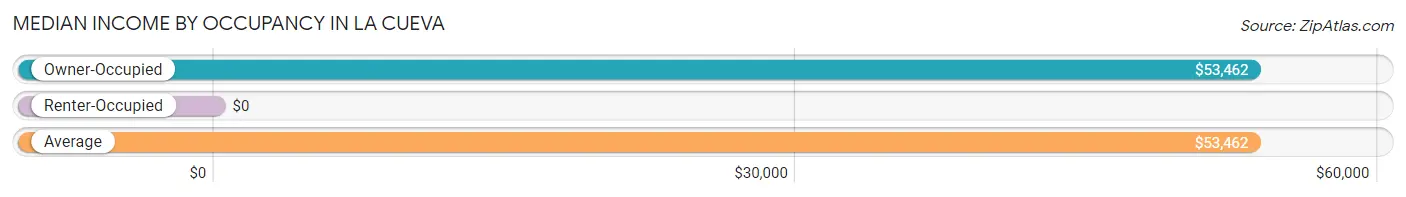
| Occupancy Type | # Households | Median Income |
| Owner-Occupied | 342 (100.0%) | $53,462 |
| Renter-Occupied | 0 (0.0%) | $0 |
| Average | 342 (100.0%) | $53,462 |
Occupancy by Householder Income Bracket in La Cueva
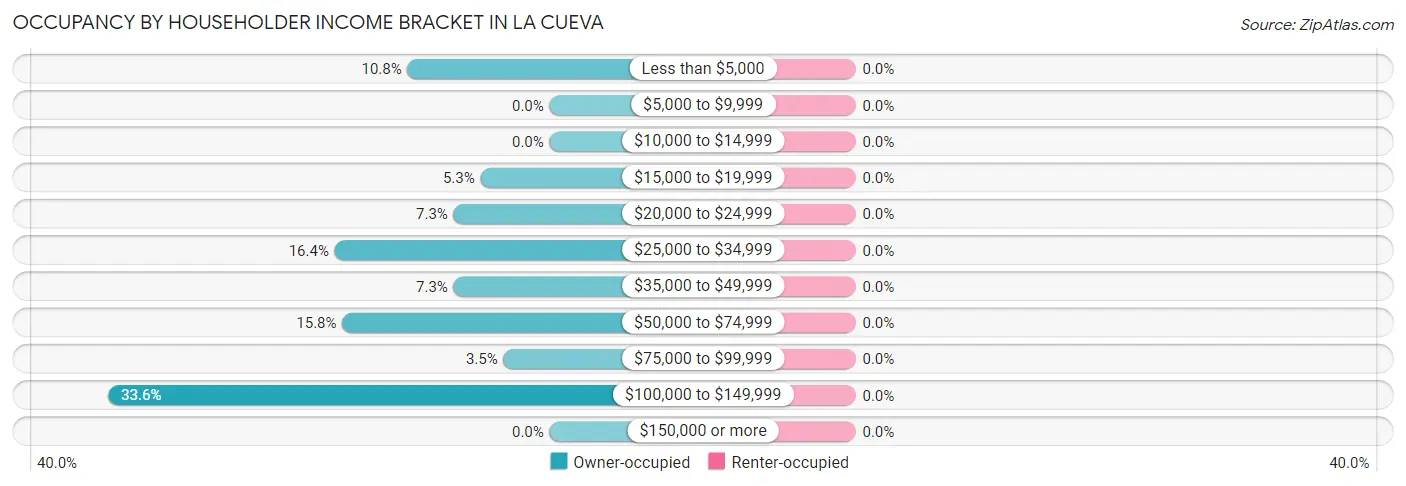
| Income Bracket | Owner-occupied | Renter-occupied |
| Less than $5,000 | 37 (10.8%) | 0 (0.0%) |
| $5,000 to $9,999 | 0 (0.0%) | 0 (0.0%) |
| $10,000 to $14,999 | 0 (0.0%) | 0 (0.0%) |
| $15,000 to $19,999 | 18 (5.3%) | 0 (0.0%) |
| $20,000 to $24,999 | 25 (7.3%) | 0 (0.0%) |
| $25,000 to $34,999 | 56 (16.4%) | 0 (0.0%) |
| $35,000 to $49,999 | 25 (7.3%) | 0 (0.0%) |
| $50,000 to $74,999 | 54 (15.8%) | 0 (0.0%) |
| $75,000 to $99,999 | 12 (3.5%) | 0 (0.0%) |
| $100,000 to $149,999 | 115 (33.6%) | 0 (0.0%) |
| $150,000 or more | 0 (0.0%) | 0 (0.0%) |
| Total | 342 (100.0%) | 0 (0.0%) |
Monthly Housing Cost Tiers in La Cueva
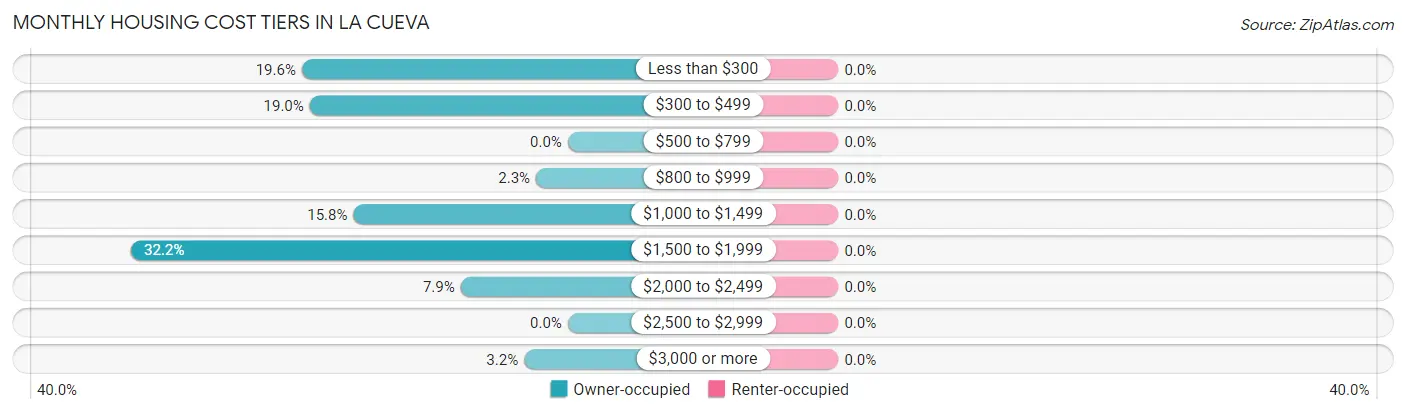
| Monthly Cost | Owner-occupied | Renter-occupied |
| Less than $300 | 67 (19.6%) | 0 (0.0%) |
| $300 to $499 | 65 (19.0%) | 0 (0.0%) |
| $500 to $799 | 0 (0.0%) | 0 (0.0%) |
| $800 to $999 | 8 (2.3%) | 0 (0.0%) |
| $1,000 to $1,499 | 54 (15.8%) | 0 (0.0%) |
| $1,500 to $1,999 | 110 (32.2%) | 0 (0.0%) |
| $2,000 to $2,499 | 27 (7.9%) | 0 (0.0%) |
| $2,500 to $2,999 | 0 (0.0%) | 0 (0.0%) |
| $3,000 or more | 11 (3.2%) | 0 (0.0%) |
| Total | 342 (100.0%) | 0 (0.0%) |
Physical Housing Characteristics in La Cueva
Housing Structures in La Cueva
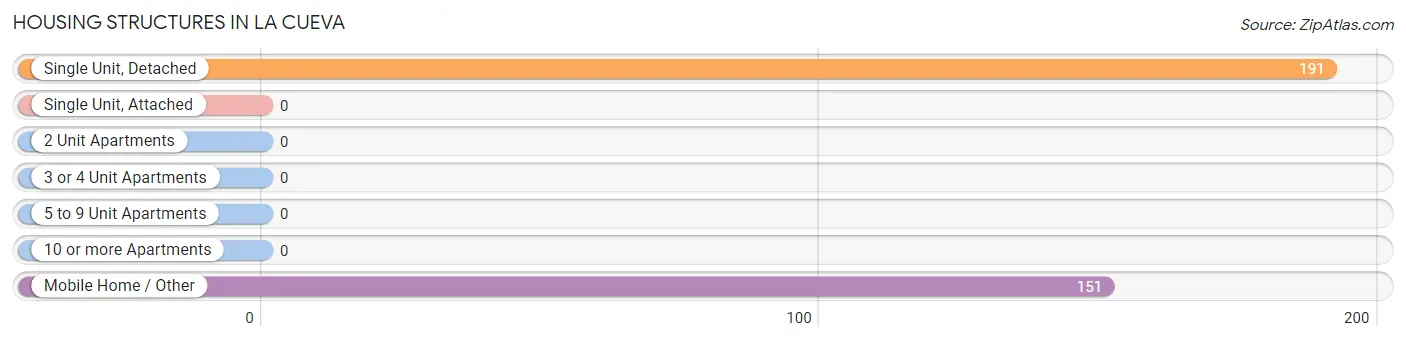
| Structure Type | # Housing Units | % Housing Units |
| Single Unit, Detached | 191 | 55.8% |
| Single Unit, Attached | 0 | 0.0% |
| 2 Unit Apartments | 0 | 0.0% |
| 3 or 4 Unit Apartments | 0 | 0.0% |
| 5 to 9 Unit Apartments | 0 | 0.0% |
| 10 or more Apartments | 0 | 0.0% |
| Mobile Home / Other | 151 | 44.2% |
| Total | 342 | 100.0% |
Housing Structures by Occupancy in La Cueva
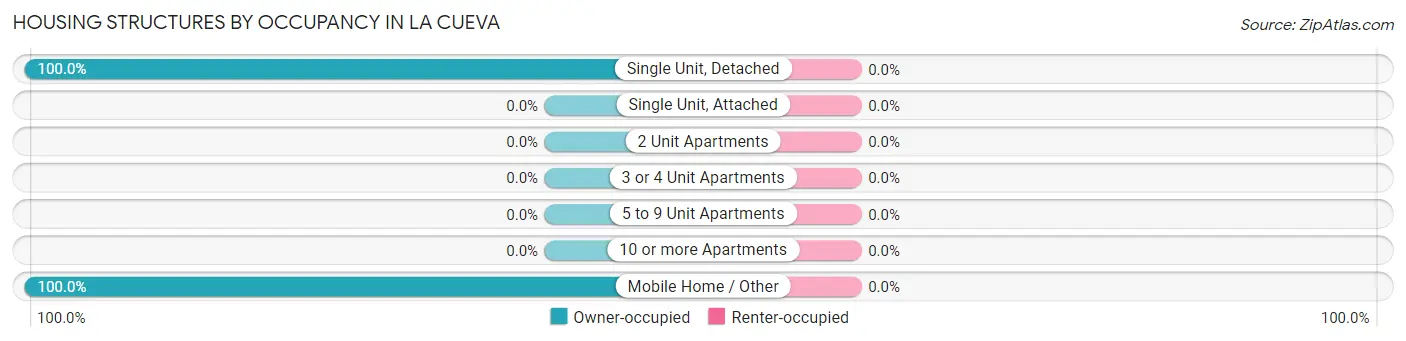
| Structure Type | Owner-occupied | Renter-occupied |
| Single Unit, Detached | 191 (100.0%) | 0 (0.0%) |
| Single Unit, Attached | 0 (0.0%) | 0 (0.0%) |
| 2 Unit Apartments | 0 (0.0%) | 0 (0.0%) |
| 3 or 4 Unit Apartments | 0 (0.0%) | 0 (0.0%) |
| 5 to 9 Unit Apartments | 0 (0.0%) | 0 (0.0%) |
| 10 or more Apartments | 0 (0.0%) | 0 (0.0%) |
| Mobile Home / Other | 151 (100.0%) | 0 (0.0%) |
| Total | 342 (100.0%) | 0 (0.0%) |
Housing Structures by Number of Rooms in La Cueva
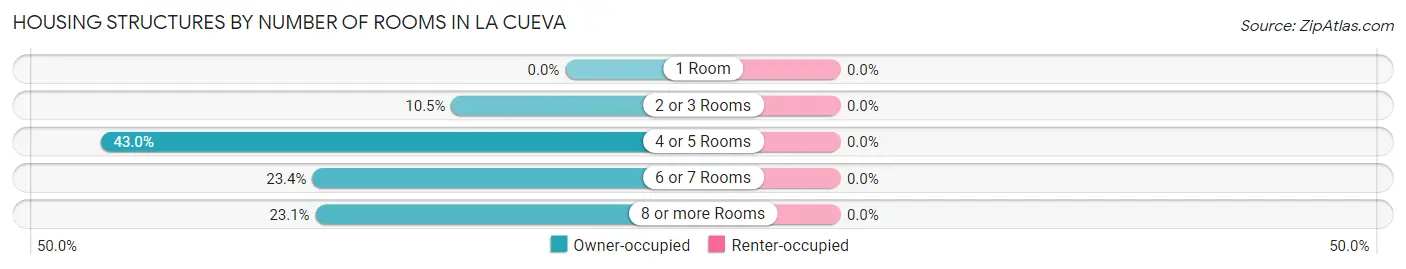
| Number of Rooms | Owner-occupied | Renter-occupied |
| 1 Room | 0 (0.0%) | 0 (0.0%) |
| 2 or 3 Rooms | 36 (10.5%) | 0 (0.0%) |
| 4 or 5 Rooms | 147 (43.0%) | 0 (0.0%) |
| 6 or 7 Rooms | 80 (23.4%) | 0 (0.0%) |
| 8 or more Rooms | 79 (23.1%) | 0 (0.0%) |
| Total | 342 (100.0%) | 0 (0.0%) |
Housing Structure by Heating Type in La Cueva
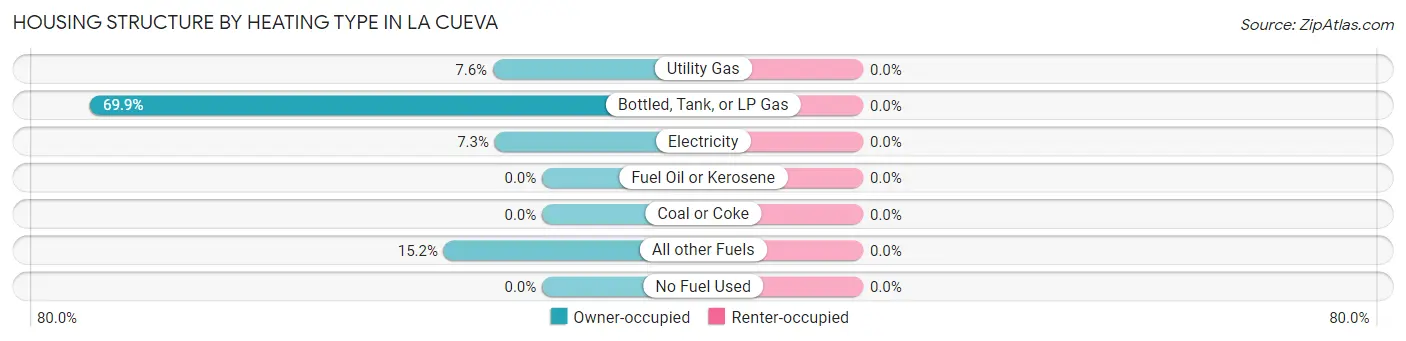
| Heating Type | Owner-occupied | Renter-occupied |
| Utility Gas | 26 (7.6%) | 0 (0.0%) |
| Bottled, Tank, or LP Gas | 239 (69.9%) | 0 (0.0%) |
| Electricity | 25 (7.3%) | 0 (0.0%) |
| Fuel Oil or Kerosene | 0 (0.0%) | 0 (0.0%) |
| Coal or Coke | 0 (0.0%) | 0 (0.0%) |
| All other Fuels | 52 (15.2%) | 0 (0.0%) |
| No Fuel Used | 0 (0.0%) | 0 (0.0%) |
| Total | 342 (100.0%) | 0 (0.0%) |
Household Vehicle Usage in La Cueva
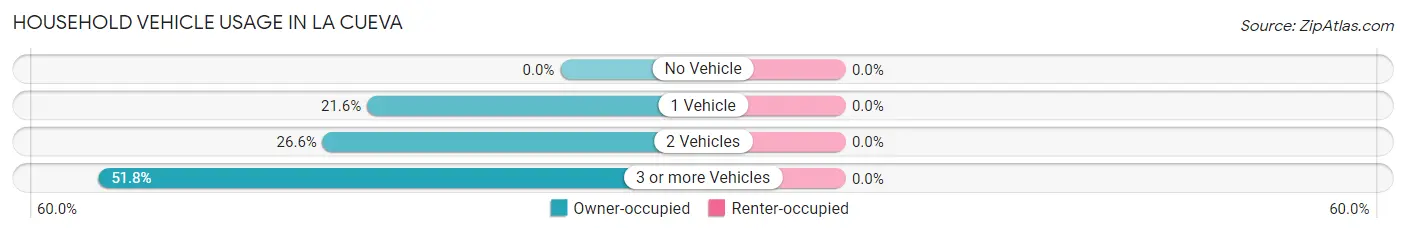
| Vehicles per Household | Owner-occupied | Renter-occupied |
| No Vehicle | 0 (0.0%) | 0 (0.0%) |
| 1 Vehicle | 74 (21.6%) | 0 (0.0%) |
| 2 Vehicles | 91 (26.6%) | 0 (0.0%) |
| 3 or more Vehicles | 177 (51.7%) | 0 (0.0%) |
| Total | 342 (100.0%) | 0 (0.0%) |
Real Estate & Mortgages in La Cueva
Real Estate and Mortgage Overview in La Cueva
| Characteristic | Without Mortgage | With Mortgage |
| Housing Units | 157 | 185 |
| Median Property Value | $230,700 | $343,300 |
| Median Household Income | - | - |
| Monthly Housing Costs | $321 | $11 |
| Real Estate Taxes | $1,288 | $0 |
Property Value by Mortgage Status in La Cueva
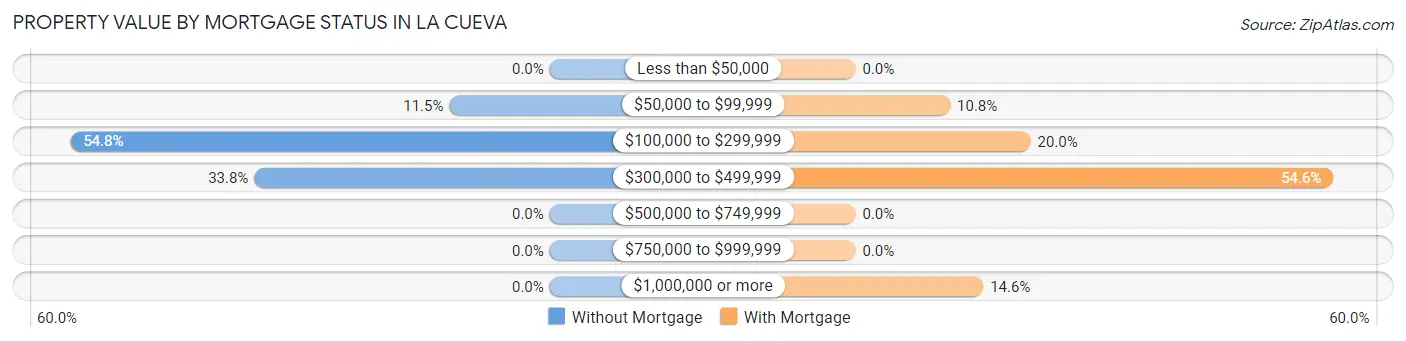
| Property Value | Without Mortgage | With Mortgage |
| Less than $50,000 | 0 (0.0%) | 0 (0.0%) |
| $50,000 to $99,999 | 18 (11.5%) | 20 (10.8%) |
| $100,000 to $299,999 | 86 (54.8%) | 37 (20.0%) |
| $300,000 to $499,999 | 53 (33.8%) | 101 (54.6%) |
| $500,000 to $749,999 | 0 (0.0%) | 0 (0.0%) |
| $750,000 to $999,999 | 0 (0.0%) | 0 (0.0%) |
| $1,000,000 or more | 0 (0.0%) | 27 (14.6%) |
| Total | 157 (100.0%) | 185 (100.0%) |
Household Income by Mortgage Status in La Cueva
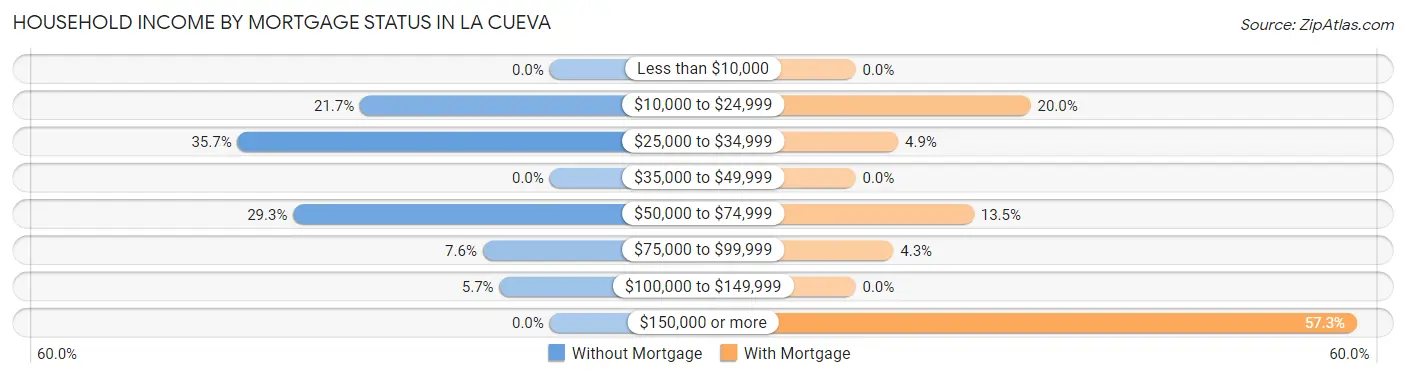
| Household Income | Without Mortgage | With Mortgage |
| Less than $10,000 | 0 (0.0%) | 0 (0.0%) |
| $10,000 to $24,999 | 34 (21.7%) | 37 (20.0%) |
| $25,000 to $34,999 | 56 (35.7%) | 9 (4.9%) |
| $35,000 to $49,999 | 0 (0.0%) | 0 (0.0%) |
| $50,000 to $74,999 | 46 (29.3%) | 25 (13.5%) |
| $75,000 to $99,999 | 12 (7.6%) | 8 (4.3%) |
| $100,000 to $149,999 | 9 (5.7%) | 0 (0.0%) |
| $150,000 or more | 0 (0.0%) | 106 (57.3%) |
| Total | 157 (100.0%) | 185 (100.0%) |
Property Value to Household Income Ratio in La Cueva
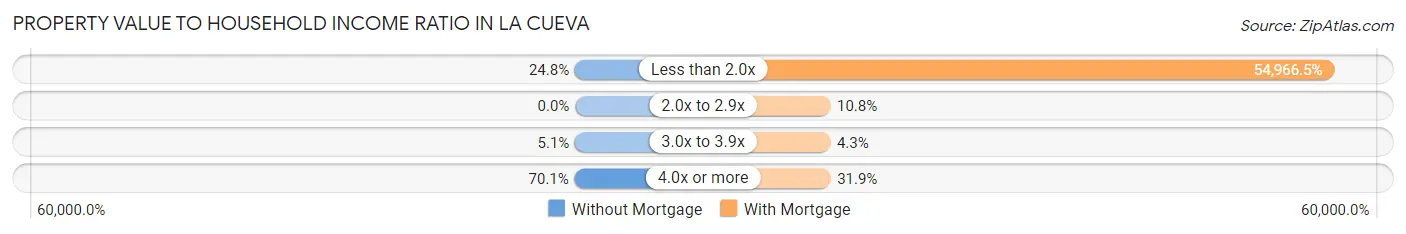
| Value-to-Income Ratio | Without Mortgage | With Mortgage |
| Less than 2.0x | 39 (24.8%) | 101,688 (54,966.5%) |
| 2.0x to 2.9x | 0 (0.0%) | 20 (10.8%) |
| 3.0x to 3.9x | 8 (5.1%) | 8 (4.3%) |
| 4.0x or more | 110 (70.1%) | 59 (31.9%) |
| Total | 157 (100.0%) | 185 (100.0%) |
Real Estate Taxes by Mortgage Status in La Cueva
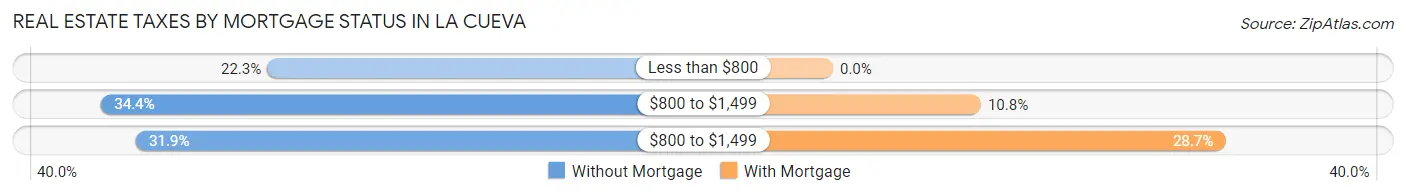
| Property Taxes | Without Mortgage | With Mortgage |
| Less than $800 | 35 (22.3%) | 0 (0.0%) |
| $800 to $1,499 | 54 (34.4%) | 20 (10.8%) |
| $800 to $1,499 | 50 (31.9%) | 53 (28.6%) |
| Total | 157 (100.0%) | 185 (100.0%) |
Health & Disability in La Cueva
Health Insurance Coverage by Age in La Cueva
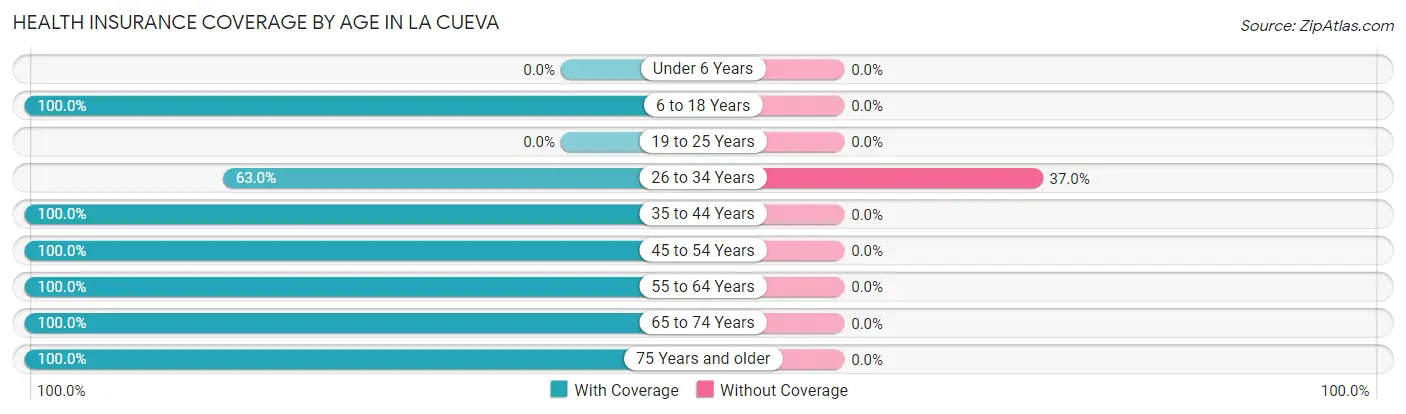
| Age Bracket | With Coverage | Without Coverage |
| Under 6 Years | 0 (0.0%) | 0 (0.0%) |
| 6 to 18 Years | 48 (100.0%) | 0 (0.0%) |
| 19 to 25 Years | 0 (0.0%) | 0 (0.0%) |
| 26 to 34 Years | 104 (63.0%) | 61 (37.0%) |
| 35 to 44 Years | 56 (100.0%) | 0 (0.0%) |
| 45 to 54 Years | 138 (100.0%) | 0 (0.0%) |
| 55 to 64 Years | 112 (100.0%) | 0 (0.0%) |
| 65 to 74 Years | 109 (100.0%) | 0 (0.0%) |
| 75 Years and older | 66 (100.0%) | 0 (0.0%) |
| Total | 633 (91.2%) | 61 (8.8%) |
Health Insurance Coverage by Citizenship Status in La Cueva
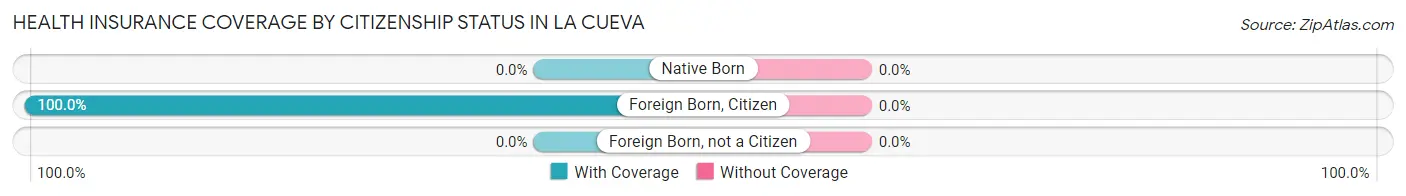
| Citizenship Status | With Coverage | Without Coverage |
| Native Born | 0 (0.0%) | 0 (0.0%) |
| Foreign Born, Citizen | 48 (100.0%) | 0 (0.0%) |
| Foreign Born, not a Citizen | 0 (0.0%) | 0 (0.0%) |
Health Insurance Coverage by Household Income in La Cueva
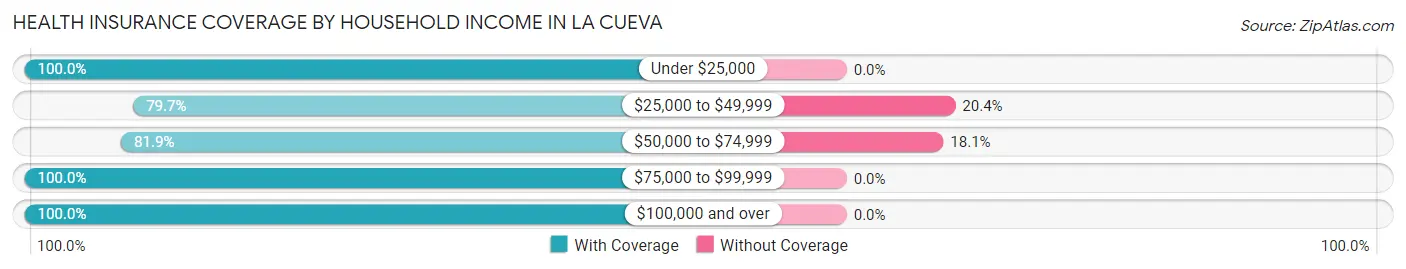
| Household Income | With Coverage | Without Coverage |
| Under $25,000 | 94 (100.0%) | 0 (0.0%) |
| $25,000 to $49,999 | 90 (79.6%) | 23 (20.3%) |
| $50,000 to $74,999 | 172 (81.9%) | 38 (18.1%) |
| $75,000 to $99,999 | 15 (100.0%) | 0 (0.0%) |
| $100,000 and over | 262 (100.0%) | 0 (0.0%) |
Public vs Private Health Insurance Coverage by Age in La Cueva
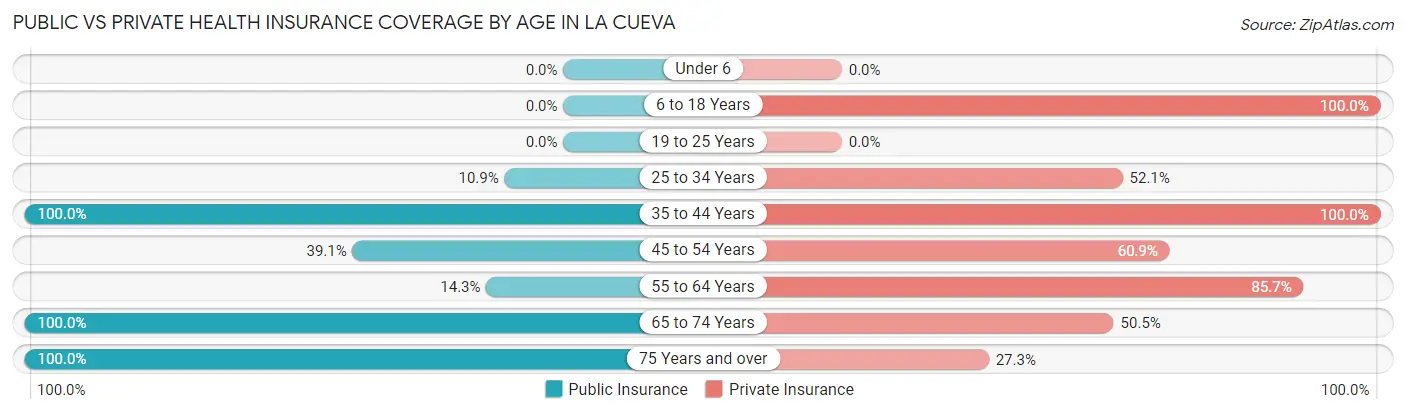
| Age Bracket | Public Insurance | Private Insurance |
| Under 6 | 0 (0.0%) | 0 (0.0%) |
| 6 to 18 Years | 0 (0.0%) | 48 (100.0%) |
| 19 to 25 Years | 0 (0.0%) | 0 (0.0%) |
| 25 to 34 Years | 18 (10.9%) | 86 (52.1%) |
| 35 to 44 Years | 56 (100.0%) | 56 (100.0%) |
| 45 to 54 Years | 54 (39.1%) | 84 (60.9%) |
| 55 to 64 Years | 16 (14.3%) | 96 (85.7%) |
| 65 to 74 Years | 109 (100.0%) | 55 (50.5%) |
| 75 Years and over | 66 (100.0%) | 18 (27.3%) |
| Total | 319 (46.0%) | 443 (63.8%) |
Disability Status by Sex by Age in La Cueva
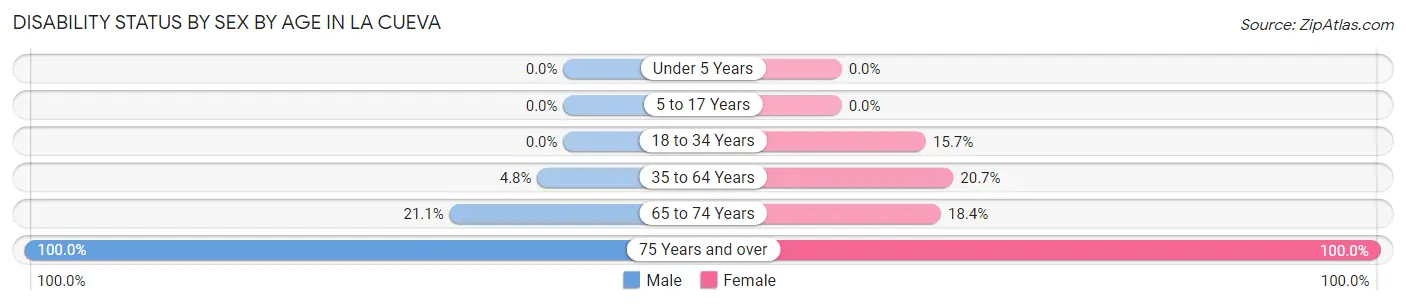
| Age Bracket | Male | Female |
| Under 5 Years | 0 (0.0%) | 0 (0.0%) |
| 5 to 17 Years | 0 (0.0%) | 0 (0.0%) |
| 18 to 34 Years | 0 (0.0%) | 18 (15.7%) |
| 35 to 64 Years | 8 (4.8%) | 29 (20.7%) |
| 65 to 74 Years | 15 (21.1%) | 7 (18.4%) |
| 75 Years and over | 24 (100.0%) | 42 (100.0%) |
Disability Class by Sex by Age in La Cueva
Disability Class: Hearing Difficulty
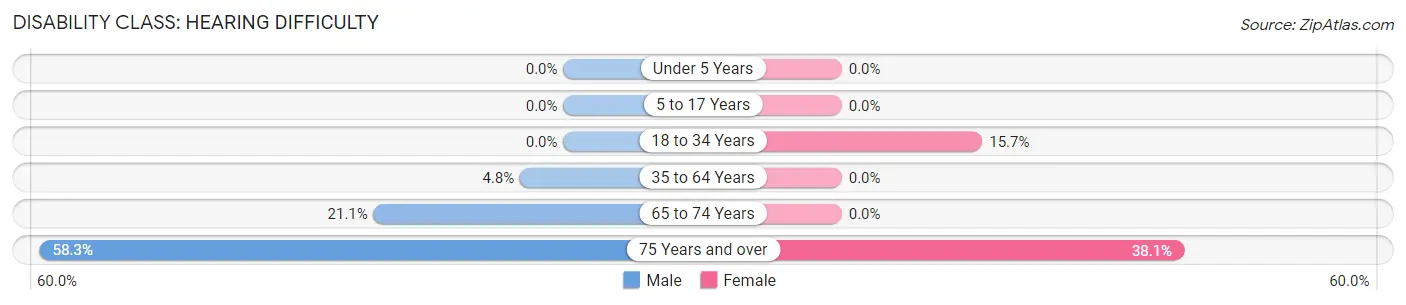
| Age Bracket | Male | Female |
| Under 5 Years | 0 (0.0%) | 0 (0.0%) |
| 5 to 17 Years | 0 (0.0%) | 0 (0.0%) |
| 18 to 34 Years | 0 (0.0%) | 18 (15.7%) |
| 35 to 64 Years | 8 (4.8%) | 0 (0.0%) |
| 65 to 74 Years | 15 (21.1%) | 0 (0.0%) |
| 75 Years and over | 14 (58.3%) | 16 (38.1%) |
Disability Class: Vision Difficulty
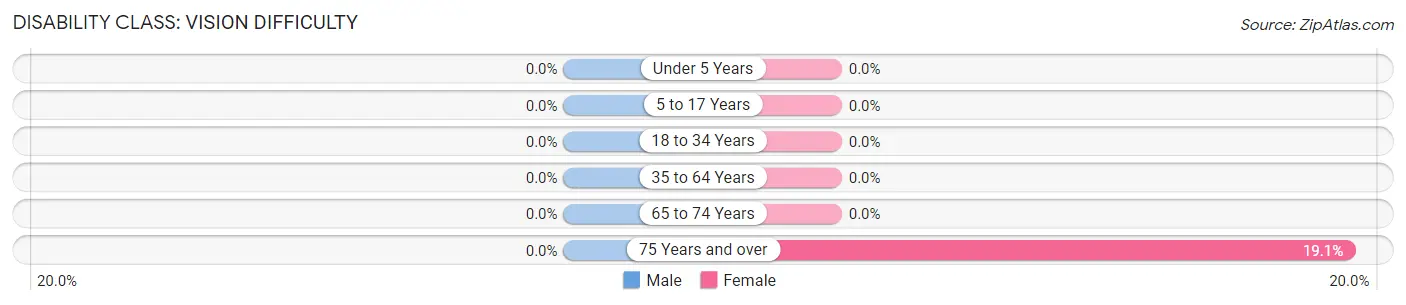
| Age Bracket | Male | Female |
| Under 5 Years | 0 (0.0%) | 0 (0.0%) |
| 5 to 17 Years | 0 (0.0%) | 0 (0.0%) |
| 18 to 34 Years | 0 (0.0%) | 0 (0.0%) |
| 35 to 64 Years | 0 (0.0%) | 0 (0.0%) |
| 65 to 74 Years | 0 (0.0%) | 0 (0.0%) |
| 75 Years and over | 0 (0.0%) | 8 (19.1%) |
Disability Class: Cognitive Difficulty
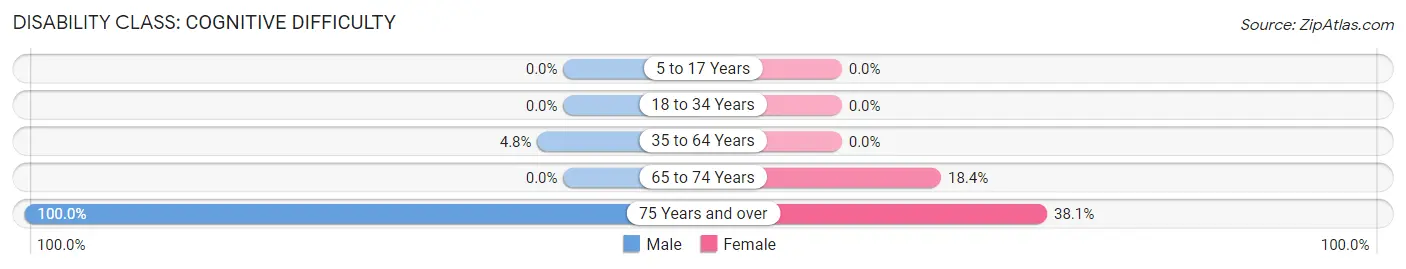
| Age Bracket | Male | Female |
| 5 to 17 Years | 0 (0.0%) | 0 (0.0%) |
| 18 to 34 Years | 0 (0.0%) | 0 (0.0%) |
| 35 to 64 Years | 8 (4.8%) | 0 (0.0%) |
| 65 to 74 Years | 0 (0.0%) | 7 (18.4%) |
| 75 Years and over | 24 (100.0%) | 16 (38.1%) |
Disability Class: Ambulatory Difficulty
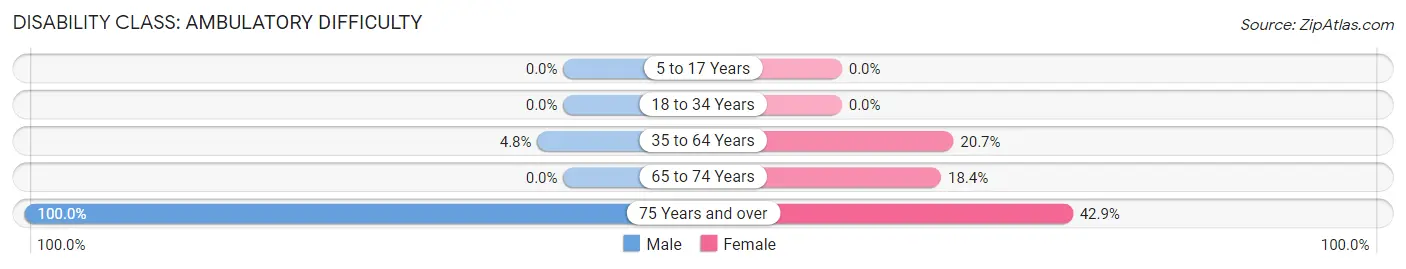
| Age Bracket | Male | Female |
| 5 to 17 Years | 0 (0.0%) | 0 (0.0%) |
| 18 to 34 Years | 0 (0.0%) | 0 (0.0%) |
| 35 to 64 Years | 8 (4.8%) | 29 (20.7%) |
| 65 to 74 Years | 0 (0.0%) | 7 (18.4%) |
| 75 Years and over | 24 (100.0%) | 18 (42.9%) |
Disability Class: Self-Care Difficulty
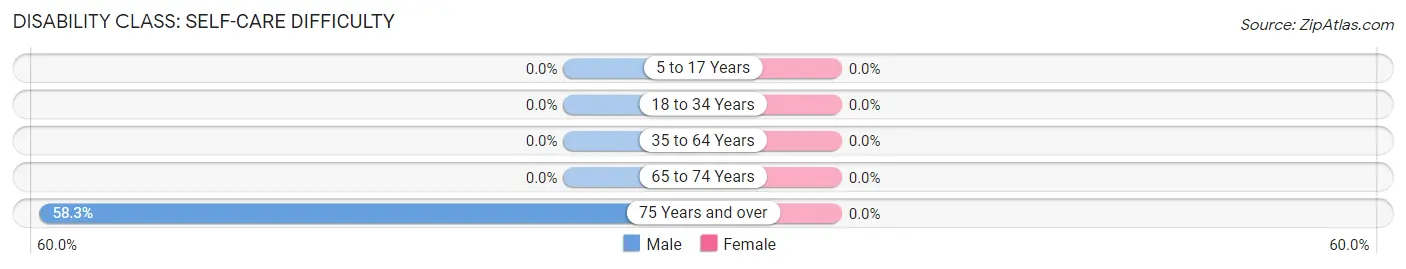
| Age Bracket | Male | Female |
| 5 to 17 Years | 0 (0.0%) | 0 (0.0%) |
| 18 to 34 Years | 0 (0.0%) | 0 (0.0%) |
| 35 to 64 Years | 0 (0.0%) | 0 (0.0%) |
| 65 to 74 Years | 0 (0.0%) | 0 (0.0%) |
| 75 Years and over | 14 (58.3%) | 0 (0.0%) |
Technology Access in La Cueva
Computing Device Access in La Cueva
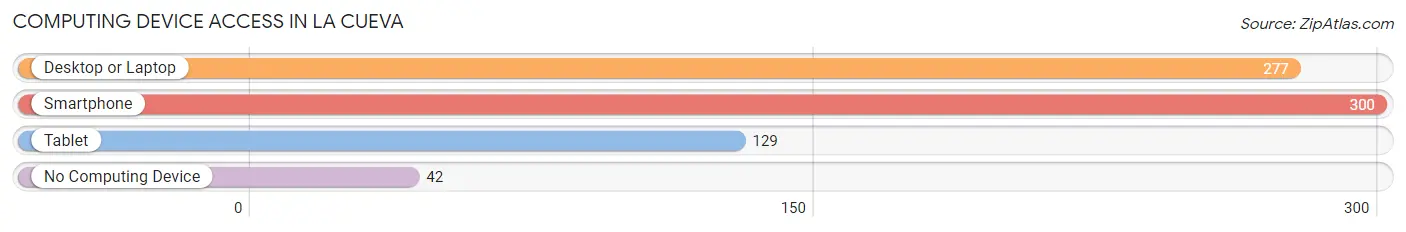
| Device Type | # Households | % Households |
| Desktop or Laptop | 277 | 81.0% |
| Smartphone | 300 | 87.7% |
| Tablet | 129 | 37.7% |
| No Computing Device | 42 | 12.3% |
| Total | 342 | 100.0% |
Internet Access in La Cueva
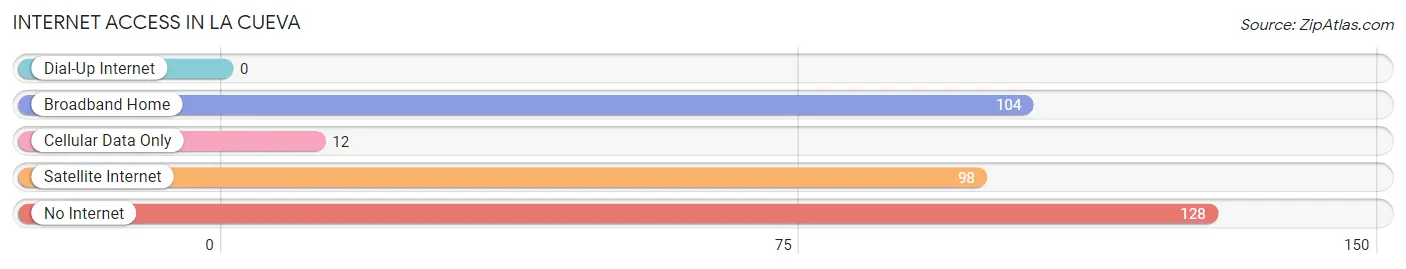
| Internet Type | # Households | % Households |
| Dial-Up Internet | 0 | 0.0% |
| Broadband Home | 104 | 30.4% |
| Cellular Data Only | 12 | 3.5% |
| Satellite Internet | 98 | 28.6% |
| No Internet | 128 | 37.4% |
| Total | 342 | 100.0% |
La Cueva Summary
Cueva, New Mexico is a small unincorporated community located in the northern part of the state. It is situated in the foothills of the Sangre de Cristo Mountains, approximately 25 miles north of Santa Fe. The area is known for its scenic beauty and is home to a variety of wildlife, including elk, deer, and bighorn sheep.
History
The area now known as Cueva, New Mexico was originally inhabited by the Tewa Indians, who lived in the area for centuries before the arrival of the Spanish in the 16th century. The Spanish established a mission in the area in 1610, and the area was later settled by Spanish colonists. The area was part of the Spanish province of New Mexico until 1821, when Mexico gained independence from Spain. After the Mexican-American War, the area became part of the United States.
In the late 19th century, the area was settled by ranchers and farmers, and the town of Cueva was established in 1891. The town was named after the nearby Cueva de los Muertos, or Cave of the Dead, which was a sacred site for the Tewa Indians. The town grew slowly, and by the early 20th century, it had a population of around 200 people.
Geography
Cueva, New Mexico is located in the northern part of the state, in the foothills of the Sangre de Cristo Mountains. The area is known for its scenic beauty, and is home to a variety of wildlife, including elk, deer, and bighorn sheep. The town is situated at an elevation of 6,400 feet, and the surrounding area is mostly mountainous, with some flat areas. The climate is semi-arid, with hot summers and cold winters.
Economy
The economy of Cueva, New Mexico is largely based on agriculture and ranching. The area is known for its cattle and sheep ranches, as well as its production of hay, alfalfa, and other crops. The town also has a small tourism industry, with visitors coming to the area to enjoy the scenic beauty and wildlife.
Demographics
As of the 2010 census, the population of Cueva, New Mexico was 1,093. The population is mostly Hispanic, with a small percentage of Native Americans. The median household income is $31,250, and the median age is 37. The town is served by the Santa Fe County School District, and the nearest hospital is located in Santa Fe.
Cueva, New Mexico is a small, rural community with a rich history and a unique culture. The area is known for its scenic beauty and its abundance of wildlife, and it is a popular destination for tourists and outdoor enthusiasts. The town is home to a diverse population, and its economy is largely based on agriculture and ranching.
Common Questions
What is Per Capita Income in La Cueva?
Per Capita income in La Cueva is $32,272.
What is the Median Family Income in La Cueva?
Median Family Income in La Cueva is $83,646.
What is the Median Household income in La Cueva?
Median Household Income in La Cueva is $53,462.
What is Inequality or Gini Index in La Cueva?
Inequality or Gini Index in La Cueva is 0.40.
What is the Total Population of La Cueva?
Total Population of La Cueva is 694.
What is the Total Male Population of La Cueva?
Total Male Population of La Cueva is 359.
What is the Total Female Population of La Cueva?
Total Female Population of La Cueva is 335.
What is the Ratio of Males per 100 Females in La Cueva?
There are 107.16 Males per 100 Females in La Cueva.
What is the Ratio of Females per 100 Males in La Cueva?
There are 93.31 Females per 100 Males in La Cueva.
What is the Median Population Age in La Cueva?
Median Population Age in La Cueva is 49.4 Years.
What is the Average Family Size in La Cueva
Average Family Size in La Cueva is 2.3 People.
What is the Average Household Size in La Cueva
Average Household Size in La Cueva is 2.0 People.
How Large is the Labor Force in La Cueva?
There are 481 People in the Labor Forcein in La Cueva.
What is the Percentage of People in the Labor Force in La Cueva?
69.3% of People are in the Labor Force in La Cueva.