Cochiti, NM Map & Demographics
Cochiti Map
Cochiti Overview
$30,664
PER CAPITA INCOME
$85,909
AVG FAMILY INCOME
$63,500
AVG HOUSEHOLD INCOME
26.2%
WAGE / INCOME GAP [ % ]
73.8¢/ $1
WAGE / INCOME GAP [ $ ]
0.57
INEQUALITY / GINI INDEX
484
TOTAL POPULATION
244
MALE POPULATION
240
FEMALE POPULATION
101.67
MALES / 100 FEMALES
98.36
FEMALES / 100 MALES
31.7
MEDIAN AGE
4.3
AVG FAMILY SIZE
3.6
AVG HOUSEHOLD SIZE
241
LABOR FORCE [ PEOPLE ]
66.0%
PERCENT IN LABOR FORCE
3.7%
UNEMPLOYMENT RATE
Income in Cochiti
Income Overview in Cochiti
Per Capita Income in Cochiti is $30,664, while median incomes of families and households are $85,909 and $63,500 respectively.
| Characteristic | Number | Measure |
| Per Capita Income | 484 | $30,664 |
| Median Family Income | 106 | $85,909 |
| Mean Family Income | 106 | $136,314 |
| Median Household Income | 136 | $63,500 |
| Mean Household Income | 136 | $110,300 |
| Income Deficit | 106 | $0 |
| Wage / Income Gap (%) | 484 | 26.19% |
| Wage / Income Gap ($) | 484 | 73.81¢ per $1 |
| Gini / Inequality Index | 484 | 0.57 |
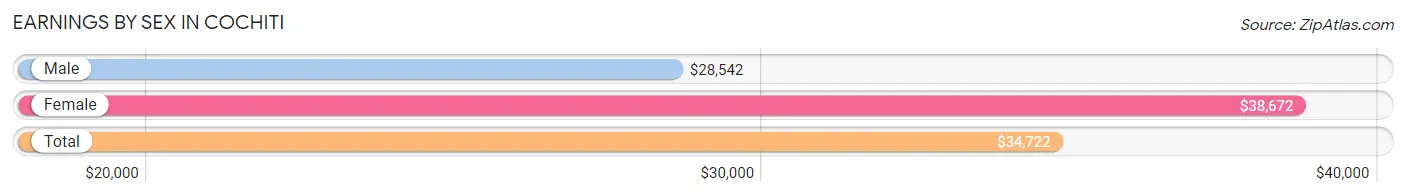
Earnings by Sex in Cochiti
Average Earnings in Cochiti are $34,722, $28,542 for men and $38,672 for women, a difference of 26.2%.
| Sex | Number | Average Earnings |
| Male | 139 (56.5%) | $28,542 |
| Female | 107 (43.5%) | $38,672 |
| Total | 246 (100.0%) | $34,722 |
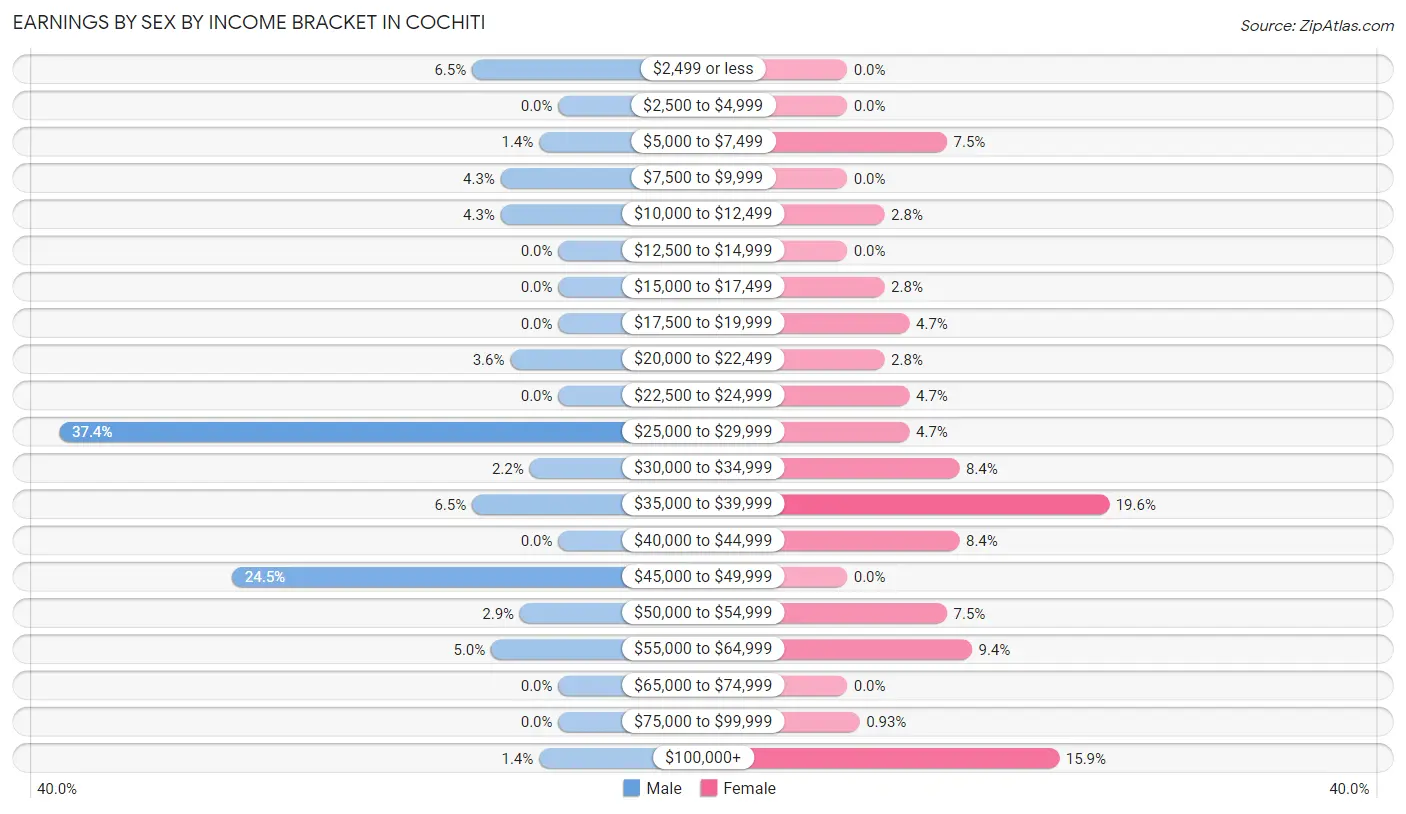
Earnings by Sex by Income Bracket in Cochiti
The most common earnings brackets in Cochiti are $25,000 to $29,999 for men (52 | 37.4%) and $35,000 to $39,999 for women (21 | 19.6%).
| Income | Male | Female |
| $2,499 or less | 9 (6.5%) | 0 (0.0%) |
| $2,500 to $4,999 | 0 (0.0%) | 0 (0.0%) |
| $5,000 to $7,499 | 2 (1.4%) | 8 (7.5%) |
| $7,500 to $9,999 | 6 (4.3%) | 0 (0.0%) |
| $10,000 to $12,499 | 6 (4.3%) | 3 (2.8%) |
| $12,500 to $14,999 | 0 (0.0%) | 0 (0.0%) |
| $15,000 to $17,499 | 0 (0.0%) | 3 (2.8%) |
| $17,500 to $19,999 | 0 (0.0%) | 5 (4.7%) |
| $20,000 to $22,499 | 5 (3.6%) | 3 (2.8%) |
| $22,500 to $24,999 | 0 (0.0%) | 5 (4.7%) |
| $25,000 to $29,999 | 52 (37.4%) | 5 (4.7%) |
| $30,000 to $34,999 | 3 (2.2%) | 9 (8.4%) |
| $35,000 to $39,999 | 9 (6.5%) | 21 (19.6%) |
| $40,000 to $44,999 | 0 (0.0%) | 9 (8.4%) |
| $45,000 to $49,999 | 34 (24.5%) | 0 (0.0%) |
| $50,000 to $54,999 | 4 (2.9%) | 8 (7.5%) |
| $55,000 to $64,999 | 7 (5.0%) | 10 (9.3%) |
| $65,000 to $74,999 | 0 (0.0%) | 0 (0.0%) |
| $75,000 to $99,999 | 0 (0.0%) | 1 (0.9%) |
| $100,000+ | 2 (1.4%) | 17 (15.9%) |
| Total | 139 (100.0%) | 107 (100.0%) |
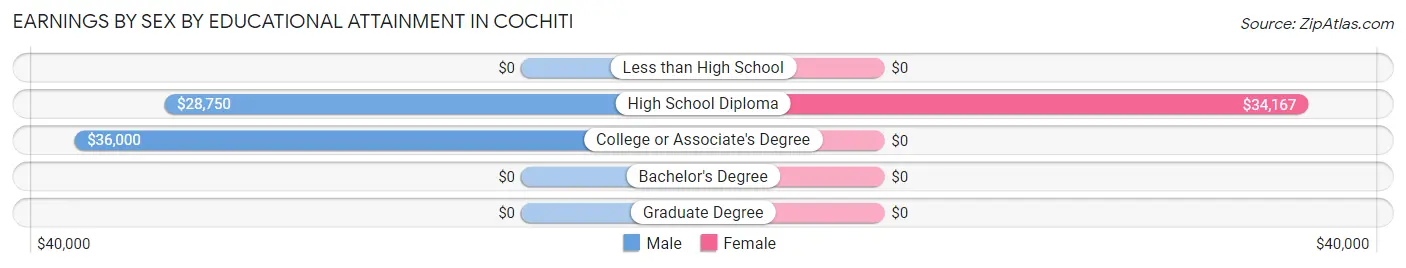
Earnings by Sex by Educational Attainment in Cochiti
Average earnings in Cochiti are $35,278 for men and $38,636 for women, a difference of 8.7%. Men with an educational attainment of college or associate's degree enjoy the highest average annual earnings of $36,000, while those with high school diploma education earn the least with $28,750. Women with an educational attainment of high school diploma earn the most with the average annual earnings of $34,167, while those with high school diploma education have the smallest earnings of $34,167.
| Educational Attainment | Male Income | Female Income |
| Less than High School | - | - |
| High School Diploma | $28,750 | $34,167 |
| College or Associate's Degree | $36,000 | $0 |
| Bachelor's Degree | - | - |
| Graduate Degree | - | - |
| Total | $35,278 | $38,636 |
Family Income in Cochiti
Family Income Brackets in Cochiti
According to the Cochiti family income data, there are 21 families falling into the $75,000 to $99,999 income range, which is the most common income bracket and makes up 19.8% of all families.
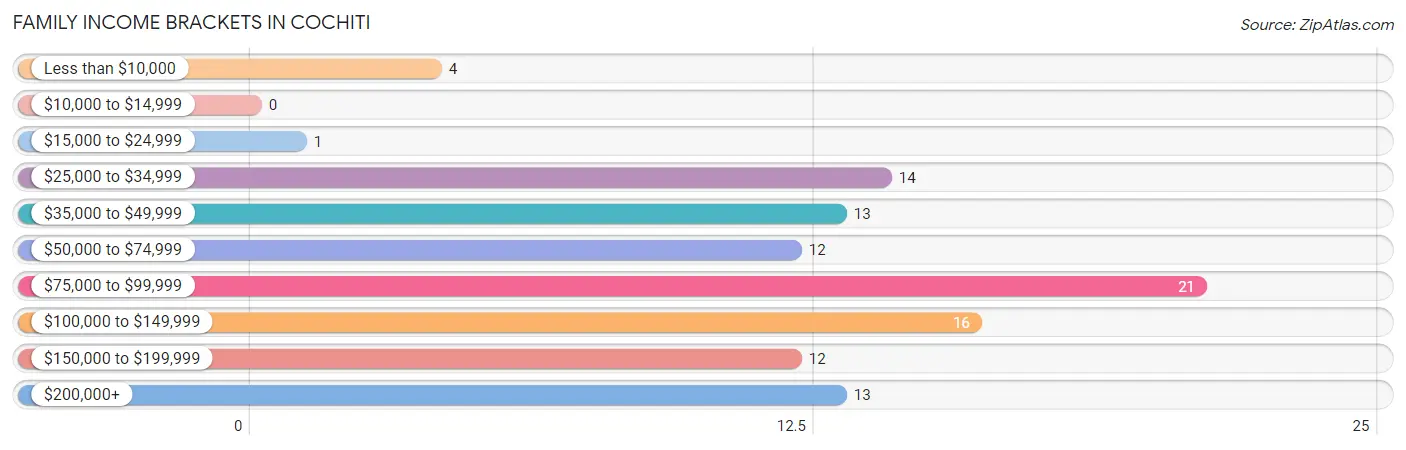
| Income Bracket | # Families | % Families |
| Less than $10,000 | 4 | 3.8% |
| $10,000 to $14,999 | 0 | 0.0% |
| $15,000 to $24,999 | 1 | 0.9% |
| $25,000 to $34,999 | 14 | 13.2% |
| $35,000 to $49,999 | 13 | 12.3% |
| $50,000 to $74,999 | 12 | 11.3% |
| $75,000 to $99,999 | 21 | 19.8% |
| $100,000 to $149,999 | 16 | 15.1% |
| $150,000 to $199,999 | 12 | 11.3% |
| $200,000+ | 13 | 12.3% |
Family Income by Famaliy Size in Cochiti
4-person families (22 | 20.7%) account for the highest median family income in Cochiti with $87,222 per family, while 4-person families (22 | 20.7%) have the highest median income of $21,806 per family member.
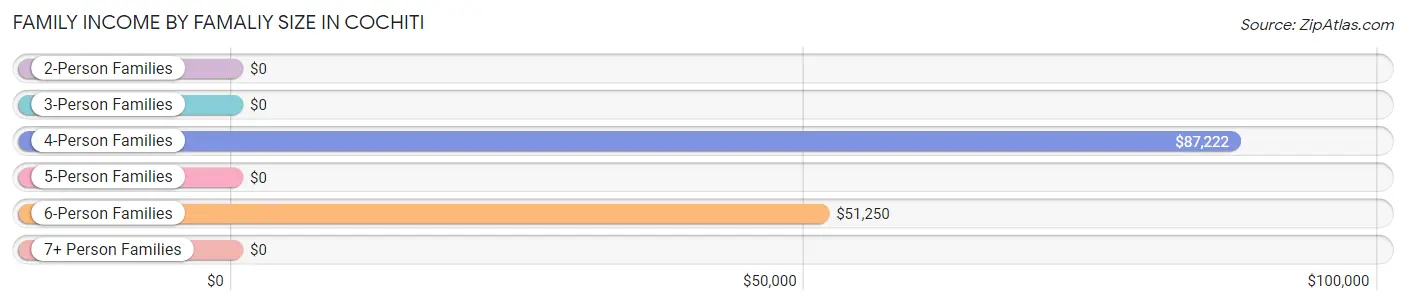
| Income Bracket | # Families | Median Income |
| 2-Person Families | 30 (28.3%) | $0 |
| 3-Person Families | 32 (30.2%) | $0 |
| 4-Person Families | 22 (20.7%) | $87,222 |
| 5-Person Families | 10 (9.4%) | $0 |
| 6-Person Families | 12 (11.3%) | $51,250 |
| 7+ Person Families | 0 (0.0%) | $0 |
| Total | 106 (100.0%) | $85,909 |
Family Income by Number of Earners in Cochiti
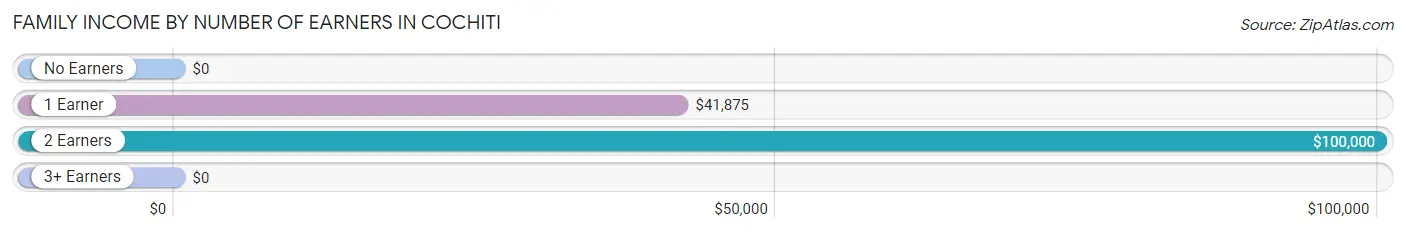
| Number of Earners | # Families | Median Income |
| No Earners | 8 (7.5%) | $0 |
| 1 Earner | 36 (34.0%) | $41,875 |
| 2 Earners | 38 (35.8%) | $100,000 |
| 3+ Earners | 24 (22.6%) | $0 |
| Total | 106 (100.0%) | $85,909 |
Household Income in Cochiti
Household Income Brackets in Cochiti
With 21 households falling in the category, the $75,000 to $99,999 income range is the most frequent in Cochiti, accounting for 15.4% of all households. In contrast, only 7 households (5.1%) fall into the $10,000 to $14,999 income bracket, making it the least populous group.
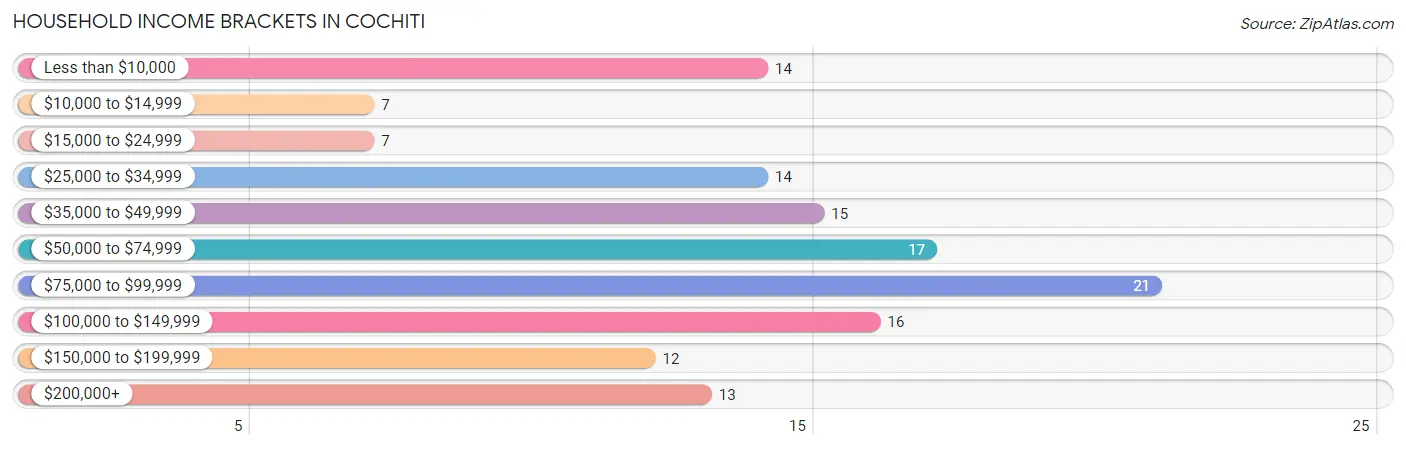
| Income Bracket | # Households | % Households |
| Less than $10,000 | 14 | 10.3% |
| $10,000 to $14,999 | 7 | 5.1% |
| $15,000 to $24,999 | 7 | 5.1% |
| $25,000 to $34,999 | 14 | 10.3% |
| $35,000 to $49,999 | 15 | 11.0% |
| $50,000 to $74,999 | 17 | 12.5% |
| $75,000 to $99,999 | 21 | 15.4% |
| $100,000 to $149,999 | 16 | 11.8% |
| $150,000 to $199,999 | 12 | 8.8% |
| $200,000+ | 13 | 9.6% |
Household Income by Householder Age in Cochiti
The median household income in Cochiti is $63,500, with the highest median household income of $99,688 found in the 45 to 64 years age bracket for the primary householder. A total of 49 households (36.0%) fall into this category.
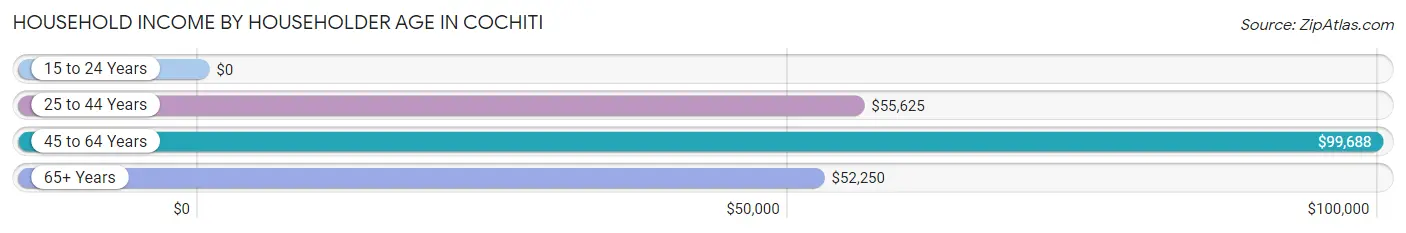
| Income Bracket | # Households | Median Income |
| 15 to 24 Years | 0 (0.0%) | $0 |
| 25 to 44 Years | 34 (25.0%) | $55,625 |
| 45 to 64 Years | 49 (36.0%) | $99,688 |
| 65+ Years | 53 (39.0%) | $52,250 |
| Total | 136 (100.0%) | $63,500 |
Poverty in Cochiti
Income Below Poverty by Sex and Age in Cochiti
With 13.1% poverty level for males and 6.7% for females among the residents of Cochiti, 6 to 11 year old males and 75 year old and over females are the most vulnerable to poverty, with 8 males (33.3%) and 4 females (26.7%) in their respective age groups living below the poverty level.
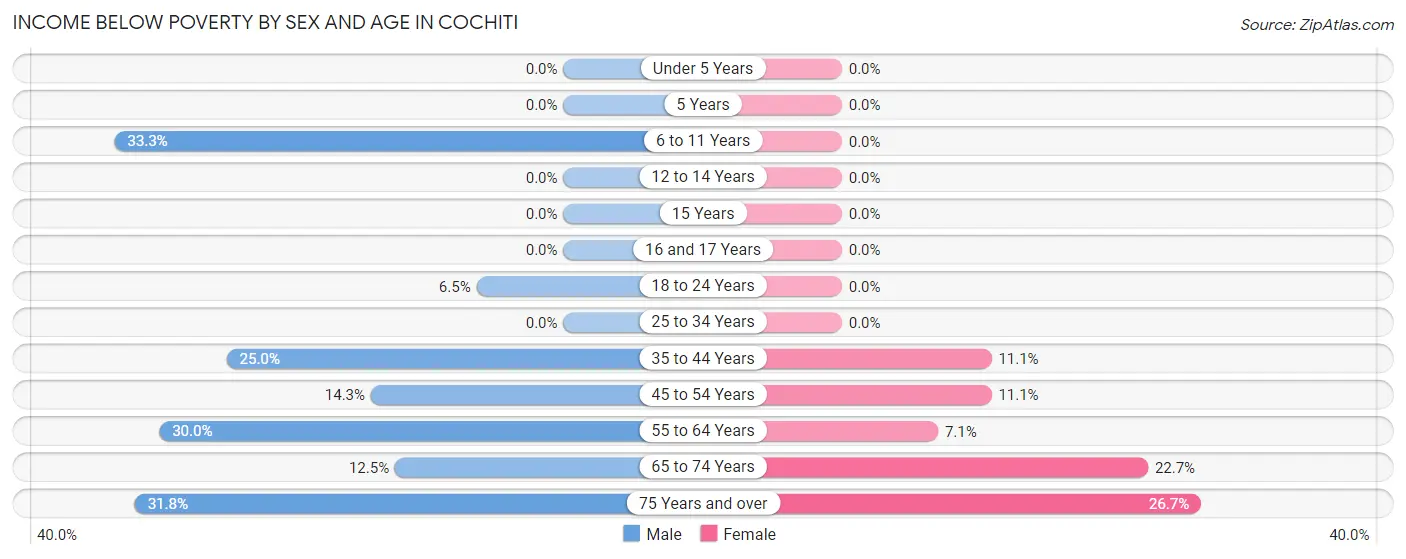
| Age Bracket | Male | Female |
| Under 5 Years | 0 (0.0%) | 0 (0.0%) |
| 5 Years | 0 (0.0%) | 0 (0.0%) |
| 6 to 11 Years | 8 (33.3%) | 0 (0.0%) |
| 12 to 14 Years | 0 (0.0%) | 0 (0.0%) |
| 15 Years | 0 (0.0%) | 0 (0.0%) |
| 16 and 17 Years | 0 (0.0%) | 0 (0.0%) |
| 18 to 24 Years | 2 (6.5%) | 0 (0.0%) |
| 25 to 34 Years | 0 (0.0%) | 0 (0.0%) |
| 35 to 44 Years | 3 (25.0%) | 1 (11.1%) |
| 45 to 54 Years | 4 (14.3%) | 5 (11.1%) |
| 55 to 64 Years | 6 (30.0%) | 1 (7.1%) |
| 65 to 74 Years | 2 (12.5%) | 5 (22.7%) |
| 75 Years and over | 7 (31.8%) | 4 (26.7%) |
| Total | 32 (13.1%) | 16 (6.7%) |
Income Above Poverty by Sex and Age in Cochiti
According to the poverty statistics in Cochiti, males aged under 5 years and females aged under 5 years are the age groups that are most secure financially, with 100.0% of males and 100.0% of females in these age groups living above the poverty line.
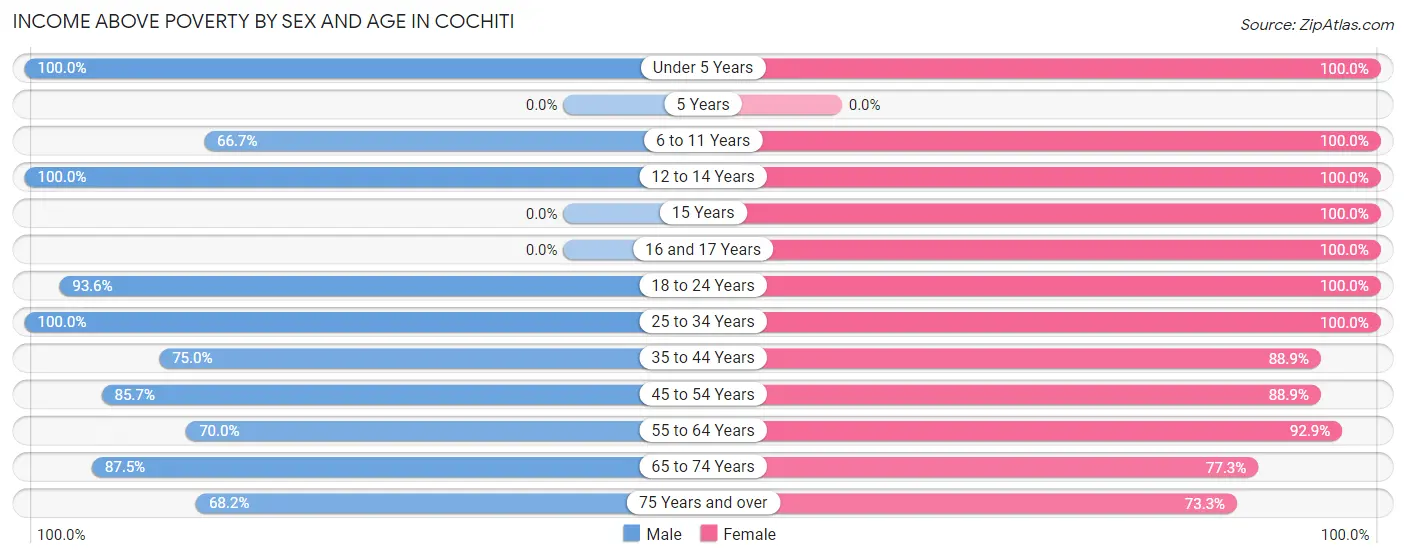
| Age Bracket | Male | Female |
| Under 5 Years | 9 (100.0%) | 27 (100.0%) |
| 5 Years | 0 (0.0%) | 0 (0.0%) |
| 6 to 11 Years | 16 (66.7%) | 24 (100.0%) |
| 12 to 14 Years | 17 (100.0%) | 4 (100.0%) |
| 15 Years | 0 (0.0%) | 14 (100.0%) |
| 16 and 17 Years | 0 (0.0%) | 12 (100.0%) |
| 18 to 24 Years | 29 (93.5%) | 10 (100.0%) |
| 25 to 34 Years | 65 (100.0%) | 44 (100.0%) |
| 35 to 44 Years | 9 (75.0%) | 8 (88.9%) |
| 45 to 54 Years | 24 (85.7%) | 40 (88.9%) |
| 55 to 64 Years | 14 (70.0%) | 13 (92.9%) |
| 65 to 74 Years | 14 (87.5%) | 17 (77.3%) |
| 75 Years and over | 15 (68.2%) | 11 (73.3%) |
| Total | 212 (86.9%) | 224 (93.3%) |
Income Below Poverty Among Married-Couple Families in Cochiti
The poverty statistics for married-couple families in Cochiti show that 13.2% or 7 of the total 53 families live below the poverty line. Families with 3 or 4 children have the highest poverty rate of 42.9%, comprising of 3 families. On the other hand, families with 1 or 2 children have the lowest poverty rate of 0.0%, which includes 0 families.
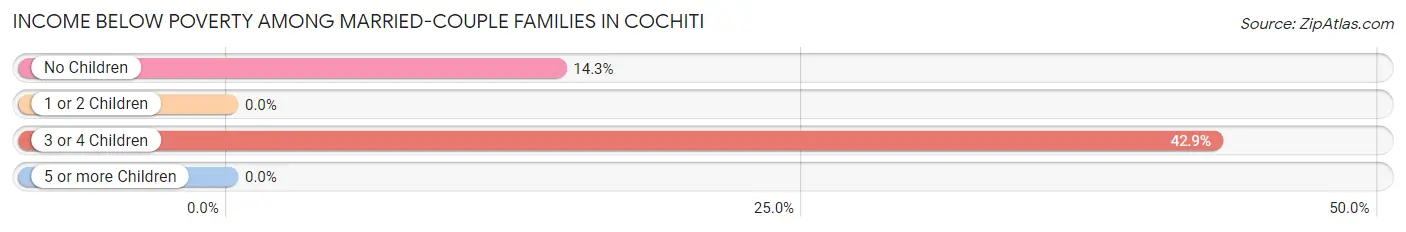
| Children | Above Poverty | Below Poverty |
| No Children | 24 (85.7%) | 4 (14.3%) |
| 1 or 2 Children | 18 (100.0%) | 0 (0.0%) |
| 3 or 4 Children | 4 (57.1%) | 3 (42.9%) |
| 5 or more Children | 0 (0.0%) | 0 (0.0%) |
| Total | 46 (86.8%) | 7 (13.2%) |
Income Below Poverty Among Single-Parent Households in Cochiti
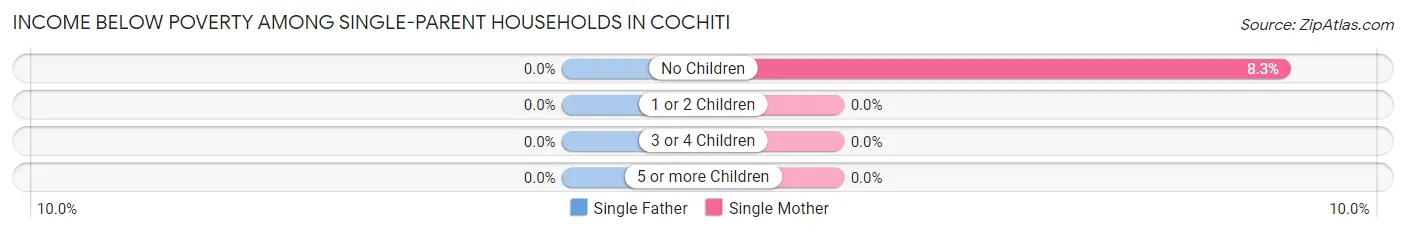
| Children | Single Father | Single Mother |
| No Children | 0 (0.0%) | 1 (8.3%) |
| 1 or 2 Children | 0 (0.0%) | 0 (0.0%) |
| 3 or 4 Children | 0 (0.0%) | 0 (0.0%) |
| 5 or more Children | 0 (0.0%) | 0 (0.0%) |
| Total | 0 (0.0%) | 1 (3.3%) |
Income Below Poverty Among Married-Couple vs Single-Parent Households in Cochiti
The poverty data for Cochiti shows that 7 of the married-couple family households (13.2%) and 1 of the single-parent households (1.9%) are living below the poverty level. Within the married-couple family households, those with 3 or 4 children have the highest poverty rate, with 3 households (42.9%) falling below the poverty line. Among the single-parent households, those with no children have the highest poverty rate, with 1 household (4.3%) living below poverty.
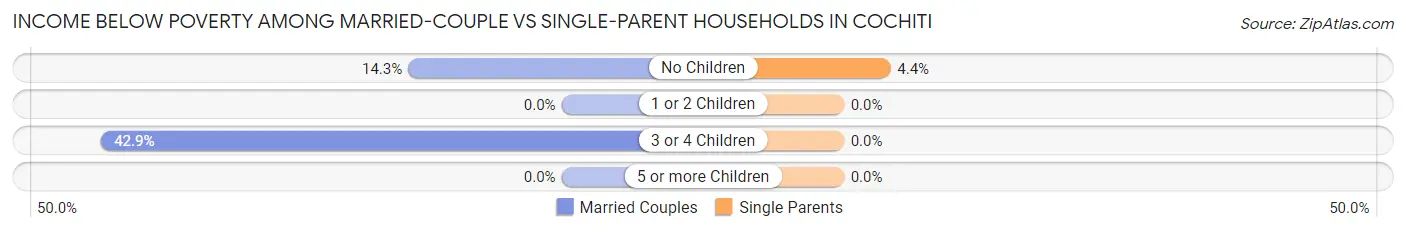
| Children | Married-Couple Families | Single-Parent Households |
| No Children | 4 (14.3%) | 1 (4.3%) |
| 1 or 2 Children | 0 (0.0%) | 0 (0.0%) |
| 3 or 4 Children | 3 (42.9%) | 0 (0.0%) |
| 5 or more Children | 0 (0.0%) | 0 (0.0%) |
| Total | 7 (13.2%) | 1 (1.9%) |
Race in Cochiti
The most populous races in Cochiti are Native / Alaskan (450 | 93.0%), Hispanic or Latino (26 | 5.4%), and Two or more Races (23 | 4.8%).
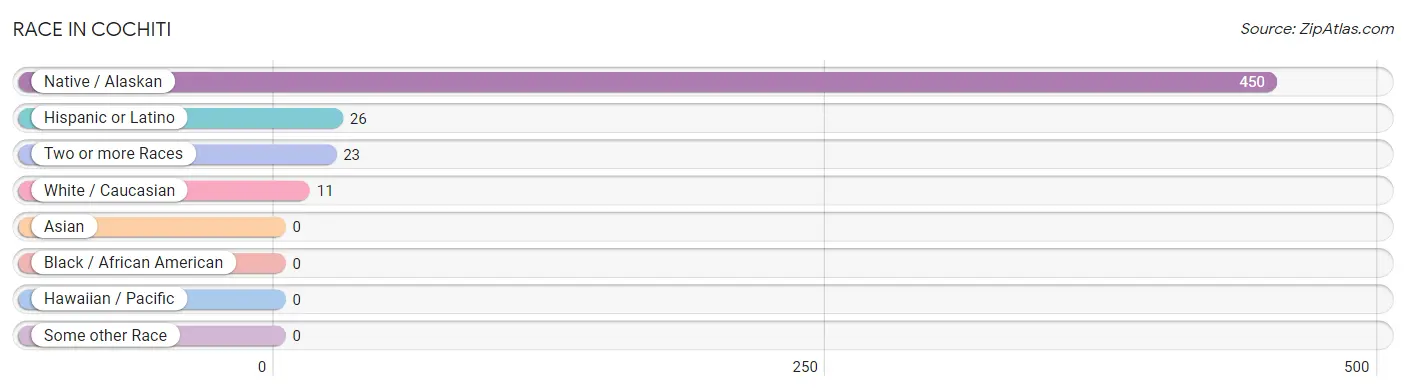
| Race | # Population | % Population |
| Asian | 0 | 0.0% |
| Black / African American | 0 | 0.0% |
| Hawaiian / Pacific | 0 | 0.0% |
| Hispanic or Latino | 26 | 5.4% |
| Native / Alaskan | 450 | 93.0% |
| White / Caucasian | 11 | 2.3% |
| Two or more Races | 23 | 4.8% |
| Some other Race | 0 | 0.0% |
| Total | 484 | 100.0% |
Ancestry in Cochiti
The most populous ancestries reported in Cochiti are Pueblo (440 | 90.9%), Mexican (20 | 4.1%), Mexican American Indian (19 | 3.9%), Navajo (18 | 3.7%), and Polish (16 | 3.3%), together accounting for 106.0% of all Cochiti residents.
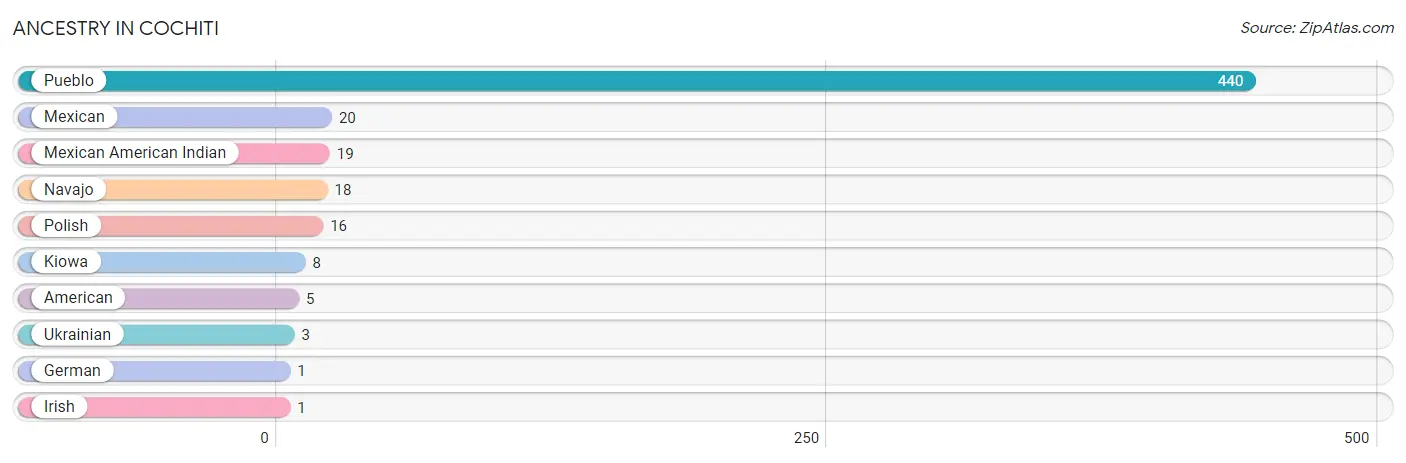
| Ancestry | # Population | % Population |
| American | 5 | 1.0% |
| German | 1 | 0.2% |
| Irish | 1 | 0.2% |
| Kiowa | 8 | 1.7% |
| Mexican | 20 | 4.1% |
| Mexican American Indian | 19 | 3.9% |
| Navajo | 18 | 3.7% |
| Polish | 16 | 3.3% |
| Pueblo | 440 | 90.9% |
| Ukrainian | 3 | 0.6% | View All 10 Rows |
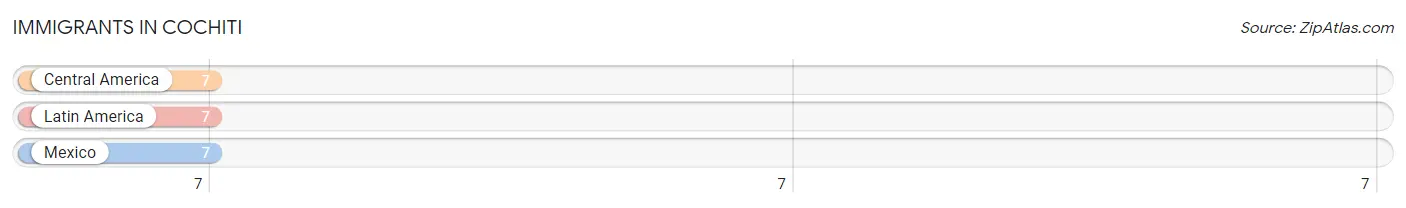
Immigrants in Cochiti
The most numerous immigrant groups reported in Cochiti came from Central America (7 | 1.5%), Latin America (7 | 1.5%), and Mexico (7 | 1.5%), together accounting for 4.4% of all Cochiti residents.
| Immigration Origin | # Population | % Population |
| Central America | 7 | 1.5% |
| Latin America | 7 | 1.5% |
| Mexico | 7 | 1.5% | View All 3 Rows |
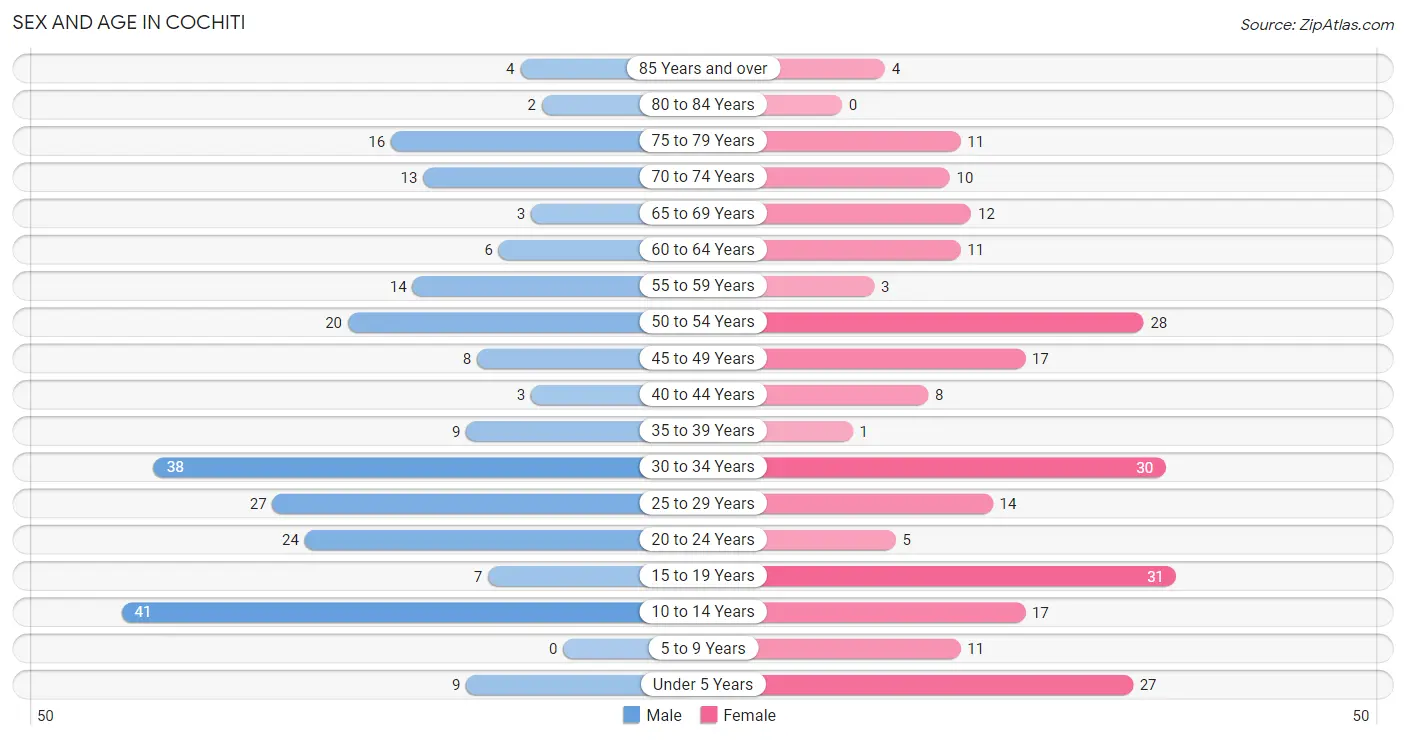
Sex and Age in Cochiti
Sex and Age in Cochiti
The most populous age groups in Cochiti are 10 to 14 Years (41 | 16.8%) for men and 15 to 19 Years (31 | 12.9%) for women.
| Age Bracket | Male | Female |
| Under 5 Years | 9 (3.7%) | 27 (11.3%) |
| 5 to 9 Years | 0 (0.0%) | 11 (4.6%) |
| 10 to 14 Years | 41 (16.8%) | 17 (7.1%) |
| 15 to 19 Years | 7 (2.9%) | 31 (12.9%) |
| 20 to 24 Years | 24 (9.8%) | 5 (2.1%) |
| 25 to 29 Years | 27 (11.1%) | 14 (5.8%) |
| 30 to 34 Years | 38 (15.6%) | 30 (12.5%) |
| 35 to 39 Years | 9 (3.7%) | 1 (0.4%) |
| 40 to 44 Years | 3 (1.2%) | 8 (3.3%) |
| 45 to 49 Years | 8 (3.3%) | 17 (7.1%) |
| 50 to 54 Years | 20 (8.2%) | 28 (11.7%) |
| 55 to 59 Years | 14 (5.7%) | 3 (1.3%) |
| 60 to 64 Years | 6 (2.5%) | 11 (4.6%) |
| 65 to 69 Years | 3 (1.2%) | 12 (5.0%) |
| 70 to 74 Years | 13 (5.3%) | 10 (4.2%) |
| 75 to 79 Years | 16 (6.6%) | 11 (4.6%) |
| 80 to 84 Years | 2 (0.8%) | 0 (0.0%) |
| 85 Years and over | 4 (1.6%) | 4 (1.7%) |
| Total | 244 (100.0%) | 240 (100.0%) |
Families and Households in Cochiti
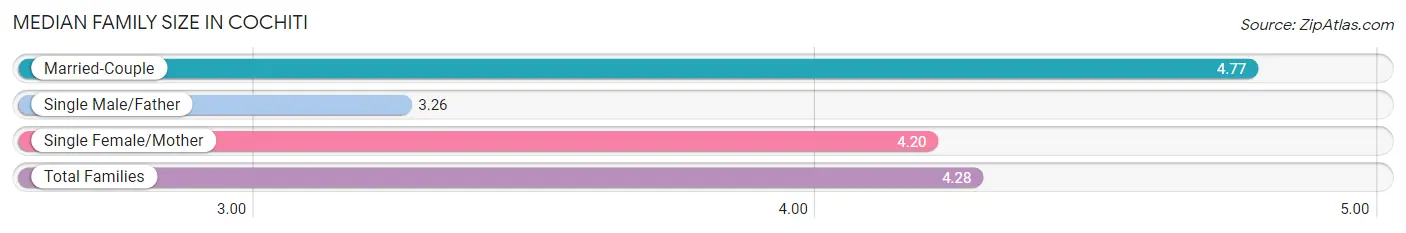
Median Family Size in Cochiti
The median family size in Cochiti is 4.28 persons per family, with married-couple families (53 | 50.0%) accounting for the largest median family size of 4.77 persons per family. On the other hand, single male/father families (23 | 21.7%) represent the smallest median family size with 3.26 persons per family.
| Family Type | # Families | Family Size |
| Married-Couple | 53 (50.0%) | 4.77 |
| Single Male/Father | 23 (21.7%) | 3.26 |
| Single Female/Mother | 30 (28.3%) | 4.20 |
| Total Families | 106 (100.0%) | 4.28 |
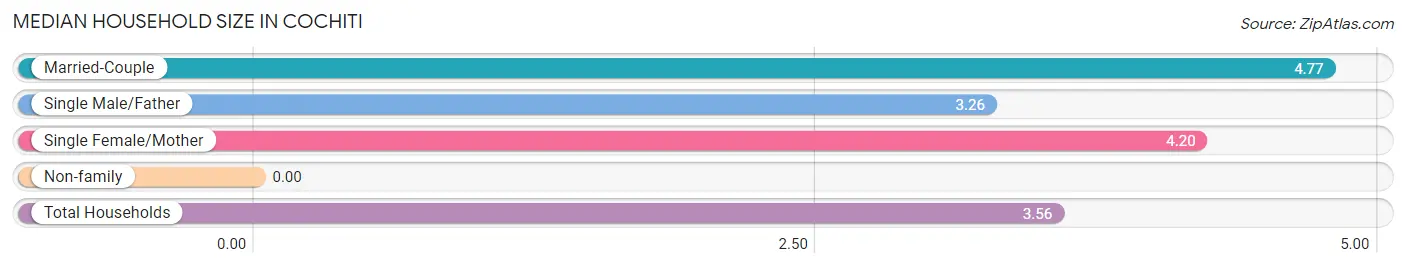
Median Household Size in Cochiti
| Household Type | # Households | Household Size |
| Married-Couple | 53 (39.0%) | 4.77 |
| Single Male/Father | 23 (16.9%) | 3.26 |
| Single Female/Mother | 30 (22.1%) | 4.20 |
| Non-family | 30 (22.1%) | - |
| Total Households | 136 (100.0%) | 3.56 |
Household Size by Marriage Status in Cochiti
Out of a total of 136 households in Cochiti, 106 (77.9%) are family households, while 30 (22.1%) are nonfamily households. The most numerous type of family households are 3-person households, comprising 32, and the most common type of nonfamily households are 1-person households, comprising 30.
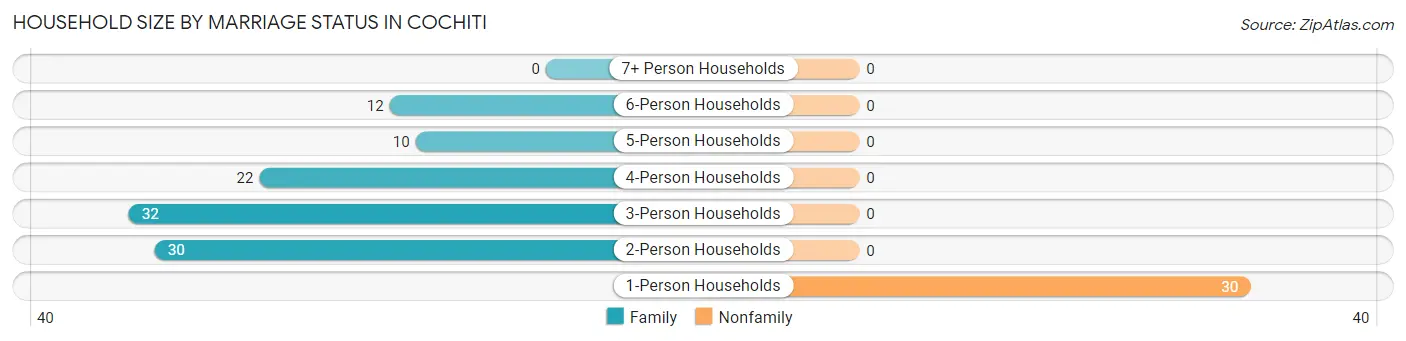
| Household Size | Family Households | Nonfamily Households |
| 1-Person Households | - | 30 (22.1%) |
| 2-Person Households | 30 (22.1%) | 0 (0.0%) |
| 3-Person Households | 32 (23.5%) | 0 (0.0%) |
| 4-Person Households | 22 (16.2%) | 0 (0.0%) |
| 5-Person Households | 10 (7.3%) | 0 (0.0%) |
| 6-Person Households | 12 (8.8%) | 0 (0.0%) |
| 7+ Person Households | 0 (0.0%) | 0 (0.0%) |
| Total | 106 (77.9%) | 30 (22.1%) |
Female Fertility in Cochiti
Fertility by Age in Cochiti
Average fertility rate in Cochiti is 47.0 births per 1,000 women. Women in the age bracket of 20 to 34 years have the highest fertility rate with 102.0 births per 1,000 women. Women in the age bracket of 20 to 34 years acount for 100.0% of all women with births.
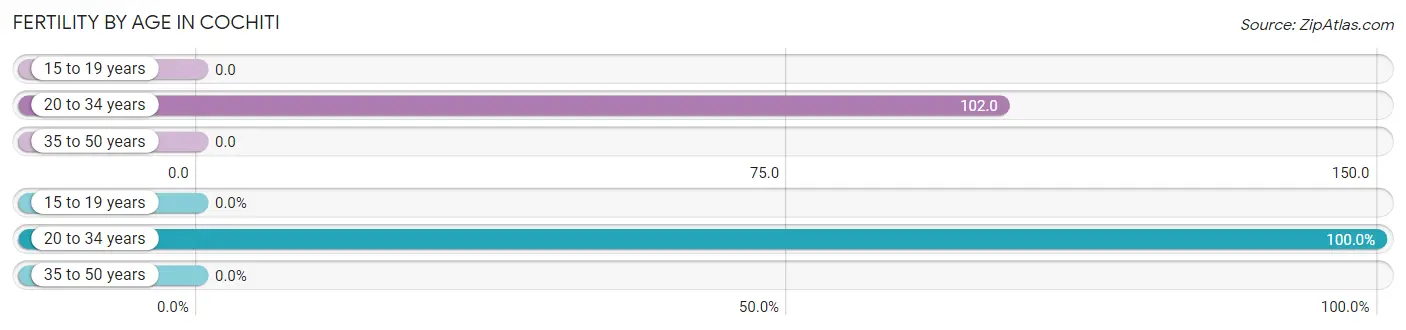
| Age Bracket | Women with Births | Births / 1,000 Women |
| 15 to 19 years | 0 (0.0%) | 0.0 |
| 20 to 34 years | 5 (100.0%) | 102.0 |
| 35 to 50 years | 0 (0.0%) | 0.0 |
| Total | 5 (100.0%) | 47.0 |
Fertility by Age by Marriage Status in Cochiti
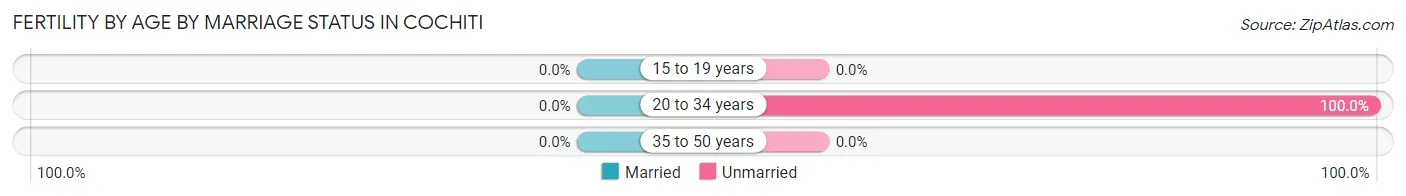
| Age Bracket | Married | Unmarried |
| 15 to 19 years | 0 (0.0%) | 0 (0.0%) |
| 20 to 34 years | 0 (0.0%) | 5 (100.0%) |
| 35 to 50 years | 0 (0.0%) | 0 (0.0%) |
| Total | 0 (0.0%) | 5 (100.0%) |
Fertility by Education in Cochiti
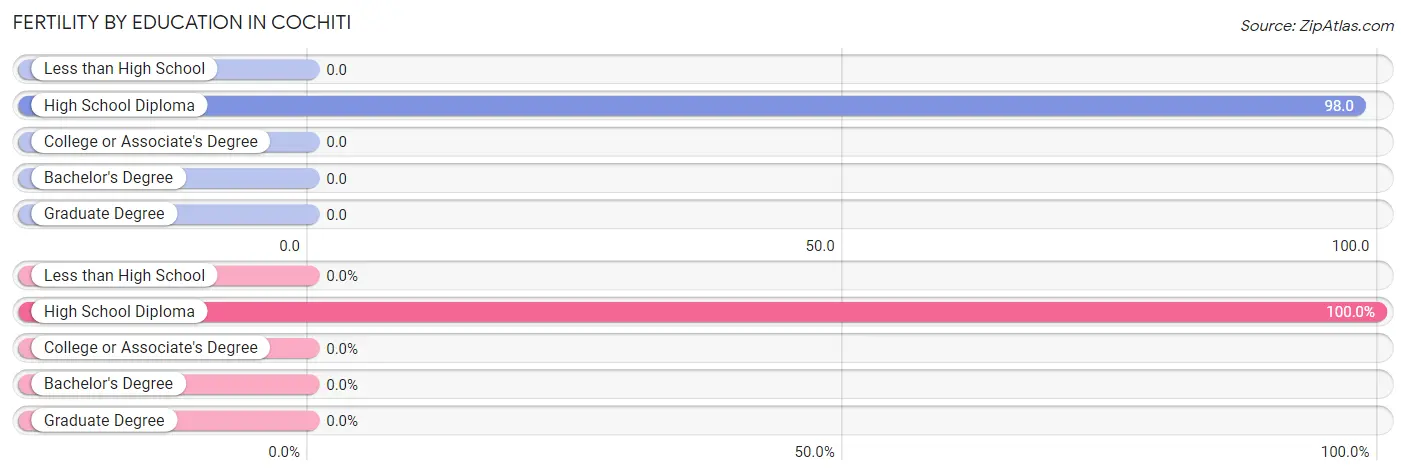
| Educational Attainment | Women with Births | Births / 1,000 Women |
| Less than High School | 0 (0.0%) | 0.0 |
| High School Diploma | 5 (100.0%) | 98.0 |
| College or Associate's Degree | 0 (0.0%) | 0.0 |
| Bachelor's Degree | 0 (0.0%) | 0.0 |
| Graduate Degree | 0 (0.0%) | 0.0 |
| Total | 5 (100.0%) | 47.0 |
Fertility by Education by Marriage Status in Cochiti
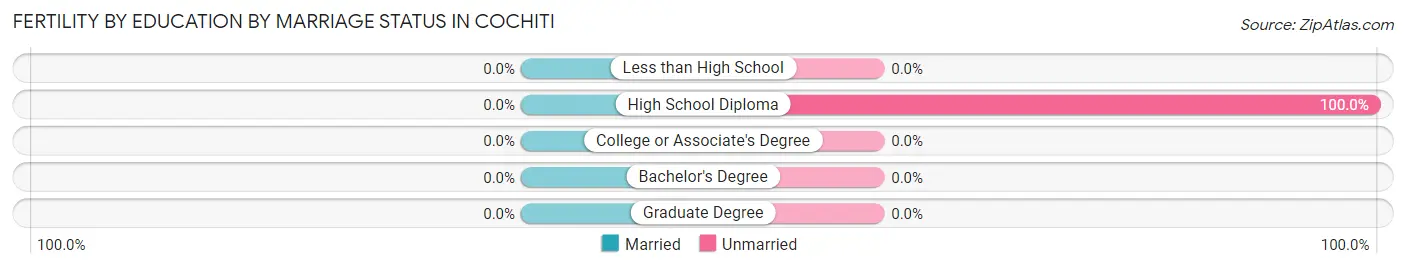
| Educational Attainment | Married | Unmarried |
| Less than High School | 0 (0.0%) | 0 (0.0%) |
| High School Diploma | 0 (0.0%) | 5 (100.0%) |
| College or Associate's Degree | 0 (0.0%) | 0 (0.0%) |
| Bachelor's Degree | 0 (0.0%) | 0 (0.0%) |
| Graduate Degree | 0 (0.0%) | 0 (0.0%) |
| Total | 0 (0.0%) | 5 (100.0%) |
Employment Characteristics in Cochiti
Employment by Class of Employer in Cochiti
Among the 231 employed individuals in Cochiti, private company employees (81 | 35.1%), local government employees (50 | 21.6%), and state government employees (26 | 11.3%) make up the most common classes of employment.

| Employer Class | # Employees | % Employees |
| Private Company Employees | 81 | 35.1% |
| Self-Employed (Incorporated) | 0 | 0.0% |
| Self-Employed (Not Incorporated) | 23 | 10.0% |
| Not-for-profit Organizations | 25 | 10.8% |
| Local Government Employees | 50 | 21.6% |
| State Government Employees | 26 | 11.3% |
| Federal Government Employees | 26 | 11.3% |
| Unpaid Family Workers | 0 | 0.0% |
| Total | 231 | 100.0% |
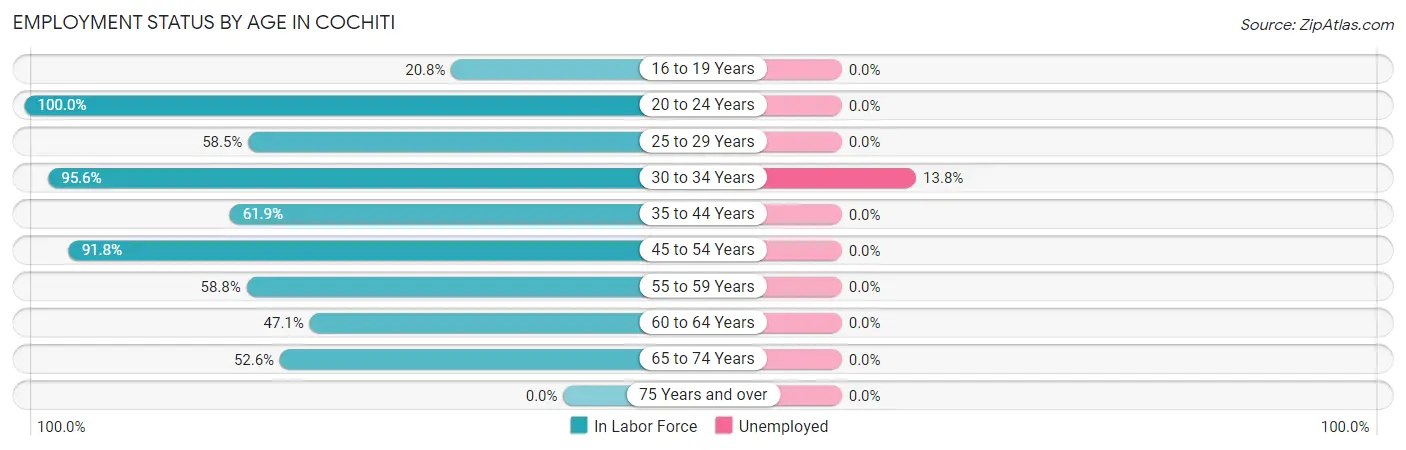
Employment Status by Age in Cochiti
According to the labor force statistics for Cochiti, out of the total population over 16 years of age (365), 66.0% or 241 individuals are in the labor force, with 3.7% or 9 of them unemployed. The age group with the highest labor force participation rate is 20 to 24 years, with 100.0% or 29 individuals in the labor force. Within the labor force, the 30 to 34 years age range has the highest percentage of unemployed individuals, with 13.8% or 9 of them being unemployed.
| Age Bracket | In Labor Force | Unemployed |
| 16 to 19 Years | 5 (20.8%) | 0 (0.0%) |
| 20 to 24 Years | 29 (100.0%) | 0 (0.0%) |
| 25 to 29 Years | 24 (58.5%) | 0 (0.0%) |
| 30 to 34 Years | 65 (95.6%) | 9 (13.8%) |
| 35 to 44 Years | 13 (61.9%) | 0 (0.0%) |
| 45 to 54 Years | 67 (91.8%) | 0 (0.0%) |
| 55 to 59 Years | 10 (58.8%) | 0 (0.0%) |
| 60 to 64 Years | 8 (47.1%) | 0 (0.0%) |
| 65 to 74 Years | 20 (52.6%) | 0 (0.0%) |
| 75 Years and over | 0 (0.0%) | 0 (0.0%) |
| Total | 241 (66.0%) | 9 (3.7%) |
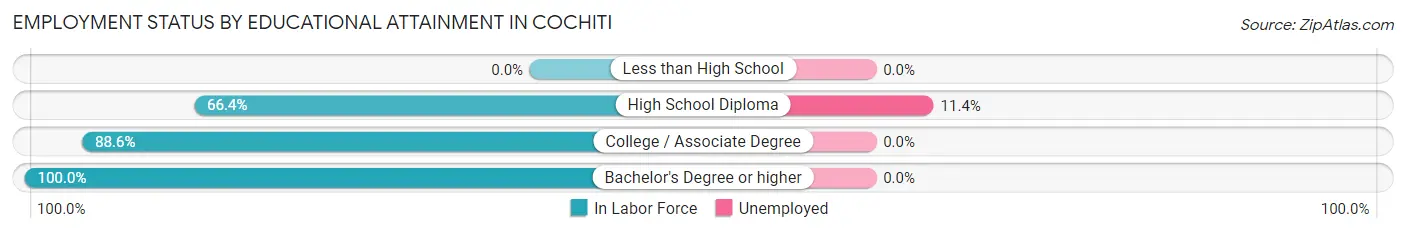
Employment Status by Educational Attainment in Cochiti
According to labor force statistics for Cochiti, 78.9% of individuals (187) out of the total population between 25 and 64 years of age (237) are in the labor force, with 4.8% or 9 of them being unemployed. The group with the highest labor force participation rate are those with the educational attainment of bachelor's degree or higher, with 100.0% or 30 individuals in the labor force. Within the labor force, individuals with high school diploma education have the highest percentage of unemployment, with 11.4% or 9 of them being unemployed.
| Educational Attainment | In Labor Force | Unemployed |
| Less than High School | 0 (0.0%) | 0 (0.0%) |
| High School Diploma | 79 (66.4%) | 14 (11.4%) |
| College / Associate Degree | 78 (88.6%) | 0 (0.0%) |
| Bachelor's Degree or higher | 30 (100.0%) | 0 (0.0%) |
| Total | 187 (78.9%) | 11 (4.8%) |
Employment Occupations by Sex in Cochiti
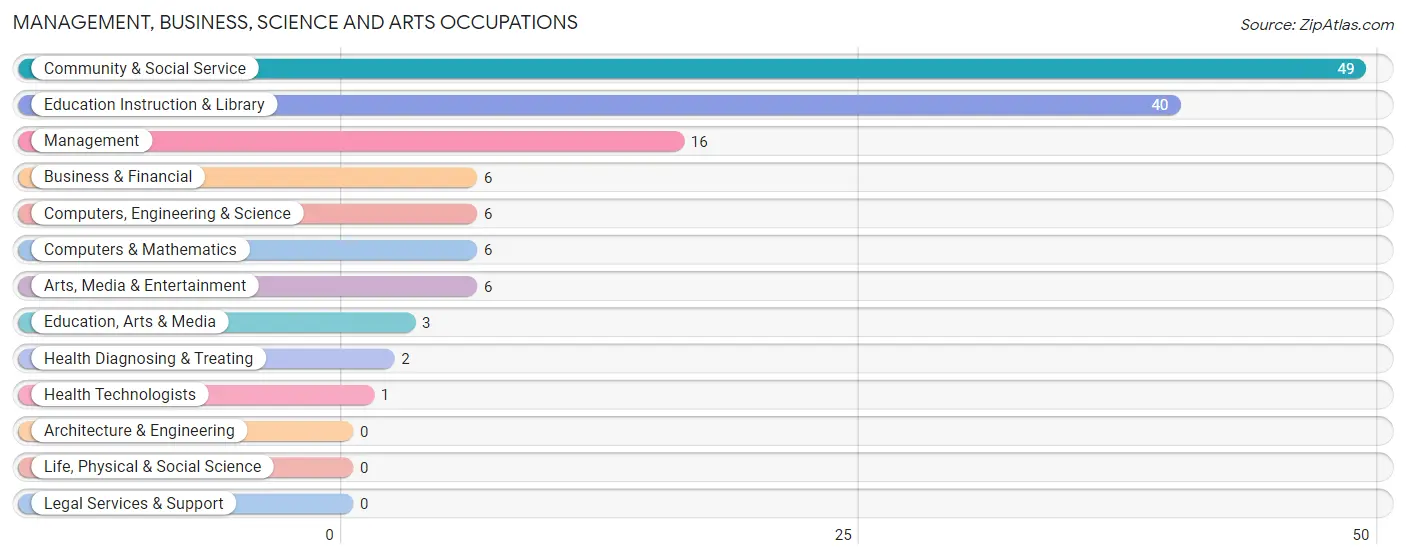
Management, Business, Science and Arts Occupations
The most common Management, Business, Science and Arts occupations in Cochiti are Community & Social Service (49 | 21.1%), Education Instruction & Library (40 | 17.2%), Management (16 | 6.9%), Business & Financial (6 | 2.6%), and Computers, Engineering & Science (6 | 2.6%).
Management, Business, Science and Arts Occupations by Sex
Within the Management, Business, Science and Arts occupations in Cochiti, the most male-oriented occupations are Computers, Engineering & Science (100.0%), Computers & Mathematics (100.0%), and Arts, Media & Entertainment (100.0%), while the most female-oriented occupations are Business & Financial (100.0%), Education, Arts & Media (100.0%), and Health Diagnosing & Treating (100.0%).
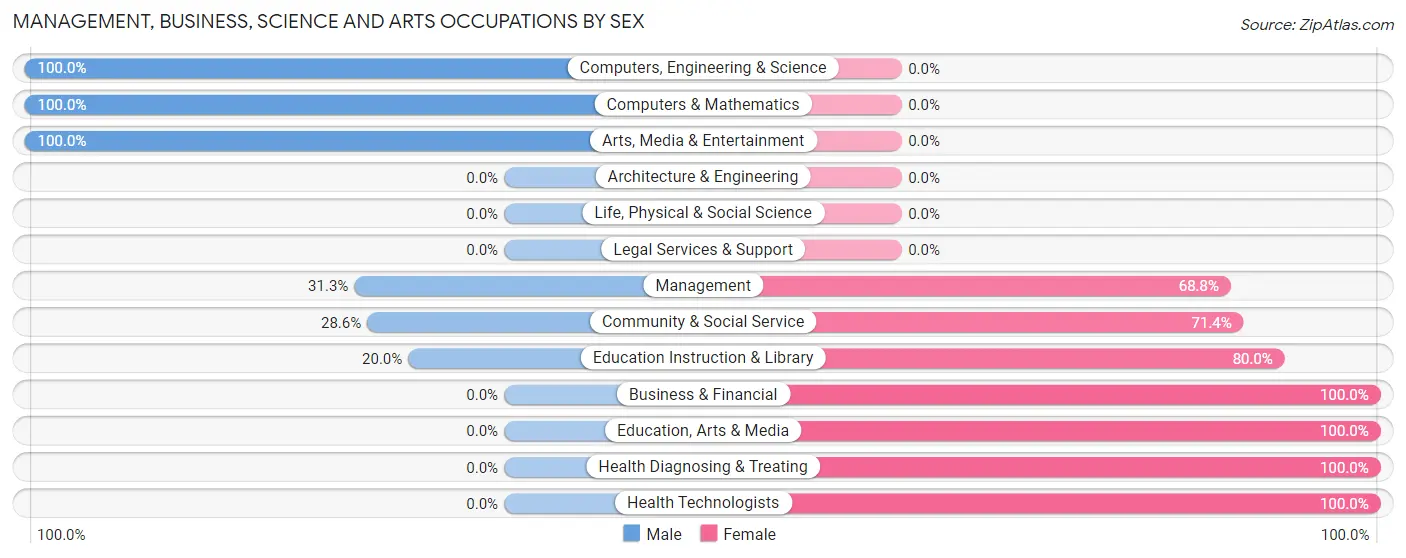
| Occupation | Male | Female |
| Management | 5 (31.2%) | 11 (68.8%) |
| Business & Financial | 0 (0.0%) | 6 (100.0%) |
| Computers, Engineering & Science | 6 (100.0%) | 0 (0.0%) |
| Computers & Mathematics | 6 (100.0%) | 0 (0.0%) |
| Architecture & Engineering | 0 (0.0%) | 0 (0.0%) |
| Life, Physical & Social Science | 0 (0.0%) | 0 (0.0%) |
| Community & Social Service | 14 (28.6%) | 35 (71.4%) |
| Education, Arts & Media | 0 (0.0%) | 3 (100.0%) |
| Legal Services & Support | 0 (0.0%) | 0 (0.0%) |
| Education Instruction & Library | 8 (20.0%) | 32 (80.0%) |
| Arts, Media & Entertainment | 6 (100.0%) | 0 (0.0%) |
| Health Diagnosing & Treating | 0 (0.0%) | 2 (100.0%) |
| Health Technologists | 0 (0.0%) | 1 (100.0%) |
| Total (Category) | 25 (31.7%) | 54 (68.3%) |
| Total (Overall) | 125 (53.9%) | 107 (46.1%) |
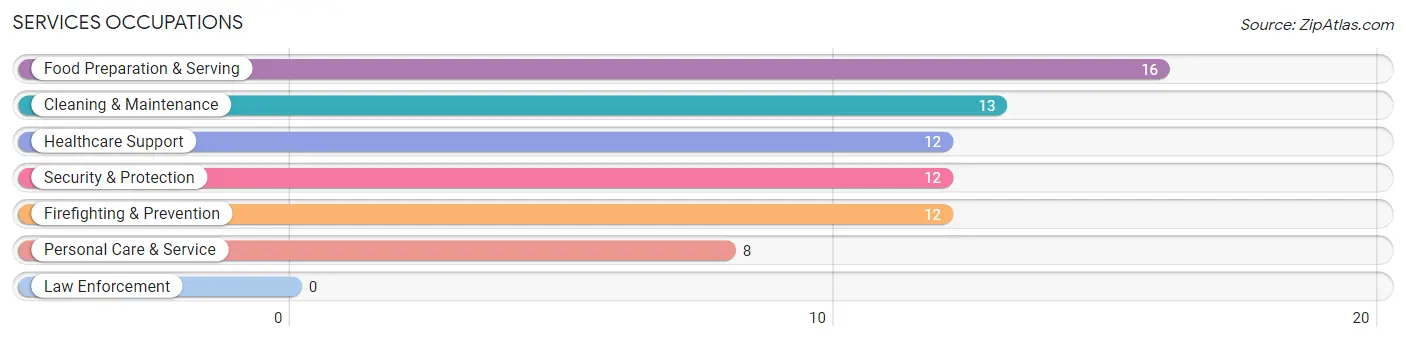
Services Occupations
The most common Services occupations in Cochiti are Food Preparation & Serving (16 | 6.9%), Cleaning & Maintenance (13 | 5.6%), Healthcare Support (12 | 5.2%), Security & Protection (12 | 5.2%), and Firefighting & Prevention (12 | 5.2%).
Services Occupations by Sex
Within the Services occupations in Cochiti, the most male-oriented occupations are Security & Protection (100.0%), Firefighting & Prevention (100.0%), and Cleaning & Maintenance (100.0%), while the most female-oriented occupations are Healthcare Support (100.0%), Food Preparation & Serving (81.2%), and Personal Care & Service (50.0%).
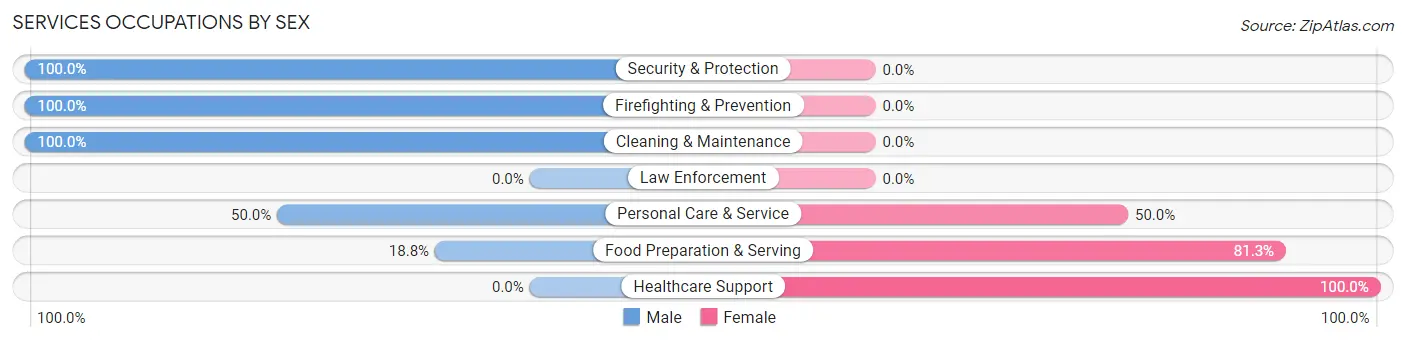
| Occupation | Male | Female |
| Healthcare Support | 0 (0.0%) | 12 (100.0%) |
| Security & Protection | 12 (100.0%) | 0 (0.0%) |
| Firefighting & Prevention | 12 (100.0%) | 0 (0.0%) |
| Law Enforcement | 0 (0.0%) | 0 (0.0%) |
| Food Preparation & Serving | 3 (18.8%) | 13 (81.2%) |
| Cleaning & Maintenance | 13 (100.0%) | 0 (0.0%) |
| Personal Care & Service | 4 (50.0%) | 4 (50.0%) |
| Total (Category) | 32 (52.5%) | 29 (47.5%) |
| Total (Overall) | 125 (53.9%) | 107 (46.1%) |
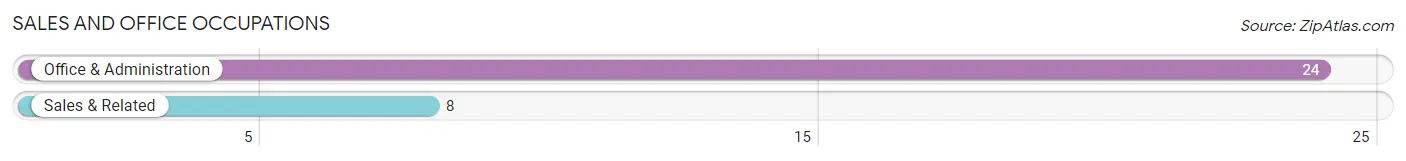
Sales and Office Occupations
The most common Sales and Office occupations in Cochiti are Office & Administration (24 | 10.3%), and Sales & Related (8 | 3.5%).
Sales and Office Occupations by Sex
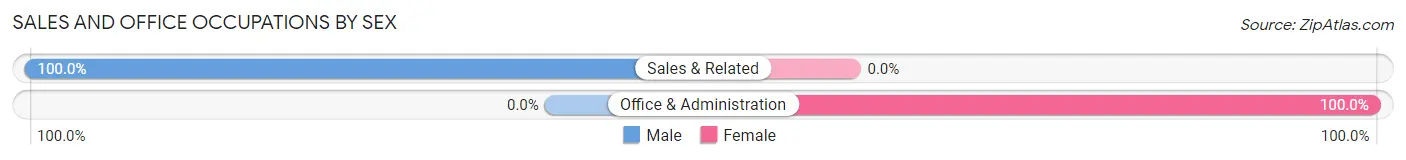
| Occupation | Male | Female |
| Sales & Related | 8 (100.0%) | 0 (0.0%) |
| Office & Administration | 0 (0.0%) | 24 (100.0%) |
| Total (Category) | 8 (25.0%) | 24 (75.0%) |
| Total (Overall) | 125 (53.9%) | 107 (46.1%) |
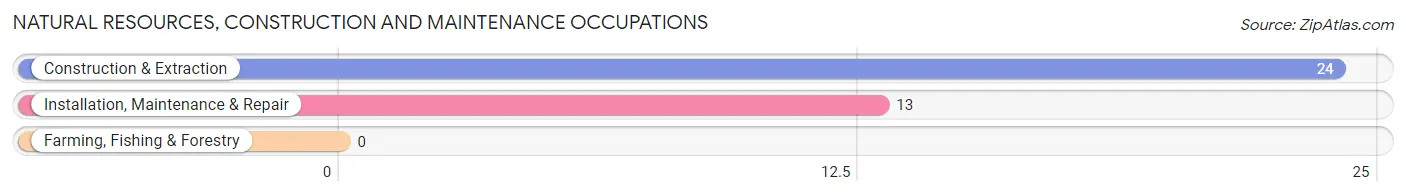
Natural Resources, Construction and Maintenance Occupations
The most common Natural Resources, Construction and Maintenance occupations in Cochiti are Construction & Extraction (24 | 10.3%), and Installation, Maintenance & Repair (13 | 5.6%).
Natural Resources, Construction and Maintenance Occupations by Sex
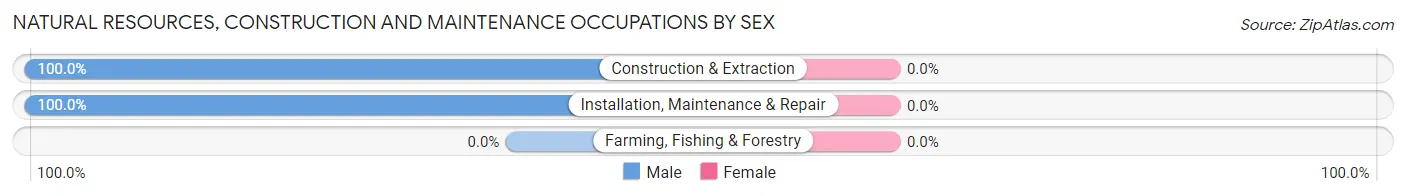
| Occupation | Male | Female |
| Farming, Fishing & Forestry | 0 (0.0%) | 0 (0.0%) |
| Construction & Extraction | 24 (100.0%) | 0 (0.0%) |
| Installation, Maintenance & Repair | 13 (100.0%) | 0 (0.0%) |
| Total (Category) | 37 (100.0%) | 0 (0.0%) |
| Total (Overall) | 125 (53.9%) | 107 (46.1%) |
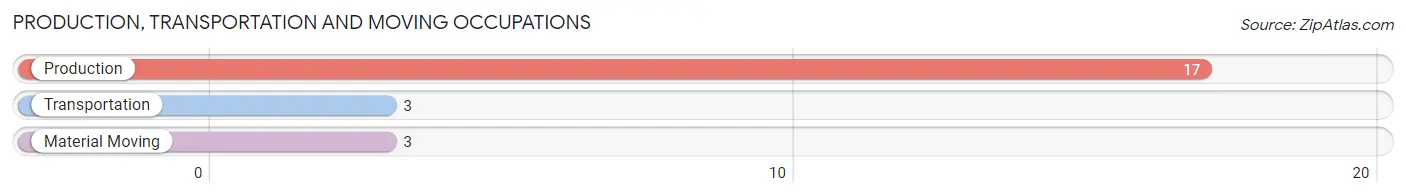
Production, Transportation and Moving Occupations
The most common Production, Transportation and Moving occupations in Cochiti are Production (17 | 7.3%), Transportation (3 | 1.3%), and Material Moving (3 | 1.3%).
Production, Transportation and Moving Occupations by Sex
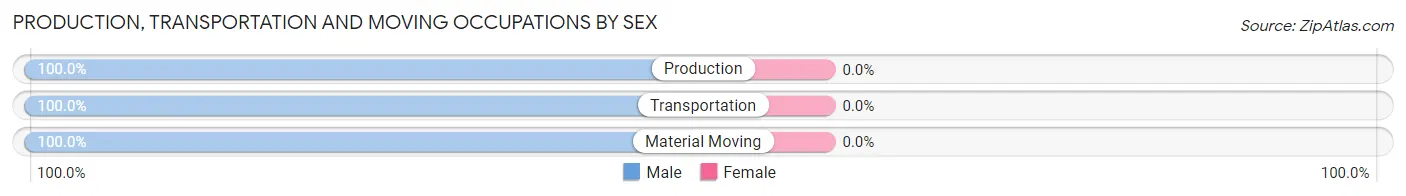
| Occupation | Male | Female |
| Production | 17 (100.0%) | 0 (0.0%) |
| Transportation | 3 (100.0%) | 0 (0.0%) |
| Material Moving | 3 (100.0%) | 0 (0.0%) |
| Total (Category) | 23 (100.0%) | 0 (0.0%) |
| Total (Overall) | 125 (53.9%) | 107 (46.1%) |
Employment Industries by Sex in Cochiti
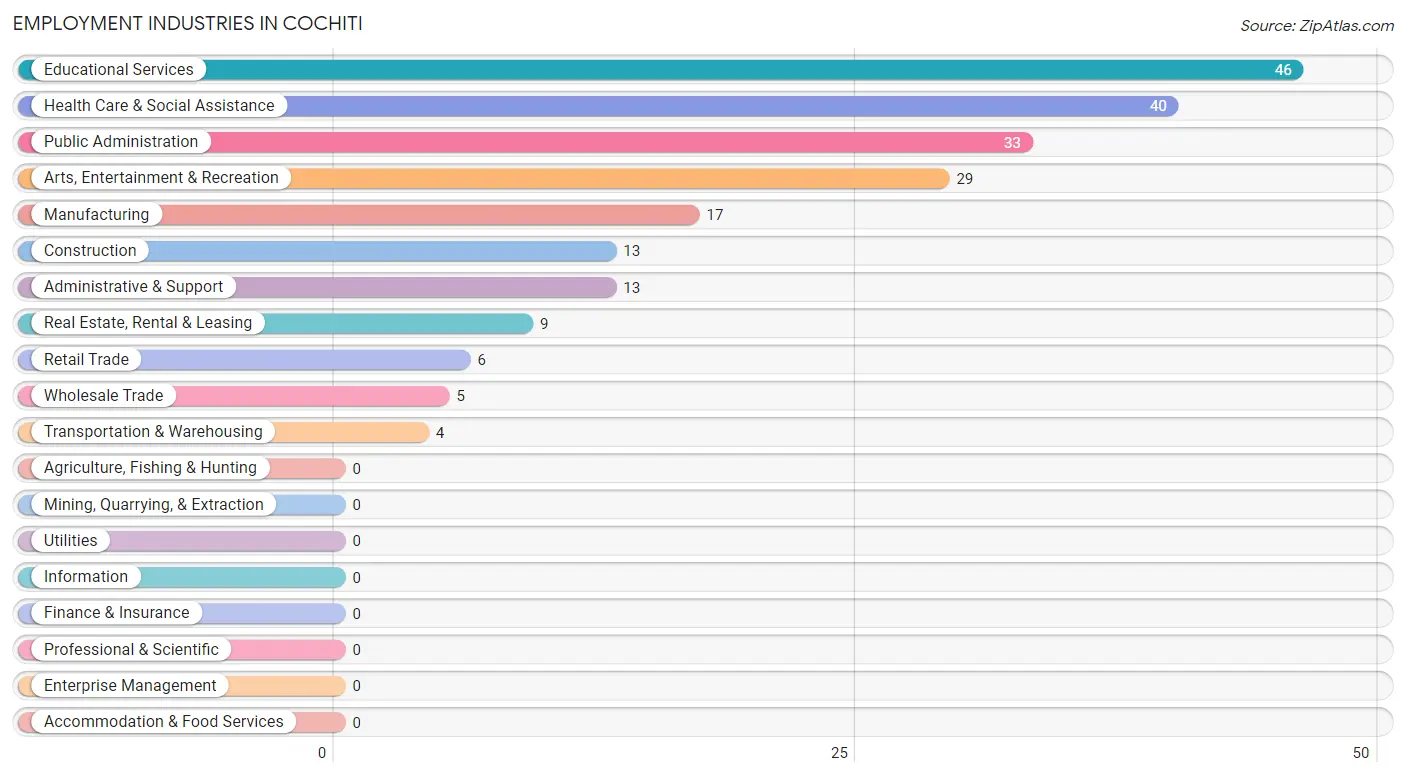
Employment Industries in Cochiti
The major employment industries in Cochiti include Educational Services (46 | 19.8%), Health Care & Social Assistance (40 | 17.2%), Public Administration (33 | 14.2%), Arts, Entertainment & Recreation (29 | 12.5%), and Manufacturing (17 | 7.3%).
Employment Industries by Sex in Cochiti
The Cochiti industries that see more men than women are Construction (100.0%), Manufacturing (100.0%), and Wholesale Trade (100.0%), whereas the industries that tend to have a higher number of women are Health Care & Social Assistance (100.0%), Educational Services (82.6%), and Public Administration (51.5%).
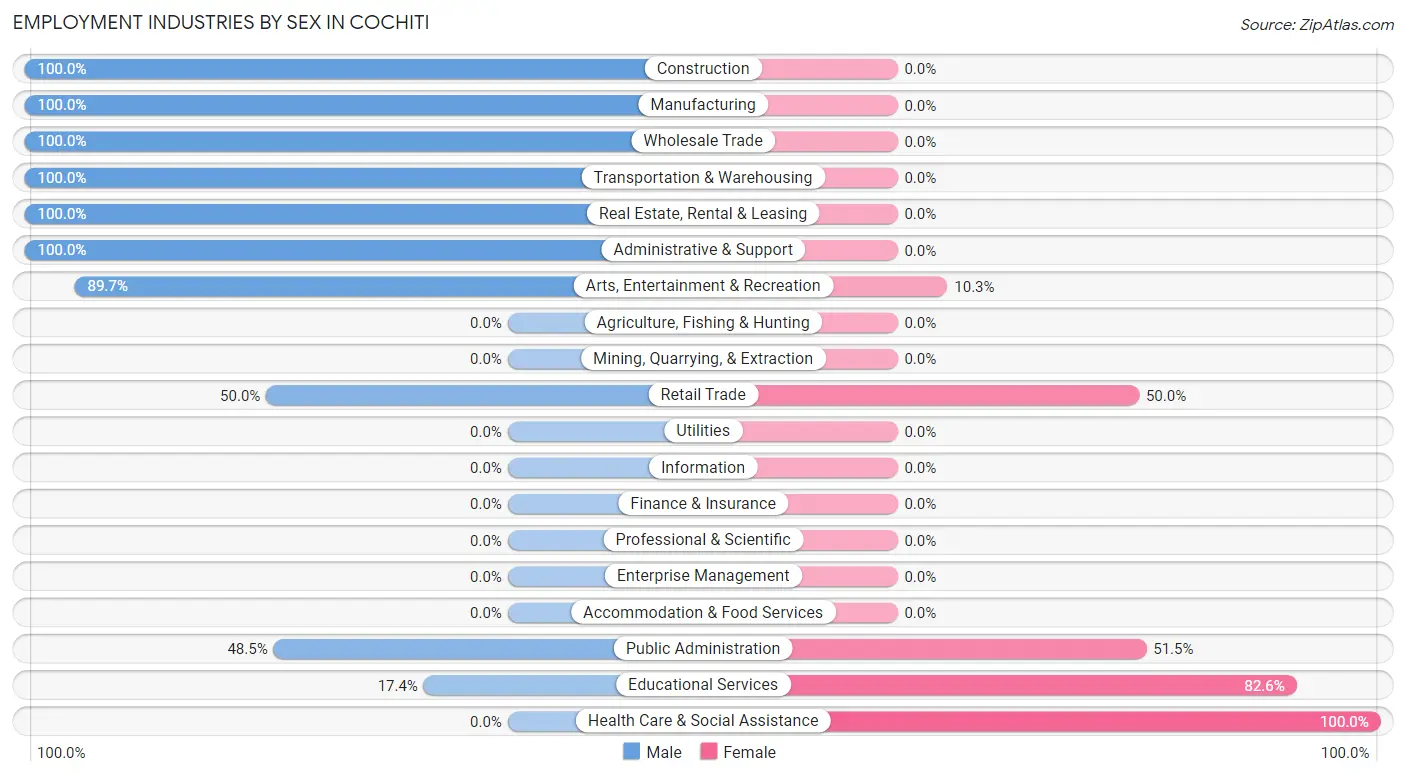
| Industry | Male | Female |
| Agriculture, Fishing & Hunting | 0 (0.0%) | 0 (0.0%) |
| Mining, Quarrying, & Extraction | 0 (0.0%) | 0 (0.0%) |
| Construction | 13 (100.0%) | 0 (0.0%) |
| Manufacturing | 17 (100.0%) | 0 (0.0%) |
| Wholesale Trade | 5 (100.0%) | 0 (0.0%) |
| Retail Trade | 3 (50.0%) | 3 (50.0%) |
| Transportation & Warehousing | 4 (100.0%) | 0 (0.0%) |
| Utilities | 0 (0.0%) | 0 (0.0%) |
| Information | 0 (0.0%) | 0 (0.0%) |
| Finance & Insurance | 0 (0.0%) | 0 (0.0%) |
| Real Estate, Rental & Leasing | 9 (100.0%) | 0 (0.0%) |
| Professional & Scientific | 0 (0.0%) | 0 (0.0%) |
| Enterprise Management | 0 (0.0%) | 0 (0.0%) |
| Administrative & Support | 13 (100.0%) | 0 (0.0%) |
| Educational Services | 8 (17.4%) | 38 (82.6%) |
| Health Care & Social Assistance | 0 (0.0%) | 40 (100.0%) |
| Arts, Entertainment & Recreation | 26 (89.7%) | 3 (10.3%) |
| Accommodation & Food Services | 0 (0.0%) | 0 (0.0%) |
| Public Administration | 16 (48.5%) | 17 (51.5%) |
| Total | 125 (53.9%) | 107 (46.1%) |
Education in Cochiti
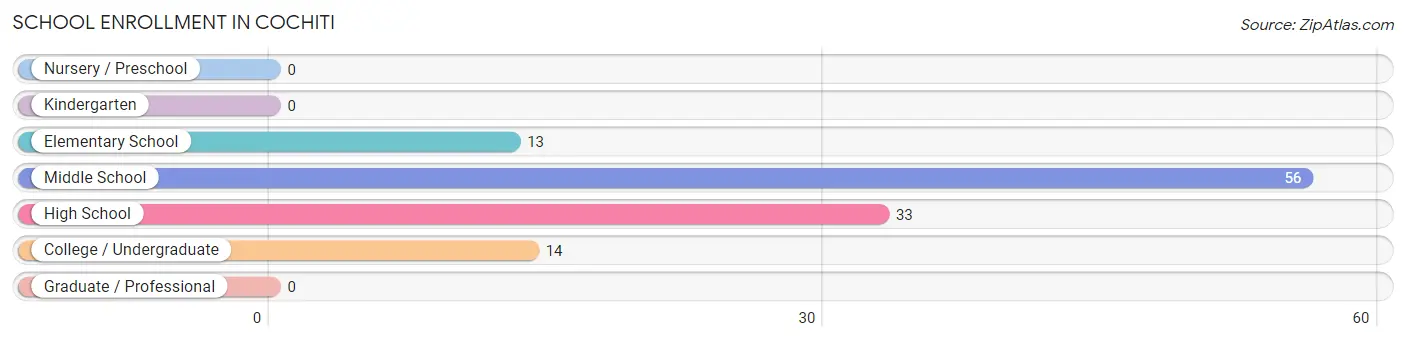
School Enrollment in Cochiti
The most common levels of schooling among the 116 students in Cochiti are middle school (56 | 48.3%), high school (33 | 28.4%), and college / undergraduate (14 | 12.1%).
| School Level | # Students | % Students |
| Nursery / Preschool | 0 | 0.0% |
| Kindergarten | 0 | 0.0% |
| Elementary School | 13 | 11.2% |
| Middle School | 56 | 48.3% |
| High School | 33 | 28.4% |
| College / Undergraduate | 14 | 12.1% |
| Graduate / Professional | 0 | 0.0% |
| Total | 116 | 100.0% |
School Enrollment by Age by Funding Source in Cochiti
Out of a total of 116 students who are enrolled in schools in Cochiti, 42 (36.2%) attend a private institution, while the remaining 74 (63.8%) are enrolled in public schools. The age group of 20 to 24 year olds has the highest likelihood of being enrolled in private schools, with 13 (100.0% in the age bracket) enrolled. Conversely, the age group of 25 to 34 year olds has the lowest likelihood of being enrolled in a private school, with 1 (100.0% in the age bracket) attending a public institution.
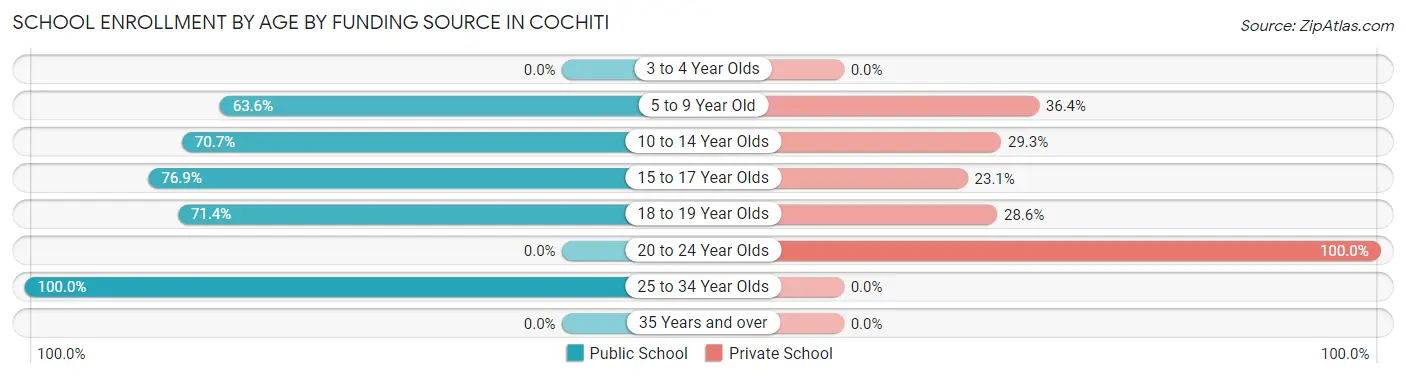
| Age Bracket | Public School | Private School |
| 3 to 4 Year Olds | 0 (0.0%) | 0 (0.0%) |
| 5 to 9 Year Old | 7 (63.6%) | 4 (36.4%) |
| 10 to 14 Year Olds | 41 (70.7%) | 17 (29.3%) |
| 15 to 17 Year Olds | 20 (76.9%) | 6 (23.1%) |
| 18 to 19 Year Olds | 5 (71.4%) | 2 (28.6%) |
| 20 to 24 Year Olds | 0 (0.0%) | 13 (100.0%) |
| 25 to 34 Year Olds | 1 (100.0%) | 0 (0.0%) |
| 35 Years and over | 0 (0.0%) | 0 (0.0%) |
| Total | 74 (63.8%) | 42 (36.2%) |
Educational Attainment by Field of Study in Cochiti
Social sciences (19 | 44.2%), education (13 | 30.2%), science & technology (5 | 11.6%), visual & performing arts (5 | 11.6%), and liberal arts & history (1 | 2.3%) are the most common fields of study among 43 individuals in Cochiti who have obtained a bachelor's degree or higher.
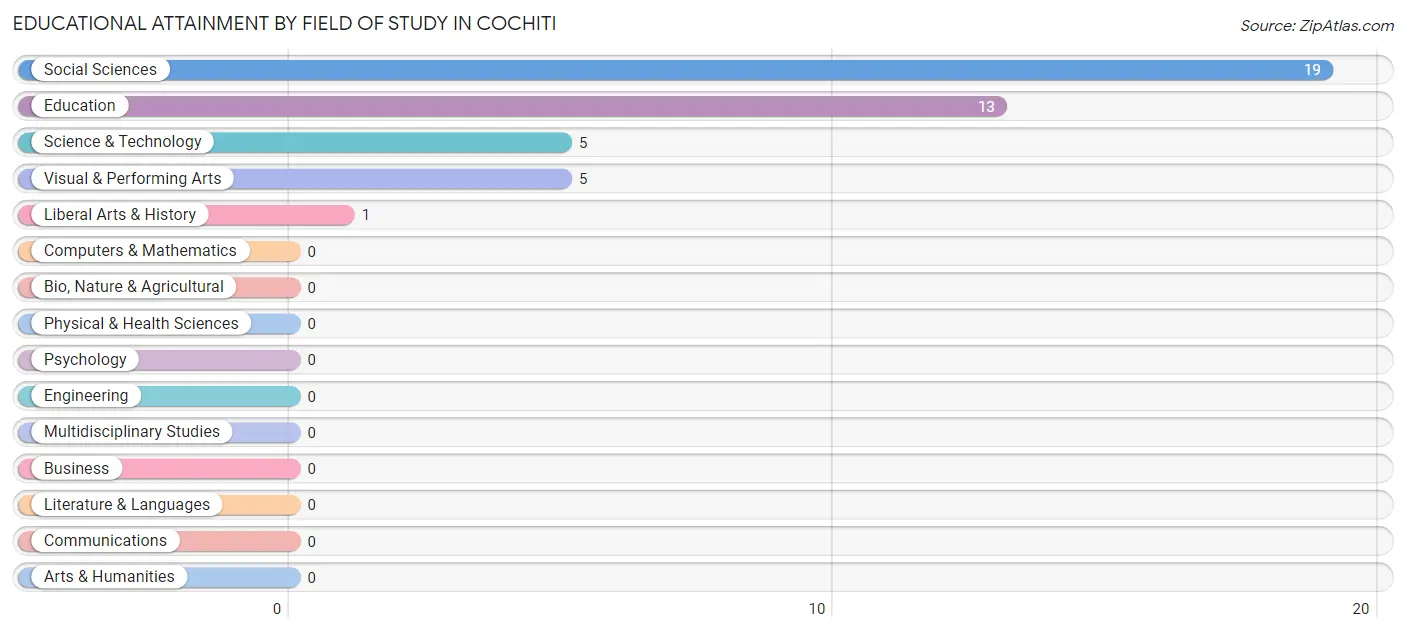
| Field of Study | # Graduates | % Graduates |
| Computers & Mathematics | 0 | 0.0% |
| Bio, Nature & Agricultural | 0 | 0.0% |
| Physical & Health Sciences | 0 | 0.0% |
| Psychology | 0 | 0.0% |
| Social Sciences | 19 | 44.2% |
| Engineering | 0 | 0.0% |
| Multidisciplinary Studies | 0 | 0.0% |
| Science & Technology | 5 | 11.6% |
| Business | 0 | 0.0% |
| Education | 13 | 30.2% |
| Literature & Languages | 0 | 0.0% |
| Liberal Arts & History | 1 | 2.3% |
| Visual & Performing Arts | 5 | 11.6% |
| Communications | 0 | 0.0% |
| Arts & Humanities | 0 | 0.0% |
| Total | 43 | 100.0% |
Transportation & Commute in Cochiti
Vehicle Availability by Sex in Cochiti
The most prevalent vehicle ownership categories in Cochiti are males with 5 or more vehicles (51, accounting for 40.8%) and females with 5 or more vehicles (9, making up 48.1%).
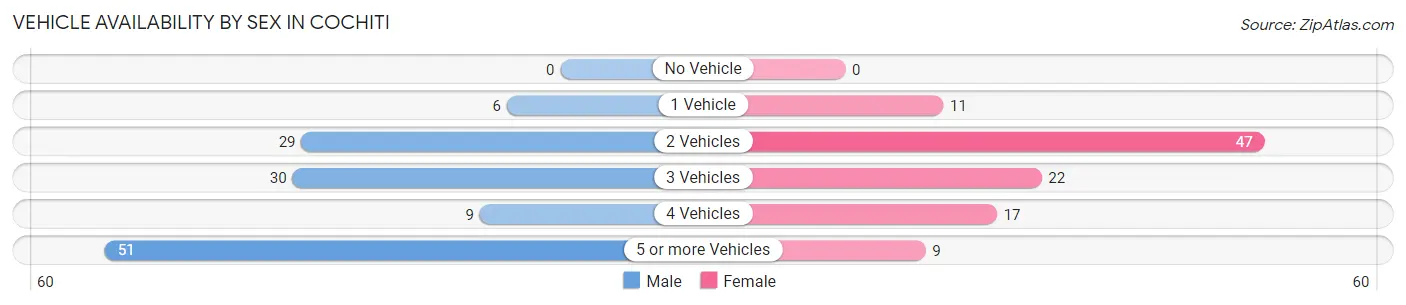
| Vehicles Available | Male | Female |
| No Vehicle | 0 (0.0%) | 0 (0.0%) |
| 1 Vehicle | 6 (4.8%) | 11 (10.4%) |
| 2 Vehicles | 29 (23.2%) | 47 (44.3%) |
| 3 Vehicles | 30 (24.0%) | 22 (20.7%) |
| 4 Vehicles | 9 (7.2%) | 17 (16.0%) |
| 5 or more Vehicles | 51 (40.8%) | 9 (8.5%) |
| Total | 125 (100.0%) | 106 (100.0%) |
Commute Time in Cochiti
The most frequently occuring commute durations in Cochiti are 30 to 34 minutes (44 commuters, 22.8%), 35 to 39 minutes (27 commuters, 14.0%), and 5 to 9 minutes (24 commuters, 12.4%).
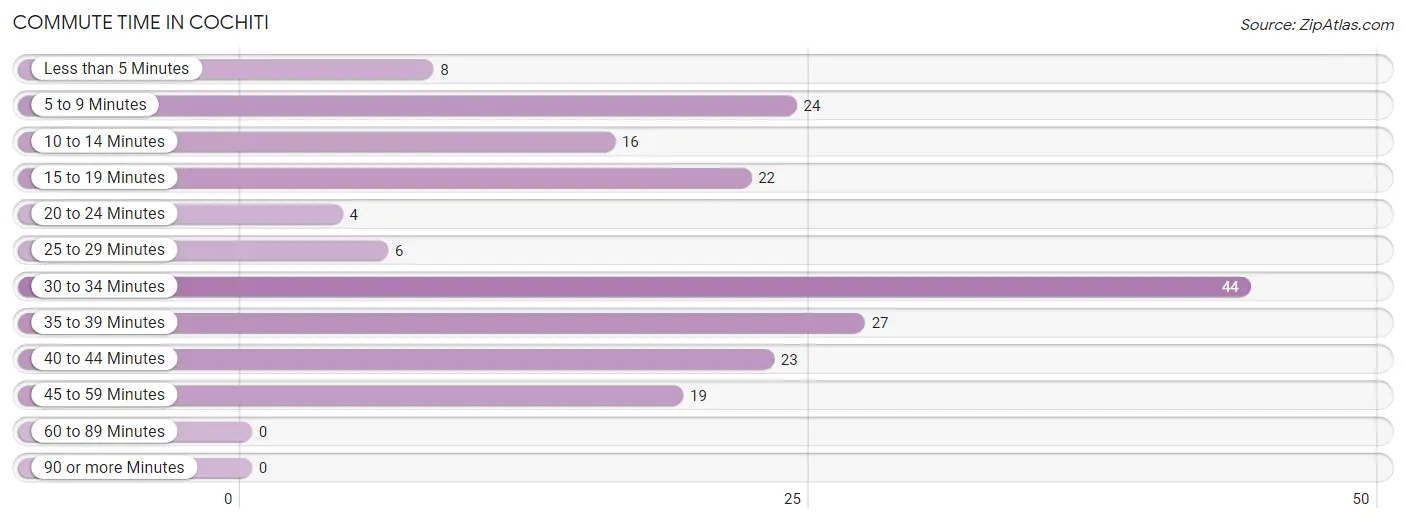
| Commute Time | # Commuters | % Commuters |
| Less than 5 Minutes | 8 | 4.2% |
| 5 to 9 Minutes | 24 | 12.4% |
| 10 to 14 Minutes | 16 | 8.3% |
| 15 to 19 Minutes | 22 | 11.4% |
| 20 to 24 Minutes | 4 | 2.1% |
| 25 to 29 Minutes | 6 | 3.1% |
| 30 to 34 Minutes | 44 | 22.8% |
| 35 to 39 Minutes | 27 | 14.0% |
| 40 to 44 Minutes | 23 | 11.9% |
| 45 to 59 Minutes | 19 | 9.8% |
| 60 to 89 Minutes | 0 | 0.0% |
| 90 or more Minutes | 0 | 0.0% |
Commute Time by Sex in Cochiti
The most common commute times in Cochiti are 35 to 39 minutes (26 commuters, 24.1%) for males and 30 to 34 minutes (38 commuters, 44.7%) for females.
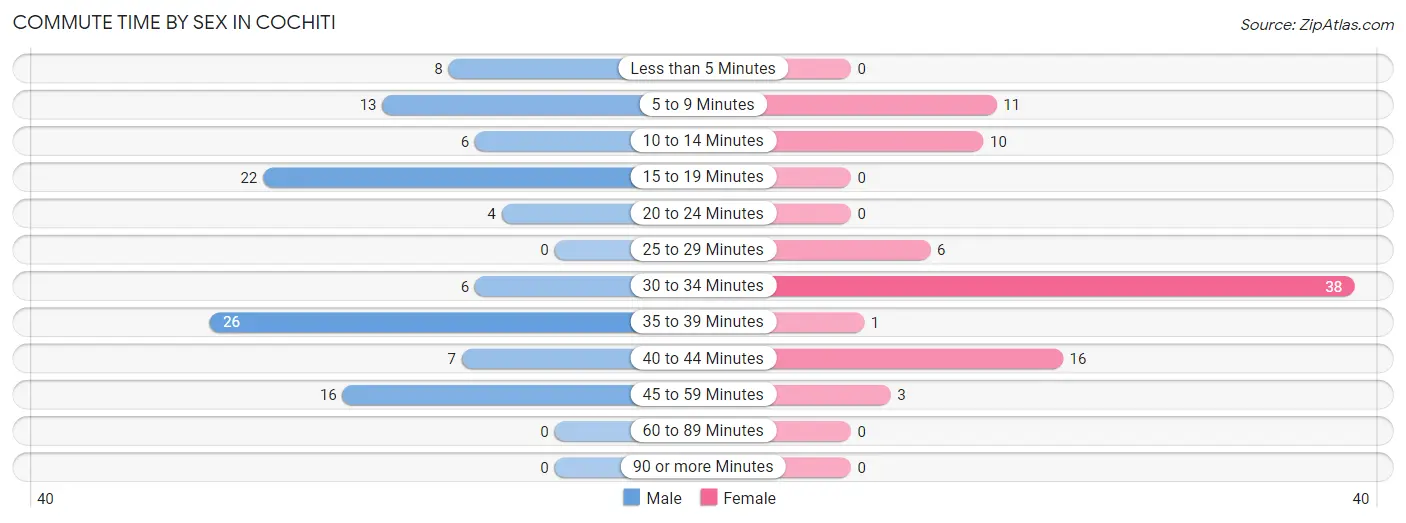
| Commute Time | Male | Female |
| Less than 5 Minutes | 8 (7.4%) | 0 (0.0%) |
| 5 to 9 Minutes | 13 (12.0%) | 11 (12.9%) |
| 10 to 14 Minutes | 6 (5.6%) | 10 (11.8%) |
| 15 to 19 Minutes | 22 (20.4%) | 0 (0.0%) |
| 20 to 24 Minutes | 4 (3.7%) | 0 (0.0%) |
| 25 to 29 Minutes | 0 (0.0%) | 6 (7.1%) |
| 30 to 34 Minutes | 6 (5.6%) | 38 (44.7%) |
| 35 to 39 Minutes | 26 (24.1%) | 1 (1.2%) |
| 40 to 44 Minutes | 7 (6.5%) | 16 (18.8%) |
| 45 to 59 Minutes | 16 (14.8%) | 3 (3.5%) |
| 60 to 89 Minutes | 0 (0.0%) | 0 (0.0%) |
| 90 or more Minutes | 0 (0.0%) | 0 (0.0%) |
Time of Departure to Work by Sex in Cochiti
The most frequent times of departure to work in Cochiti are 6:30 AM to 6:59 AM (27, 25.0%) for males and 7:00 AM to 7:29 AM (39, 45.9%) for females.
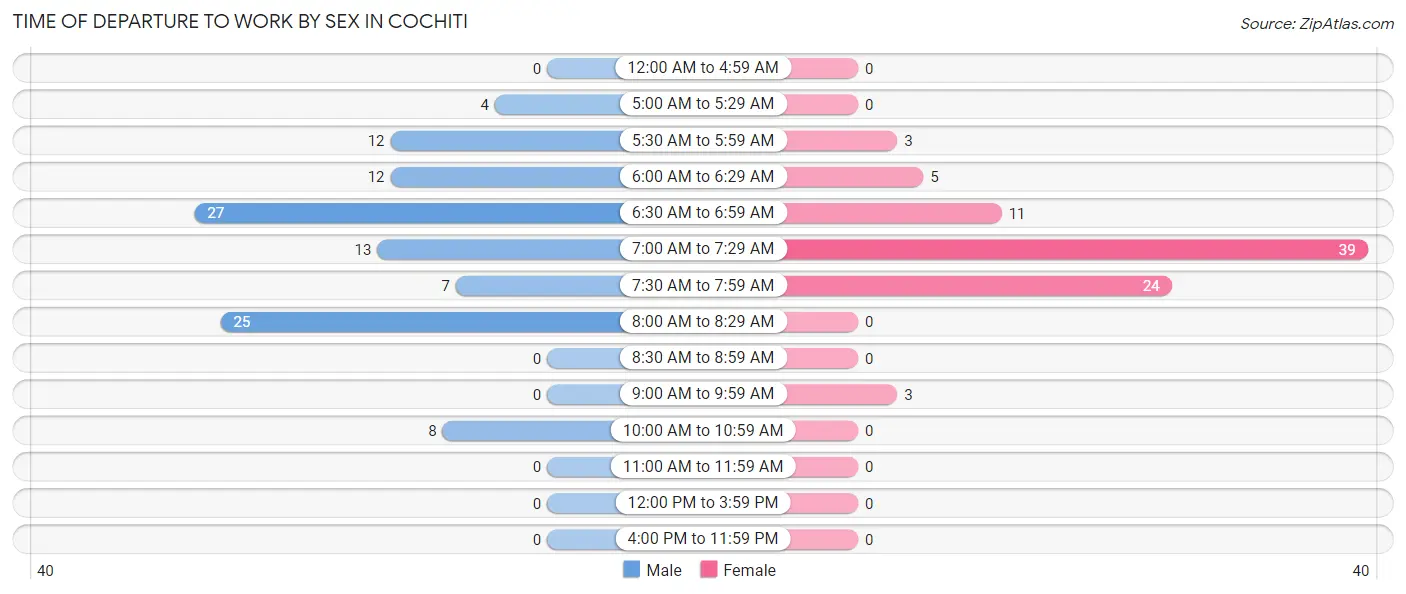
| Time of Departure | Male | Female |
| 12:00 AM to 4:59 AM | 0 (0.0%) | 0 (0.0%) |
| 5:00 AM to 5:29 AM | 4 (3.7%) | 0 (0.0%) |
| 5:30 AM to 5:59 AM | 12 (11.1%) | 3 (3.5%) |
| 6:00 AM to 6:29 AM | 12 (11.1%) | 5 (5.9%) |
| 6:30 AM to 6:59 AM | 27 (25.0%) | 11 (12.9%) |
| 7:00 AM to 7:29 AM | 13 (12.0%) | 39 (45.9%) |
| 7:30 AM to 7:59 AM | 7 (6.5%) | 24 (28.2%) |
| 8:00 AM to 8:29 AM | 25 (23.2%) | 0 (0.0%) |
| 8:30 AM to 8:59 AM | 0 (0.0%) | 0 (0.0%) |
| 9:00 AM to 9:59 AM | 0 (0.0%) | 3 (3.5%) |
| 10:00 AM to 10:59 AM | 8 (7.4%) | 0 (0.0%) |
| 11:00 AM to 11:59 AM | 0 (0.0%) | 0 (0.0%) |
| 12:00 PM to 3:59 PM | 0 (0.0%) | 0 (0.0%) |
| 4:00 PM to 11:59 PM | 0 (0.0%) | 0 (0.0%) |
| Total | 108 (100.0%) | 85 (100.0%) |
Housing Occupancy in Cochiti
Occupancy by Ownership in Cochiti
Of the total 136 dwellings in Cochiti, owner-occupied units account for 121 (89.0%), while renter-occupied units make up 15 (11.0%).
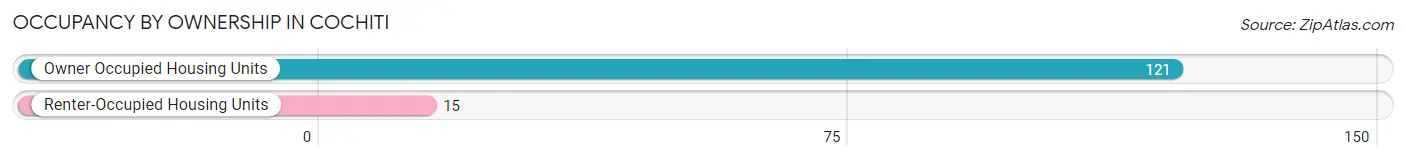
| Occupancy | # Housing Units | % Housing Units |
| Owner Occupied Housing Units | 121 | 89.0% |
| Renter-Occupied Housing Units | 15 | 11.0% |
| Total Occupied Housing Units | 136 | 100.0% |
Occupancy by Household Size in Cochiti
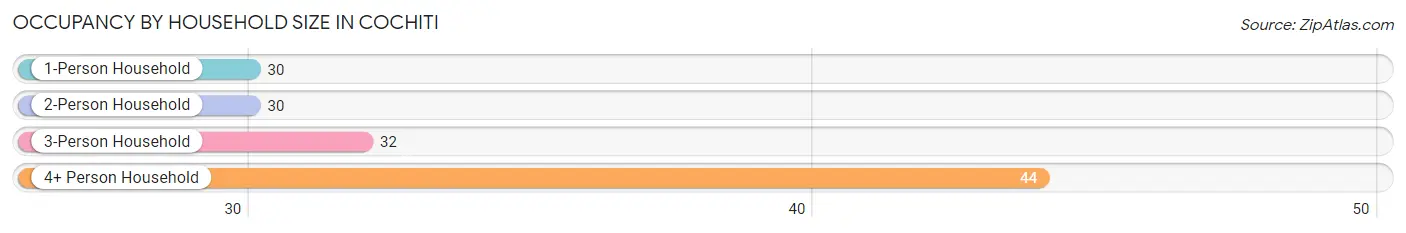
| Household Size | # Housing Units | % Housing Units |
| 1-Person Household | 30 | 22.1% |
| 2-Person Household | 30 | 22.1% |
| 3-Person Household | 32 | 23.5% |
| 4+ Person Household | 44 | 32.4% |
| Total Housing Units | 136 | 100.0% |
Occupancy by Ownership by Household Size in Cochiti
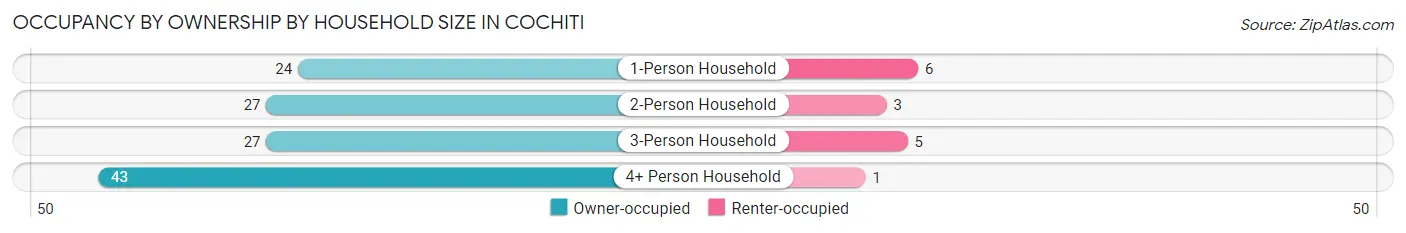
| Household Size | Owner-occupied | Renter-occupied |
| 1-Person Household | 24 (80.0%) | 6 (20.0%) |
| 2-Person Household | 27 (90.0%) | 3 (10.0%) |
| 3-Person Household | 27 (84.4%) | 5 (15.6%) |
| 4+ Person Household | 43 (97.7%) | 1 (2.3%) |
| Total Housing Units | 121 (89.0%) | 15 (11.0%) |
Occupancy by Educational Attainment in Cochiti
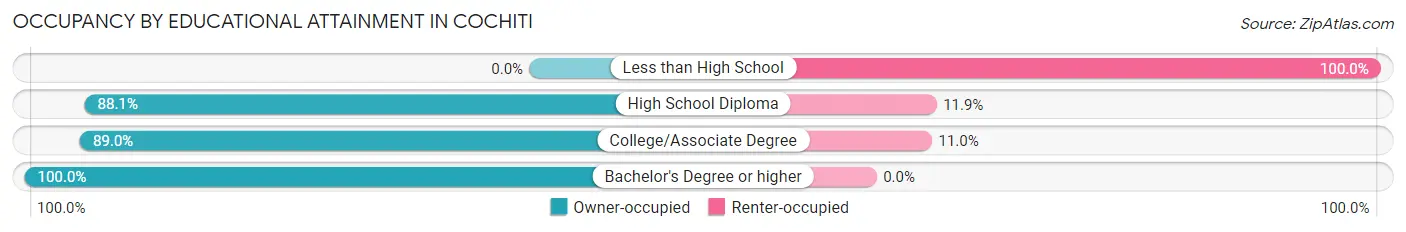
| Household Size | Owner-occupied | Renter-occupied |
| Less than High School | 0 (0.0%) | 1 (100.0%) |
| High School Diploma | 37 (88.1%) | 5 (11.9%) |
| College/Associate Degree | 73 (89.0%) | 9 (11.0%) |
| Bachelor's Degree or higher | 11 (100.0%) | 0 (0.0%) |
Occupancy by Age of Householder in Cochiti
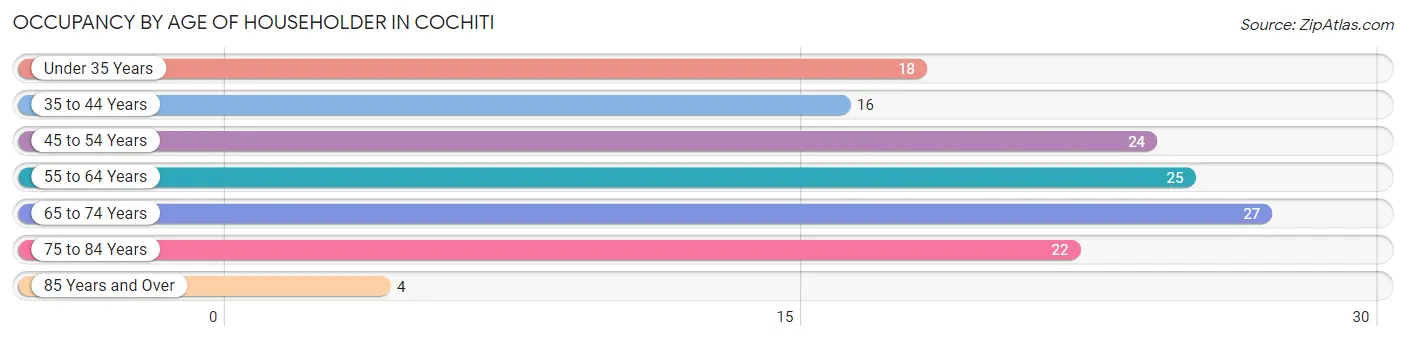
| Age Bracket | # Households | % Households |
| Under 35 Years | 18 | 13.2% |
| 35 to 44 Years | 16 | 11.8% |
| 45 to 54 Years | 24 | 17.6% |
| 55 to 64 Years | 25 | 18.4% |
| 65 to 74 Years | 27 | 19.9% |
| 75 to 84 Years | 22 | 16.2% |
| 85 Years and Over | 4 | 2.9% |
| Total | 136 | 100.0% |
Housing Finances in Cochiti
Median Income by Occupancy in Cochiti
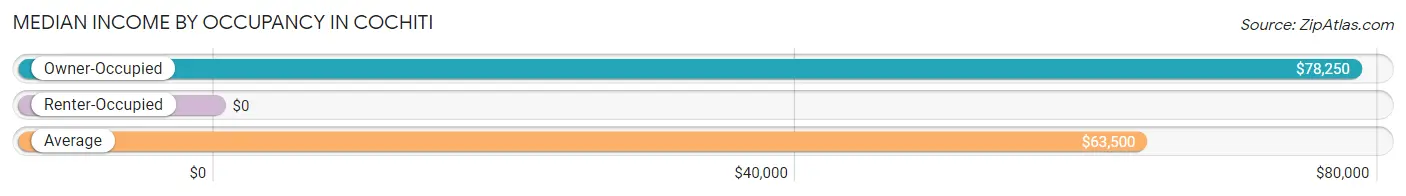
| Occupancy Type | # Households | Median Income |
| Owner-Occupied | 121 (89.0%) | $78,250 |
| Renter-Occupied | 15 (11.0%) | $0 |
| Average | 136 (100.0%) | $63,500 |
Occupancy by Householder Income Bracket in Cochiti
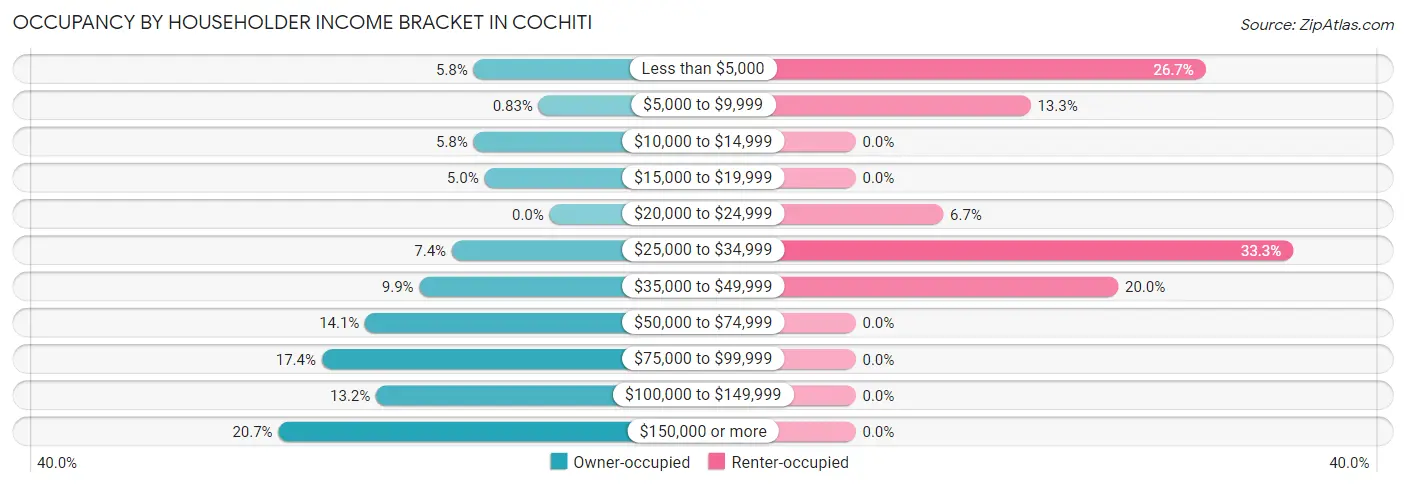
| Income Bracket | Owner-occupied | Renter-occupied |
| Less than $5,000 | 7 (5.8%) | 4 (26.7%) |
| $5,000 to $9,999 | 1 (0.8%) | 2 (13.3%) |
| $10,000 to $14,999 | 7 (5.8%) | 0 (0.0%) |
| $15,000 to $19,999 | 6 (5.0%) | 0 (0.0%) |
| $20,000 to $24,999 | 0 (0.0%) | 1 (6.7%) |
| $25,000 to $34,999 | 9 (7.4%) | 5 (33.3%) |
| $35,000 to $49,999 | 12 (9.9%) | 3 (20.0%) |
| $50,000 to $74,999 | 17 (14.1%) | 0 (0.0%) |
| $75,000 to $99,999 | 21 (17.4%) | 0 (0.0%) |
| $100,000 to $149,999 | 16 (13.2%) | 0 (0.0%) |
| $150,000 or more | 25 (20.7%) | 0 (0.0%) |
| Total | 121 (100.0%) | 15 (100.0%) |
Monthly Housing Cost Tiers in Cochiti
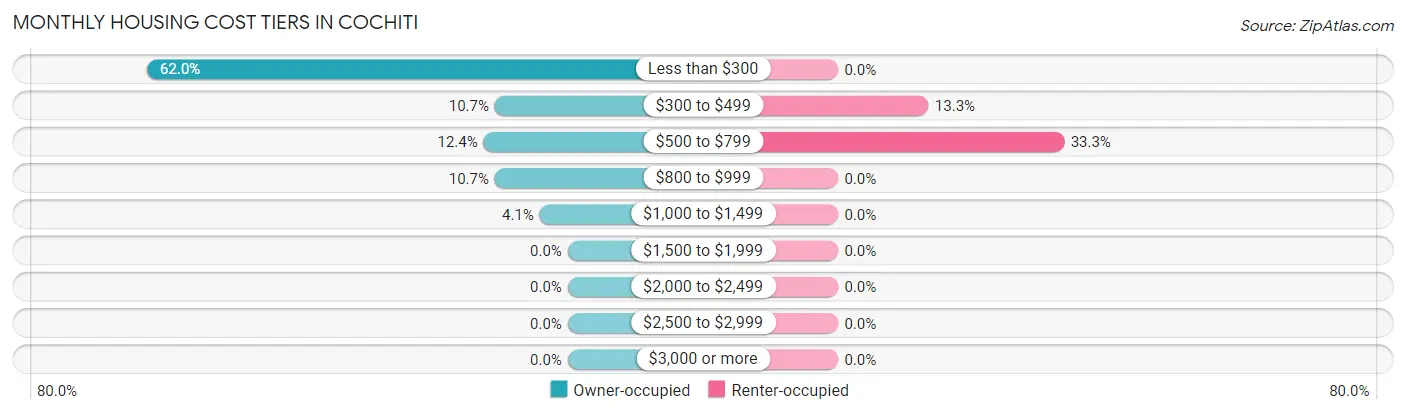
| Monthly Cost | Owner-occupied | Renter-occupied |
| Less than $300 | 75 (62.0%) | 0 (0.0%) |
| $300 to $499 | 13 (10.7%) | 2 (13.3%) |
| $500 to $799 | 15 (12.4%) | 5 (33.3%) |
| $800 to $999 | 13 (10.7%) | 0 (0.0%) |
| $1,000 to $1,499 | 5 (4.1%) | 0 (0.0%) |
| $1,500 to $1,999 | 0 (0.0%) | 0 (0.0%) |
| $2,000 to $2,499 | 0 (0.0%) | 0 (0.0%) |
| $2,500 to $2,999 | 0 (0.0%) | 0 (0.0%) |
| $3,000 or more | 0 (0.0%) | 0 (0.0%) |
| Total | 121 (100.0%) | 15 (100.0%) |
Physical Housing Characteristics in Cochiti
Housing Structures in Cochiti
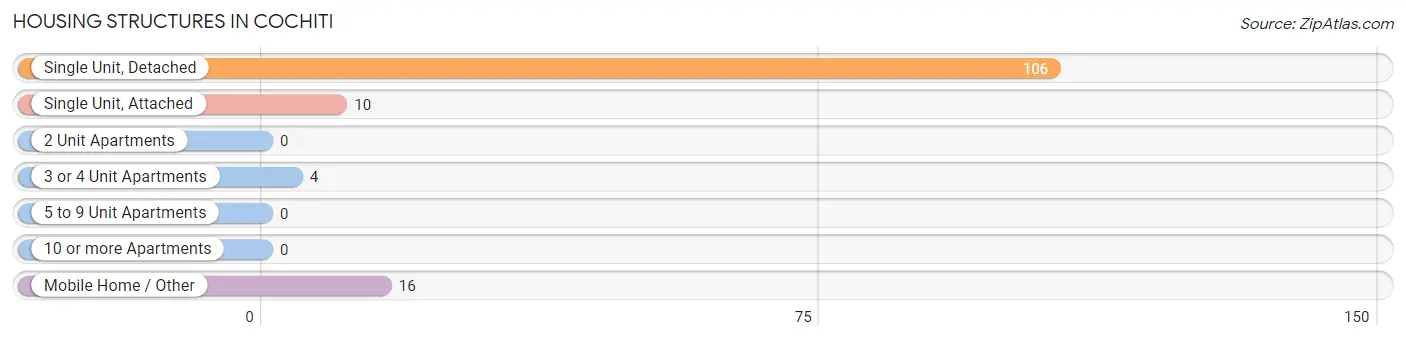
| Structure Type | # Housing Units | % Housing Units |
| Single Unit, Detached | 106 | 77.9% |
| Single Unit, Attached | 10 | 7.3% |
| 2 Unit Apartments | 0 | 0.0% |
| 3 or 4 Unit Apartments | 4 | 2.9% |
| 5 to 9 Unit Apartments | 0 | 0.0% |
| 10 or more Apartments | 0 | 0.0% |
| Mobile Home / Other | 16 | 11.8% |
| Total | 136 | 100.0% |
Housing Structures by Occupancy in Cochiti
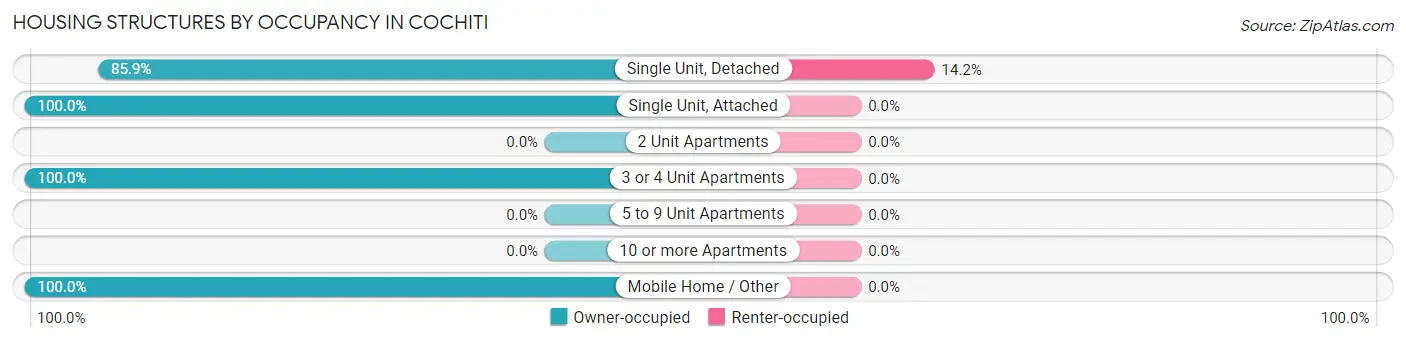
| Structure Type | Owner-occupied | Renter-occupied |
| Single Unit, Detached | 91 (85.9%) | 15 (14.1%) |
| Single Unit, Attached | 10 (100.0%) | 0 (0.0%) |
| 2 Unit Apartments | 0 (0.0%) | 0 (0.0%) |
| 3 or 4 Unit Apartments | 4 (100.0%) | 0 (0.0%) |
| 5 to 9 Unit Apartments | 0 (0.0%) | 0 (0.0%) |
| 10 or more Apartments | 0 (0.0%) | 0 (0.0%) |
| Mobile Home / Other | 16 (100.0%) | 0 (0.0%) |
| Total | 121 (89.0%) | 15 (11.0%) |
Housing Structures by Number of Rooms in Cochiti
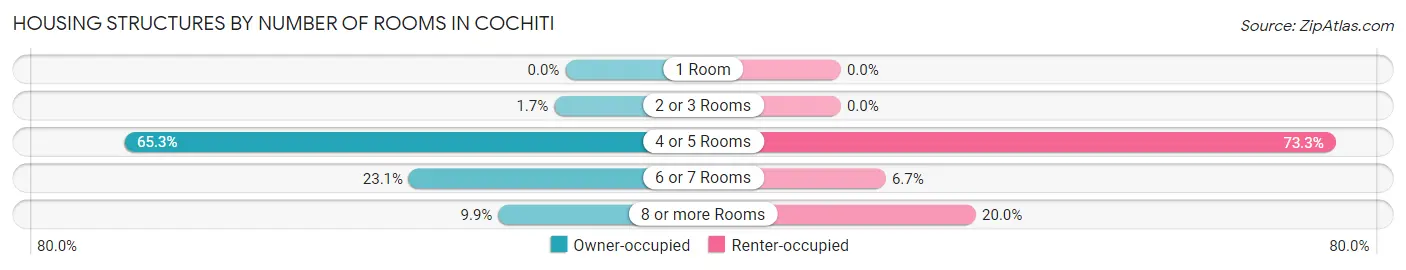
| Number of Rooms | Owner-occupied | Renter-occupied |
| 1 Room | 0 (0.0%) | 0 (0.0%) |
| 2 or 3 Rooms | 2 (1.7%) | 0 (0.0%) |
| 4 or 5 Rooms | 79 (65.3%) | 11 (73.3%) |
| 6 or 7 Rooms | 28 (23.1%) | 1 (6.7%) |
| 8 or more Rooms | 12 (9.9%) | 3 (20.0%) |
| Total | 121 (100.0%) | 15 (100.0%) |
Housing Structure by Heating Type in Cochiti
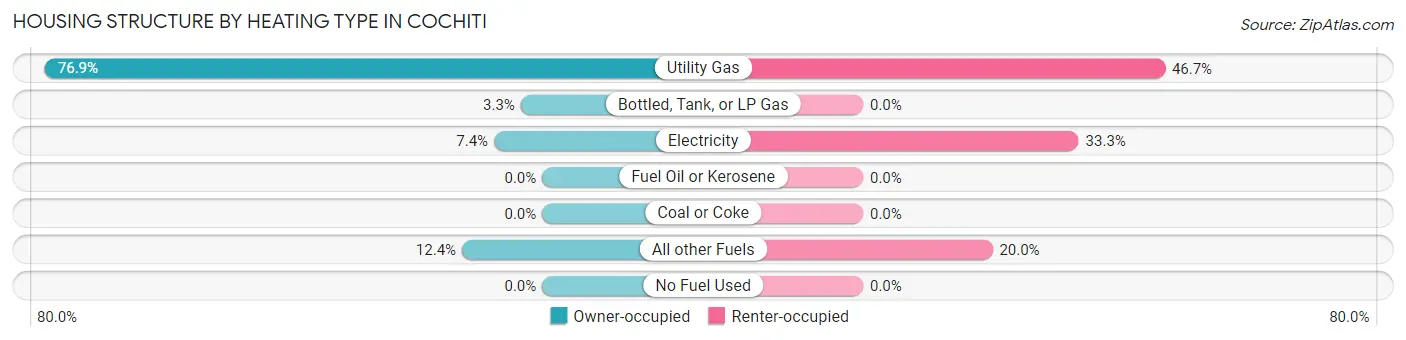
| Heating Type | Owner-occupied | Renter-occupied |
| Utility Gas | 93 (76.9%) | 7 (46.7%) |
| Bottled, Tank, or LP Gas | 4 (3.3%) | 0 (0.0%) |
| Electricity | 9 (7.4%) | 5 (33.3%) |
| Fuel Oil or Kerosene | 0 (0.0%) | 0 (0.0%) |
| Coal or Coke | 0 (0.0%) | 0 (0.0%) |
| All other Fuels | 15 (12.4%) | 3 (20.0%) |
| No Fuel Used | 0 (0.0%) | 0 (0.0%) |
| Total | 121 (100.0%) | 15 (100.0%) |
Household Vehicle Usage in Cochiti
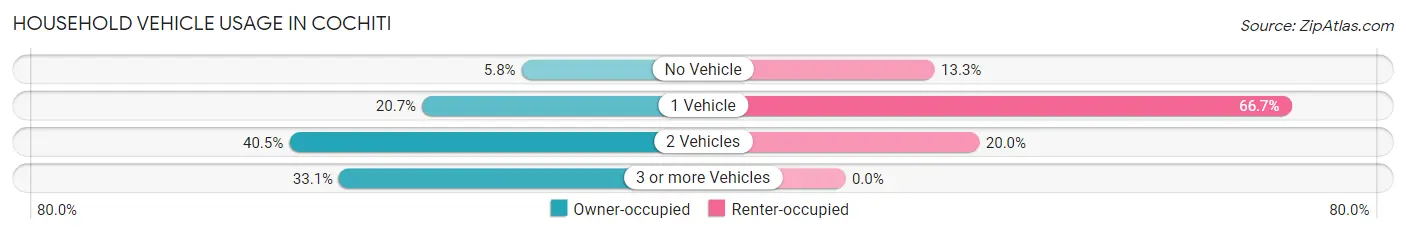
| Vehicles per Household | Owner-occupied | Renter-occupied |
| No Vehicle | 7 (5.8%) | 2 (13.3%) |
| 1 Vehicle | 25 (20.7%) | 10 (66.7%) |
| 2 Vehicles | 49 (40.5%) | 3 (20.0%) |
| 3 or more Vehicles | 40 (33.1%) | 0 (0.0%) |
| Total | 121 (100.0%) | 15 (100.0%) |
Real Estate & Mortgages in Cochiti
Real Estate and Mortgage Overview in Cochiti
| Characteristic | Without Mortgage | With Mortgage |
| Housing Units | 108 | 13 |
| Median Property Value | $240,600 | $129,200 |
| Median Household Income | $78,500 | $0 |
| Monthly Housing Costs | $245 | $0 |
| Real Estate Taxes | $2,389 | $9 |
Property Value by Mortgage Status in Cochiti
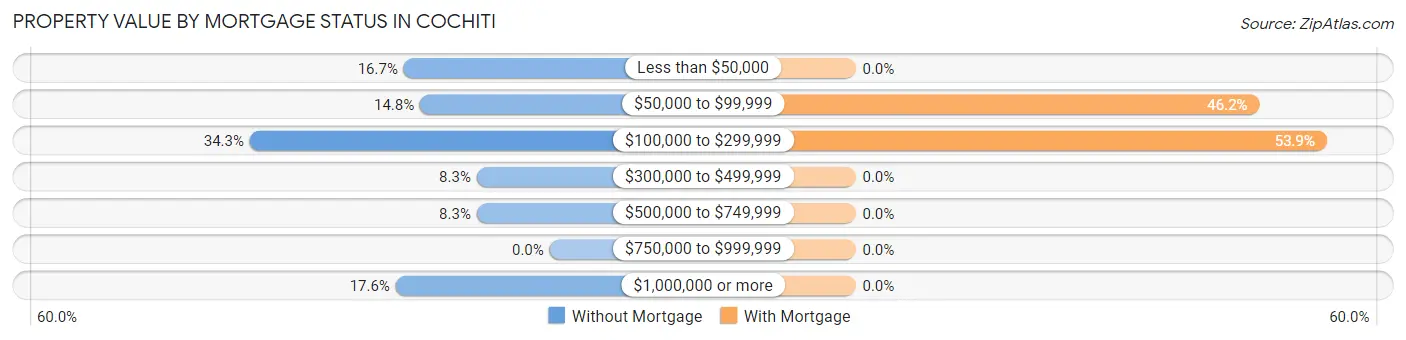
| Property Value | Without Mortgage | With Mortgage |
| Less than $50,000 | 18 (16.7%) | 0 (0.0%) |
| $50,000 to $99,999 | 16 (14.8%) | 6 (46.2%) |
| $100,000 to $299,999 | 37 (34.3%) | 7 (53.8%) |
| $300,000 to $499,999 | 9 (8.3%) | 0 (0.0%) |
| $500,000 to $749,999 | 9 (8.3%) | 0 (0.0%) |
| $750,000 to $999,999 | 0 (0.0%) | 0 (0.0%) |
| $1,000,000 or more | 19 (17.6%) | 0 (0.0%) |
| Total | 108 (100.0%) | 13 (100.0%) |
Household Income by Mortgage Status in Cochiti
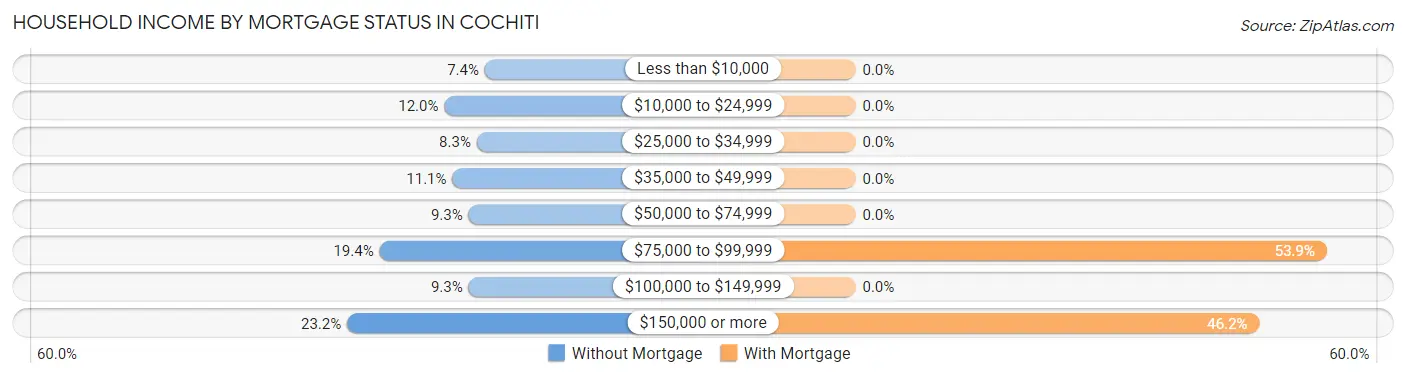
| Household Income | Without Mortgage | With Mortgage |
| Less than $10,000 | 8 (7.4%) | 0 (0.0%) |
| $10,000 to $24,999 | 13 (12.0%) | 0 (0.0%) |
| $25,000 to $34,999 | 9 (8.3%) | 0 (0.0%) |
| $35,000 to $49,999 | 12 (11.1%) | 0 (0.0%) |
| $50,000 to $74,999 | 10 (9.3%) | 0 (0.0%) |
| $75,000 to $99,999 | 21 (19.4%) | 7 (53.8%) |
| $100,000 to $149,999 | 10 (9.3%) | 0 (0.0%) |
| $150,000 or more | 25 (23.2%) | 6 (46.2%) |
| Total | 108 (100.0%) | 13 (100.0%) |
Property Value to Household Income Ratio in Cochiti
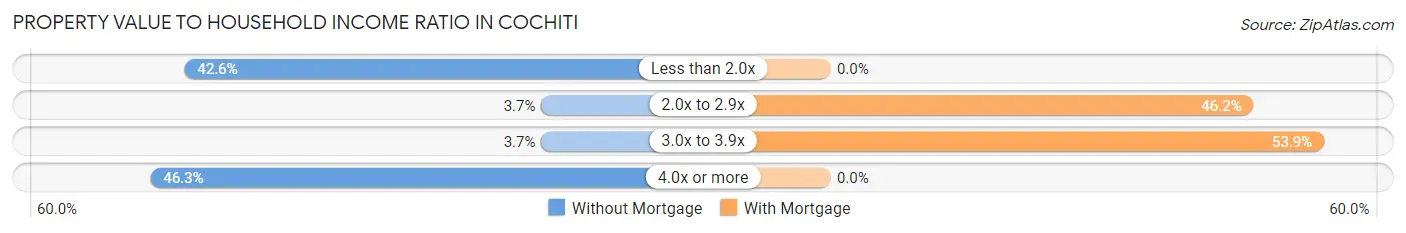
| Value-to-Income Ratio | Without Mortgage | With Mortgage |
| Less than 2.0x | 46 (42.6%) | 0 (0.0%) |
| 2.0x to 2.9x | 4 (3.7%) | 6 (46.2%) |
| 3.0x to 3.9x | 4 (3.7%) | 7 (53.8%) |
| 4.0x or more | 50 (46.3%) | 0 (0.0%) |
| Total | 108 (100.0%) | 13 (100.0%) |
Real Estate Taxes by Mortgage Status in Cochiti
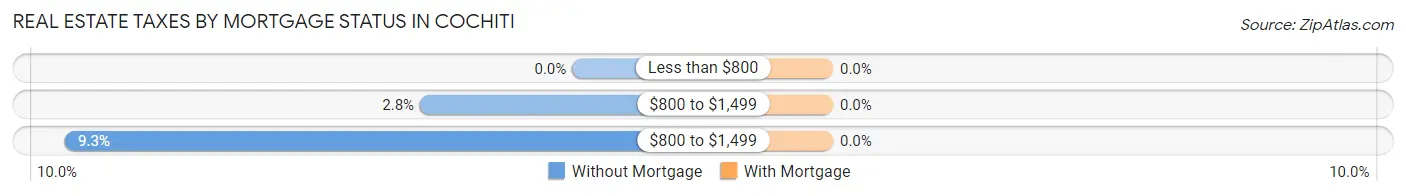
| Property Taxes | Without Mortgage | With Mortgage |
| Less than $800 | 0 (0.0%) | 0 (0.0%) |
| $800 to $1,499 | 3 (2.8%) | 0 (0.0%) |
| $800 to $1,499 | 10 (9.3%) | 0 (0.0%) |
| Total | 108 (100.0%) | 13 (100.0%) |
Health & Disability in Cochiti
Health Insurance Coverage by Age in Cochiti
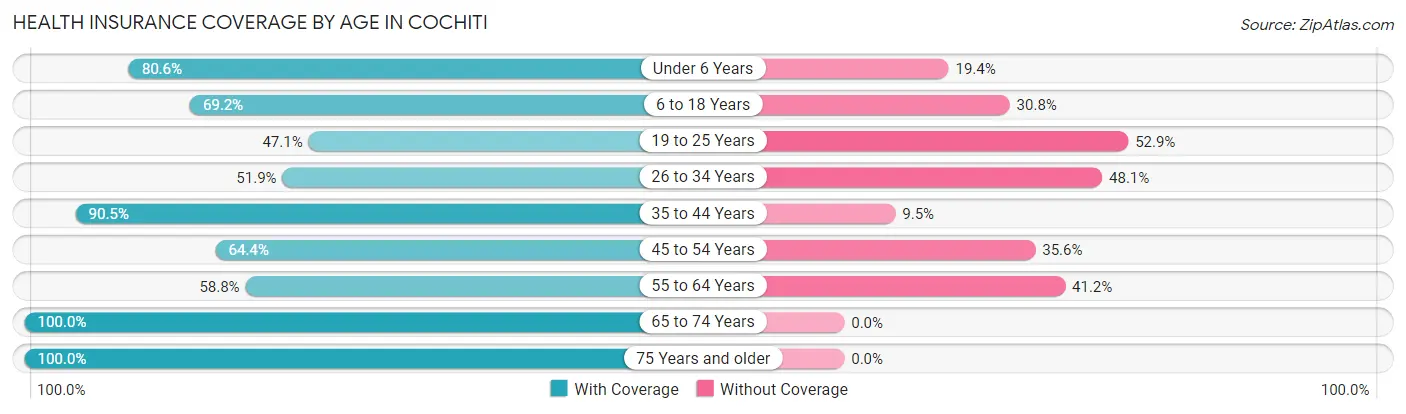
| Age Bracket | With Coverage | Without Coverage |
| Under 6 Years | 29 (80.6%) | 7 (19.4%) |
| 6 to 18 Years | 74 (69.2%) | 33 (30.8%) |
| 19 to 25 Years | 16 (47.1%) | 18 (52.9%) |
| 26 to 34 Years | 54 (51.9%) | 50 (48.1%) |
| 35 to 44 Years | 19 (90.5%) | 2 (9.5%) |
| 45 to 54 Years | 47 (64.4%) | 26 (35.6%) |
| 55 to 64 Years | 20 (58.8%) | 14 (41.2%) |
| 65 to 74 Years | 38 (100.0%) | 0 (0.0%) |
| 75 Years and older | 37 (100.0%) | 0 (0.0%) |
| Total | 334 (69.0%) | 150 (31.0%) |
Health Insurance Coverage by Citizenship Status in Cochiti
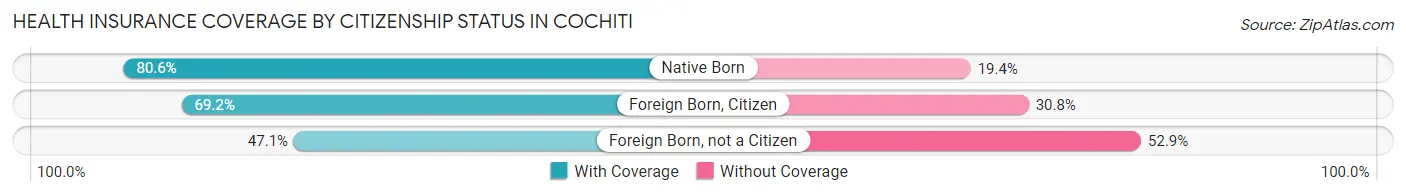
| Citizenship Status | With Coverage | Without Coverage |
| Native Born | 29 (80.6%) | 7 (19.4%) |
| Foreign Born, Citizen | 74 (69.2%) | 33 (30.8%) |
| Foreign Born, not a Citizen | 16 (47.1%) | 18 (52.9%) |
Health Insurance Coverage by Household Income in Cochiti
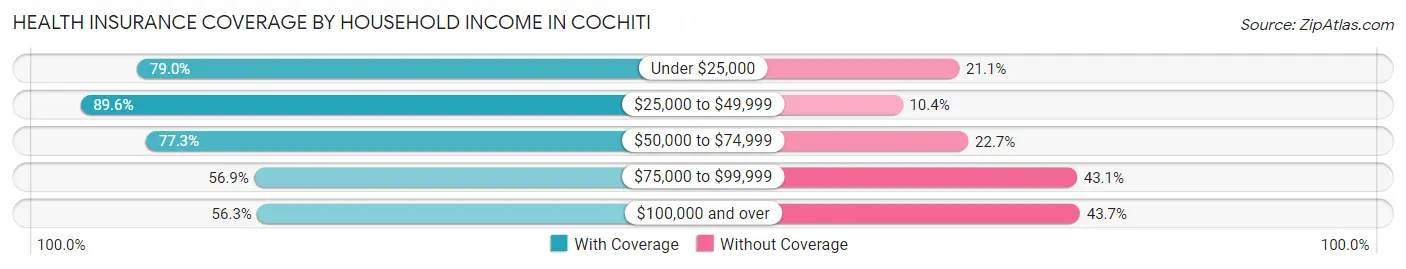
| Household Income | With Coverage | Without Coverage |
| Under $25,000 | 30 (78.9%) | 8 (21.0%) |
| $25,000 to $49,999 | 103 (89.6%) | 12 (10.4%) |
| $50,000 to $74,999 | 51 (77.3%) | 15 (22.7%) |
| $75,000 to $99,999 | 70 (56.9%) | 53 (43.1%) |
| $100,000 and over | 80 (56.3%) | 62 (43.7%) |
Public vs Private Health Insurance Coverage by Age in Cochiti
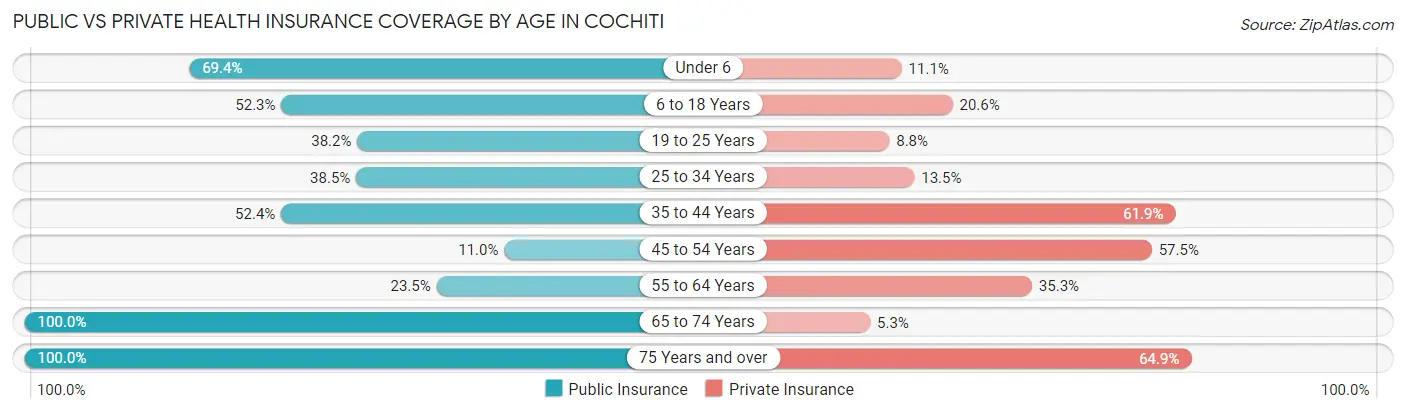
| Age Bracket | Public Insurance | Private Insurance |
| Under 6 | 25 (69.4%) | 4 (11.1%) |
| 6 to 18 Years | 56 (52.3%) | 22 (20.6%) |
| 19 to 25 Years | 13 (38.2%) | 3 (8.8%) |
| 25 to 34 Years | 40 (38.5%) | 14 (13.5%) |
| 35 to 44 Years | 11 (52.4%) | 13 (61.9%) |
| 45 to 54 Years | 8 (11.0%) | 42 (57.5%) |
| 55 to 64 Years | 8 (23.5%) | 12 (35.3%) |
| 65 to 74 Years | 38 (100.0%) | 2 (5.3%) |
| 75 Years and over | 37 (100.0%) | 24 (64.9%) |
| Total | 236 (48.8%) | 136 (28.1%) |
Disability Status by Sex by Age in Cochiti
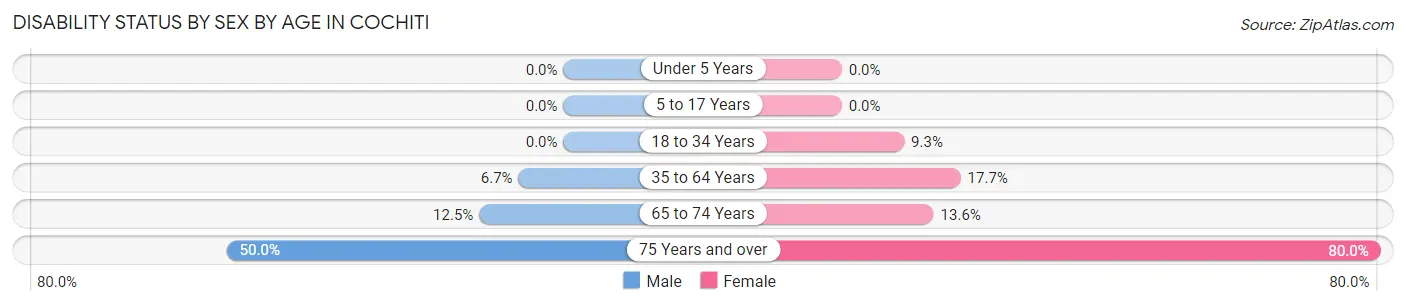
| Age Bracket | Male | Female |
| Under 5 Years | 0 (0.0%) | 0 (0.0%) |
| 5 to 17 Years | 0 (0.0%) | 0 (0.0%) |
| 18 to 34 Years | 0 (0.0%) | 5 (9.3%) |
| 35 to 64 Years | 4 (6.7%) | 12 (17.6%) |
| 65 to 74 Years | 2 (12.5%) | 3 (13.6%) |
| 75 Years and over | 11 (50.0%) | 12 (80.0%) |
Disability Class by Sex by Age in Cochiti
Disability Class: Hearing Difficulty
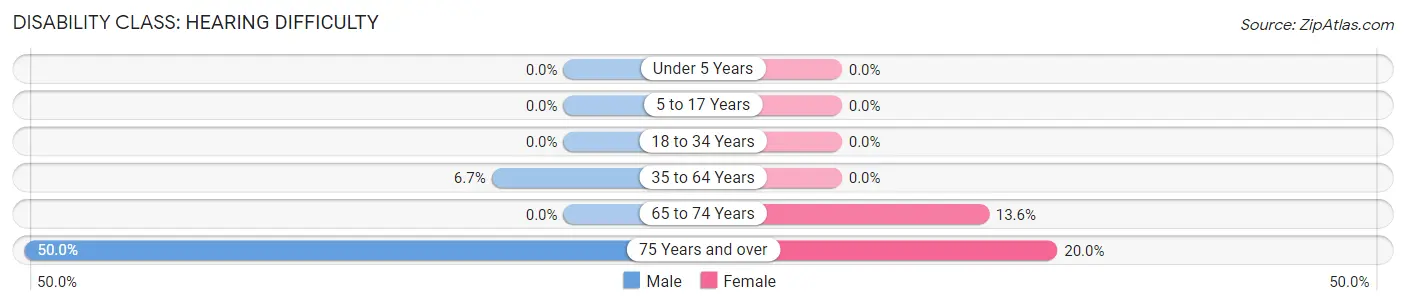
| Age Bracket | Male | Female |
| Under 5 Years | 0 (0.0%) | 0 (0.0%) |
| 5 to 17 Years | 0 (0.0%) | 0 (0.0%) |
| 18 to 34 Years | 0 (0.0%) | 0 (0.0%) |
| 35 to 64 Years | 4 (6.7%) | 0 (0.0%) |
| 65 to 74 Years | 0 (0.0%) | 3 (13.6%) |
| 75 Years and over | 11 (50.0%) | 3 (20.0%) |
Disability Class: Vision Difficulty
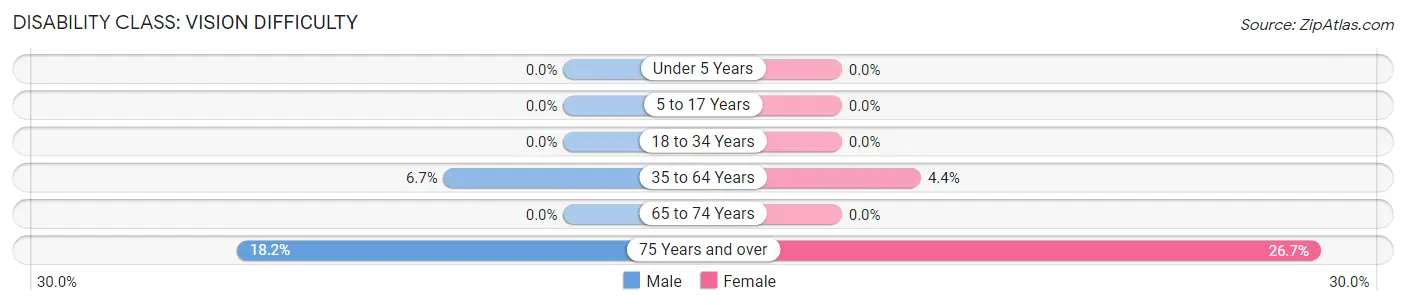
| Age Bracket | Male | Female |
| Under 5 Years | 0 (0.0%) | 0 (0.0%) |
| 5 to 17 Years | 0 (0.0%) | 0 (0.0%) |
| 18 to 34 Years | 0 (0.0%) | 0 (0.0%) |
| 35 to 64 Years | 4 (6.7%) | 3 (4.4%) |
| 65 to 74 Years | 0 (0.0%) | 0 (0.0%) |
| 75 Years and over | 4 (18.2%) | 4 (26.7%) |
Disability Class: Cognitive Difficulty
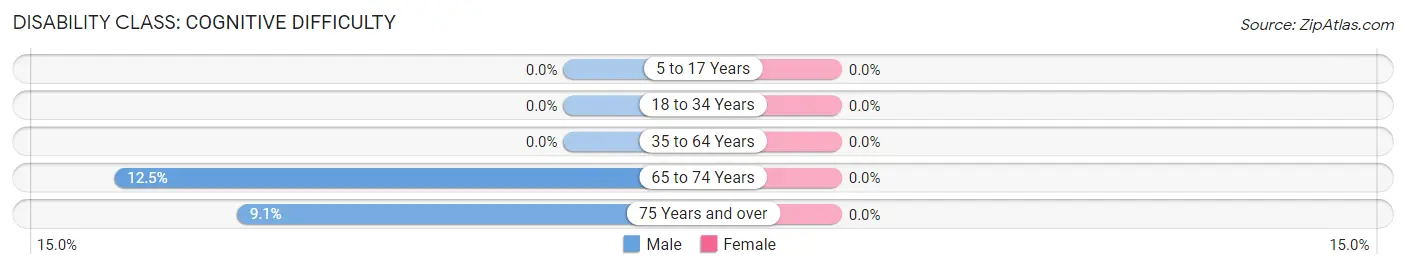
| Age Bracket | Male | Female |
| 5 to 17 Years | 0 (0.0%) | 0 (0.0%) |
| 18 to 34 Years | 0 (0.0%) | 0 (0.0%) |
| 35 to 64 Years | 0 (0.0%) | 0 (0.0%) |
| 65 to 74 Years | 2 (12.5%) | 0 (0.0%) |
| 75 Years and over | 2 (9.1%) | 0 (0.0%) |
Disability Class: Ambulatory Difficulty
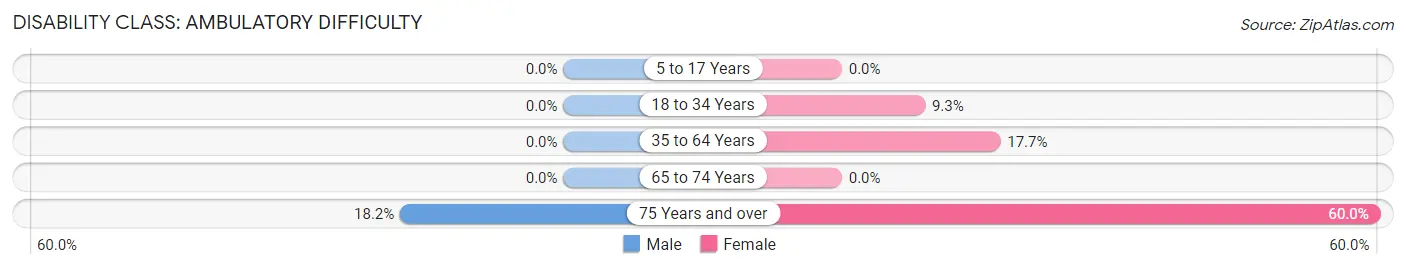
| Age Bracket | Male | Female |
| 5 to 17 Years | 0 (0.0%) | 0 (0.0%) |
| 18 to 34 Years | 0 (0.0%) | 5 (9.3%) |
| 35 to 64 Years | 0 (0.0%) | 12 (17.6%) |
| 65 to 74 Years | 0 (0.0%) | 0 (0.0%) |
| 75 Years and over | 4 (18.2%) | 9 (60.0%) |
Disability Class: Self-Care Difficulty
| Age Bracket | Male | Female |
| 5 to 17 Years | 0 (0.0%) | 0 (0.0%) |
| 18 to 34 Years | 0 (0.0%) | 0 (0.0%) |
| 35 to 64 Years | 0 (0.0%) | 0 (0.0%) |
| 65 to 74 Years | 0 (0.0%) | 0 (0.0%) |
| 75 Years and over | 0 (0.0%) | 0 (0.0%) |
Technology Access in Cochiti
Computing Device Access in Cochiti
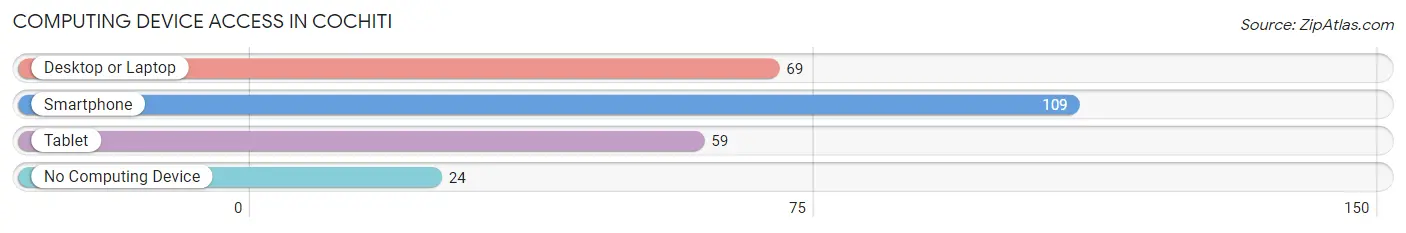
| Device Type | # Households | % Households |
| Desktop or Laptop | 69 | 50.7% |
| Smartphone | 109 | 80.1% |
| Tablet | 59 | 43.4% |
| No Computing Device | 24 | 17.6% |
| Total | 136 | 100.0% |
Internet Access in Cochiti
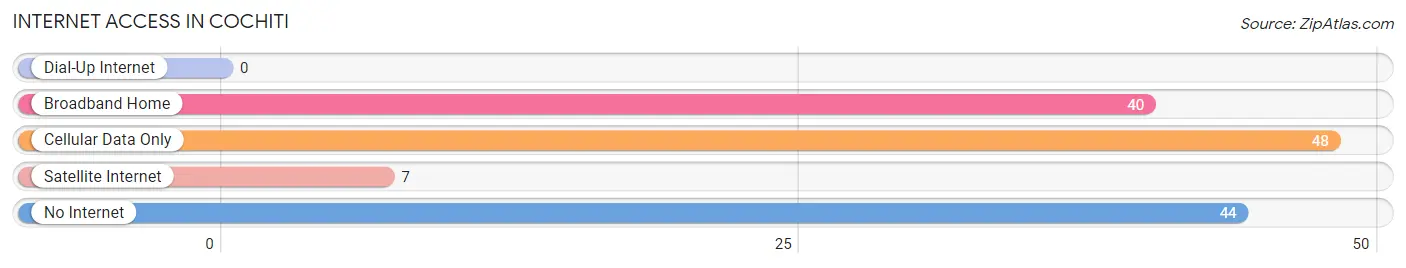
| Internet Type | # Households | % Households |
| Dial-Up Internet | 0 | 0.0% |
| Broadband Home | 40 | 29.4% |
| Cellular Data Only | 48 | 35.3% |
| Satellite Internet | 7 | 5.1% |
| No Internet | 44 | 32.4% |
| Total | 136 | 100.0% |
Cochiti Summary
Cochiti, New Mexico is a small town located in Sandoval County, about 40 miles southwest of Albuquerque. It is situated on the banks of the Rio Grande, and is part of the Cochiti Pueblo Indian Reservation. The town has a population of about 1,100 people, and is home to the Cochiti Pueblo, a federally recognized tribe of Native Americans.
History
The Cochiti Pueblo has been inhabited for centuries, and is believed to have been established around 1300 AD. The Pueblo is one of the 19 Pueblos of New Mexico, and is the only one located on the Rio Grande. The Cochiti people are believed to be descended from the ancient Anasazi people, and their language is a dialect of the Keresan language.
The Cochiti Pueblo was first visited by Europeans in 1540, when the Spanish explorer Francisco Vásquez de Coronado arrived in the area. The Pueblo was later visited by the Spanish Franciscan friar Juan de Padilla in 1581. The Pueblo was then visited by the Spanish explorer Antonio de Espejo in 1583.
In 1680, the Pueblo Revolt occurred, in which the Pueblo people rose up against the Spanish colonists. The revolt was successful, and the Spanish were driven out of the area. The Cochiti Pueblo was then re-established in 1706.
In 1848, the Treaty of Guadalupe Hidalgo was signed, which ended the Mexican-American War and ceded the area to the United States. In 1876, the Cochiti Pueblo was granted a reservation by the United States government.
Geography
Cochiti is located in Sandoval County, about 40 miles southwest of Albuquerque. The town is situated on the banks of the Rio Grande, and is part of the Cochiti Pueblo Indian Reservation. The town has an elevation of 5,890 feet above sea level.
The climate in Cochiti is semi-arid, with hot summers and mild winters. The average annual temperature is about 60 degrees Fahrenheit, and the average annual precipitation is about 12 inches.
Economy
The economy of Cochiti is largely based on tourism and agriculture. The town is home to the Cochiti Pueblo, which is a popular tourist destination. The Pueblo is home to a number of cultural attractions, including the Cochiti Lake Recreation Area, the Cochiti Pueblo Museum, and the Cochiti Pueblo Cultural Center.
The town is also home to a number of agricultural operations, including cattle ranches, dairy farms, and orchards. The town is also home to a number of small businesses, including restaurants, shops, and art galleries.
Demographics
As of the 2010 census, the population of Cochiti was 1,100. The racial makeup of the town was 94.2% Native American, 4.2% White, 0.2% African American, 0.2% Asian, and 0.2% from other races. The median household income was $25,000, and the median family income was $30,000. The per capita income was $14,000.
Conclusion
Cochiti, New Mexico is a small town located in Sandoval County, about 40 miles southwest of Albuquerque. It is situated on the banks of the Rio Grande, and is part of the Cochiti Pueblo Indian Reservation. The town has a population of about 1,100 people, and is home to the Cochiti Pueblo, a federally recognized tribe of Native Americans. The economy of Cochiti is largely based on tourism and agriculture, and the town is home to a number of cultural attractions, agricultural operations, and small businesses. The racial makeup of the town is 94.2% Native American, 4.2% White, 0.2% African American, 0.2% Asian, and 0.2% from other races. The median household income was $25,000, and the median family income was $30,000.
Common Questions
What is Per Capita Income in Cochiti?
Per Capita income in Cochiti is $30,664.
What is the Median Family Income in Cochiti?
Median Family Income in Cochiti is $85,909.
What is the Median Household income in Cochiti?
Median Household Income in Cochiti is $63,500.
What is Income or Wage Gap in Cochiti?
Income or Wage Gap in Cochiti is 26.2%.
Women in Cochiti earn 73.8 cents for every dollar earned by a man.
What is Inequality or Gini Index in Cochiti?
Inequality or Gini Index in Cochiti is 0.57.
What is the Total Population of Cochiti?
Total Population of Cochiti is 484.
What is the Total Male Population of Cochiti?
Total Male Population of Cochiti is 244.
What is the Total Female Population of Cochiti?
Total Female Population of Cochiti is 240.
What is the Ratio of Males per 100 Females in Cochiti?
There are 101.67 Males per 100 Females in Cochiti.
What is the Ratio of Females per 100 Males in Cochiti?
There are 98.36 Females per 100 Males in Cochiti.
What is the Median Population Age in Cochiti?
Median Population Age in Cochiti is 31.7 Years.
What is the Average Family Size in Cochiti
Average Family Size in Cochiti is 4.3 People.
What is the Average Household Size in Cochiti
Average Household Size in Cochiti is 3.6 People.
How Large is the Labor Force in Cochiti?
There are 241 People in the Labor Forcein in Cochiti.
What is the Percentage of People in the Labor Force in Cochiti?
66.0% of People are in the Labor Force in Cochiti.
What is the Unemployment Rate in Cochiti?
Unemployment Rate in Cochiti is 3.7%.