Ramah, NM Map & Demographics
Ramah Map
Ramah Overview
$61,781
PER CAPITA INCOME
$107,284
AVG FAMILY INCOME
$106,932
AVG HOUSEHOLD INCOME
0.25
INEQUALITY / GINI INDEX
391
TOTAL POPULATION
233
MALE POPULATION
158
FEMALE POPULATION
147.47
MALES / 100 FEMALES
67.81
FEMALES / 100 MALES
54.7
MEDIAN AGE
1.6
AVG FAMILY SIZE
1.6
AVG HOUSEHOLD SIZE
273
LABOR FORCE [ PEOPLE ]
69.8%
PERCENT IN LABOR FORCE
Ramah Zip Codes
Ramah Area Codes
Income in Ramah
Income Overview in Ramah
Per Capita Income in Ramah is $61,781, while median incomes of families and households are $107,284 and $106,932 respectively.
| Characteristic | Number | Measure |
| Per Capita Income | 391 | $61,781 |
| Median Family Income | 201 | $107,284 |
| Mean Family Income | 201 | $135,899 |
| Median Household Income | 232 | $106,932 |
| Mean Household Income | 232 | $119,721 |
| Income Deficit | 201 | $0 |
| Wage / Income Gap (%) | 391 | 0.00% |
| Wage / Income Gap ($) | 391 | 100.00¢ per $1 |
| Gini / Inequality Index | 391 | 0.25 |
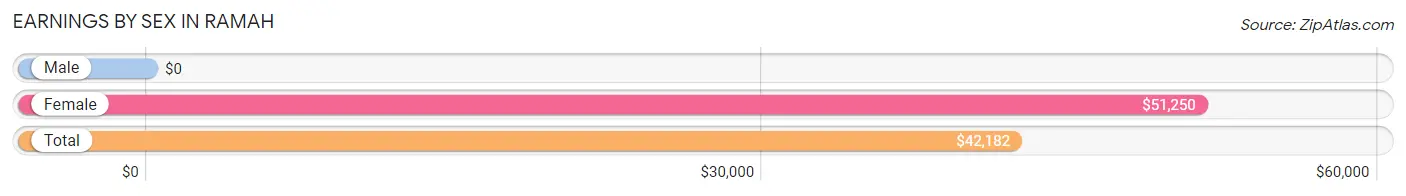
Earnings by Sex in Ramah
| Sex | Number | Average Earnings |
| Male | 207 (73.1%) | $0 |
| Female | 76 (26.9%) | $51,250 |
| Total | 283 (100.0%) | $42,182 |
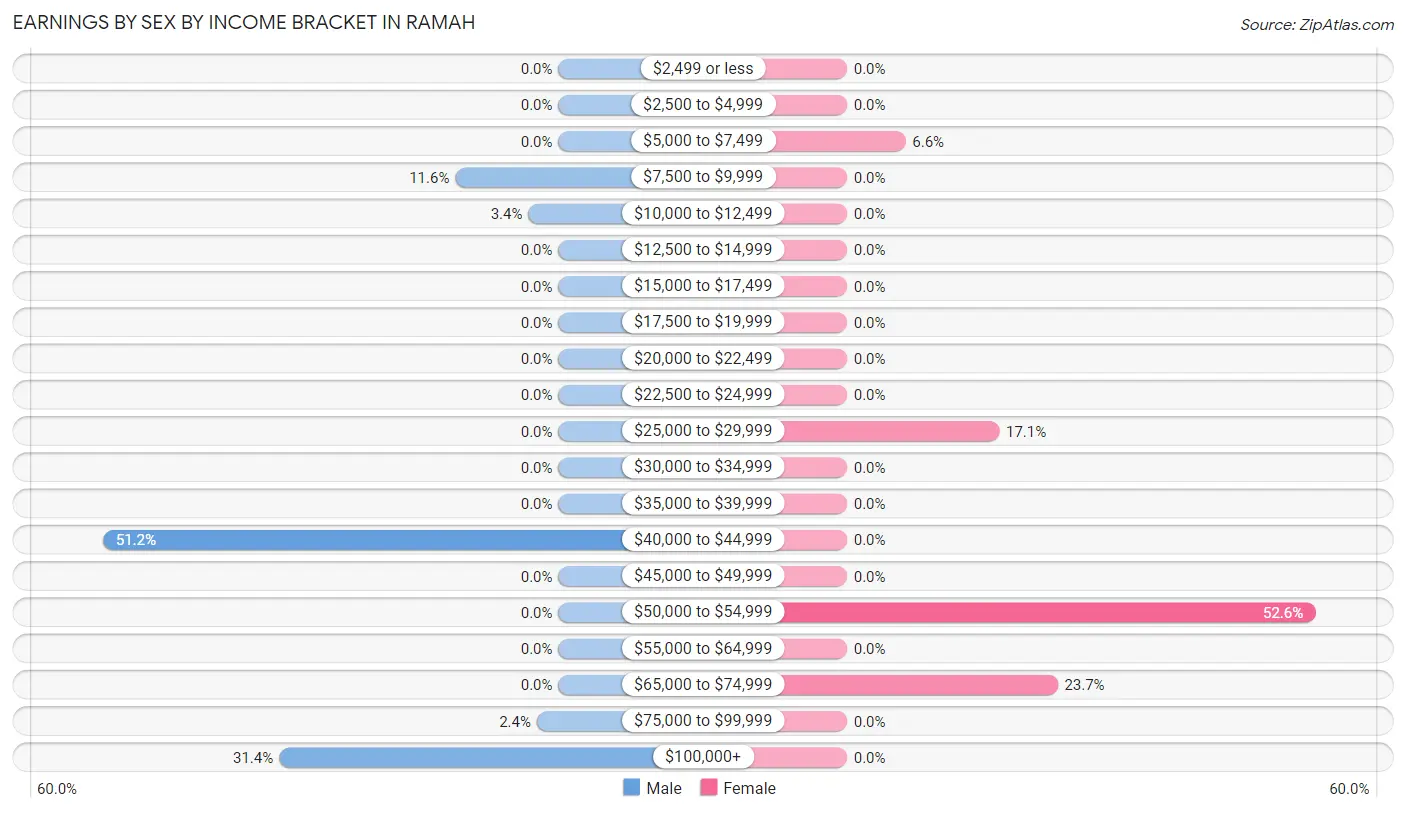
Earnings by Sex by Income Bracket in Ramah
The most common earnings brackets in Ramah are $40,000 to $44,999 for men (106 | 51.2%) and $50,000 to $54,999 for women (40 | 52.6%).
| Income | Male | Female |
| $2,499 or less | 0 (0.0%) | 0 (0.0%) |
| $2,500 to $4,999 | 0 (0.0%) | 0 (0.0%) |
| $5,000 to $7,499 | 0 (0.0%) | 5 (6.6%) |
| $7,500 to $9,999 | 24 (11.6%) | 0 (0.0%) |
| $10,000 to $12,499 | 7 (3.4%) | 0 (0.0%) |
| $12,500 to $14,999 | 0 (0.0%) | 0 (0.0%) |
| $15,000 to $17,499 | 0 (0.0%) | 0 (0.0%) |
| $17,500 to $19,999 | 0 (0.0%) | 0 (0.0%) |
| $20,000 to $22,499 | 0 (0.0%) | 0 (0.0%) |
| $22,500 to $24,999 | 0 (0.0%) | 0 (0.0%) |
| $25,000 to $29,999 | 0 (0.0%) | 13 (17.1%) |
| $30,000 to $34,999 | 0 (0.0%) | 0 (0.0%) |
| $35,000 to $39,999 | 0 (0.0%) | 0 (0.0%) |
| $40,000 to $44,999 | 106 (51.2%) | 0 (0.0%) |
| $45,000 to $49,999 | 0 (0.0%) | 0 (0.0%) |
| $50,000 to $54,999 | 0 (0.0%) | 40 (52.6%) |
| $55,000 to $64,999 | 0 (0.0%) | 0 (0.0%) |
| $65,000 to $74,999 | 0 (0.0%) | 18 (23.7%) |
| $75,000 to $99,999 | 5 (2.4%) | 0 (0.0%) |
| $100,000+ | 65 (31.4%) | 0 (0.0%) |
| Total | 207 (100.0%) | 76 (100.0%) |
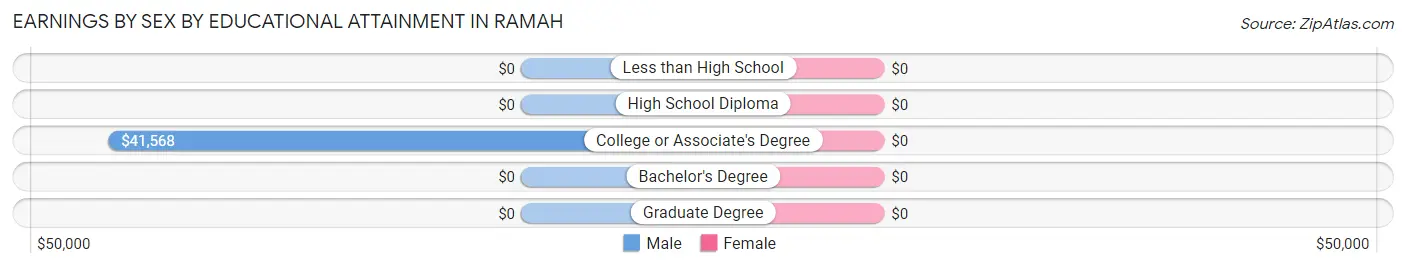
Earnings by Sex by Educational Attainment in Ramah
| Educational Attainment | Male Income | Female Income |
| Less than High School | - | - |
| High School Diploma | - | - |
| College or Associate's Degree | $41,568 | $0 |
| Bachelor's Degree | - | - |
| Graduate Degree | - | - |
| Total | - | - |
Family Income in Ramah
Family Income Brackets in Ramah
According to the Ramah family income data, there are 148 families falling into the $100,000 to $149,999 income range, which is the most common income bracket and makes up 73.6% of all families.
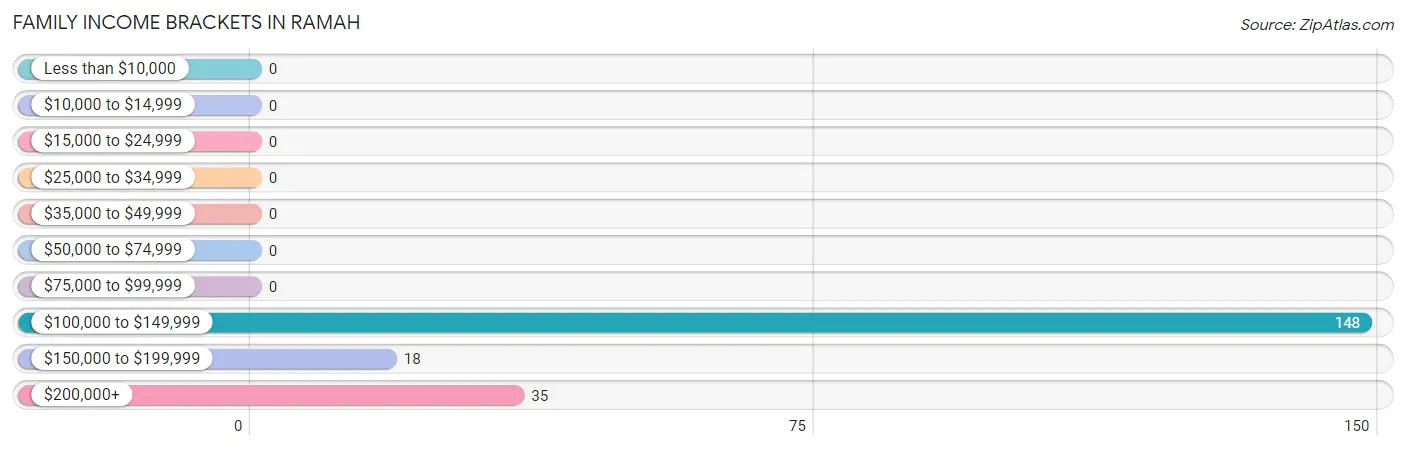
| Income Bracket | # Families | % Families |
| Less than $10,000 | 0 | 0.0% |
| $10,000 to $14,999 | 0 | 0.0% |
| $15,000 to $24,999 | 0 | 0.0% |
| $25,000 to $34,999 | 0 | 0.0% |
| $35,000 to $49,999 | 0 | 0.0% |
| $50,000 to $74,999 | 0 | 0.0% |
| $75,000 to $99,999 | 0 | 0.0% |
| $100,000 to $149,999 | 148 | 73.6% |
| $150,000 to $199,999 | 18 | 9.0% |
| $200,000+ | 35 | 17.4% |
Family Income by Famaliy Size in Ramah
2-person families (201 | 100.0%) account for the highest median family income in Ramah with $107,284 per family, while 2-person families (201 | 100.0%) have the highest median income of $53,642 per family member.
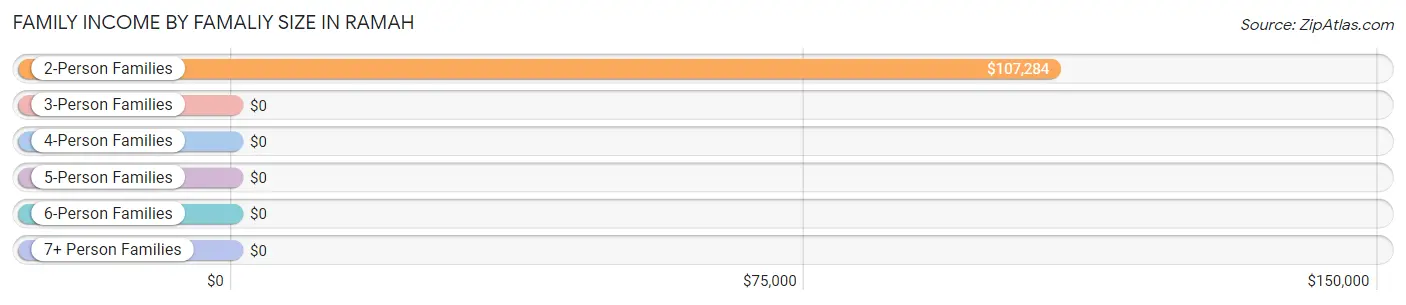
| Income Bracket | # Families | Median Income |
| 2-Person Families | 201 (100.0%) | $107,284 |
| 3-Person Families | 0 (0.0%) | $0 |
| 4-Person Families | 0 (0.0%) | $0 |
| 5-Person Families | 0 (0.0%) | $0 |
| 6-Person Families | 0 (0.0%) | $0 |
| 7+ Person Families | 0 (0.0%) | $0 |
| Total | 201 (100.0%) | $107,284 |
Family Income by Number of Earners in Ramah
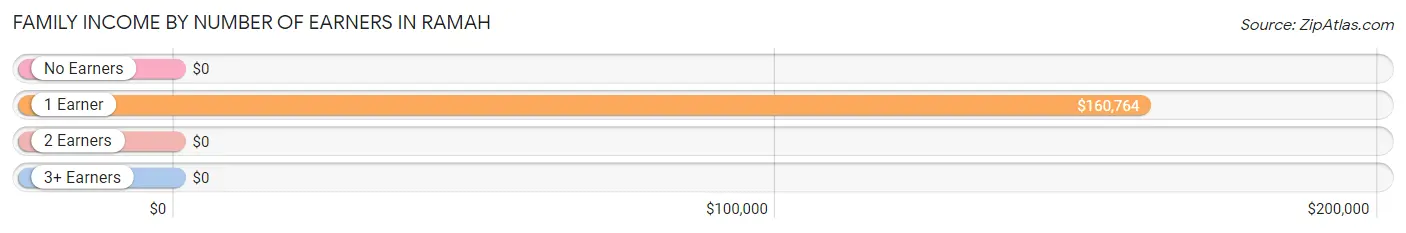
| Number of Earners | # Families | Median Income |
| No Earners | 0 (0.0%) | $0 |
| 1 Earner | 95 (47.3%) | $160,764 |
| 2 Earners | 106 (52.7%) | $0 |
| 3+ Earners | 0 (0.0%) | $0 |
| Total | 201 (100.0%) | $107,284 |
Household Income in Ramah
Household Income Brackets in Ramah
With 148 households falling in the category, the $100,000 to $149,999 income range is the most frequent in Ramah, accounting for 63.8% of all households.
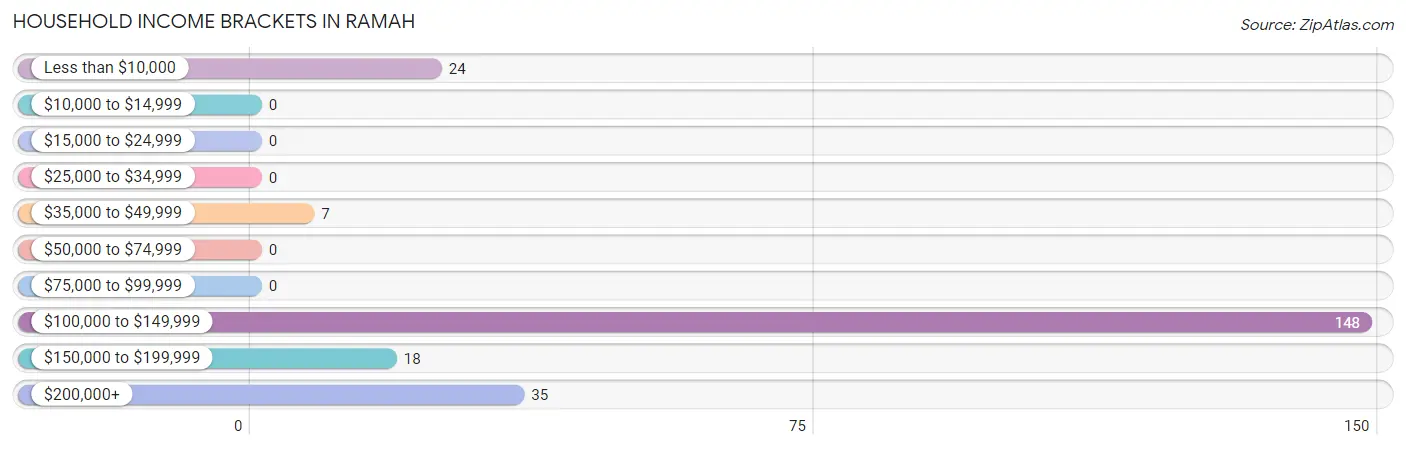
| Income Bracket | # Households | % Households |
| Less than $10,000 | 24 | 10.3% |
| $10,000 to $14,999 | 0 | 0.0% |
| $15,000 to $24,999 | 0 | 0.0% |
| $25,000 to $34,999 | 0 | 0.0% |
| $35,000 to $49,999 | 7 | 3.0% |
| $50,000 to $74,999 | 0 | 0.0% |
| $75,000 to $99,999 | 0 | 0.0% |
| $100,000 to $149,999 | 148 | 63.8% |
| $150,000 to $199,999 | 18 | 7.8% |
| $200,000+ | 35 | 15.1% |
Household Income by Householder Age in Ramah
The median household income in Ramah is $106,932, with the highest median household income of $209,375 found in the 65+ years age bracket for the primary householder. A total of 43 households (18.5%) fall into this category.
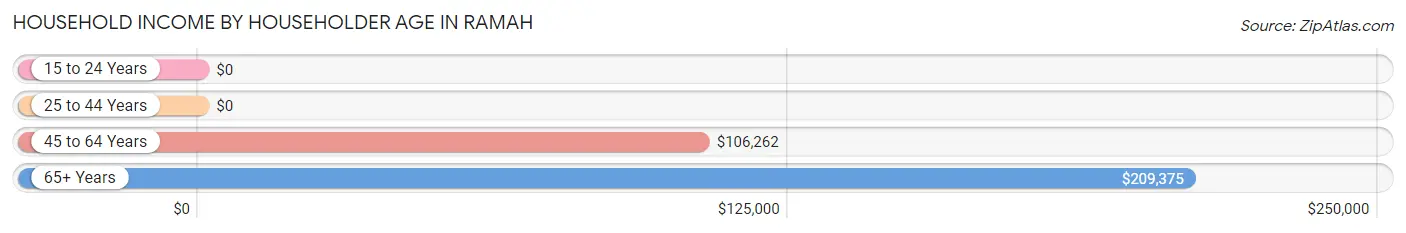
| Income Bracket | # Households | Median Income |
| 15 to 24 Years | 0 (0.0%) | $0 |
| 25 to 44 Years | 34 (14.7%) | $0 |
| 45 to 64 Years | 155 (66.8%) | $106,262 |
| 65+ Years | 43 (18.5%) | $209,375 |
| Total | 232 (100.0%) | $106,932 |
Poverty in Ramah
Income Below Poverty by Sex and Age in Ramah
With 13.3% poverty level for males and 5.1% for females among the residents of Ramah, 25 to 34 year old males and 18 to 24 year old females are the most vulnerable to poverty, with 7 males (100.0%) and 5 females (55.6%) in their respective age groups living below the poverty level.
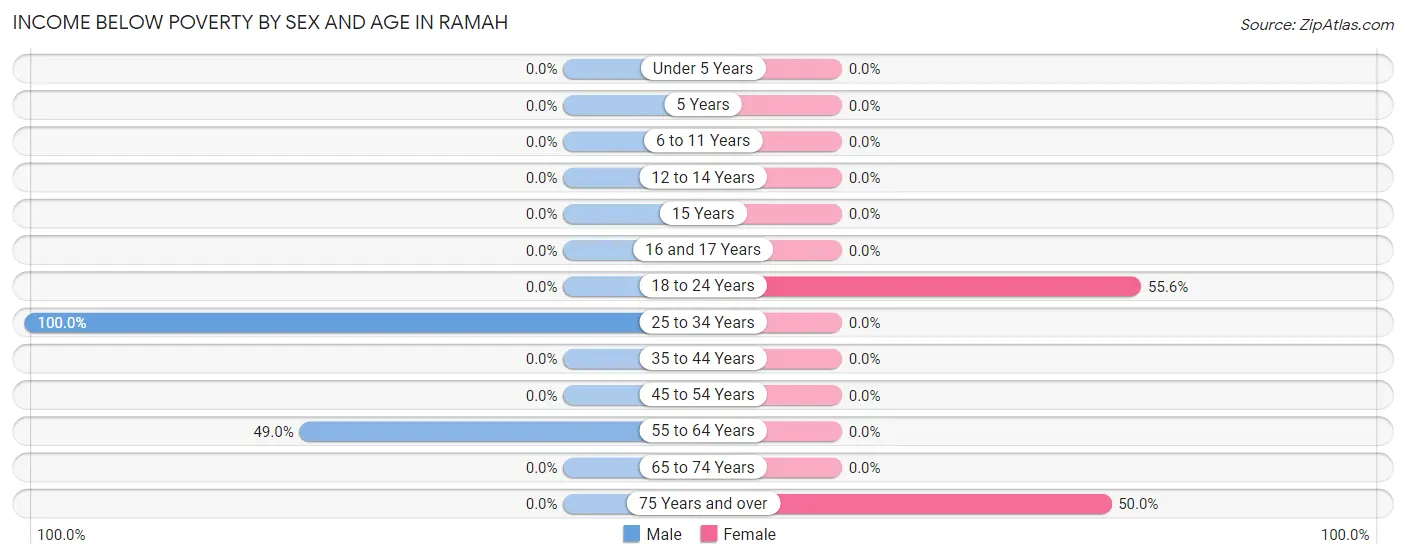
| Age Bracket | Male | Female |
| Under 5 Years | 0 (0.0%) | 0 (0.0%) |
| 5 Years | 0 (0.0%) | 0 (0.0%) |
| 6 to 11 Years | 0 (0.0%) | 0 (0.0%) |
| 12 to 14 Years | 0 (0.0%) | 0 (0.0%) |
| 15 Years | 0 (0.0%) | 0 (0.0%) |
| 16 and 17 Years | 0 (0.0%) | 0 (0.0%) |
| 18 to 24 Years | 0 (0.0%) | 5 (55.6%) |
| 25 to 34 Years | 7 (100.0%) | 0 (0.0%) |
| 35 to 44 Years | 0 (0.0%) | 0 (0.0%) |
| 45 to 54 Years | 0 (0.0%) | 0 (0.0%) |
| 55 to 64 Years | 24 (49.0%) | 0 (0.0%) |
| 65 to 74 Years | 0 (0.0%) | 0 (0.0%) |
| 75 Years and over | 0 (0.0%) | 3 (50.0%) |
| Total | 31 (13.3%) | 8 (5.1%) |
Income Above Poverty by Sex and Age in Ramah
According to the poverty statistics in Ramah, males aged 35 to 44 years and females aged 25 to 34 years are the age groups that are most secure financially, with 100.0% of males and 100.0% of females in these age groups living above the poverty line.
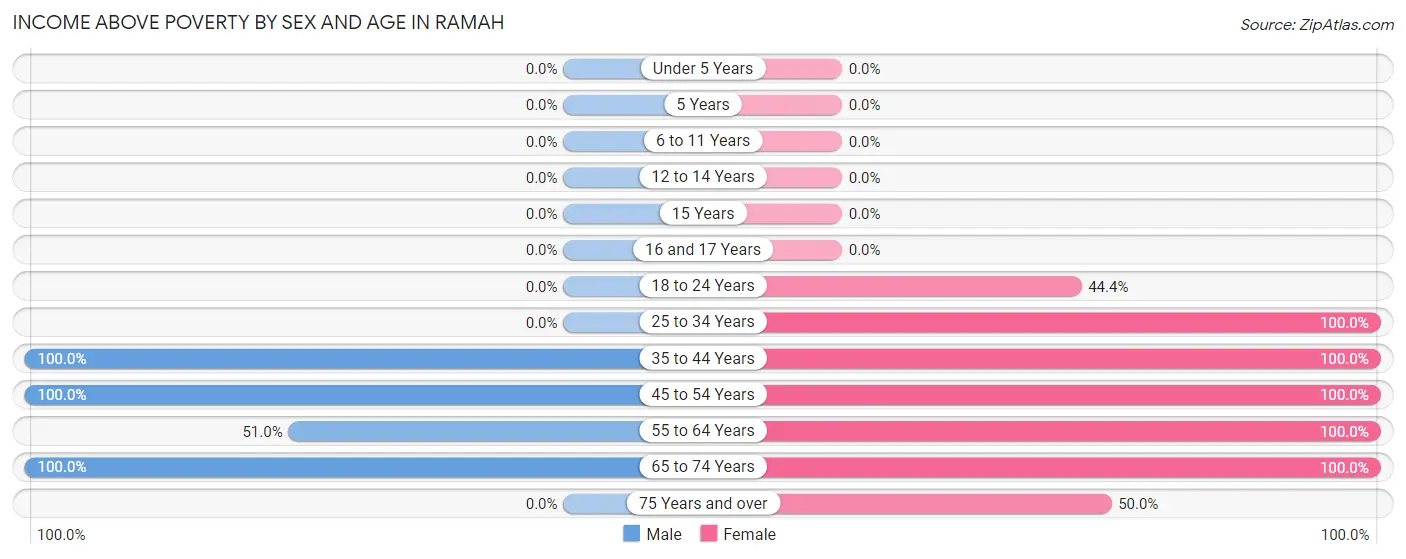
| Age Bracket | Male | Female |
| Under 5 Years | 0 (0.0%) | 0 (0.0%) |
| 5 Years | 0 (0.0%) | 0 (0.0%) |
| 6 to 11 Years | 0 (0.0%) | 0 (0.0%) |
| 12 to 14 Years | 0 (0.0%) | 0 (0.0%) |
| 15 Years | 0 (0.0%) | 0 (0.0%) |
| 16 and 17 Years | 0 (0.0%) | 0 (0.0%) |
| 18 to 24 Years | 0 (0.0%) | 4 (44.4%) |
| 25 to 34 Years | 0 (0.0%) | 13 (100.0%) |
| 35 to 44 Years | 32 (100.0%) | 17 (100.0%) |
| 45 to 54 Years | 106 (100.0%) | 40 (100.0%) |
| 55 to 64 Years | 25 (51.0%) | 25 (100.0%) |
| 65 to 74 Years | 39 (100.0%) | 48 (100.0%) |
| 75 Years and over | 0 (0.0%) | 3 (50.0%) |
| Total | 202 (86.7%) | 150 (94.9%) |
Income Below Poverty Among Married-Couple Families in Ramah
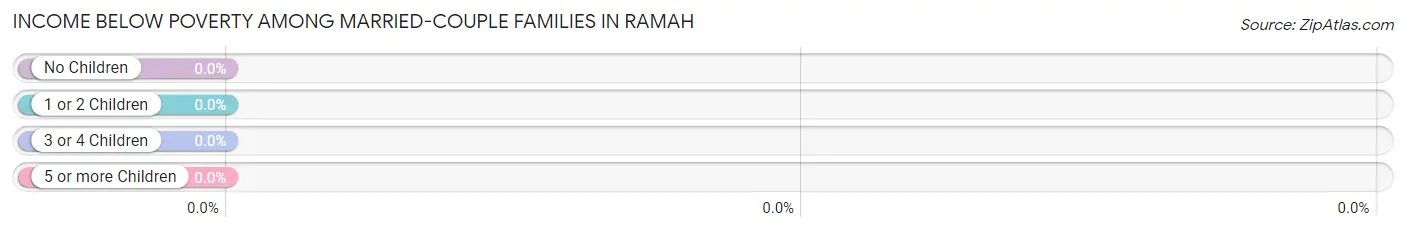
| Children | Above Poverty | Below Poverty |
| No Children | 197 (100.0%) | 0 (0.0%) |
| 1 or 2 Children | 0 (0.0%) | 0 (0.0%) |
| 3 or 4 Children | 0 (0.0%) | 0 (0.0%) |
| 5 or more Children | 0 (0.0%) | 0 (0.0%) |
| Total | 197 (100.0%) | 0 (0.0%) |
Income Below Poverty Among Single-Parent Households in Ramah
| Children | Single Father | Single Mother |
| No Children | 0 (0.0%) | 0 (0.0%) |
| 1 or 2 Children | 0 (0.0%) | 0 (0.0%) |
| 3 or 4 Children | 0 (0.0%) | 0 (0.0%) |
| 5 or more Children | 0 (0.0%) | 0 (0.0%) |
| Total | 0 (0.0%) | 0 (0.0%) |
Income Below Poverty Among Married-Couple vs Single-Parent Households in Ramah
| Children | Married-Couple Families | Single-Parent Households |
| No Children | 0 (0.0%) | 0 (0.0%) |
| 1 or 2 Children | 0 (0.0%) | 0 (0.0%) |
| 3 or 4 Children | 0 (0.0%) | 0 (0.0%) |
| 5 or more Children | 0 (0.0%) | 0 (0.0%) |
| Total | 0 (0.0%) | 0 (0.0%) |
Race in Ramah
The most populous races in Ramah are White / Caucasian (331 | 84.7%), Hispanic or Latino (55 | 14.1%), and Native / Alaskan (26 | 6.7%).
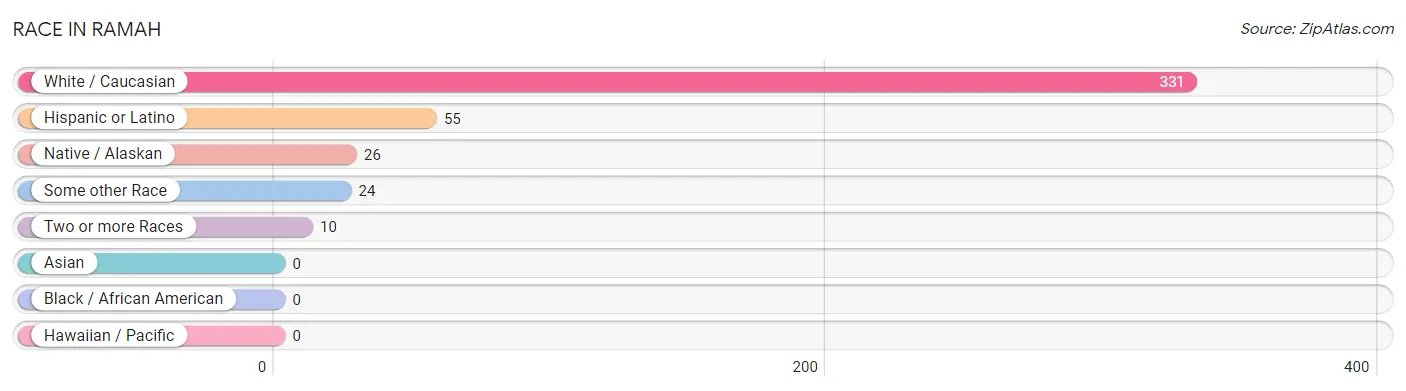
| Race | # Population | % Population |
| Asian | 0 | 0.0% |
| Black / African American | 0 | 0.0% |
| Hawaiian / Pacific | 0 | 0.0% |
| Hispanic or Latino | 55 | 14.1% |
| Native / Alaskan | 26 | 6.7% |
| White / Caucasian | 331 | 84.7% |
| Two or more Races | 10 | 2.6% |
| Some other Race | 24 | 6.1% |
| Total | 391 | 100.0% |
Ancestry in Ramah
The most populous ancestries reported in Ramah are European (178 | 45.5%), Mexican (32 | 8.2%), Navajo (26 | 6.7%), Spanish (23 | 5.9%), and Austrian (18 | 4.6%), together accounting for 70.8% of all Ramah residents.
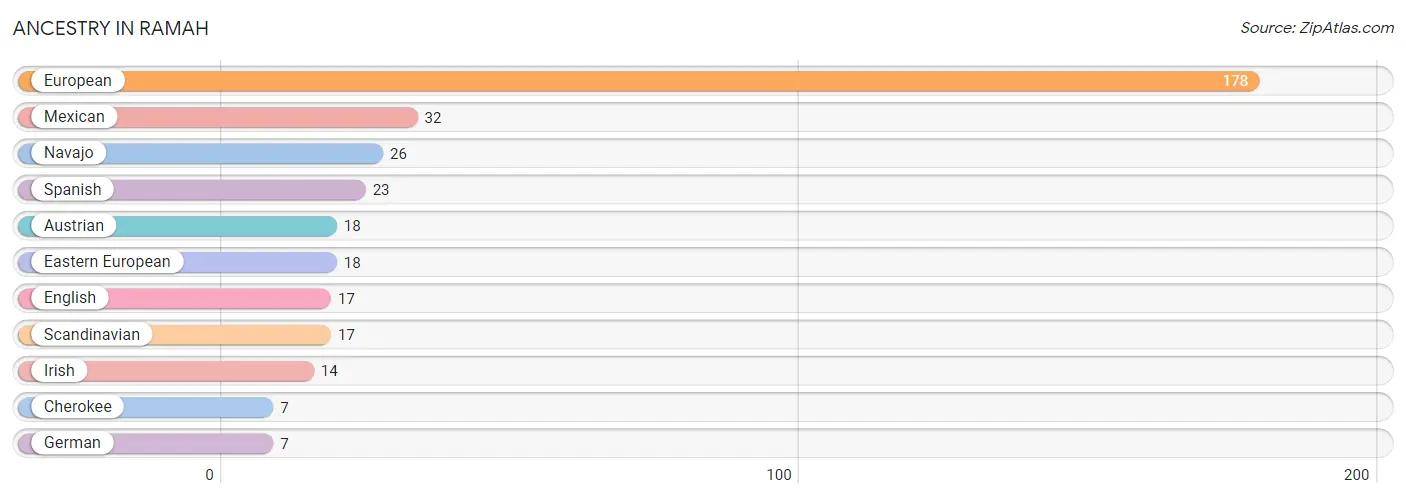
| Ancestry | # Population | % Population |
| Austrian | 18 | 4.6% |
| Cherokee | 7 | 1.8% |
| Eastern European | 18 | 4.6% |
| English | 17 | 4.3% |
| European | 178 | 45.5% |
| German | 7 | 1.8% |
| Irish | 14 | 3.6% |
| Mexican | 32 | 8.2% |
| Navajo | 26 | 6.7% |
| Scandinavian | 17 | 4.3% |
| Spanish | 23 | 5.9% | View All 11 Rows |
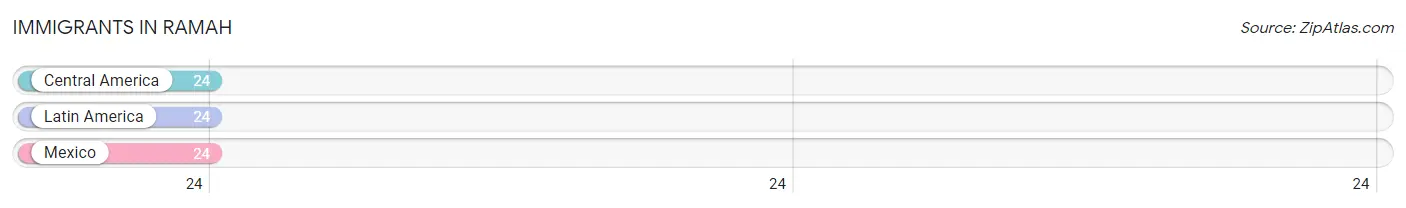
Immigrants in Ramah
The most numerous immigrant groups reported in Ramah came from Central America (24 | 6.1%), Latin America (24 | 6.1%), and Mexico (24 | 6.1%), together accounting for 18.4% of all Ramah residents.
| Immigration Origin | # Population | % Population |
| Central America | 24 | 6.1% |
| Latin America | 24 | 6.1% |
| Mexico | 24 | 6.1% | View All 3 Rows |
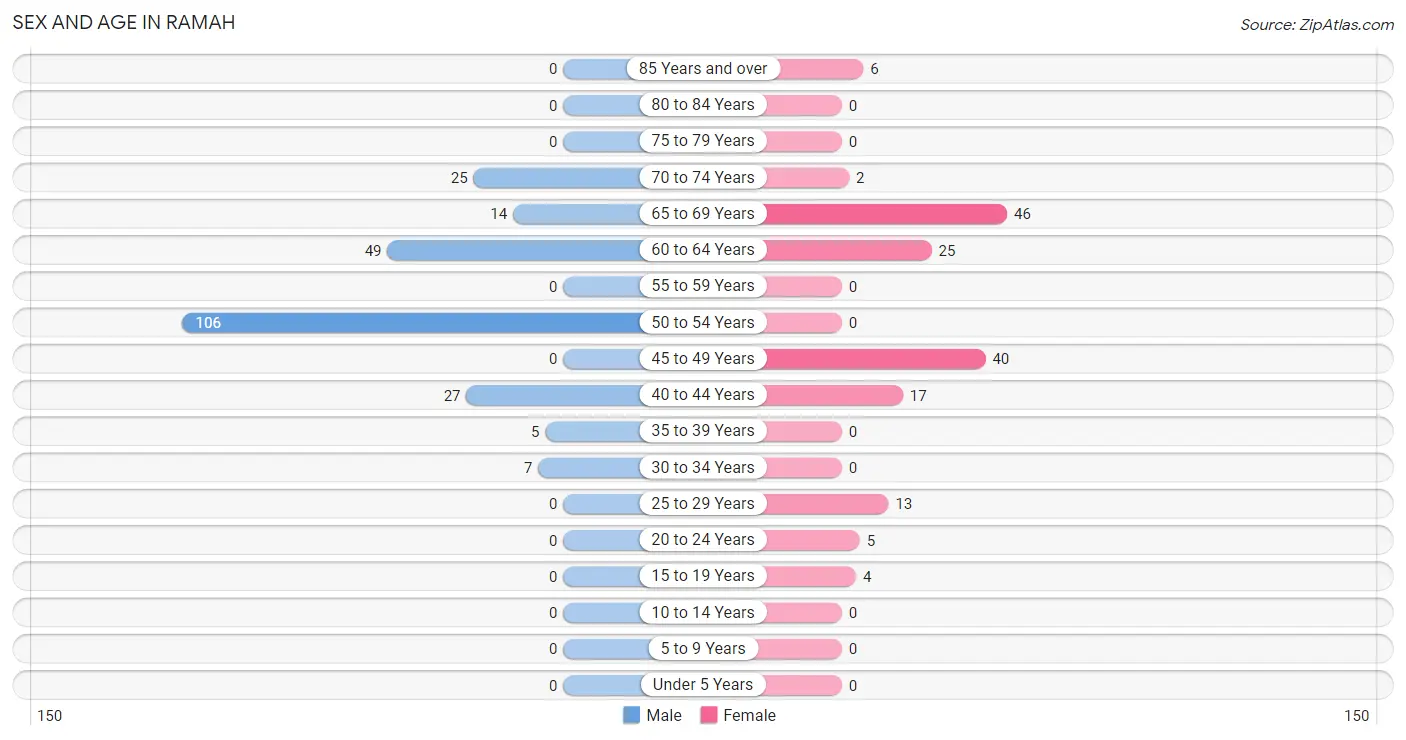
Sex and Age in Ramah
Sex and Age in Ramah
The most populous age groups in Ramah are 50 to 54 Years (106 | 45.5%) for men and 65 to 69 Years (46 | 29.1%) for women.
| Age Bracket | Male | Female |
| Under 5 Years | 0 (0.0%) | 0 (0.0%) |
| 5 to 9 Years | 0 (0.0%) | 0 (0.0%) |
| 10 to 14 Years | 0 (0.0%) | 0 (0.0%) |
| 15 to 19 Years | 0 (0.0%) | 4 (2.5%) |
| 20 to 24 Years | 0 (0.0%) | 5 (3.2%) |
| 25 to 29 Years | 0 (0.0%) | 13 (8.2%) |
| 30 to 34 Years | 7 (3.0%) | 0 (0.0%) |
| 35 to 39 Years | 5 (2.1%) | 0 (0.0%) |
| 40 to 44 Years | 27 (11.6%) | 17 (10.8%) |
| 45 to 49 Years | 0 (0.0%) | 40 (25.3%) |
| 50 to 54 Years | 106 (45.5%) | 0 (0.0%) |
| 55 to 59 Years | 0 (0.0%) | 0 (0.0%) |
| 60 to 64 Years | 49 (21.0%) | 25 (15.8%) |
| 65 to 69 Years | 14 (6.0%) | 46 (29.1%) |
| 70 to 74 Years | 25 (10.7%) | 2 (1.3%) |
| 75 to 79 Years | 0 (0.0%) | 0 (0.0%) |
| 80 to 84 Years | 0 (0.0%) | 0 (0.0%) |
| 85 Years and over | 0 (0.0%) | 6 (3.8%) |
| Total | 233 (100.0%) | 158 (100.0%) |
Families and Households in Ramah
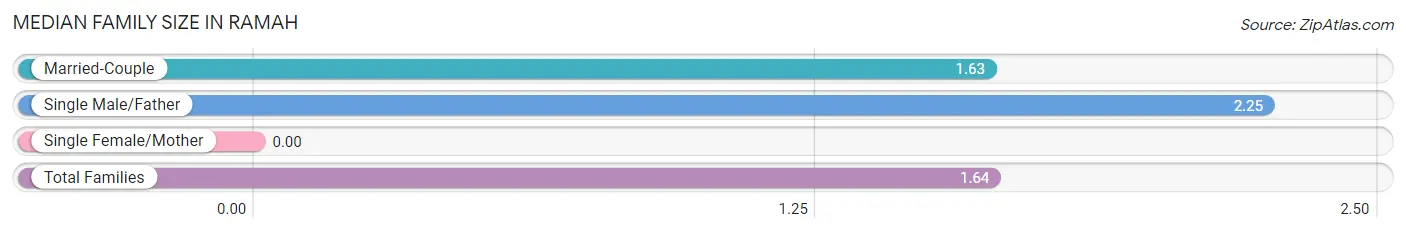
Median Family Size in Ramah
| Family Type | # Families | Family Size |
| Married-Couple | 197 (98.0%) | 1.63 |
| Single Male/Father | 4 (2.0%) | 2.25 |
| Single Female/Mother | 0 (0.0%) | - |
| Total Families | 201 (100.0%) | 1.64 |
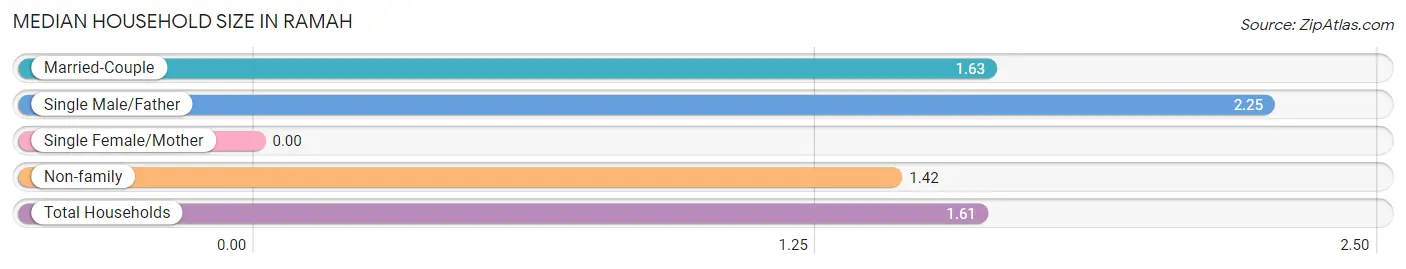
Median Household Size in Ramah
| Household Type | # Households | Household Size |
| Married-Couple | 197 (84.9%) | 1.63 |
| Single Male/Father | 4 (1.7%) | 2.25 |
| Single Female/Mother | 0 (0.0%) | - |
| Non-family | 31 (13.4%) | 1.42 |
| Total Households | 232 (100.0%) | 1.61 |
Household Size by Marriage Status in Ramah
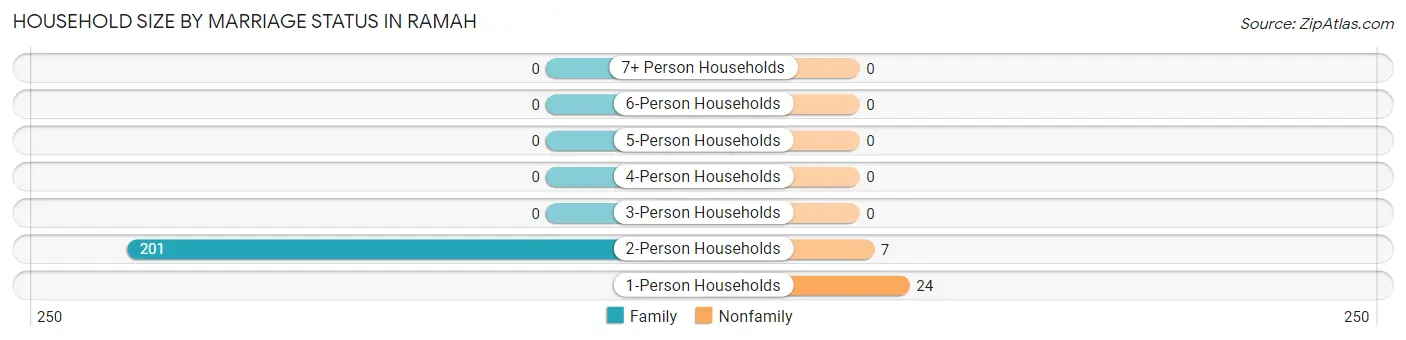
Out of a total of 232 households in Ramah, 201 (86.6%) are family households, while 31 (13.4%) are nonfamily households. The most numerous type of family households are 2-person households, comprising 201, and the most common type of nonfamily households are 1-person households, comprising 24.
| Household Size | Family Households | Nonfamily Households |
| 1-Person Households | - | 24 (10.3%) |
| 2-Person Households | 201 (86.6%) | 7 (3.0%) |
| 3-Person Households | 0 (0.0%) | 0 (0.0%) |
| 4-Person Households | 0 (0.0%) | 0 (0.0%) |
| 5-Person Households | 0 (0.0%) | 0 (0.0%) |
| 6-Person Households | 0 (0.0%) | 0 (0.0%) |
| 7+ Person Households | 0 (0.0%) | 0 (0.0%) |
| Total | 201 (86.6%) | 31 (13.4%) |
Female Fertility in Ramah
Fertility by Age in Ramah
| Age Bracket | Women with Births | Births / 1,000 Women |
| 15 to 19 years | 0 (0.0%) | 0.0 |
| 20 to 34 years | 0 (0.0%) | 0.0 |
| 35 to 50 years | 0 (0.0%) | 0.0 |
| Total | 0 (0.0%) | 0.0 |
Fertility by Age by Marriage Status in Ramah
| Age Bracket | Married | Unmarried |
| 15 to 19 years | 0 (0.0%) | 0 (0.0%) |
| 20 to 34 years | 0 (0.0%) | 0 (0.0%) |
| 35 to 50 years | 0 (0.0%) | 0 (0.0%) |
| Total | 0 (0.0%) | 0 (0.0%) |
Fertility by Education in Ramah
| Educational Attainment | Women with Births | Births / 1,000 Women |
| Less than High School | 0 (0.0%) | 0.0 |
| High School Diploma | 0 (0.0%) | 0.0 |
| College or Associate's Degree | 0 (0.0%) | 0.0 |
| Bachelor's Degree | 0 (0.0%) | 0.0 |
| Graduate Degree | 0 (0.0%) | 0.0 |
| Total | 0 (0.0%) | 0.0 |
Fertility by Education by Marriage Status in Ramah
| Educational Attainment | Married | Unmarried |
| Less than High School | 0 (0.0%) | 0 (0.0%) |
| High School Diploma | 0 (0.0%) | 0 (0.0%) |
| College or Associate's Degree | 0 (0.0%) | 0 (0.0%) |
| Bachelor's Degree | 0 (0.0%) | 0 (0.0%) |
| Graduate Degree | 0 (0.0%) | 0 (0.0%) |
| Total | 0 (0.0%) | 0 (0.0%) |
Employment Characteristics in Ramah
Employment by Class of Employer in Ramah
Among the 260 employed individuals in Ramah, federal government employees (164 | 63.1%), local government employees (48 | 18.5%), and self-employed (not incorporated) (24 | 9.2%) make up the most common classes of employment.
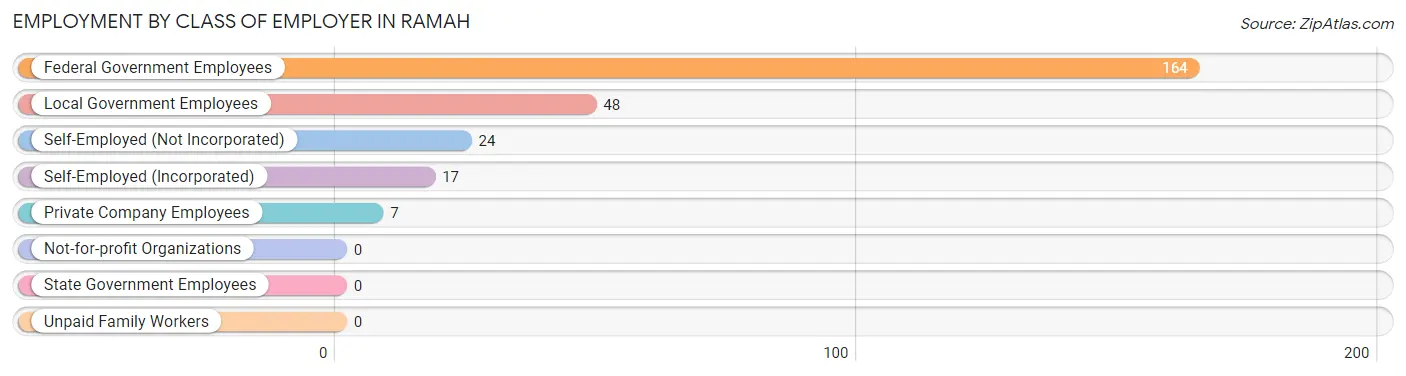
| Employer Class | # Employees | % Employees |
| Private Company Employees | 7 | 2.7% |
| Self-Employed (Incorporated) | 17 | 6.5% |
| Self-Employed (Not Incorporated) | 24 | 9.2% |
| Not-for-profit Organizations | 0 | 0.0% |
| Local Government Employees | 48 | 18.5% |
| State Government Employees | 0 | 0.0% |
| Federal Government Employees | 164 | 63.1% |
| Unpaid Family Workers | 0 | 0.0% |
| Total | 260 | 100.0% |
Employment Status by Age in Ramah
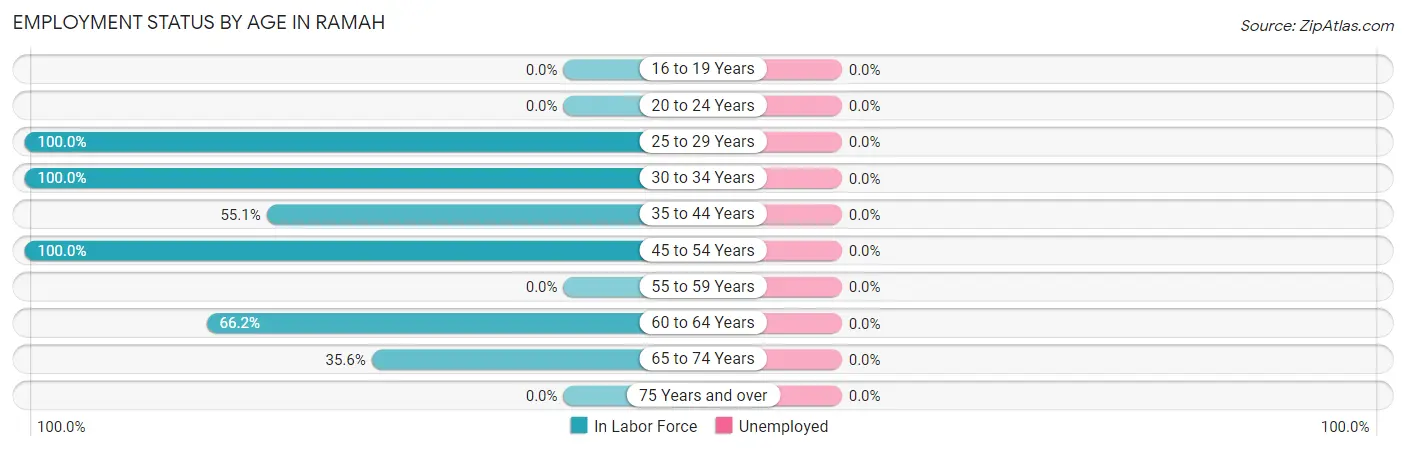
| Age Bracket | In Labor Force | Unemployed |
| 16 to 19 Years | 0 (0.0%) | 0 (0.0%) |
| 20 to 24 Years | 0 (0.0%) | 0 (0.0%) |
| 25 to 29 Years | 13 (100.0%) | 0 (0.0%) |
| 30 to 34 Years | 7 (100.0%) | 0 (0.0%) |
| 35 to 44 Years | 27 (55.1%) | 0 (0.0%) |
| 45 to 54 Years | 146 (100.0%) | 0 (0.0%) |
| 55 to 59 Years | 0 (0.0%) | 0 (0.0%) |
| 60 to 64 Years | 49 (66.2%) | 0 (0.0%) |
| 65 to 74 Years | 31 (35.6%) | 0 (0.0%) |
| 75 Years and over | 0 (0.0%) | 0 (0.0%) |
| Total | 273 (69.8%) | 0 (0.0%) |
Employment Status by Educational Attainment in Ramah
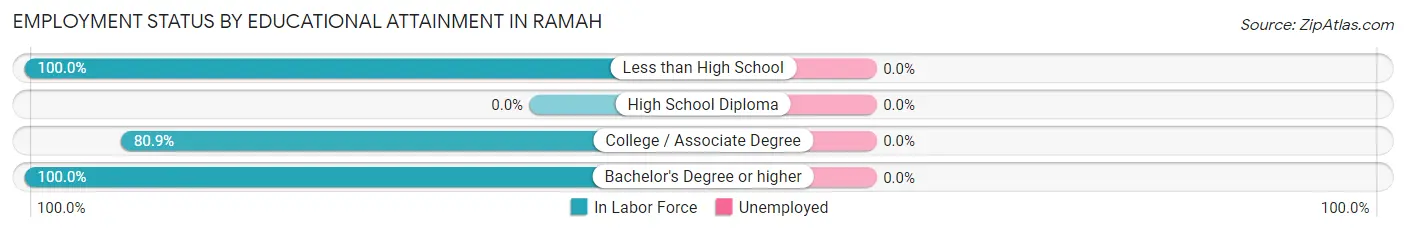
| Educational Attainment | In Labor Force | Unemployed |
| Less than High School | 24 (100.0%) | 0 (0.0%) |
| High School Diploma | 0 (0.0%) | 0 (0.0%) |
| College / Associate Degree | 178 (80.9%) | 0 (0.0%) |
| Bachelor's Degree or higher | 40 (100.0%) | 0 (0.0%) |
| Total | 242 (83.7%) | 0 (0.0%) |
Employment Occupations by Sex in Ramah
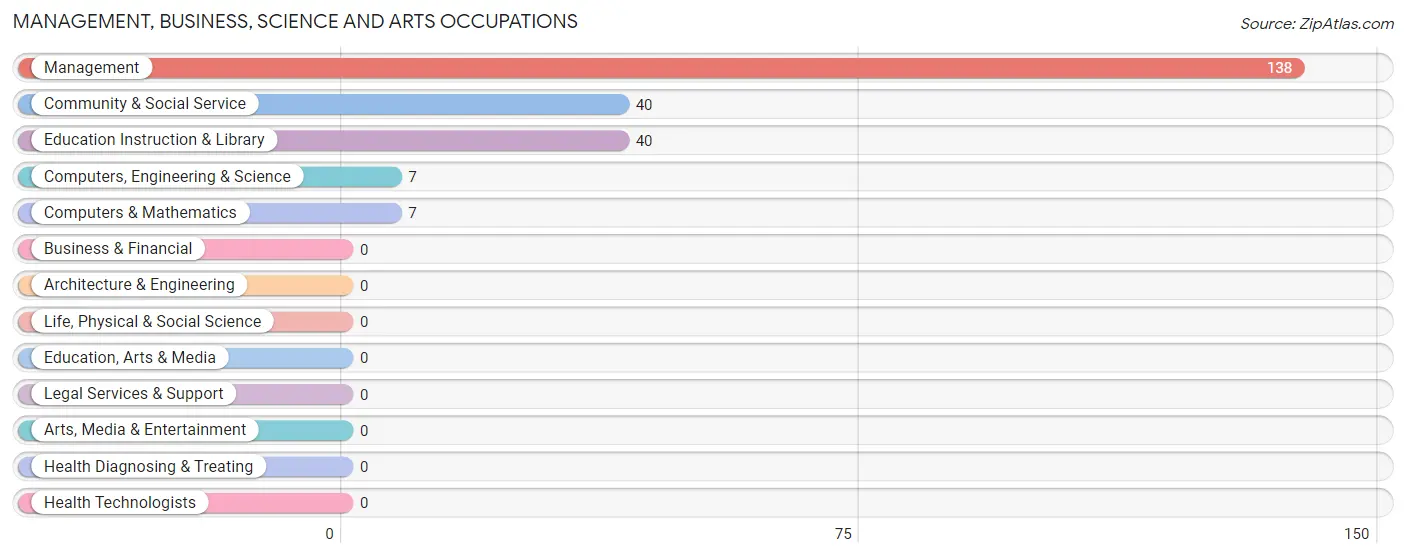
Management, Business, Science and Arts Occupations
The most common Management, Business, Science and Arts occupations in Ramah are Management (138 | 50.5%), Community & Social Service (40 | 14.6%), Education Instruction & Library (40 | 14.6%), Computers, Engineering & Science (7 | 2.6%), and Computers & Mathematics (7 | 2.6%).
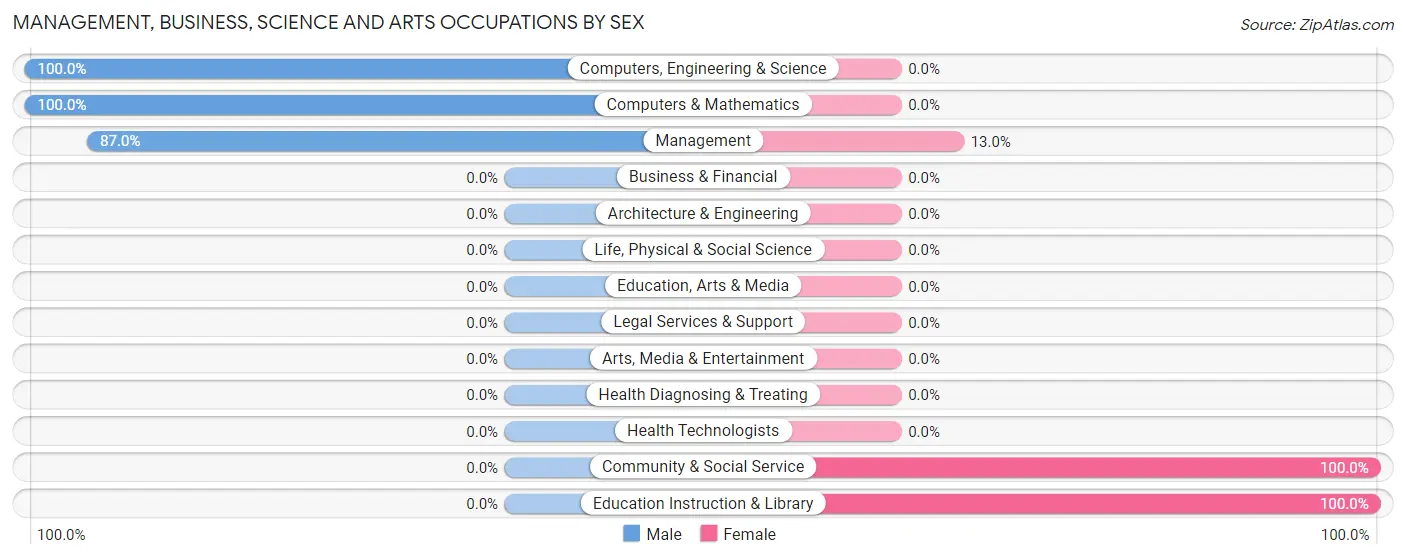
Management, Business, Science and Arts Occupations by Sex
Within the Management, Business, Science and Arts occupations in Ramah, the most male-oriented occupations are Computers, Engineering & Science (100.0%), Computers & Mathematics (100.0%), and Management (87.0%), while the most female-oriented occupations are Community & Social Service (100.0%), Education Instruction & Library (100.0%), and Management (13.0%).
| Occupation | Male | Female |
| Management | 120 (87.0%) | 18 (13.0%) |
| Business & Financial | 0 (0.0%) | 0 (0.0%) |
| Computers, Engineering & Science | 7 (100.0%) | 0 (0.0%) |
| Computers & Mathematics | 7 (100.0%) | 0 (0.0%) |
| Architecture & Engineering | 0 (0.0%) | 0 (0.0%) |
| Life, Physical & Social Science | 0 (0.0%) | 0 (0.0%) |
| Community & Social Service | 0 (0.0%) | 40 (100.0%) |
| Education, Arts & Media | 0 (0.0%) | 0 (0.0%) |
| Legal Services & Support | 0 (0.0%) | 0 (0.0%) |
| Education Instruction & Library | 0 (0.0%) | 40 (100.0%) |
| Arts, Media & Entertainment | 0 (0.0%) | 0 (0.0%) |
| Health Diagnosing & Treating | 0 (0.0%) | 0 (0.0%) |
| Health Technologists | 0 (0.0%) | 0 (0.0%) |
| Total (Category) | 127 (68.6%) | 58 (31.4%) |
| Total (Overall) | 202 (74.0%) | 71 (26.0%) |
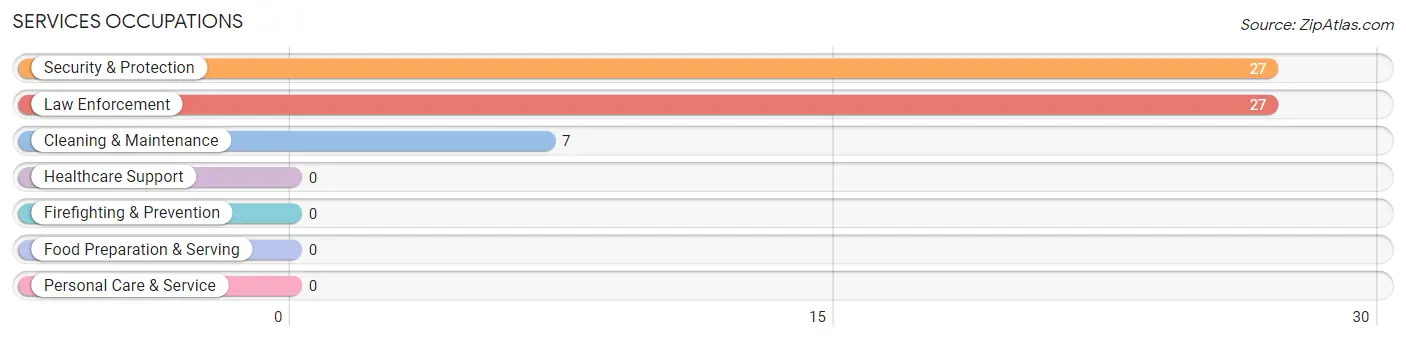
Services Occupations
The most common Services occupations in Ramah are Security & Protection (27 | 9.9%), Law Enforcement (27 | 9.9%), and Cleaning & Maintenance (7 | 2.6%).
Services Occupations by Sex
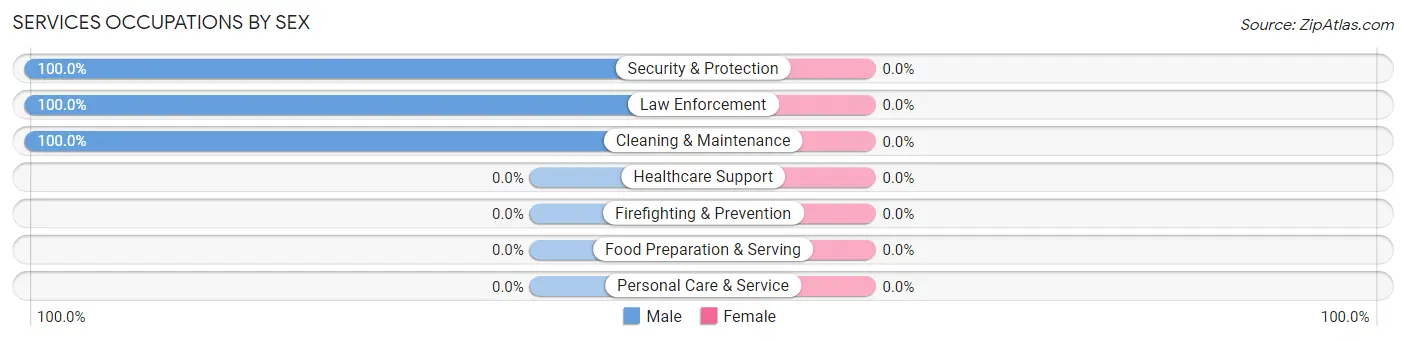
| Occupation | Male | Female |
| Healthcare Support | 0 (0.0%) | 0 (0.0%) |
| Security & Protection | 27 (100.0%) | 0 (0.0%) |
| Firefighting & Prevention | 0 (0.0%) | 0 (0.0%) |
| Law Enforcement | 27 (100.0%) | 0 (0.0%) |
| Food Preparation & Serving | 0 (0.0%) | 0 (0.0%) |
| Cleaning & Maintenance | 7 (100.0%) | 0 (0.0%) |
| Personal Care & Service | 0 (0.0%) | 0 (0.0%) |
| Total (Category) | 34 (100.0%) | 0 (0.0%) |
| Total (Overall) | 202 (74.0%) | 71 (26.0%) |
Sales and Office Occupations
The most common Sales and Office occupations in Ramah are , and Office & Administration (13 | 4.8%).
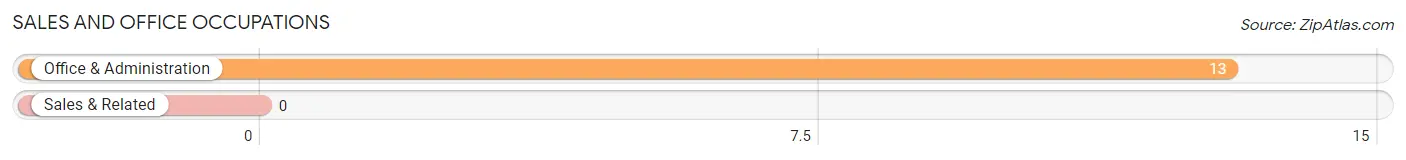
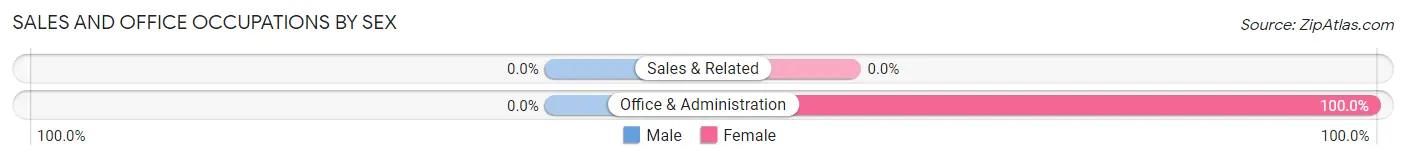
Sales and Office Occupations by Sex
| Occupation | Male | Female |
| Sales & Related | 0 (0.0%) | 0 (0.0%) |
| Office & Administration | 0 (0.0%) | 13 (100.0%) |
| Total (Category) | 0 (0.0%) | 13 (100.0%) |
| Total (Overall) | 202 (74.0%) | 71 (26.0%) |
Natural Resources, Construction and Maintenance Occupations
The most common Natural Resources, Construction and Maintenance occupations in Ramah are , and Construction & Extraction (24 | 8.8%).
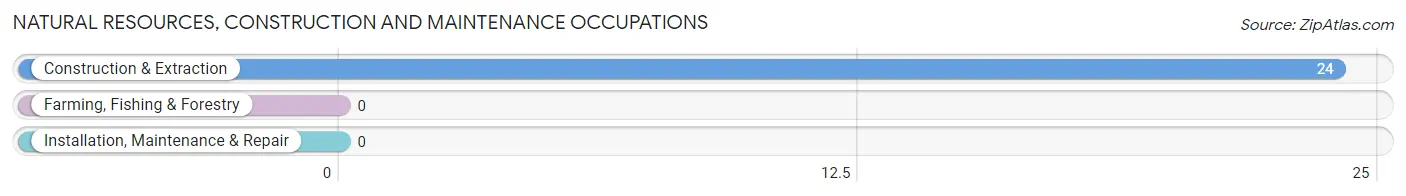
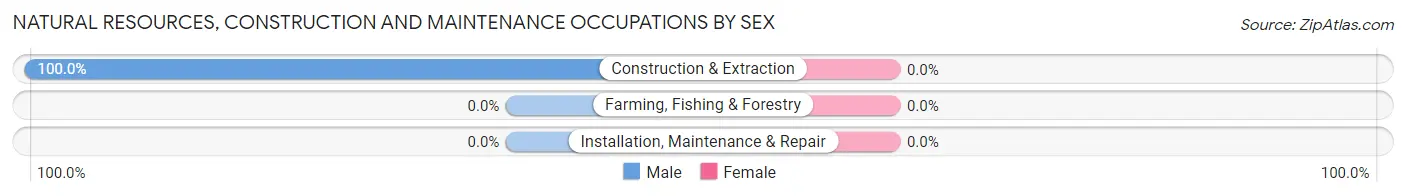
Natural Resources, Construction and Maintenance Occupations by Sex
| Occupation | Male | Female |
| Farming, Fishing & Forestry | 0 (0.0%) | 0 (0.0%) |
| Construction & Extraction | 24 (100.0%) | 0 (0.0%) |
| Installation, Maintenance & Repair | 0 (0.0%) | 0 (0.0%) |
| Total (Category) | 24 (100.0%) | 0 (0.0%) |
| Total (Overall) | 202 (74.0%) | 71 (26.0%) |
Production, Transportation and Moving Occupations
The most common Production, Transportation and Moving occupations in Ramah are , and Production (17 | 6.2%).
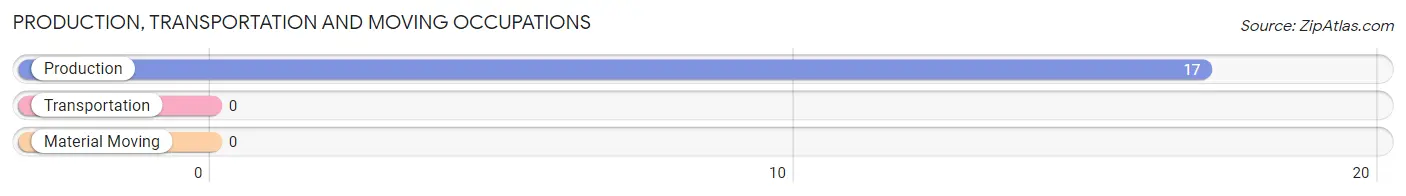
Production, Transportation and Moving Occupations by Sex
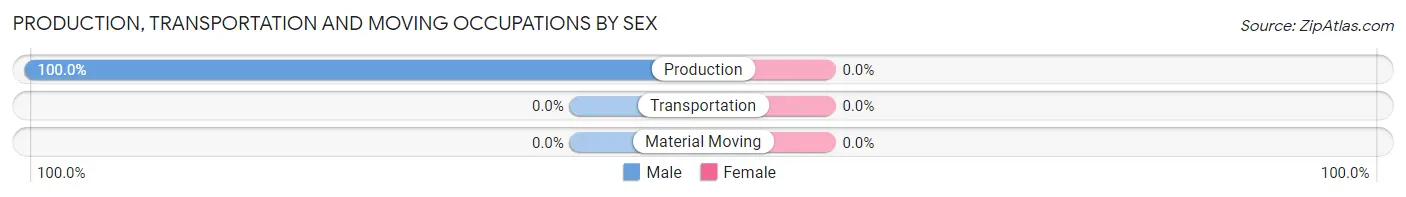
| Occupation | Male | Female |
| Production | 17 (100.0%) | 0 (0.0%) |
| Transportation | 0 (0.0%) | 0 (0.0%) |
| Material Moving | 0 (0.0%) | 0 (0.0%) |
| Total (Category) | 17 (100.0%) | 0 (0.0%) |
| Total (Overall) | 202 (74.0%) | 71 (26.0%) |
Employment Industries by Sex in Ramah
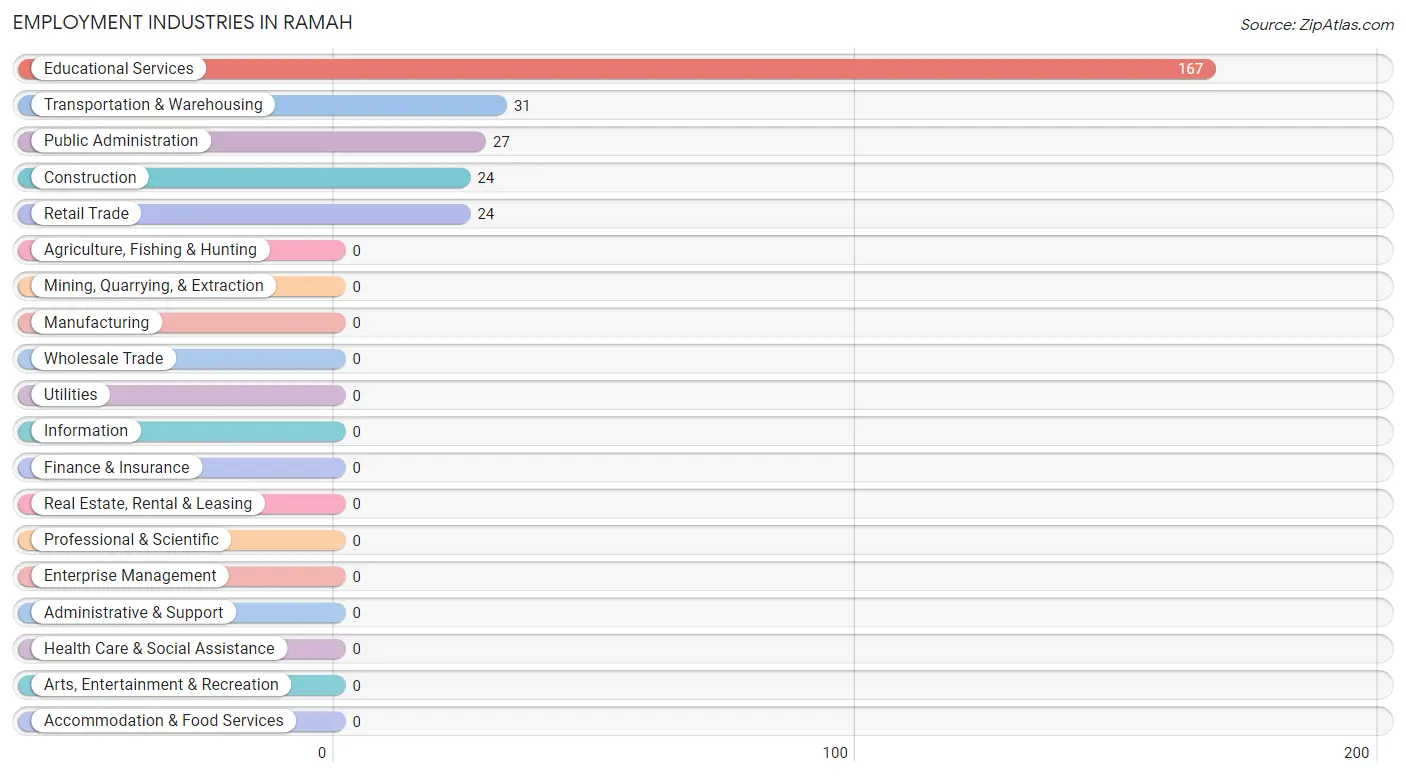
Employment Industries in Ramah
The major employment industries in Ramah include Educational Services (167 | 61.2%), Transportation & Warehousing (31 | 11.4%), Public Administration (27 | 9.9%), Construction (24 | 8.8%), and Retail Trade (24 | 8.8%).
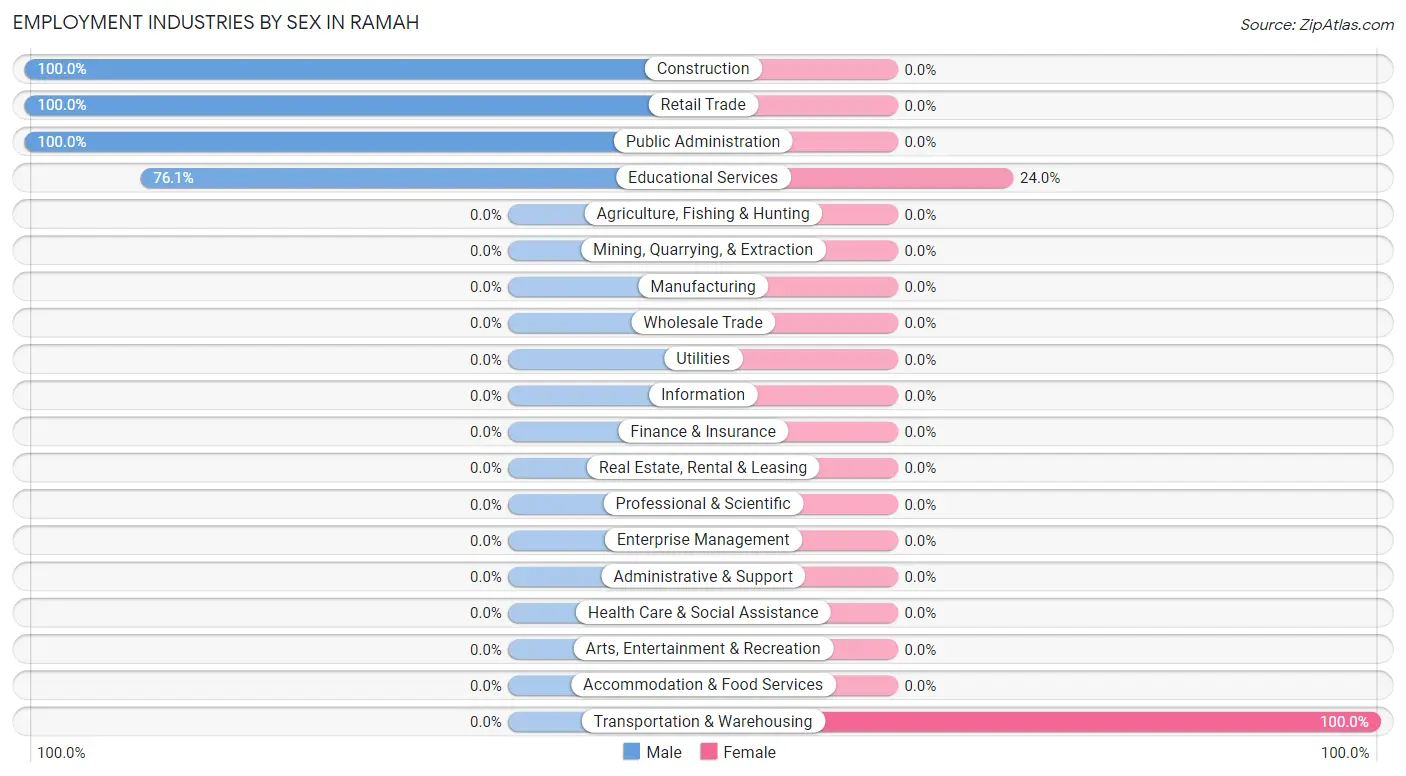
Employment Industries by Sex in Ramah
The Ramah industries that see more men than women are Construction (100.0%), Retail Trade (100.0%), and Public Administration (100.0%), whereas the industries that tend to have a higher number of women are Transportation & Warehousing (100.0%), and Educational Services (23.9%).
| Industry | Male | Female |
| Agriculture, Fishing & Hunting | 0 (0.0%) | 0 (0.0%) |
| Mining, Quarrying, & Extraction | 0 (0.0%) | 0 (0.0%) |
| Construction | 24 (100.0%) | 0 (0.0%) |
| Manufacturing | 0 (0.0%) | 0 (0.0%) |
| Wholesale Trade | 0 (0.0%) | 0 (0.0%) |
| Retail Trade | 24 (100.0%) | 0 (0.0%) |
| Transportation & Warehousing | 0 (0.0%) | 31 (100.0%) |
| Utilities | 0 (0.0%) | 0 (0.0%) |
| Information | 0 (0.0%) | 0 (0.0%) |
| Finance & Insurance | 0 (0.0%) | 0 (0.0%) |
| Real Estate, Rental & Leasing | 0 (0.0%) | 0 (0.0%) |
| Professional & Scientific | 0 (0.0%) | 0 (0.0%) |
| Enterprise Management | 0 (0.0%) | 0 (0.0%) |
| Administrative & Support | 0 (0.0%) | 0 (0.0%) |
| Educational Services | 127 (76.0%) | 40 (23.9%) |
| Health Care & Social Assistance | 0 (0.0%) | 0 (0.0%) |
| Arts, Entertainment & Recreation | 0 (0.0%) | 0 (0.0%) |
| Accommodation & Food Services | 0 (0.0%) | 0 (0.0%) |
| Public Administration | 27 (100.0%) | 0 (0.0%) |
| Total | 202 (74.0%) | 71 (26.0%) |
Education in Ramah
School Enrollment in Ramah
| School Level | # Students | % Students |
| Nursery / Preschool | 0 | 0.0% |
| Kindergarten | 0 | 0.0% |
| Elementary School | 0 | 0.0% |
| Middle School | 0 | 0.0% |
| High School | 0 | 0.0% |
| College / Undergraduate | 0 | 0.0% |
| Graduate / Professional | 0 | 0.0% |
| Total | 0 | 0.0% |
School Enrollment by Age by Funding Source in Ramah
| Age Bracket | Public School | Private School |
| 3 to 4 Year Olds | 0 (0.0%) | 0 (0.0%) |
| 5 to 9 Year Old | 0 (0.0%) | 0 (0.0%) |
| 10 to 14 Year Olds | 0 (0.0%) | 0 (0.0%) |
| 15 to 17 Year Olds | 0 (0.0%) | 0 (0.0%) |
| 18 to 19 Year Olds | 0 (0.0%) | 0 (0.0%) |
| 20 to 24 Year Olds | 0 (0.0%) | 0 (0.0%) |
| 25 to 34 Year Olds | 0 (0.0%) | 0 (0.0%) |
| 35 Years and over | 0 (0.0%) | 0 (0.0%) |
| Total | 0 (0.0%) | 0 (0.0%) |
Educational Attainment by Field of Study in Ramah
Education (57 | 93.4%), and science & technology (4 | 6.6%) are the most common fields of study among 61 individuals in Ramah who have obtained a bachelor's degree or higher.
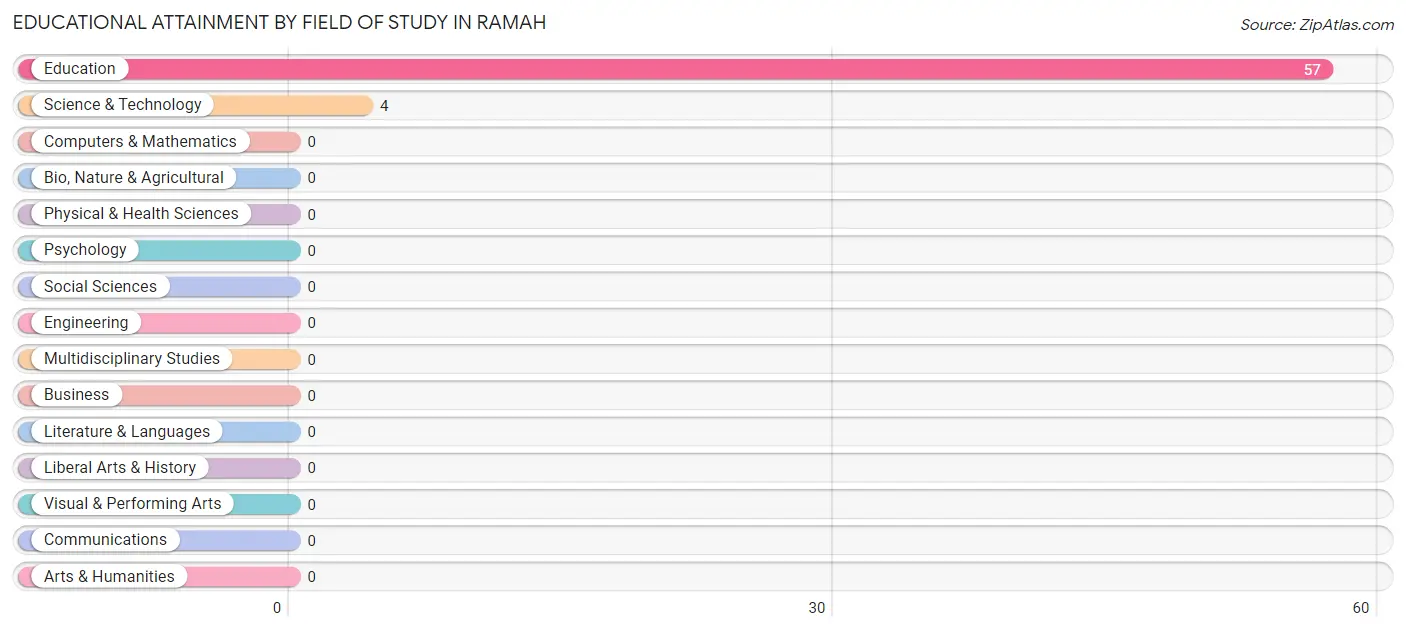
| Field of Study | # Graduates | % Graduates |
| Computers & Mathematics | 0 | 0.0% |
| Bio, Nature & Agricultural | 0 | 0.0% |
| Physical & Health Sciences | 0 | 0.0% |
| Psychology | 0 | 0.0% |
| Social Sciences | 0 | 0.0% |
| Engineering | 0 | 0.0% |
| Multidisciplinary Studies | 0 | 0.0% |
| Science & Technology | 4 | 6.6% |
| Business | 0 | 0.0% |
| Education | 57 | 93.4% |
| Literature & Languages | 0 | 0.0% |
| Liberal Arts & History | 0 | 0.0% |
| Visual & Performing Arts | 0 | 0.0% |
| Communications | 0 | 0.0% |
| Arts & Humanities | 0 | 0.0% |
| Total | 61 | 100.0% |
Transportation & Commute in Ramah
Vehicle Availability by Sex in Ramah
The most prevalent vehicle ownership categories in Ramah are males with 3 vehicles (123, accounting for 60.9%) and females with 3 vehicles (40, making up 212.1%).
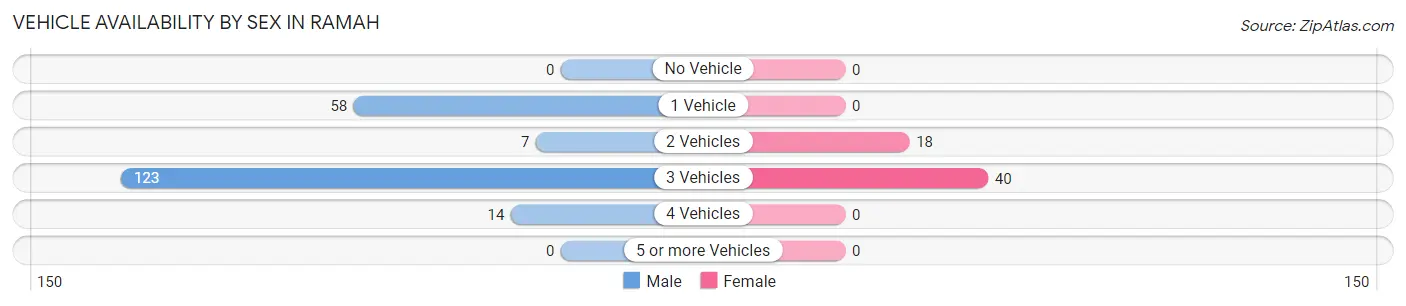
| Vehicles Available | Male | Female |
| No Vehicle | 0 (0.0%) | 0 (0.0%) |
| 1 Vehicle | 58 (28.7%) | 0 (0.0%) |
| 2 Vehicles | 7 (3.5%) | 18 (31.0%) |
| 3 Vehicles | 123 (60.9%) | 40 (69.0%) |
| 4 Vehicles | 14 (6.9%) | 0 (0.0%) |
| 5 or more Vehicles | 0 (0.0%) | 0 (0.0%) |
| Total | 202 (100.0%) | 58 (100.0%) |
Commute Time in Ramah
The most frequently occuring commute durations in Ramah are 20 to 24 minutes (146 commuters, 60.1%), 10 to 14 minutes (42 commuters, 17.3%), and 45 to 59 minutes (27 commuters, 11.1%).
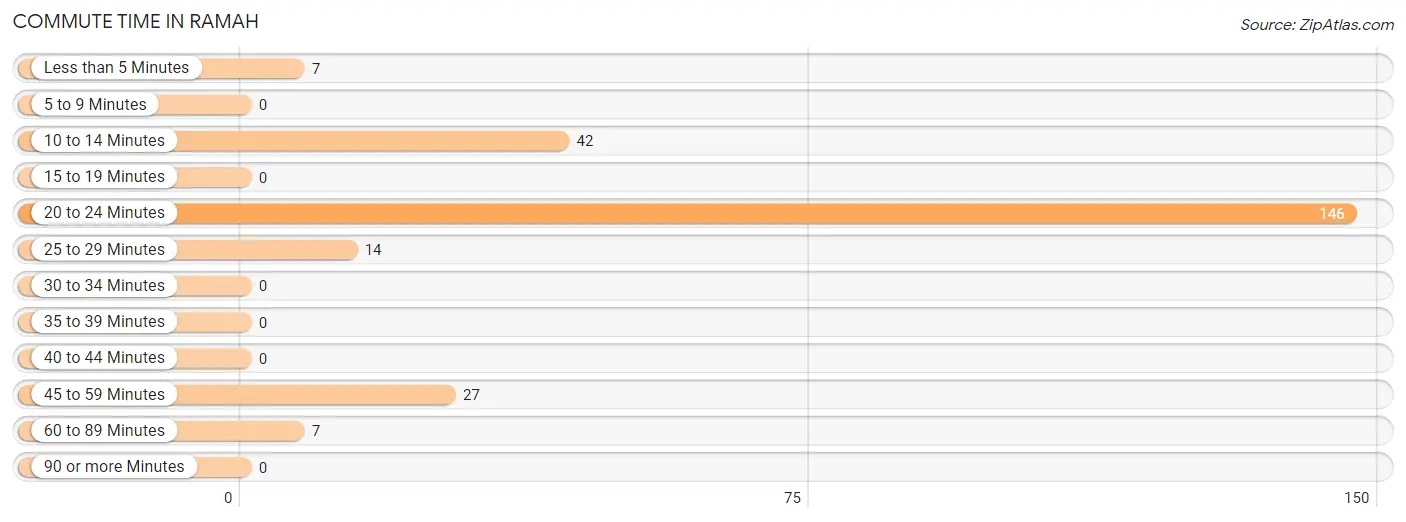
| Commute Time | # Commuters | % Commuters |
| Less than 5 Minutes | 7 | 2.9% |
| 5 to 9 Minutes | 0 | 0.0% |
| 10 to 14 Minutes | 42 | 17.3% |
| 15 to 19 Minutes | 0 | 0.0% |
| 20 to 24 Minutes | 146 | 60.1% |
| 25 to 29 Minutes | 14 | 5.8% |
| 30 to 34 Minutes | 0 | 0.0% |
| 35 to 39 Minutes | 0 | 0.0% |
| 40 to 44 Minutes | 0 | 0.0% |
| 45 to 59 Minutes | 27 | 11.1% |
| 60 to 89 Minutes | 7 | 2.9% |
| 90 or more Minutes | 0 | 0.0% |
Commute Time by Sex in Ramah
The most common commute times in Ramah are 20 to 24 minutes (106 commuters, 57.3%) for males and 20 to 24 minutes (40 commuters, 69.0%) for females.
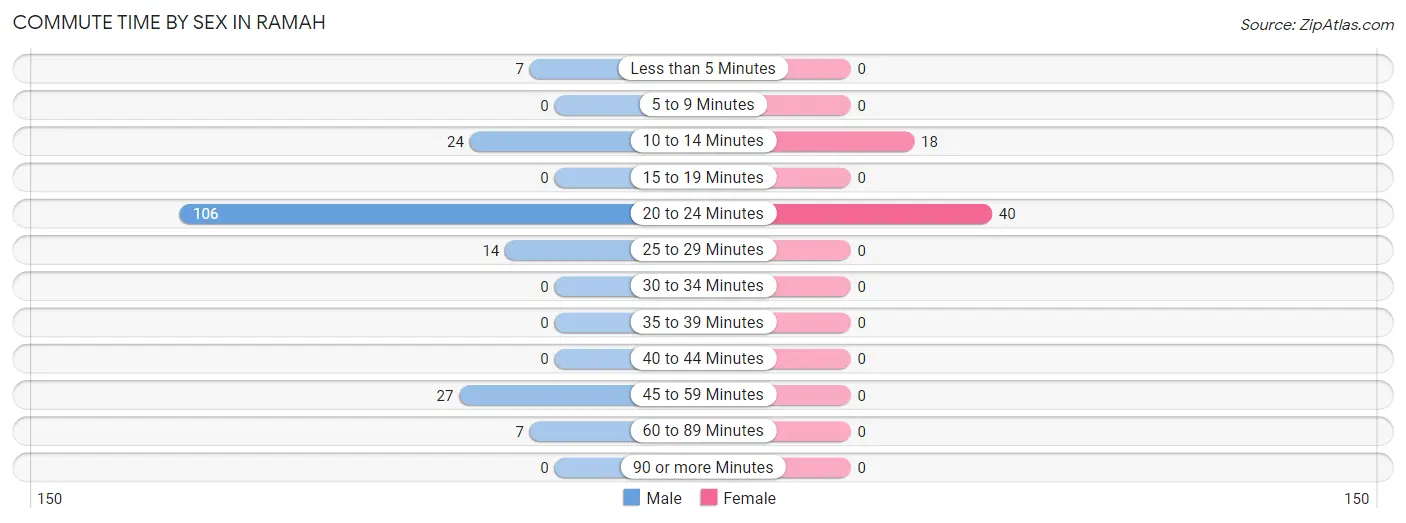
| Commute Time | Male | Female |
| Less than 5 Minutes | 7 (3.8%) | 0 (0.0%) |
| 5 to 9 Minutes | 0 (0.0%) | 0 (0.0%) |
| 10 to 14 Minutes | 24 (13.0%) | 18 (31.0%) |
| 15 to 19 Minutes | 0 (0.0%) | 0 (0.0%) |
| 20 to 24 Minutes | 106 (57.3%) | 40 (69.0%) |
| 25 to 29 Minutes | 14 (7.6%) | 0 (0.0%) |
| 30 to 34 Minutes | 0 (0.0%) | 0 (0.0%) |
| 35 to 39 Minutes | 0 (0.0%) | 0 (0.0%) |
| 40 to 44 Minutes | 0 (0.0%) | 0 (0.0%) |
| 45 to 59 Minutes | 27 (14.6%) | 0 (0.0%) |
| 60 to 89 Minutes | 7 (3.8%) | 0 (0.0%) |
| 90 or more Minutes | 0 (0.0%) | 0 (0.0%) |
Time of Departure to Work by Sex in Ramah
The most frequent times of departure to work in Ramah are 6:00 AM to 6:29 AM (106, 57.3%) for males and 6:00 AM to 6:29 AM (40, 69.0%) for females.
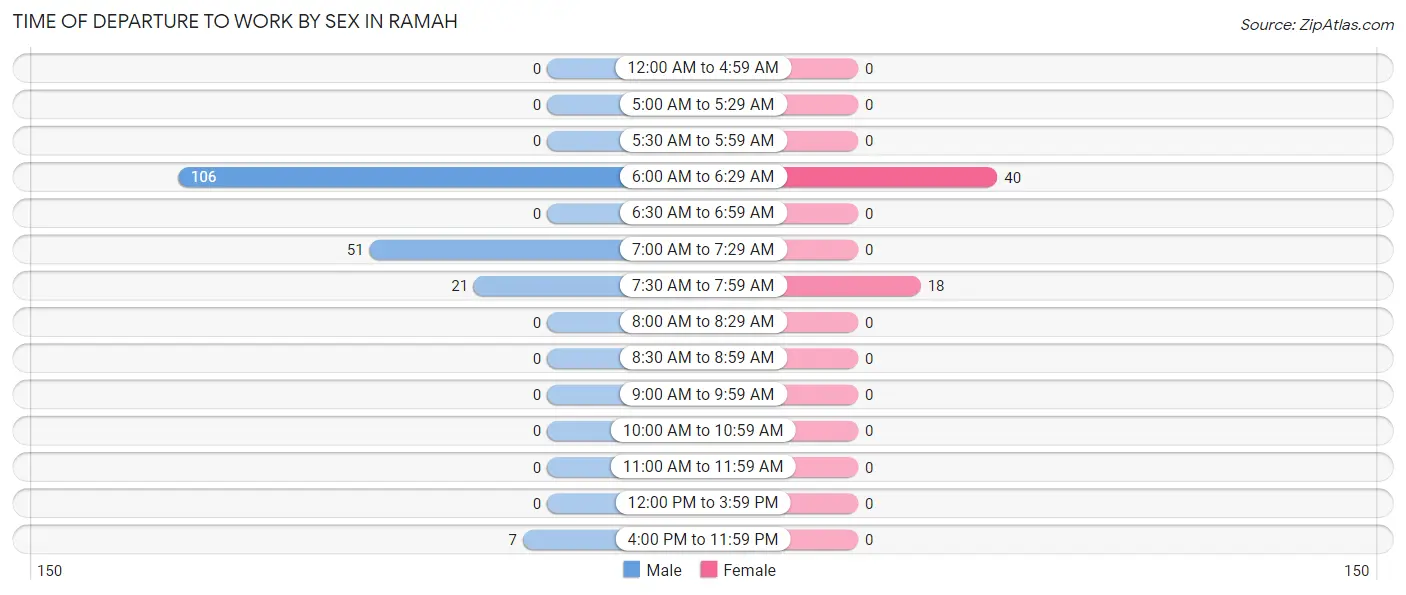
| Time of Departure | Male | Female |
| 12:00 AM to 4:59 AM | 0 (0.0%) | 0 (0.0%) |
| 5:00 AM to 5:29 AM | 0 (0.0%) | 0 (0.0%) |
| 5:30 AM to 5:59 AM | 0 (0.0%) | 0 (0.0%) |
| 6:00 AM to 6:29 AM | 106 (57.3%) | 40 (69.0%) |
| 6:30 AM to 6:59 AM | 0 (0.0%) | 0 (0.0%) |
| 7:00 AM to 7:29 AM | 51 (27.6%) | 0 (0.0%) |
| 7:30 AM to 7:59 AM | 21 (11.4%) | 18 (31.0%) |
| 8:00 AM to 8:29 AM | 0 (0.0%) | 0 (0.0%) |
| 8:30 AM to 8:59 AM | 0 (0.0%) | 0 (0.0%) |
| 9:00 AM to 9:59 AM | 0 (0.0%) | 0 (0.0%) |
| 10:00 AM to 10:59 AM | 0 (0.0%) | 0 (0.0%) |
| 11:00 AM to 11:59 AM | 0 (0.0%) | 0 (0.0%) |
| 12:00 PM to 3:59 PM | 0 (0.0%) | 0 (0.0%) |
| 4:00 PM to 11:59 PM | 7 (3.8%) | 0 (0.0%) |
| Total | 185 (100.0%) | 58 (100.0%) |
Housing Occupancy in Ramah
Occupancy by Ownership in Ramah
Of the total 232 dwellings in Ramah, owner-occupied units account for 126 (54.3%), while renter-occupied units make up 106 (45.7%).
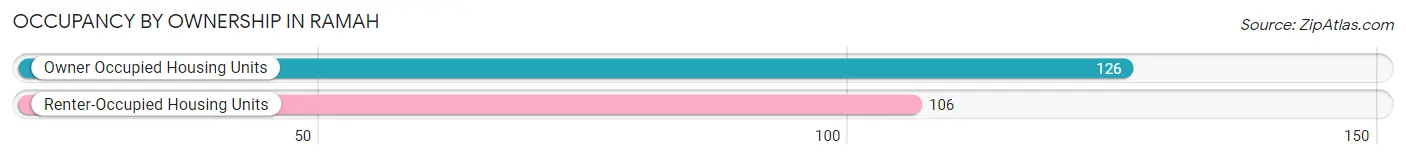
| Occupancy | # Housing Units | % Housing Units |
| Owner Occupied Housing Units | 126 | 54.3% |
| Renter-Occupied Housing Units | 106 | 45.7% |
| Total Occupied Housing Units | 232 | 100.0% |
Occupancy by Household Size in Ramah
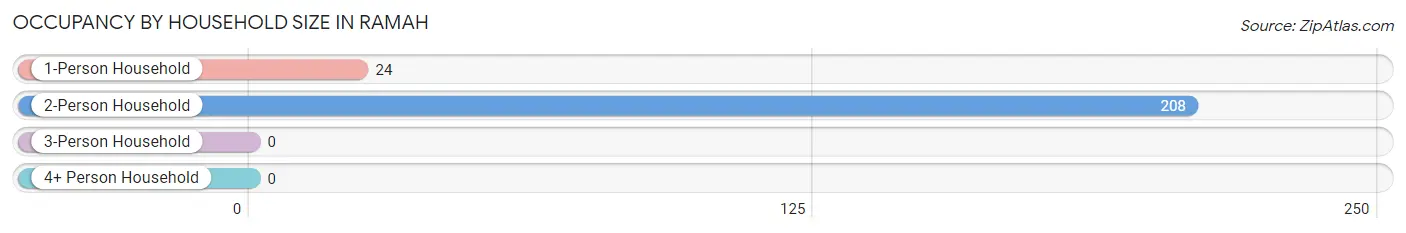
| Household Size | # Housing Units | % Housing Units |
| 1-Person Household | 24 | 10.3% |
| 2-Person Household | 208 | 89.7% |
| 3-Person Household | 0 | 0.0% |
| 4+ Person Household | 0 | 0.0% |
| Total Housing Units | 232 | 100.0% |
Occupancy by Ownership by Household Size in Ramah
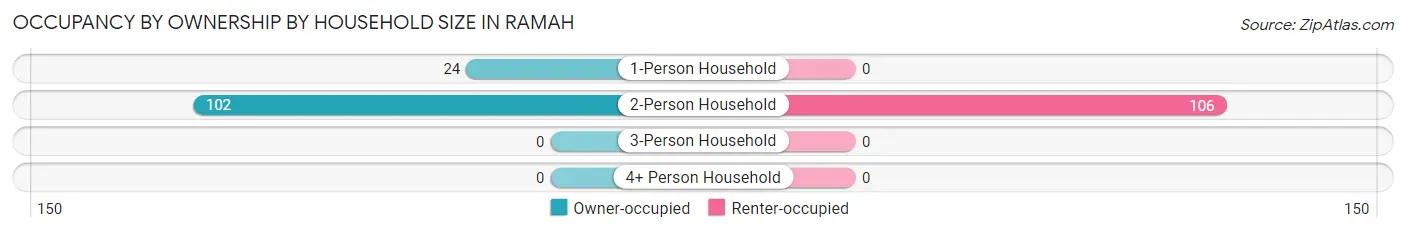
| Household Size | Owner-occupied | Renter-occupied |
| 1-Person Household | 24 (100.0%) | 0 (0.0%) |
| 2-Person Household | 102 (49.0%) | 106 (51.0%) |
| 3-Person Household | 0 (0.0%) | 0 (0.0%) |
| 4+ Person Household | 0 (0.0%) | 0 (0.0%) |
| Total Housing Units | 126 (54.3%) | 106 (45.7%) |
Occupancy by Educational Attainment in Ramah
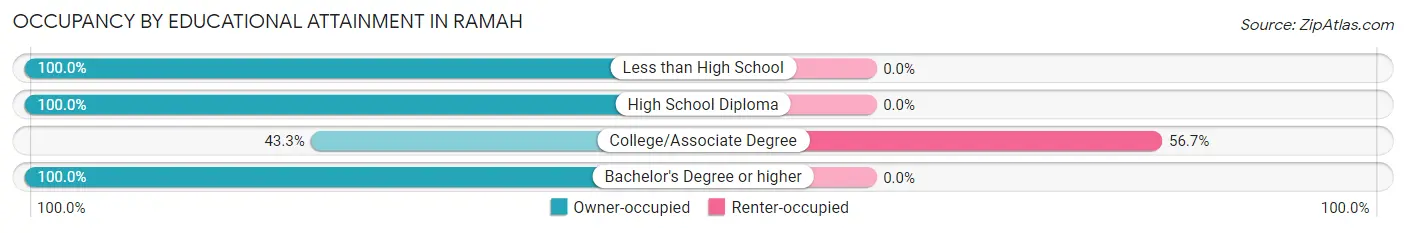
| Household Size | Owner-occupied | Renter-occupied |
| Less than High School | 24 (100.0%) | 0 (0.0%) |
| High School Diploma | 17 (100.0%) | 0 (0.0%) |
| College/Associate Degree | 81 (43.3%) | 106 (56.7%) |
| Bachelor's Degree or higher | 4 (100.0%) | 0 (0.0%) |
Occupancy by Age of Householder in Ramah
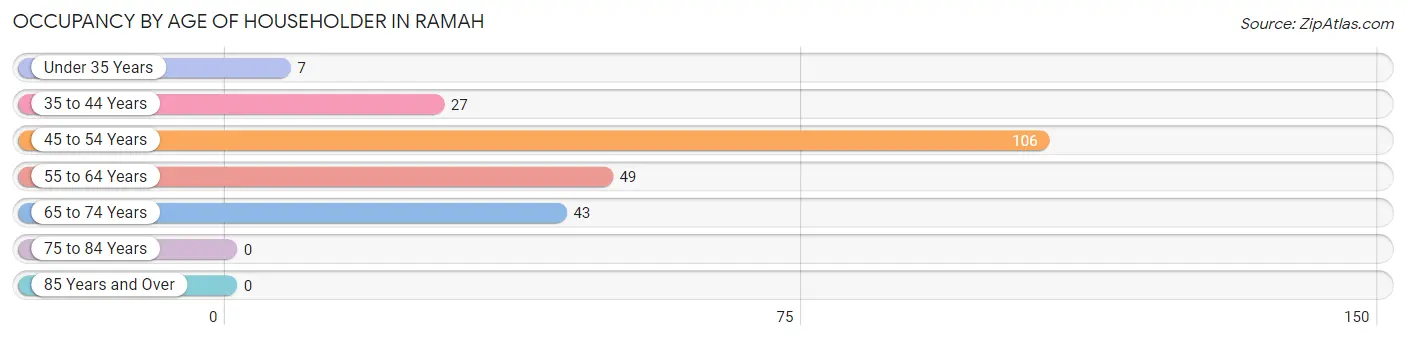
| Age Bracket | # Households | % Households |
| Under 35 Years | 7 | 3.0% |
| 35 to 44 Years | 27 | 11.6% |
| 45 to 54 Years | 106 | 45.7% |
| 55 to 64 Years | 49 | 21.1% |
| 65 to 74 Years | 43 | 18.5% |
| 75 to 84 Years | 0 | 0.0% |
| 85 Years and Over | 0 | 0.0% |
| Total | 232 | 100.0% |
Housing Finances in Ramah
Median Income by Occupancy in Ramah
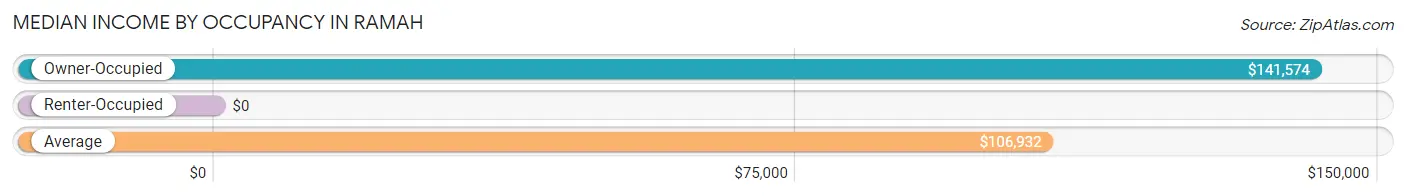
| Occupancy Type | # Households | Median Income |
| Owner-Occupied | 126 (54.3%) | $141,574 |
| Renter-Occupied | 106 (45.7%) | $0 |
| Average | 232 (100.0%) | $106,932 |
Occupancy by Householder Income Bracket in Ramah
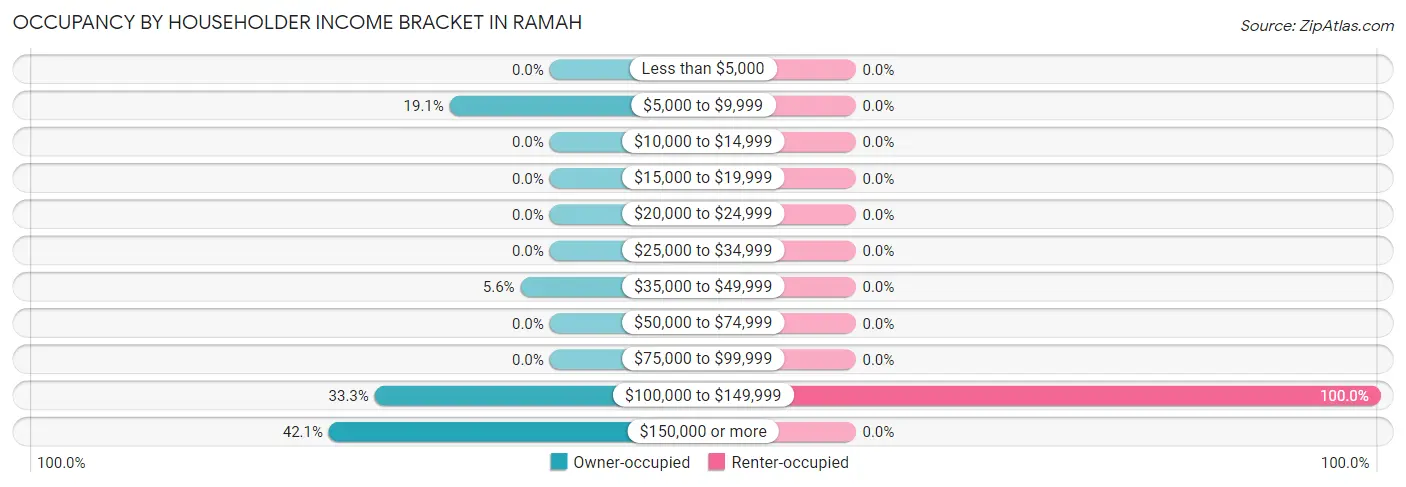
| Income Bracket | Owner-occupied | Renter-occupied |
| Less than $5,000 | 0 (0.0%) | 0 (0.0%) |
| $5,000 to $9,999 | 24 (19.1%) | 0 (0.0%) |
| $10,000 to $14,999 | 0 (0.0%) | 0 (0.0%) |
| $15,000 to $19,999 | 0 (0.0%) | 0 (0.0%) |
| $20,000 to $24,999 | 0 (0.0%) | 0 (0.0%) |
| $25,000 to $34,999 | 0 (0.0%) | 0 (0.0%) |
| $35,000 to $49,999 | 7 (5.6%) | 0 (0.0%) |
| $50,000 to $74,999 | 0 (0.0%) | 0 (0.0%) |
| $75,000 to $99,999 | 0 (0.0%) | 0 (0.0%) |
| $100,000 to $149,999 | 42 (33.3%) | 106 (100.0%) |
| $150,000 or more | 53 (42.1%) | 0 (0.0%) |
| Total | 126 (100.0%) | 106 (100.0%) |
Monthly Housing Cost Tiers in Ramah
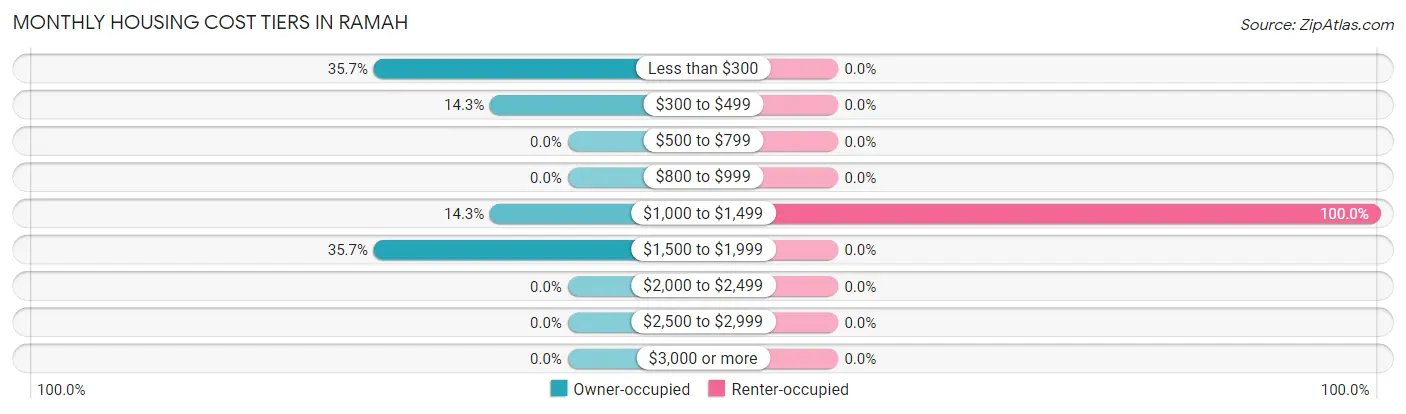
| Monthly Cost | Owner-occupied | Renter-occupied |
| Less than $300 | 45 (35.7%) | 0 (0.0%) |
| $300 to $499 | 18 (14.3%) | 0 (0.0%) |
| $500 to $799 | 0 (0.0%) | 0 (0.0%) |
| $800 to $999 | 0 (0.0%) | 0 (0.0%) |
| $1,000 to $1,499 | 18 (14.3%) | 106 (100.0%) |
| $1,500 to $1,999 | 45 (35.7%) | 0 (0.0%) |
| $2,000 to $2,499 | 0 (0.0%) | 0 (0.0%) |
| $2,500 to $2,999 | 0 (0.0%) | 0 (0.0%) |
| $3,000 or more | 0 (0.0%) | 0 (0.0%) |
| Total | 126 (100.0%) | 106 (100.0%) |
Physical Housing Characteristics in Ramah
Housing Structures in Ramah
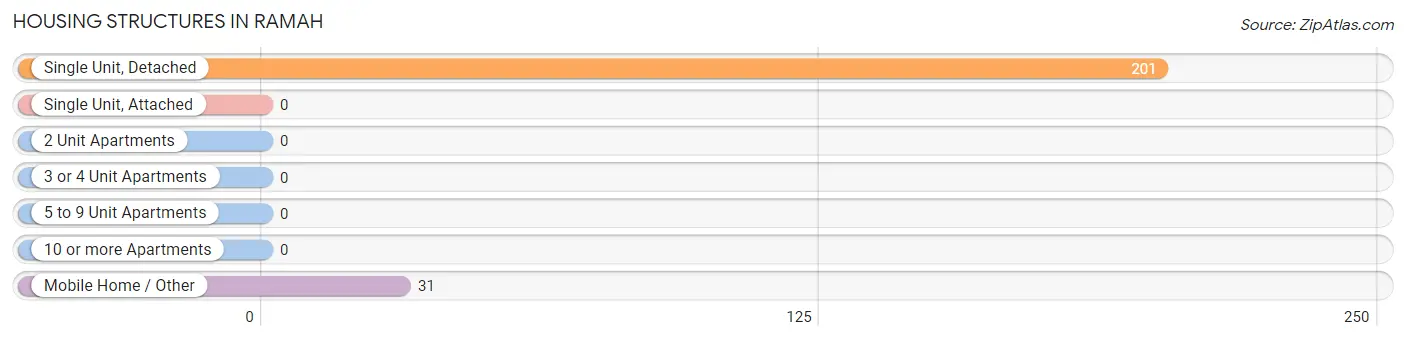
| Structure Type | # Housing Units | % Housing Units |
| Single Unit, Detached | 201 | 86.6% |
| Single Unit, Attached | 0 | 0.0% |
| 2 Unit Apartments | 0 | 0.0% |
| 3 or 4 Unit Apartments | 0 | 0.0% |
| 5 to 9 Unit Apartments | 0 | 0.0% |
| 10 or more Apartments | 0 | 0.0% |
| Mobile Home / Other | 31 | 13.4% |
| Total | 232 | 100.0% |
Housing Structures by Occupancy in Ramah
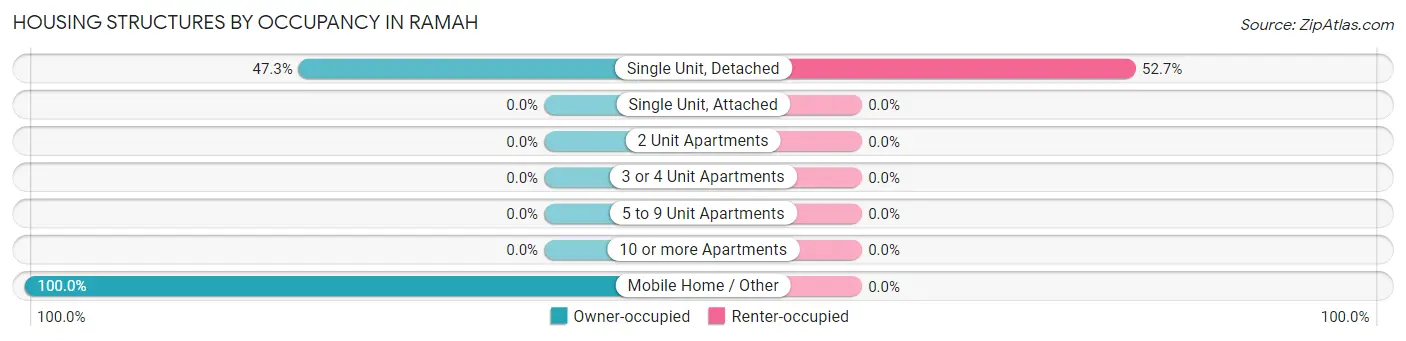
| Structure Type | Owner-occupied | Renter-occupied |
| Single Unit, Detached | 95 (47.3%) | 106 (52.7%) |
| Single Unit, Attached | 0 (0.0%) | 0 (0.0%) |
| 2 Unit Apartments | 0 (0.0%) | 0 (0.0%) |
| 3 or 4 Unit Apartments | 0 (0.0%) | 0 (0.0%) |
| 5 to 9 Unit Apartments | 0 (0.0%) | 0 (0.0%) |
| 10 or more Apartments | 0 (0.0%) | 0 (0.0%) |
| Mobile Home / Other | 31 (100.0%) | 0 (0.0%) |
| Total | 126 (54.3%) | 106 (45.7%) |
Housing Structures by Number of Rooms in Ramah
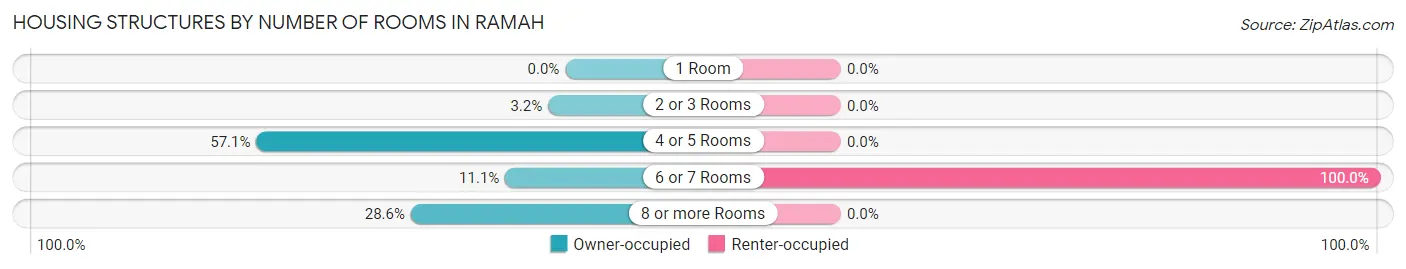
| Number of Rooms | Owner-occupied | Renter-occupied |
| 1 Room | 0 (0.0%) | 0 (0.0%) |
| 2 or 3 Rooms | 4 (3.2%) | 0 (0.0%) |
| 4 or 5 Rooms | 72 (57.1%) | 0 (0.0%) |
| 6 or 7 Rooms | 14 (11.1%) | 106 (100.0%) |
| 8 or more Rooms | 36 (28.6%) | 0 (0.0%) |
| Total | 126 (100.0%) | 106 (100.0%) |
Housing Structure by Heating Type in Ramah
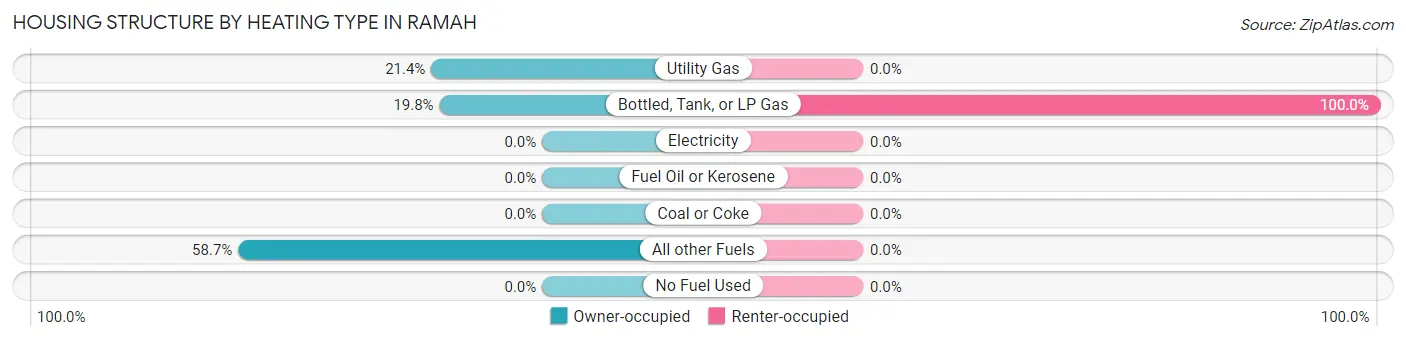
| Heating Type | Owner-occupied | Renter-occupied |
| Utility Gas | 27 (21.4%) | 0 (0.0%) |
| Bottled, Tank, or LP Gas | 25 (19.8%) | 106 (100.0%) |
| Electricity | 0 (0.0%) | 0 (0.0%) |
| Fuel Oil or Kerosene | 0 (0.0%) | 0 (0.0%) |
| Coal or Coke | 0 (0.0%) | 0 (0.0%) |
| All other Fuels | 74 (58.7%) | 0 (0.0%) |
| No Fuel Used | 0 (0.0%) | 0 (0.0%) |
| Total | 126 (100.0%) | 106 (100.0%) |
Household Vehicle Usage in Ramah
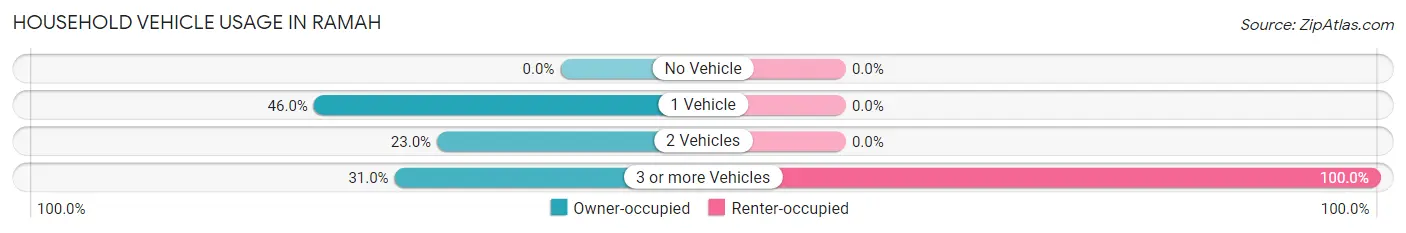
| Vehicles per Household | Owner-occupied | Renter-occupied |
| No Vehicle | 0 (0.0%) | 0 (0.0%) |
| 1 Vehicle | 58 (46.0%) | 0 (0.0%) |
| 2 Vehicles | 29 (23.0%) | 0 (0.0%) |
| 3 or more Vehicles | 39 (30.9%) | 106 (100.0%) |
| Total | 126 (100.0%) | 106 (100.0%) |
Real Estate & Mortgages in Ramah
Real Estate and Mortgage Overview in Ramah
| Characteristic | Without Mortgage | With Mortgage |
| Housing Units | 63 | 63 |
| Median Property Value | $178,100 | $225,000 |
| Median Household Income | - | - |
| Monthly Housing Costs | $234 | $0 |
| Real Estate Taxes | $1,115 | $0 |
Property Value by Mortgage Status in Ramah
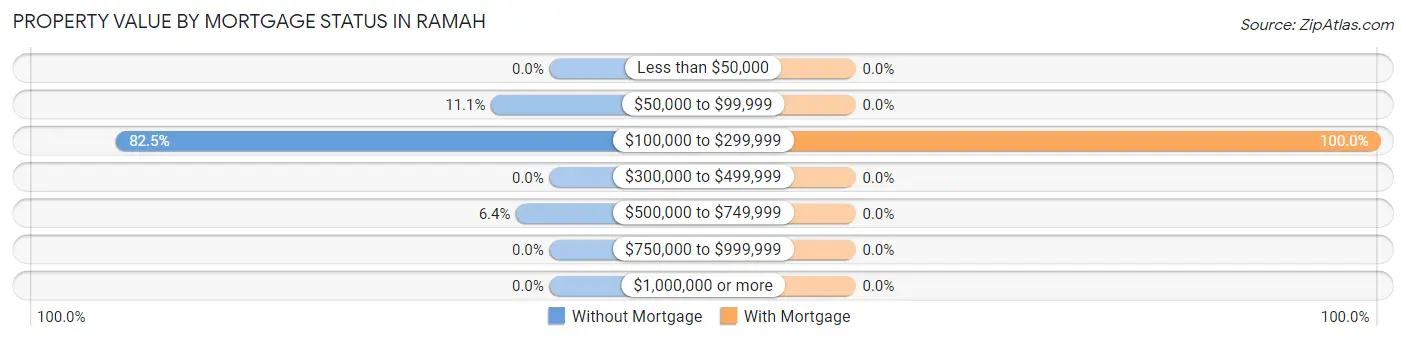
| Property Value | Without Mortgage | With Mortgage |
| Less than $50,000 | 0 (0.0%) | 0 (0.0%) |
| $50,000 to $99,999 | 7 (11.1%) | 0 (0.0%) |
| $100,000 to $299,999 | 52 (82.5%) | 63 (100.0%) |
| $300,000 to $499,999 | 0 (0.0%) | 0 (0.0%) |
| $500,000 to $749,999 | 4 (6.4%) | 0 (0.0%) |
| $750,000 to $999,999 | 0 (0.0%) | 0 (0.0%) |
| $1,000,000 or more | 0 (0.0%) | 0 (0.0%) |
| Total | 63 (100.0%) | 63 (100.0%) |
Household Income by Mortgage Status in Ramah
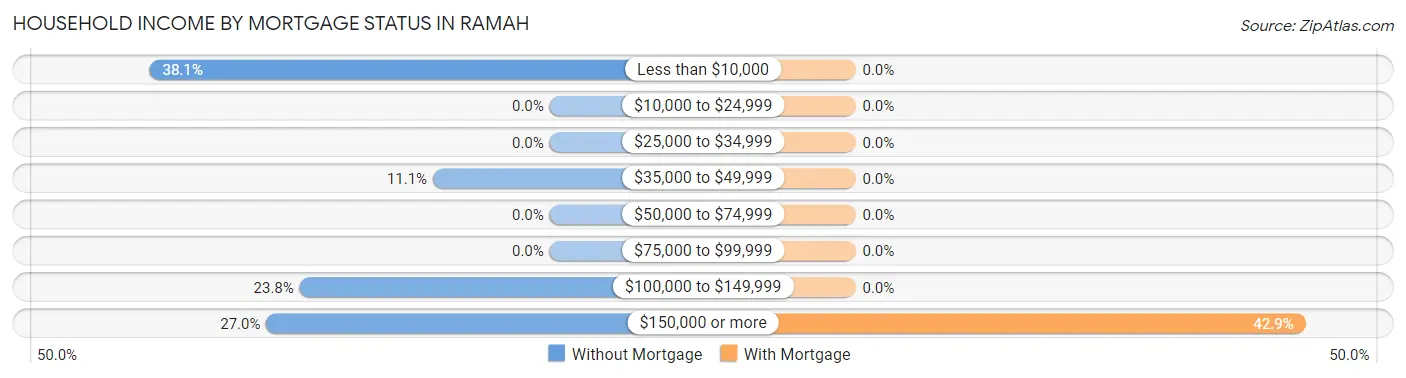
| Household Income | Without Mortgage | With Mortgage |
| Less than $10,000 | 24 (38.1%) | 0 (0.0%) |
| $10,000 to $24,999 | 0 (0.0%) | 0 (0.0%) |
| $25,000 to $34,999 | 0 (0.0%) | 0 (0.0%) |
| $35,000 to $49,999 | 7 (11.1%) | 0 (0.0%) |
| $50,000 to $74,999 | 0 (0.0%) | 0 (0.0%) |
| $75,000 to $99,999 | 0 (0.0%) | 0 (0.0%) |
| $100,000 to $149,999 | 15 (23.8%) | 0 (0.0%) |
| $150,000 or more | 17 (27.0%) | 27 (42.9%) |
| Total | 63 (100.0%) | 63 (100.0%) |
Property Value to Household Income Ratio in Ramah
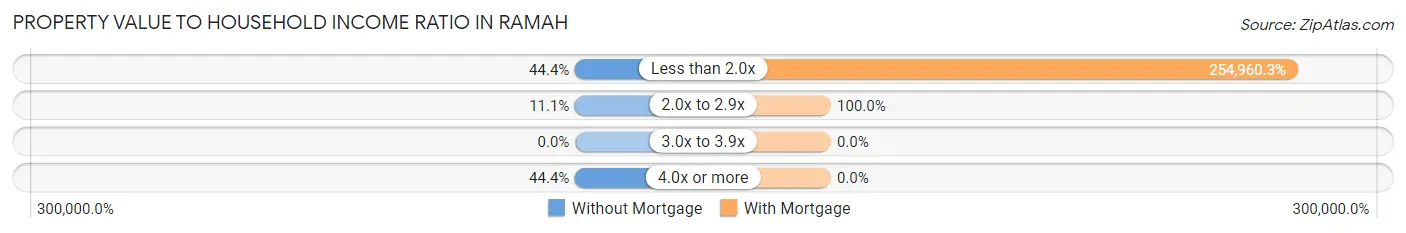
| Value-to-Income Ratio | Without Mortgage | With Mortgage |
| Less than 2.0x | 28 (44.4%) | 160,625 (254,960.3%) |
| 2.0x to 2.9x | 7 (11.1%) | 63 (100.0%) |
| 3.0x to 3.9x | 0 (0.0%) | 0 (0.0%) |
| 4.0x or more | 28 (44.4%) | 0 (0.0%) |
| Total | 63 (100.0%) | 63 (100.0%) |
Real Estate Taxes by Mortgage Status in Ramah
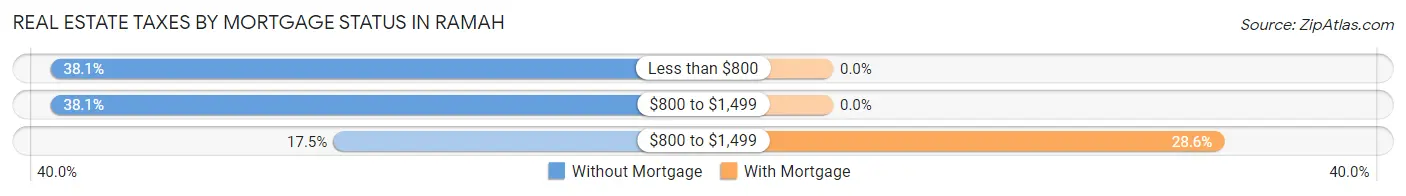
| Property Taxes | Without Mortgage | With Mortgage |
| Less than $800 | 24 (38.1%) | 0 (0.0%) |
| $800 to $1,499 | 24 (38.1%) | 0 (0.0%) |
| $800 to $1,499 | 11 (17.5%) | 18 (28.6%) |
| Total | 63 (100.0%) | 63 (100.0%) |
Health & Disability in Ramah
Health Insurance Coverage by Age in Ramah
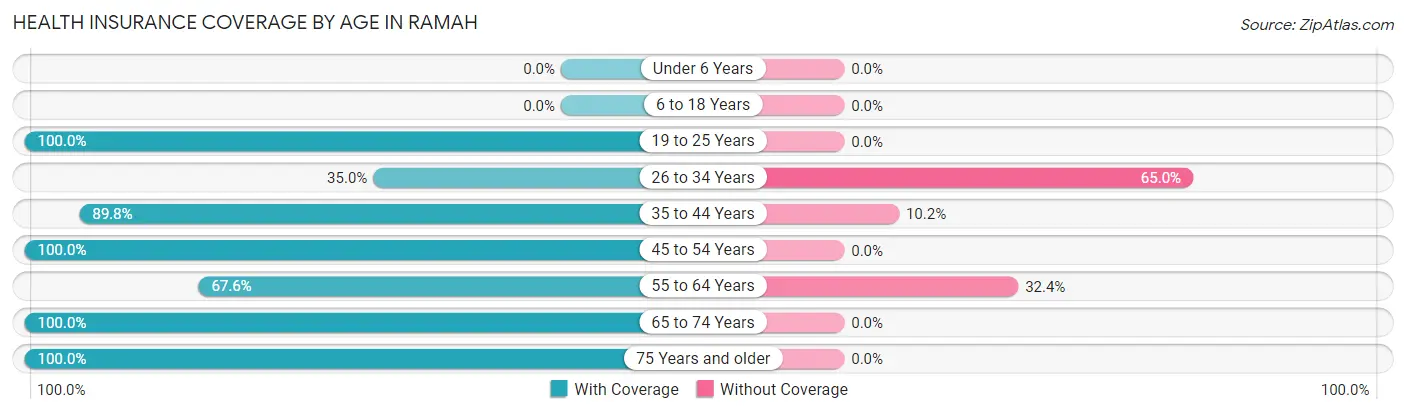
| Age Bracket | With Coverage | Without Coverage |
| Under 6 Years | 0 (0.0%) | 0 (0.0%) |
| 6 to 18 Years | 0 (0.0%) | 0 (0.0%) |
| 19 to 25 Years | 9 (100.0%) | 0 (0.0%) |
| 26 to 34 Years | 7 (35.0%) | 13 (65.0%) |
| 35 to 44 Years | 44 (89.8%) | 5 (10.2%) |
| 45 to 54 Years | 146 (100.0%) | 0 (0.0%) |
| 55 to 64 Years | 50 (67.6%) | 24 (32.4%) |
| 65 to 74 Years | 87 (100.0%) | 0 (0.0%) |
| 75 Years and older | 6 (100.0%) | 0 (0.0%) |
| Total | 349 (89.3%) | 42 (10.7%) |
Health Insurance Coverage by Citizenship Status in Ramah
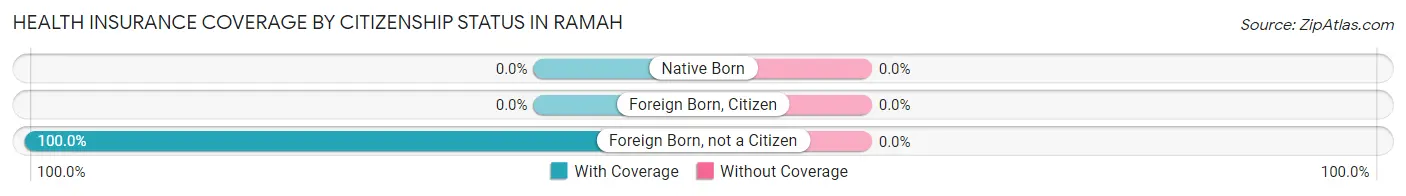
| Citizenship Status | With Coverage | Without Coverage |
| Native Born | 0 (0.0%) | 0 (0.0%) |
| Foreign Born, Citizen | 0 (0.0%) | 0 (0.0%) |
| Foreign Born, not a Citizen | 9 (100.0%) | 0 (0.0%) |
Health Insurance Coverage by Household Income in Ramah
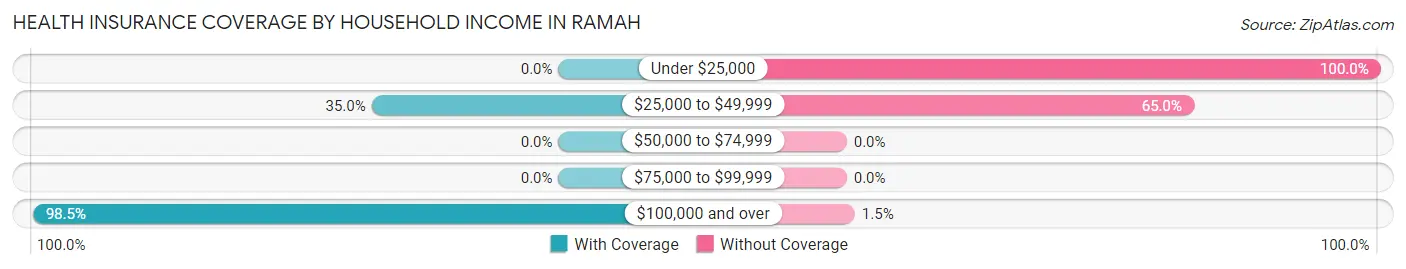
| Household Income | With Coverage | Without Coverage |
| Under $25,000 | 0 (0.0%) | 24 (100.0%) |
| $25,000 to $49,999 | 7 (35.0%) | 13 (65.0%) |
| $50,000 to $74,999 | 0 (0.0%) | 0 (0.0%) |
| $75,000 to $99,999 | 0 (0.0%) | 0 (0.0%) |
| $100,000 and over | 325 (98.5%) | 5 (1.5%) |
Public vs Private Health Insurance Coverage by Age in Ramah
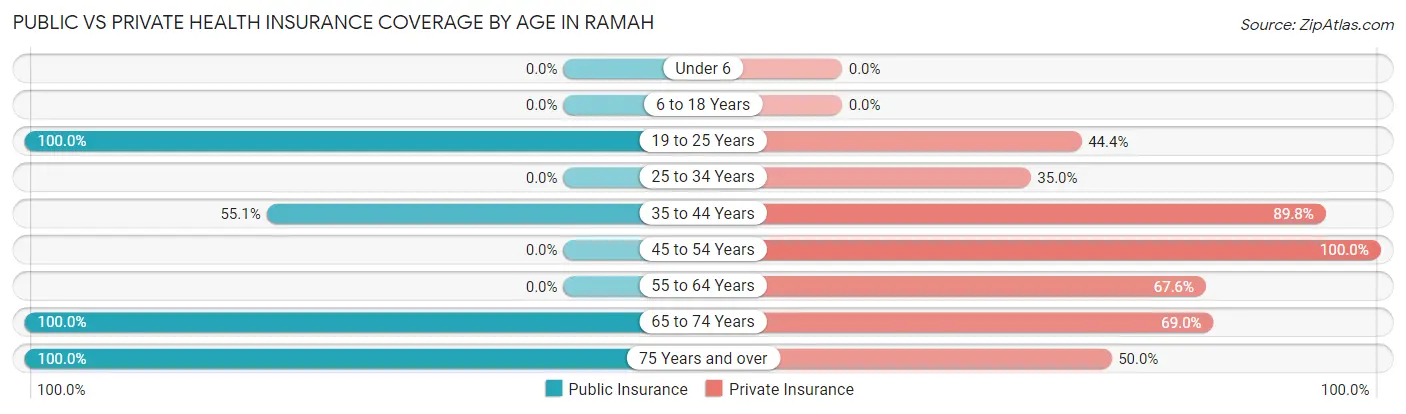
| Age Bracket | Public Insurance | Private Insurance |
| Under 6 | 0 (0.0%) | 0 (0.0%) |
| 6 to 18 Years | 0 (0.0%) | 0 (0.0%) |
| 19 to 25 Years | 9 (100.0%) | 4 (44.4%) |
| 25 to 34 Years | 0 (0.0%) | 7 (35.0%) |
| 35 to 44 Years | 27 (55.1%) | 44 (89.8%) |
| 45 to 54 Years | 0 (0.0%) | 146 (100.0%) |
| 55 to 64 Years | 0 (0.0%) | 50 (67.6%) |
| 65 to 74 Years | 87 (100.0%) | 60 (69.0%) |
| 75 Years and over | 6 (100.0%) | 3 (50.0%) |
| Total | 129 (33.0%) | 314 (80.3%) |
Disability Status by Sex by Age in Ramah
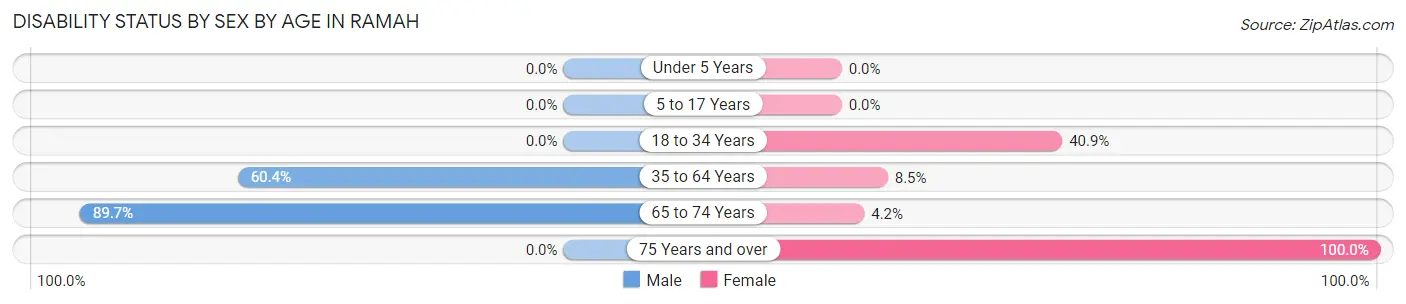
| Age Bracket | Male | Female |
| Under 5 Years | 0 (0.0%) | 0 (0.0%) |
| 5 to 17 Years | 0 (0.0%) | 0 (0.0%) |
| 18 to 34 Years | 0 (0.0%) | 9 (40.9%) |
| 35 to 64 Years | 113 (60.4%) | 7 (8.5%) |
| 65 to 74 Years | 35 (89.7%) | 2 (4.2%) |
| 75 Years and over | 0 (0.0%) | 6 (100.0%) |
Disability Class by Sex by Age in Ramah
Disability Class: Hearing Difficulty
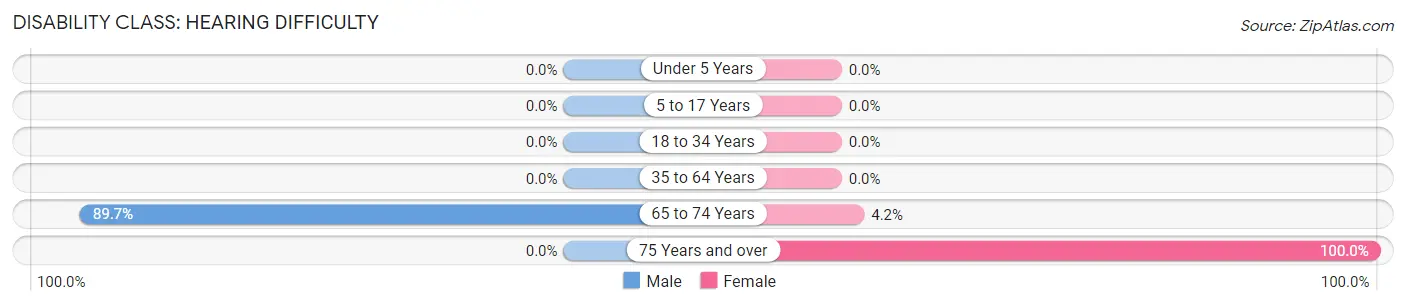
| Age Bracket | Male | Female |
| Under 5 Years | 0 (0.0%) | 0 (0.0%) |
| 5 to 17 Years | 0 (0.0%) | 0 (0.0%) |
| 18 to 34 Years | 0 (0.0%) | 0 (0.0%) |
| 35 to 64 Years | 0 (0.0%) | 0 (0.0%) |
| 65 to 74 Years | 35 (89.7%) | 2 (4.2%) |
| 75 Years and over | 0 (0.0%) | 6 (100.0%) |
Disability Class: Vision Difficulty
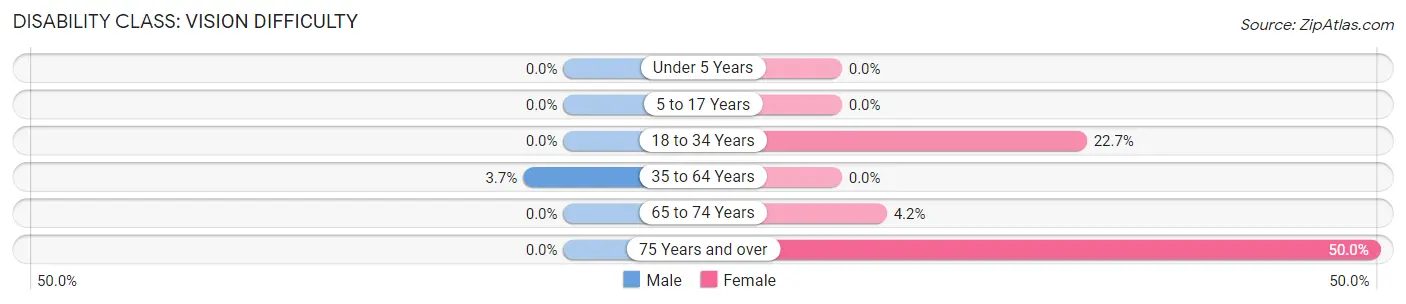
| Age Bracket | Male | Female |
| Under 5 Years | 0 (0.0%) | 0 (0.0%) |
| 5 to 17 Years | 0 (0.0%) | 0 (0.0%) |
| 18 to 34 Years | 0 (0.0%) | 5 (22.7%) |
| 35 to 64 Years | 7 (3.7%) | 0 (0.0%) |
| 65 to 74 Years | 0 (0.0%) | 2 (4.2%) |
| 75 Years and over | 0 (0.0%) | 3 (50.0%) |
Disability Class: Cognitive Difficulty
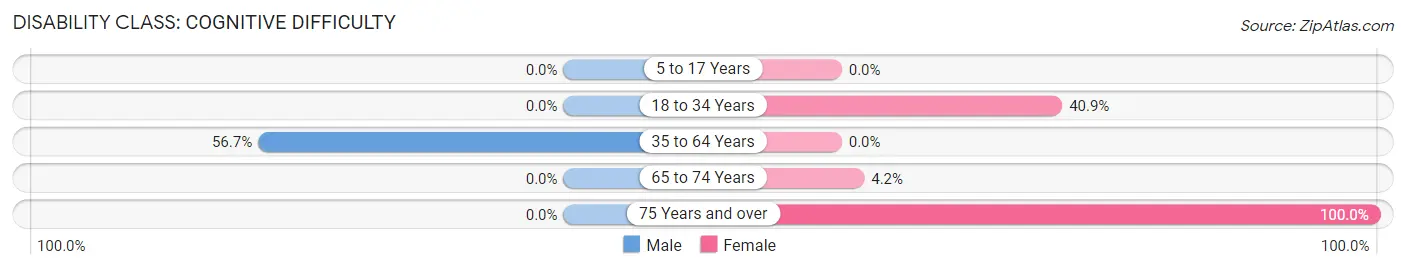
| Age Bracket | Male | Female |
| 5 to 17 Years | 0 (0.0%) | 0 (0.0%) |
| 18 to 34 Years | 0 (0.0%) | 9 (40.9%) |
| 35 to 64 Years | 106 (56.7%) | 0 (0.0%) |
| 65 to 74 Years | 0 (0.0%) | 2 (4.2%) |
| 75 Years and over | 0 (0.0%) | 6 (100.0%) |
Disability Class: Ambulatory Difficulty
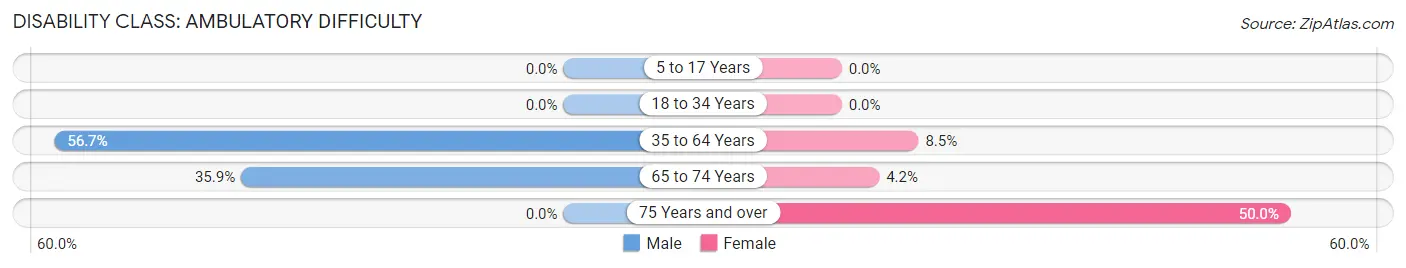
| Age Bracket | Male | Female |
| 5 to 17 Years | 0 (0.0%) | 0 (0.0%) |
| 18 to 34 Years | 0 (0.0%) | 0 (0.0%) |
| 35 to 64 Years | 106 (56.7%) | 7 (8.5%) |
| 65 to 74 Years | 14 (35.9%) | 2 (4.2%) |
| 75 Years and over | 0 (0.0%) | 3 (50.0%) |
Disability Class: Self-Care Difficulty
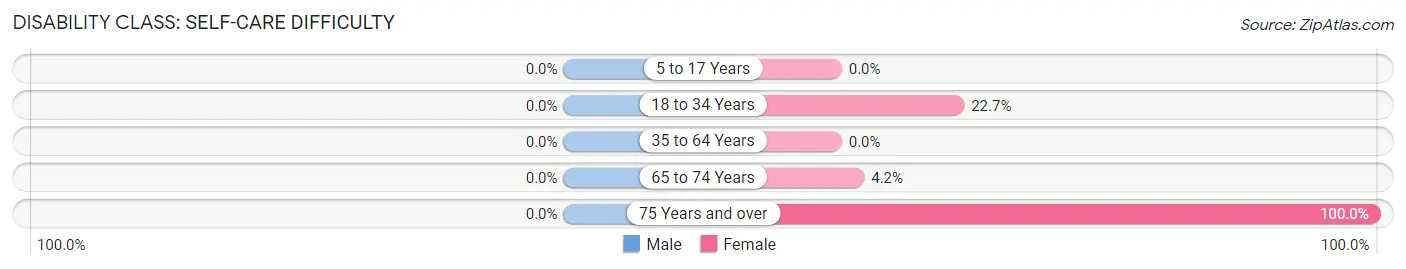
| Age Bracket | Male | Female |
| 5 to 17 Years | 0 (0.0%) | 0 (0.0%) |
| 18 to 34 Years | 0 (0.0%) | 5 (22.7%) |
| 35 to 64 Years | 0 (0.0%) | 0 (0.0%) |
| 65 to 74 Years | 0 (0.0%) | 2 (4.2%) |
| 75 Years and over | 0 (0.0%) | 6 (100.0%) |
Technology Access in Ramah
Computing Device Access in Ramah
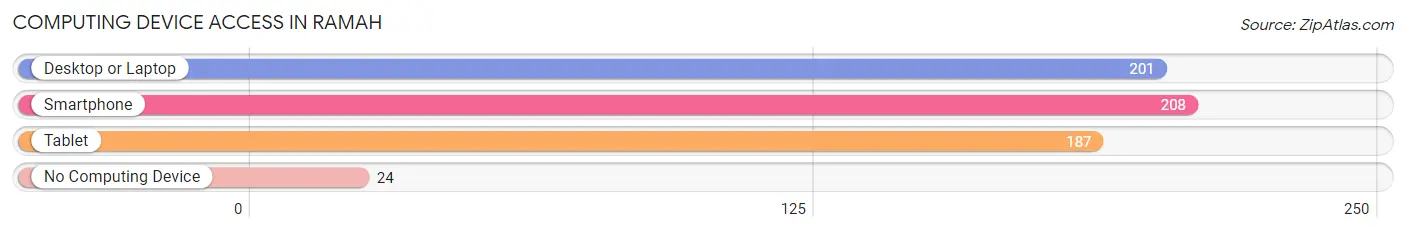
| Device Type | # Households | % Households |
| Desktop or Laptop | 201 | 86.6% |
| Smartphone | 208 | 89.7% |
| Tablet | 187 | 80.6% |
| No Computing Device | 24 | 10.3% |
| Total | 232 | 100.0% |
Internet Access in Ramah
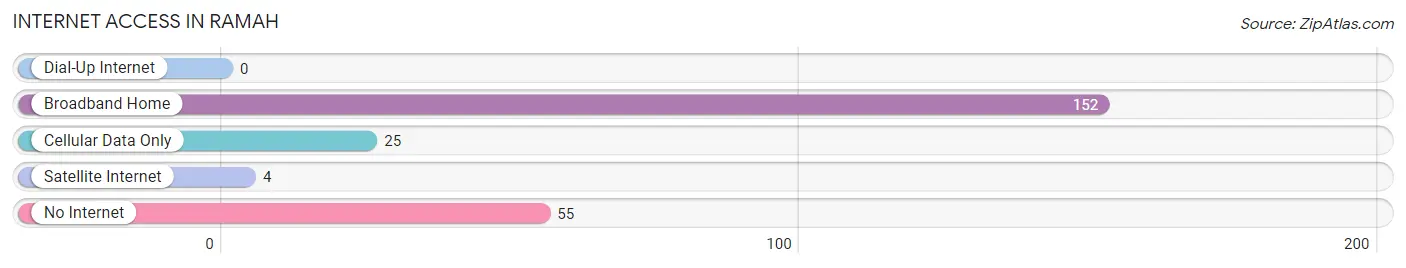
| Internet Type | # Households | % Households |
| Dial-Up Internet | 0 | 0.0% |
| Broadband Home | 152 | 65.5% |
| Cellular Data Only | 25 | 10.8% |
| Satellite Internet | 4 | 1.7% |
| No Internet | 55 | 23.7% |
| Total | 232 | 100.0% |
Ramah Summary
Ramah, New Mexico is a small unincorporated community located in the northwest corner of the state. It is situated in the foothills of the Zuni Mountains, approximately 40 miles west of Albuquerque. The town is home to a population of approximately 1,000 people, and is the largest community in Cibola County.
History
The area that is now Ramah was originally inhabited by the Zuni people, who had lived in the area for centuries. The first European settlers arrived in the area in the late 1800s, and the town was officially established in 1891. The town was named after the biblical town of Ramah, which was located in the ancient kingdom of Israel.
The town was initially a farming and ranching community, and the local economy was largely based on the production of wool and other agricultural products. In the early 1900s, the town began to experience a period of growth, as the railroad was extended to the area. This allowed for the transportation of goods and people to and from the town, and helped to spur economic development.
In the mid-1900s, the town began to experience a decline in population, as many of the local businesses closed and people moved away in search of better opportunities. However, in recent years, the town has seen a resurgence in population, as people have moved back to the area in search of a more rural lifestyle.
Geography
Ramah is located in the northwest corner of New Mexico, in the foothills of the Zuni Mountains. The town is situated at an elevation of 6,000 feet, and is surrounded by a variety of natural features, including mesas, canyons, and forests. The town is located approximately 40 miles west of Albuquerque, and is accessible via State Highway 53.
The climate in Ramah is semi-arid, with hot summers and cold winters. The average annual temperature is approximately 60 degrees Fahrenheit, and the average annual precipitation is approximately 10 inches.
Economy
The economy of Ramah is largely based on agriculture and tourism. The town is home to a variety of farms and ranches, which produce a variety of crops, including alfalfa, hay, and wheat. The town is also home to a number of tourist attractions, including the Zuni Pueblo, the Ramah Lake State Park, and the Ramah Wildlife Refuge.
In addition to agriculture and tourism, the town is also home to a variety of small businesses, including restaurants, shops, and other services. The town is also home to a number of manufacturing companies, which produce a variety of products, including furniture, clothing, and electronics.
Demographics
As of the 2010 census, the population of Ramah was 1,000 people. The racial makeup of the town was 94.2% White, 0.7% African American, 0.7% Native American, 0.7% Asian, 0.7% from other races, and 2.7% from two or more races. The median household income was $35,000, and the median home value was $90,000.
Conclusion
Ramah, New Mexico is a small unincorporated community located in the northwest corner of the state. It is situated in the foothills of the Zuni Mountains, approximately 40 miles west of Albuquerque. The town is home to a population of approximately 1,000 people, and is the largest community in Cibola County. The economy of Ramah is largely based on agriculture and tourism, and the town is home to a variety of small businesses, including restaurants, shops, and other services. The racial makeup of the town is 94.2% White, 0.7% African American, 0.7% Native American, 0.7% Asian, 0.7% from other races, and 2.7% from two or more races. The median household income was $35,000, and the median home value was $90,000.
Common Questions
What is Per Capita Income in Ramah?
Per Capita income in Ramah is $61,781.
What is the Median Family Income in Ramah?
Median Family Income in Ramah is $107,284.
What is the Median Household income in Ramah?
Median Household Income in Ramah is $106,932.
What is Inequality or Gini Index in Ramah?
Inequality or Gini Index in Ramah is 0.25.
What is the Total Population of Ramah?
Total Population of Ramah is 391.
What is the Total Male Population of Ramah?
Total Male Population of Ramah is 233.
What is the Total Female Population of Ramah?
Total Female Population of Ramah is 158.
What is the Ratio of Males per 100 Females in Ramah?
There are 147.47 Males per 100 Females in Ramah.
What is the Ratio of Females per 100 Males in Ramah?
There are 67.81 Females per 100 Males in Ramah.
What is the Median Population Age in Ramah?
Median Population Age in Ramah is 54.7 Years.
What is the Average Family Size in Ramah
Average Family Size in Ramah is 1.6 People.
What is the Average Household Size in Ramah
Average Household Size in Ramah is 1.6 People.
How Large is the Labor Force in Ramah?
There are 273 People in the Labor Forcein in Ramah.
What is the Percentage of People in the Labor Force in Ramah?
69.8% of People are in the Labor Force in Ramah.