El Duende, NM Map & Demographics
El Duende Map
El Duende Overview
$15,667
PER CAPITA INCOME
0.51
INEQUALITY / GINI INDEX
1,113
TOTAL POPULATION
443
MALE POPULATION
670
FEMALE POPULATION
66.12
MALES / 100 FEMALES
151.24
FEMALES / 100 MALES
14.3
MEDIAN AGE
4.0
AVG FAMILY SIZE
4.2
AVG HOUSEHOLD SIZE
285
LABOR FORCE [ PEOPLE ]
64.0%
PERCENT IN LABOR FORCE
Income in El Duende
Income Overview in El Duende
| Characteristic | Number | Measure |
| Per Capita Income | 1,113 | $15,667 |
| Median Family Income | 266 | $0 |
| Mean Family Income | 266 | $75,688 |
| Median Household Income | 266 | $0 |
| Mean Household Income | 266 | $77,979 |
| Income Deficit | 266 | $0 |
| Wage / Income Gap (%) | 1,113 | 0.00% |
| Wage / Income Gap ($) | 1,113 | 100.00¢ per $1 |
| Gini / Inequality Index | 1,113 | 0.51 |
Earnings by Sex in El Duende
| Sex | Number | Average Earnings |
| Male | 139 (48.8%) | $0 |
| Female | 146 (51.2%) | $0 |
| Total | 285 (100.0%) | $0 |
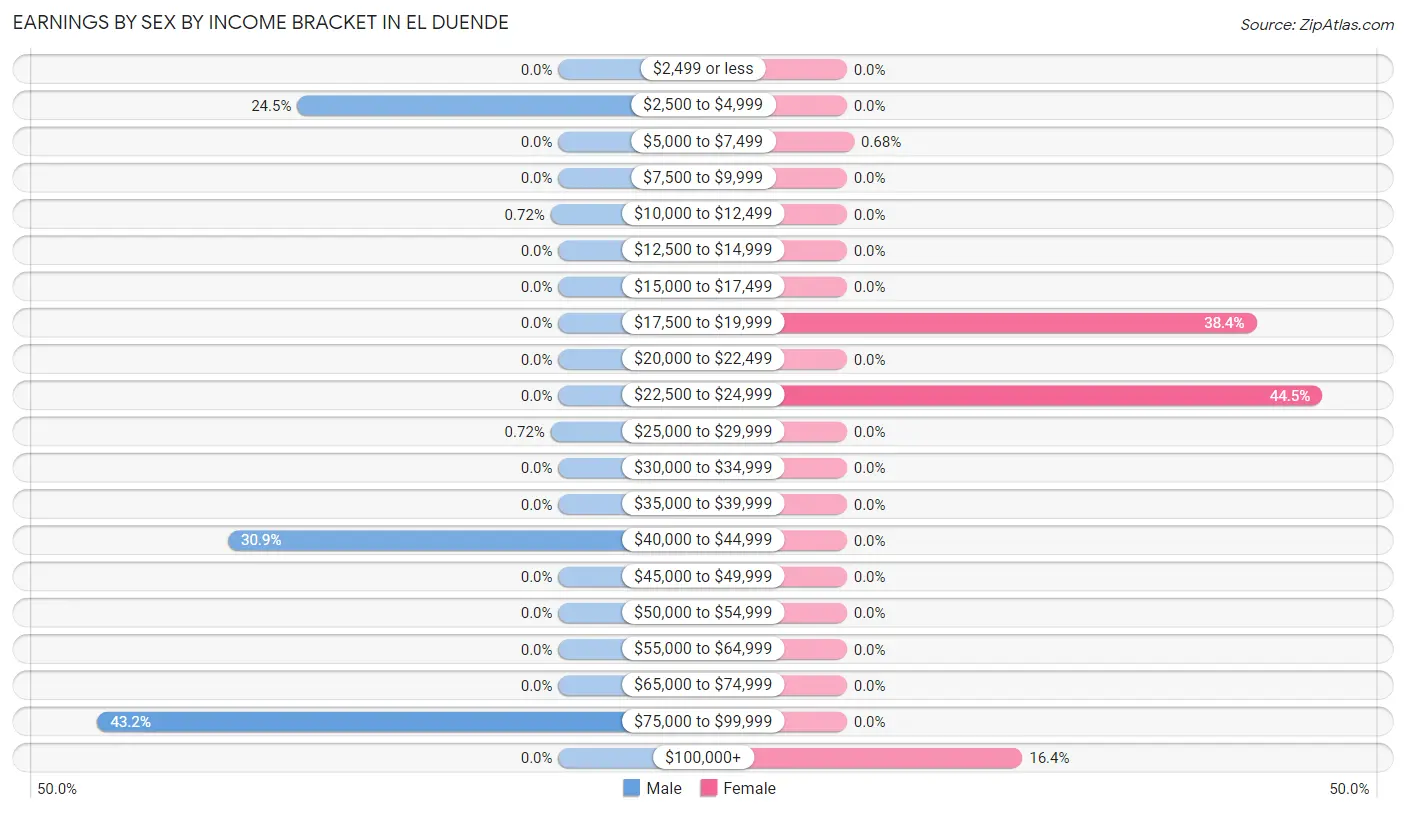
Earnings by Sex by Income Bracket in El Duende
The most common earnings brackets in El Duende are $75,000 to $99,999 for men (60 | 43.2%) and $22,500 to $24,999 for women (65 | 44.5%).
| Income | Male | Female |
| $2,499 or less | 0 (0.0%) | 0 (0.0%) |
| $2,500 to $4,999 | 34 (24.5%) | 0 (0.0%) |
| $5,000 to $7,499 | 0 (0.0%) | 1 (0.7%) |
| $7,500 to $9,999 | 0 (0.0%) | 0 (0.0%) |
| $10,000 to $12,499 | 1 (0.7%) | 0 (0.0%) |
| $12,500 to $14,999 | 0 (0.0%) | 0 (0.0%) |
| $15,000 to $17,499 | 0 (0.0%) | 0 (0.0%) |
| $17,500 to $19,999 | 0 (0.0%) | 56 (38.4%) |
| $20,000 to $22,499 | 0 (0.0%) | 0 (0.0%) |
| $22,500 to $24,999 | 0 (0.0%) | 65 (44.5%) |
| $25,000 to $29,999 | 1 (0.7%) | 0 (0.0%) |
| $30,000 to $34,999 | 0 (0.0%) | 0 (0.0%) |
| $35,000 to $39,999 | 0 (0.0%) | 0 (0.0%) |
| $40,000 to $44,999 | 43 (30.9%) | 0 (0.0%) |
| $45,000 to $49,999 | 0 (0.0%) | 0 (0.0%) |
| $50,000 to $54,999 | 0 (0.0%) | 0 (0.0%) |
| $55,000 to $64,999 | 0 (0.0%) | 0 (0.0%) |
| $65,000 to $74,999 | 0 (0.0%) | 0 (0.0%) |
| $75,000 to $99,999 | 60 (43.2%) | 0 (0.0%) |
| $100,000+ | 0 (0.0%) | 24 (16.4%) |
| Total | 139 (100.0%) | 146 (100.0%) |
Earnings by Sex by Educational Attainment in El Duende
| Educational Attainment | Male Income | Female Income |
| Less than High School | - | - |
| High School Diploma | - | - |
| College or Associate's Degree | - | - |
| Bachelor's Degree | - | - |
| Graduate Degree | - | - |
| Total | - | - |
Family Income in El Duende
Family Income Brackets in El Duende
According to the El Duende family income data, there are 114 families falling into the less than $10,000 income range, which is the most common income bracket and makes up 42.9% of all families.
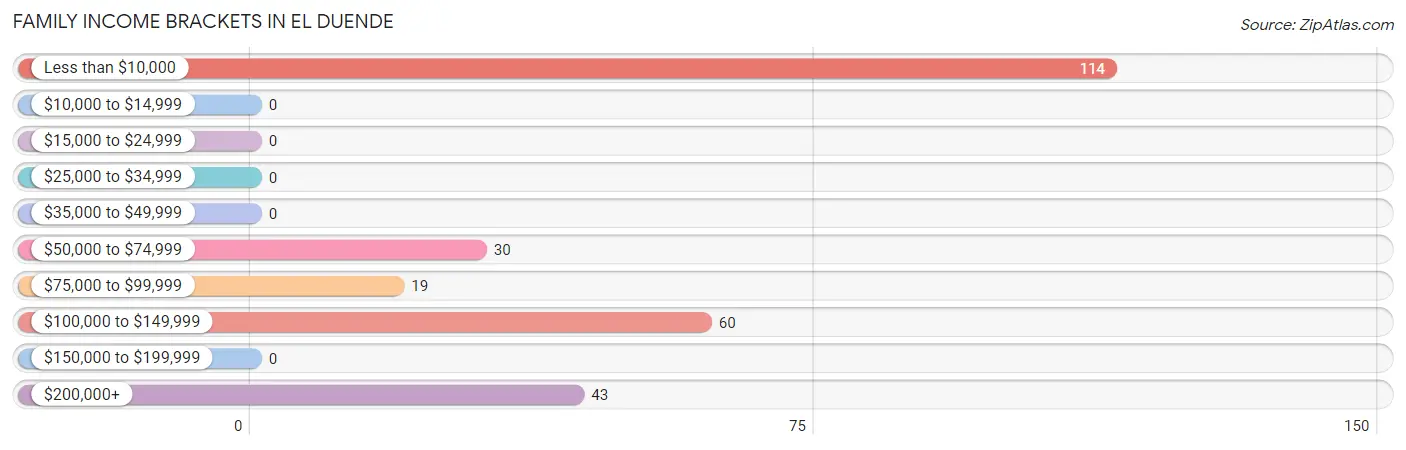
| Income Bracket | # Families | % Families |
| Less than $10,000 | 114 | 42.9% |
| $10,000 to $14,999 | 0 | 0.0% |
| $15,000 to $24,999 | 0 | 0.0% |
| $25,000 to $34,999 | 0 | 0.0% |
| $35,000 to $49,999 | 0 | 0.0% |
| $50,000 to $74,999 | 30 | 11.3% |
| $75,000 to $99,999 | 19 | 7.1% |
| $100,000 to $149,999 | 60 | 22.6% |
| $150,000 to $199,999 | 0 | 0.0% |
| $200,000+ | 43 | 16.2% |
Family Income by Famaliy Size in El Duende
| Income Bracket | # Families | Median Income |
| 2-Person Families | 62 (23.3%) | $0 |
| 3-Person Families | 114 (42.9%) | $0 |
| 4-Person Families | 60 (22.6%) | $0 |
| 5-Person Families | 0 (0.0%) | $0 |
| 6-Person Families | 30 (11.3%) | $0 |
| 7+ Person Families | 0 (0.0%) | $0 |
| Total | 266 (100.0%) | $0 |
Family Income by Number of Earners in El Duende
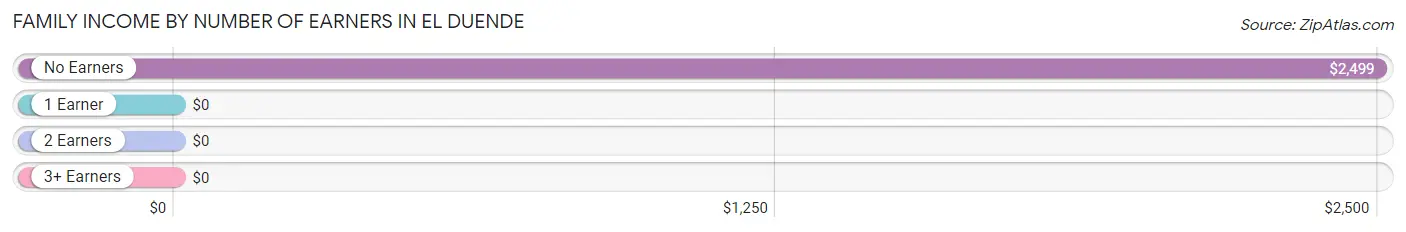
| Number of Earners | # Families | Median Income |
| No Earners | 129 (48.5%) | $2,499 |
| 1 Earner | 34 (12.8%) | $0 |
| 2 Earners | 103 (38.7%) | $0 |
| 3+ Earners | 0 (0.0%) | $0 |
| Total | 266 (100.0%) | $0 |
Household Income in El Duende
Household Income Brackets in El Duende
With 80 households falling in the category, the less than $10,000 income range is the most frequent in El Duende, accounting for 30.1% of all households.
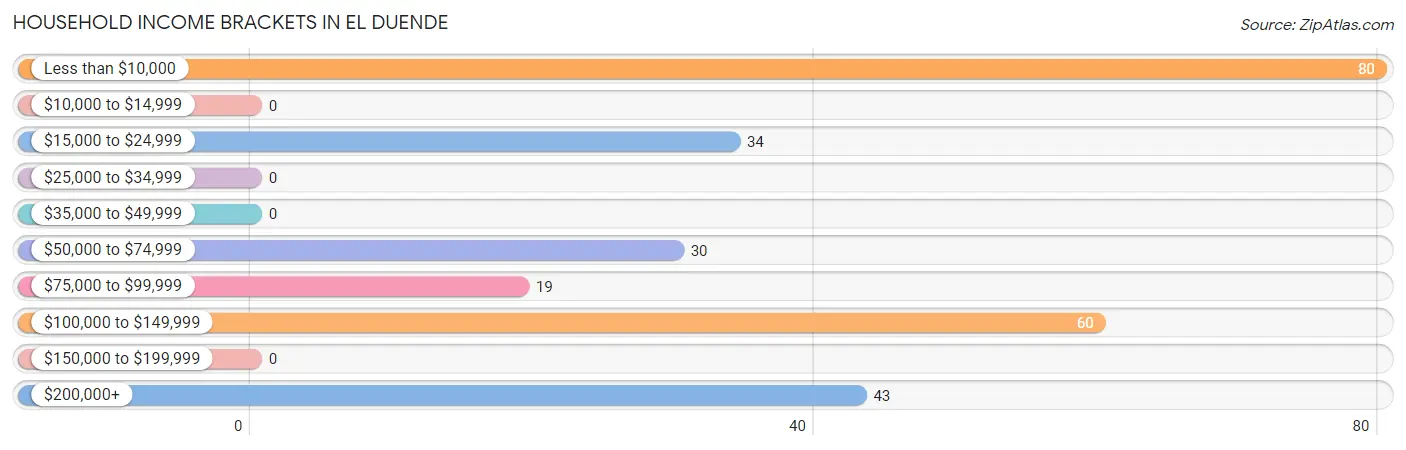
| Income Bracket | # Households | % Households |
| Less than $10,000 | 80 | 30.1% |
| $10,000 to $14,999 | 0 | 0.0% |
| $15,000 to $24,999 | 34 | 12.8% |
| $25,000 to $34,999 | 0 | 0.0% |
| $35,000 to $49,999 | 0 | 0.0% |
| $50,000 to $74,999 | 30 | 11.3% |
| $75,000 to $99,999 | 19 | 7.1% |
| $100,000 to $149,999 | 60 | 22.6% |
| $150,000 to $199,999 | 0 | 0.0% |
| $200,000+ | 43 | 16.2% |
Household Income by Householder Age in El Duende
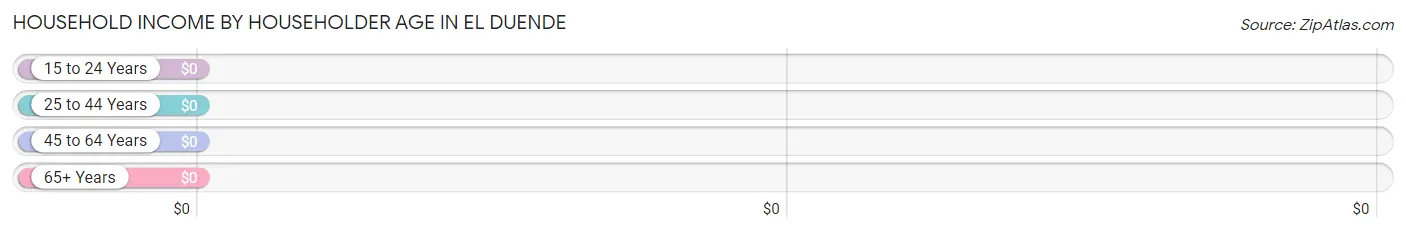
| Income Bracket | # Households | Median Income |
| 15 to 24 Years | 0 (0.0%) | $0 |
| 25 to 44 Years | 174 (65.4%) | $0 |
| 45 to 64 Years | 92 (34.6%) | $0 |
| 65+ Years | 0 (0.0%) | $0 |
| Total | 266 (100.0%) | $0 |
Poverty in El Duende
Income Below Poverty by Sex and Age in El Duende
With 27.1% poverty level for males and 54.0% for females among the residents of El Duende, 18 to 24 year old males and 6 to 11 year old females are the most vulnerable to poverty, with 1 males (100.0%) and 180 females (100.0%) in their respective age groups living below the poverty level.
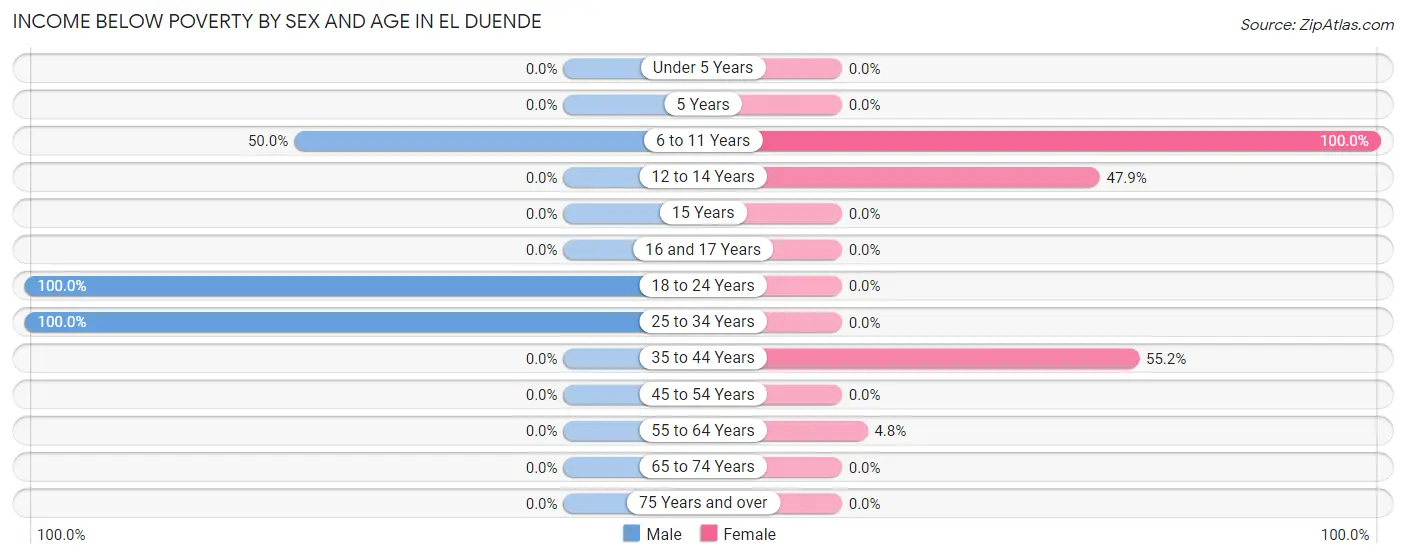
| Age Bracket | Male | Female |
| Under 5 Years | 0 (0.0%) | 0 (0.0%) |
| 5 Years | 0 (0.0%) | 0 (0.0%) |
| 6 to 11 Years | 85 (50.0%) | 180 (100.0%) |
| 12 to 14 Years | 0 (0.0%) | 100 (47.8%) |
| 15 Years | 0 (0.0%) | 0 (0.0%) |
| 16 and 17 Years | 0 (0.0%) | 0 (0.0%) |
| 18 to 24 Years | 1 (100.0%) | 0 (0.0%) |
| 25 to 34 Years | 34 (100.0%) | 0 (0.0%) |
| 35 to 44 Years | 0 (0.0%) | 80 (55.2%) |
| 45 to 54 Years | 0 (0.0%) | 0 (0.0%) |
| 55 to 64 Years | 0 (0.0%) | 1 (4.8%) |
| 65 to 74 Years | 0 (0.0%) | 0 (0.0%) |
| 75 Years and over | 0 (0.0%) | 0 (0.0%) |
| Total | 120 (27.1%) | 361 (54.0%) |
Income Above Poverty by Sex and Age in El Duende
According to the poverty statistics in El Duende, males aged under 5 years and females aged 15 years are the age groups that are most secure financially, with 100.0% of males and 100.0% of females in these age groups living above the poverty line.
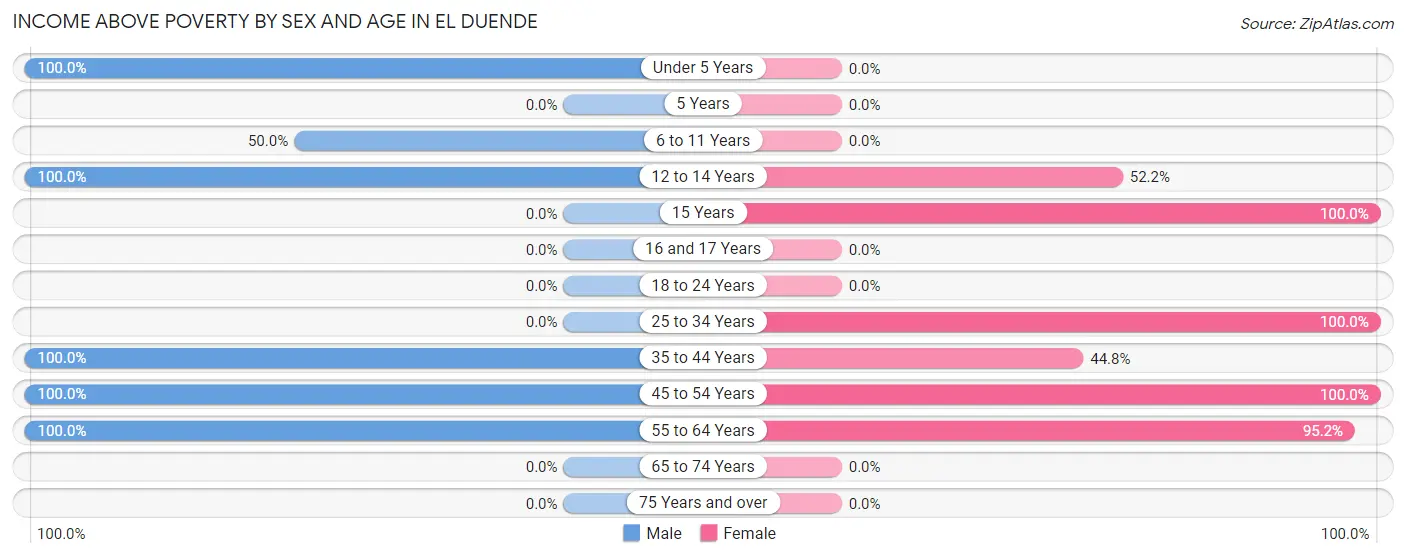
| Age Bracket | Male | Female |
| Under 5 Years | 55 (100.0%) | 0 (0.0%) |
| 5 Years | 0 (0.0%) | 0 (0.0%) |
| 6 to 11 Years | 85 (50.0%) | 0 (0.0%) |
| 12 to 14 Years | 30 (100.0%) | 109 (52.1%) |
| 15 Years | 0 (0.0%) | 24 (100.0%) |
| 16 and 17 Years | 0 (0.0%) | 0 (0.0%) |
| 18 to 24 Years | 0 (0.0%) | 0 (0.0%) |
| 25 to 34 Years | 0 (0.0%) | 56 (100.0%) |
| 35 to 44 Years | 61 (100.0%) | 65 (44.8%) |
| 45 to 54 Years | 19 (100.0%) | 34 (100.0%) |
| 55 to 64 Years | 73 (100.0%) | 20 (95.2%) |
| 65 to 74 Years | 0 (0.0%) | 0 (0.0%) |
| 75 Years and over | 0 (0.0%) | 0 (0.0%) |
| Total | 323 (72.9%) | 308 (46.0%) |
Income Below Poverty Among Married-Couple Families in El Duende
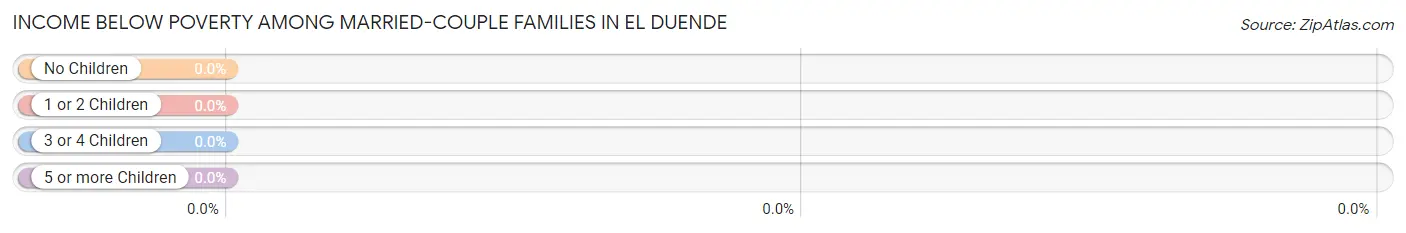
| Children | Above Poverty | Below Poverty |
| No Children | 62 (100.0%) | 0 (0.0%) |
| 1 or 2 Children | 60 (100.0%) | 0 (0.0%) |
| 3 or 4 Children | 30 (100.0%) | 0 (0.0%) |
| 5 or more Children | 0 (0.0%) | 0 (0.0%) |
| Total | 152 (100.0%) | 0 (0.0%) |
Income Below Poverty Among Single-Parent Households in El Duende
According to the poverty data in El Duende, 100.0% or 34 single-father households and 100.0% or 80 single-mother households are living below the poverty line. Among single-father households, those with 1 or 2 children have the highest poverty rate, with 34 households (100.0%) experiencing poverty. Likewise, among single-mother households, those with 1 or 2 children have the highest poverty rate, with 80 households (100.0%) falling below the poverty line.
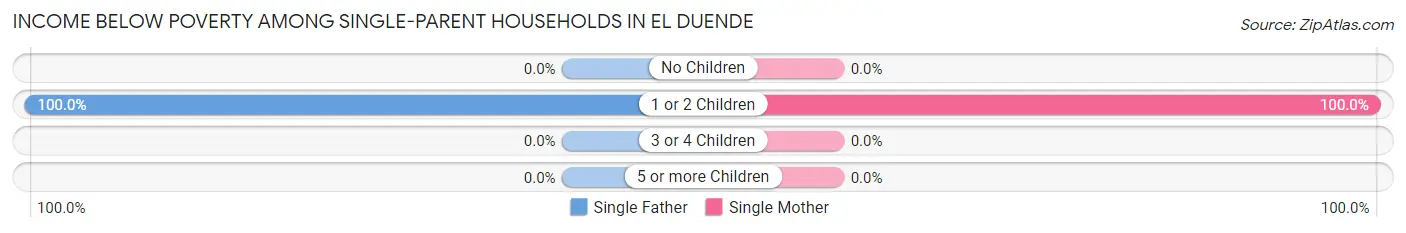
| Children | Single Father | Single Mother |
| No Children | 0 (0.0%) | 0 (0.0%) |
| 1 or 2 Children | 34 (100.0%) | 80 (100.0%) |
| 3 or 4 Children | 0 (0.0%) | 0 (0.0%) |
| 5 or more Children | 0 (0.0%) | 0 (0.0%) |
| Total | 34 (100.0%) | 80 (100.0%) |
Income Below Poverty Among Married-Couple vs Single-Parent Households in El Duende
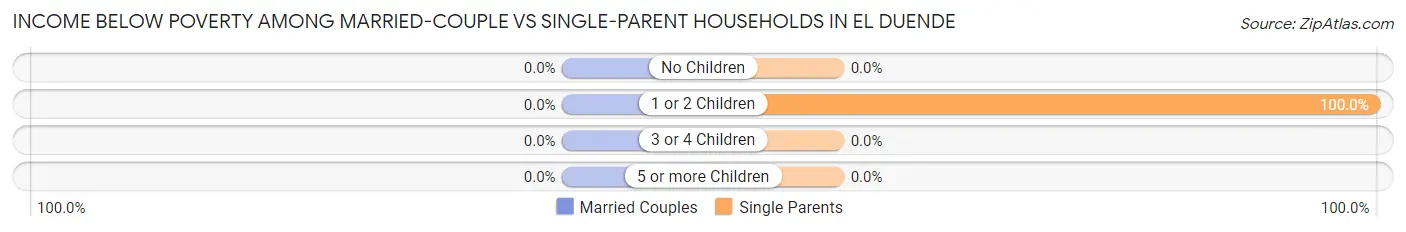
| Children | Married-Couple Families | Single-Parent Households |
| No Children | 0 (0.0%) | 0 (0.0%) |
| 1 or 2 Children | 0 (0.0%) | 114 (100.0%) |
| 3 or 4 Children | 0 (0.0%) | 0 (0.0%) |
| 5 or more Children | 0 (0.0%) | 0 (0.0%) |
| Total | 0 (0.0%) | 114 (100.0%) |
Race in El Duende
The most populous races in El Duende are Hispanic or Latino (1,109 | 99.6%), White / Caucasian (725 | 65.1%), and Some other Race (320 | 28.7%).
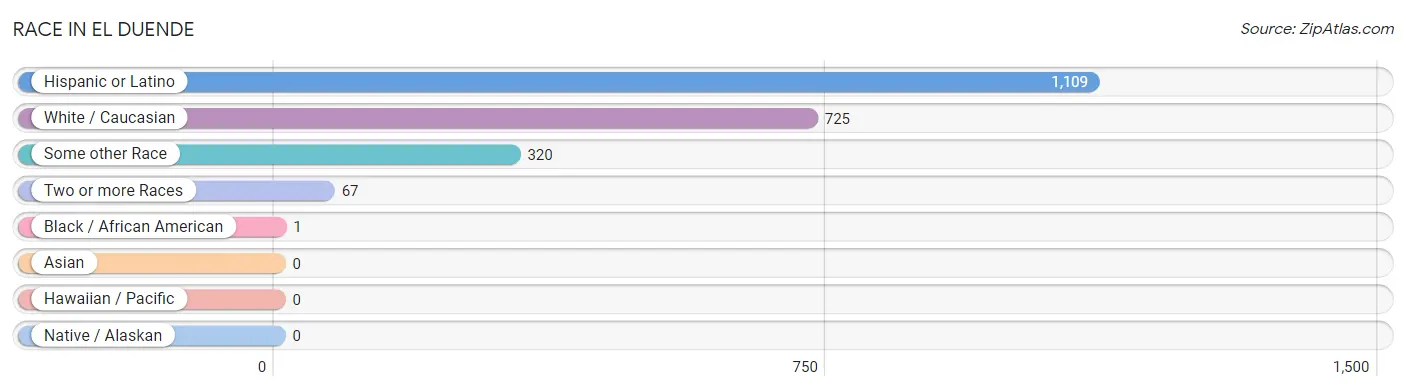
| Race | # Population | % Population |
| Asian | 0 | 0.0% |
| Black / African American | 1 | 0.1% |
| Hawaiian / Pacific | 0 | 0.0% |
| Hispanic or Latino | 1,109 | 99.6% |
| Native / Alaskan | 0 | 0.0% |
| White / Caucasian | 725 | 65.1% |
| Two or more Races | 67 | 6.0% |
| Some other Race | 320 | 28.7% |
| Total | 1,113 | 100.0% |
Ancestry in El Duende
The most populous ancestries reported in El Duende are Spanish (466 | 41.9%), Mexican (291 | 26.2%), German (2 | 0.2%), Swedish (1 | 0.1%), and Swiss (1 | 0.1%), together accounting for 68.4% of all El Duende residents.
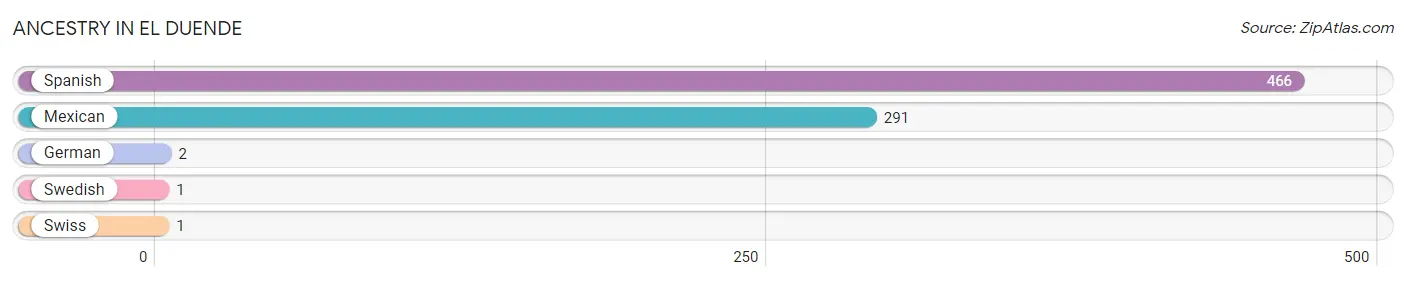
| Ancestry | # Population | % Population |
| German | 2 | 0.2% |
| Mexican | 291 | 26.2% |
| Spanish | 466 | 41.9% |
| Swedish | 1 | 0.1% |
| Swiss | 1 | 0.1% | View All 5 Rows |
Immigrants in El Duende
The most numerous immigrant groups reported in El Duende came from Europe (1 | 0.1%), Switzerland (1 | 0.1%), and Western Europe (1 | 0.1%), together accounting for 0.3% of all El Duende residents.
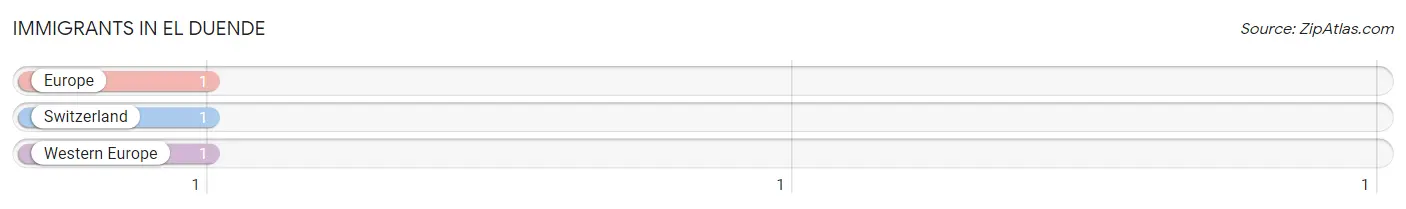
| Immigration Origin | # Population | % Population |
| Europe | 1 | 0.1% |
| Switzerland | 1 | 0.1% |
| Western Europe | 1 | 0.1% | View All 3 Rows |
Sex and Age in El Duende
Sex and Age in El Duende
The most populous age groups in El Duende are 5 to 9 Years (170 | 38.4%) for men and 10 to 14 Years (209 | 31.2%) for women.
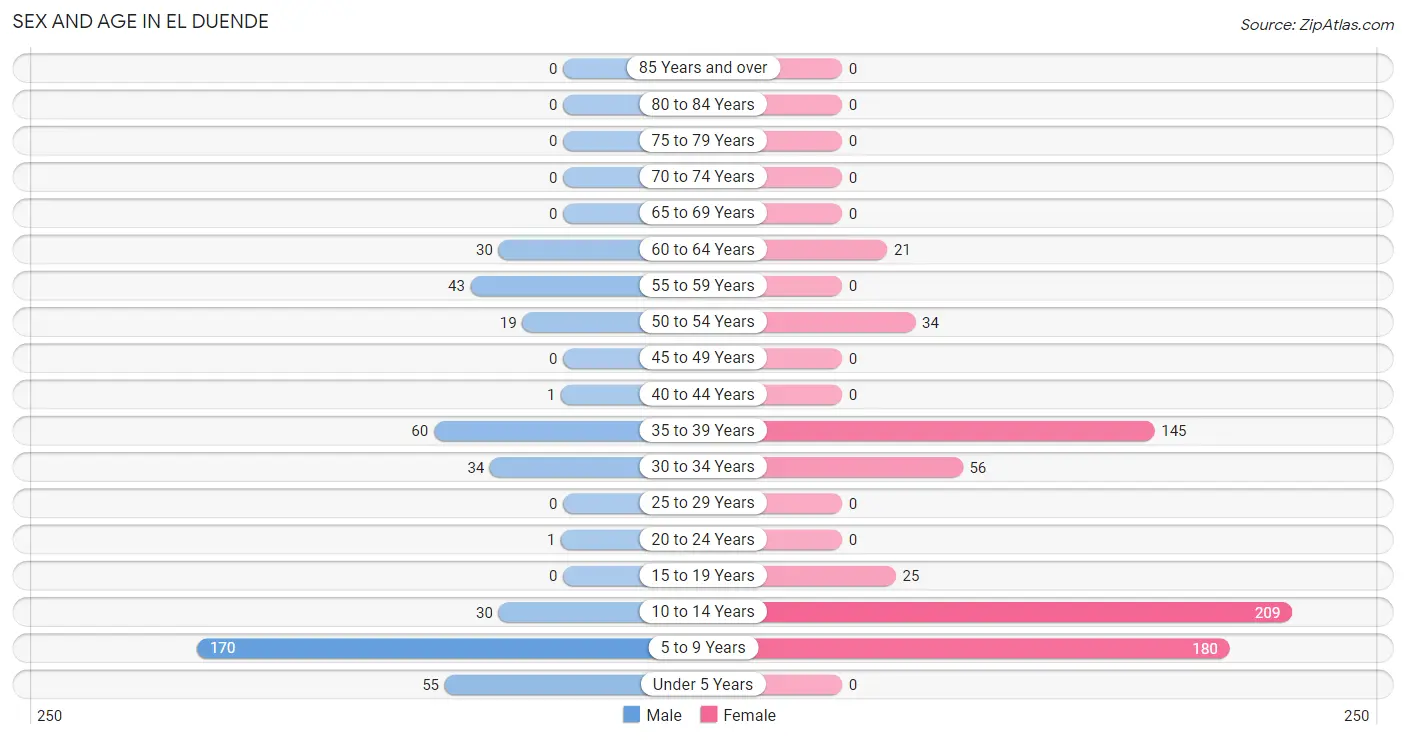
| Age Bracket | Male | Female |
| Under 5 Years | 55 (12.4%) | 0 (0.0%) |
| 5 to 9 Years | 170 (38.4%) | 180 (26.9%) |
| 10 to 14 Years | 30 (6.8%) | 209 (31.2%) |
| 15 to 19 Years | 0 (0.0%) | 25 (3.7%) |
| 20 to 24 Years | 1 (0.2%) | 0 (0.0%) |
| 25 to 29 Years | 0 (0.0%) | 0 (0.0%) |
| 30 to 34 Years | 34 (7.7%) | 56 (8.4%) |
| 35 to 39 Years | 60 (13.5%) | 145 (21.6%) |
| 40 to 44 Years | 1 (0.2%) | 0 (0.0%) |
| 45 to 49 Years | 0 (0.0%) | 0 (0.0%) |
| 50 to 54 Years | 19 (4.3%) | 34 (5.1%) |
| 55 to 59 Years | 43 (9.7%) | 0 (0.0%) |
| 60 to 64 Years | 30 (6.8%) | 21 (3.1%) |
| 65 to 69 Years | 0 (0.0%) | 0 (0.0%) |
| 70 to 74 Years | 0 (0.0%) | 0 (0.0%) |
| 75 to 79 Years | 0 (0.0%) | 0 (0.0%) |
| 80 to 84 Years | 0 (0.0%) | 0 (0.0%) |
| 85 Years and over | 0 (0.0%) | 0 (0.0%) |
| Total | 443 (100.0%) | 670 (100.0%) |
Families and Households in El Duende
Median Family Size in El Duende
The median family size in El Duende is 3.96 persons per family, with single male/father families (34 | 12.8%) accounting for the largest median family size of 5.88 persons per family. On the other hand, single female/mother families (80 | 30.1%) represent the smallest median family size with 3.49 persons per family.
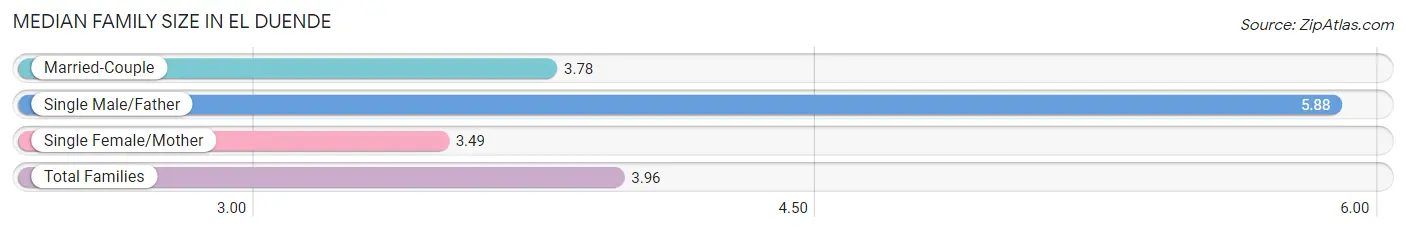
| Family Type | # Families | Family Size |
| Married-Couple | 152 (57.1%) | 3.78 |
| Single Male/Father | 34 (12.8%) | 5.88 |
| Single Female/Mother | 80 (30.1%) | 3.49 |
| Total Families | 266 (100.0%) | 3.96 |
Median Household Size in El Duende
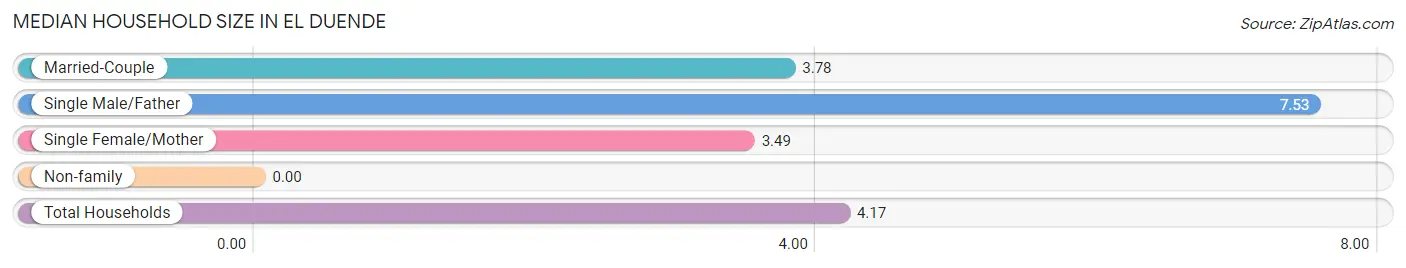
| Household Type | # Households | Household Size |
| Married-Couple | 152 (57.1%) | 3.78 |
| Single Male/Father | 34 (12.8%) | 7.53 |
| Single Female/Mother | 80 (30.1%) | 3.49 |
| Non-family | 0 (0.0%) | - |
| Total Households | 266 (100.0%) | 4.17 |
Household Size by Marriage Status in El Duende
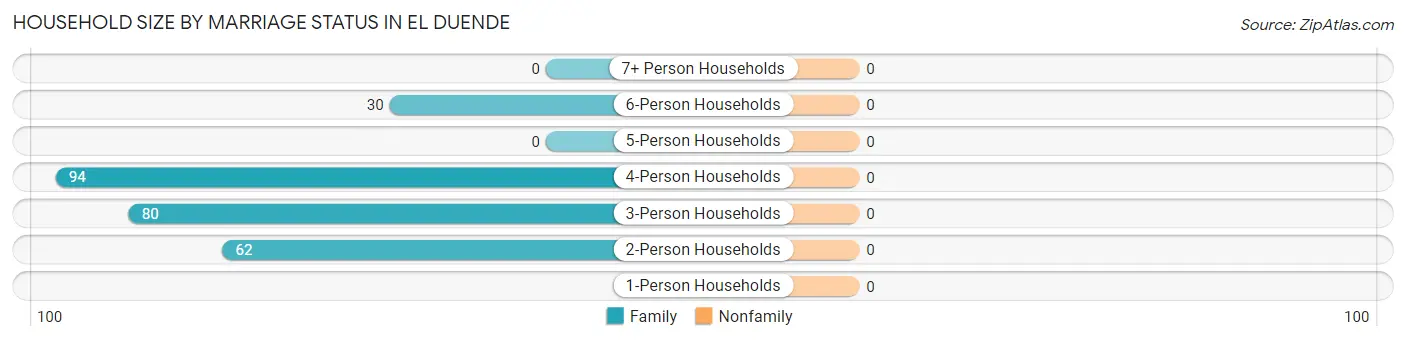
| Household Size | Family Households | Nonfamily Households |
| 1-Person Households | - | 0 (0.0%) |
| 2-Person Households | 62 (23.3%) | 0 (0.0%) |
| 3-Person Households | 80 (30.1%) | 0 (0.0%) |
| 4-Person Households | 94 (35.3%) | 0 (0.0%) |
| 5-Person Households | 0 (0.0%) | 0 (0.0%) |
| 6-Person Households | 30 (11.3%) | 0 (0.0%) |
| 7+ Person Households | 0 (0.0%) | 0 (0.0%) |
| Total | 266 (100.0%) | 0 (0.0%) |
Female Fertility in El Duende
Fertility by Age in El Duende
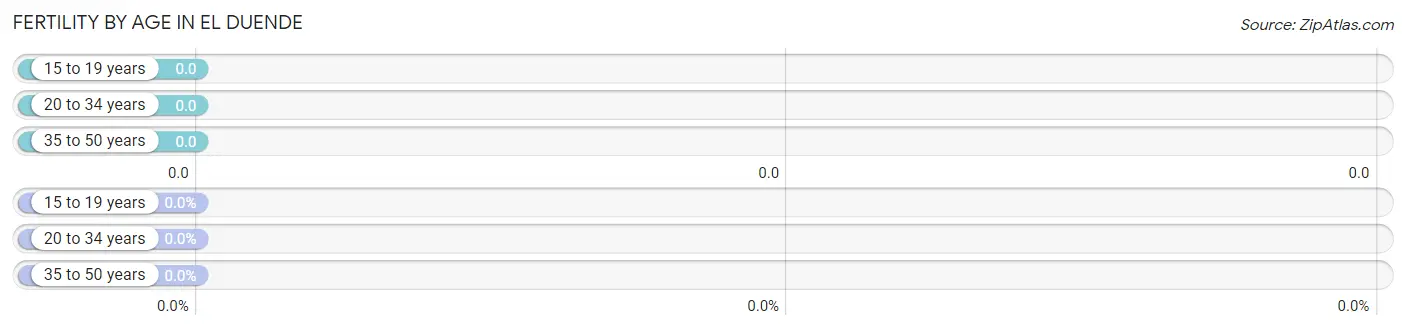
| Age Bracket | Women with Births | Births / 1,000 Women |
| 15 to 19 years | 0 (0.0%) | 0.0 |
| 20 to 34 years | 0 (0.0%) | 0.0 |
| 35 to 50 years | 0 (0.0%) | 0.0 |
| Total | 0 (0.0%) | 0.0 |
Fertility by Age by Marriage Status in El Duende
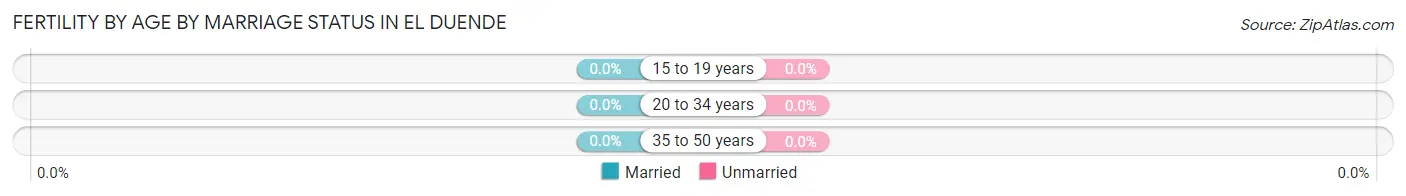
| Age Bracket | Married | Unmarried |
| 15 to 19 years | 0 (0.0%) | 0 (0.0%) |
| 20 to 34 years | 0 (0.0%) | 0 (0.0%) |
| 35 to 50 years | 0 (0.0%) | 0 (0.0%) |
| Total | 0 (0.0%) | 0 (0.0%) |
Fertility by Education in El Duende
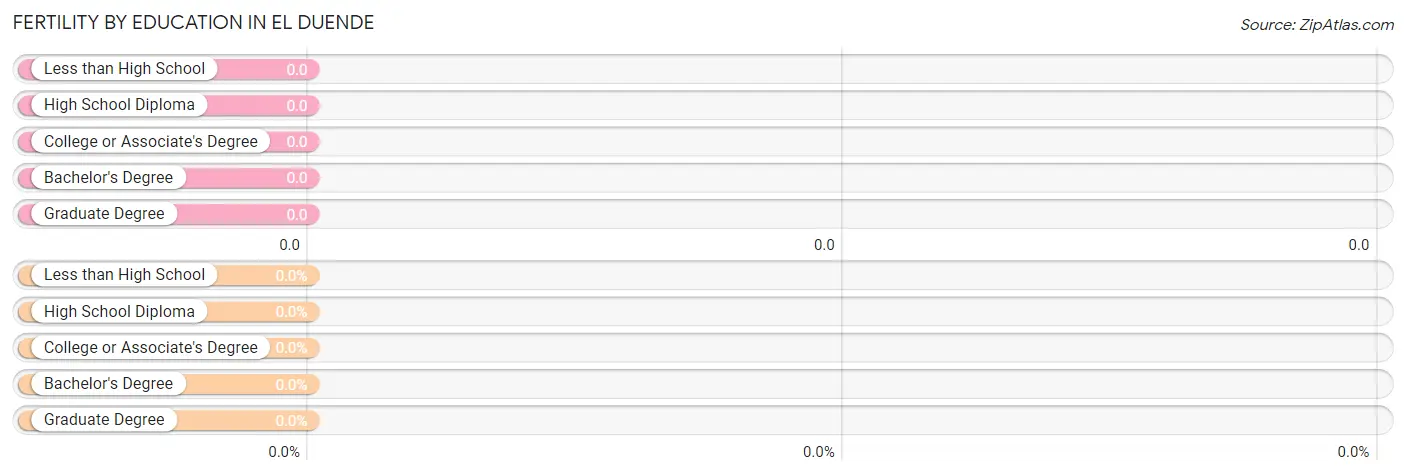
| Educational Attainment | Women with Births | Births / 1,000 Women |
| Less than High School | 0 (0.0%) | 0.0 |
| High School Diploma | 0 (0.0%) | 0.0 |
| College or Associate's Degree | 0 (0.0%) | 0.0 |
| Bachelor's Degree | 0 (0.0%) | 0.0 |
| Graduate Degree | 0 (0.0%) | 0.0 |
| Total | 0 (0.0%) | 0.0 |
Fertility by Education by Marriage Status in El Duende
| Educational Attainment | Married | Unmarried |
| Less than High School | 0 (0.0%) | 0 (0.0%) |
| High School Diploma | 0 (0.0%) | 0 (0.0%) |
| College or Associate's Degree | 0 (0.0%) | 0 (0.0%) |
| Bachelor's Degree | 0 (0.0%) | 0 (0.0%) |
| Graduate Degree | 0 (0.0%) | 0 (0.0%) |
| Total | 0 (0.0%) | 0 (0.0%) |
Employment Characteristics in El Duende
Employment by Class of Employer in El Duende
Among the 285 employed individuals in El Duende, private company employees (126 | 44.2%), federal government employees (114 | 40.0%), and self-employed (incorporated) (43 | 15.1%) make up the most common classes of employment.
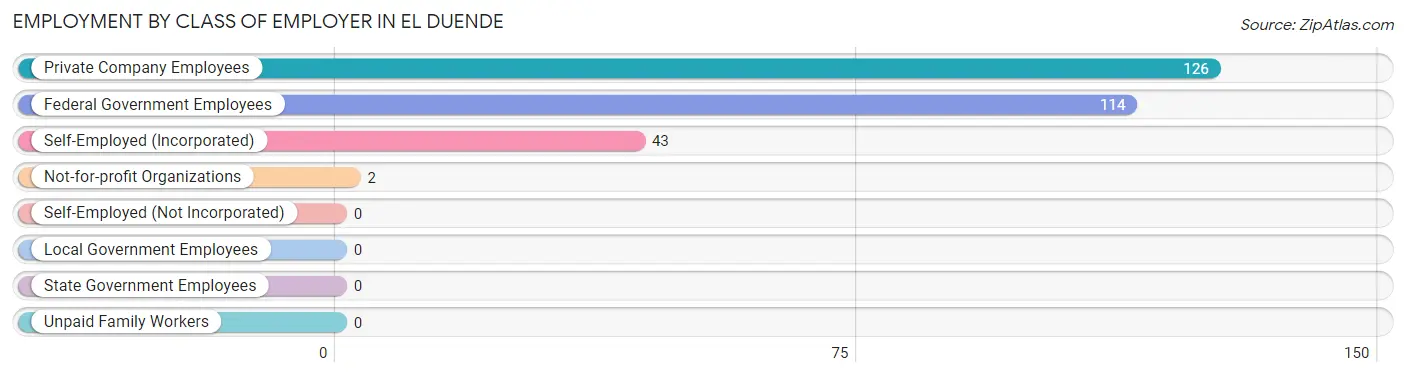
| Employer Class | # Employees | % Employees |
| Private Company Employees | 126 | 44.2% |
| Self-Employed (Incorporated) | 43 | 15.1% |
| Self-Employed (Not Incorporated) | 0 | 0.0% |
| Not-for-profit Organizations | 2 | 0.7% |
| Local Government Employees | 0 | 0.0% |
| State Government Employees | 0 | 0.0% |
| Federal Government Employees | 114 | 40.0% |
| Unpaid Family Workers | 0 | 0.0% |
| Total | 285 | 100.0% |
Employment Status by Age in El Duende
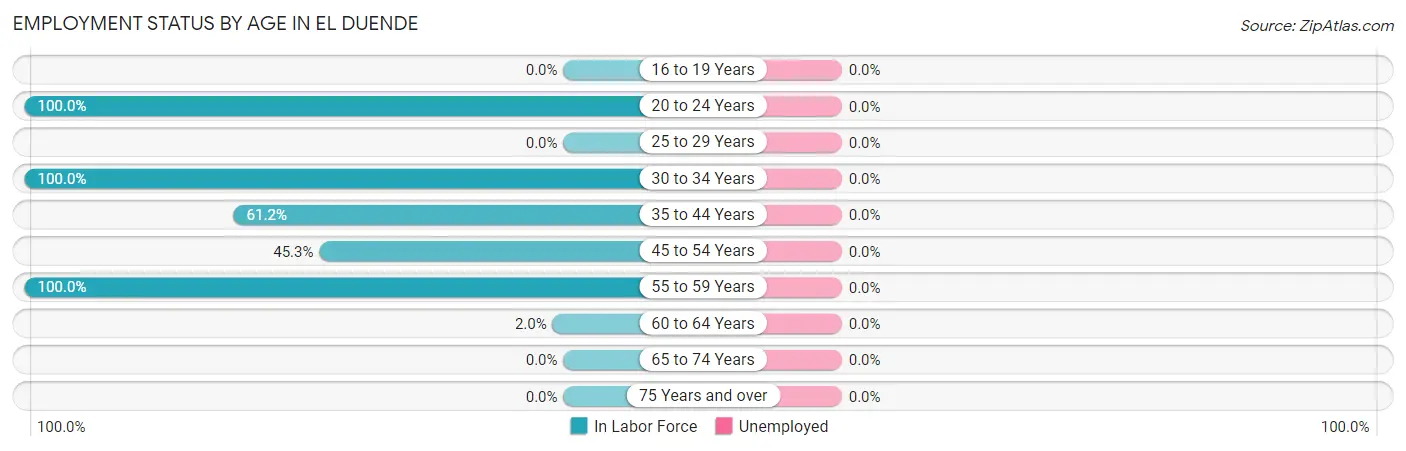
| Age Bracket | In Labor Force | Unemployed |
| 16 to 19 Years | 0 (0.0%) | 0 (0.0%) |
| 20 to 24 Years | 1 (100.0%) | 0 (0.0%) |
| 25 to 29 Years | 0 (0.0%) | 0 (0.0%) |
| 30 to 34 Years | 90 (100.0%) | 0 (0.0%) |
| 35 to 44 Years | 126 (61.2%) | 0 (0.0%) |
| 45 to 54 Years | 24 (45.3%) | 0 (0.0%) |
| 55 to 59 Years | 43 (100.0%) | 0 (0.0%) |
| 60 to 64 Years | 1 (2.0%) | 0 (0.0%) |
| 65 to 74 Years | 0 (0.0%) | 0 (0.0%) |
| 75 Years and over | 0 (0.0%) | 0 (0.0%) |
| Total | 285 (64.0%) | 0 (0.0%) |
Employment Status by Educational Attainment in El Duende
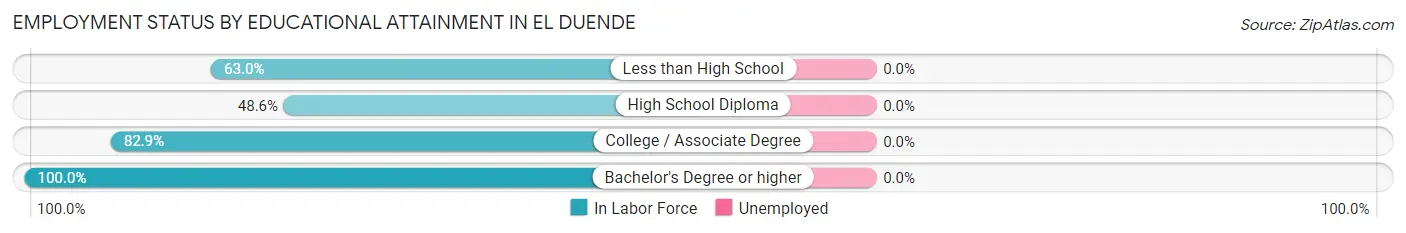
| Educational Attainment | In Labor Force | Unemployed |
| Less than High School | 34 (63.0%) | 0 (0.0%) |
| High School Diploma | 103 (48.6%) | 0 (0.0%) |
| College / Associate Degree | 145 (82.9%) | 0 (0.0%) |
| Bachelor's Degree or higher | 2 (100.0%) | 0 (0.0%) |
| Total | 284 (64.1%) | 0 (0.0%) |
Employment Occupations by Sex in El Duende
Management, Business, Science and Arts Occupations
The most common Management, Business, Science and Arts occupations in El Duende are Community & Social Service (1 | 0.4%), and Education, Arts & Media (1 | 0.4%).
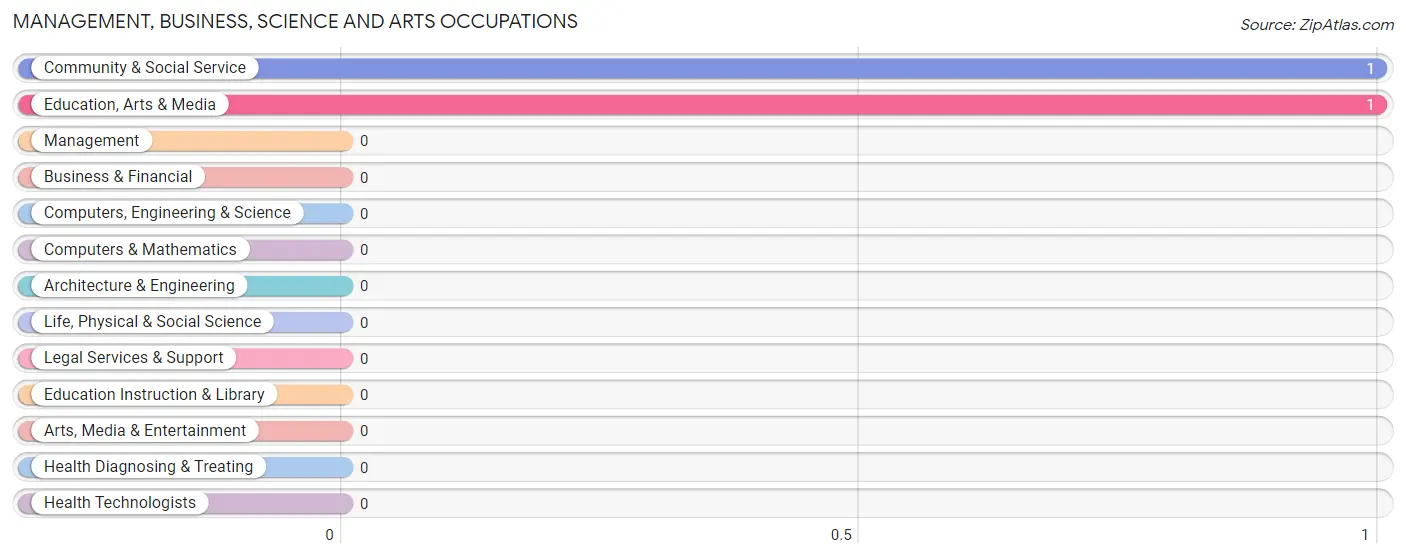
Management, Business, Science and Arts Occupations by Sex
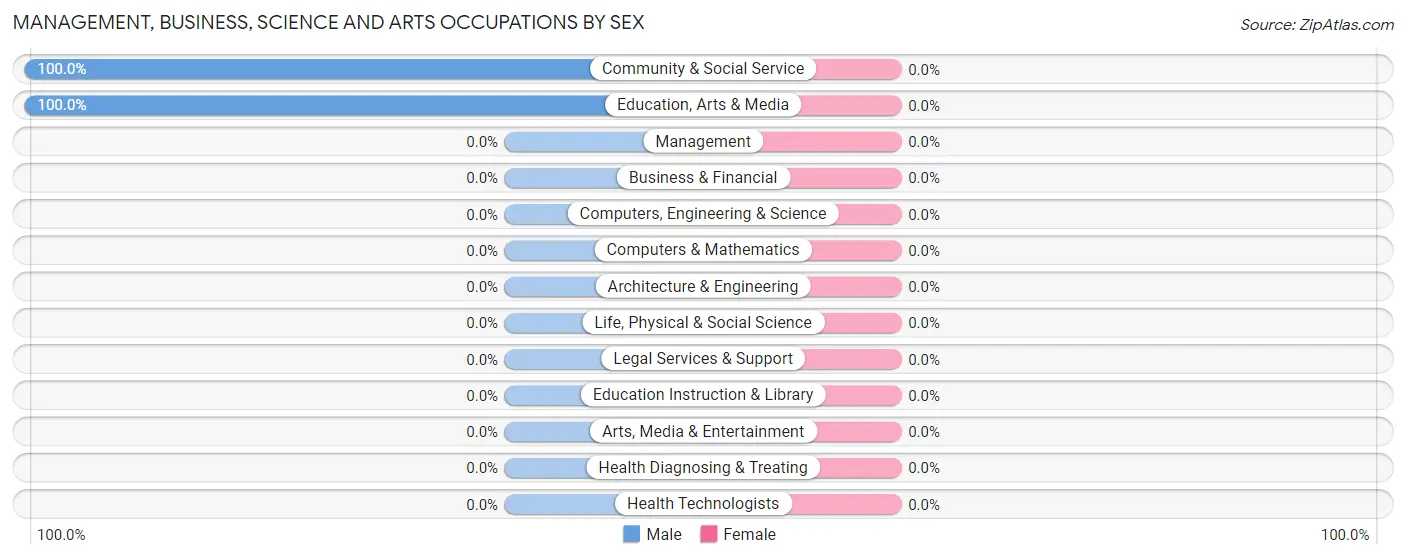
| Occupation | Male | Female |
| Management | 0 (0.0%) | 0 (0.0%) |
| Business & Financial | 0 (0.0%) | 0 (0.0%) |
| Computers, Engineering & Science | 0 (0.0%) | 0 (0.0%) |
| Computers & Mathematics | 0 (0.0%) | 0 (0.0%) |
| Architecture & Engineering | 0 (0.0%) | 0 (0.0%) |
| Life, Physical & Social Science | 0 (0.0%) | 0 (0.0%) |
| Community & Social Service | 1 (100.0%) | 0 (0.0%) |
| Education, Arts & Media | 1 (100.0%) | 0 (0.0%) |
| Legal Services & Support | 0 (0.0%) | 0 (0.0%) |
| Education Instruction & Library | 0 (0.0%) | 0 (0.0%) |
| Arts, Media & Entertainment | 0 (0.0%) | 0 (0.0%) |
| Health Diagnosing & Treating | 0 (0.0%) | 0 (0.0%) |
| Health Technologists | 0 (0.0%) | 0 (0.0%) |
| Total (Category) | 1 (100.0%) | 0 (0.0%) |
| Total (Overall) | 139 (48.8%) | 146 (51.2%) |
Services Occupations
The most common Services occupations in El Duende are Cleaning & Maintenance (133 | 46.7%), Personal Care & Service (65 | 22.8%), Security & Protection (24 | 8.4%), and Firefighting & Prevention (24 | 8.4%).
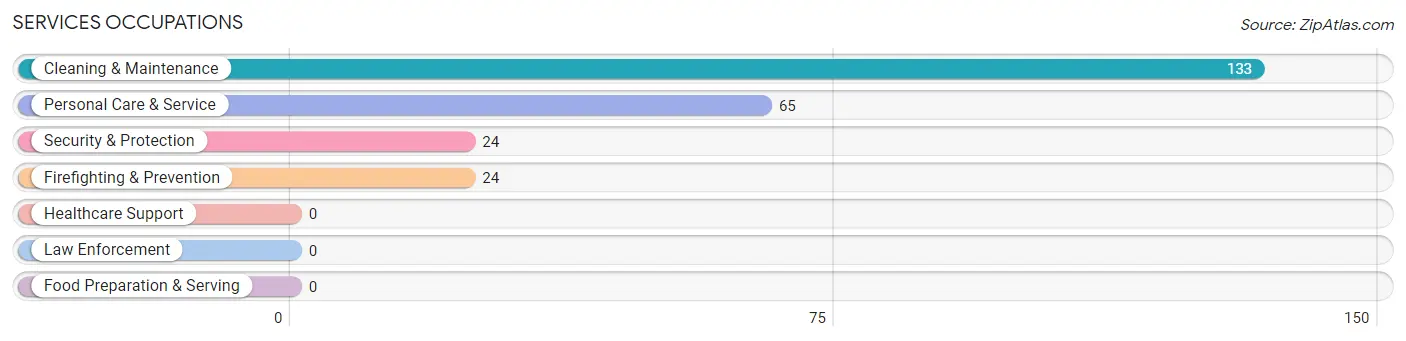
Services Occupations by Sex
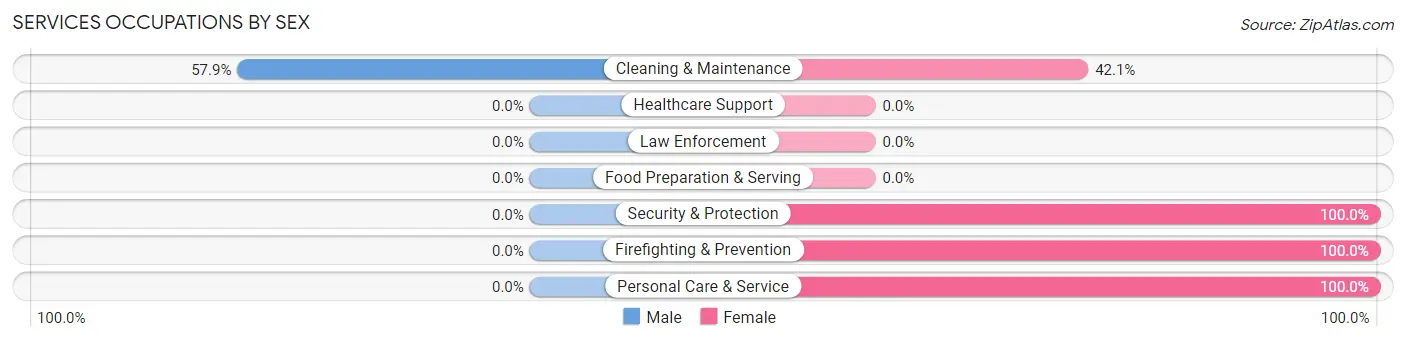
| Occupation | Male | Female |
| Healthcare Support | 0 (0.0%) | 0 (0.0%) |
| Security & Protection | 0 (0.0%) | 24 (100.0%) |
| Firefighting & Prevention | 0 (0.0%) | 24 (100.0%) |
| Law Enforcement | 0 (0.0%) | 0 (0.0%) |
| Food Preparation & Serving | 0 (0.0%) | 0 (0.0%) |
| Cleaning & Maintenance | 77 (57.9%) | 56 (42.1%) |
| Personal Care & Service | 0 (0.0%) | 65 (100.0%) |
| Total (Category) | 77 (34.7%) | 145 (65.3%) |
| Total (Overall) | 139 (48.8%) | 146 (51.2%) |
Sales and Office Occupations
The most common Sales and Office occupations in El Duende are , and Sales & Related (1 | 0.4%).

Sales and Office Occupations by Sex

| Occupation | Male | Female |
| Sales & Related | 0 (0.0%) | 1 (100.0%) |
| Office & Administration | 0 (0.0%) | 0 (0.0%) |
| Total (Category) | 0 (0.0%) | 1 (100.0%) |
| Total (Overall) | 139 (48.8%) | 146 (51.2%) |
Natural Resources, Construction and Maintenance Occupations
The most common Natural Resources, Construction and Maintenance occupations in El Duende are , and Installation, Maintenance & Repair (60 | 21.0%).
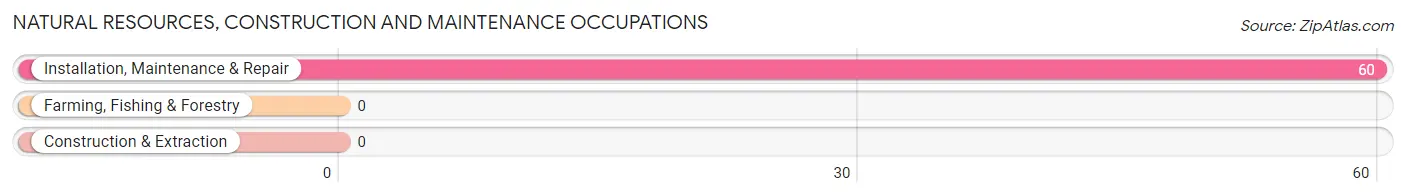
Natural Resources, Construction and Maintenance Occupations by Sex
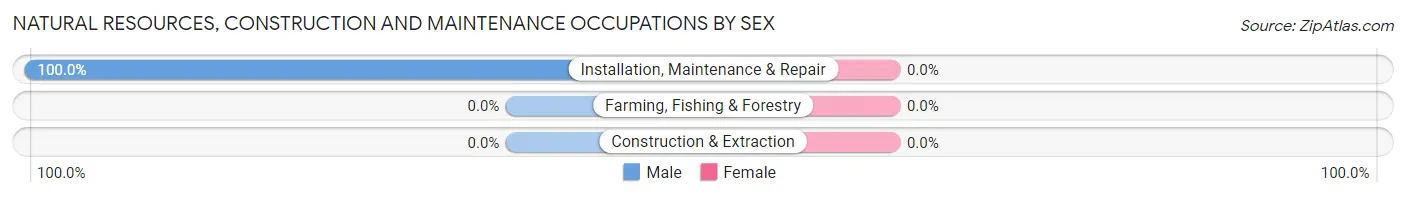
| Occupation | Male | Female |
| Farming, Fishing & Forestry | 0 (0.0%) | 0 (0.0%) |
| Construction & Extraction | 0 (0.0%) | 0 (0.0%) |
| Installation, Maintenance & Repair | 60 (100.0%) | 0 (0.0%) |
| Total (Category) | 60 (100.0%) | 0 (0.0%) |
| Total (Overall) | 139 (48.8%) | 146 (51.2%) |
Production, Transportation and Moving Occupations
The most common Production, Transportation and Moving occupations in El Duende are , and Production (1 | 0.4%).
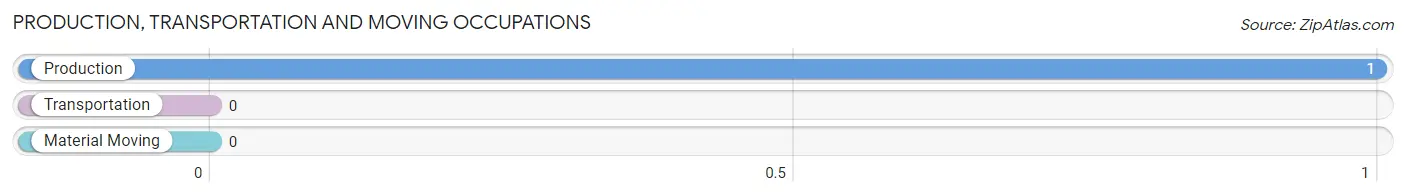
Production, Transportation and Moving Occupations by Sex
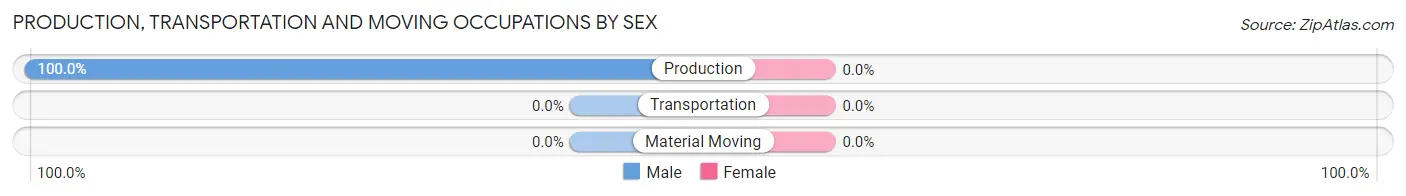
| Occupation | Male | Female |
| Production | 1 (100.0%) | 0 (0.0%) |
| Transportation | 0 (0.0%) | 0 (0.0%) |
| Material Moving | 0 (0.0%) | 0 (0.0%) |
| Total (Category) | 1 (100.0%) | 0 (0.0%) |
| Total (Overall) | 139 (48.8%) | 146 (51.2%) |
Employment Industries by Sex in El Duende
Employment Industries in El Duende
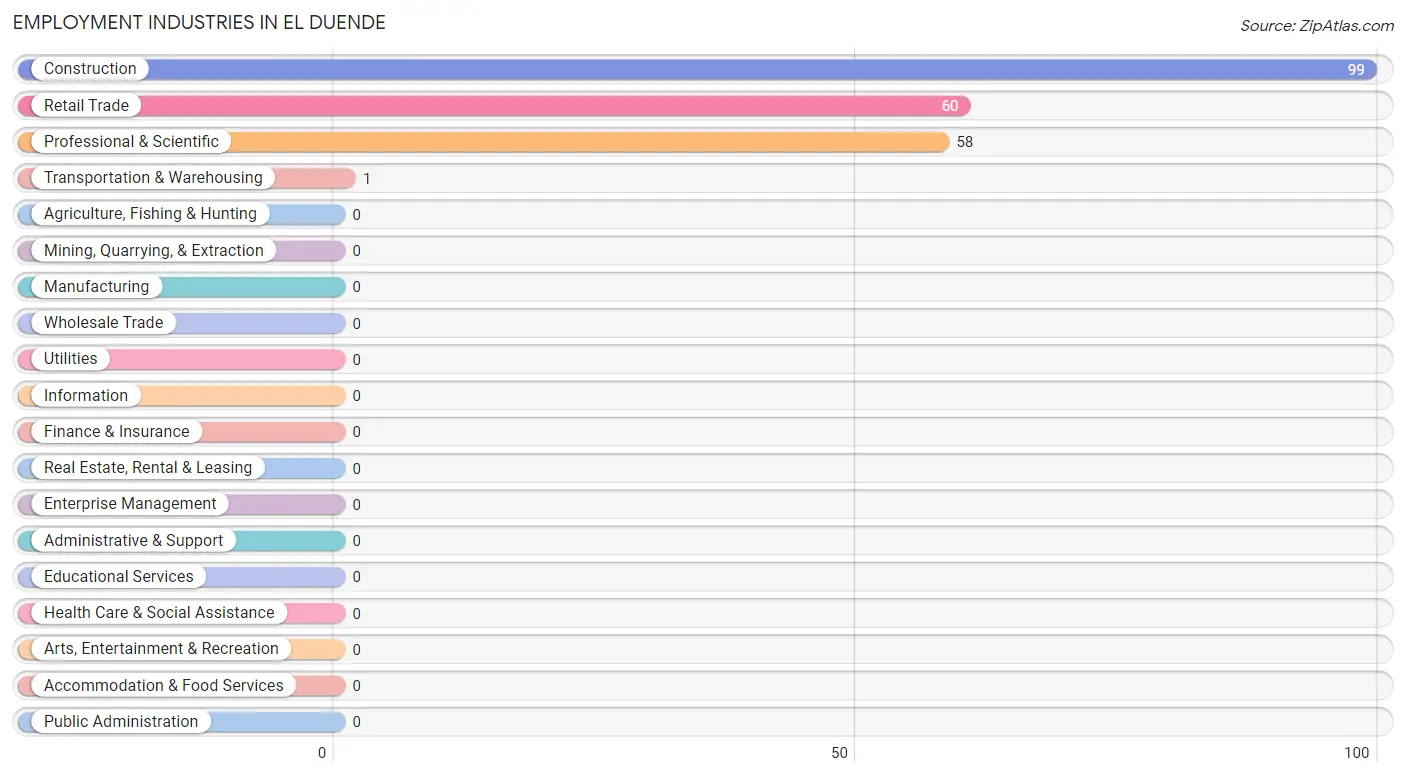
The major employment industries in El Duende include Construction (99 | 34.7%), Retail Trade (60 | 21.0%), Professional & Scientific (58 | 20.3%), and Transportation & Warehousing (1 | 0.4%).
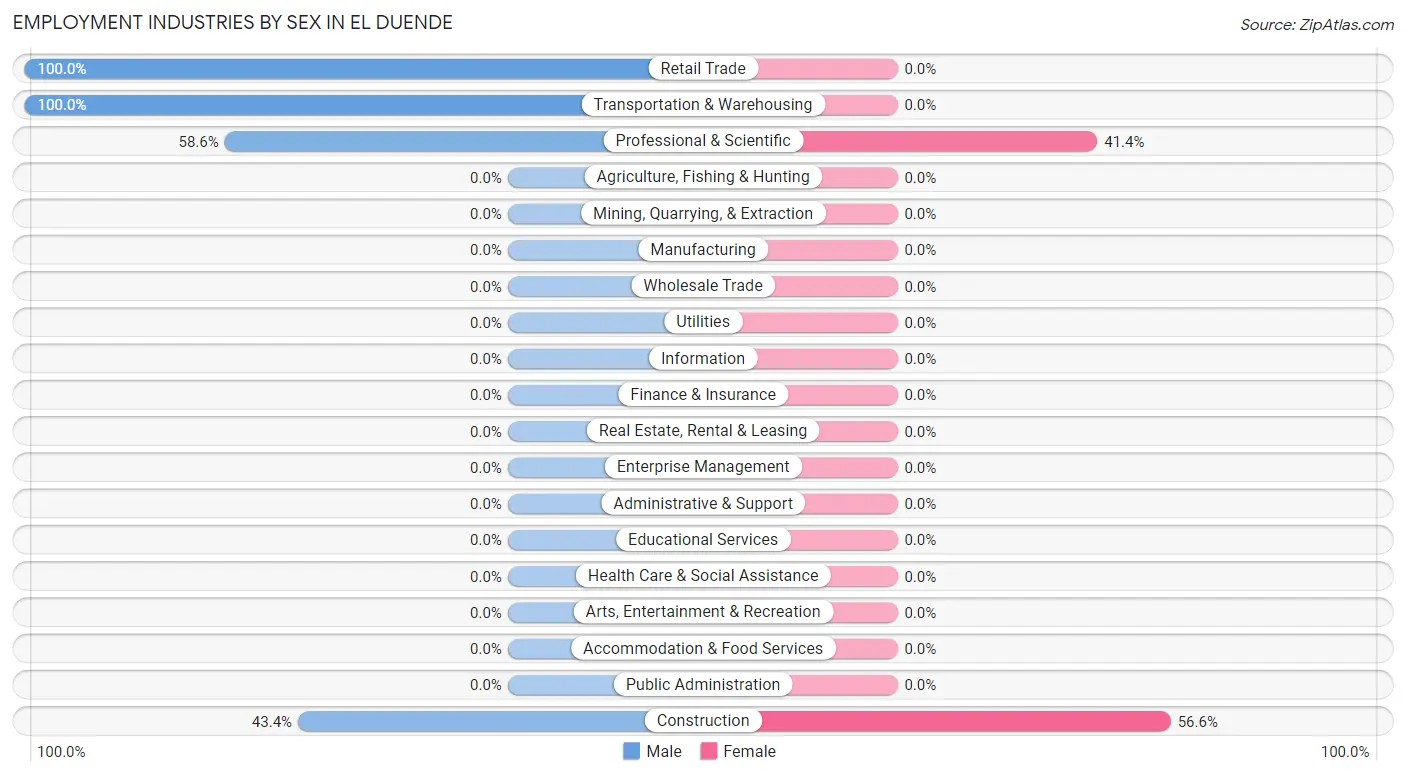
Employment Industries by Sex in El Duende
The El Duende industries that see more men than women are Retail Trade (100.0%), Transportation & Warehousing (100.0%), and Professional & Scientific (58.6%), whereas the industries that tend to have a higher number of women are Construction (56.6%), and Professional & Scientific (41.4%).
| Industry | Male | Female |
| Agriculture, Fishing & Hunting | 0 (0.0%) | 0 (0.0%) |
| Mining, Quarrying, & Extraction | 0 (0.0%) | 0 (0.0%) |
| Construction | 43 (43.4%) | 56 (56.6%) |
| Manufacturing | 0 (0.0%) | 0 (0.0%) |
| Wholesale Trade | 0 (0.0%) | 0 (0.0%) |
| Retail Trade | 60 (100.0%) | 0 (0.0%) |
| Transportation & Warehousing | 1 (100.0%) | 0 (0.0%) |
| Utilities | 0 (0.0%) | 0 (0.0%) |
| Information | 0 (0.0%) | 0 (0.0%) |
| Finance & Insurance | 0 (0.0%) | 0 (0.0%) |
| Real Estate, Rental & Leasing | 0 (0.0%) | 0 (0.0%) |
| Professional & Scientific | 34 (58.6%) | 24 (41.4%) |
| Enterprise Management | 0 (0.0%) | 0 (0.0%) |
| Administrative & Support | 0 (0.0%) | 0 (0.0%) |
| Educational Services | 0 (0.0%) | 0 (0.0%) |
| Health Care & Social Assistance | 0 (0.0%) | 0 (0.0%) |
| Arts, Entertainment & Recreation | 0 (0.0%) | 0 (0.0%) |
| Accommodation & Food Services | 0 (0.0%) | 0 (0.0%) |
| Public Administration | 0 (0.0%) | 0 (0.0%) |
| Total | 139 (48.8%) | 146 (51.2%) |
Education in El Duende
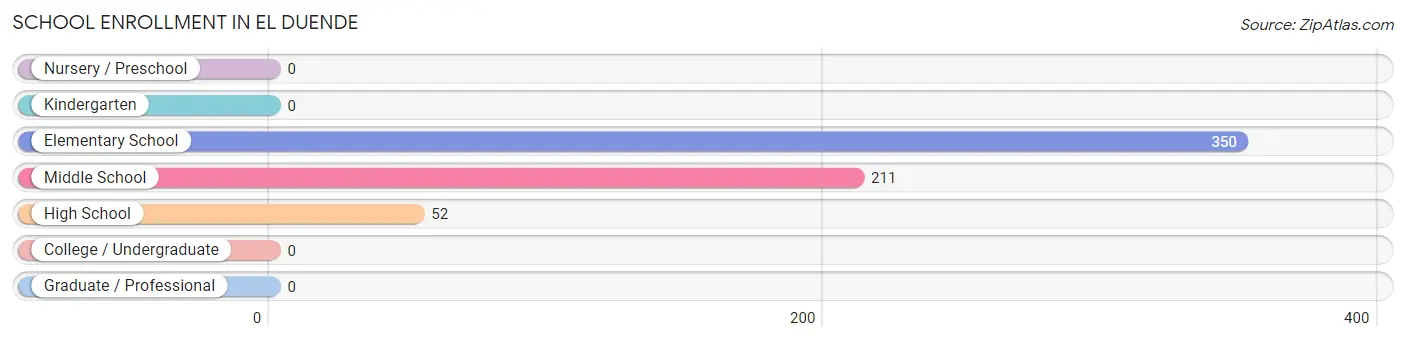
School Enrollment in El Duende
The most common levels of schooling among the 613 students in El Duende are elementary school (350 | 57.1%), middle school (211 | 34.4%), and high school (52 | 8.5%).
| School Level | # Students | % Students |
| Nursery / Preschool | 0 | 0.0% |
| Kindergarten | 0 | 0.0% |
| Elementary School | 350 | 57.1% |
| Middle School | 211 | 34.4% |
| High School | 52 | 8.5% |
| College / Undergraduate | 0 | 0.0% |
| Graduate / Professional | 0 | 0.0% |
| Total | 613 | 100.0% |
School Enrollment by Age by Funding Source in El Duende
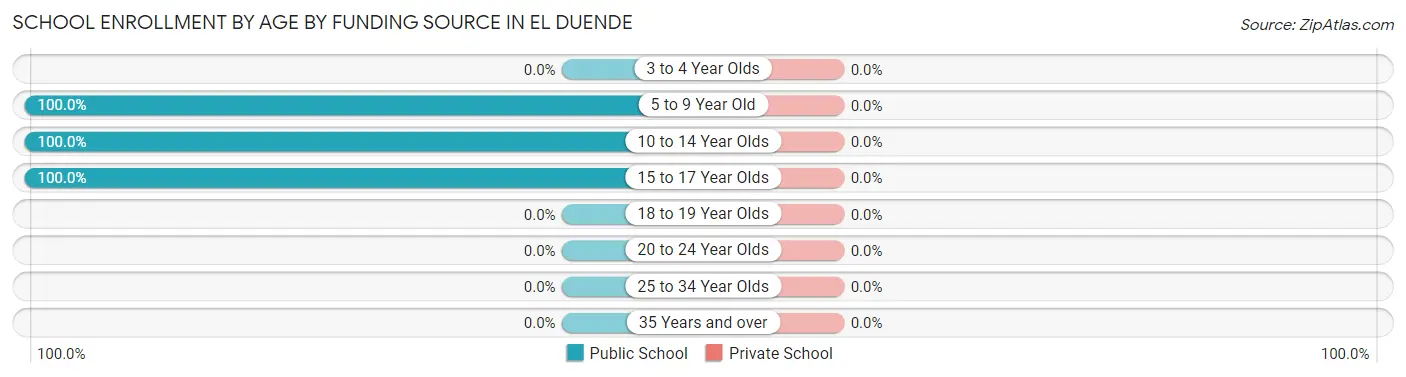
| Age Bracket | Public School | Private School |
| 3 to 4 Year Olds | 0 (0.0%) | 0 (0.0%) |
| 5 to 9 Year Old | 350 (100.0%) | 0 (0.0%) |
| 10 to 14 Year Olds | 239 (100.0%) | 0 (0.0%) |
| 15 to 17 Year Olds | 24 (100.0%) | 0 (0.0%) |
| 18 to 19 Year Olds | 0 (0.0%) | 0 (0.0%) |
| 20 to 24 Year Olds | 0 (0.0%) | 0 (0.0%) |
| 25 to 34 Year Olds | 0 (0.0%) | 0 (0.0%) |
| 35 Years and over | 0 (0.0%) | 0 (0.0%) |
| Total | 613 (100.0%) | 0 (0.0%) |
Educational Attainment by Field of Study in El Duende
Business (1 | 50.0%), and liberal arts & history (1 | 50.0%) are the most common fields of study among 2 individuals in El Duende who have obtained a bachelor's degree or higher.
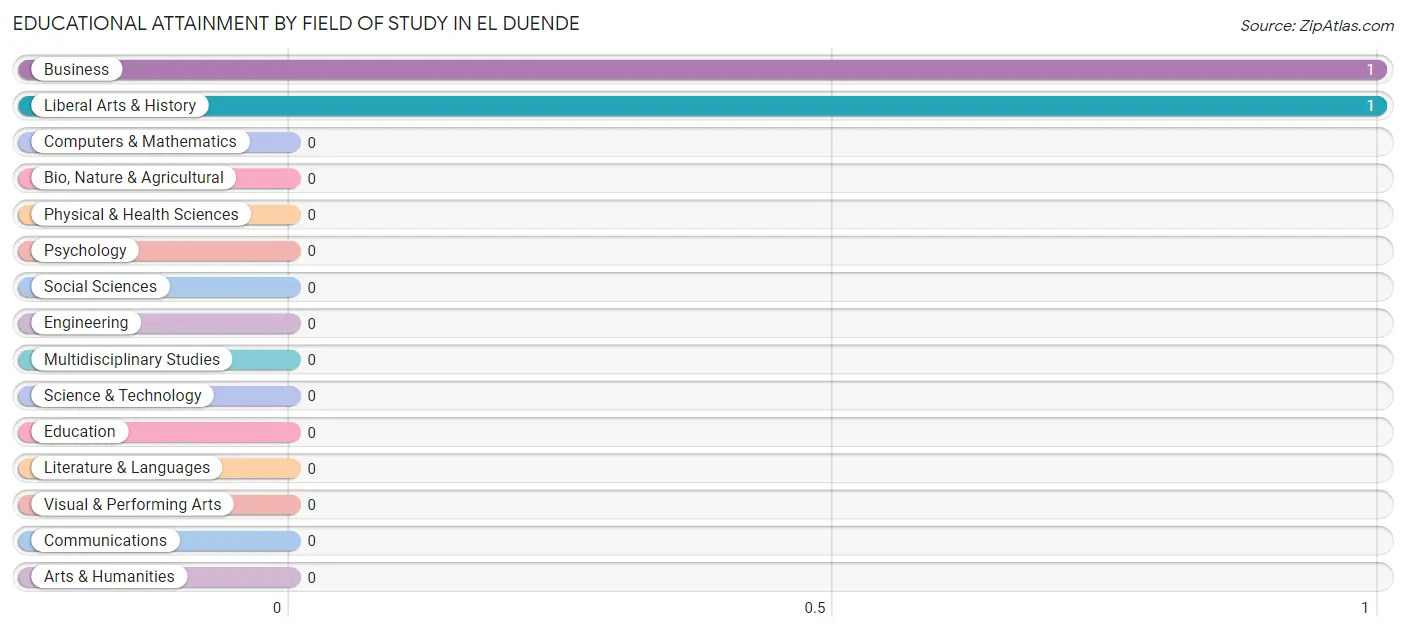
| Field of Study | # Graduates | % Graduates |
| Computers & Mathematics | 0 | 0.0% |
| Bio, Nature & Agricultural | 0 | 0.0% |
| Physical & Health Sciences | 0 | 0.0% |
| Psychology | 0 | 0.0% |
| Social Sciences | 0 | 0.0% |
| Engineering | 0 | 0.0% |
| Multidisciplinary Studies | 0 | 0.0% |
| Science & Technology | 0 | 0.0% |
| Business | 1 | 50.0% |
| Education | 0 | 0.0% |
| Literature & Languages | 0 | 0.0% |
| Liberal Arts & History | 1 | 50.0% |
| Visual & Performing Arts | 0 | 0.0% |
| Communications | 0 | 0.0% |
| Arts & Humanities | 0 | 0.0% |
| Total | 2 | 100.0% |
Transportation & Commute in El Duende
Vehicle Availability by Sex in El Duende
The most prevalent vehicle ownership categories in El Duende are males with 5 or more vehicles (60, accounting for 43.8%) and females with 5 or more vehicles (65, making up 41.4%).
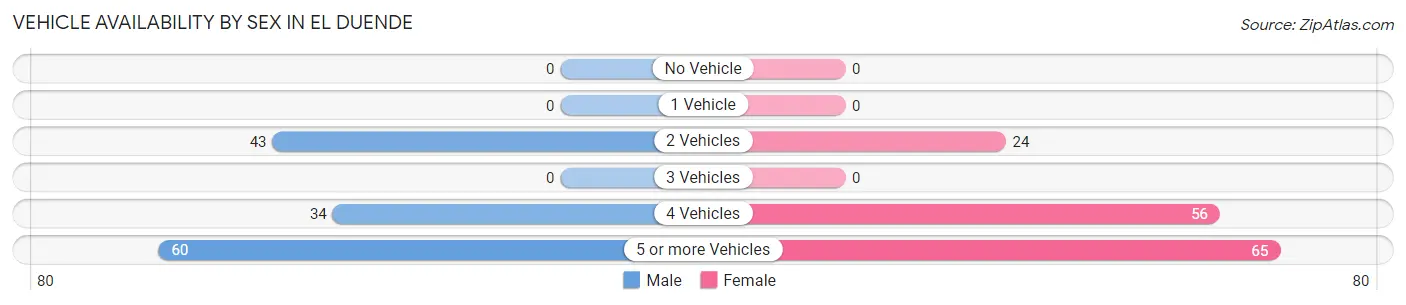
| Vehicles Available | Male | Female |
| No Vehicle | 0 (0.0%) | 0 (0.0%) |
| 1 Vehicle | 0 (0.0%) | 0 (0.0%) |
| 2 Vehicles | 43 (31.4%) | 24 (16.6%) |
| 3 Vehicles | 0 (0.0%) | 0 (0.0%) |
| 4 Vehicles | 34 (24.8%) | 56 (38.6%) |
| 5 or more Vehicles | 60 (43.8%) | 65 (44.8%) |
| Total | 137 (100.0%) | 145 (100.0%) |
Commute Time in El Duende
The most frequently occuring commute durations in El Duende are 15 to 19 minutes (125 commuters, 44.2%), 45 to 59 minutes (90 commuters, 31.8%), and 10 to 14 minutes (43 commuters, 15.2%).
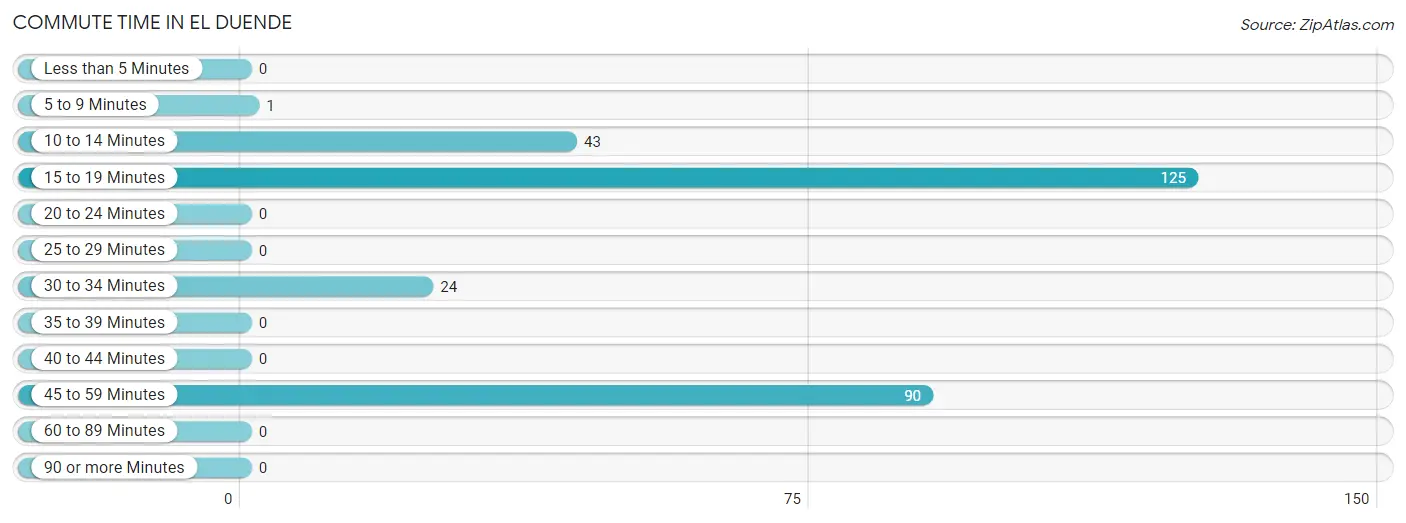
| Commute Time | # Commuters | % Commuters |
| Less than 5 Minutes | 0 | 0.0% |
| 5 to 9 Minutes | 1 | 0.4% |
| 10 to 14 Minutes | 43 | 15.2% |
| 15 to 19 Minutes | 125 | 44.2% |
| 20 to 24 Minutes | 0 | 0.0% |
| 25 to 29 Minutes | 0 | 0.0% |
| 30 to 34 Minutes | 24 | 8.5% |
| 35 to 39 Minutes | 0 | 0.0% |
| 40 to 44 Minutes | 0 | 0.0% |
| 45 to 59 Minutes | 90 | 31.8% |
| 60 to 89 Minutes | 0 | 0.0% |
| 90 or more Minutes | 0 | 0.0% |
Commute Time by Sex in El Duende
The most common commute times in El Duende are 15 to 19 minutes (60 commuters, 43.5%) for males and 15 to 19 minutes (65 commuters, 44.8%) for females.
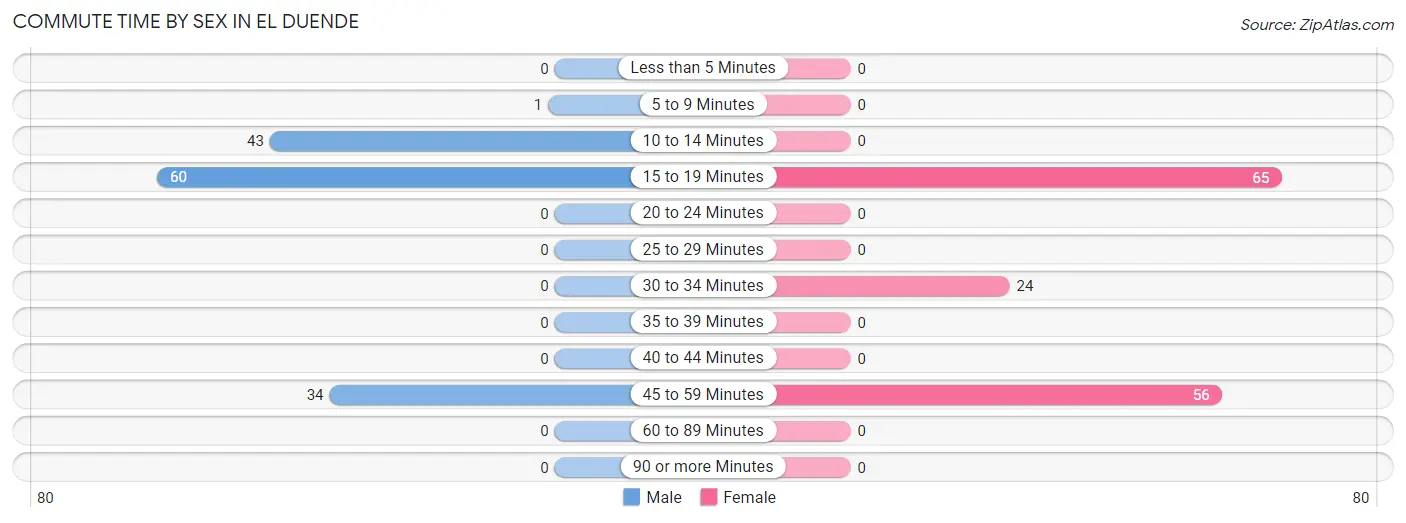
| Commute Time | Male | Female |
| Less than 5 Minutes | 0 (0.0%) | 0 (0.0%) |
| 5 to 9 Minutes | 1 (0.7%) | 0 (0.0%) |
| 10 to 14 Minutes | 43 (31.2%) | 0 (0.0%) |
| 15 to 19 Minutes | 60 (43.5%) | 65 (44.8%) |
| 20 to 24 Minutes | 0 (0.0%) | 0 (0.0%) |
| 25 to 29 Minutes | 0 (0.0%) | 0 (0.0%) |
| 30 to 34 Minutes | 0 (0.0%) | 24 (16.6%) |
| 35 to 39 Minutes | 0 (0.0%) | 0 (0.0%) |
| 40 to 44 Minutes | 0 (0.0%) | 0 (0.0%) |
| 45 to 59 Minutes | 34 (24.6%) | 56 (38.6%) |
| 60 to 89 Minutes | 0 (0.0%) | 0 (0.0%) |
| 90 or more Minutes | 0 (0.0%) | 0 (0.0%) |
Time of Departure to Work by Sex in El Duende
The most frequent times of departure to work in El Duende are 9:00 AM to 9:59 AM (60, 43.5%) for males and 12:00 PM to 3:59 PM (65, 44.8%) for females.
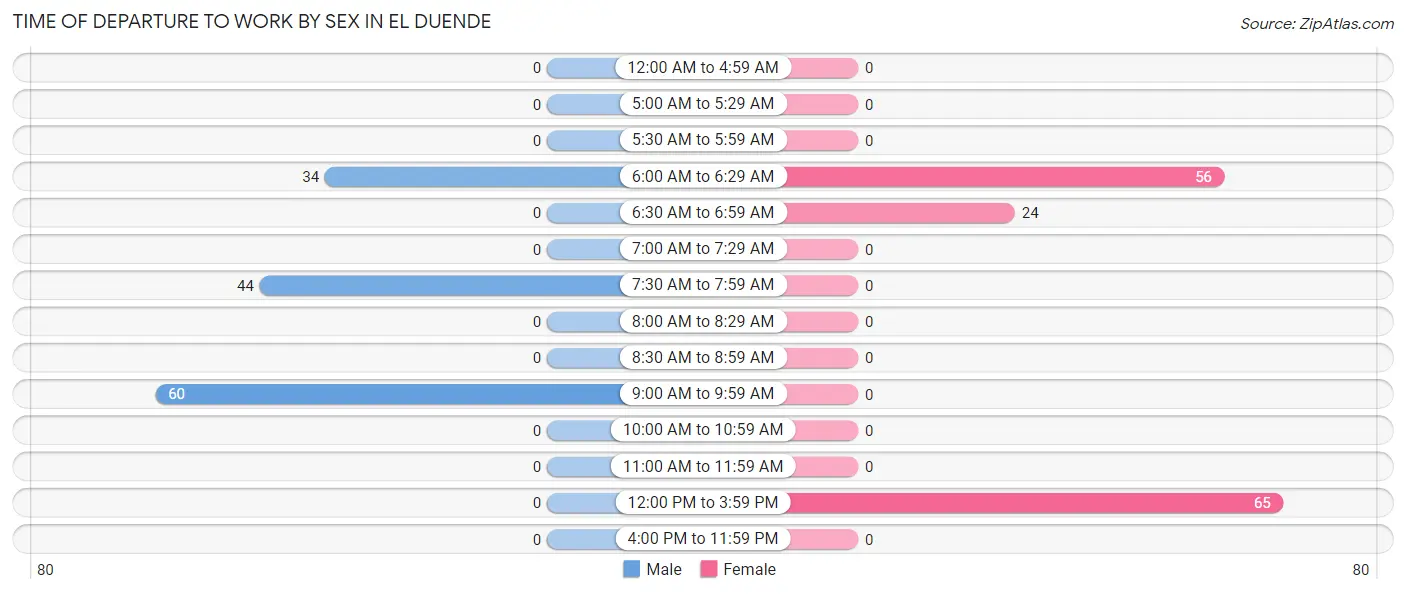
| Time of Departure | Male | Female |
| 12:00 AM to 4:59 AM | 0 (0.0%) | 0 (0.0%) |
| 5:00 AM to 5:29 AM | 0 (0.0%) | 0 (0.0%) |
| 5:30 AM to 5:59 AM | 0 (0.0%) | 0 (0.0%) |
| 6:00 AM to 6:29 AM | 34 (24.6%) | 56 (38.6%) |
| 6:30 AM to 6:59 AM | 0 (0.0%) | 24 (16.6%) |
| 7:00 AM to 7:29 AM | 0 (0.0%) | 0 (0.0%) |
| 7:30 AM to 7:59 AM | 44 (31.9%) | 0 (0.0%) |
| 8:00 AM to 8:29 AM | 0 (0.0%) | 0 (0.0%) |
| 8:30 AM to 8:59 AM | 0 (0.0%) | 0 (0.0%) |
| 9:00 AM to 9:59 AM | 60 (43.5%) | 0 (0.0%) |
| 10:00 AM to 10:59 AM | 0 (0.0%) | 0 (0.0%) |
| 11:00 AM to 11:59 AM | 0 (0.0%) | 0 (0.0%) |
| 12:00 PM to 3:59 PM | 0 (0.0%) | 65 (44.8%) |
| 4:00 PM to 11:59 PM | 0 (0.0%) | 0 (0.0%) |
| Total | 138 (100.0%) | 145 (100.0%) |
Housing Occupancy in El Duende
Occupancy by Ownership in El Duende
Of the total 266 dwellings in El Duende, owner-occupied units account for 186 (69.9%), while renter-occupied units make up 80 (30.1%).
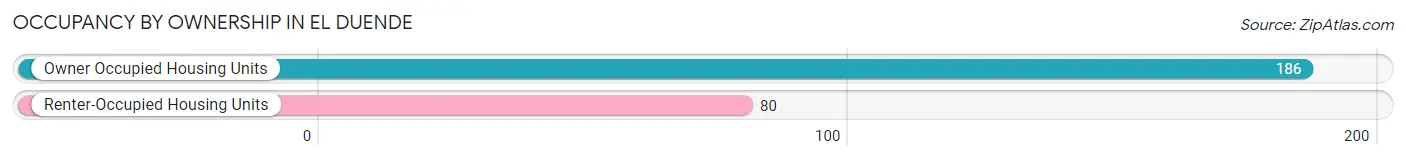
| Occupancy | # Housing Units | % Housing Units |
| Owner Occupied Housing Units | 186 | 69.9% |
| Renter-Occupied Housing Units | 80 | 30.1% |
| Total Occupied Housing Units | 266 | 100.0% |
Occupancy by Household Size in El Duende
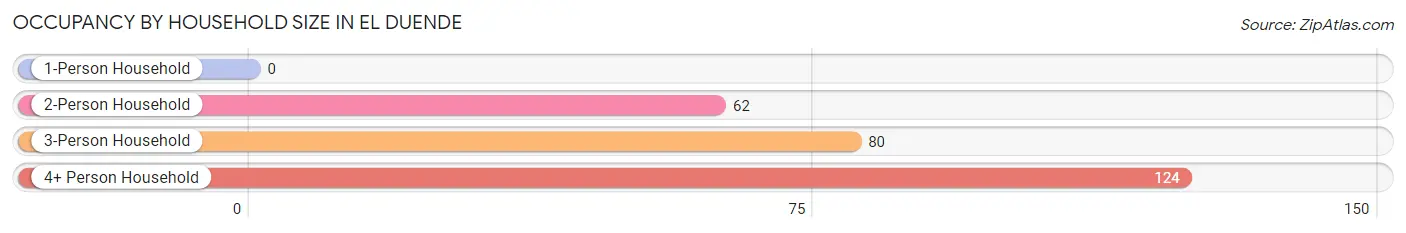
| Household Size | # Housing Units | % Housing Units |
| 1-Person Household | 0 | 0.0% |
| 2-Person Household | 62 | 23.3% |
| 3-Person Household | 80 | 30.1% |
| 4+ Person Household | 124 | 46.6% |
| Total Housing Units | 266 | 100.0% |
Occupancy by Ownership by Household Size in El Duende
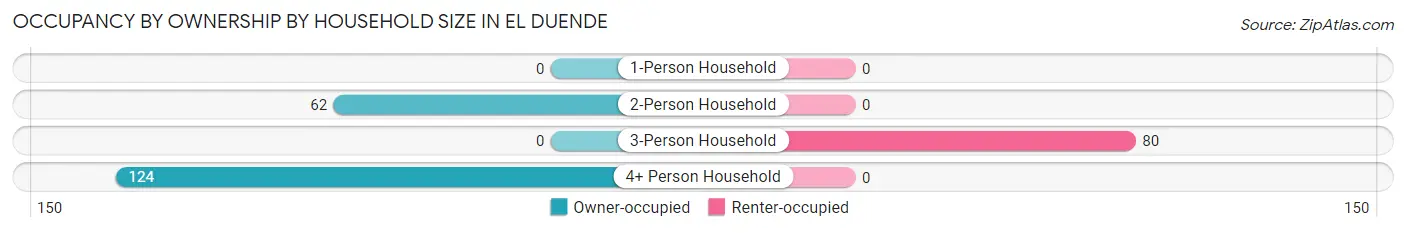
| Household Size | Owner-occupied | Renter-occupied |
| 1-Person Household | 0 (0.0%) | 0 (0.0%) |
| 2-Person Household | 62 (100.0%) | 0 (0.0%) |
| 3-Person Household | 0 (0.0%) | 80 (100.0%) |
| 4+ Person Household | 124 (100.0%) | 0 (0.0%) |
| Total Housing Units | 186 (69.9%) | 80 (30.1%) |
Occupancy by Educational Attainment in El Duende
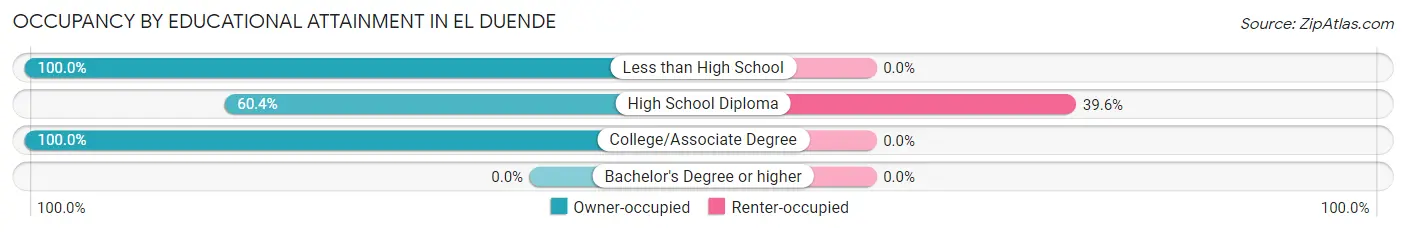
| Household Size | Owner-occupied | Renter-occupied |
| Less than High School | 34 (100.0%) | 0 (0.0%) |
| High School Diploma | 122 (60.4%) | 80 (39.6%) |
| College/Associate Degree | 30 (100.0%) | 0 (0.0%) |
| Bachelor's Degree or higher | 0 (0.0%) | 0 (0.0%) |
Occupancy by Age of Householder in El Duende
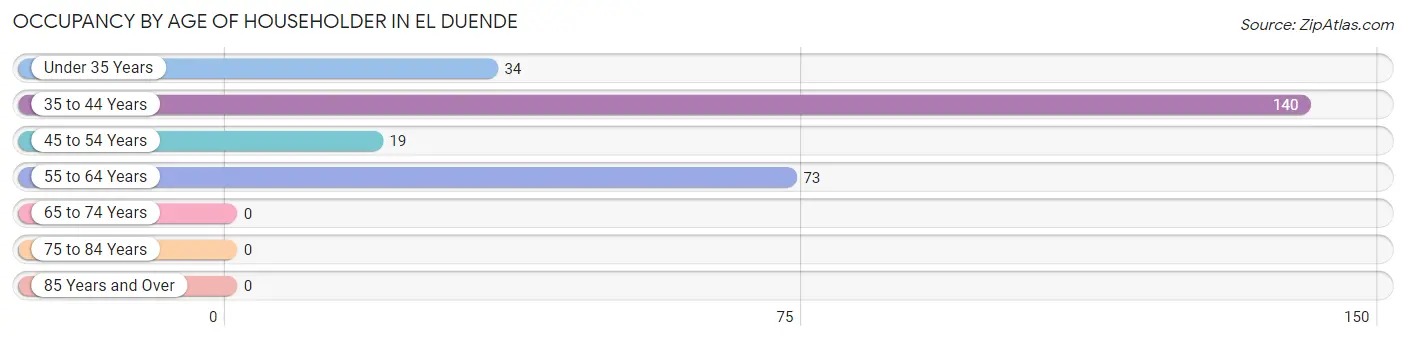
| Age Bracket | # Households | % Households |
| Under 35 Years | 34 | 12.8% |
| 35 to 44 Years | 140 | 52.6% |
| 45 to 54 Years | 19 | 7.1% |
| 55 to 64 Years | 73 | 27.4% |
| 65 to 74 Years | 0 | 0.0% |
| 75 to 84 Years | 0 | 0.0% |
| 85 Years and Over | 0 | 0.0% |
| Total | 266 | 100.0% |
Housing Finances in El Duende
Median Income by Occupancy in El Duende
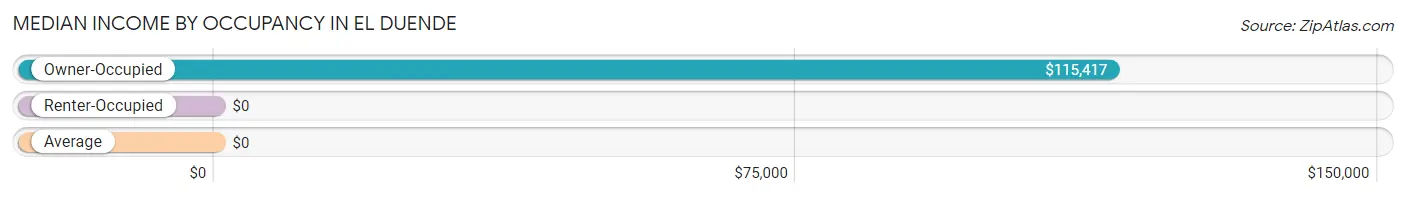
| Occupancy Type | # Households | Median Income |
| Owner-Occupied | 186 (69.9%) | $115,417 |
| Renter-Occupied | 80 (30.1%) | $0 |
| Average | 266 (100.0%) | $0 |
Occupancy by Householder Income Bracket in El Duende
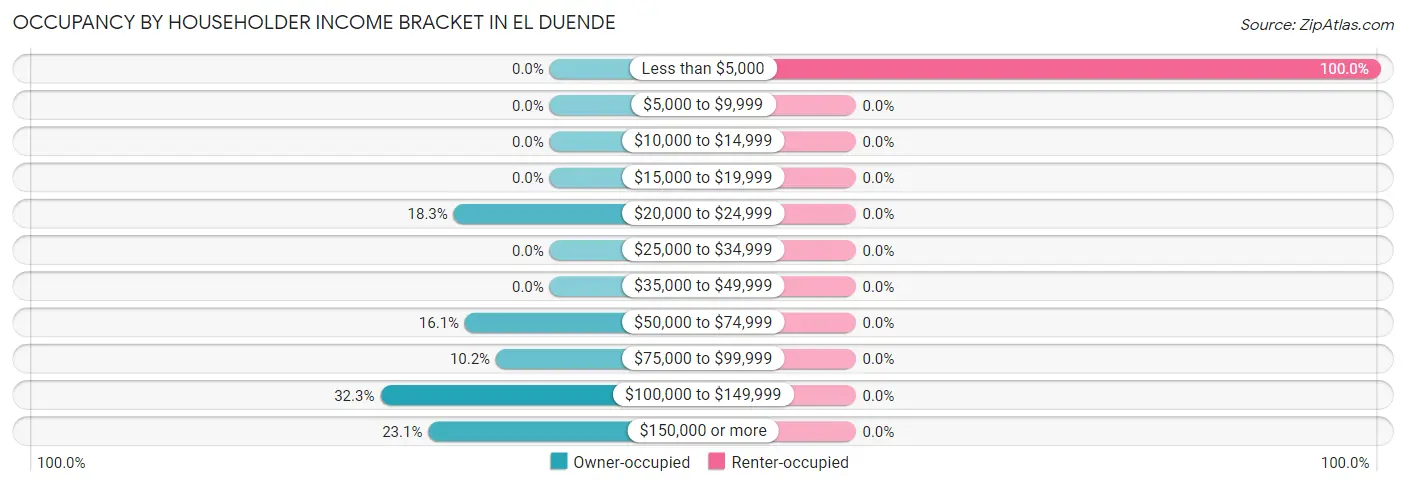
| Income Bracket | Owner-occupied | Renter-occupied |
| Less than $5,000 | 0 (0.0%) | 80 (100.0%) |
| $5,000 to $9,999 | 0 (0.0%) | 0 (0.0%) |
| $10,000 to $14,999 | 0 (0.0%) | 0 (0.0%) |
| $15,000 to $19,999 | 0 (0.0%) | 0 (0.0%) |
| $20,000 to $24,999 | 34 (18.3%) | 0 (0.0%) |
| $25,000 to $34,999 | 0 (0.0%) | 0 (0.0%) |
| $35,000 to $49,999 | 0 (0.0%) | 0 (0.0%) |
| $50,000 to $74,999 | 30 (16.1%) | 0 (0.0%) |
| $75,000 to $99,999 | 19 (10.2%) | 0 (0.0%) |
| $100,000 to $149,999 | 60 (32.3%) | 0 (0.0%) |
| $150,000 or more | 43 (23.1%) | 0 (0.0%) |
| Total | 186 (100.0%) | 80 (100.0%) |
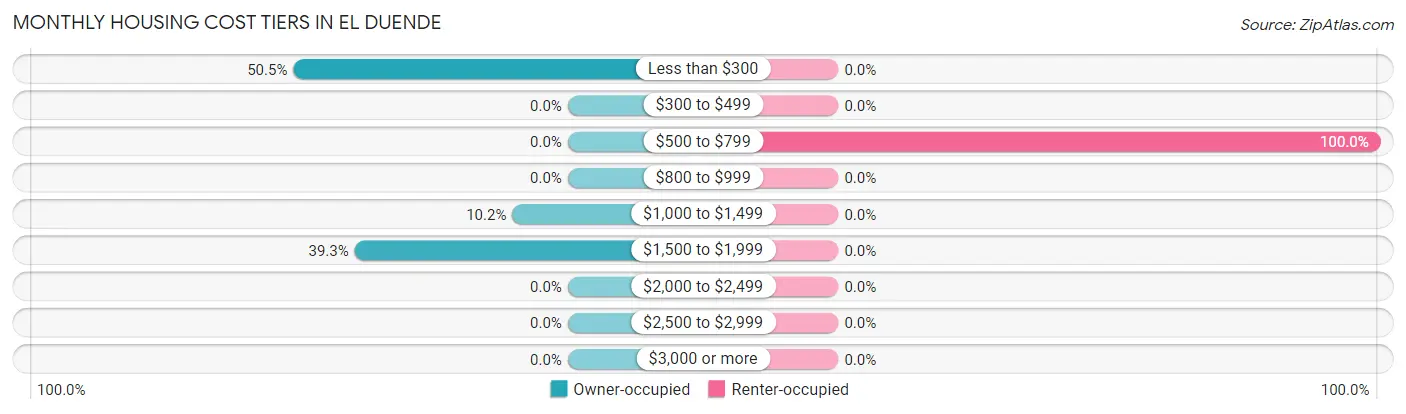
Monthly Housing Cost Tiers in El Duende
| Monthly Cost | Owner-occupied | Renter-occupied |
| Less than $300 | 94 (50.5%) | 0 (0.0%) |
| $300 to $499 | 0 (0.0%) | 0 (0.0%) |
| $500 to $799 | 0 (0.0%) | 80 (100.0%) |
| $800 to $999 | 0 (0.0%) | 0 (0.0%) |
| $1,000 to $1,499 | 19 (10.2%) | 0 (0.0%) |
| $1,500 to $1,999 | 73 (39.3%) | 0 (0.0%) |
| $2,000 to $2,499 | 0 (0.0%) | 0 (0.0%) |
| $2,500 to $2,999 | 0 (0.0%) | 0 (0.0%) |
| $3,000 or more | 0 (0.0%) | 0 (0.0%) |
| Total | 186 (100.0%) | 80 (100.0%) |
Physical Housing Characteristics in El Duende
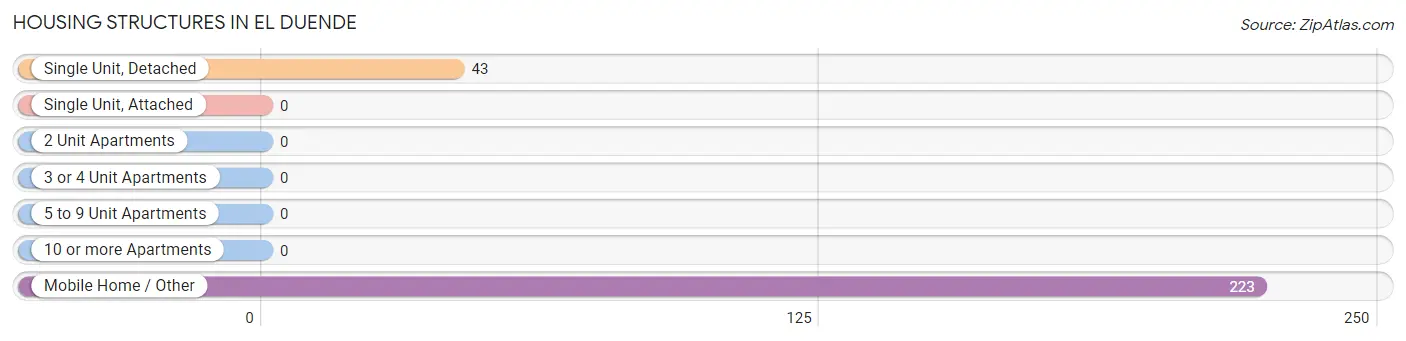
Housing Structures in El Duende
| Structure Type | # Housing Units | % Housing Units |
| Single Unit, Detached | 43 | 16.2% |
| Single Unit, Attached | 0 | 0.0% |
| 2 Unit Apartments | 0 | 0.0% |
| 3 or 4 Unit Apartments | 0 | 0.0% |
| 5 to 9 Unit Apartments | 0 | 0.0% |
| 10 or more Apartments | 0 | 0.0% |
| Mobile Home / Other | 223 | 83.8% |
| Total | 266 | 100.0% |
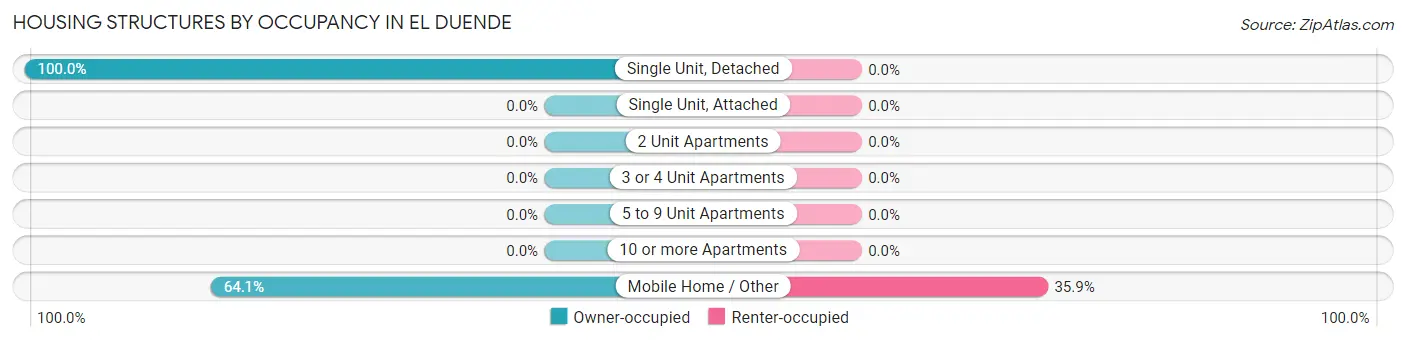
Housing Structures by Occupancy in El Duende
| Structure Type | Owner-occupied | Renter-occupied |
| Single Unit, Detached | 43 (100.0%) | 0 (0.0%) |
| Single Unit, Attached | 0 (0.0%) | 0 (0.0%) |
| 2 Unit Apartments | 0 (0.0%) | 0 (0.0%) |
| 3 or 4 Unit Apartments | 0 (0.0%) | 0 (0.0%) |
| 5 to 9 Unit Apartments | 0 (0.0%) | 0 (0.0%) |
| 10 or more Apartments | 0 (0.0%) | 0 (0.0%) |
| Mobile Home / Other | 143 (64.1%) | 80 (35.9%) |
| Total | 186 (69.9%) | 80 (30.1%) |
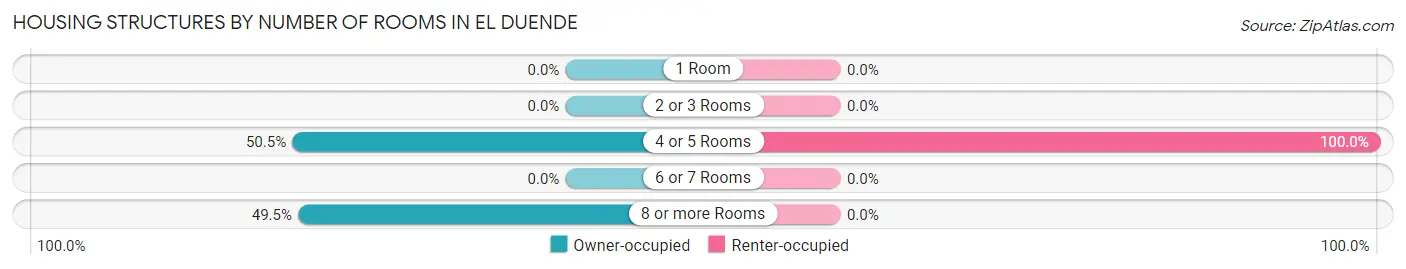
Housing Structures by Number of Rooms in El Duende
| Number of Rooms | Owner-occupied | Renter-occupied |
| 1 Room | 0 (0.0%) | 0 (0.0%) |
| 2 or 3 Rooms | 0 (0.0%) | 0 (0.0%) |
| 4 or 5 Rooms | 94 (50.5%) | 80 (100.0%) |
| 6 or 7 Rooms | 0 (0.0%) | 0 (0.0%) |
| 8 or more Rooms | 92 (49.5%) | 0 (0.0%) |
| Total | 186 (100.0%) | 80 (100.0%) |
Housing Structure by Heating Type in El Duende
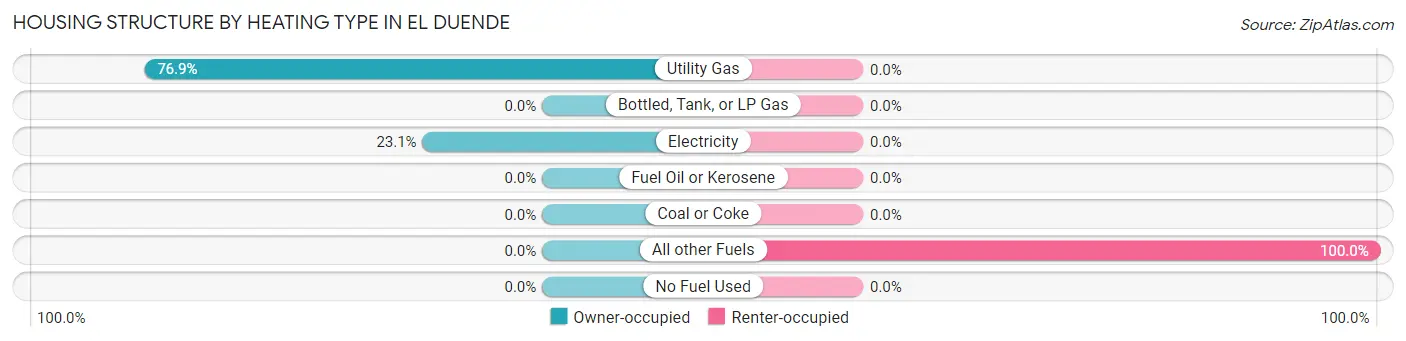
| Heating Type | Owner-occupied | Renter-occupied |
| Utility Gas | 143 (76.9%) | 0 (0.0%) |
| Bottled, Tank, or LP Gas | 0 (0.0%) | 0 (0.0%) |
| Electricity | 43 (23.1%) | 0 (0.0%) |
| Fuel Oil or Kerosene | 0 (0.0%) | 0 (0.0%) |
| Coal or Coke | 0 (0.0%) | 0 (0.0%) |
| All other Fuels | 0 (0.0%) | 80 (100.0%) |
| No Fuel Used | 0 (0.0%) | 0 (0.0%) |
| Total | 186 (100.0%) | 80 (100.0%) |
Household Vehicle Usage in El Duende
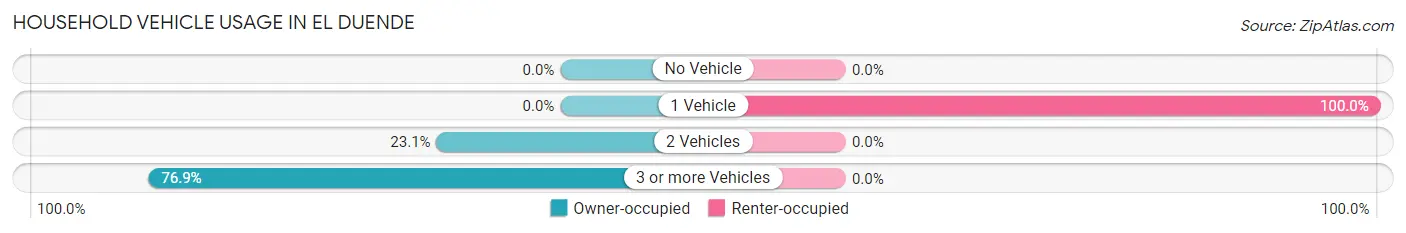
| Vehicles per Household | Owner-occupied | Renter-occupied |
| No Vehicle | 0 (0.0%) | 0 (0.0%) |
| 1 Vehicle | 0 (0.0%) | 80 (100.0%) |
| 2 Vehicles | 43 (23.1%) | 0 (0.0%) |
| 3 or more Vehicles | 143 (76.9%) | 0 (0.0%) |
| Total | 186 (100.0%) | 80 (100.0%) |
Real Estate & Mortgages in El Duende
Real Estate and Mortgage Overview in El Duende
| Characteristic | Without Mortgage | With Mortgage |
| Housing Units | 94 | 92 |
| Median Property Value | - | - |
| Median Household Income | - | - |
| Monthly Housing Costs | - | - |
| Real Estate Taxes | - | - |
Property Value by Mortgage Status in El Duende
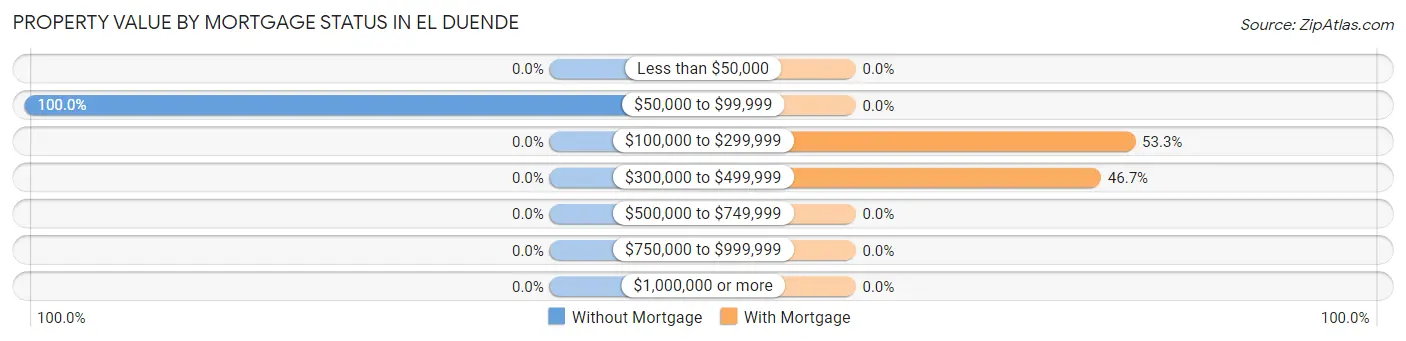
| Property Value | Without Mortgage | With Mortgage |
| Less than $50,000 | 0 (0.0%) | 0 (0.0%) |
| $50,000 to $99,999 | 94 (100.0%) | 0 (0.0%) |
| $100,000 to $299,999 | 0 (0.0%) | 49 (53.3%) |
| $300,000 to $499,999 | 0 (0.0%) | 43 (46.7%) |
| $500,000 to $749,999 | 0 (0.0%) | 0 (0.0%) |
| $750,000 to $999,999 | 0 (0.0%) | 0 (0.0%) |
| $1,000,000 or more | 0 (0.0%) | 0 (0.0%) |
| Total | 94 (100.0%) | 92 (100.0%) |
Household Income by Mortgage Status in El Duende
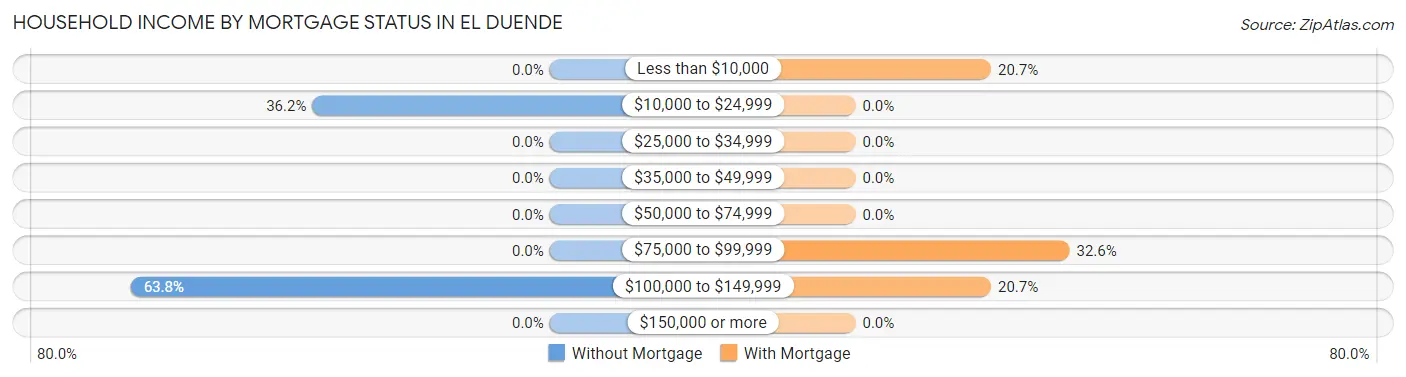
| Household Income | Without Mortgage | With Mortgage |
| Less than $10,000 | 0 (0.0%) | 19 (20.6%) |
| $10,000 to $24,999 | 34 (36.2%) | 0 (0.0%) |
| $25,000 to $34,999 | 0 (0.0%) | 0 (0.0%) |
| $35,000 to $49,999 | 0 (0.0%) | 0 (0.0%) |
| $50,000 to $74,999 | 0 (0.0%) | 0 (0.0%) |
| $75,000 to $99,999 | 0 (0.0%) | 30 (32.6%) |
| $100,000 to $149,999 | 60 (63.8%) | 19 (20.6%) |
| $150,000 or more | 0 (0.0%) | 0 (0.0%) |
| Total | 94 (100.0%) | 92 (100.0%) |
Property Value to Household Income Ratio in El Duende
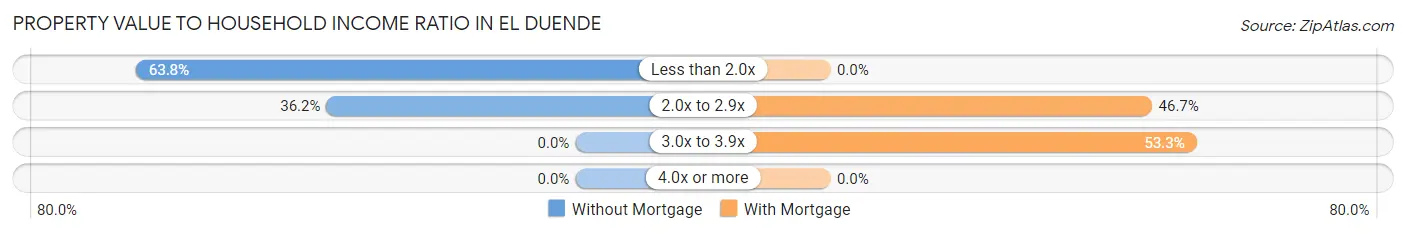
| Value-to-Income Ratio | Without Mortgage | With Mortgage |
| Less than 2.0x | 60 (63.8%) | 0 (0.0%) |
| 2.0x to 2.9x | 34 (36.2%) | 43 (46.7%) |
| 3.0x to 3.9x | 0 (0.0%) | 49 (53.3%) |
| 4.0x or more | 0 (0.0%) | 0 (0.0%) |
| Total | 94 (100.0%) | 92 (100.0%) |
Real Estate Taxes by Mortgage Status in El Duende
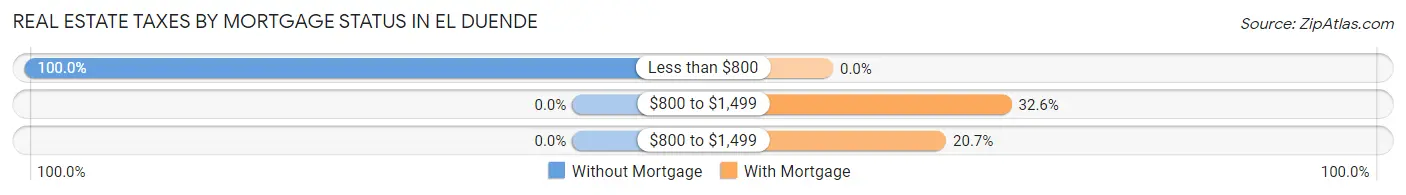
| Property Taxes | Without Mortgage | With Mortgage |
| Less than $800 | 94 (100.0%) | 0 (0.0%) |
| $800 to $1,499 | 0 (0.0%) | 30 (32.6%) |
| $800 to $1,499 | 0 (0.0%) | 19 (20.6%) |
| Total | 94 (100.0%) | 92 (100.0%) |
Health & Disability in El Duende
Health Insurance Coverage by Age in El Duende
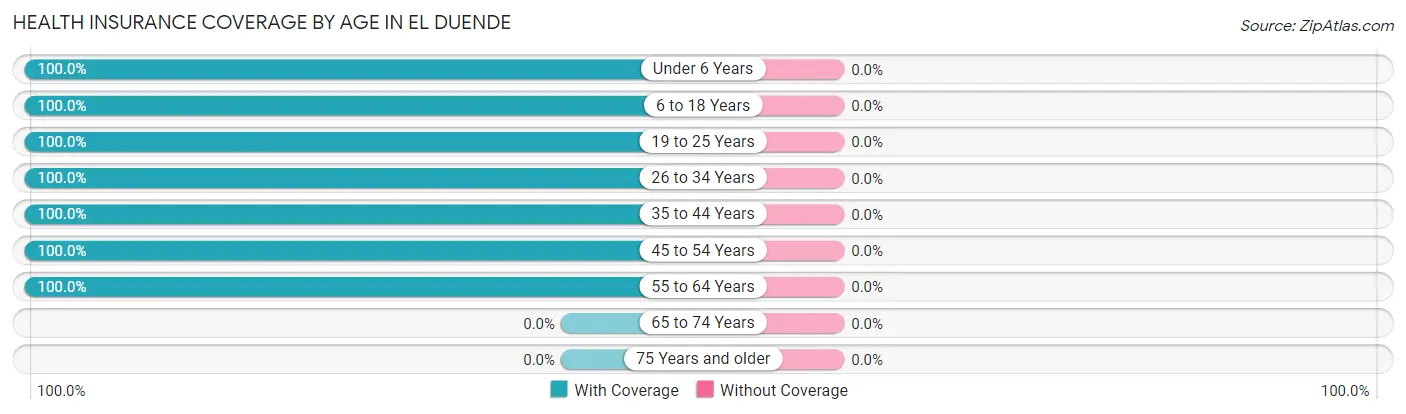
| Age Bracket | With Coverage | Without Coverage |
| Under 6 Years | 55 (100.0%) | 0 (0.0%) |
| 6 to 18 Years | 613 (100.0%) | 0 (0.0%) |
| 19 to 25 Years | 1 (100.0%) | 0 (0.0%) |
| 26 to 34 Years | 90 (100.0%) | 0 (0.0%) |
| 35 to 44 Years | 206 (100.0%) | 0 (0.0%) |
| 45 to 54 Years | 53 (100.0%) | 0 (0.0%) |
| 55 to 64 Years | 94 (100.0%) | 0 (0.0%) |
| 65 to 74 Years | 0 (0.0%) | 0 (0.0%) |
| 75 Years and older | 0 (0.0%) | 0 (0.0%) |
| Total | 1,112 (100.0%) | 0 (0.0%) |
Health Insurance Coverage by Citizenship Status in El Duende
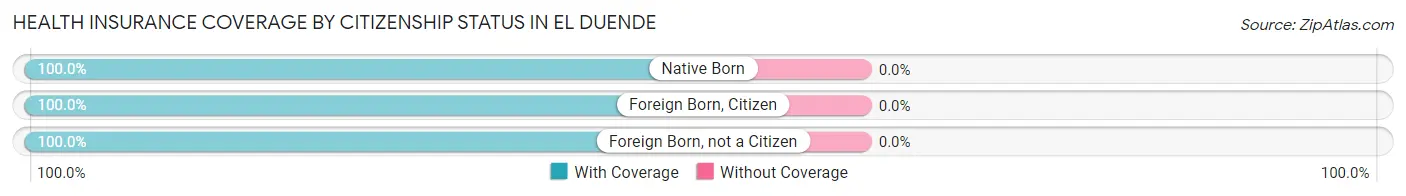
| Citizenship Status | With Coverage | Without Coverage |
| Native Born | 55 (100.0%) | 0 (0.0%) |
| Foreign Born, Citizen | 613 (100.0%) | 0 (0.0%) |
| Foreign Born, not a Citizen | 1 (100.0%) | 0 (0.0%) |
Health Insurance Coverage by Household Income in El Duende
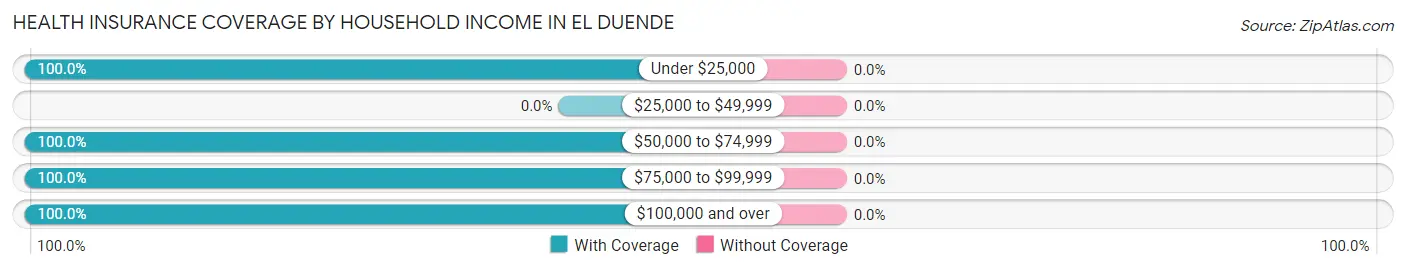
| Household Income | With Coverage | Without Coverage |
| Under $25,000 | 535 (100.0%) | 0 (0.0%) |
| $25,000 to $49,999 | 0 (0.0%) | 0 (0.0%) |
| $50,000 to $74,999 | 187 (100.0%) | 0 (0.0%) |
| $75,000 to $99,999 | 29 (100.0%) | 0 (0.0%) |
| $100,000 and over | 358 (100.0%) | 0 (0.0%) |
Public vs Private Health Insurance Coverage by Age in El Duende
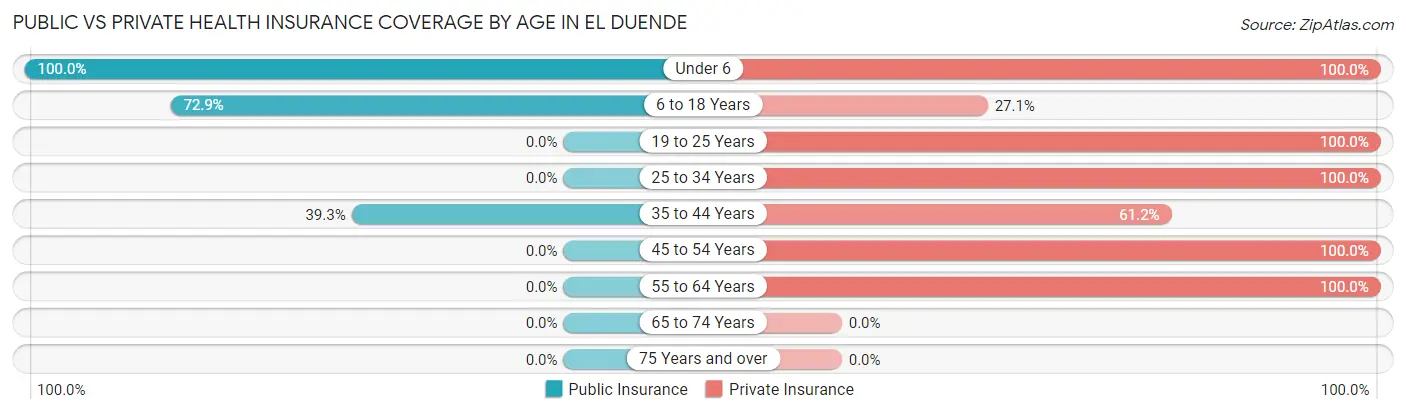
| Age Bracket | Public Insurance | Private Insurance |
| Under 6 | 55 (100.0%) | 55 (100.0%) |
| 6 to 18 Years | 447 (72.9%) | 166 (27.1%) |
| 19 to 25 Years | 0 (0.0%) | 1 (100.0%) |
| 25 to 34 Years | 0 (0.0%) | 90 (100.0%) |
| 35 to 44 Years | 81 (39.3%) | 126 (61.2%) |
| 45 to 54 Years | 0 (0.0%) | 53 (100.0%) |
| 55 to 64 Years | 0 (0.0%) | 94 (100.0%) |
| 65 to 74 Years | 0 (0.0%) | 0 (0.0%) |
| 75 Years and over | 0 (0.0%) | 0 (0.0%) |
| Total | 583 (52.4%) | 585 (52.6%) |
Disability Status by Sex by Age in El Duende
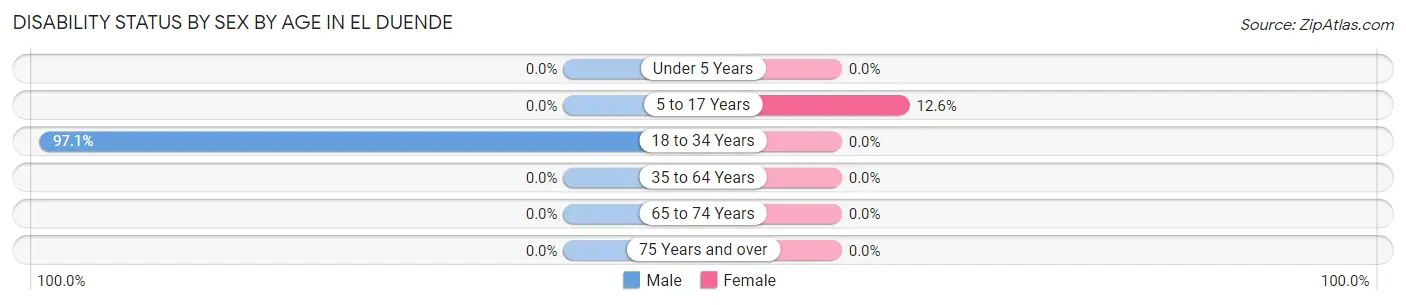
| Age Bracket | Male | Female |
| Under 5 Years | 0 (0.0%) | 0 (0.0%) |
| 5 to 17 Years | 0 (0.0%) | 52 (12.6%) |
| 18 to 34 Years | 34 (97.1%) | 0 (0.0%) |
| 35 to 64 Years | 0 (0.0%) | 0 (0.0%) |
| 65 to 74 Years | 0 (0.0%) | 0 (0.0%) |
| 75 Years and over | 0 (0.0%) | 0 (0.0%) |
Disability Class by Sex by Age in El Duende
Disability Class: Hearing Difficulty

| Age Bracket | Male | Female |
| Under 5 Years | 0 (0.0%) | 0 (0.0%) |
| 5 to 17 Years | 0 (0.0%) | 0 (0.0%) |
| 18 to 34 Years | 34 (97.1%) | 0 (0.0%) |
| 35 to 64 Years | 0 (0.0%) | 0 (0.0%) |
| 65 to 74 Years | 0 (0.0%) | 0 (0.0%) |
| 75 Years and over | 0 (0.0%) | 0 (0.0%) |
Disability Class: Vision Difficulty
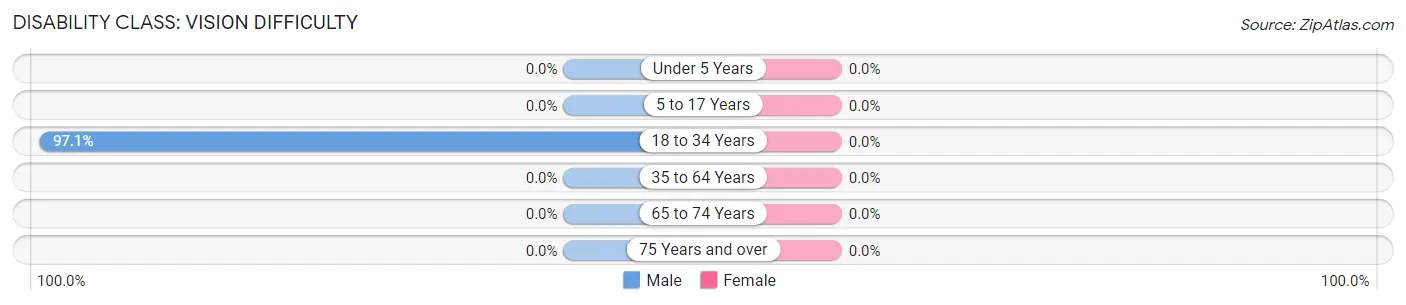
| Age Bracket | Male | Female |
| Under 5 Years | 0 (0.0%) | 0 (0.0%) |
| 5 to 17 Years | 0 (0.0%) | 0 (0.0%) |
| 18 to 34 Years | 34 (97.1%) | 0 (0.0%) |
| 35 to 64 Years | 0 (0.0%) | 0 (0.0%) |
| 65 to 74 Years | 0 (0.0%) | 0 (0.0%) |
| 75 Years and over | 0 (0.0%) | 0 (0.0%) |
Disability Class: Cognitive Difficulty
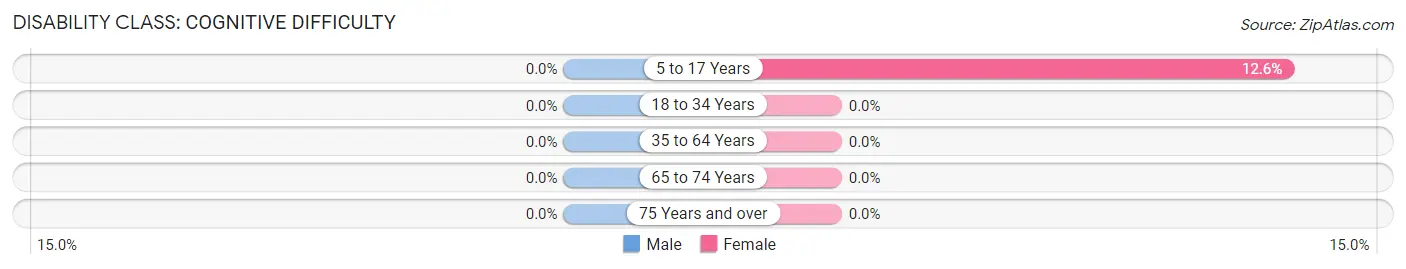
| Age Bracket | Male | Female |
| 5 to 17 Years | 0 (0.0%) | 52 (12.6%) |
| 18 to 34 Years | 0 (0.0%) | 0 (0.0%) |
| 35 to 64 Years | 0 (0.0%) | 0 (0.0%) |
| 65 to 74 Years | 0 (0.0%) | 0 (0.0%) |
| 75 Years and over | 0 (0.0%) | 0 (0.0%) |
Disability Class: Ambulatory Difficulty
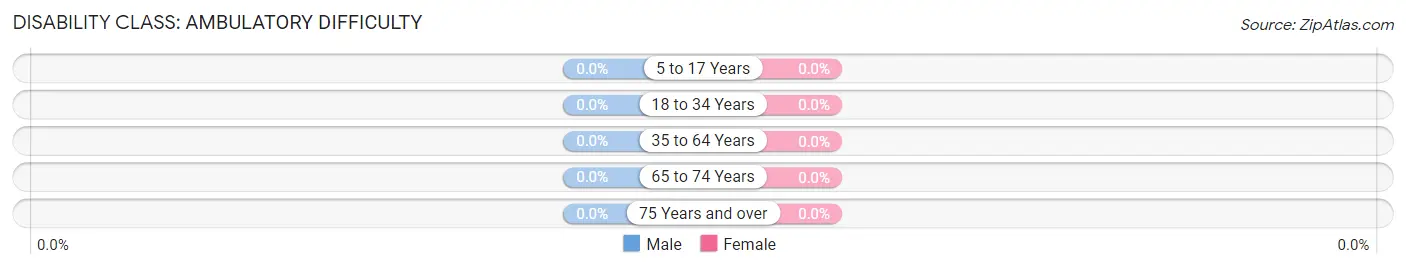
| Age Bracket | Male | Female |
| 5 to 17 Years | 0 (0.0%) | 0 (0.0%) |
| 18 to 34 Years | 0 (0.0%) | 0 (0.0%) |
| 35 to 64 Years | 0 (0.0%) | 0 (0.0%) |
| 65 to 74 Years | 0 (0.0%) | 0 (0.0%) |
| 75 Years and over | 0 (0.0%) | 0 (0.0%) |
Disability Class: Self-Care Difficulty
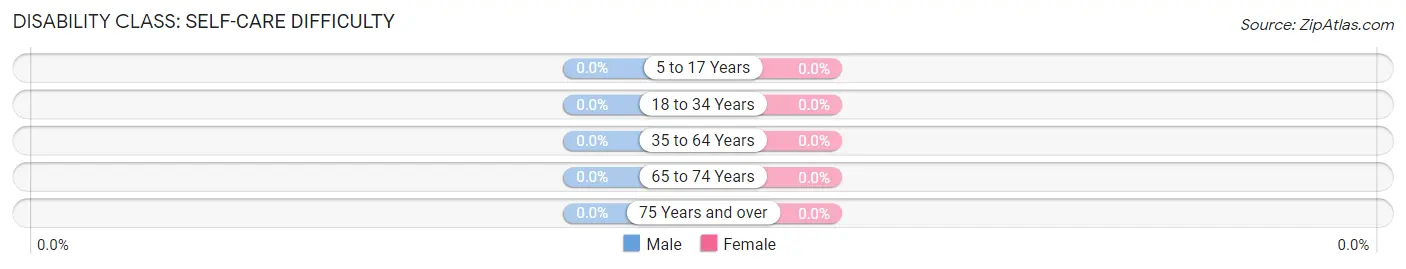
| Age Bracket | Male | Female |
| 5 to 17 Years | 0 (0.0%) | 0 (0.0%) |
| 18 to 34 Years | 0 (0.0%) | 0 (0.0%) |
| 35 to 64 Years | 0 (0.0%) | 0 (0.0%) |
| 65 to 74 Years | 0 (0.0%) | 0 (0.0%) |
| 75 Years and over | 0 (0.0%) | 0 (0.0%) |
Technology Access in El Duende
Computing Device Access in El Duende
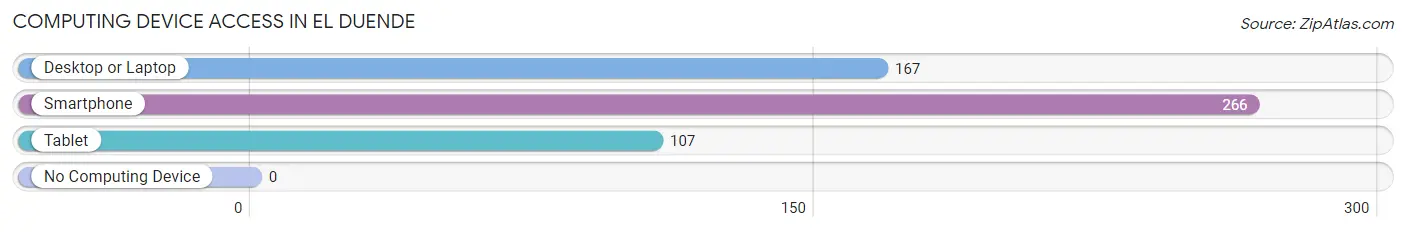
| Device Type | # Households | % Households |
| Desktop or Laptop | 167 | 62.8% |
| Smartphone | 266 | 100.0% |
| Tablet | 107 | 40.2% |
| No Computing Device | 0 | 0.0% |
| Total | 266 | 100.0% |
Internet Access in El Duende
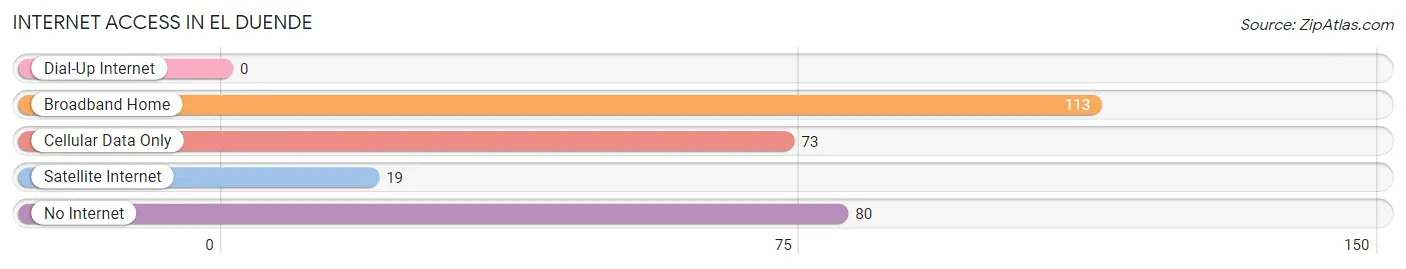
| Internet Type | # Households | % Households |
| Dial-Up Internet | 0 | 0.0% |
| Broadband Home | 113 | 42.5% |
| Cellular Data Only | 73 | 27.4% |
| Satellite Internet | 19 | 7.1% |
| No Internet | 80 | 30.1% |
| Total | 266 | 100.0% |
El Duende Summary
Duende, New Mexico is a small town located in the northern part of the state, near the border with Colorado. It is situated in the San Juan Basin, a region of the Colorado Plateau that is known for its high desert climate and rugged terrain. The town has a population of just over 1,000 people, and is home to a variety of businesses, including a few restaurants, a grocery store, and a few small shops.
Geography
Duende is located in the San Juan Basin, a region of the Colorado Plateau that is known for its high desert climate and rugged terrain. The town is situated at an elevation of 6,000 feet, and is surrounded by the San Juan Mountains to the east and the Chama River to the west. The town is located in a valley, and is surrounded by mesas and buttes. The climate in Duende is semi-arid, with hot summers and cold winters. The average annual precipitation is just over 10 inches, and the average annual temperature is around 50 degrees Fahrenheit.
Economy
Duende’s economy is largely based on agriculture and tourism. The town is home to a variety of farms, which produce a variety of crops, including alfalfa, corn, and wheat. The town is also home to a few small businesses, including a few restaurants, a grocery store, and a few small shops. The town is also home to a few tourist attractions, including the Chama River, which is popular for fishing and rafting, and the nearby San Juan Mountains, which are popular for hiking and camping.
Demographics
As of the 2010 census, the population of Duende was 1,037. The racial makeup of the town was 94.3% White, 0.7% African American, 0.3% Native American, 0.2% Asian, 0.1% Pacific Islander, and 4.4% from other races. The median household income in Duende was $31,250, and the median family income was $37,500. The per capita income in Duende was $17,845.
History
Duende was founded in the late 1800s by a group of settlers from Colorado. The town was originally called “Duende Springs”, and was named after the nearby Chama River. The town grew slowly, and by the early 1900s, it had become a popular destination for tourists, who came to enjoy the area’s natural beauty and outdoor activities. The town was incorporated in 1912, and the population continued to grow throughout the 20th century. Today, Duende is a small, rural town that is known for its friendly atmosphere and its beautiful scenery.
Common Questions
What is Per Capita Income in El Duende?
Per Capita income in El Duende is $15,667.
What is Inequality or Gini Index in El Duende?
Inequality or Gini Index in El Duende is 0.51.
What is the Total Population of El Duende?
Total Population of El Duende is 1,113.
What is the Total Male Population of El Duende?
Total Male Population of El Duende is 443.
What is the Total Female Population of El Duende?
Total Female Population of El Duende is 670.
What is the Ratio of Males per 100 Females in El Duende?
There are 66.12 Males per 100 Females in El Duende.
What is the Ratio of Females per 100 Males in El Duende?
There are 151.24 Females per 100 Males in El Duende.
What is the Median Population Age in El Duende?
Median Population Age in El Duende is 14.3 Years.
What is the Average Family Size in El Duende
Average Family Size in El Duende is 4.0 People.
What is the Average Household Size in El Duende
Average Household Size in El Duende is 4.2 People.
How Large is the Labor Force in El Duende?
There are 285 People in the Labor Forcein in El Duende.
What is the Percentage of People in the Labor Force in El Duende?
64.0% of People are in the Labor Force in El Duende.