South Acomita Village, NM Map & Demographics
South Acomita Village Map
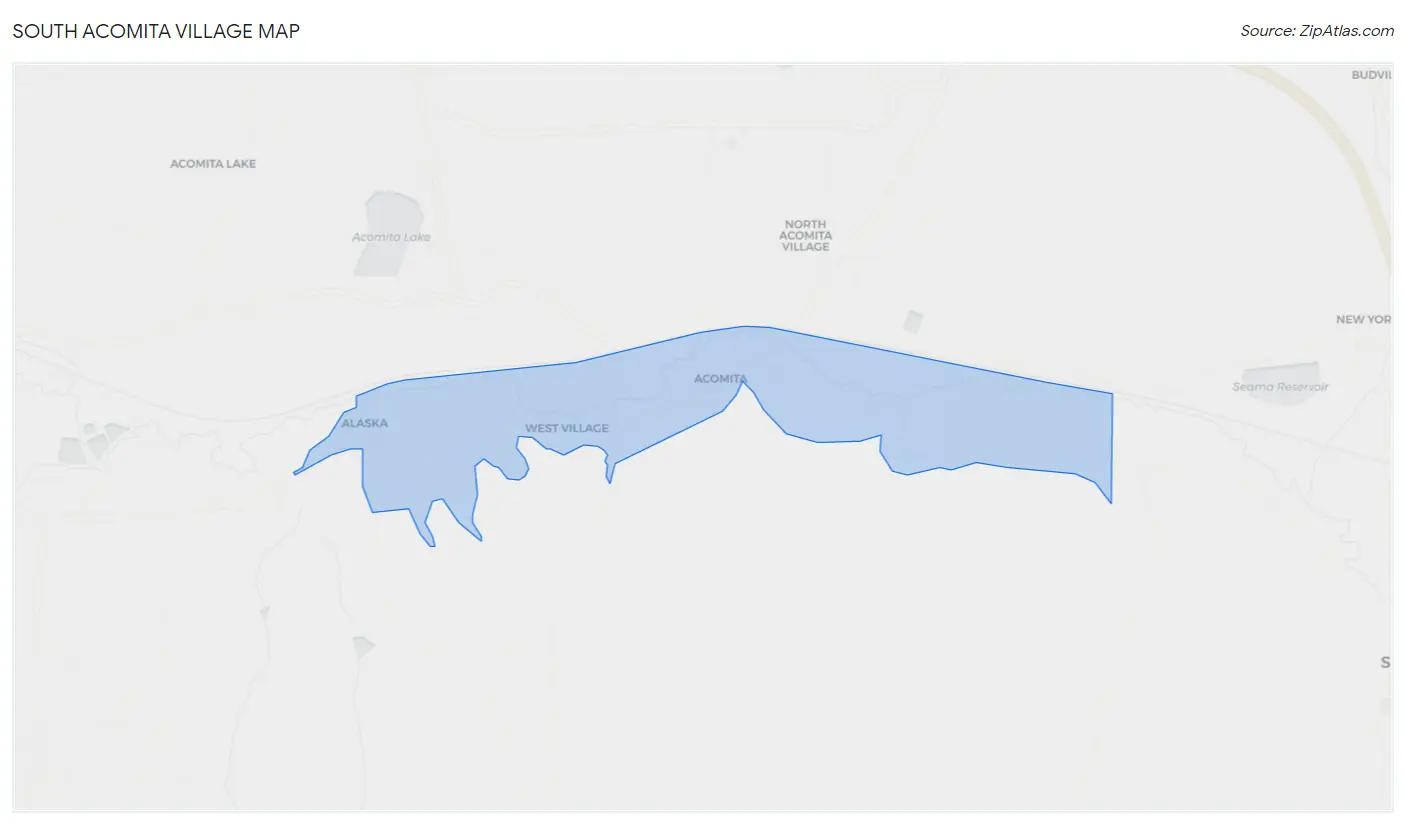
South Acomita Village Overview
$11,957
PER CAPITA INCOME
$32,434
AVG HOUSEHOLD INCOME
0.18
INEQUALITY / GINI INDEX
125
TOTAL POPULATION
67
MALE POPULATION
58
FEMALE POPULATION
115.52
MALES / 100 FEMALES
86.57
FEMALES / 100 MALES
56.3
MEDIAN AGE
4.1
AVG FAMILY SIZE
3.4
AVG HOUSEHOLD SIZE
18
LABOR FORCE [ PEOPLE ]
17.1%
PERCENT IN LABOR FORCE
Income in South Acomita Village
Income Overview in South Acomita Village
| Characteristic | Number | Measure |
| Per Capita Income | 125 | $11,957 |
| Median Family Income | 27 | $0 |
| Mean Family Income | 27 | $0 |
| Median Household Income | 37 | $32,434 |
| Mean Household Income | 37 | $41,716 |
| Income Deficit | 27 | $0 |
| Wage / Income Gap (%) | 125 | 0.00% |
| Wage / Income Gap ($) | 125 | 100.00¢ per $1 |
| Gini / Inequality Index | 125 | 0.18 |
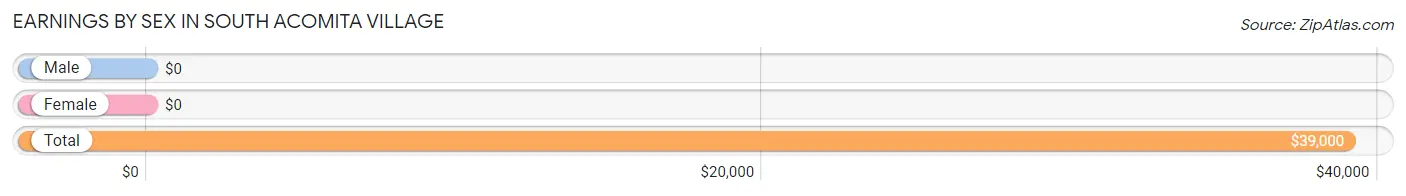
Earnings by Sex in South Acomita Village
| Sex | Number | Average Earnings |
| Male | 11 (61.1%) | $0 |
| Female | 7 (38.9%) | $0 |
| Total | 18 (100.0%) | $39,000 |
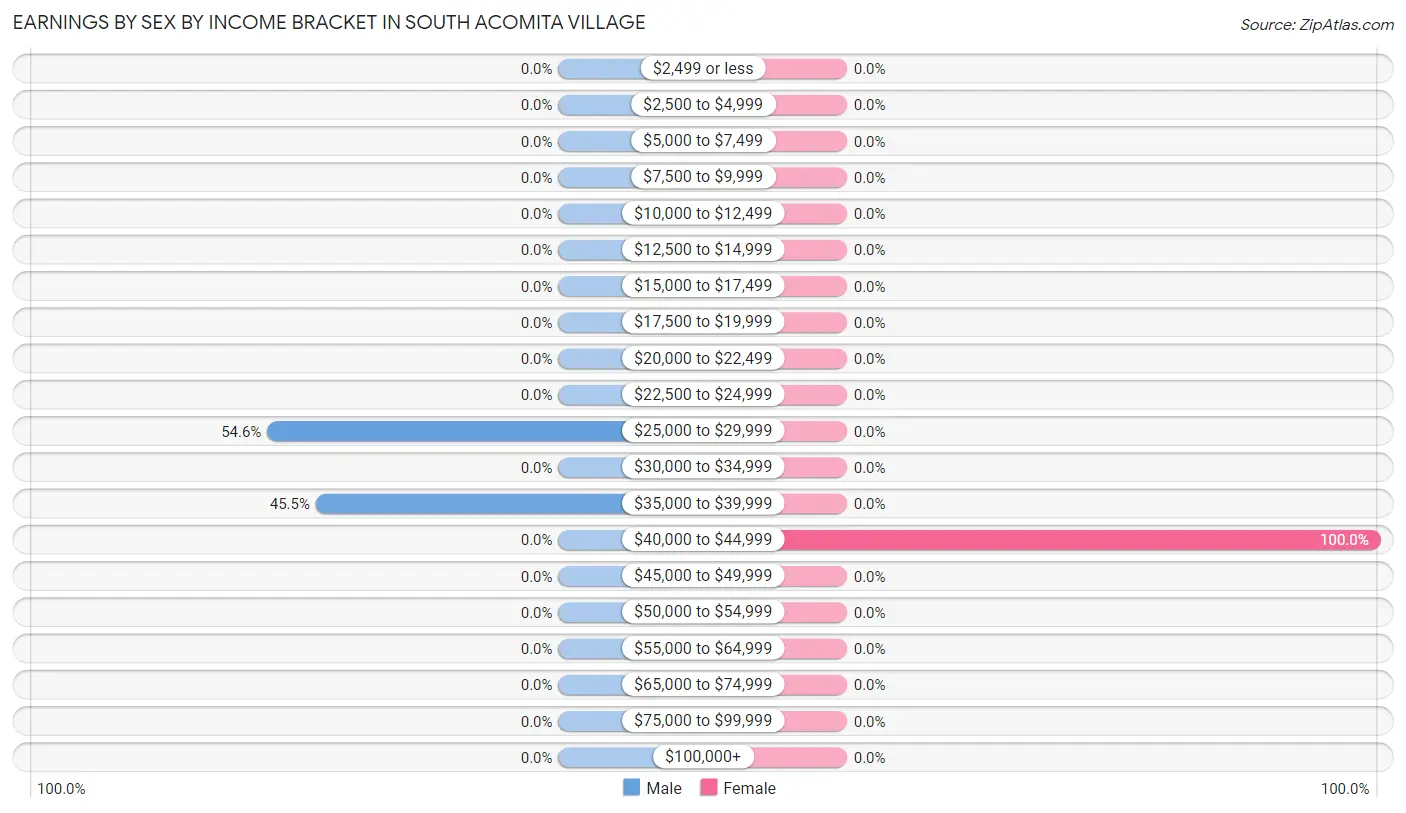
Earnings by Sex by Income Bracket in South Acomita Village
The most common earnings brackets in South Acomita Village are $25,000 to $29,999 for men (6 | 54.5%) and $40,000 to $44,999 for women (7 | 100.0%).
| Income | Male | Female |
| $2,499 or less | 0 (0.0%) | 0 (0.0%) |
| $2,500 to $4,999 | 0 (0.0%) | 0 (0.0%) |
| $5,000 to $7,499 | 0 (0.0%) | 0 (0.0%) |
| $7,500 to $9,999 | 0 (0.0%) | 0 (0.0%) |
| $10,000 to $12,499 | 0 (0.0%) | 0 (0.0%) |
| $12,500 to $14,999 | 0 (0.0%) | 0 (0.0%) |
| $15,000 to $17,499 | 0 (0.0%) | 0 (0.0%) |
| $17,500 to $19,999 | 0 (0.0%) | 0 (0.0%) |
| $20,000 to $22,499 | 0 (0.0%) | 0 (0.0%) |
| $22,500 to $24,999 | 0 (0.0%) | 0 (0.0%) |
| $25,000 to $29,999 | 6 (54.5%) | 0 (0.0%) |
| $30,000 to $34,999 | 0 (0.0%) | 0 (0.0%) |
| $35,000 to $39,999 | 5 (45.5%) | 0 (0.0%) |
| $40,000 to $44,999 | 0 (0.0%) | 7 (100.0%) |
| $45,000 to $49,999 | 0 (0.0%) | 0 (0.0%) |
| $50,000 to $54,999 | 0 (0.0%) | 0 (0.0%) |
| $55,000 to $64,999 | 0 (0.0%) | 0 (0.0%) |
| $65,000 to $74,999 | 0 (0.0%) | 0 (0.0%) |
| $75,000 to $99,999 | 0 (0.0%) | 0 (0.0%) |
| $100,000+ | 0 (0.0%) | 0 (0.0%) |
| Total | 11 (100.0%) | 7 (100.0%) |
Earnings by Sex by Educational Attainment in South Acomita Village
| Educational Attainment | Male Income | Female Income |
| Less than High School | - | - |
| High School Diploma | - | - |
| College or Associate's Degree | - | - |
| Bachelor's Degree | - | - |
| Graduate Degree | - | - |
| Total | - | - |
Family Income in South Acomita Village
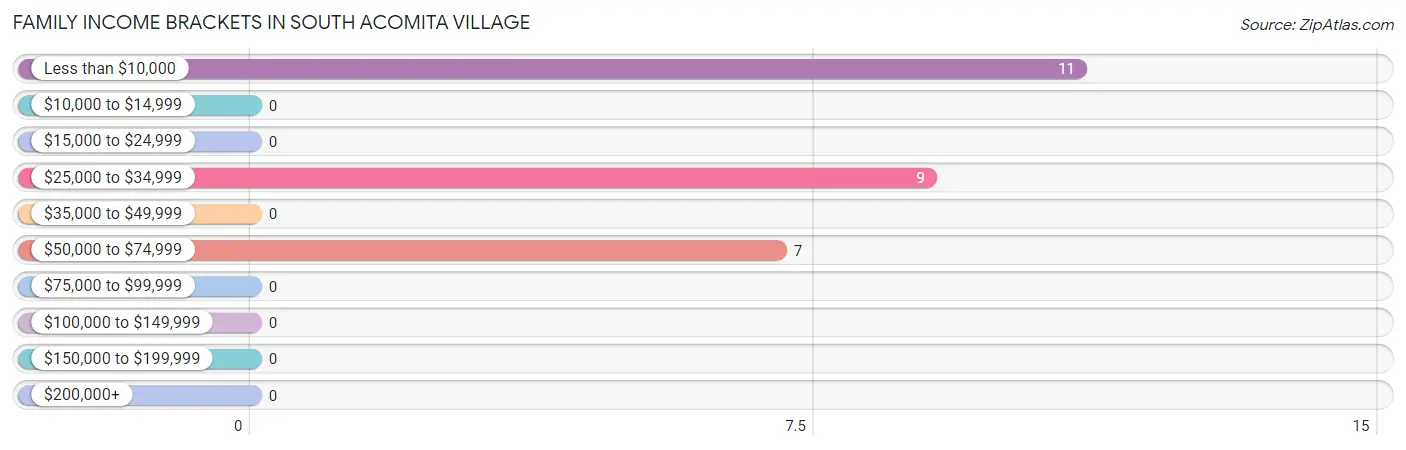
Family Income Brackets in South Acomita Village
According to the South Acomita Village family income data, there are 11 families falling into the less than $10,000 income range, which is the most common income bracket and makes up 40.7% of all families.
| Income Bracket | # Families | % Families |
| Less than $10,000 | 11 | 40.7% |
| $10,000 to $14,999 | 0 | 0.0% |
| $15,000 to $24,999 | 0 | 0.0% |
| $25,000 to $34,999 | 9 | 33.3% |
| $35,000 to $49,999 | 0 | 0.0% |
| $50,000 to $74,999 | 7 | 25.9% |
| $75,000 to $99,999 | 0 | 0.0% |
| $100,000 to $149,999 | 0 | 0.0% |
| $150,000 to $199,999 | 0 | 0.0% |
| $200,000+ | 0 | 0.0% |
Family Income by Famaliy Size in South Acomita Village
| Income Bracket | # Families | Median Income |
| 2-Person Families | 7 (25.9%) | $0 |
| 3-Person Families | 11 (40.7%) | $0 |
| 4-Person Families | 9 (33.3%) | $0 |
| 5-Person Families | 0 (0.0%) | $0 |
| 6-Person Families | 0 (0.0%) | $0 |
| 7+ Person Families | 0 (0.0%) | $0 |
| Total | 27 (100.0%) | $0 |
Family Income by Number of Earners in South Acomita Village
| Number of Earners | # Families | Median Income |
| No Earners | 20 (74.1%) | $0 |
| 1 Earner | 0 (0.0%) | $0 |
| 2 Earners | 7 (25.9%) | $0 |
| 3+ Earners | 0 (0.0%) | $0 |
| Total | 27 (100.0%) | $0 |
Household Income in South Acomita Village
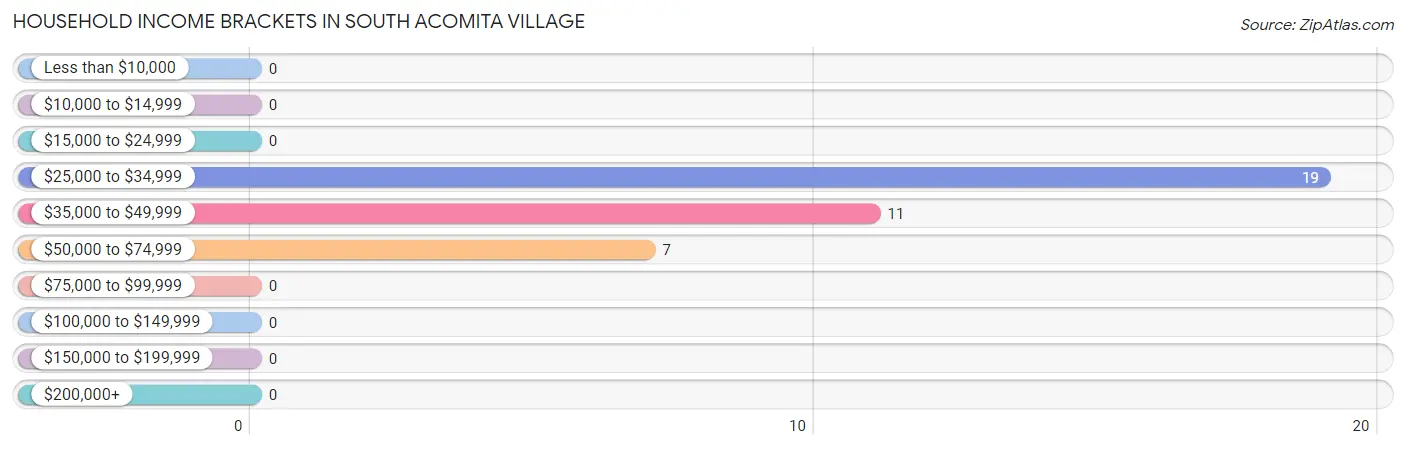
Household Income Brackets in South Acomita Village
With 19 households falling in the category, the $25,000 to $34,999 income range is the most frequent in South Acomita Village, accounting for 51.3% of all households.
| Income Bracket | # Households | % Households |
| Less than $10,000 | 0 | 0.0% |
| $10,000 to $14,999 | 0 | 0.0% |
| $15,000 to $24,999 | 0 | 0.0% |
| $25,000 to $34,999 | 19 | 51.4% |
| $35,000 to $49,999 | 11 | 29.7% |
| $50,000 to $74,999 | 7 | 18.9% |
| $75,000 to $99,999 | 0 | 0.0% |
| $100,000 to $149,999 | 0 | 0.0% |
| $150,000 to $199,999 | 0 | 0.0% |
| $200,000+ | 0 | 0.0% |
Household Income by Householder Age in South Acomita Village
The median household income in South Acomita Village is $32,434, with the highest median household income of $38,523 found in the 45 to 64 years age bracket for the primary householder. A total of 27 households (73.0%) fall into this category.
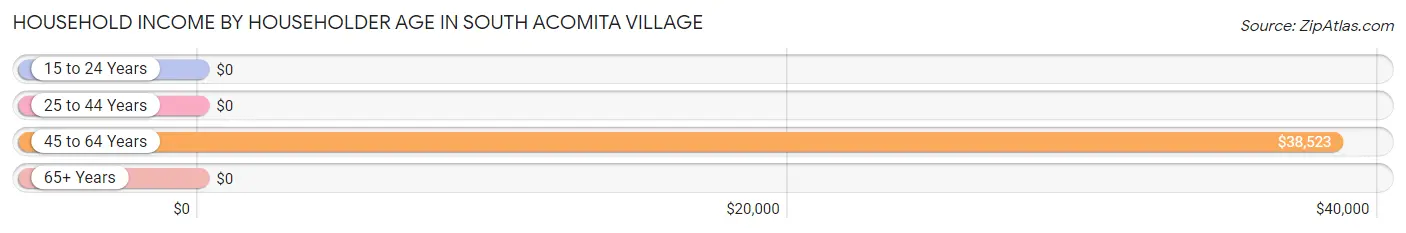
| Income Bracket | # Households | Median Income |
| 15 to 24 Years | 0 (0.0%) | $0 |
| 25 to 44 Years | 0 (0.0%) | $0 |
| 45 to 64 Years | 27 (73.0%) | $38,523 |
| 65+ Years | 10 (27.0%) | $0 |
| Total | 37 (100.0%) | $32,434 |
Poverty in South Acomita Village
Income Below Poverty by Sex and Age in South Acomita Village
With 43.3% poverty level for males and 19.0% for females among the residents of South Acomita Village, 6 to 11 year old males and 45 to 54 year old females are the most vulnerable to poverty, with 20 males (100.0%) and 11 females (100.0%) in their respective age groups living below the poverty level.
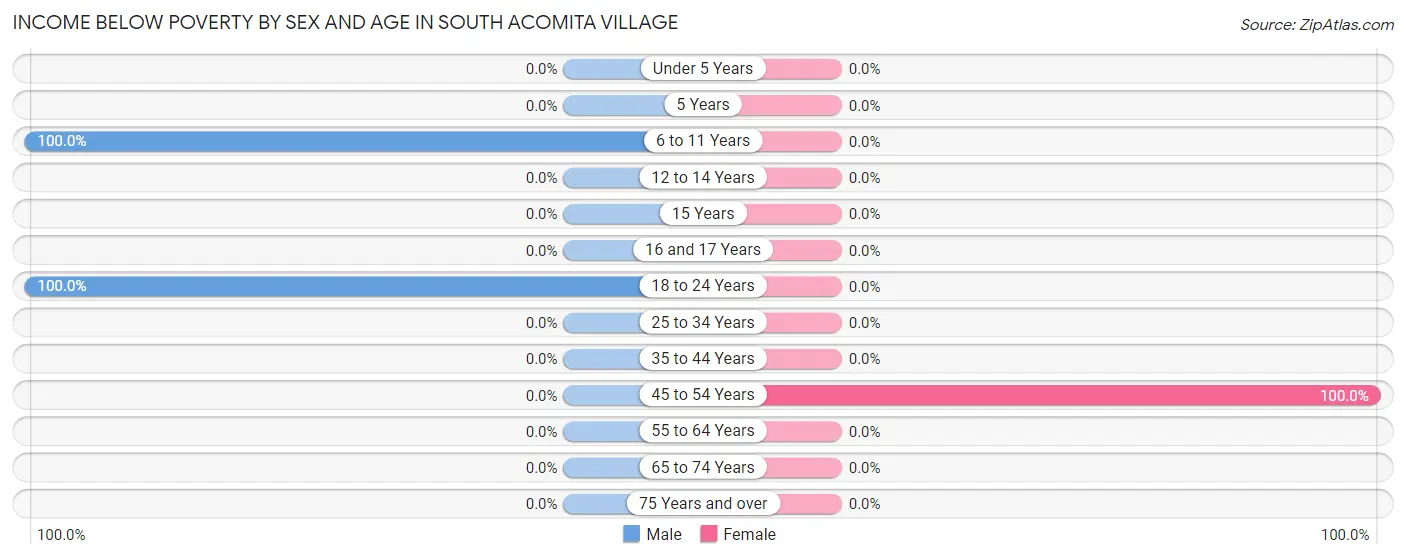
| Age Bracket | Male | Female |
| Under 5 Years | 0 (0.0%) | 0 (0.0%) |
| 5 Years | 0 (0.0%) | 0 (0.0%) |
| 6 to 11 Years | 20 (100.0%) | 0 (0.0%) |
| 12 to 14 Years | 0 (0.0%) | 0 (0.0%) |
| 15 Years | 0 (0.0%) | 0 (0.0%) |
| 16 and 17 Years | 0 (0.0%) | 0 (0.0%) |
| 18 to 24 Years | 9 (100.0%) | 0 (0.0%) |
| 25 to 34 Years | 0 (0.0%) | 0 (0.0%) |
| 35 to 44 Years | 0 (0.0%) | 0 (0.0%) |
| 45 to 54 Years | 0 (0.0%) | 11 (100.0%) |
| 55 to 64 Years | 0 (0.0%) | 0 (0.0%) |
| 65 to 74 Years | 0 (0.0%) | 0 (0.0%) |
| 75 Years and over | 0 (0.0%) | 0 (0.0%) |
| Total | 29 (43.3%) | 11 (19.0%) |
Income Above Poverty by Sex and Age in South Acomita Village
According to the poverty statistics in South Acomita Village, males aged 35 to 44 years and females aged 18 to 24 years are the age groups that are most secure financially, with 100.0% of males and 100.0% of females in these age groups living above the poverty line.
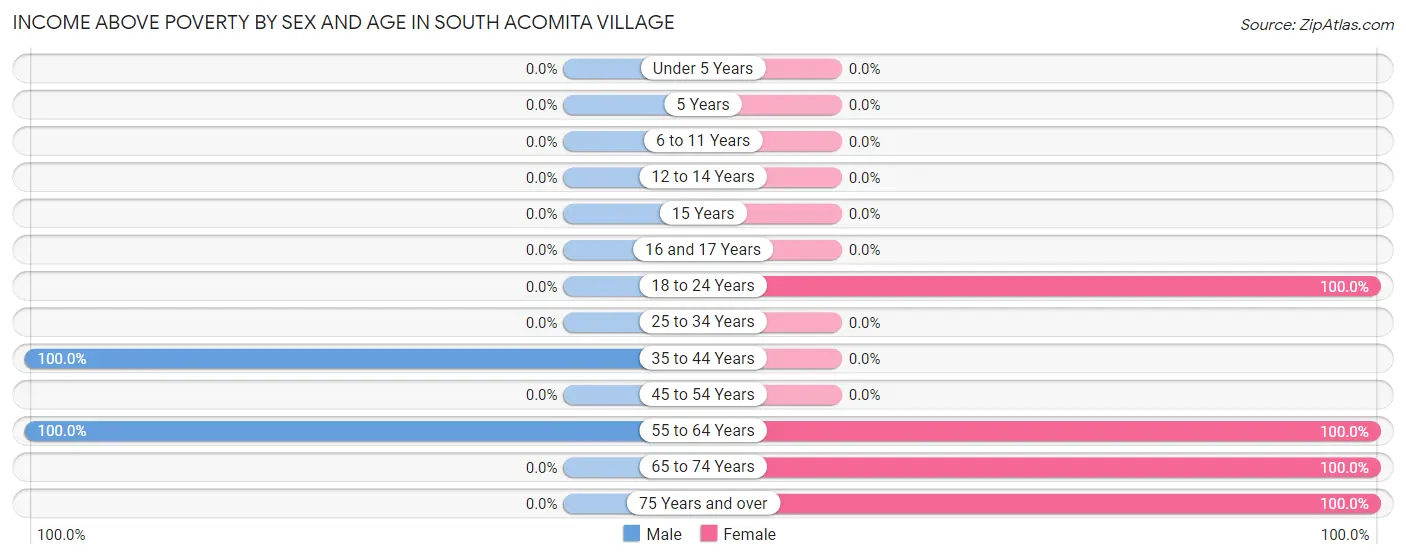
| Age Bracket | Male | Female |
| Under 5 Years | 0 (0.0%) | 0 (0.0%) |
| 5 Years | 0 (0.0%) | 0 (0.0%) |
| 6 to 11 Years | 0 (0.0%) | 0 (0.0%) |
| 12 to 14 Years | 0 (0.0%) | 0 (0.0%) |
| 15 Years | 0 (0.0%) | 0 (0.0%) |
| 16 and 17 Years | 0 (0.0%) | 0 (0.0%) |
| 18 to 24 Years | 0 (0.0%) | 9 (100.0%) |
| 25 to 34 Years | 0 (0.0%) | 0 (0.0%) |
| 35 to 44 Years | 5 (100.0%) | 0 (0.0%) |
| 45 to 54 Years | 0 (0.0%) | 0 (0.0%) |
| 55 to 64 Years | 33 (100.0%) | 16 (100.0%) |
| 65 to 74 Years | 0 (0.0%) | 12 (100.0%) |
| 75 Years and over | 0 (0.0%) | 10 (100.0%) |
| Total | 38 (56.7%) | 47 (81.0%) |
Income Below Poverty Among Married-Couple Families in South Acomita Village
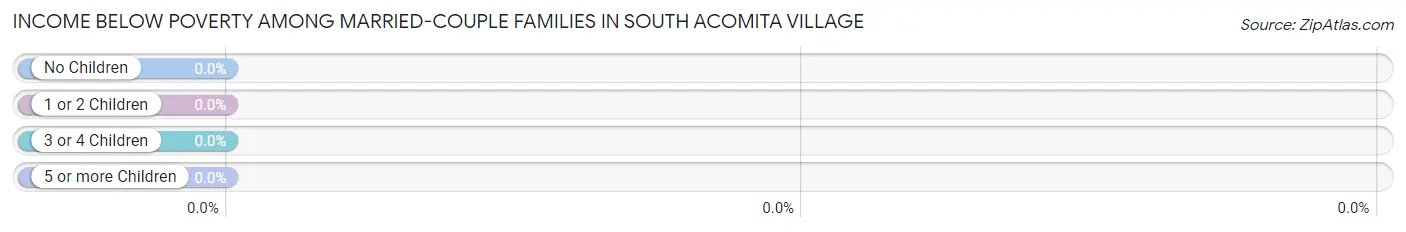
| Children | Above Poverty | Below Poverty |
| No Children | 7 (100.0%) | 0 (0.0%) |
| 1 or 2 Children | 0 (0.0%) | 0 (0.0%) |
| 3 or 4 Children | 0 (0.0%) | 0 (0.0%) |
| 5 or more Children | 0 (0.0%) | 0 (0.0%) |
| Total | 7 (100.0%) | 0 (0.0%) |
Income Below Poverty Among Single-Parent Households in South Acomita Village
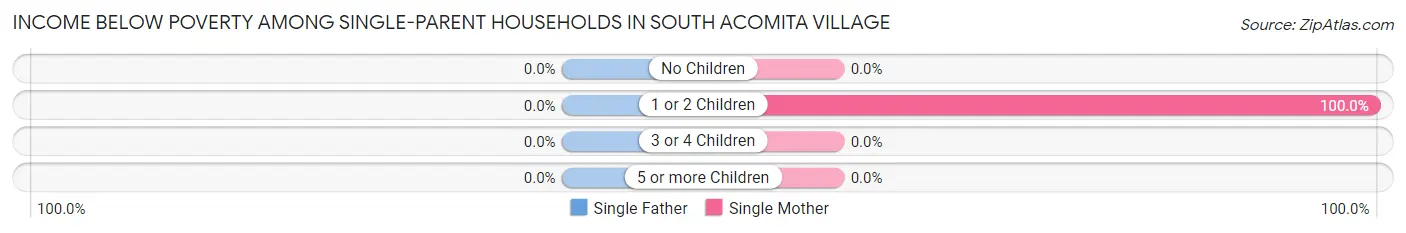
| Children | Single Father | Single Mother |
| No Children | 0 (0.0%) | 0 (0.0%) |
| 1 or 2 Children | 0 (0.0%) | 11 (100.0%) |
| 3 or 4 Children | 0 (0.0%) | 0 (0.0%) |
| 5 or more Children | 0 (0.0%) | 0 (0.0%) |
| Total | 0 (0.0%) | 11 (55.0%) |
Income Below Poverty Among Married-Couple vs Single-Parent Households in South Acomita Village
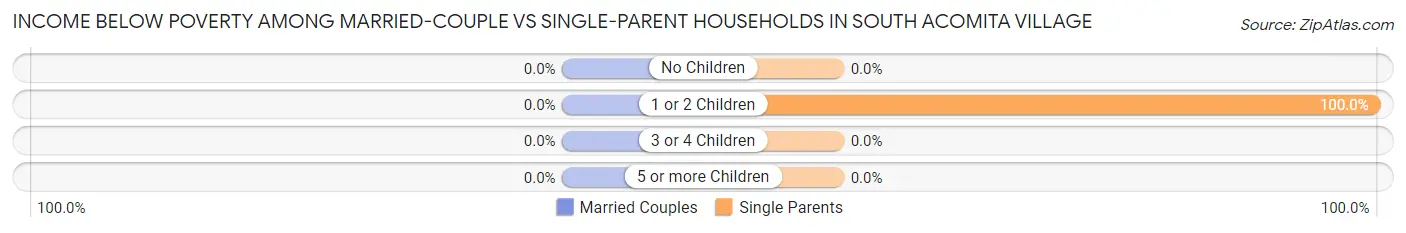
| Children | Married-Couple Families | Single-Parent Households |
| No Children | 0 (0.0%) | 0 (0.0%) |
| 1 or 2 Children | 0 (0.0%) | 11 (100.0%) |
| 3 or 4 Children | 0 (0.0%) | 0 (0.0%) |
| 5 or more Children | 0 (0.0%) | 0 (0.0%) |
| Total | 0 (0.0%) | 11 (55.0%) |
Race in South Acomita Village
The most populous races in South Acomita Village are Native / Alaskan (88 | 70.4%), Hispanic or Latino (47 | 37.6%), and Some other Race (27 | 21.6%).
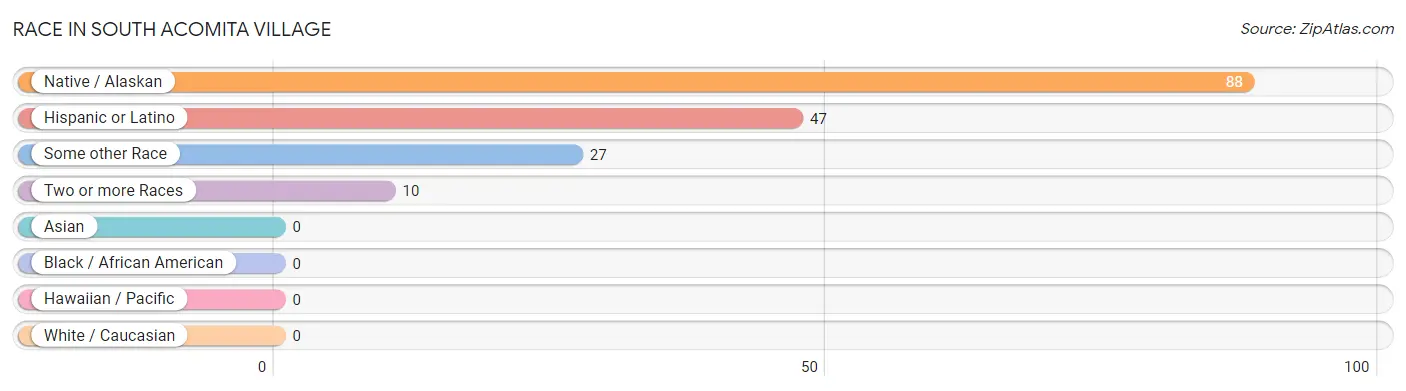
| Race | # Population | % Population |
| Asian | 0 | 0.0% |
| Black / African American | 0 | 0.0% |
| Hawaiian / Pacific | 0 | 0.0% |
| Hispanic or Latino | 47 | 37.6% |
| Native / Alaskan | 88 | 70.4% |
| White / Caucasian | 0 | 0.0% |
| Two or more Races | 10 | 8.0% |
| Some other Race | 27 | 21.6% |
| Total | 125 | 100.0% |
Ancestry in South Acomita Village
The most populous ancestries reported in South Acomita Village are Pueblo (88 | 70.4%), Mexican (47 | 37.6%), Cherokee (10 | 8.0%), American (9 | 7.2%), and Navajo (5 | 4.0%), together accounting for 127.2% of all South Acomita Village residents.
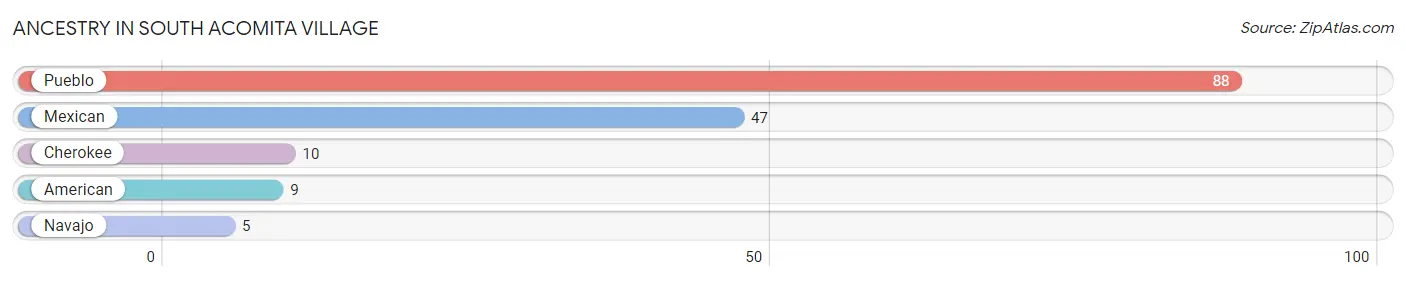
| Ancestry | # Population | % Population |
| American | 9 | 7.2% |
| Cherokee | 10 | 8.0% |
| Mexican | 47 | 37.6% |
| Navajo | 5 | 4.0% |
| Pueblo | 88 | 70.4% | View All 5 Rows |
Immigrants in South Acomita Village

| Immigration Origin | # Population | % Population | View All 0 Rows |
Sex and Age in South Acomita Village
Sex and Age in South Acomita Village
The most populous age groups in South Acomita Village are 60 to 64 Years (27 | 40.3%) for men and 65 to 69 Years (12 | 20.7%) for women.
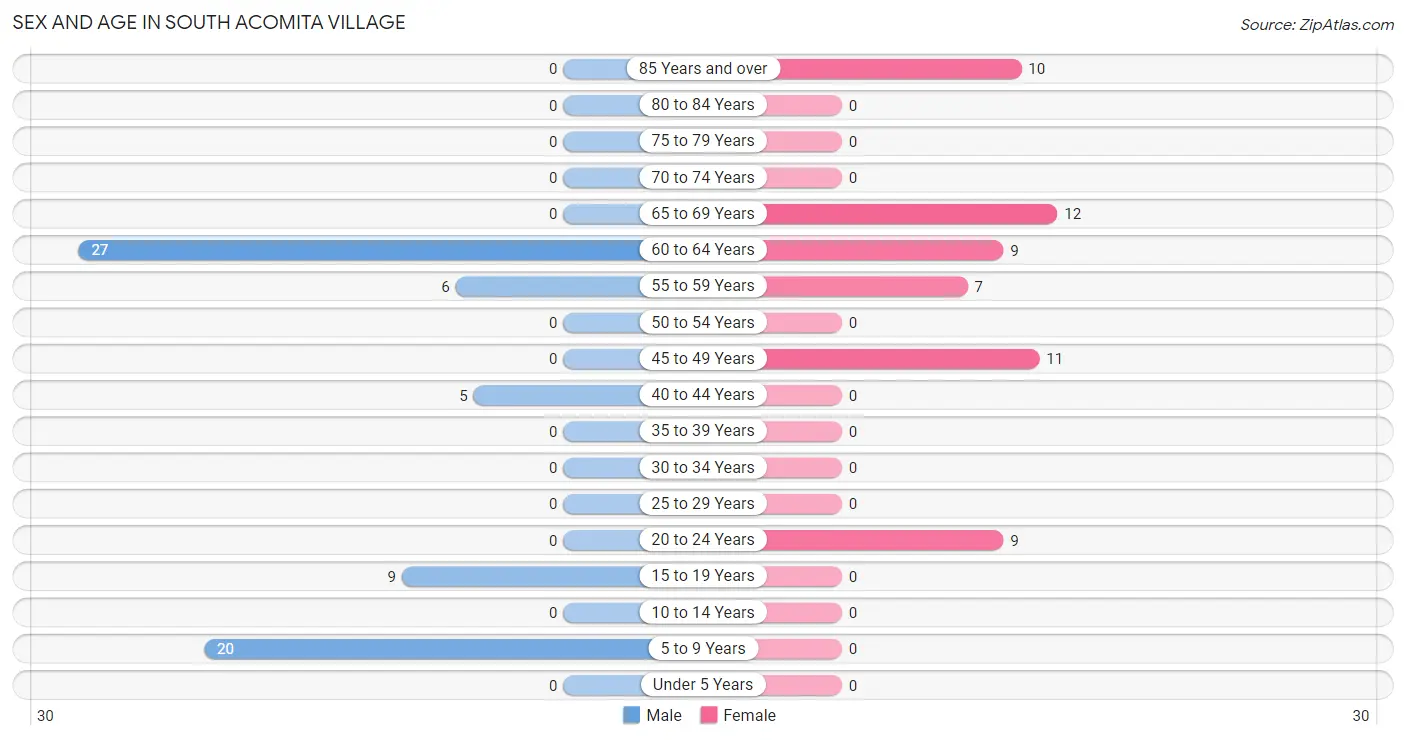
| Age Bracket | Male | Female |
| Under 5 Years | 0 (0.0%) | 0 (0.0%) |
| 5 to 9 Years | 20 (29.8%) | 0 (0.0%) |
| 10 to 14 Years | 0 (0.0%) | 0 (0.0%) |
| 15 to 19 Years | 9 (13.4%) | 0 (0.0%) |
| 20 to 24 Years | 0 (0.0%) | 9 (15.5%) |
| 25 to 29 Years | 0 (0.0%) | 0 (0.0%) |
| 30 to 34 Years | 0 (0.0%) | 0 (0.0%) |
| 35 to 39 Years | 0 (0.0%) | 0 (0.0%) |
| 40 to 44 Years | 5 (7.5%) | 0 (0.0%) |
| 45 to 49 Years | 0 (0.0%) | 11 (19.0%) |
| 50 to 54 Years | 0 (0.0%) | 0 (0.0%) |
| 55 to 59 Years | 6 (9.0%) | 7 (12.1%) |
| 60 to 64 Years | 27 (40.3%) | 9 (15.5%) |
| 65 to 69 Years | 0 (0.0%) | 12 (20.7%) |
| 70 to 74 Years | 0 (0.0%) | 0 (0.0%) |
| 75 to 79 Years | 0 (0.0%) | 0 (0.0%) |
| 80 to 84 Years | 0 (0.0%) | 0 (0.0%) |
| 85 Years and over | 0 (0.0%) | 10 (17.2%) |
| Total | 67 (100.0%) | 58 (100.0%) |
Families and Households in South Acomita Village
Median Family Size in South Acomita Village
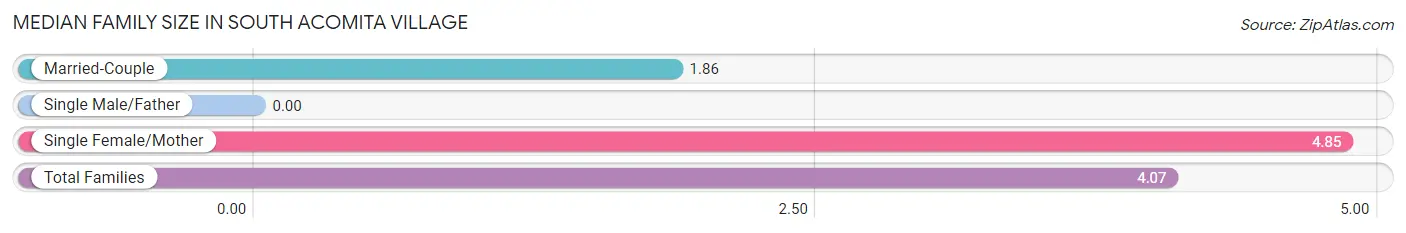
| Family Type | # Families | Family Size |
| Married-Couple | 7 (25.9%) | 1.86 |
| Single Male/Father | 0 (0.0%) | - |
| Single Female/Mother | 20 (74.1%) | 4.85 |
| Total Families | 27 (100.0%) | 4.07 |
Median Household Size in South Acomita Village
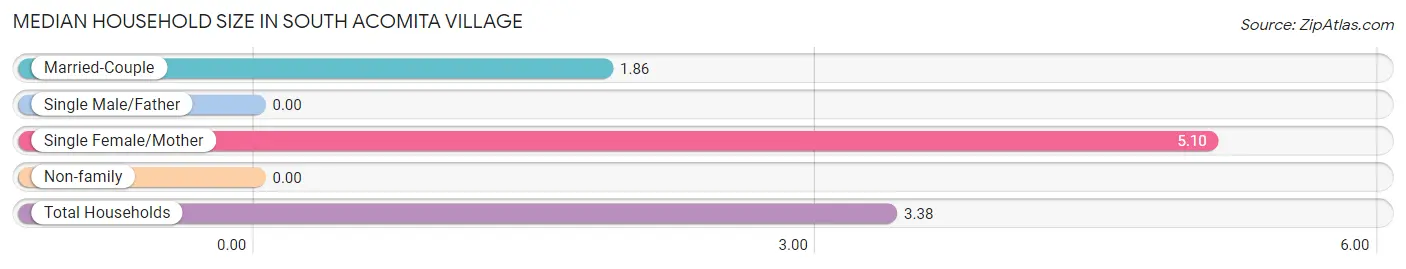
| Household Type | # Households | Household Size |
| Married-Couple | 7 (18.9%) | 1.86 |
| Single Male/Father | 0 (0.0%) | - |
| Single Female/Mother | 20 (54.0%) | 5.10 |
| Non-family | 10 (27.0%) | - |
| Total Households | 37 (100.0%) | 3.38 |
Household Size by Marriage Status in South Acomita Village
Out of a total of 37 households in South Acomita Village, 27 (73.0%) are family households, while 10 (27.0%) are nonfamily households. The most numerous type of family households are 4-person households, comprising 20, and the most common type of nonfamily households are 1-person households, comprising 10.
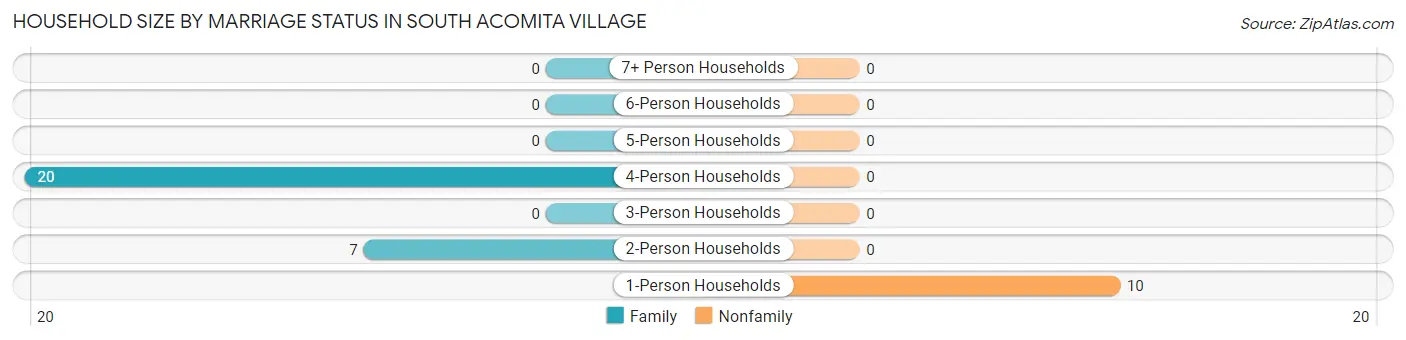
| Household Size | Family Households | Nonfamily Households |
| 1-Person Households | - | 10 (27.0%) |
| 2-Person Households | 7 (18.9%) | 0 (0.0%) |
| 3-Person Households | 0 (0.0%) | 0 (0.0%) |
| 4-Person Households | 20 (54.0%) | 0 (0.0%) |
| 5-Person Households | 0 (0.0%) | 0 (0.0%) |
| 6-Person Households | 0 (0.0%) | 0 (0.0%) |
| 7+ Person Households | 0 (0.0%) | 0 (0.0%) |
| Total | 27 (73.0%) | 10 (27.0%) |
Female Fertility in South Acomita Village
Fertility by Age in South Acomita Village
| Age Bracket | Women with Births | Births / 1,000 Women |
| 15 to 19 years | 0 (0.0%) | 0.0 |
| 20 to 34 years | 0 (0.0%) | 0.0 |
| 35 to 50 years | 0 (0.0%) | 0.0 |
| Total | 0 (0.0%) | 0.0 |
Fertility by Age by Marriage Status in South Acomita Village
| Age Bracket | Married | Unmarried |
| 15 to 19 years | 0 (0.0%) | 0 (0.0%) |
| 20 to 34 years | 0 (0.0%) | 0 (0.0%) |
| 35 to 50 years | 0 (0.0%) | 0 (0.0%) |
| Total | 0 (0.0%) | 0 (0.0%) |
Fertility by Education in South Acomita Village
| Educational Attainment | Women with Births | Births / 1,000 Women |
| Less than High School | 0 (0.0%) | 0.0 |
| High School Diploma | 0 (0.0%) | 0.0 |
| College or Associate's Degree | 0 (0.0%) | 0.0 |
| Bachelor's Degree | 0 (0.0%) | 0.0 |
| Graduate Degree | 0 (0.0%) | 0.0 |
| Total | 0 (0.0%) | 0.0 |
Fertility by Education by Marriage Status in South Acomita Village
| Educational Attainment | Married | Unmarried |
| Less than High School | 0 (0.0%) | 0 (0.0%) |
| High School Diploma | 0 (0.0%) | 0 (0.0%) |
| College or Associate's Degree | 0 (0.0%) | 0 (0.0%) |
| Bachelor's Degree | 0 (0.0%) | 0 (0.0%) |
| Graduate Degree | 0 (0.0%) | 0 (0.0%) |
| Total | 0 (0.0%) | 0 (0.0%) |
Employment Characteristics in South Acomita Village
Employment by Class of Employer in South Acomita Village
Among the 18 employed individuals in South Acomita Village, federal government employees (7 | 38.9%), local government employees (6 | 33.3%), and private company employees (5 | 27.8%) make up the most common classes of employment.
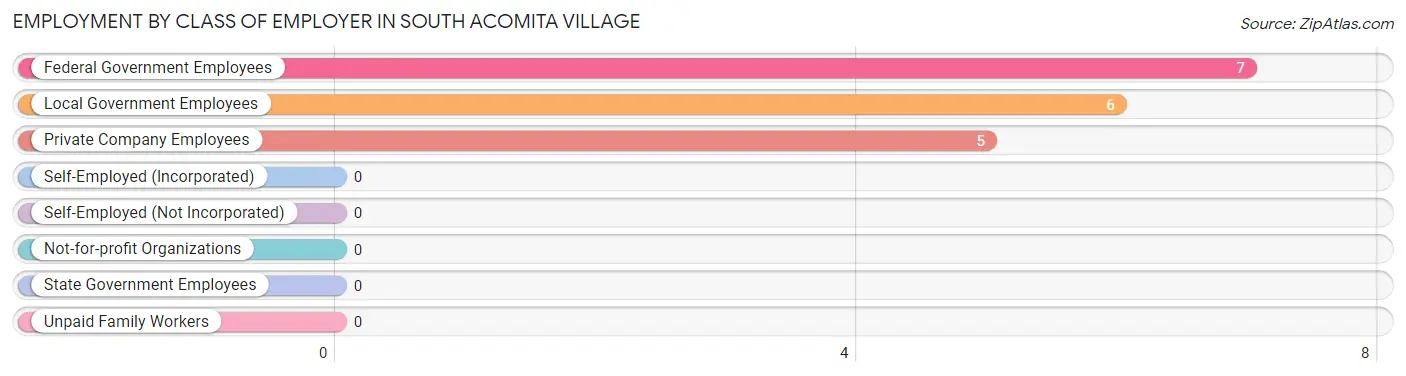
| Employer Class | # Employees | % Employees |
| Private Company Employees | 5 | 27.8% |
| Self-Employed (Incorporated) | 0 | 0.0% |
| Self-Employed (Not Incorporated) | 0 | 0.0% |
| Not-for-profit Organizations | 0 | 0.0% |
| Local Government Employees | 6 | 33.3% |
| State Government Employees | 0 | 0.0% |
| Federal Government Employees | 7 | 38.9% |
| Unpaid Family Workers | 0 | 0.0% |
| Total | 18 | 100.0% |
Employment Status by Age in South Acomita Village
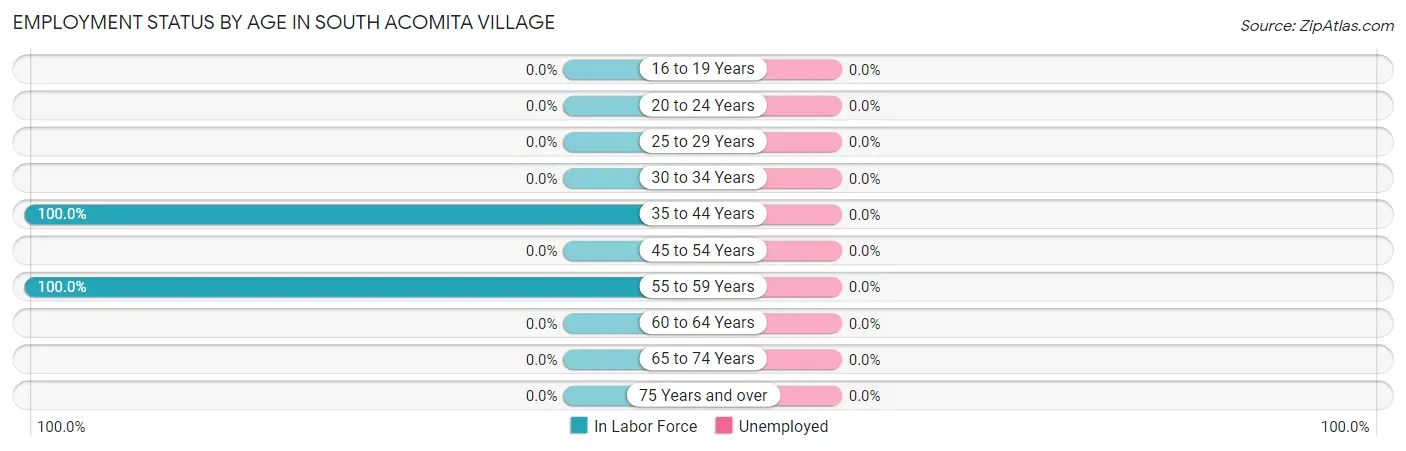
| Age Bracket | In Labor Force | Unemployed |
| 16 to 19 Years | 0 (0.0%) | 0 (0.0%) |
| 20 to 24 Years | 0 (0.0%) | 0 (0.0%) |
| 25 to 29 Years | 0 (0.0%) | 0 (0.0%) |
| 30 to 34 Years | 0 (0.0%) | 0 (0.0%) |
| 35 to 44 Years | 5 (100.0%) | 0 (0.0%) |
| 45 to 54 Years | 0 (0.0%) | 0 (0.0%) |
| 55 to 59 Years | 13 (100.0%) | 0 (0.0%) |
| 60 to 64 Years | 0 (0.0%) | 0 (0.0%) |
| 65 to 74 Years | 0 (0.0%) | 0 (0.0%) |
| 75 Years and over | 0 (0.0%) | 0 (0.0%) |
| Total | 18 (17.1%) | 0 (0.0%) |
Employment Status by Educational Attainment in South Acomita Village
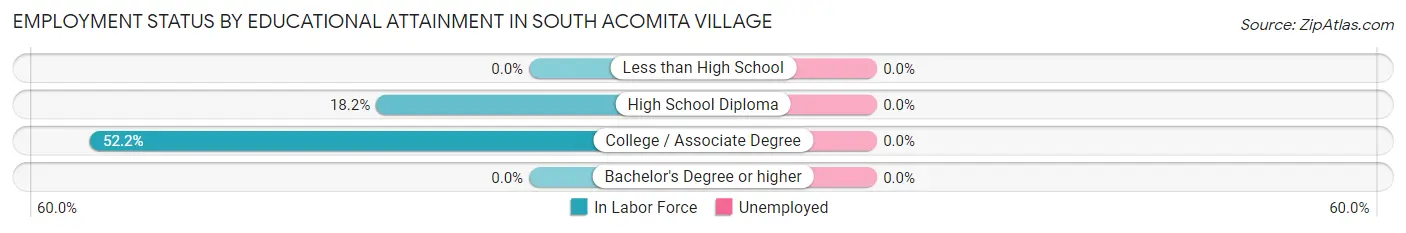
| Educational Attainment | In Labor Force | Unemployed |
| Less than High School | 0 (0.0%) | 0 (0.0%) |
| High School Diploma | 6 (18.2%) | 0 (0.0%) |
| College / Associate Degree | 12 (52.2%) | 0 (0.0%) |
| Bachelor's Degree or higher | 0 (0.0%) | 0 (0.0%) |
| Total | 18 (27.7%) | 0 (0.0%) |
Employment Occupations by Sex in South Acomita Village
Management, Business, Science and Arts Occupations
The most common Management, Business, Science and Arts occupations in South Acomita Village are , and Business & Financial (7 | 38.9%).
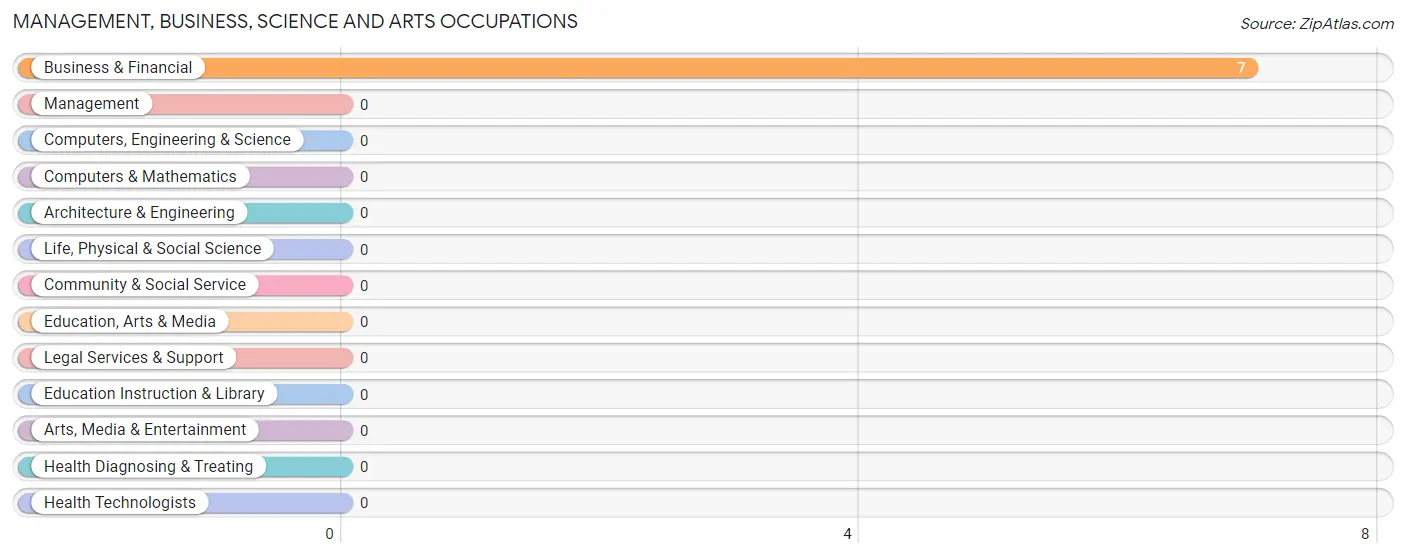
Management, Business, Science and Arts Occupations by Sex
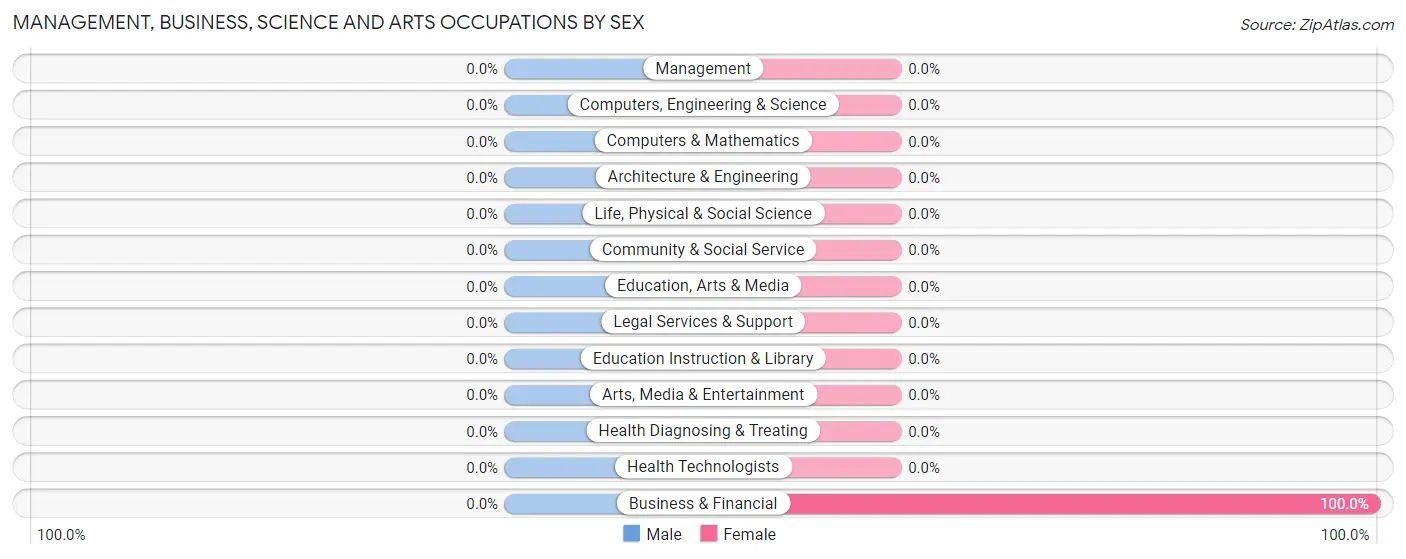
| Occupation | Male | Female |
| Management | 0 (0.0%) | 0 (0.0%) |
| Business & Financial | 0 (0.0%) | 7 (100.0%) |
| Computers, Engineering & Science | 0 (0.0%) | 0 (0.0%) |
| Computers & Mathematics | 0 (0.0%) | 0 (0.0%) |
| Architecture & Engineering | 0 (0.0%) | 0 (0.0%) |
| Life, Physical & Social Science | 0 (0.0%) | 0 (0.0%) |
| Community & Social Service | 0 (0.0%) | 0 (0.0%) |
| Education, Arts & Media | 0 (0.0%) | 0 (0.0%) |
| Legal Services & Support | 0 (0.0%) | 0 (0.0%) |
| Education Instruction & Library | 0 (0.0%) | 0 (0.0%) |
| Arts, Media & Entertainment | 0 (0.0%) | 0 (0.0%) |
| Health Diagnosing & Treating | 0 (0.0%) | 0 (0.0%) |
| Health Technologists | 0 (0.0%) | 0 (0.0%) |
| Total (Category) | 0 (0.0%) | 7 (100.0%) |
| Total (Overall) | 11 (61.1%) | 7 (38.9%) |
Services Occupations
The most common Services occupations in South Acomita Village are Security & Protection (6 | 33.3%), and Law Enforcement (6 | 33.3%).
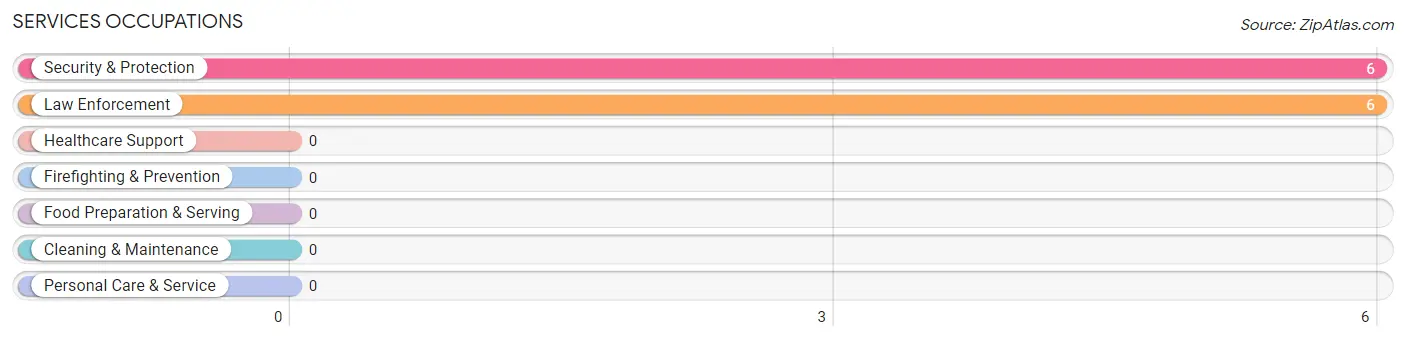
Services Occupations by Sex
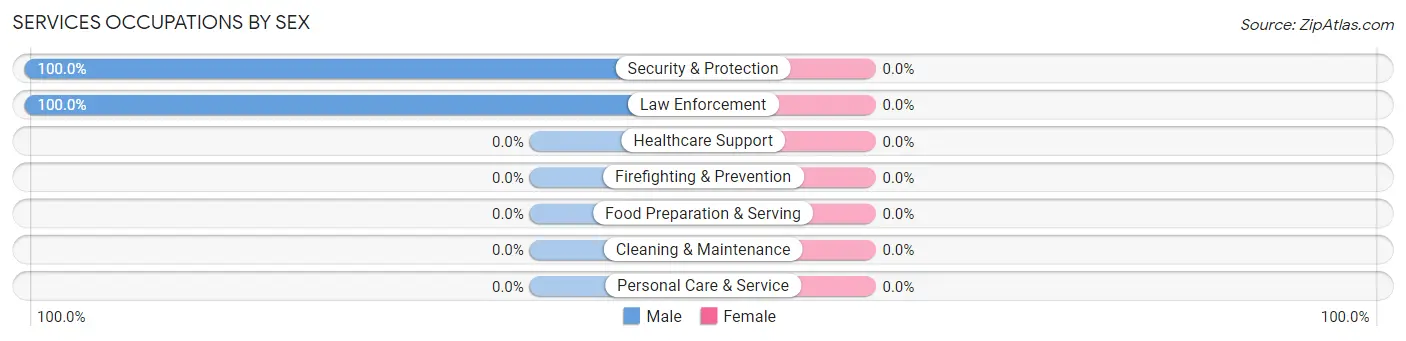
| Occupation | Male | Female |
| Healthcare Support | 0 (0.0%) | 0 (0.0%) |
| Security & Protection | 6 (100.0%) | 0 (0.0%) |
| Firefighting & Prevention | 0 (0.0%) | 0 (0.0%) |
| Law Enforcement | 6 (100.0%) | 0 (0.0%) |
| Food Preparation & Serving | 0 (0.0%) | 0 (0.0%) |
| Cleaning & Maintenance | 0 (0.0%) | 0 (0.0%) |
| Personal Care & Service | 0 (0.0%) | 0 (0.0%) |
| Total (Category) | 6 (100.0%) | 0 (0.0%) |
| Total (Overall) | 11 (61.1%) | 7 (38.9%) |
Sales and Office Occupations
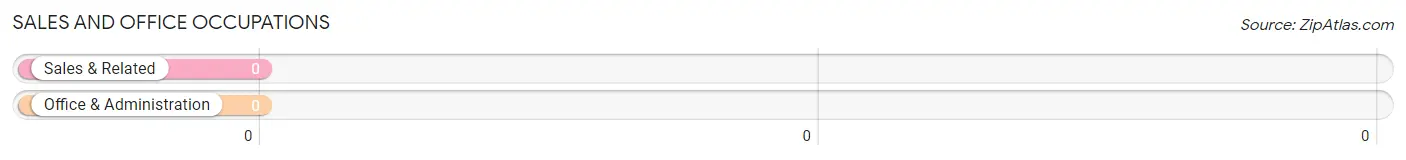
Sales and Office Occupations by Sex
| Occupation | Male | Female |
| Sales & Related | 0 (0.0%) | 0 (0.0%) |
| Office & Administration | 0 (0.0%) | 0 (0.0%) |
| Total (Category) | 0 (0.0%) | 0 (0.0%) |
| Total (Overall) | 11 (61.1%) | 7 (38.9%) |
Natural Resources, Construction and Maintenance Occupations
Natural Resources, Construction and Maintenance Occupations by Sex
| Occupation | Male | Female |
| Farming, Fishing & Forestry | 0 (0.0%) | 0 (0.0%) |
| Construction & Extraction | 0 (0.0%) | 0 (0.0%) |
| Installation, Maintenance & Repair | 0 (0.0%) | 0 (0.0%) |
| Total (Category) | 0 (0.0%) | 0 (0.0%) |
| Total (Overall) | 11 (61.1%) | 7 (38.9%) |
Production, Transportation and Moving Occupations
The most common Production, Transportation and Moving occupations in South Acomita Village are , and Production (5 | 27.8%).
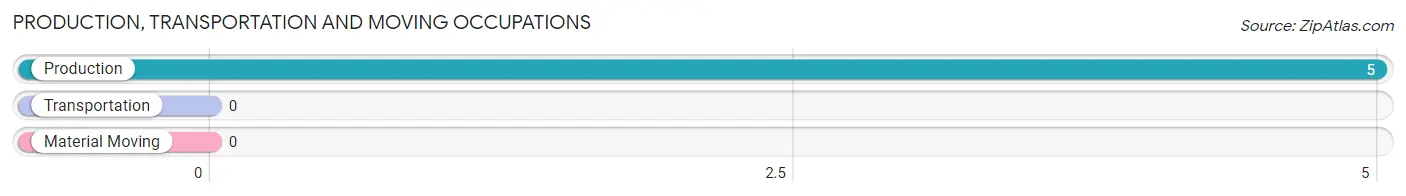
Production, Transportation and Moving Occupations by Sex
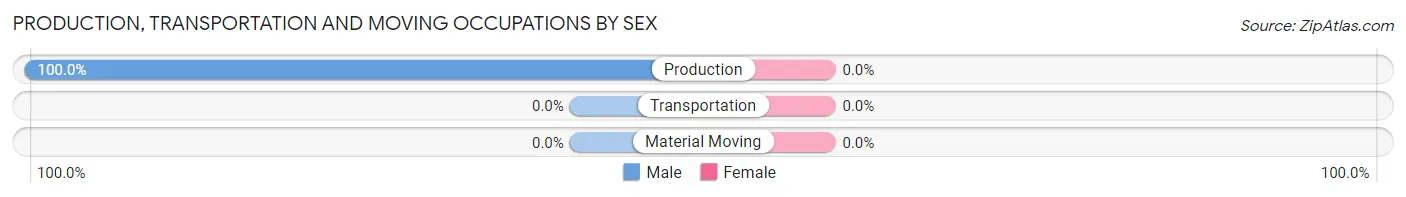
| Occupation | Male | Female |
| Production | 5 (100.0%) | 0 (0.0%) |
| Transportation | 0 (0.0%) | 0 (0.0%) |
| Material Moving | 0 (0.0%) | 0 (0.0%) |
| Total (Category) | 5 (100.0%) | 0 (0.0%) |
| Total (Overall) | 11 (61.1%) | 7 (38.9%) |
Employment Industries by Sex in South Acomita Village
Employment Industries in South Acomita Village
The major employment industries in South Acomita Village include Public Administration (13 | 72.2%), and Manufacturing (5 | 27.8%).
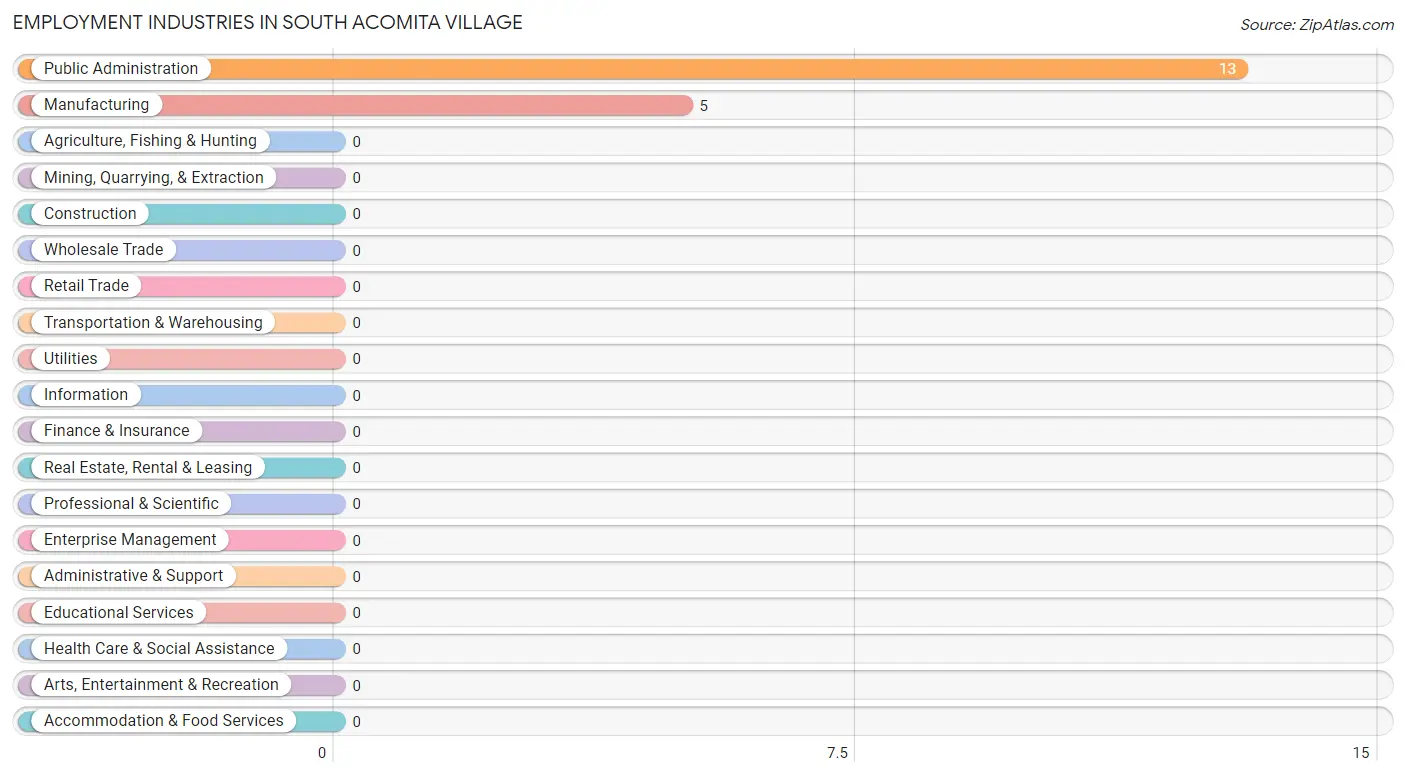
Employment Industries by Sex in South Acomita Village
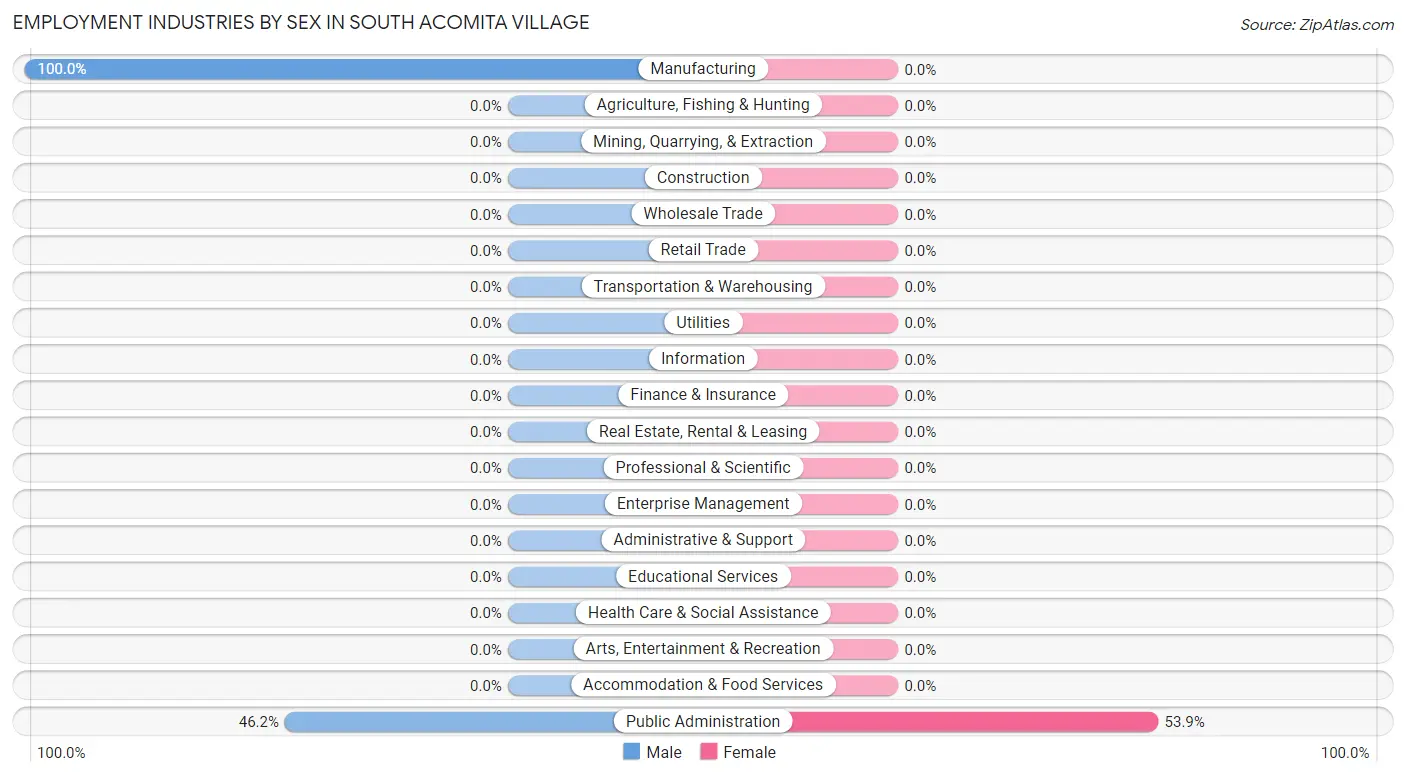
| Industry | Male | Female |
| Agriculture, Fishing & Hunting | 0 (0.0%) | 0 (0.0%) |
| Mining, Quarrying, & Extraction | 0 (0.0%) | 0 (0.0%) |
| Construction | 0 (0.0%) | 0 (0.0%) |
| Manufacturing | 5 (100.0%) | 0 (0.0%) |
| Wholesale Trade | 0 (0.0%) | 0 (0.0%) |
| Retail Trade | 0 (0.0%) | 0 (0.0%) |
| Transportation & Warehousing | 0 (0.0%) | 0 (0.0%) |
| Utilities | 0 (0.0%) | 0 (0.0%) |
| Information | 0 (0.0%) | 0 (0.0%) |
| Finance & Insurance | 0 (0.0%) | 0 (0.0%) |
| Real Estate, Rental & Leasing | 0 (0.0%) | 0 (0.0%) |
| Professional & Scientific | 0 (0.0%) | 0 (0.0%) |
| Enterprise Management | 0 (0.0%) | 0 (0.0%) |
| Administrative & Support | 0 (0.0%) | 0 (0.0%) |
| Educational Services | 0 (0.0%) | 0 (0.0%) |
| Health Care & Social Assistance | 0 (0.0%) | 0 (0.0%) |
| Arts, Entertainment & Recreation | 0 (0.0%) | 0 (0.0%) |
| Accommodation & Food Services | 0 (0.0%) | 0 (0.0%) |
| Public Administration | 6 (46.2%) | 7 (53.8%) |
| Total | 11 (61.1%) | 7 (38.9%) |
Education in South Acomita Village
School Enrollment in South Acomita Village
The most common levels of schooling among the 38 students in South Acomita Village are elementary school (20 | 52.6%), high school (9 | 23.7%), and college / undergraduate (9 | 23.7%).
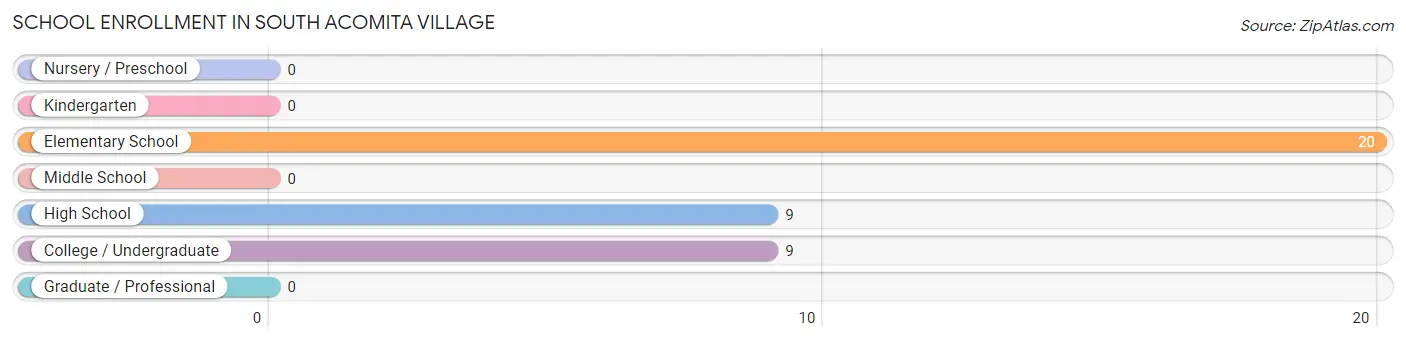
| School Level | # Students | % Students |
| Nursery / Preschool | 0 | 0.0% |
| Kindergarten | 0 | 0.0% |
| Elementary School | 20 | 52.6% |
| Middle School | 0 | 0.0% |
| High School | 9 | 23.7% |
| College / Undergraduate | 9 | 23.7% |
| Graduate / Professional | 0 | 0.0% |
| Total | 38 | 100.0% |
School Enrollment by Age by Funding Source in South Acomita Village
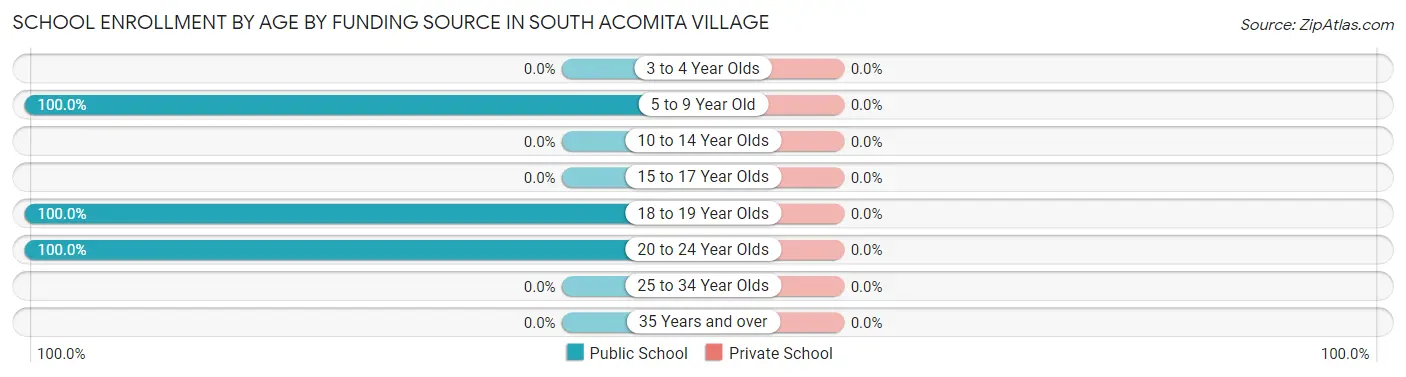
| Age Bracket | Public School | Private School |
| 3 to 4 Year Olds | 0 (0.0%) | 0 (0.0%) |
| 5 to 9 Year Old | 20 (100.0%) | 0 (0.0%) |
| 10 to 14 Year Olds | 0 (0.0%) | 0 (0.0%) |
| 15 to 17 Year Olds | 0 (0.0%) | 0 (0.0%) |
| 18 to 19 Year Olds | 9 (100.0%) | 0 (0.0%) |
| 20 to 24 Year Olds | 9 (100.0%) | 0 (0.0%) |
| 25 to 34 Year Olds | 0 (0.0%) | 0 (0.0%) |
| 35 Years and over | 0 (0.0%) | 0 (0.0%) |
| Total | 38 (100.0%) | 0 (0.0%) |
Educational Attainment by Field of Study in South Acomita Village
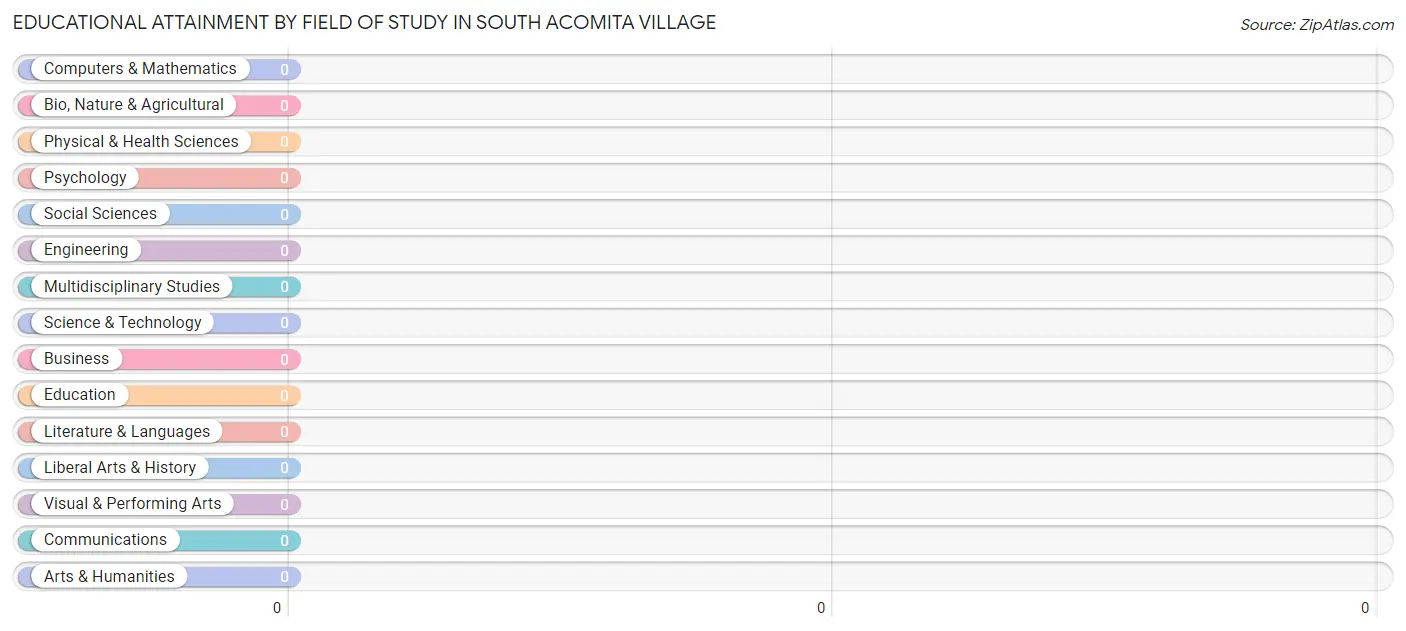
| Field of Study | # Graduates | % Graduates |
| Computers & Mathematics | 0 | 0.0% |
| Bio, Nature & Agricultural | 0 | 0.0% |
| Physical & Health Sciences | 0 | 0.0% |
| Psychology | 0 | 0.0% |
| Social Sciences | 0 | 0.0% |
| Engineering | 0 | 0.0% |
| Multidisciplinary Studies | 0 | 0.0% |
| Science & Technology | 0 | 0.0% |
| Business | 0 | 0.0% |
| Education | 0 | 0.0% |
| Literature & Languages | 0 | 0.0% |
| Liberal Arts & History | 0 | 0.0% |
| Visual & Performing Arts | 0 | 0.0% |
| Communications | 0 | 0.0% |
| Arts & Humanities | 0 | 0.0% |
| Total | 0 | 0.0% |
Transportation & Commute in South Acomita Village
Vehicle Availability by Sex in South Acomita Village
The most prevalent vehicle ownership categories in South Acomita Village are males with 2 vehicles (6, accounting for 54.5%) and females with 2 vehicles (7, making up 85.7%).
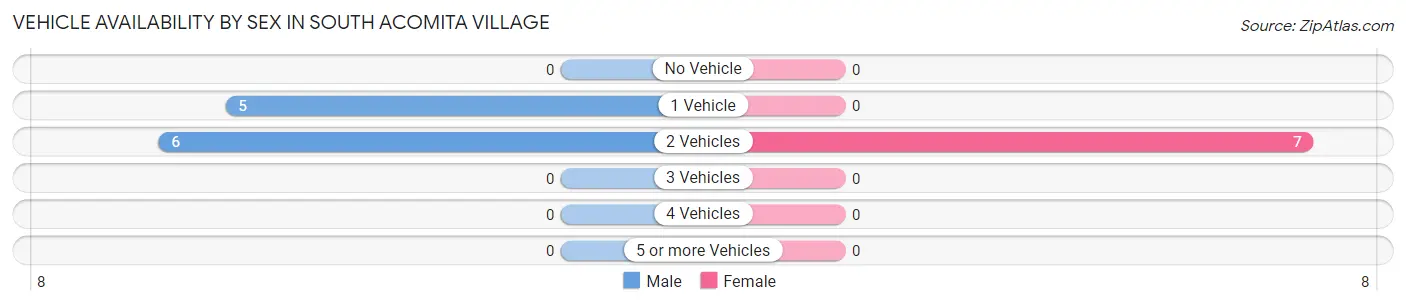
| Vehicles Available | Male | Female |
| No Vehicle | 0 (0.0%) | 0 (0.0%) |
| 1 Vehicle | 5 (45.5%) | 0 (0.0%) |
| 2 Vehicles | 6 (54.5%) | 7 (100.0%) |
| 3 Vehicles | 0 (0.0%) | 0 (0.0%) |
| 4 Vehicles | 0 (0.0%) | 0 (0.0%) |
| 5 or more Vehicles | 0 (0.0%) | 0 (0.0%) |
| Total | 11 (100.0%) | 7 (100.0%) |
Commute Time in South Acomita Village
The most frequently occuring commute durations in South Acomita Village are 5 to 9 minutes (13 commuters, 72.2%), 45 to 59 minutes (5 commuters, 27.8%), and less than 5 minutes (0 commuters, 0.0%).
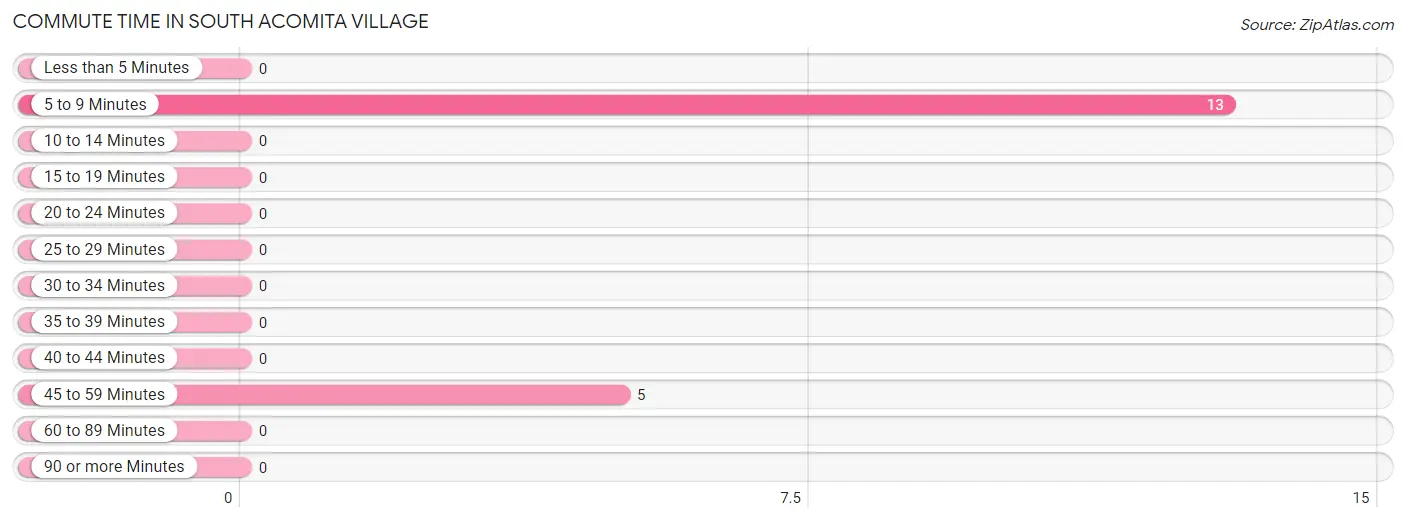
| Commute Time | # Commuters | % Commuters |
| Less than 5 Minutes | 0 | 0.0% |
| 5 to 9 Minutes | 13 | 72.2% |
| 10 to 14 Minutes | 0 | 0.0% |
| 15 to 19 Minutes | 0 | 0.0% |
| 20 to 24 Minutes | 0 | 0.0% |
| 25 to 29 Minutes | 0 | 0.0% |
| 30 to 34 Minutes | 0 | 0.0% |
| 35 to 39 Minutes | 0 | 0.0% |
| 40 to 44 Minutes | 0 | 0.0% |
| 45 to 59 Minutes | 5 | 27.8% |
| 60 to 89 Minutes | 0 | 0.0% |
| 90 or more Minutes | 0 | 0.0% |
Commute Time by Sex in South Acomita Village
The most common commute times in South Acomita Village are 5 to 9 minutes (6 commuters, 54.5%) for males and 5 to 9 minutes (7 commuters, 100.0%) for females.
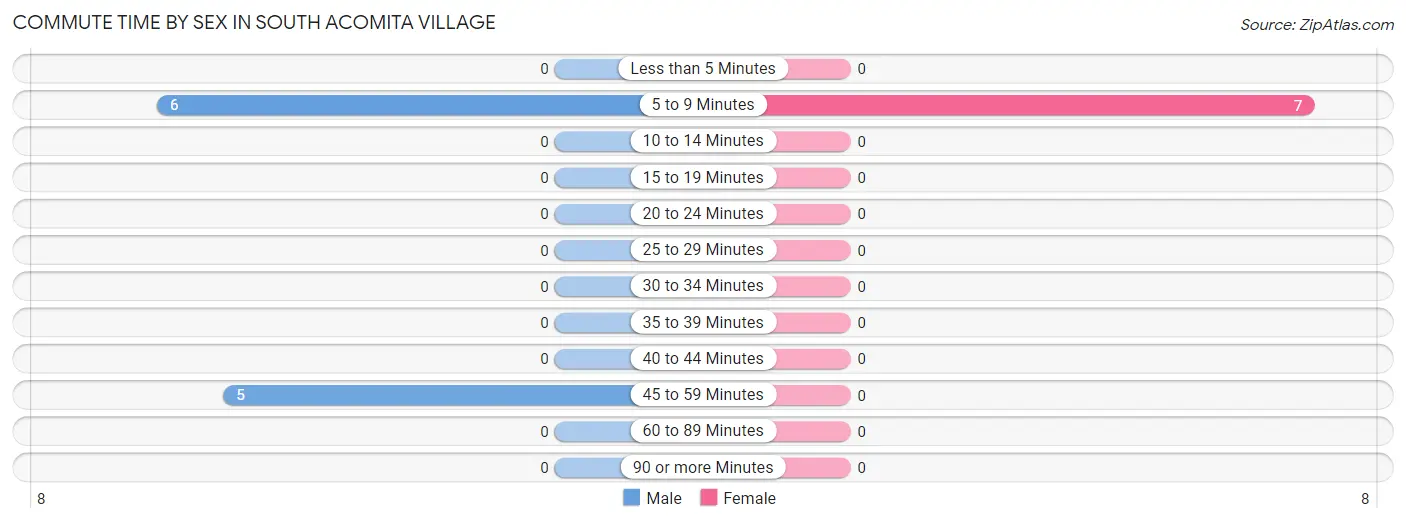
| Commute Time | Male | Female |
| Less than 5 Minutes | 0 (0.0%) | 0 (0.0%) |
| 5 to 9 Minutes | 6 (54.5%) | 7 (100.0%) |
| 10 to 14 Minutes | 0 (0.0%) | 0 (0.0%) |
| 15 to 19 Minutes | 0 (0.0%) | 0 (0.0%) |
| 20 to 24 Minutes | 0 (0.0%) | 0 (0.0%) |
| 25 to 29 Minutes | 0 (0.0%) | 0 (0.0%) |
| 30 to 34 Minutes | 0 (0.0%) | 0 (0.0%) |
| 35 to 39 Minutes | 0 (0.0%) | 0 (0.0%) |
| 40 to 44 Minutes | 0 (0.0%) | 0 (0.0%) |
| 45 to 59 Minutes | 5 (45.5%) | 0 (0.0%) |
| 60 to 89 Minutes | 0 (0.0%) | 0 (0.0%) |
| 90 or more Minutes | 0 (0.0%) | 0 (0.0%) |
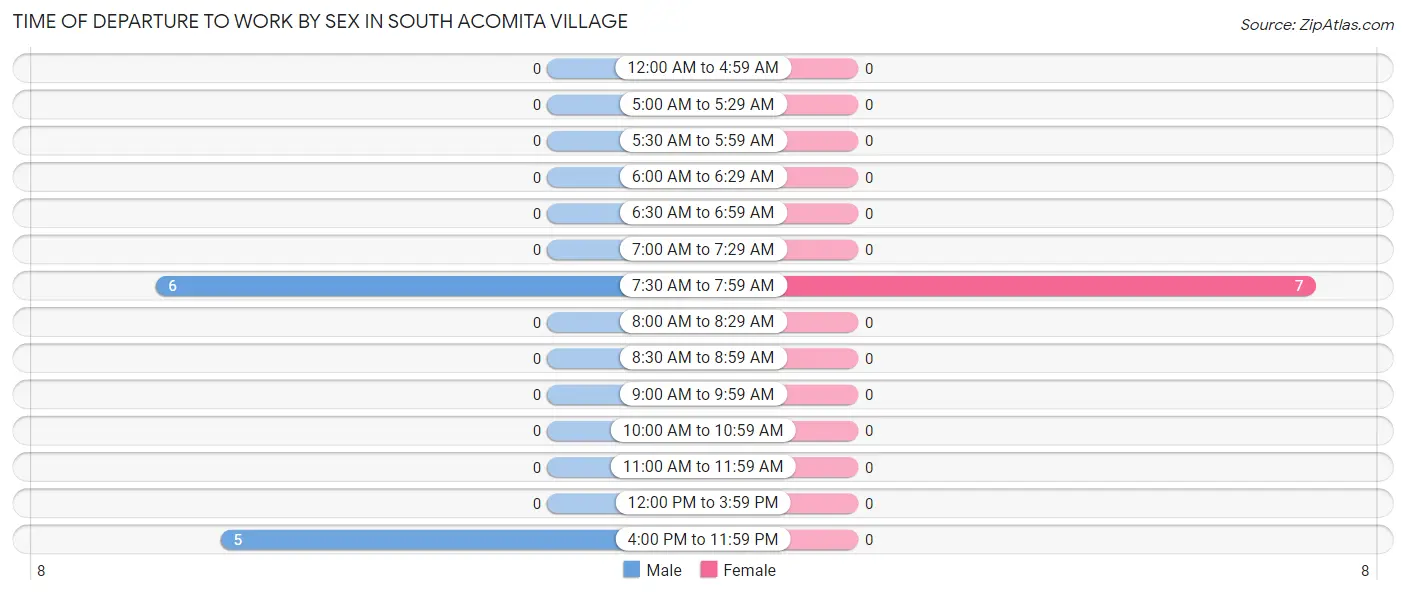
Time of Departure to Work by Sex in South Acomita Village
The most frequent times of departure to work in South Acomita Village are 7:30 AM to 7:59 AM (6, 54.5%) for males and 7:30 AM to 7:59 AM (7, 100.0%) for females.
| Time of Departure | Male | Female |
| 12:00 AM to 4:59 AM | 0 (0.0%) | 0 (0.0%) |
| 5:00 AM to 5:29 AM | 0 (0.0%) | 0 (0.0%) |
| 5:30 AM to 5:59 AM | 0 (0.0%) | 0 (0.0%) |
| 6:00 AM to 6:29 AM | 0 (0.0%) | 0 (0.0%) |
| 6:30 AM to 6:59 AM | 0 (0.0%) | 0 (0.0%) |
| 7:00 AM to 7:29 AM | 0 (0.0%) | 0 (0.0%) |
| 7:30 AM to 7:59 AM | 6 (54.5%) | 7 (100.0%) |
| 8:00 AM to 8:29 AM | 0 (0.0%) | 0 (0.0%) |
| 8:30 AM to 8:59 AM | 0 (0.0%) | 0 (0.0%) |
| 9:00 AM to 9:59 AM | 0 (0.0%) | 0 (0.0%) |
| 10:00 AM to 10:59 AM | 0 (0.0%) | 0 (0.0%) |
| 11:00 AM to 11:59 AM | 0 (0.0%) | 0 (0.0%) |
| 12:00 PM to 3:59 PM | 0 (0.0%) | 0 (0.0%) |
| 4:00 PM to 11:59 PM | 5 (45.5%) | 0 (0.0%) |
| Total | 11 (100.0%) | 7 (100.0%) |
Housing Occupancy in South Acomita Village
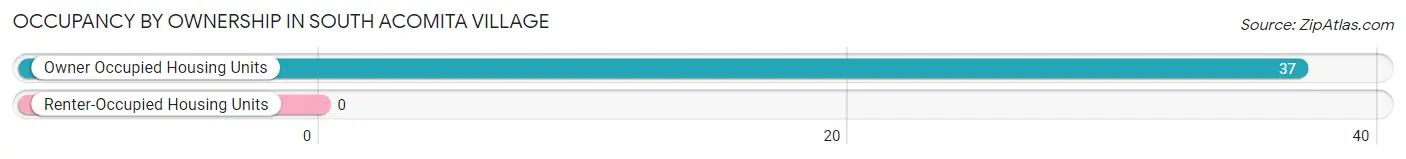
Occupancy by Ownership in South Acomita Village
Of the total 37 dwellings in South Acomita Village, owner-occupied units account for 37 (100.0%), while renter-occupied units make up 0 (0.0%).
| Occupancy | # Housing Units | % Housing Units |
| Owner Occupied Housing Units | 37 | 100.0% |
| Renter-Occupied Housing Units | 0 | 0.0% |
| Total Occupied Housing Units | 37 | 100.0% |
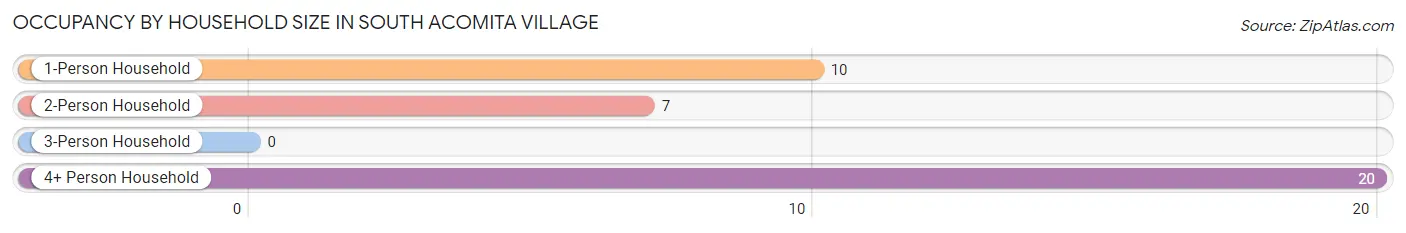
Occupancy by Household Size in South Acomita Village
| Household Size | # Housing Units | % Housing Units |
| 1-Person Household | 10 | 27.0% |
| 2-Person Household | 7 | 18.9% |
| 3-Person Household | 0 | 0.0% |
| 4+ Person Household | 20 | 54.0% |
| Total Housing Units | 37 | 100.0% |
Occupancy by Ownership by Household Size in South Acomita Village
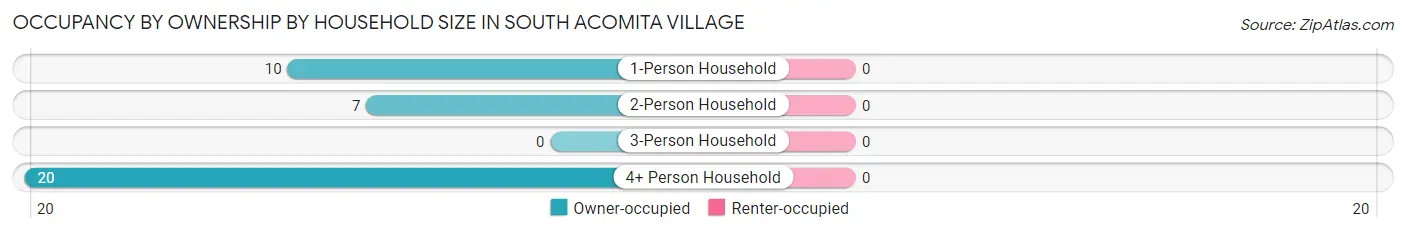
| Household Size | Owner-occupied | Renter-occupied |
| 1-Person Household | 10 (100.0%) | 0 (0.0%) |
| 2-Person Household | 7 (100.0%) | 0 (0.0%) |
| 3-Person Household | 0 (0.0%) | 0 (0.0%) |
| 4+ Person Household | 20 (100.0%) | 0 (0.0%) |
| Total Housing Units | 37 (100.0%) | 0 (0.0%) |
Occupancy by Educational Attainment in South Acomita Village
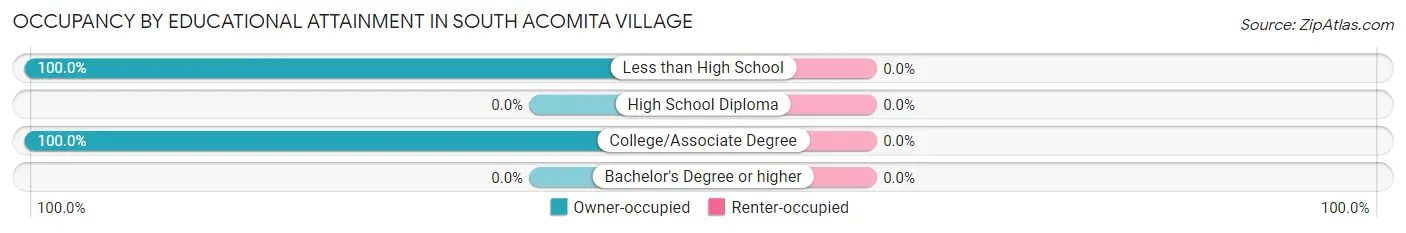
| Household Size | Owner-occupied | Renter-occupied |
| Less than High School | 19 (100.0%) | 0 (0.0%) |
| High School Diploma | 0 (0.0%) | 0 (0.0%) |
| College/Associate Degree | 18 (100.0%) | 0 (0.0%) |
| Bachelor's Degree or higher | 0 (0.0%) | 0 (0.0%) |
Occupancy by Age of Householder in South Acomita Village
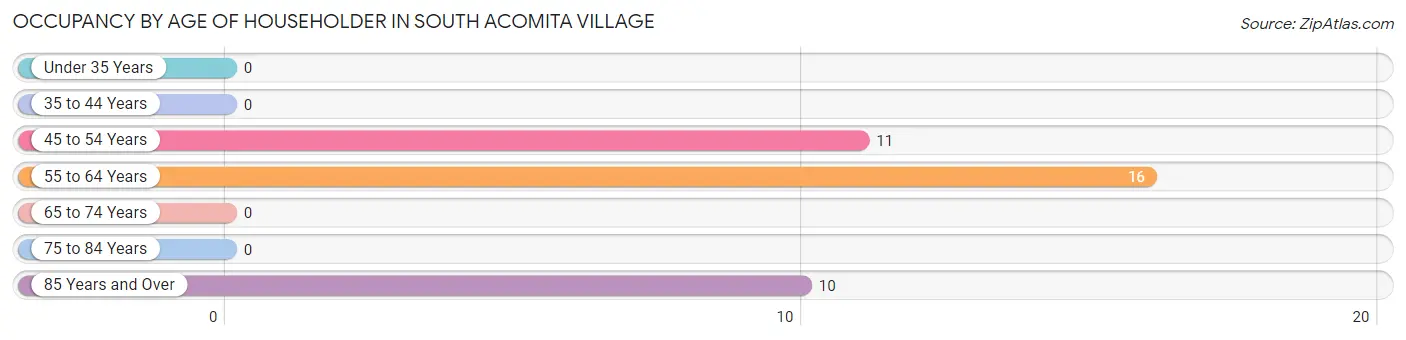
| Age Bracket | # Households | % Households |
| Under 35 Years | 0 | 0.0% |
| 35 to 44 Years | 0 | 0.0% |
| 45 to 54 Years | 11 | 29.7% |
| 55 to 64 Years | 16 | 43.2% |
| 65 to 74 Years | 0 | 0.0% |
| 75 to 84 Years | 0 | 0.0% |
| 85 Years and Over | 10 | 27.0% |
| Total | 37 | 100.0% |
Housing Finances in South Acomita Village
Median Income by Occupancy in South Acomita Village
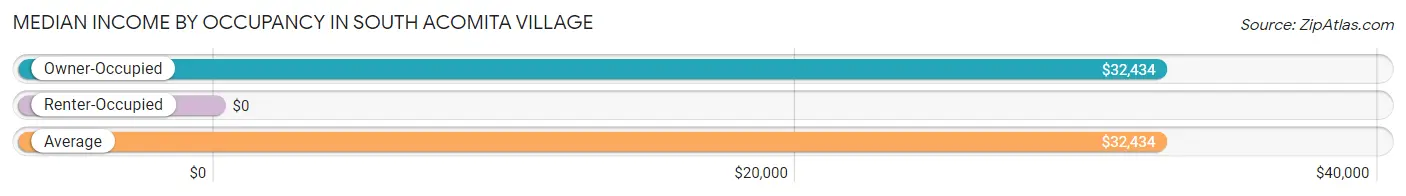
| Occupancy Type | # Households | Median Income |
| Owner-Occupied | 37 (100.0%) | $32,434 |
| Renter-Occupied | 0 (0.0%) | $0 |
| Average | 37 (100.0%) | $32,434 |
Occupancy by Householder Income Bracket in South Acomita Village
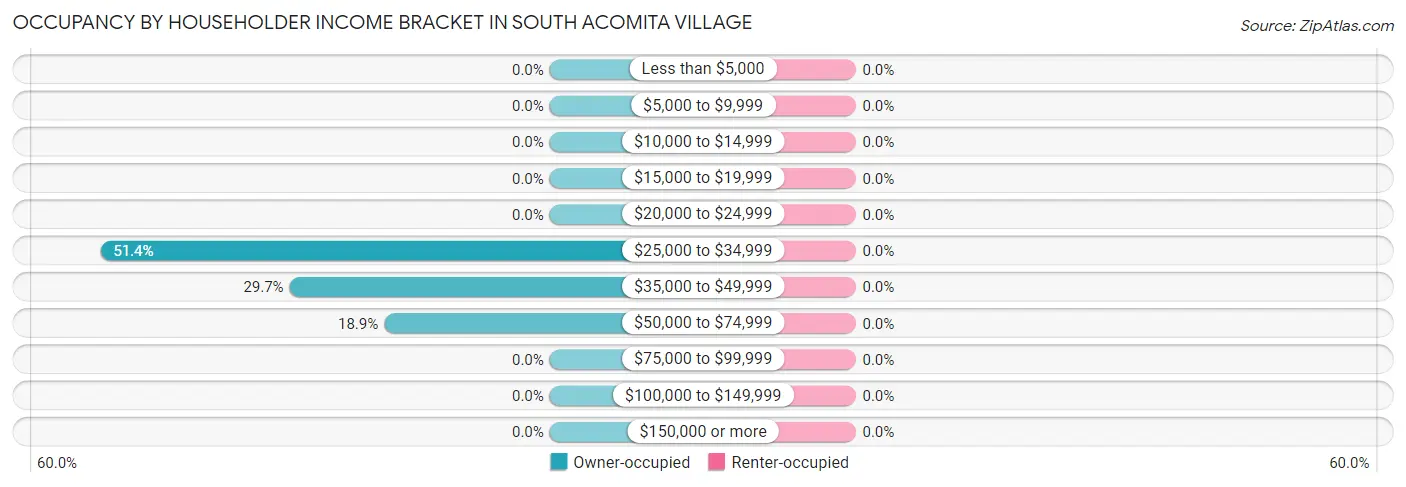
| Income Bracket | Owner-occupied | Renter-occupied |
| Less than $5,000 | 0 (0.0%) | 0 (0.0%) |
| $5,000 to $9,999 | 0 (0.0%) | 0 (0.0%) |
| $10,000 to $14,999 | 0 (0.0%) | 0 (0.0%) |
| $15,000 to $19,999 | 0 (0.0%) | 0 (0.0%) |
| $20,000 to $24,999 | 0 (0.0%) | 0 (0.0%) |
| $25,000 to $34,999 | 19 (51.3%) | 0 (0.0%) |
| $35,000 to $49,999 | 11 (29.7%) | 0 (0.0%) |
| $50,000 to $74,999 | 7 (18.9%) | 0 (0.0%) |
| $75,000 to $99,999 | 0 (0.0%) | 0 (0.0%) |
| $100,000 to $149,999 | 0 (0.0%) | 0 (0.0%) |
| $150,000 or more | 0 (0.0%) | 0 (0.0%) |
| Total | 37 (100.0%) | 0 (0.0%) |
Monthly Housing Cost Tiers in South Acomita Village
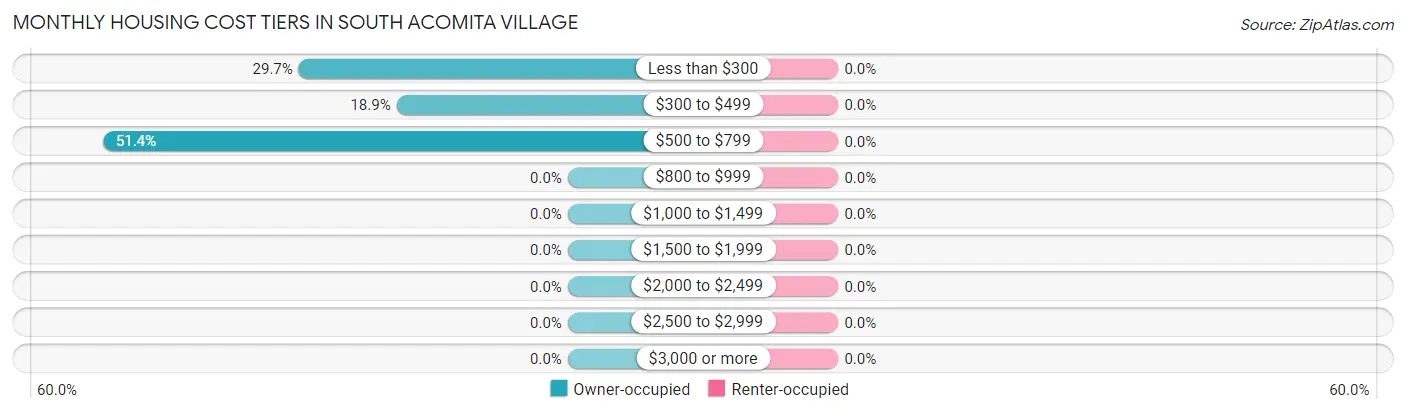
| Monthly Cost | Owner-occupied | Renter-occupied |
| Less than $300 | 11 (29.7%) | 0 (0.0%) |
| $300 to $499 | 7 (18.9%) | 0 (0.0%) |
| $500 to $799 | 19 (51.3%) | 0 (0.0%) |
| $800 to $999 | 0 (0.0%) | 0 (0.0%) |
| $1,000 to $1,499 | 0 (0.0%) | 0 (0.0%) |
| $1,500 to $1,999 | 0 (0.0%) | 0 (0.0%) |
| $2,000 to $2,499 | 0 (0.0%) | 0 (0.0%) |
| $2,500 to $2,999 | 0 (0.0%) | 0 (0.0%) |
| $3,000 or more | 0 (0.0%) | 0 (0.0%) |
| Total | 37 (100.0%) | 0 (0.0%) |
Physical Housing Characteristics in South Acomita Village
Housing Structures in South Acomita Village
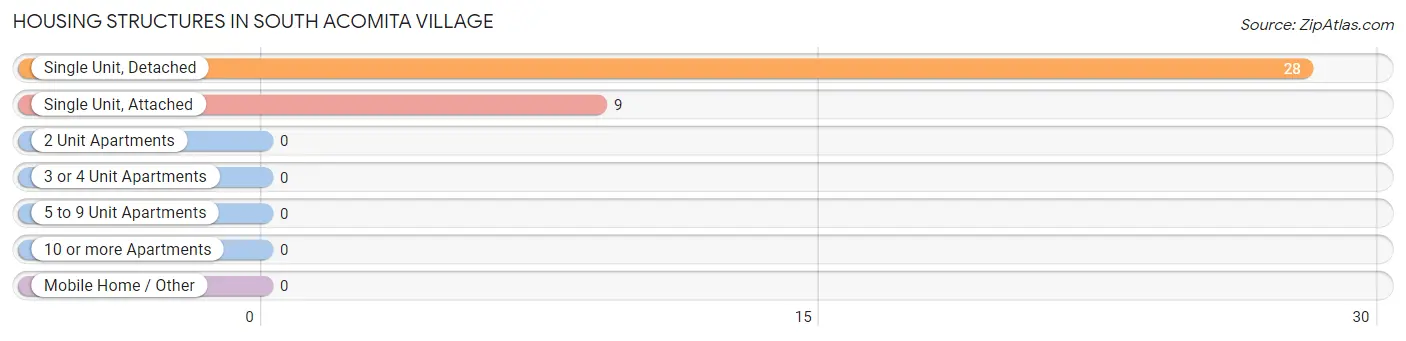
| Structure Type | # Housing Units | % Housing Units |
| Single Unit, Detached | 28 | 75.7% |
| Single Unit, Attached | 9 | 24.3% |
| 2 Unit Apartments | 0 | 0.0% |
| 3 or 4 Unit Apartments | 0 | 0.0% |
| 5 to 9 Unit Apartments | 0 | 0.0% |
| 10 or more Apartments | 0 | 0.0% |
| Mobile Home / Other | 0 | 0.0% |
| Total | 37 | 100.0% |
Housing Structures by Occupancy in South Acomita Village
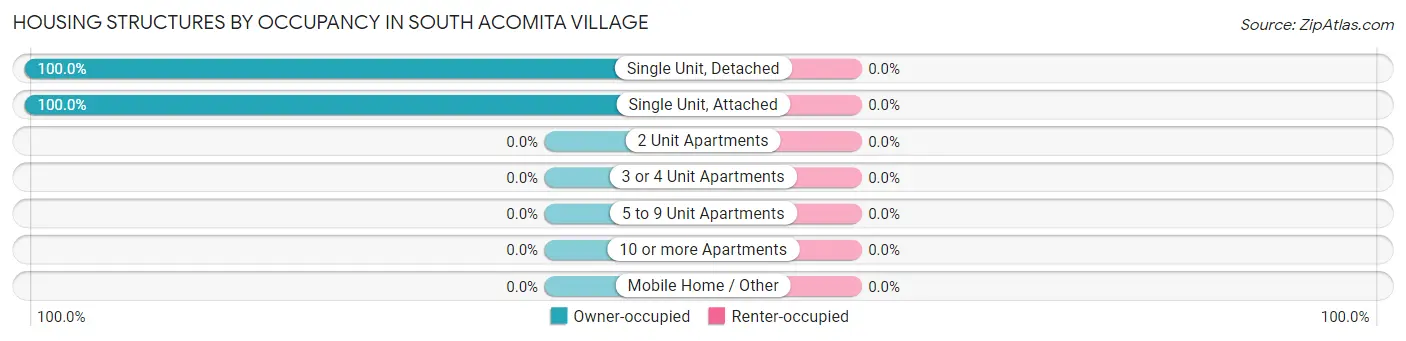
| Structure Type | Owner-occupied | Renter-occupied |
| Single Unit, Detached | 28 (100.0%) | 0 (0.0%) |
| Single Unit, Attached | 9 (100.0%) | 0 (0.0%) |
| 2 Unit Apartments | 0 (0.0%) | 0 (0.0%) |
| 3 or 4 Unit Apartments | 0 (0.0%) | 0 (0.0%) |
| 5 to 9 Unit Apartments | 0 (0.0%) | 0 (0.0%) |
| 10 or more Apartments | 0 (0.0%) | 0 (0.0%) |
| Mobile Home / Other | 0 (0.0%) | 0 (0.0%) |
| Total | 37 (100.0%) | 0 (0.0%) |
Housing Structures by Number of Rooms in South Acomita Village
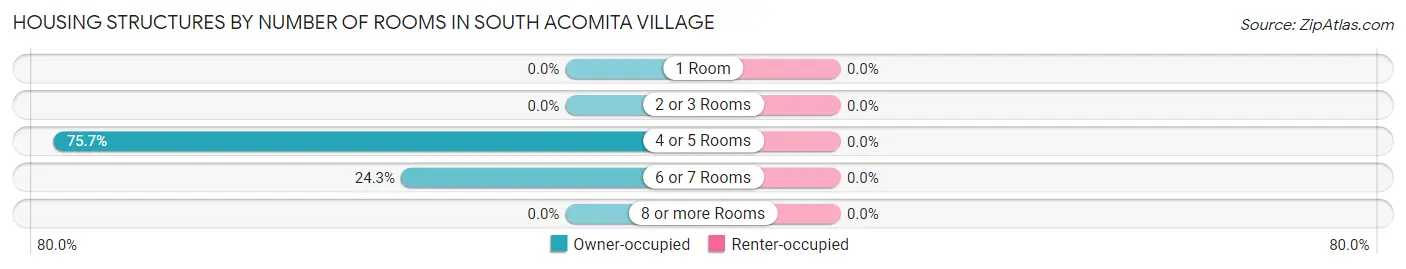
| Number of Rooms | Owner-occupied | Renter-occupied |
| 1 Room | 0 (0.0%) | 0 (0.0%) |
| 2 or 3 Rooms | 0 (0.0%) | 0 (0.0%) |
| 4 or 5 Rooms | 28 (75.7%) | 0 (0.0%) |
| 6 or 7 Rooms | 9 (24.3%) | 0 (0.0%) |
| 8 or more Rooms | 0 (0.0%) | 0 (0.0%) |
| Total | 37 (100.0%) | 0 (0.0%) |
Housing Structure by Heating Type in South Acomita Village
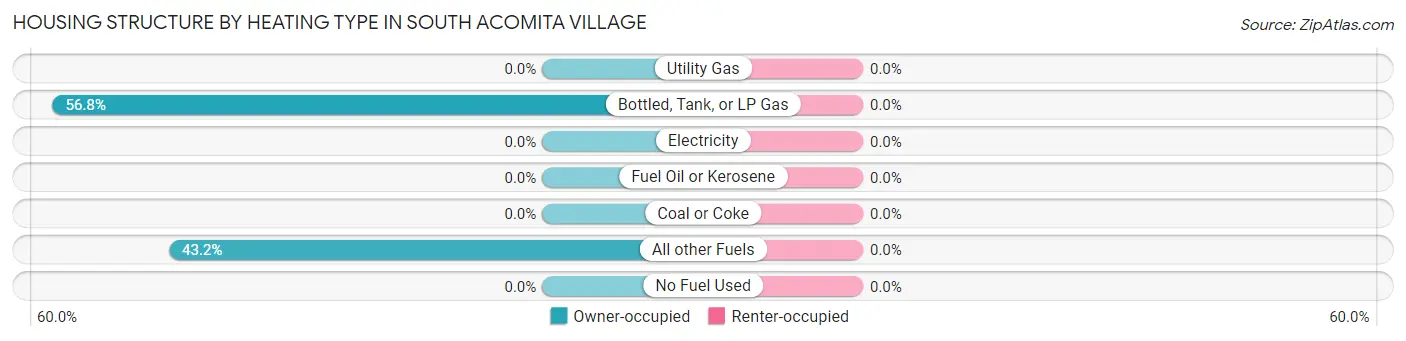
| Heating Type | Owner-occupied | Renter-occupied |
| Utility Gas | 0 (0.0%) | 0 (0.0%) |
| Bottled, Tank, or LP Gas | 21 (56.8%) | 0 (0.0%) |
| Electricity | 0 (0.0%) | 0 (0.0%) |
| Fuel Oil or Kerosene | 0 (0.0%) | 0 (0.0%) |
| Coal or Coke | 0 (0.0%) | 0 (0.0%) |
| All other Fuels | 16 (43.2%) | 0 (0.0%) |
| No Fuel Used | 0 (0.0%) | 0 (0.0%) |
| Total | 37 (100.0%) | 0 (0.0%) |
Household Vehicle Usage in South Acomita Village
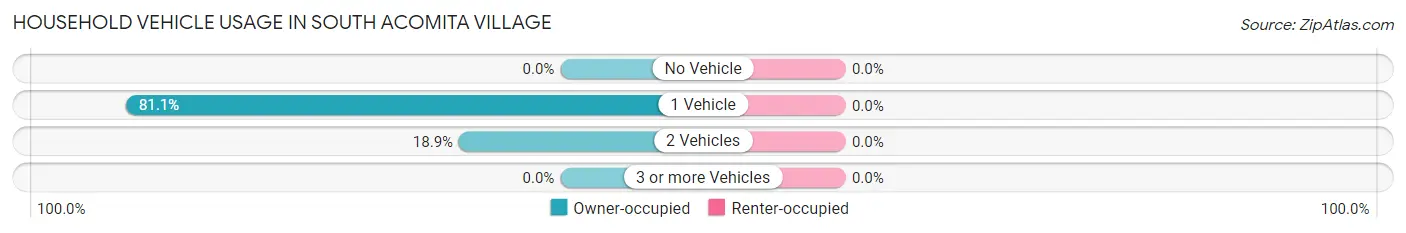
| Vehicles per Household | Owner-occupied | Renter-occupied |
| No Vehicle | 0 (0.0%) | 0 (0.0%) |
| 1 Vehicle | 30 (81.1%) | 0 (0.0%) |
| 2 Vehicles | 7 (18.9%) | 0 (0.0%) |
| 3 or more Vehicles | 0 (0.0%) | 0 (0.0%) |
| Total | 37 (100.0%) | 0 (0.0%) |
Real Estate & Mortgages in South Acomita Village
Real Estate and Mortgage Overview in South Acomita Village
| Characteristic | Without Mortgage | With Mortgage |
| Housing Units | 37 | 0 |
| Median Property Value | $113,200 | $0 |
| Median Household Income | $32,434 | $0 |
| Monthly Housing Costs | $505 | $0 |
| Real Estate Taxes | - | - |
Property Value by Mortgage Status in South Acomita Village
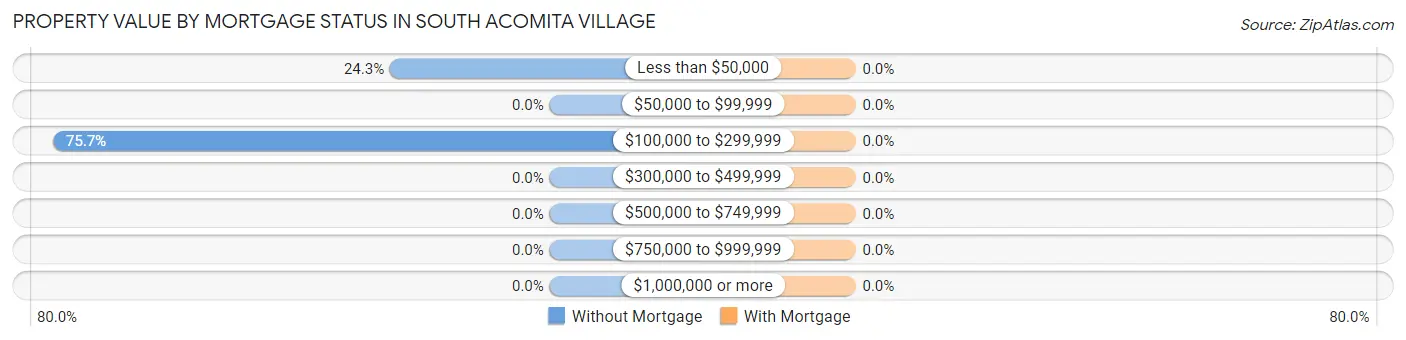
| Property Value | Without Mortgage | With Mortgage |
| Less than $50,000 | 9 (24.3%) | 0 (0.0%) |
| $50,000 to $99,999 | 0 (0.0%) | 0 (0.0%) |
| $100,000 to $299,999 | 28 (75.7%) | 0 (0.0%) |
| $300,000 to $499,999 | 0 (0.0%) | 0 (0.0%) |
| $500,000 to $749,999 | 0 (0.0%) | 0 (0.0%) |
| $750,000 to $999,999 | 0 (0.0%) | 0 (0.0%) |
| $1,000,000 or more | 0 (0.0%) | 0 (0.0%) |
| Total | 37 (100.0%) | 0 (0.0%) |
Household Income by Mortgage Status in South Acomita Village
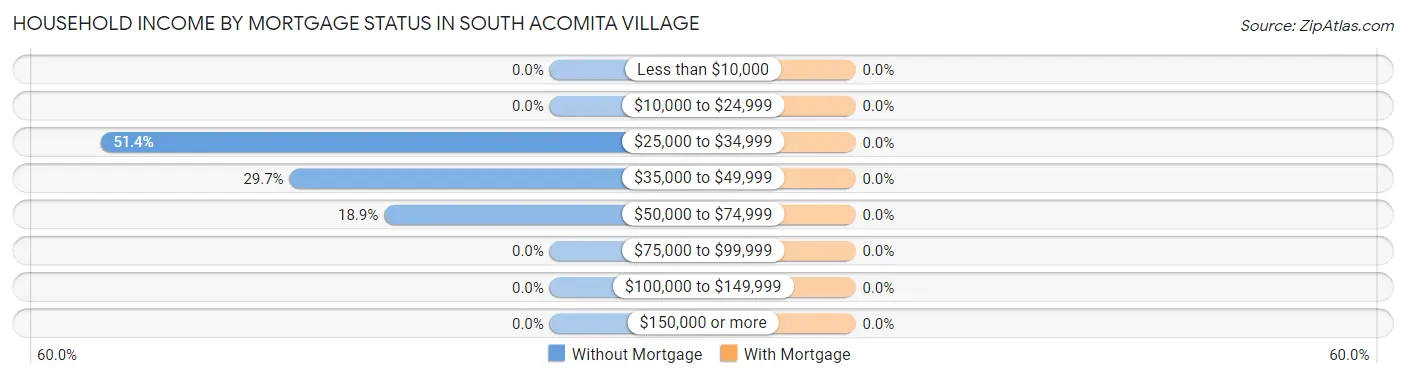
| Household Income | Without Mortgage | With Mortgage |
| Less than $10,000 | 0 (0.0%) | 0 (0.0%) |
| $10,000 to $24,999 | 0 (0.0%) | 0 (0.0%) |
| $25,000 to $34,999 | 19 (51.3%) | 0 (0.0%) |
| $35,000 to $49,999 | 11 (29.7%) | 0 (0.0%) |
| $50,000 to $74,999 | 7 (18.9%) | 0 (0.0%) |
| $75,000 to $99,999 | 0 (0.0%) | 0 (0.0%) |
| $100,000 to $149,999 | 0 (0.0%) | 0 (0.0%) |
| $150,000 or more | 0 (0.0%) | 0 (0.0%) |
| Total | 37 (100.0%) | 0 (0.0%) |
Property Value to Household Income Ratio in South Acomita Village
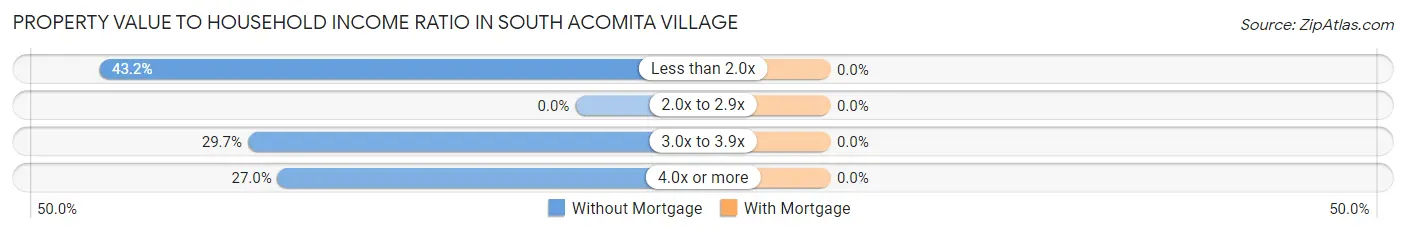
| Value-to-Income Ratio | Without Mortgage | With Mortgage |
| Less than 2.0x | 16 (43.2%) | 0 (0.0%) |
| 2.0x to 2.9x | 0 (0.0%) | 0 (0.0%) |
| 3.0x to 3.9x | 11 (29.7%) | 0 (0.0%) |
| 4.0x or more | 10 (27.0%) | 0 (0.0%) |
| Total | 37 (100.0%) | 0 (0.0%) |
Real Estate Taxes by Mortgage Status in South Acomita Village
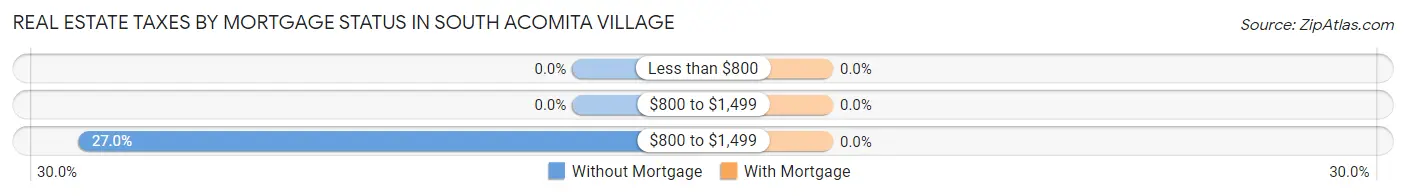
| Property Taxes | Without Mortgage | With Mortgage |
| Less than $800 | 0 (0.0%) | 0 (0.0%) |
| $800 to $1,499 | 0 (0.0%) | 0 (0.0%) |
| $800 to $1,499 | 10 (27.0%) | 0 (0.0%) |
| Total | 37 (100.0%) | 0 (0.0%) |
Health & Disability in South Acomita Village
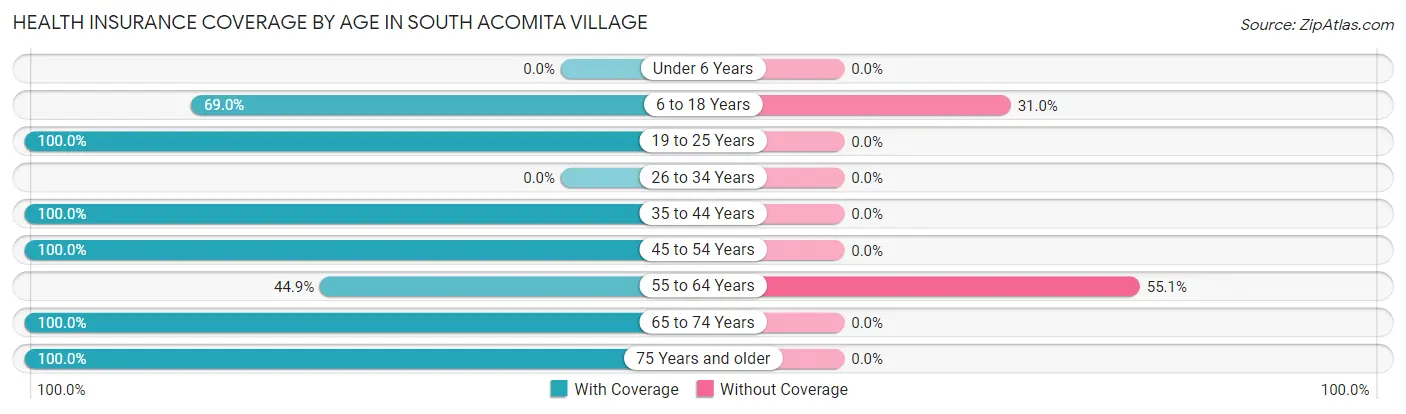
Health Insurance Coverage by Age in South Acomita Village
| Age Bracket | With Coverage | Without Coverage |
| Under 6 Years | 0 (0.0%) | 0 (0.0%) |
| 6 to 18 Years | 20 (69.0%) | 9 (31.0%) |
| 19 to 25 Years | 9 (100.0%) | 0 (0.0%) |
| 26 to 34 Years | 0 (0.0%) | 0 (0.0%) |
| 35 to 44 Years | 5 (100.0%) | 0 (0.0%) |
| 45 to 54 Years | 11 (100.0%) | 0 (0.0%) |
| 55 to 64 Years | 22 (44.9%) | 27 (55.1%) |
| 65 to 74 Years | 12 (100.0%) | 0 (0.0%) |
| 75 Years and older | 10 (100.0%) | 0 (0.0%) |
| Total | 89 (71.2%) | 36 (28.8%) |
Health Insurance Coverage by Citizenship Status in South Acomita Village
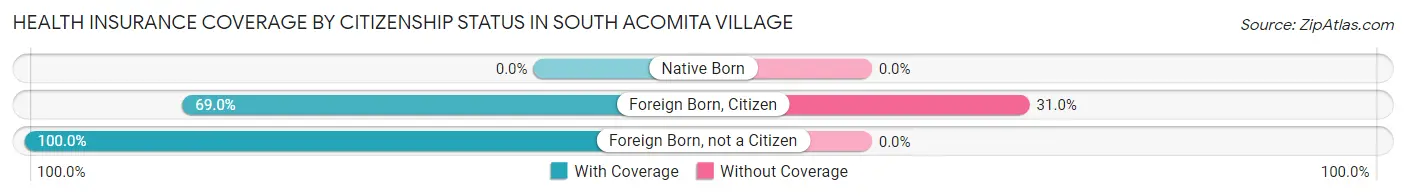
| Citizenship Status | With Coverage | Without Coverage |
| Native Born | 0 (0.0%) | 0 (0.0%) |
| Foreign Born, Citizen | 20 (69.0%) | 9 (31.0%) |
| Foreign Born, not a Citizen | 9 (100.0%) | 0 (0.0%) |
Health Insurance Coverage by Household Income in South Acomita Village
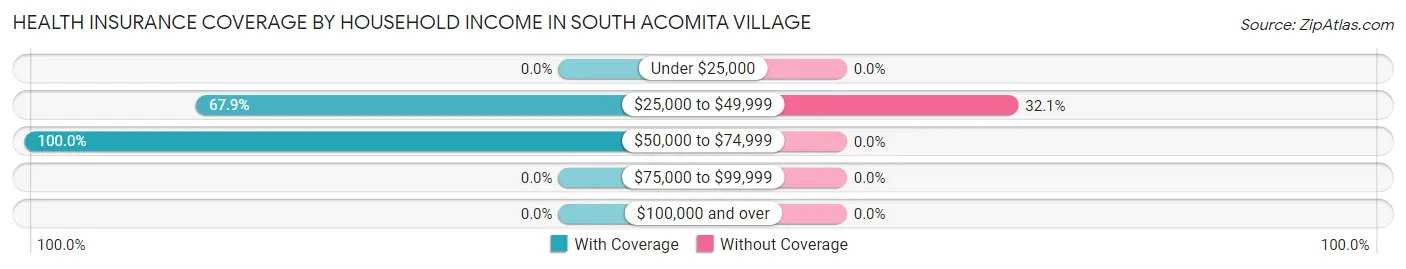
| Household Income | With Coverage | Without Coverage |
| Under $25,000 | 0 (0.0%) | 0 (0.0%) |
| $25,000 to $49,999 | 76 (67.9%) | 36 (32.1%) |
| $50,000 to $74,999 | 13 (100.0%) | 0 (0.0%) |
| $75,000 to $99,999 | 0 (0.0%) | 0 (0.0%) |
| $100,000 and over | 0 (0.0%) | 0 (0.0%) |
Public vs Private Health Insurance Coverage by Age in South Acomita Village
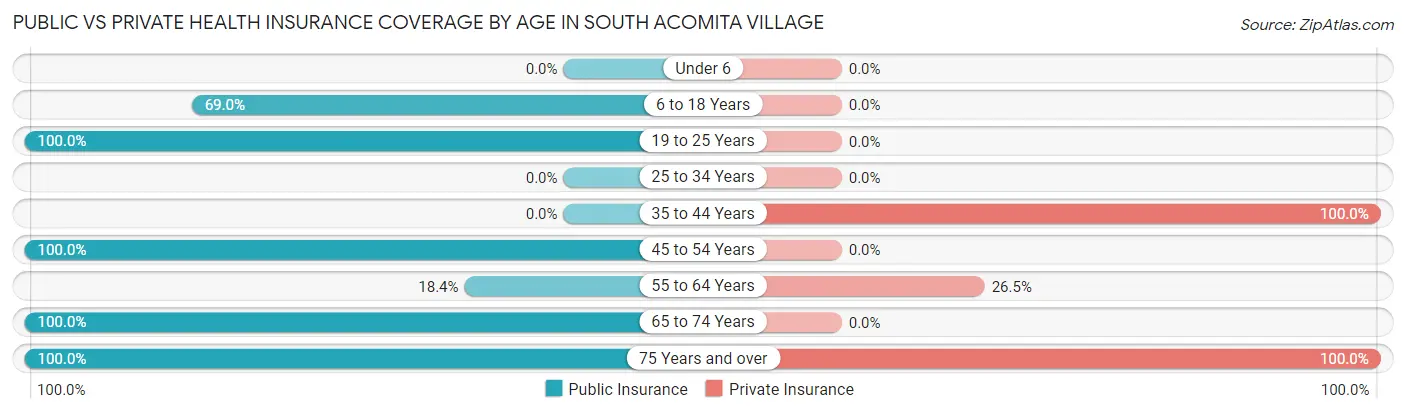
| Age Bracket | Public Insurance | Private Insurance |
| Under 6 | 0 (0.0%) | 0 (0.0%) |
| 6 to 18 Years | 20 (69.0%) | 0 (0.0%) |
| 19 to 25 Years | 9 (100.0%) | 0 (0.0%) |
| 25 to 34 Years | 0 (0.0%) | 0 (0.0%) |
| 35 to 44 Years | 0 (0.0%) | 5 (100.0%) |
| 45 to 54 Years | 11 (100.0%) | 0 (0.0%) |
| 55 to 64 Years | 9 (18.4%) | 13 (26.5%) |
| 65 to 74 Years | 12 (100.0%) | 0 (0.0%) |
| 75 Years and over | 10 (100.0%) | 10 (100.0%) |
| Total | 71 (56.8%) | 28 (22.4%) |
Disability Status by Sex by Age in South Acomita Village
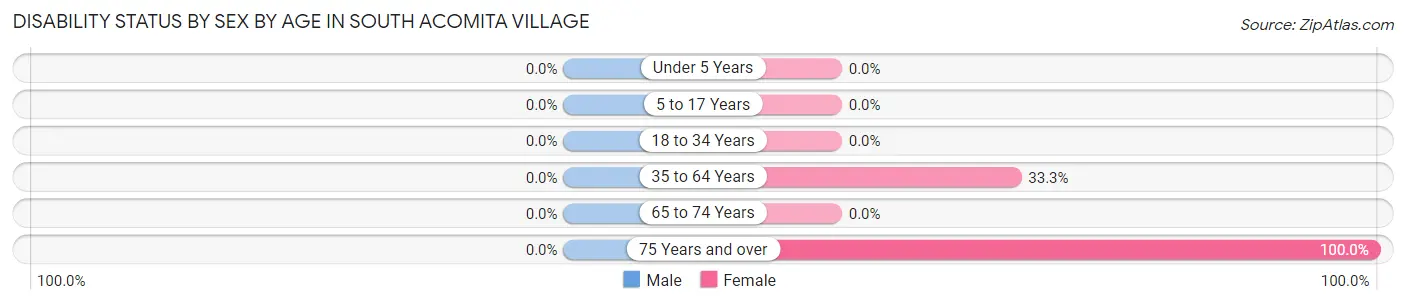
| Age Bracket | Male | Female |
| Under 5 Years | 0 (0.0%) | 0 (0.0%) |
| 5 to 17 Years | 0 (0.0%) | 0 (0.0%) |
| 18 to 34 Years | 0 (0.0%) | 0 (0.0%) |
| 35 to 64 Years | 0 (0.0%) | 9 (33.3%) |
| 65 to 74 Years | 0 (0.0%) | 0 (0.0%) |
| 75 Years and over | 0 (0.0%) | 10 (100.0%) |
Disability Class by Sex by Age in South Acomita Village
Disability Class: Hearing Difficulty
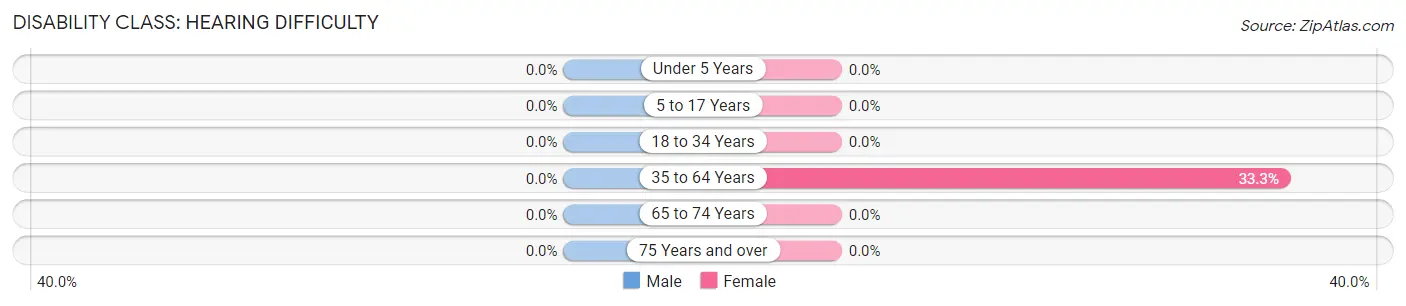
| Age Bracket | Male | Female |
| Under 5 Years | 0 (0.0%) | 0 (0.0%) |
| 5 to 17 Years | 0 (0.0%) | 0 (0.0%) |
| 18 to 34 Years | 0 (0.0%) | 0 (0.0%) |
| 35 to 64 Years | 0 (0.0%) | 9 (33.3%) |
| 65 to 74 Years | 0 (0.0%) | 0 (0.0%) |
| 75 Years and over | 0 (0.0%) | 0 (0.0%) |
Disability Class: Vision Difficulty
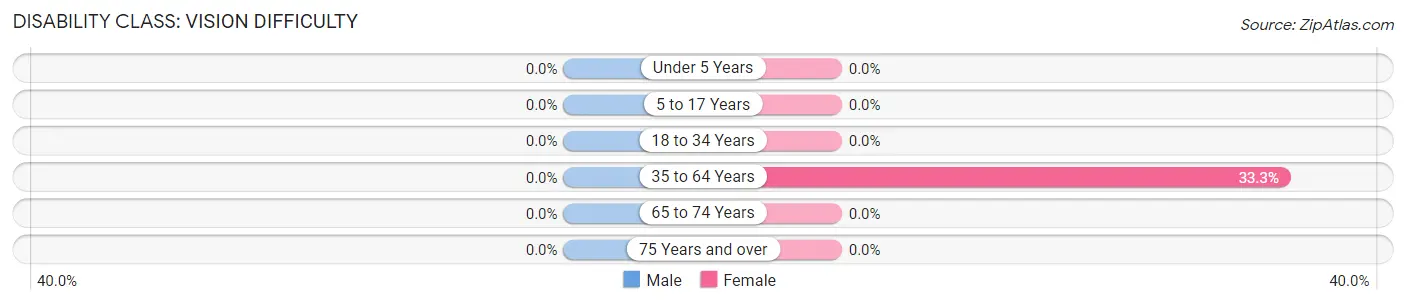
| Age Bracket | Male | Female |
| Under 5 Years | 0 (0.0%) | 0 (0.0%) |
| 5 to 17 Years | 0 (0.0%) | 0 (0.0%) |
| 18 to 34 Years | 0 (0.0%) | 0 (0.0%) |
| 35 to 64 Years | 0 (0.0%) | 9 (33.3%) |
| 65 to 74 Years | 0 (0.0%) | 0 (0.0%) |
| 75 Years and over | 0 (0.0%) | 0 (0.0%) |
Disability Class: Cognitive Difficulty
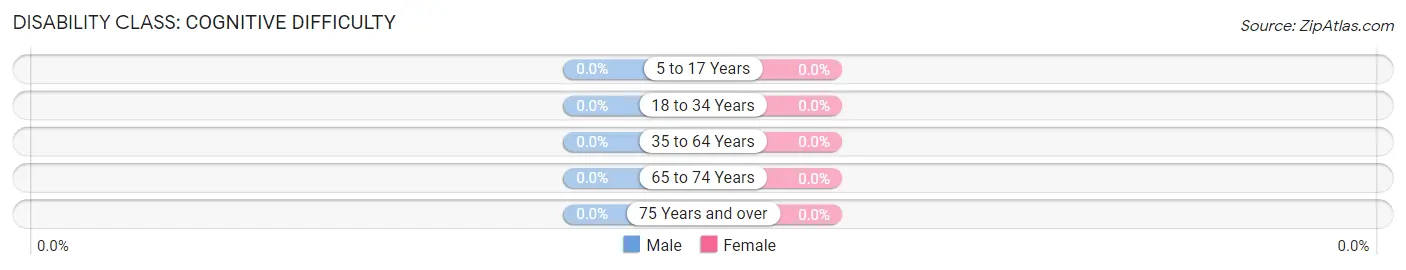
| Age Bracket | Male | Female |
| 5 to 17 Years | 0 (0.0%) | 0 (0.0%) |
| 18 to 34 Years | 0 (0.0%) | 0 (0.0%) |
| 35 to 64 Years | 0 (0.0%) | 0 (0.0%) |
| 65 to 74 Years | 0 (0.0%) | 0 (0.0%) |
| 75 Years and over | 0 (0.0%) | 0 (0.0%) |
Disability Class: Ambulatory Difficulty
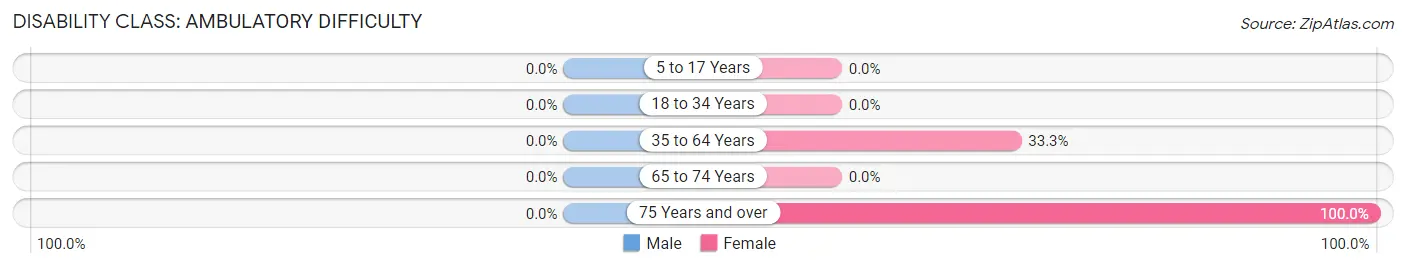
| Age Bracket | Male | Female |
| 5 to 17 Years | 0 (0.0%) | 0 (0.0%) |
| 18 to 34 Years | 0 (0.0%) | 0 (0.0%) |
| 35 to 64 Years | 0 (0.0%) | 9 (33.3%) |
| 65 to 74 Years | 0 (0.0%) | 0 (0.0%) |
| 75 Years and over | 0 (0.0%) | 10 (100.0%) |
Disability Class: Self-Care Difficulty
| Age Bracket | Male | Female |
| 5 to 17 Years | 0 (0.0%) | 0 (0.0%) |
| 18 to 34 Years | 0 (0.0%) | 0 (0.0%) |
| 35 to 64 Years | 0 (0.0%) | 0 (0.0%) |
| 65 to 74 Years | 0 (0.0%) | 0 (0.0%) |
| 75 Years and over | 0 (0.0%) | 0 (0.0%) |
Technology Access in South Acomita Village
Computing Device Access in South Acomita Village
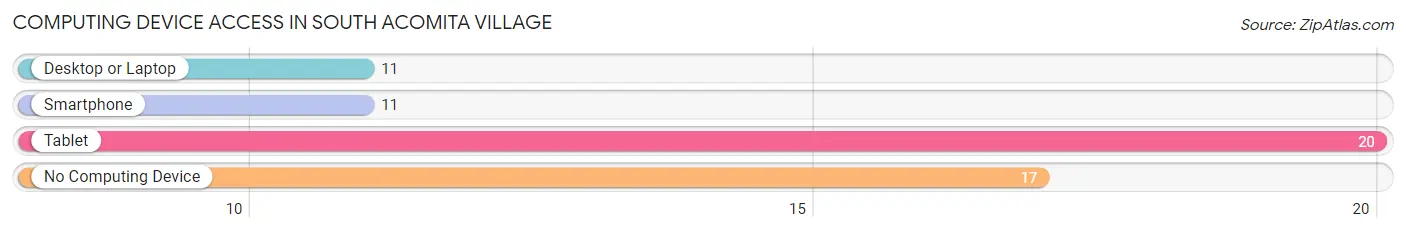
| Device Type | # Households | % Households |
| Desktop or Laptop | 11 | 29.7% |
| Smartphone | 11 | 29.7% |
| Tablet | 20 | 54.0% |
| No Computing Device | 17 | 46.0% |
| Total | 37 | 100.0% |
Internet Access in South Acomita Village
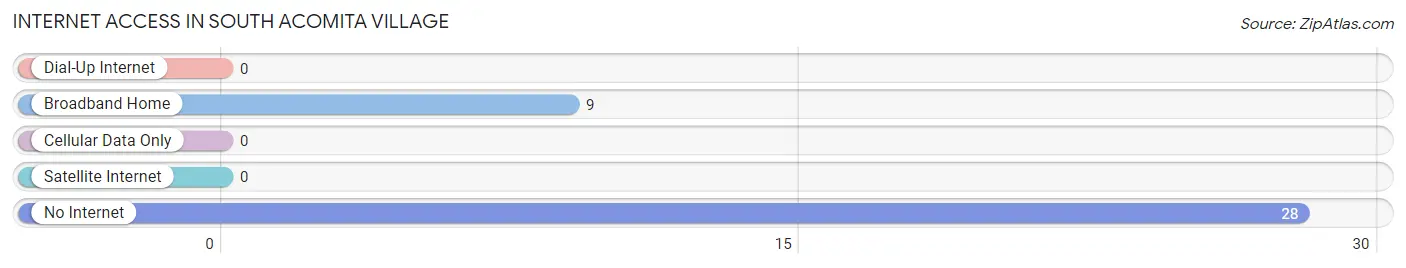
| Internet Type | # Households | % Households |
| Dial-Up Internet | 0 | 0.0% |
| Broadband Home | 9 | 24.3% |
| Cellular Data Only | 0 | 0.0% |
| Satellite Internet | 0 | 0.0% |
| No Internet | 28 | 75.7% |
| Total | 37 | 100.0% |
South Acomita Village Summary
South Acomita Village is a small unincorporated community located in Cibola County, New Mexico. It is situated on the eastern side of the Acoma Pueblo, a Native American reservation. The village is home to approximately 1,000 people, most of whom are members of the Acoma Pueblo.
Geography
South Acomita Village is located in the western part of Cibola County, New Mexico. It is situated on the eastern side of the Acoma Pueblo, a Native American reservation. The village is located at an elevation of 5,890 feet (1,795 m). The area is characterized by a semi-arid climate, with hot summers and cold winters. The average annual precipitation is approximately 11 inches (279 mm).
Economy
The economy of South Acomita Village is largely based on tourism and agriculture. The village is home to several tourist attractions, including the Acoma Cultural Center, the Acoma Sky City, and the Acoma Pueblo Museum. The village also has a number of small businesses, including restaurants, convenience stores, and gift shops. Agriculture is also an important part of the local economy, with the main crops being corn, beans, squash, and melons.
Demographics
As of the 2010 census, South Acomita Village had a population of 1,000 people. The racial makeup of the village was 95.2% Native American, 2.2% White, 0.2% African American, 0.2% Asian, 0.2% Pacific Islander, and 1.2% from other races. The median household income was $20,000, and the median family income was $25,000.
History
South Acomita Village was established in the late 19th century by members of the Acoma Pueblo. The village was originally a small farming community, but it has since grown to become a popular tourist destination. The village is home to several historic sites, including the Acoma Cultural Center, the Acoma Sky City, and the Acoma Pueblo Museum. The village is also home to the Acoma Pueblo, which is one of the oldest continuously inhabited communities in the United States.
South Acomita Village is a small but vibrant community that is steeped in history and culture. The village is home to a diverse population of Native Americans, Hispanics, and other ethnicities. The village is a popular tourist destination, and it is home to several historic sites and attractions. The village is also an important part of the local economy, with tourism and agriculture being the main sources of income.
Common Questions
What is Per Capita Income in South Acomita Village?
Per Capita income in South Acomita Village is $11,957.
What is the Median Household income in South Acomita Village?
Median Household Income in South Acomita Village is $32,434.
What is Inequality or Gini Index in South Acomita Village?
Inequality or Gini Index in South Acomita Village is 0.18.
What is the Total Population of South Acomita Village?
Total Population of South Acomita Village is 125.
What is the Total Male Population of South Acomita Village?
Total Male Population of South Acomita Village is 67.
What is the Total Female Population of South Acomita Village?
Total Female Population of South Acomita Village is 58.
What is the Ratio of Males per 100 Females in South Acomita Village?
There are 115.52 Males per 100 Females in South Acomita Village.
What is the Ratio of Females per 100 Males in South Acomita Village?
There are 86.57 Females per 100 Males in South Acomita Village.
What is the Median Population Age in South Acomita Village?
Median Population Age in South Acomita Village is 56.3 Years.
What is the Average Family Size in South Acomita Village
Average Family Size in South Acomita Village is 4.1 People.
What is the Average Household Size in South Acomita Village
Average Household Size in South Acomita Village is 3.4 People.
How Large is the Labor Force in South Acomita Village?
There are 18 People in the Labor Forcein in South Acomita Village.
What is the Percentage of People in the Labor Force in South Acomita Village?
17.1% of People are in the Labor Force in South Acomita Village.