Willard, NM Map & Demographics
Willard Map
Willard Overview
$19,778
PER CAPITA INCOME
0.37
INEQUALITY / GINI INDEX
360
TOTAL POPULATION
225
MALE POPULATION
135
FEMALE POPULATION
166.67
MALES / 100 FEMALES
60.00
FEMALES / 100 MALES
28.8
MEDIAN AGE
4.2
AVG FAMILY SIZE
3.4
AVG HOUSEHOLD SIZE
150
LABOR FORCE [ PEOPLE ]
47.8%
PERCENT IN LABOR FORCE
16.7%
UNEMPLOYMENT RATE
Willard Zip Codes
Willard Area Codes
Income in Willard
Income Overview in Willard
| Characteristic | Number | Measure |
| Per Capita Income | 360 | $19,778 |
| Median Family Income | 77 | $0 |
| Mean Family Income | 77 | $82,179 |
| Median Household Income | 105 | $0 |
| Mean Household Income | 105 | $66,684 |
| Income Deficit | 77 | $0 |
| Wage / Income Gap (%) | 360 | 0.00% |
| Wage / Income Gap ($) | 360 | 100.00¢ per $1 |
| Gini / Inequality Index | 360 | 0.37 |
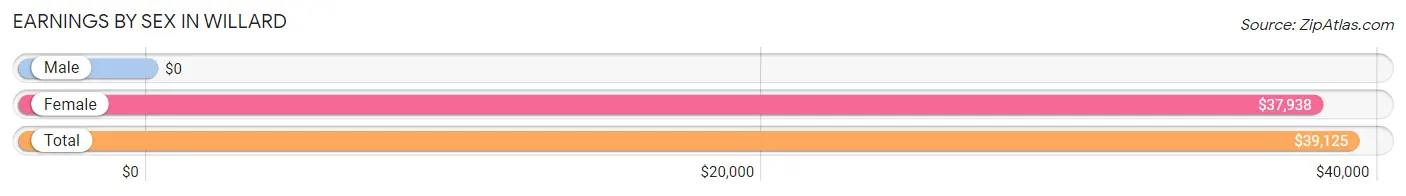
Earnings by Sex in Willard
| Sex | Number | Average Earnings |
| Male | 85 (65.4%) | $0 |
| Female | 45 (34.6%) | $37,938 |
| Total | 130 (100.0%) | $39,125 |
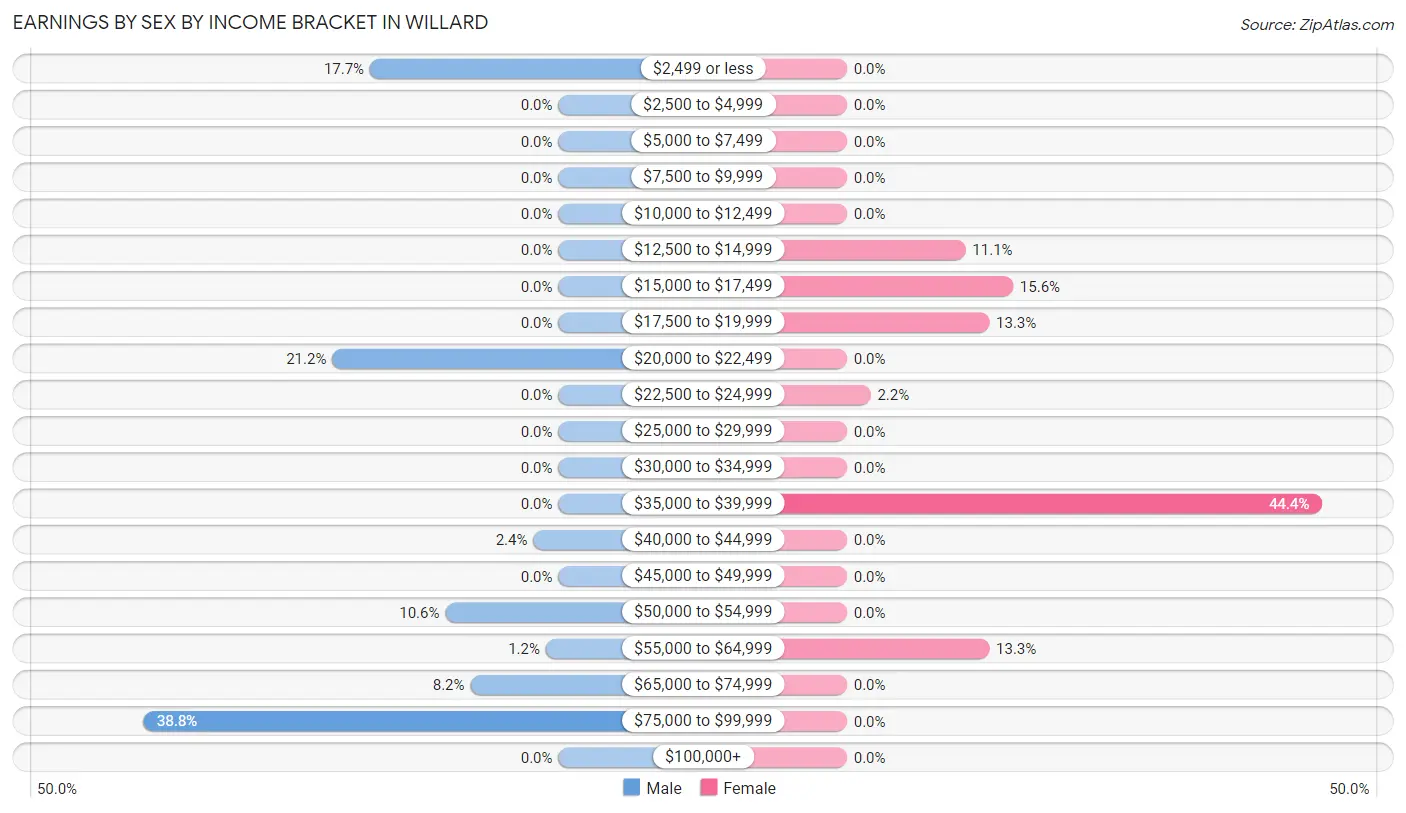
Earnings by Sex by Income Bracket in Willard
The most common earnings brackets in Willard are $75,000 to $99,999 for men (33 | 38.8%) and $35,000 to $39,999 for women (20 | 44.4%).
| Income | Male | Female |
| $2,499 or less | 15 (17.6%) | 0 (0.0%) |
| $2,500 to $4,999 | 0 (0.0%) | 0 (0.0%) |
| $5,000 to $7,499 | 0 (0.0%) | 0 (0.0%) |
| $7,500 to $9,999 | 0 (0.0%) | 0 (0.0%) |
| $10,000 to $12,499 | 0 (0.0%) | 0 (0.0%) |
| $12,500 to $14,999 | 0 (0.0%) | 5 (11.1%) |
| $15,000 to $17,499 | 0 (0.0%) | 7 (15.6%) |
| $17,500 to $19,999 | 0 (0.0%) | 6 (13.3%) |
| $20,000 to $22,499 | 18 (21.2%) | 0 (0.0%) |
| $22,500 to $24,999 | 0 (0.0%) | 1 (2.2%) |
| $25,000 to $29,999 | 0 (0.0%) | 0 (0.0%) |
| $30,000 to $34,999 | 0 (0.0%) | 0 (0.0%) |
| $35,000 to $39,999 | 0 (0.0%) | 20 (44.4%) |
| $40,000 to $44,999 | 2 (2.4%) | 0 (0.0%) |
| $45,000 to $49,999 | 0 (0.0%) | 0 (0.0%) |
| $50,000 to $54,999 | 9 (10.6%) | 0 (0.0%) |
| $55,000 to $64,999 | 1 (1.2%) | 6 (13.3%) |
| $65,000 to $74,999 | 7 (8.2%) | 0 (0.0%) |
| $75,000 to $99,999 | 33 (38.8%) | 0 (0.0%) |
| $100,000+ | 0 (0.0%) | 0 (0.0%) |
| Total | 85 (100.0%) | 45 (100.0%) |
Earnings by Sex by Educational Attainment in Willard
| Educational Attainment | Male Income | Female Income |
| Less than High School | - | - |
| High School Diploma | - | - |
| College or Associate's Degree | - | - |
| Bachelor's Degree | - | - |
| Graduate Degree | - | - |
| Total | - | - |
Family Income in Willard
Family Income Brackets in Willard
According to the Willard family income data, there are 39 families falling into the $100,000 to $149,999 income range, which is the most common income bracket and makes up 50.6% of all families.
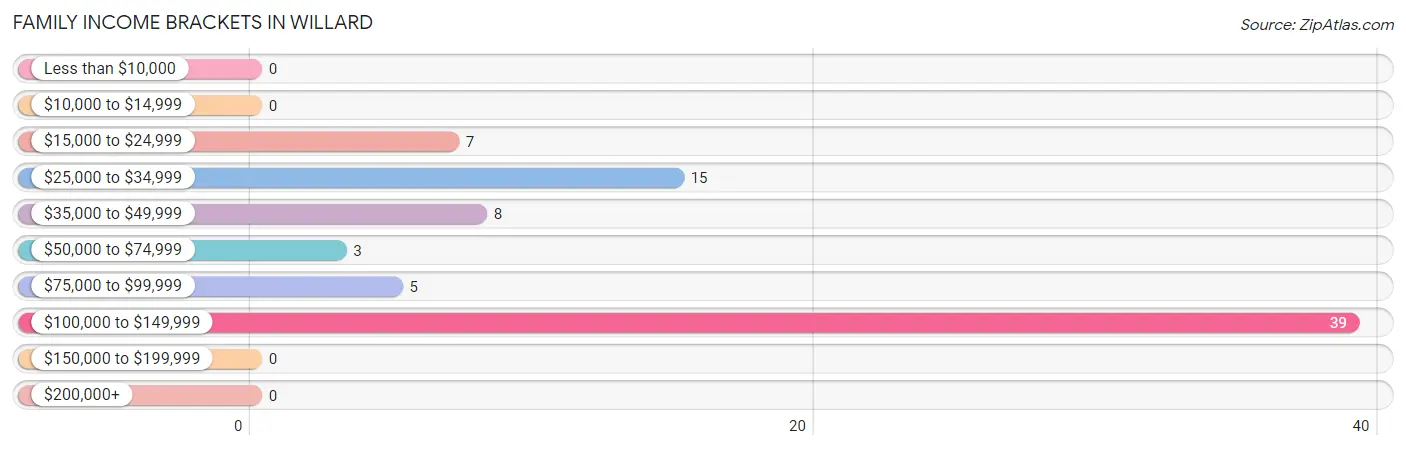
| Income Bracket | # Families | % Families |
| Less than $10,000 | 0 | 0.0% |
| $10,000 to $14,999 | 0 | 0.0% |
| $15,000 to $24,999 | 7 | 9.1% |
| $25,000 to $34,999 | 15 | 19.5% |
| $35,000 to $49,999 | 8 | 10.4% |
| $50,000 to $74,999 | 3 | 3.9% |
| $75,000 to $99,999 | 5 | 6.5% |
| $100,000 to $149,999 | 39 | 50.6% |
| $150,000 to $199,999 | 0 | 0.0% |
| $200,000+ | 0 | 0.0% |
Family Income by Famaliy Size in Willard
3-person families (42 | 54.5%) account for the highest median family income in Willard with $118,864 per family, while 3-person families (42 | 54.5%) have the highest median income of $39,621 per family member.
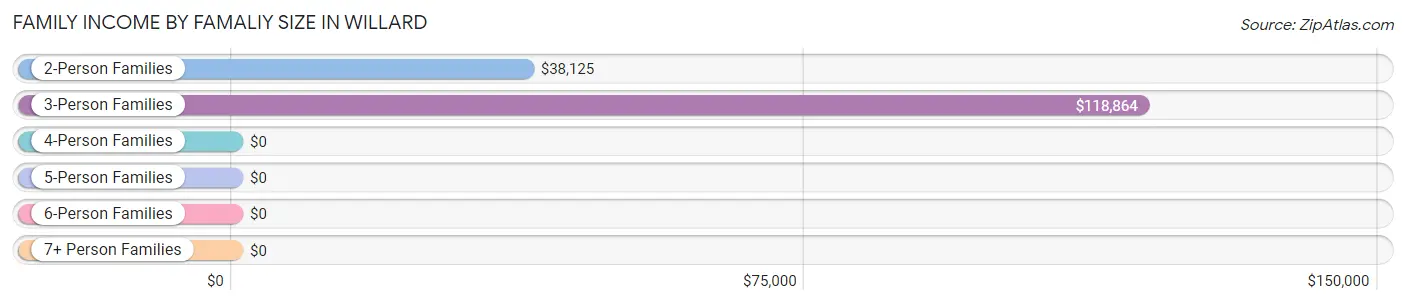
| Income Bracket | # Families | Median Income |
| 2-Person Families | 22 (28.6%) | $38,125 |
| 3-Person Families | 42 (54.5%) | $118,864 |
| 4-Person Families | 0 (0.0%) | $0 |
| 5-Person Families | 13 (16.9%) | $0 |
| 6-Person Families | 0 (0.0%) | $0 |
| 7+ Person Families | 0 (0.0%) | $0 |
| Total | 77 (100.0%) | $0 |
Family Income by Number of Earners in Willard

| Number of Earners | # Families | Median Income |
| No Earners | 8 (10.4%) | $0 |
| 1 Earner | 25 (32.5%) | $29,792 |
| 2 Earners | 38 (49.3%) | $0 |
| 3+ Earners | 6 (7.8%) | $0 |
| Total | 77 (100.0%) | $0 |
Household Income in Willard
Household Income Brackets in Willard
With 39 households falling in the category, the $100,000 to $149,999 income range is the most frequent in Willard, accounting for 37.1% of all households.
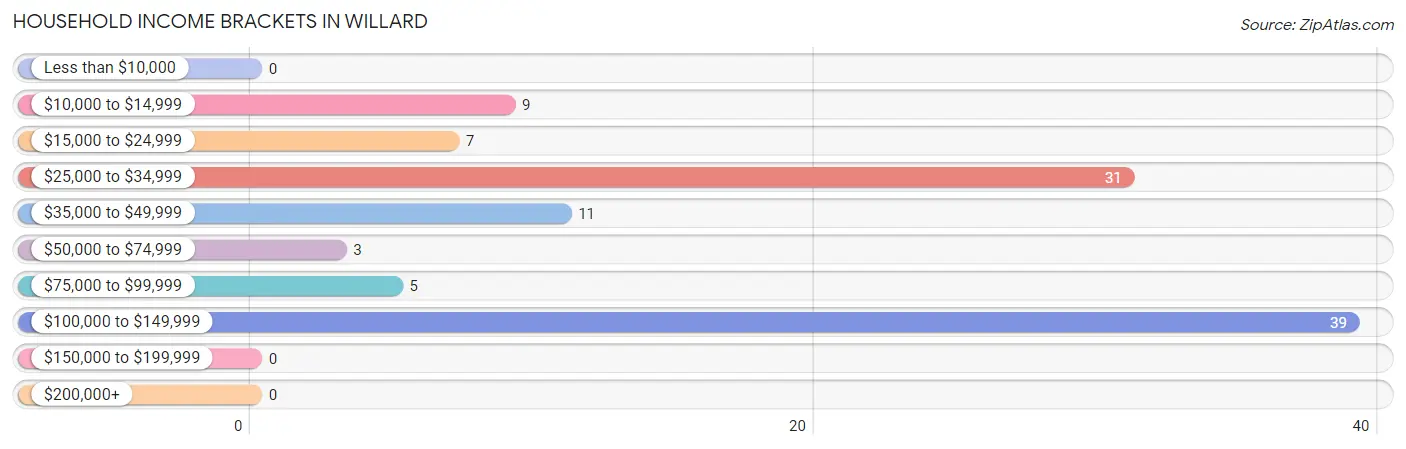
| Income Bracket | # Households | % Households |
| Less than $10,000 | 0 | 0.0% |
| $10,000 to $14,999 | 9 | 8.6% |
| $15,000 to $24,999 | 7 | 6.7% |
| $25,000 to $34,999 | 31 | 29.5% |
| $35,000 to $49,999 | 11 | 10.5% |
| $50,000 to $74,999 | 3 | 2.9% |
| $75,000 to $99,999 | 5 | 4.8% |
| $100,000 to $149,999 | 39 | 37.1% |
| $150,000 to $199,999 | 0 | 0.0% |
| $200,000+ | 0 | 0.0% |
Household Income by Householder Age in Willard
The median household income in Willard is $0, with the highest median household income of $118,144 found in the 45 to 64 years age bracket for the primary householder. A total of 49 households (46.7%) fall into this category. Meanwhile, the 15 to 24 years age bracket for the primary householder has the lowest median household income of $0, with 5 households (4.8%) in this group.
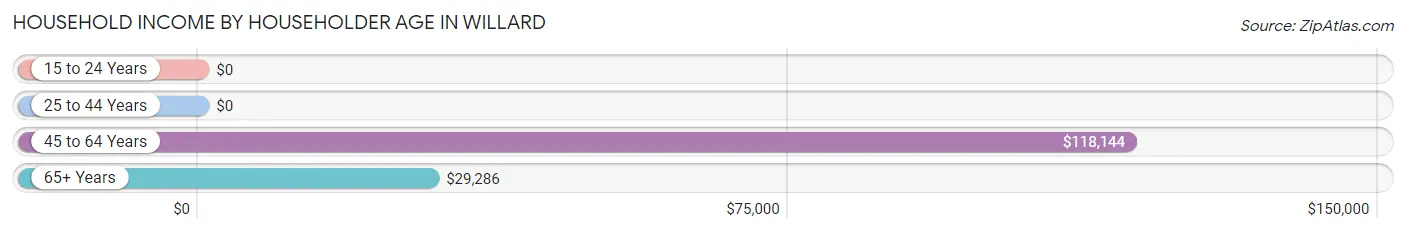
| Income Bracket | # Households | Median Income |
| 15 to 24 Years | 5 (4.8%) | $0 |
| 25 to 44 Years | 7 (6.7%) | $0 |
| 45 to 64 Years | 49 (46.7%) | $118,144 |
| 65+ Years | 44 (41.9%) | $29,286 |
| Total | 105 (100.0%) | $0 |
Poverty in Willard
Income Below Poverty by Sex and Age in Willard
With 30.2% poverty level for males and 36.3% for females among the residents of Willard, 6 to 11 year old males and 12 to 14 year old females are the most vulnerable to poverty, with 8 males (100.0%) and 6 females (100.0%) in their respective age groups living below the poverty level.
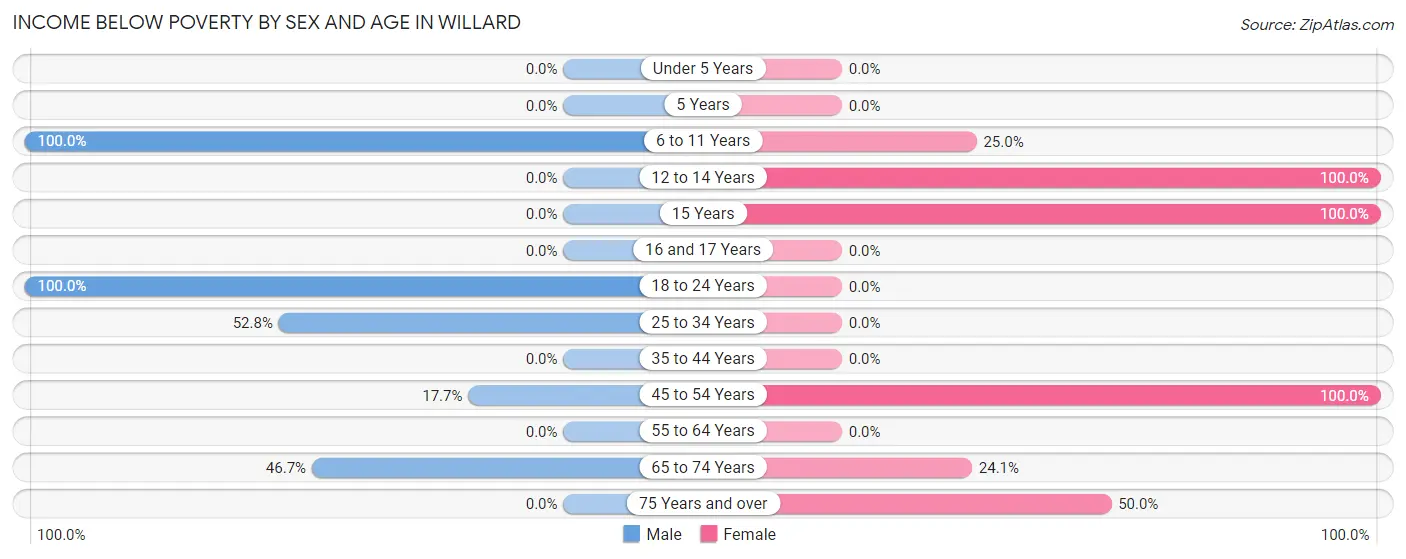
| Age Bracket | Male | Female |
| Under 5 Years | 0 (0.0%) | 0 (0.0%) |
| 5 Years | 0 (0.0%) | 0 (0.0%) |
| 6 to 11 Years | 8 (100.0%) | 6 (25.0%) |
| 12 to 14 Years | 0 (0.0%) | 6 (100.0%) |
| 15 Years | 0 (0.0%) | 8 (100.0%) |
| 16 and 17 Years | 0 (0.0%) | 0 (0.0%) |
| 18 to 24 Years | 16 (100.0%) | 0 (0.0%) |
| 25 to 34 Years | 28 (52.8%) | 0 (0.0%) |
| 35 to 44 Years | 0 (0.0%) | 0 (0.0%) |
| 45 to 54 Years | 9 (17.6%) | 13 (100.0%) |
| 55 to 64 Years | 0 (0.0%) | 0 (0.0%) |
| 65 to 74 Years | 7 (46.7%) | 7 (24.1%) |
| 75 Years and over | 0 (0.0%) | 9 (50.0%) |
| Total | 68 (30.2%) | 49 (36.3%) |
Income Above Poverty by Sex and Age in Willard
According to the poverty statistics in Willard, males aged 16 and 17 years and females aged 18 to 24 years are the age groups that are most secure financially, with 100.0% of males and 100.0% of females in these age groups living above the poverty line.
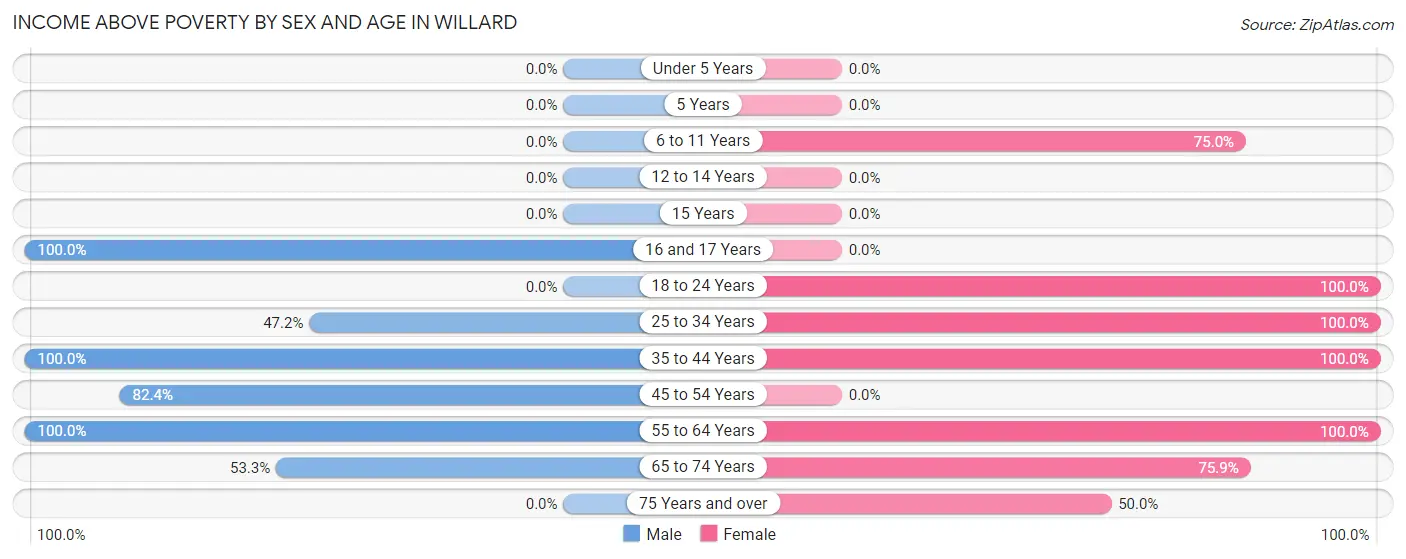
| Age Bracket | Male | Female |
| Under 5 Years | 0 (0.0%) | 0 (0.0%) |
| 5 Years | 0 (0.0%) | 0 (0.0%) |
| 6 to 11 Years | 0 (0.0%) | 18 (75.0%) |
| 12 to 14 Years | 0 (0.0%) | 0 (0.0%) |
| 15 Years | 0 (0.0%) | 0 (0.0%) |
| 16 and 17 Years | 64 (100.0%) | 0 (0.0%) |
| 18 to 24 Years | 0 (0.0%) | 5 (100.0%) |
| 25 to 34 Years | 25 (47.2%) | 2 (100.0%) |
| 35 to 44 Years | 16 (100.0%) | 29 (100.0%) |
| 45 to 54 Years | 42 (82.4%) | 0 (0.0%) |
| 55 to 64 Years | 2 (100.0%) | 1 (100.0%) |
| 65 to 74 Years | 8 (53.3%) | 22 (75.9%) |
| 75 Years and over | 0 (0.0%) | 9 (50.0%) |
| Total | 157 (69.8%) | 86 (63.7%) |
Income Below Poverty Among Married-Couple Families in Willard
The poverty statistics for married-couple families in Willard show that 9.8% or 6 of the total 61 families live below the poverty line. Families with 1 or 2 children have the highest poverty rate of 15.0%, comprising of 6 families. On the other hand, families with no children have the lowest poverty rate of 0.0%, which includes 0 families.
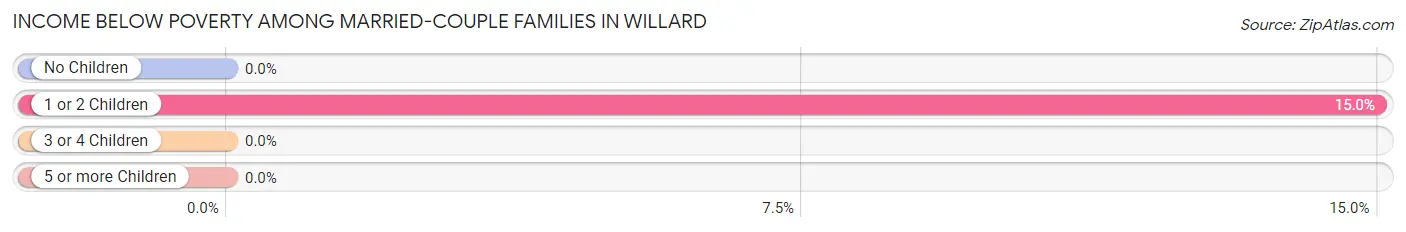
| Children | Above Poverty | Below Poverty |
| No Children | 21 (100.0%) | 0 (0.0%) |
| 1 or 2 Children | 34 (85.0%) | 6 (15.0%) |
| 3 or 4 Children | 0 (0.0%) | 0 (0.0%) |
| 5 or more Children | 0 (0.0%) | 0 (0.0%) |
| Total | 55 (90.2%) | 6 (9.8%) |
Income Below Poverty Among Single-Parent Households in Willard
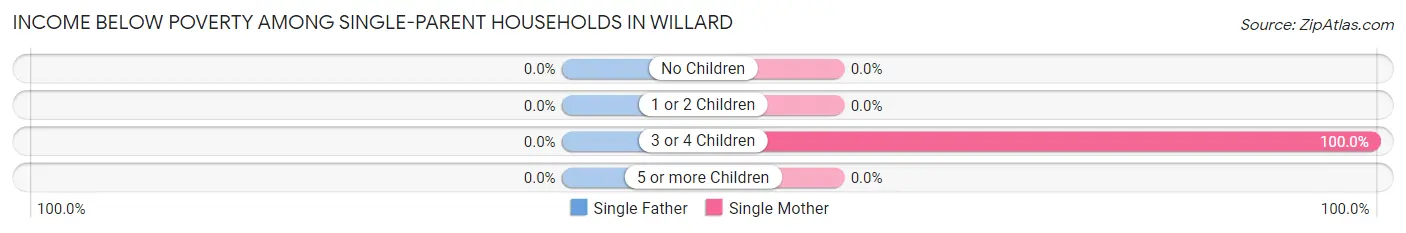
| Children | Single Father | Single Mother |
| No Children | 0 (0.0%) | 0 (0.0%) |
| 1 or 2 Children | 0 (0.0%) | 0 (0.0%) |
| 3 or 4 Children | 0 (0.0%) | 7 (100.0%) |
| 5 or more Children | 0 (0.0%) | 0 (0.0%) |
| Total | 0 (0.0%) | 7 (43.8%) |
Income Below Poverty Among Married-Couple vs Single-Parent Households in Willard
The poverty data for Willard shows that 6 of the married-couple family households (9.8%) and 7 of the single-parent households (43.8%) are living below the poverty level. Within the married-couple family households, those with 1 or 2 children have the highest poverty rate, with 6 households (15.0%) falling below the poverty line. Among the single-parent households, those with 3 or 4 children have the highest poverty rate, with 7 household (100.0%) living below poverty.
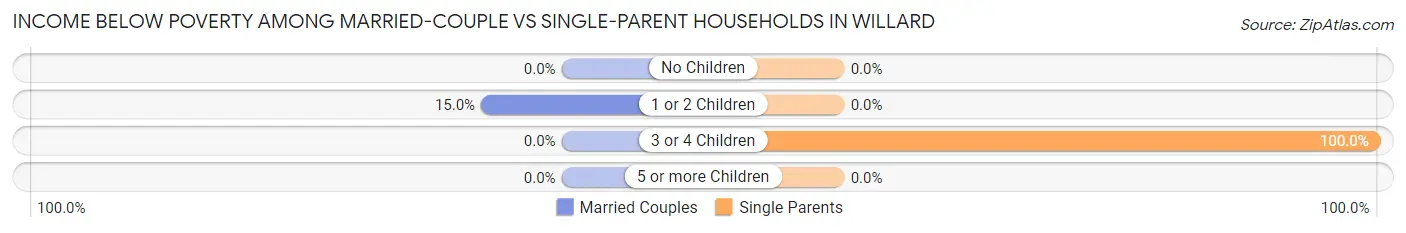
| Children | Married-Couple Families | Single-Parent Households |
| No Children | 0 (0.0%) | 0 (0.0%) |
| 1 or 2 Children | 6 (15.0%) | 0 (0.0%) |
| 3 or 4 Children | 0 (0.0%) | 7 (100.0%) |
| 5 or more Children | 0 (0.0%) | 0 (0.0%) |
| Total | 6 (9.8%) | 7 (43.8%) |
Race in Willard
The most populous races in Willard are Hispanic or Latino (313 | 86.9%), White / Caucasian (260 | 72.2%), and Two or more Races (74 | 20.6%).
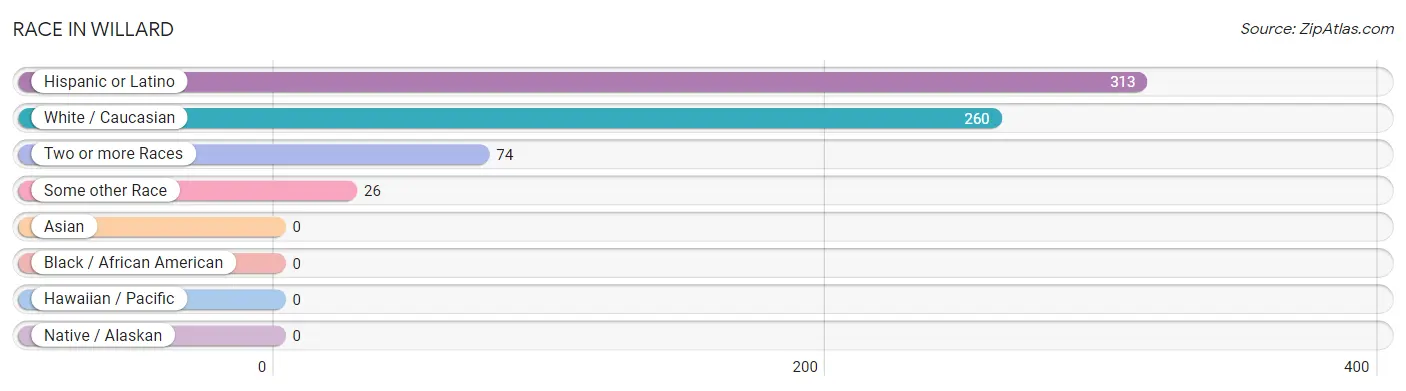
| Race | # Population | % Population |
| Asian | 0 | 0.0% |
| Black / African American | 0 | 0.0% |
| Hawaiian / Pacific | 0 | 0.0% |
| Hispanic or Latino | 313 | 86.9% |
| Native / Alaskan | 0 | 0.0% |
| White / Caucasian | 260 | 72.2% |
| Two or more Races | 74 | 20.6% |
| Some other Race | 26 | 7.2% |
| Total | 360 | 100.0% |
Ancestry in Willard
The most populous ancestries reported in Willard are Mexican (209 | 58.1%), American (12 | 3.3%), European (7 | 1.9%), Spanish (7 | 1.9%), and Portuguese (1 | 0.3%), together accounting for 65.5% of all Willard residents.
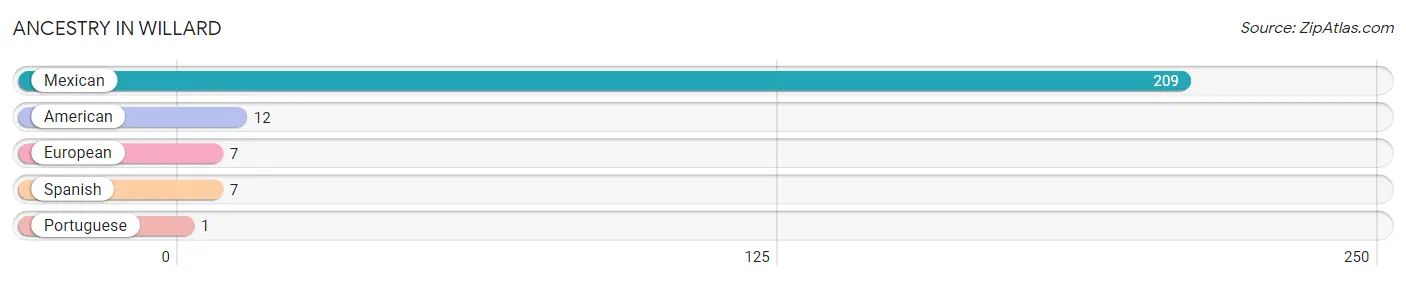
| Ancestry | # Population | % Population |
| American | 12 | 3.3% |
| European | 7 | 1.9% |
| Mexican | 209 | 58.1% |
| Portuguese | 1 | 0.3% |
| Spanish | 7 | 1.9% | View All 5 Rows |
Immigrants in Willard

| Immigration Origin | # Population | % Population | View All 0 Rows |
Sex and Age in Willard
Sex and Age in Willard
The most populous age groups in Willard are 15 to 19 Years (64 | 28.4%) for men and 10 to 14 Years (30 | 22.2%) for women.
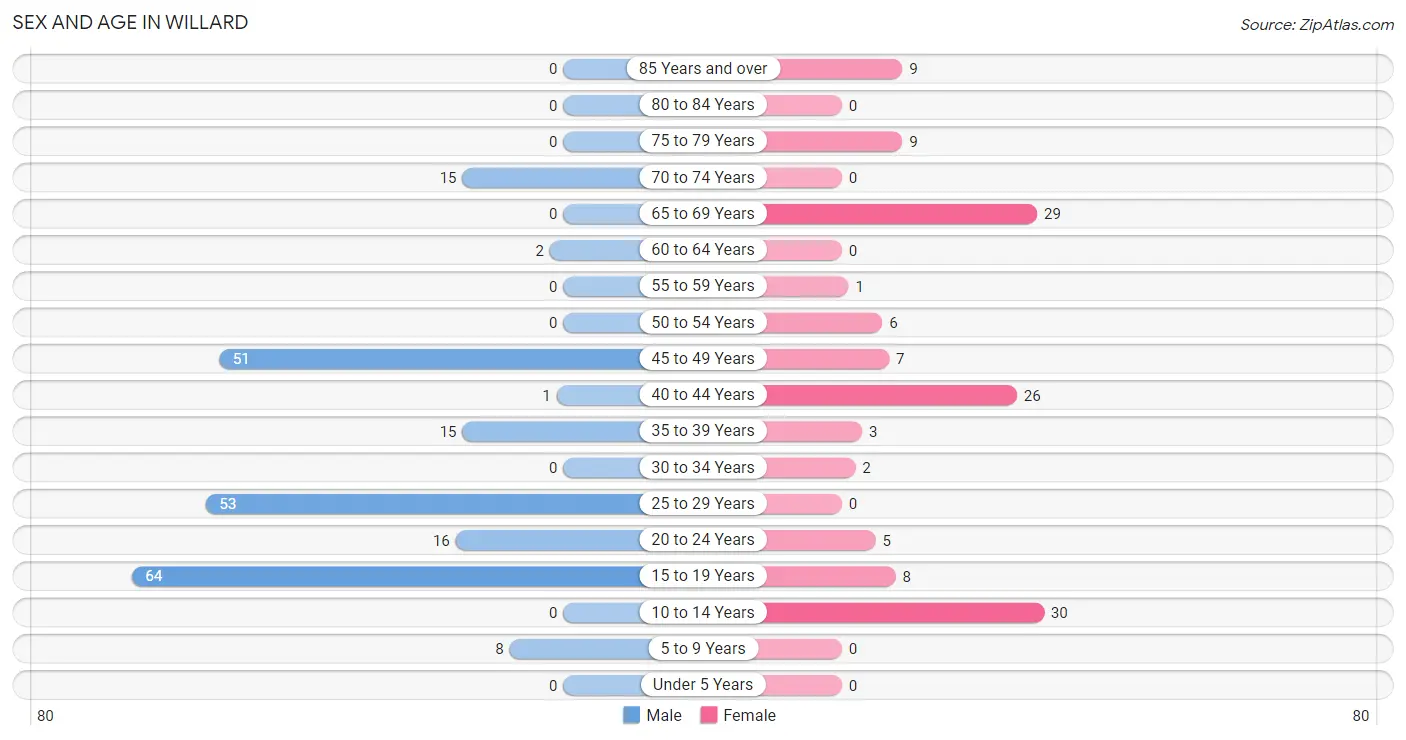
| Age Bracket | Male | Female |
| Under 5 Years | 0 (0.0%) | 0 (0.0%) |
| 5 to 9 Years | 8 (3.6%) | 0 (0.0%) |
| 10 to 14 Years | 0 (0.0%) | 30 (22.2%) |
| 15 to 19 Years | 64 (28.4%) | 8 (5.9%) |
| 20 to 24 Years | 16 (7.1%) | 5 (3.7%) |
| 25 to 29 Years | 53 (23.6%) | 0 (0.0%) |
| 30 to 34 Years | 0 (0.0%) | 2 (1.5%) |
| 35 to 39 Years | 15 (6.7%) | 3 (2.2%) |
| 40 to 44 Years | 1 (0.4%) | 26 (19.3%) |
| 45 to 49 Years | 51 (22.7%) | 7 (5.2%) |
| 50 to 54 Years | 0 (0.0%) | 6 (4.4%) |
| 55 to 59 Years | 0 (0.0%) | 1 (0.7%) |
| 60 to 64 Years | 2 (0.9%) | 0 (0.0%) |
| 65 to 69 Years | 0 (0.0%) | 29 (21.5%) |
| 70 to 74 Years | 15 (6.7%) | 0 (0.0%) |
| 75 to 79 Years | 0 (0.0%) | 9 (6.7%) |
| 80 to 84 Years | 0 (0.0%) | 0 (0.0%) |
| 85 Years and over | 0 (0.0%) | 9 (6.7%) |
| Total | 225 (100.0%) | 135 (100.0%) |
Families and Households in Willard
Median Family Size in Willard
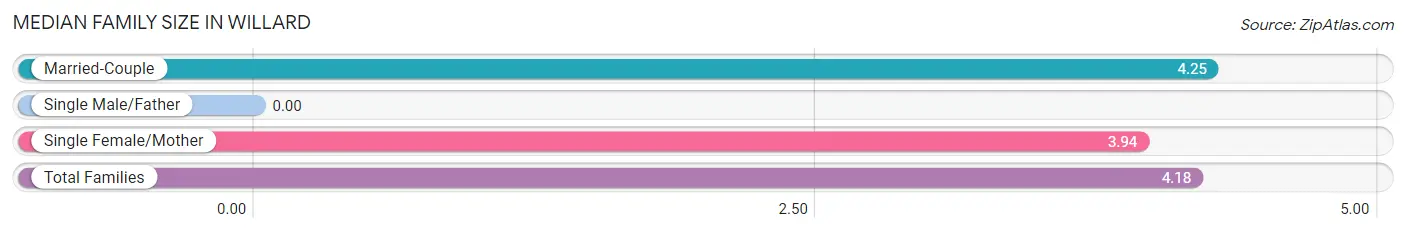
| Family Type | # Families | Family Size |
| Married-Couple | 61 (79.2%) | 4.25 |
| Single Male/Father | 0 (0.0%) | - |
| Single Female/Mother | 16 (20.8%) | 3.94 |
| Total Families | 77 (100.0%) | 4.18 |
Median Household Size in Willard
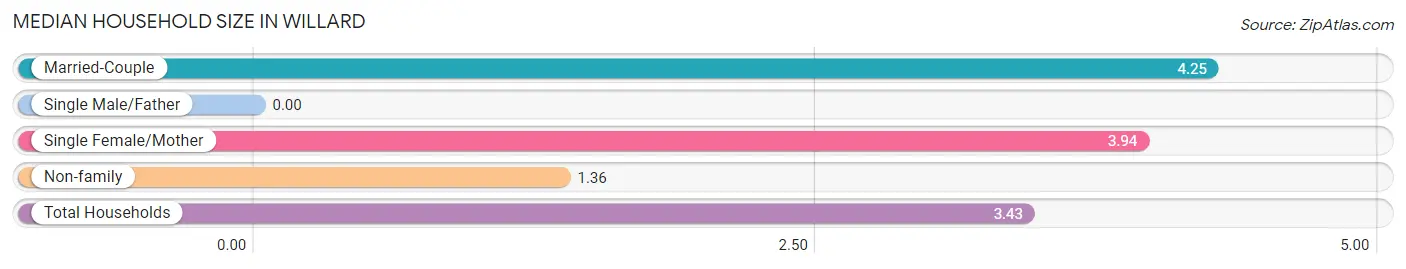
| Household Type | # Households | Household Size |
| Married-Couple | 61 (58.1%) | 4.25 |
| Single Male/Father | 0 (0.0%) | - |
| Single Female/Mother | 16 (15.2%) | 3.94 |
| Non-family | 28 (26.7%) | 1.36 |
| Total Households | 105 (100.0%) | 3.43 |
Household Size by Marriage Status in Willard
Out of a total of 105 households in Willard, 77 (73.3%) are family households, while 28 (26.7%) are nonfamily households. The most numerous type of family households are 3-person households, comprising 42, and the most common type of nonfamily households are 1-person households, comprising 19.
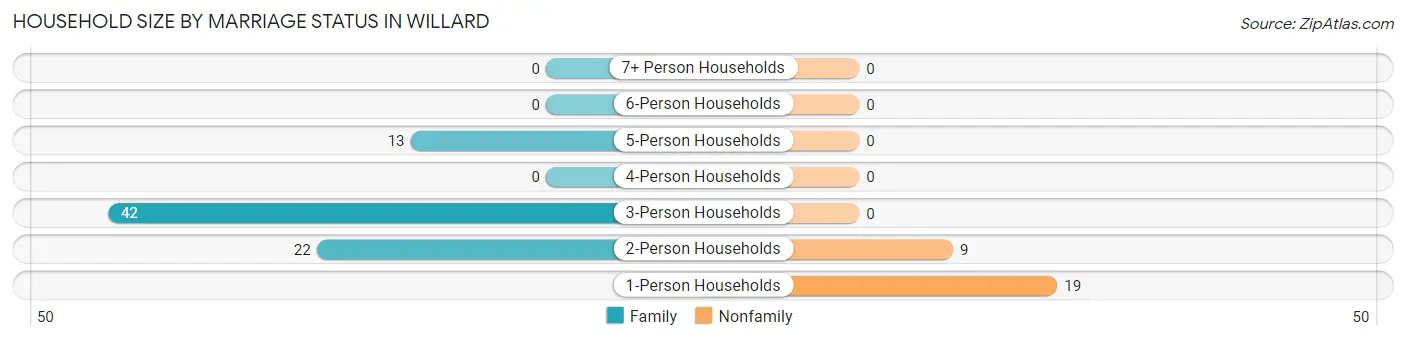
| Household Size | Family Households | Nonfamily Households |
| 1-Person Households | - | 19 (18.1%) |
| 2-Person Households | 22 (20.9%) | 9 (8.6%) |
| 3-Person Households | 42 (40.0%) | 0 (0.0%) |
| 4-Person Households | 0 (0.0%) | 0 (0.0%) |
| 5-Person Households | 13 (12.4%) | 0 (0.0%) |
| 6-Person Households | 0 (0.0%) | 0 (0.0%) |
| 7+ Person Households | 0 (0.0%) | 0 (0.0%) |
| Total | 77 (73.3%) | 28 (26.7%) |
Female Fertility in Willard
Fertility by Age in Willard
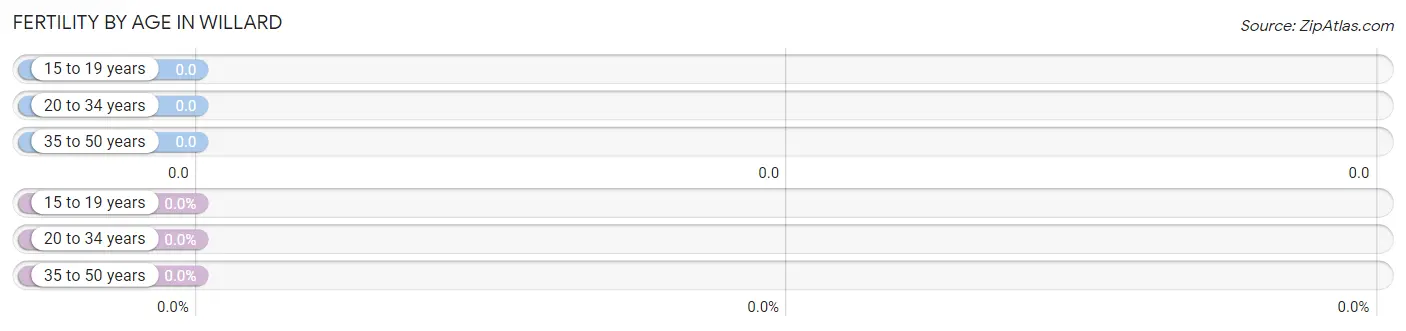
| Age Bracket | Women with Births | Births / 1,000 Women |
| 15 to 19 years | 0 (0.0%) | 0.0 |
| 20 to 34 years | 0 (0.0%) | 0.0 |
| 35 to 50 years | 0 (0.0%) | 0.0 |
| Total | 0 (0.0%) | 0.0 |
Fertility by Age by Marriage Status in Willard
| Age Bracket | Married | Unmarried |
| 15 to 19 years | 0 (0.0%) | 0 (0.0%) |
| 20 to 34 years | 0 (0.0%) | 0 (0.0%) |
| 35 to 50 years | 0 (0.0%) | 0 (0.0%) |
| Total | 0 (0.0%) | 0 (0.0%) |
Fertility by Education in Willard
| Educational Attainment | Women with Births | Births / 1,000 Women |
| Less than High School | 0 (0.0%) | 0.0 |
| High School Diploma | 0 (0.0%) | 0.0 |
| College or Associate's Degree | 0 (0.0%) | 0.0 |
| Bachelor's Degree | 0 (0.0%) | 0.0 |
| Graduate Degree | 0 (0.0%) | 0.0 |
| Total | 0 (0.0%) | 0.0 |
Fertility by Education by Marriage Status in Willard
| Educational Attainment | Married | Unmarried |
| Less than High School | 0 (0.0%) | 0 (0.0%) |
| High School Diploma | 0 (0.0%) | 0 (0.0%) |
| College or Associate's Degree | 0 (0.0%) | 0 (0.0%) |
| Bachelor's Degree | 0 (0.0%) | 0 (0.0%) |
| Graduate Degree | 0 (0.0%) | 0 (0.0%) |
| Total | 0 (0.0%) | 0 (0.0%) |
Employment Characteristics in Willard
Employment by Class of Employer in Willard
Among the 125 employed individuals in Willard, local government employees (47 | 37.6%), state government employees (42 | 33.6%), and private company employees (34 | 27.2%) make up the most common classes of employment.
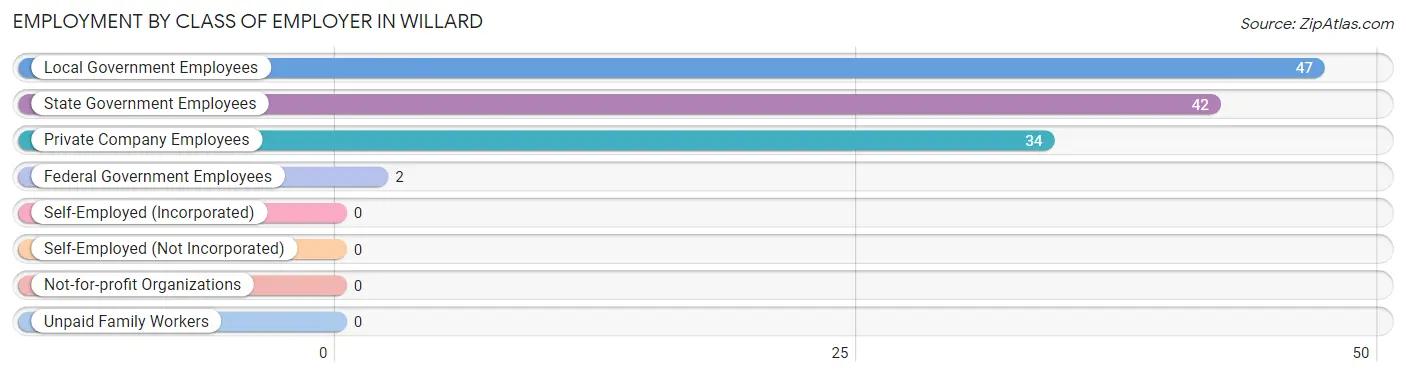
| Employer Class | # Employees | % Employees |
| Private Company Employees | 34 | 27.2% |
| Self-Employed (Incorporated) | 0 | 0.0% |
| Self-Employed (Not Incorporated) | 0 | 0.0% |
| Not-for-profit Organizations | 0 | 0.0% |
| Local Government Employees | 47 | 37.6% |
| State Government Employees | 42 | 33.6% |
| Federal Government Employees | 2 | 1.6% |
| Unpaid Family Workers | 0 | 0.0% |
| Total | 125 | 100.0% |
Employment Status by Age in Willard
According to the labor force statistics for Willard, out of the total population over 16 years of age (314), 47.8% or 150 individuals are in the labor force, with 16.7% or 25 of them unemployed. The age group with the highest labor force participation rate is 45 to 54 years, with 100.0% or 64 individuals in the labor force. Within the labor force, the 25 to 29 years age range has the highest percentage of unemployed individuals, with 39.0% or 16 of them being unemployed.
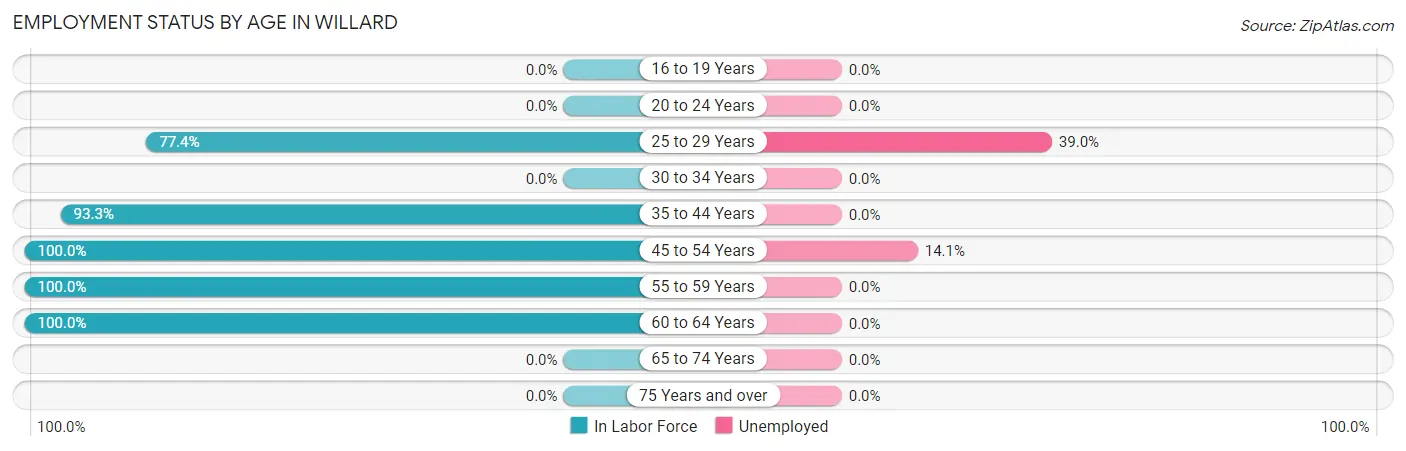
| Age Bracket | In Labor Force | Unemployed |
| 16 to 19 Years | 0 (0.0%) | 0 (0.0%) |
| 20 to 24 Years | 0 (0.0%) | 0 (0.0%) |
| 25 to 29 Years | 41 (77.4%) | 16 (39.0%) |
| 30 to 34 Years | 0 (0.0%) | 0 (0.0%) |
| 35 to 44 Years | 42 (93.3%) | 0 (0.0%) |
| 45 to 54 Years | 64 (100.0%) | 9 (14.1%) |
| 55 to 59 Years | 1 (100.0%) | 0 (0.0%) |
| 60 to 64 Years | 2 (100.0%) | 0 (0.0%) |
| 65 to 74 Years | 0 (0.0%) | 0 (0.0%) |
| 75 Years and over | 0 (0.0%) | 0 (0.0%) |
| Total | 150 (47.8%) | 25 (16.7%) |
Employment Status by Educational Attainment in Willard
According to labor force statistics for Willard, 89.8% of individuals (150) out of the total population between 25 and 64 years of age (167) are in the labor force, with 16.7% or 25 of them being unemployed. The group with the highest labor force participation rate are those with the educational attainment of high school diploma, with 100.0% or 58 individuals in the labor force. Within the labor force, individuals with less than high school education have the highest percentage of unemployment, with 100.0% or 9 of them being unemployed.
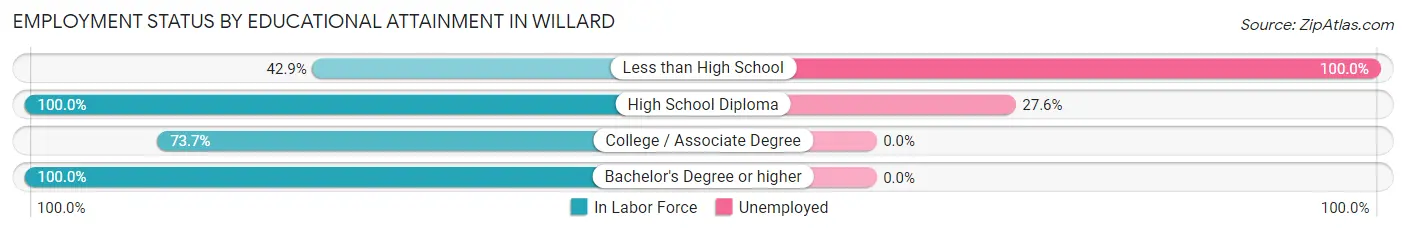
| Educational Attainment | In Labor Force | Unemployed |
| Less than High School | 9 (42.9%) | 21 (100.0%) |
| High School Diploma | 58 (100.0%) | 16 (27.6%) |
| College / Associate Degree | 14 (73.7%) | 0 (0.0%) |
| Bachelor's Degree or higher | 69 (100.0%) | 0 (0.0%) |
| Total | 150 (89.8%) | 28 (16.7%) |
Employment Occupations by Sex in Willard
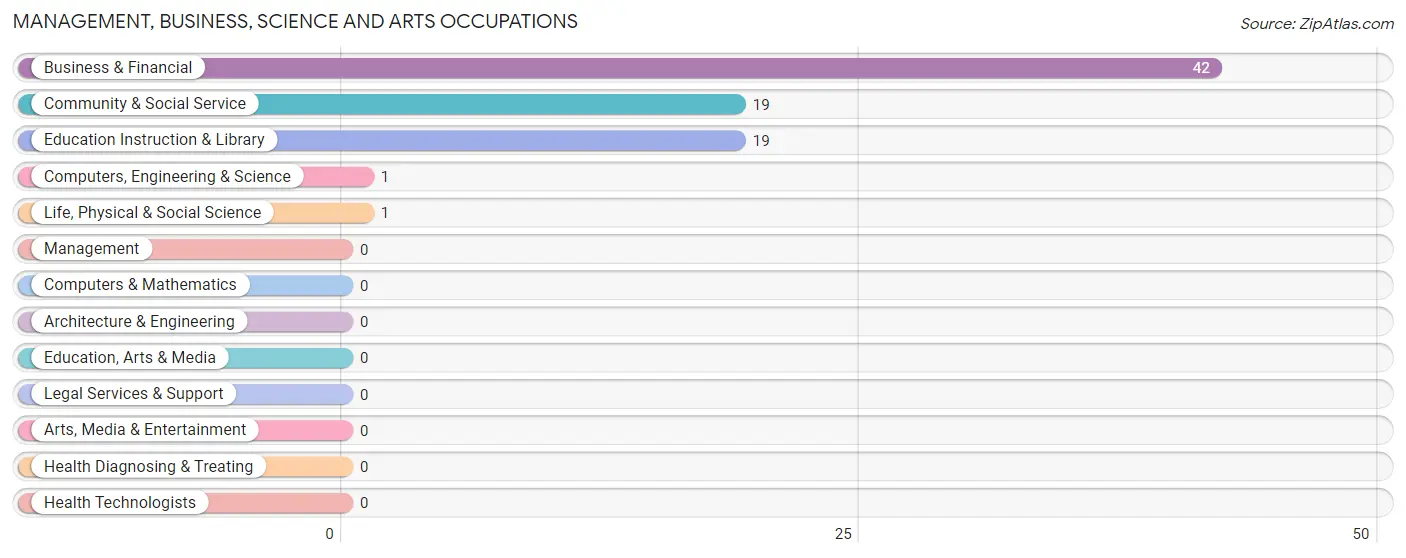
Management, Business, Science and Arts Occupations
The most common Management, Business, Science and Arts occupations in Willard are Business & Financial (42 | 33.6%), Community & Social Service (19 | 15.2%), Education Instruction & Library (19 | 15.2%), Computers, Engineering & Science (1 | 0.8%), and Life, Physical & Social Science (1 | 0.8%).
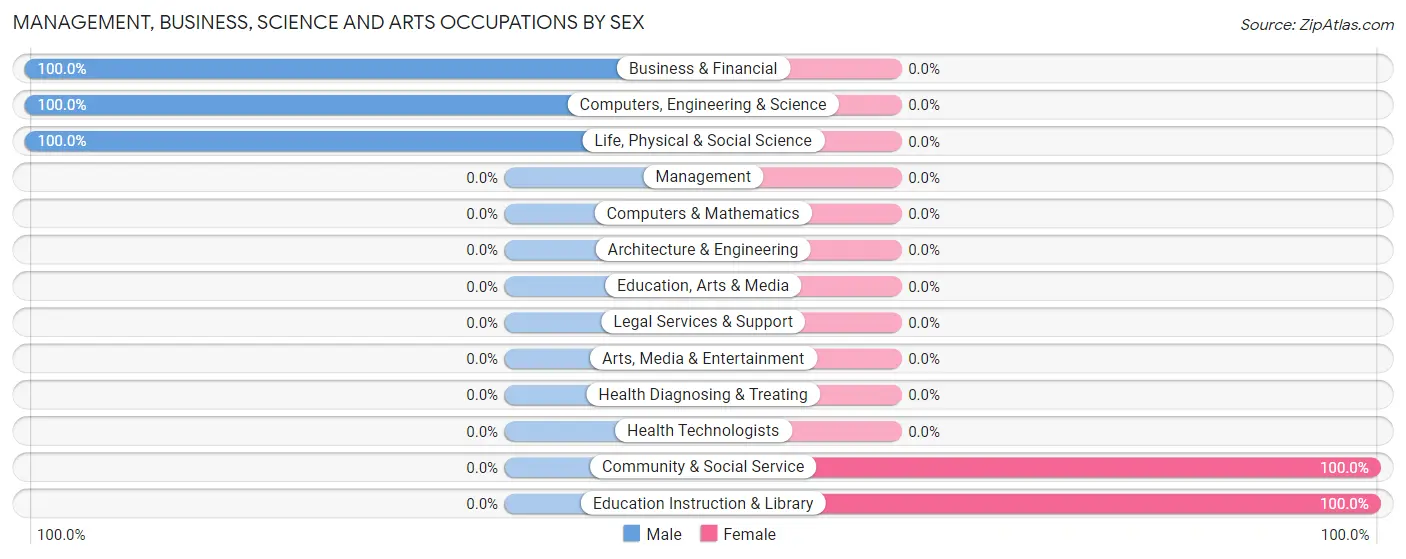
Management, Business, Science and Arts Occupations by Sex
Within the Management, Business, Science and Arts occupations in Willard, the most male-oriented occupations are Business & Financial (100.0%), Computers, Engineering & Science (100.0%), and Life, Physical & Social Science (100.0%), while the most female-oriented occupations are Community & Social Service (100.0%), and Education Instruction & Library (100.0%).
| Occupation | Male | Female |
| Management | 0 (0.0%) | 0 (0.0%) |
| Business & Financial | 42 (100.0%) | 0 (0.0%) |
| Computers, Engineering & Science | 1 (100.0%) | 0 (0.0%) |
| Computers & Mathematics | 0 (0.0%) | 0 (0.0%) |
| Architecture & Engineering | 0 (0.0%) | 0 (0.0%) |
| Life, Physical & Social Science | 1 (100.0%) | 0 (0.0%) |
| Community & Social Service | 0 (0.0%) | 19 (100.0%) |
| Education, Arts & Media | 0 (0.0%) | 0 (0.0%) |
| Legal Services & Support | 0 (0.0%) | 0 (0.0%) |
| Education Instruction & Library | 0 (0.0%) | 19 (100.0%) |
| Arts, Media & Entertainment | 0 (0.0%) | 0 (0.0%) |
| Health Diagnosing & Treating | 0 (0.0%) | 0 (0.0%) |
| Health Technologists | 0 (0.0%) | 0 (0.0%) |
| Total (Category) | 43 (69.4%) | 19 (30.6%) |
| Total (Overall) | 85 (68.0%) | 40 (32.0%) |
Services Occupations
The most common Services occupations in Willard are Security & Protection (7 | 5.6%), and Law Enforcement (7 | 5.6%).
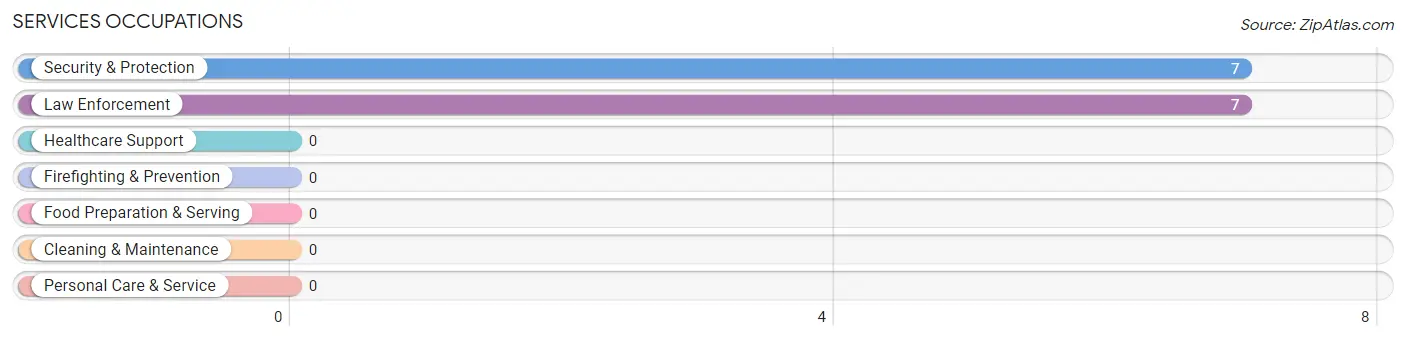
Services Occupations by Sex
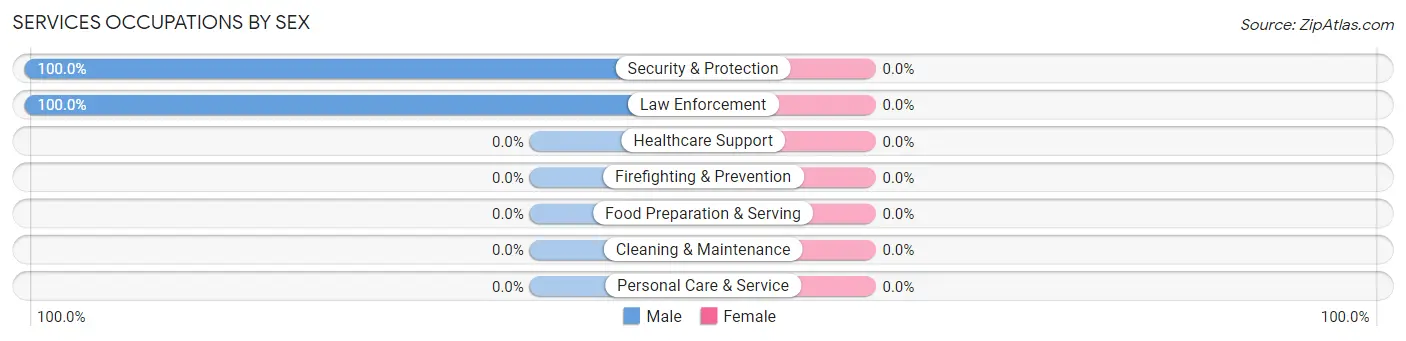
| Occupation | Male | Female |
| Healthcare Support | 0 (0.0%) | 0 (0.0%) |
| Security & Protection | 7 (100.0%) | 0 (0.0%) |
| Firefighting & Prevention | 0 (0.0%) | 0 (0.0%) |
| Law Enforcement | 7 (100.0%) | 0 (0.0%) |
| Food Preparation & Serving | 0 (0.0%) | 0 (0.0%) |
| Cleaning & Maintenance | 0 (0.0%) | 0 (0.0%) |
| Personal Care & Service | 0 (0.0%) | 0 (0.0%) |
| Total (Category) | 7 (100.0%) | 0 (0.0%) |
| Total (Overall) | 85 (68.0%) | 40 (32.0%) |
Sales and Office Occupations
The most common Sales and Office occupations in Willard are , and Office & Administration (23 | 18.4%).
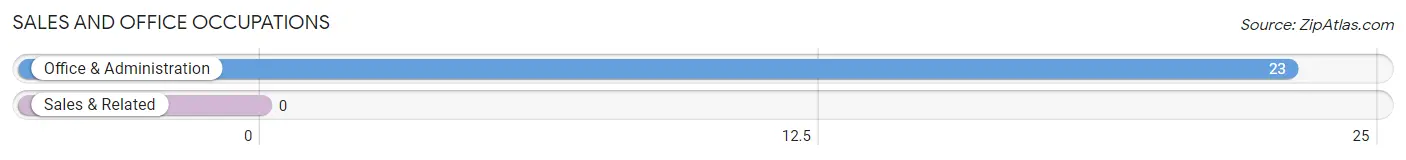
Sales and Office Occupations by Sex
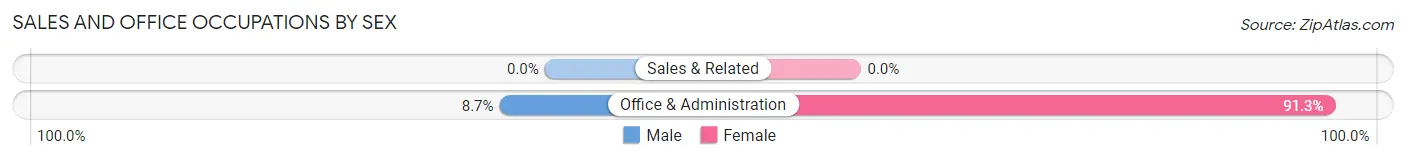
| Occupation | Male | Female |
| Sales & Related | 0 (0.0%) | 0 (0.0%) |
| Office & Administration | 2 (8.7%) | 21 (91.3%) |
| Total (Category) | 2 (8.7%) | 21 (91.3%) |
| Total (Overall) | 85 (68.0%) | 40 (32.0%) |
Natural Resources, Construction and Maintenance Occupations
The most common Natural Resources, Construction and Maintenance occupations in Willard are Farming, Fishing & Forestry (18 | 14.4%), and Installation, Maintenance & Repair (15 | 12.0%).
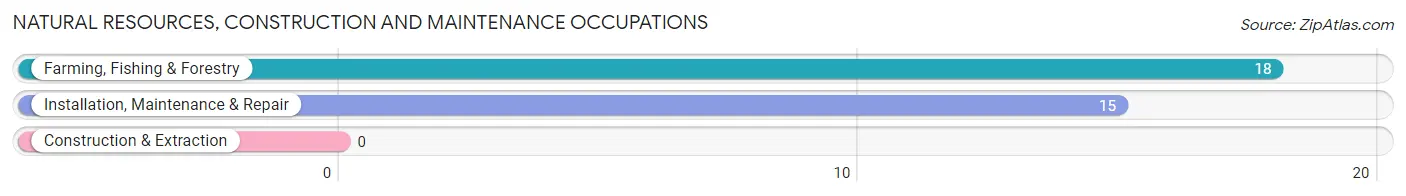
Natural Resources, Construction and Maintenance Occupations by Sex
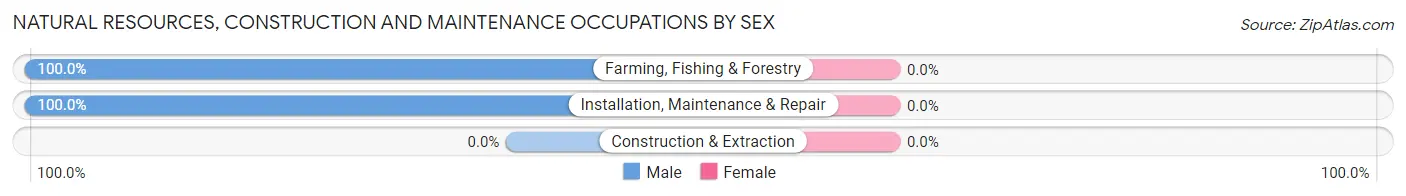
| Occupation | Male | Female |
| Farming, Fishing & Forestry | 18 (100.0%) | 0 (0.0%) |
| Construction & Extraction | 0 (0.0%) | 0 (0.0%) |
| Installation, Maintenance & Repair | 15 (100.0%) | 0 (0.0%) |
| Total (Category) | 33 (100.0%) | 0 (0.0%) |
| Total (Overall) | 85 (68.0%) | 40 (32.0%) |
Production, Transportation and Moving Occupations
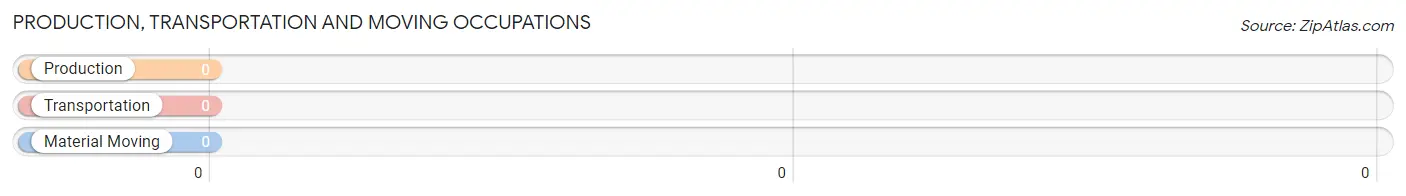
Production, Transportation and Moving Occupations by Sex
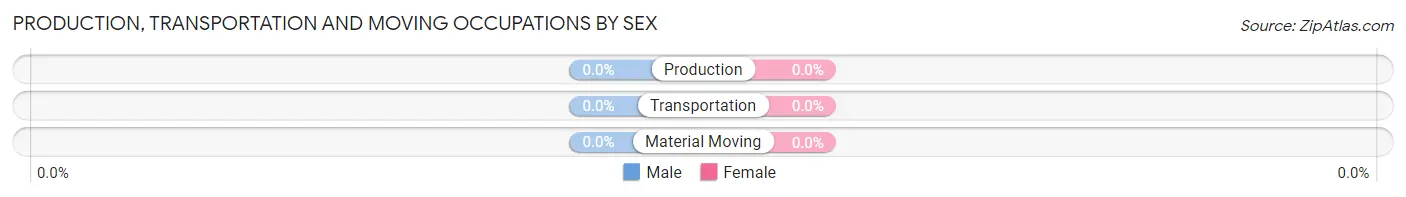
| Occupation | Male | Female |
| Production | 0 (0.0%) | 0 (0.0%) |
| Transportation | 0 (0.0%) | 0 (0.0%) |
| Material Moving | 0 (0.0%) | 0 (0.0%) |
| Total (Category) | 0 (0.0%) | 0 (0.0%) |
| Total (Overall) | 85 (68.0%) | 40 (32.0%) |
Employment Industries by Sex in Willard
Employment Industries in Willard
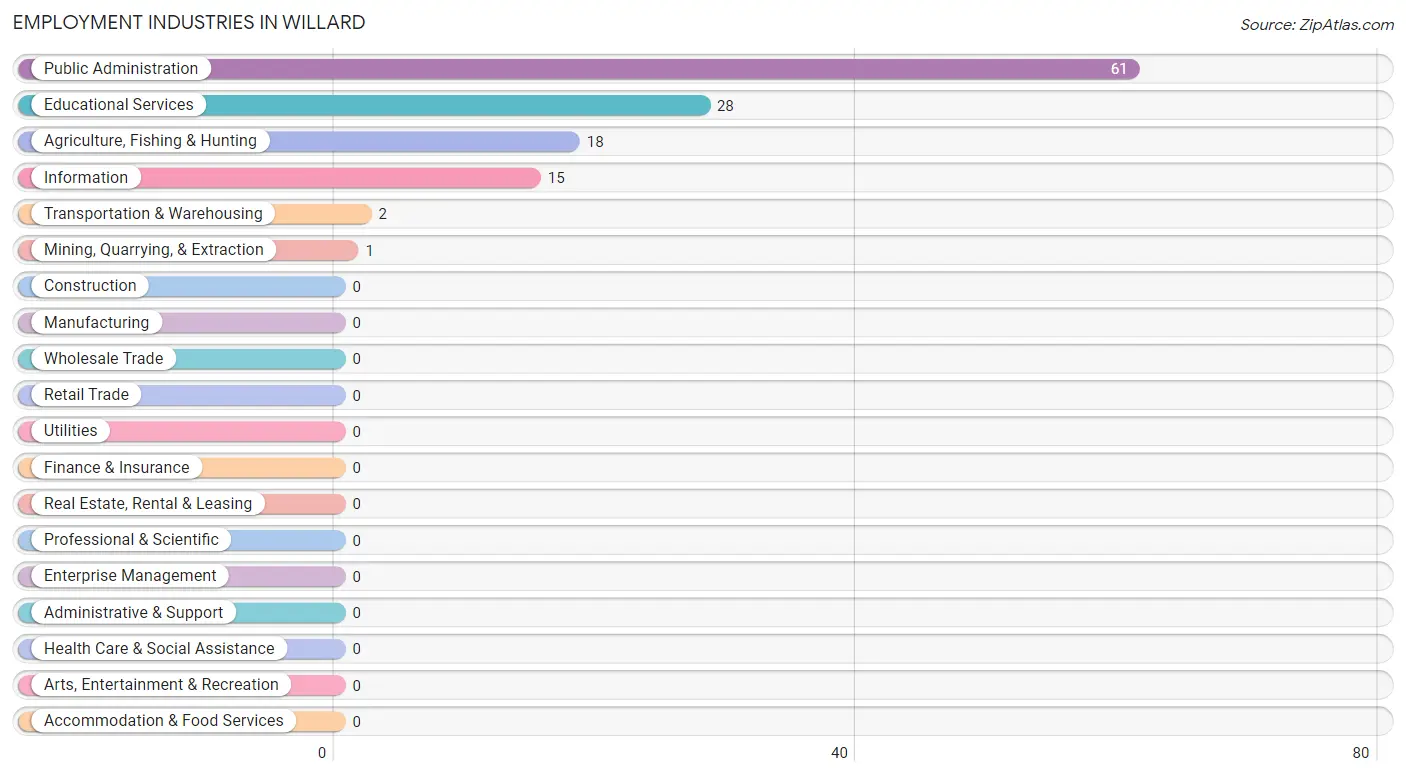
The major employment industries in Willard include Public Administration (61 | 48.8%), Educational Services (28 | 22.4%), Agriculture, Fishing & Hunting (18 | 14.4%), Information (15 | 12.0%), and Transportation & Warehousing (2 | 1.6%).
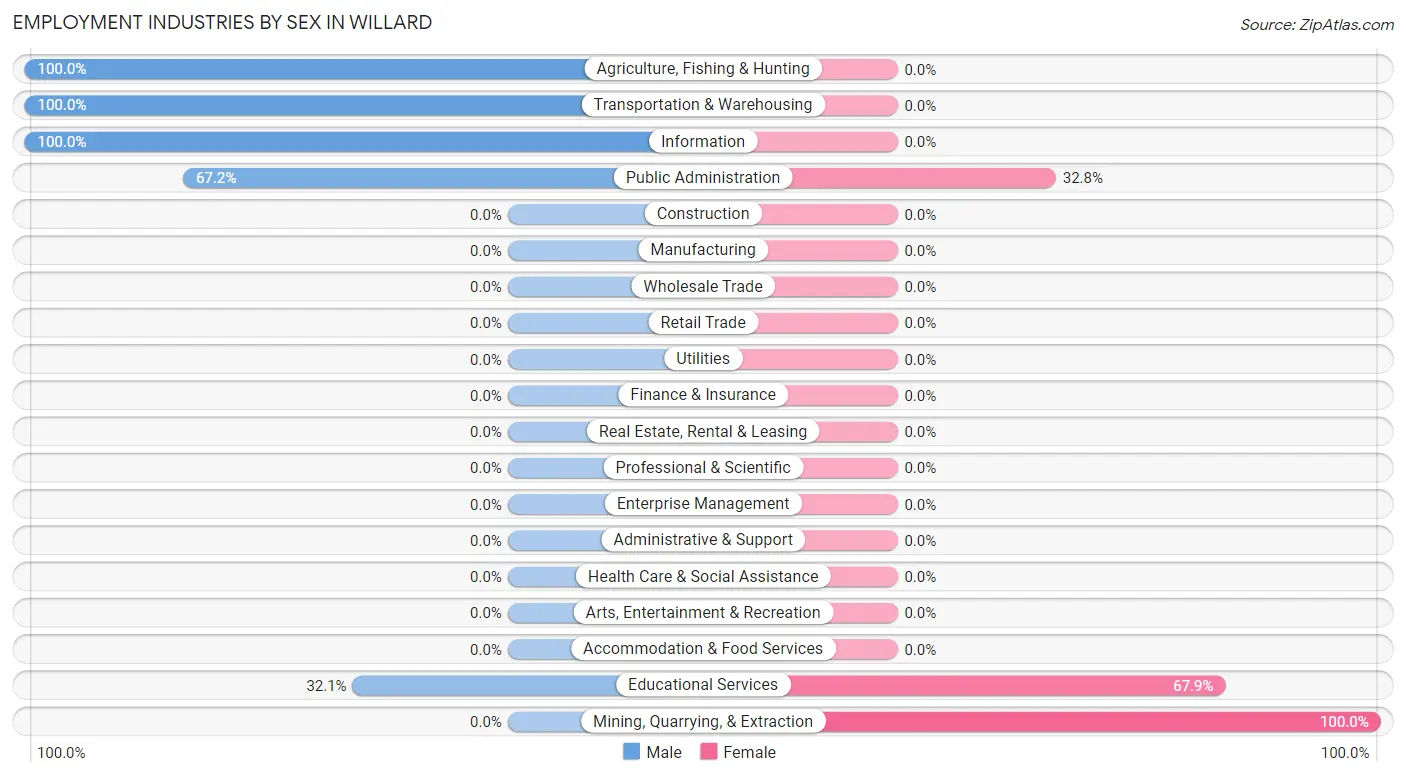
Employment Industries by Sex in Willard
The Willard industries that see more men than women are Agriculture, Fishing & Hunting (100.0%), Transportation & Warehousing (100.0%), and Information (100.0%), whereas the industries that tend to have a higher number of women are Mining, Quarrying, & Extraction (100.0%), Educational Services (67.9%), and Public Administration (32.8%).
| Industry | Male | Female |
| Agriculture, Fishing & Hunting | 18 (100.0%) | 0 (0.0%) |
| Mining, Quarrying, & Extraction | 0 (0.0%) | 1 (100.0%) |
| Construction | 0 (0.0%) | 0 (0.0%) |
| Manufacturing | 0 (0.0%) | 0 (0.0%) |
| Wholesale Trade | 0 (0.0%) | 0 (0.0%) |
| Retail Trade | 0 (0.0%) | 0 (0.0%) |
| Transportation & Warehousing | 2 (100.0%) | 0 (0.0%) |
| Utilities | 0 (0.0%) | 0 (0.0%) |
| Information | 15 (100.0%) | 0 (0.0%) |
| Finance & Insurance | 0 (0.0%) | 0 (0.0%) |
| Real Estate, Rental & Leasing | 0 (0.0%) | 0 (0.0%) |
| Professional & Scientific | 0 (0.0%) | 0 (0.0%) |
| Enterprise Management | 0 (0.0%) | 0 (0.0%) |
| Administrative & Support | 0 (0.0%) | 0 (0.0%) |
| Educational Services | 9 (32.1%) | 19 (67.9%) |
| Health Care & Social Assistance | 0 (0.0%) | 0 (0.0%) |
| Arts, Entertainment & Recreation | 0 (0.0%) | 0 (0.0%) |
| Accommodation & Food Services | 0 (0.0%) | 0 (0.0%) |
| Public Administration | 41 (67.2%) | 20 (32.8%) |
| Total | 85 (68.0%) | 40 (32.0%) |
Education in Willard
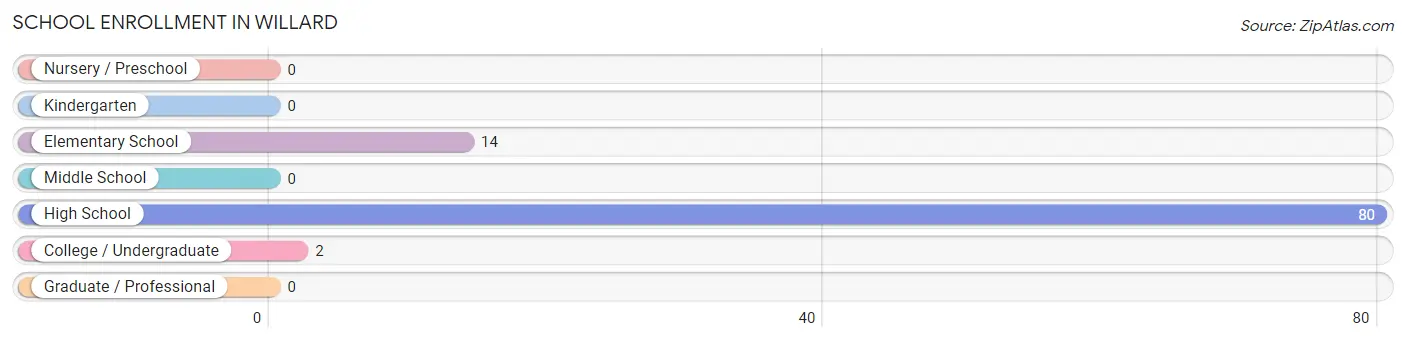
School Enrollment in Willard
The most common levels of schooling among the 96 students in Willard are high school (80 | 83.3%), elementary school (14 | 14.6%), and college / undergraduate (2 | 2.1%).
| School Level | # Students | % Students |
| Nursery / Preschool | 0 | 0.0% |
| Kindergarten | 0 | 0.0% |
| Elementary School | 14 | 14.6% |
| Middle School | 0 | 0.0% |
| High School | 80 | 83.3% |
| College / Undergraduate | 2 | 2.1% |
| Graduate / Professional | 0 | 0.0% |
| Total | 96 | 100.0% |
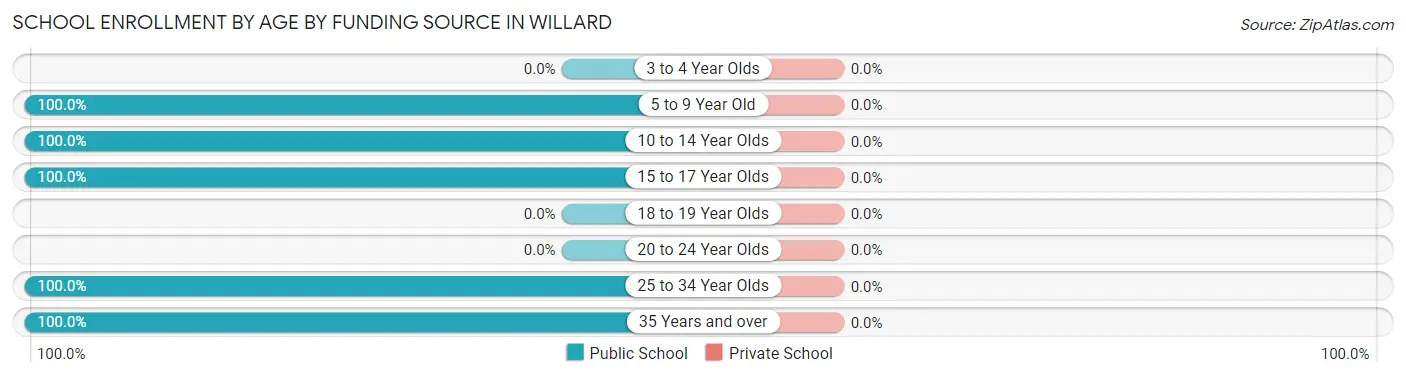
School Enrollment by Age by Funding Source in Willard
| Age Bracket | Public School | Private School |
| 3 to 4 Year Olds | 0 (0.0%) | 0 (0.0%) |
| 5 to 9 Year Old | 8 (100.0%) | 0 (0.0%) |
| 10 to 14 Year Olds | 12 (100.0%) | 0 (0.0%) |
| 15 to 17 Year Olds | 72 (100.0%) | 0 (0.0%) |
| 18 to 19 Year Olds | 0 (0.0%) | 0 (0.0%) |
| 20 to 24 Year Olds | 0 (0.0%) | 0 (0.0%) |
| 25 to 34 Year Olds | 2 (100.0%) | 0 (0.0%) |
| 35 Years and over | 2 (100.0%) | 0 (0.0%) |
| Total | 96 (100.0%) | 0 (0.0%) |
Educational Attainment by Field of Study in Willard
Business (33 | 44.6%), arts & humanities (20 | 27.0%), liberal arts & history (14 | 18.9%), psychology (6 | 8.1%), and bio, nature & agricultural (1 | 1.3%) are the most common fields of study among 74 individuals in Willard who have obtained a bachelor's degree or higher.
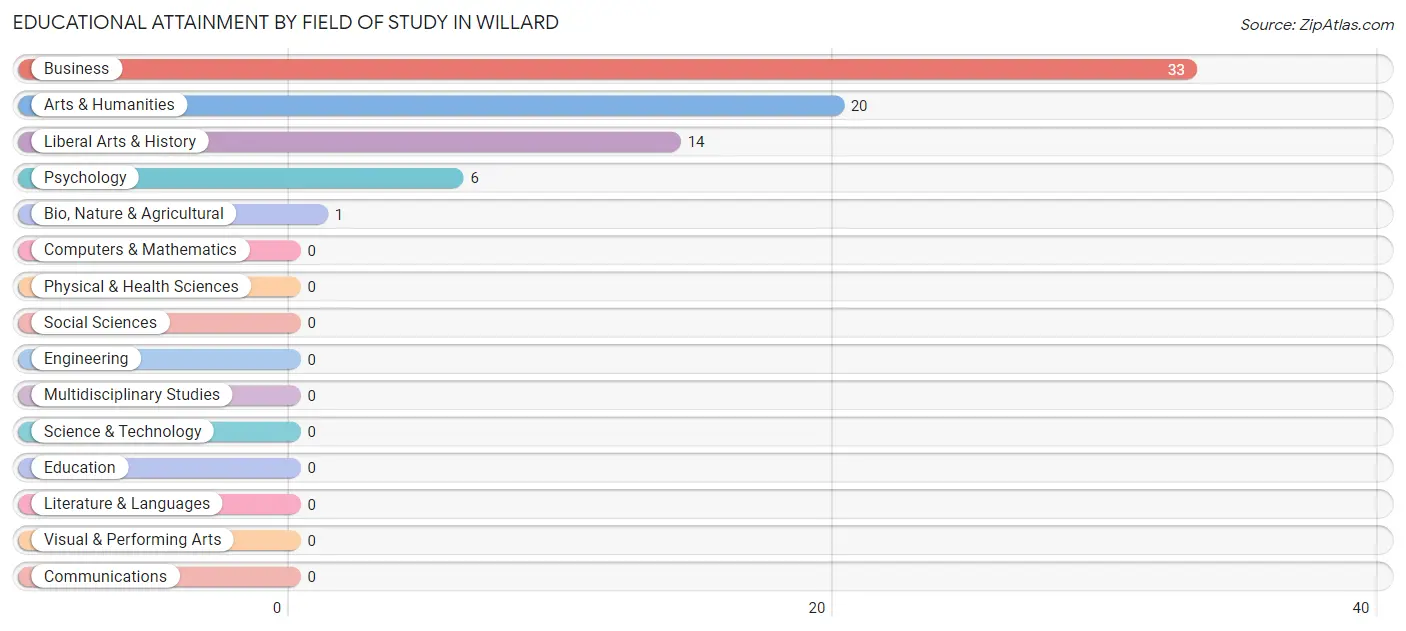
| Field of Study | # Graduates | % Graduates |
| Computers & Mathematics | 0 | 0.0% |
| Bio, Nature & Agricultural | 1 | 1.3% |
| Physical & Health Sciences | 0 | 0.0% |
| Psychology | 6 | 8.1% |
| Social Sciences | 0 | 0.0% |
| Engineering | 0 | 0.0% |
| Multidisciplinary Studies | 0 | 0.0% |
| Science & Technology | 0 | 0.0% |
| Business | 33 | 44.6% |
| Education | 0 | 0.0% |
| Literature & Languages | 0 | 0.0% |
| Liberal Arts & History | 14 | 18.9% |
| Visual & Performing Arts | 0 | 0.0% |
| Communications | 0 | 0.0% |
| Arts & Humanities | 20 | 27.0% |
| Total | 74 | 100.0% |
Transportation & Commute in Willard
Vehicle Availability by Sex in Willard
The most prevalent vehicle ownership categories in Willard are males with 5 or more vehicles (33, accounting for 38.8%) and females with 5 or more vehicles (20, making up 82.5%).
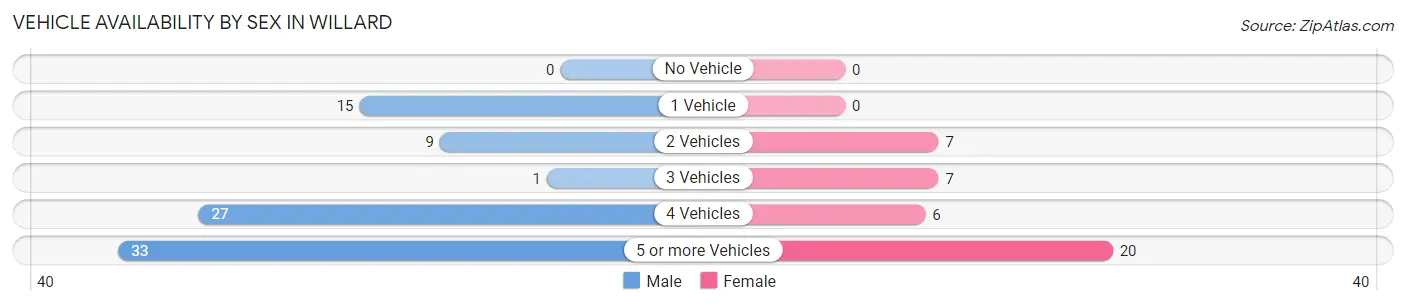
| Vehicles Available | Male | Female |
| No Vehicle | 0 (0.0%) | 0 (0.0%) |
| 1 Vehicle | 15 (17.6%) | 0 (0.0%) |
| 2 Vehicles | 9 (10.6%) | 7 (17.5%) |
| 3 Vehicles | 1 (1.2%) | 7 (17.5%) |
| 4 Vehicles | 27 (31.8%) | 6 (15.0%) |
| 5 or more Vehicles | 33 (38.8%) | 20 (50.0%) |
| Total | 85 (100.0%) | 40 (100.0%) |
Commute Time in Willard
The most frequently occuring commute durations in Willard are 20 to 24 minutes (59 commuters, 53.6%), 15 to 19 minutes (26 commuters, 23.6%), and 60 to 89 minutes (15 commuters, 13.6%).
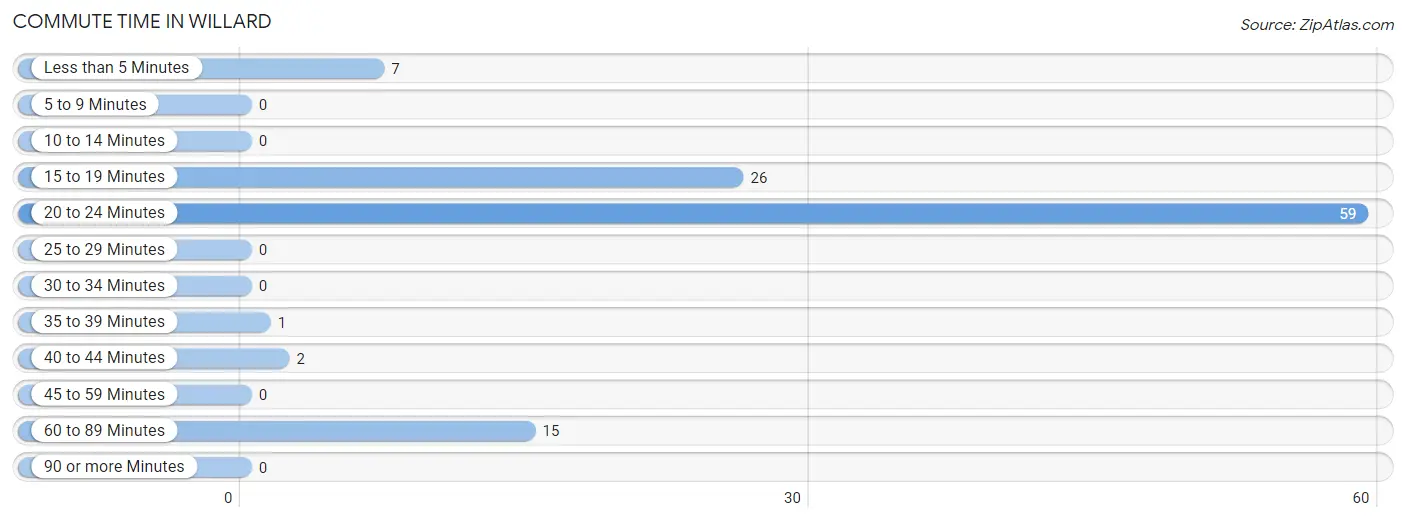
| Commute Time | # Commuters | % Commuters |
| Less than 5 Minutes | 7 | 6.4% |
| 5 to 9 Minutes | 0 | 0.0% |
| 10 to 14 Minutes | 0 | 0.0% |
| 15 to 19 Minutes | 26 | 23.6% |
| 20 to 24 Minutes | 59 | 53.6% |
| 25 to 29 Minutes | 0 | 0.0% |
| 30 to 34 Minutes | 0 | 0.0% |
| 35 to 39 Minutes | 1 | 0.9% |
| 40 to 44 Minutes | 2 | 1.8% |
| 45 to 59 Minutes | 0 | 0.0% |
| 60 to 89 Minutes | 15 | 13.6% |
| 90 or more Minutes | 0 | 0.0% |
Commute Time by Sex in Willard
The most common commute times in Willard are 20 to 24 minutes (33 commuters, 43.4%) for males and 20 to 24 minutes (26 commuters, 76.5%) for females.
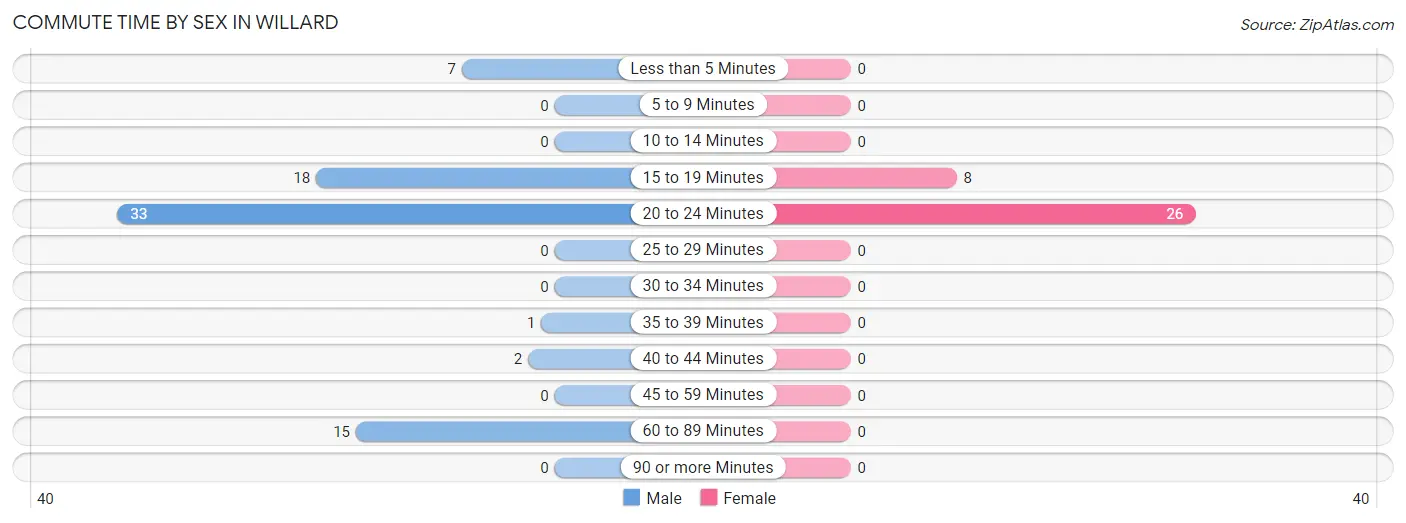
| Commute Time | Male | Female |
| Less than 5 Minutes | 7 (9.2%) | 0 (0.0%) |
| 5 to 9 Minutes | 0 (0.0%) | 0 (0.0%) |
| 10 to 14 Minutes | 0 (0.0%) | 0 (0.0%) |
| 15 to 19 Minutes | 18 (23.7%) | 8 (23.5%) |
| 20 to 24 Minutes | 33 (43.4%) | 26 (76.5%) |
| 25 to 29 Minutes | 0 (0.0%) | 0 (0.0%) |
| 30 to 34 Minutes | 0 (0.0%) | 0 (0.0%) |
| 35 to 39 Minutes | 1 (1.3%) | 0 (0.0%) |
| 40 to 44 Minutes | 2 (2.6%) | 0 (0.0%) |
| 45 to 59 Minutes | 0 (0.0%) | 0 (0.0%) |
| 60 to 89 Minutes | 15 (19.7%) | 0 (0.0%) |
| 90 or more Minutes | 0 (0.0%) | 0 (0.0%) |
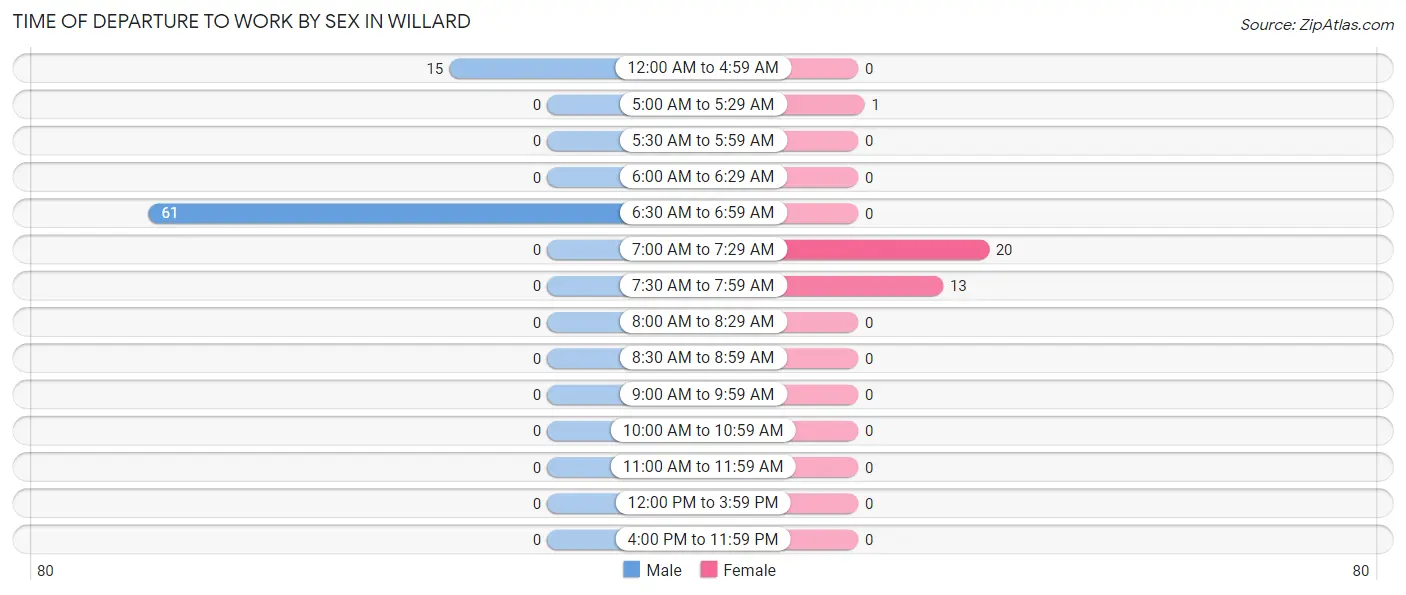
Time of Departure to Work by Sex in Willard
The most frequent times of departure to work in Willard are 6:30 AM to 6:59 AM (61, 80.3%) for males and 7:00 AM to 7:29 AM (20, 58.8%) for females.
| Time of Departure | Male | Female |
| 12:00 AM to 4:59 AM | 15 (19.7%) | 0 (0.0%) |
| 5:00 AM to 5:29 AM | 0 (0.0%) | 1 (2.9%) |
| 5:30 AM to 5:59 AM | 0 (0.0%) | 0 (0.0%) |
| 6:00 AM to 6:29 AM | 0 (0.0%) | 0 (0.0%) |
| 6:30 AM to 6:59 AM | 61 (80.3%) | 0 (0.0%) |
| 7:00 AM to 7:29 AM | 0 (0.0%) | 20 (58.8%) |
| 7:30 AM to 7:59 AM | 0 (0.0%) | 13 (38.2%) |
| 8:00 AM to 8:29 AM | 0 (0.0%) | 0 (0.0%) |
| 8:30 AM to 8:59 AM | 0 (0.0%) | 0 (0.0%) |
| 9:00 AM to 9:59 AM | 0 (0.0%) | 0 (0.0%) |
| 10:00 AM to 10:59 AM | 0 (0.0%) | 0 (0.0%) |
| 11:00 AM to 11:59 AM | 0 (0.0%) | 0 (0.0%) |
| 12:00 PM to 3:59 PM | 0 (0.0%) | 0 (0.0%) |
| 4:00 PM to 11:59 PM | 0 (0.0%) | 0 (0.0%) |
| Total | 76 (100.0%) | 34 (100.0%) |
Housing Occupancy in Willard
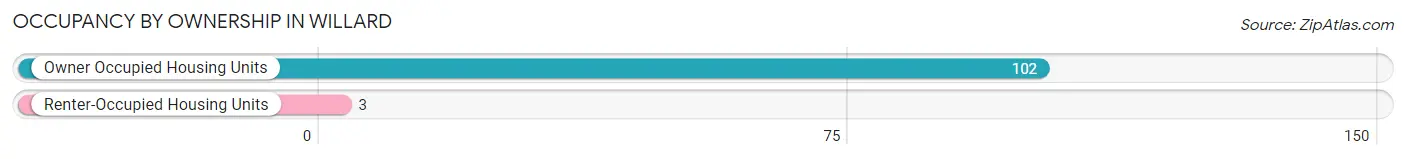
Occupancy by Ownership in Willard
Of the total 105 dwellings in Willard, owner-occupied units account for 102 (97.1%), while renter-occupied units make up 3 (2.9%).
| Occupancy | # Housing Units | % Housing Units |
| Owner Occupied Housing Units | 102 | 97.1% |
| Renter-Occupied Housing Units | 3 | 2.9% |
| Total Occupied Housing Units | 105 | 100.0% |
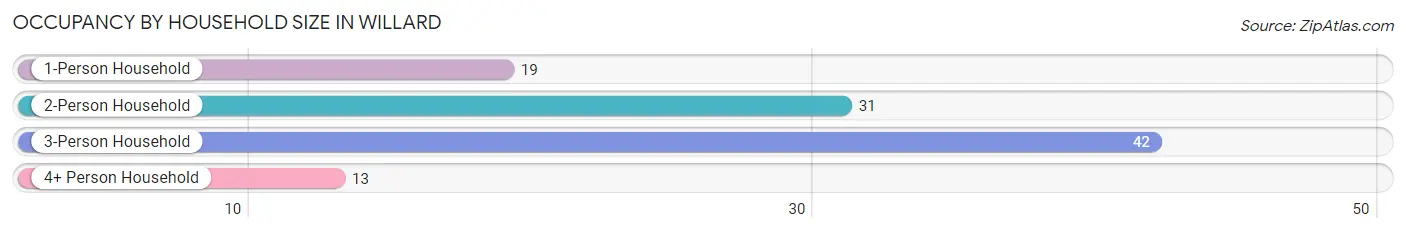
Occupancy by Household Size in Willard
| Household Size | # Housing Units | % Housing Units |
| 1-Person Household | 19 | 18.1% |
| 2-Person Household | 31 | 29.5% |
| 3-Person Household | 42 | 40.0% |
| 4+ Person Household | 13 | 12.4% |
| Total Housing Units | 105 | 100.0% |
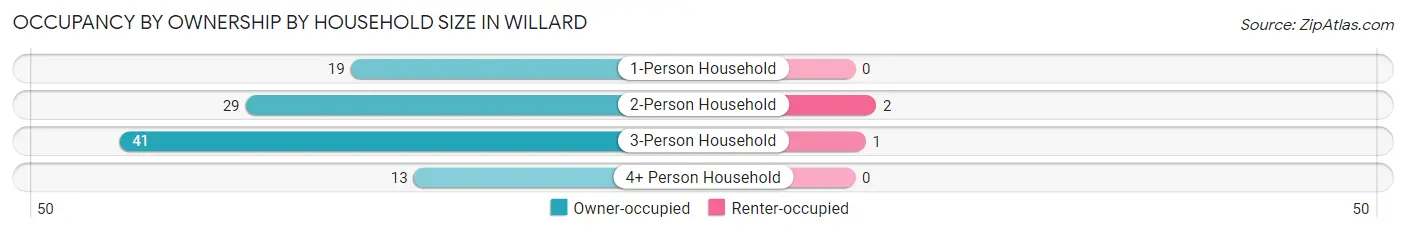
Occupancy by Ownership by Household Size in Willard
| Household Size | Owner-occupied | Renter-occupied |
| 1-Person Household | 19 (100.0%) | 0 (0.0%) |
| 2-Person Household | 29 (93.5%) | 2 (6.5%) |
| 3-Person Household | 41 (97.6%) | 1 (2.4%) |
| 4+ Person Household | 13 (100.0%) | 0 (0.0%) |
| Total Housing Units | 102 (97.1%) | 3 (2.9%) |
Occupancy by Educational Attainment in Willard
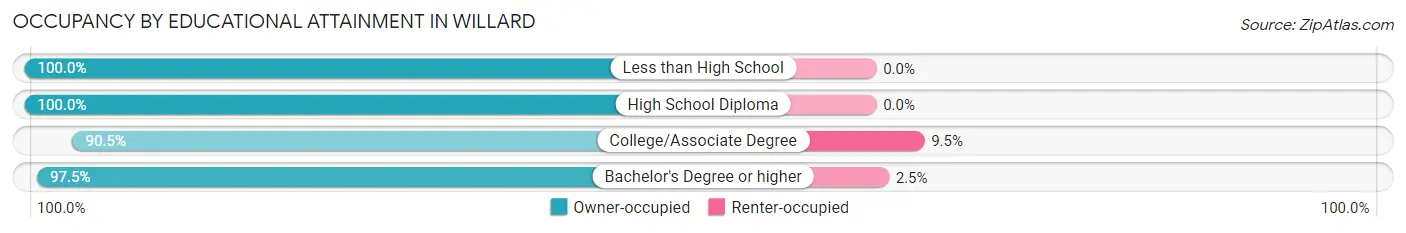
| Household Size | Owner-occupied | Renter-occupied |
| Less than High School | 20 (100.0%) | 0 (0.0%) |
| High School Diploma | 24 (100.0%) | 0 (0.0%) |
| College/Associate Degree | 19 (90.5%) | 2 (9.5%) |
| Bachelor's Degree or higher | 39 (97.5%) | 1 (2.5%) |
Occupancy by Age of Householder in Willard
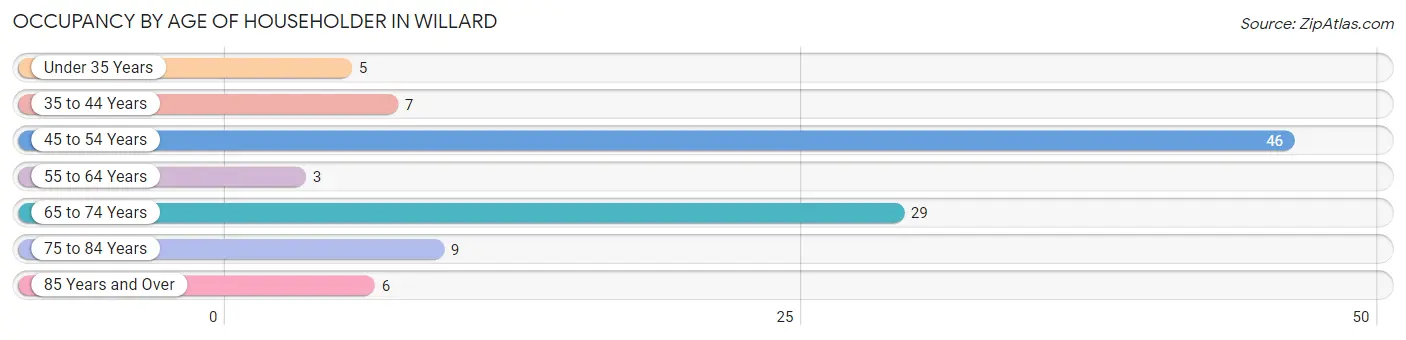
| Age Bracket | # Households | % Households |
| Under 35 Years | 5 | 4.8% |
| 35 to 44 Years | 7 | 6.7% |
| 45 to 54 Years | 46 | 43.8% |
| 55 to 64 Years | 3 | 2.9% |
| 65 to 74 Years | 29 | 27.6% |
| 75 to 84 Years | 9 | 8.6% |
| 85 Years and Over | 6 | 5.7% |
| Total | 105 | 100.0% |
Housing Finances in Willard
Median Income by Occupancy in Willard
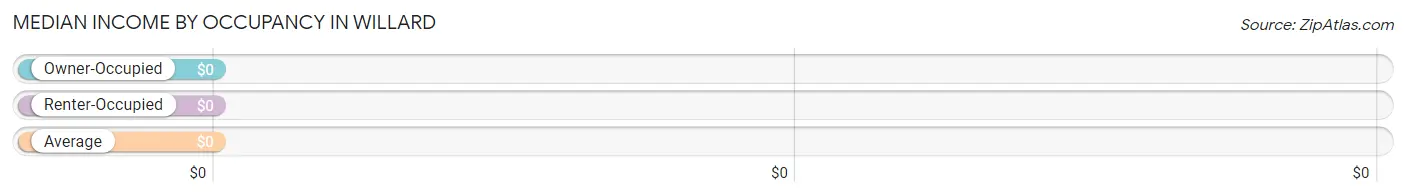
| Occupancy Type | # Households | Median Income |
| Owner-Occupied | 102 (97.1%) | $0 |
| Renter-Occupied | 3 (2.9%) | $0 |
| Average | 105 (100.0%) | $0 |
Occupancy by Householder Income Bracket in Willard
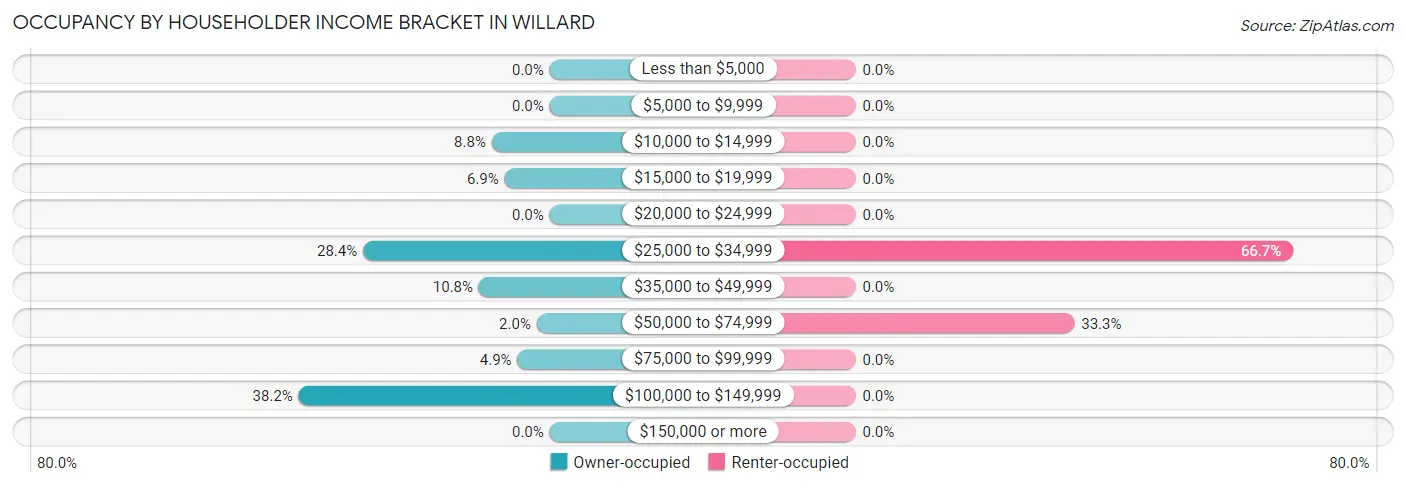
| Income Bracket | Owner-occupied | Renter-occupied |
| Less than $5,000 | 0 (0.0%) | 0 (0.0%) |
| $5,000 to $9,999 | 0 (0.0%) | 0 (0.0%) |
| $10,000 to $14,999 | 9 (8.8%) | 0 (0.0%) |
| $15,000 to $19,999 | 7 (6.9%) | 0 (0.0%) |
| $20,000 to $24,999 | 0 (0.0%) | 0 (0.0%) |
| $25,000 to $34,999 | 29 (28.4%) | 2 (66.7%) |
| $35,000 to $49,999 | 11 (10.8%) | 0 (0.0%) |
| $50,000 to $74,999 | 2 (2.0%) | 1 (33.3%) |
| $75,000 to $99,999 | 5 (4.9%) | 0 (0.0%) |
| $100,000 to $149,999 | 39 (38.2%) | 0 (0.0%) |
| $150,000 or more | 0 (0.0%) | 0 (0.0%) |
| Total | 102 (100.0%) | 3 (100.0%) |
Monthly Housing Cost Tiers in Willard
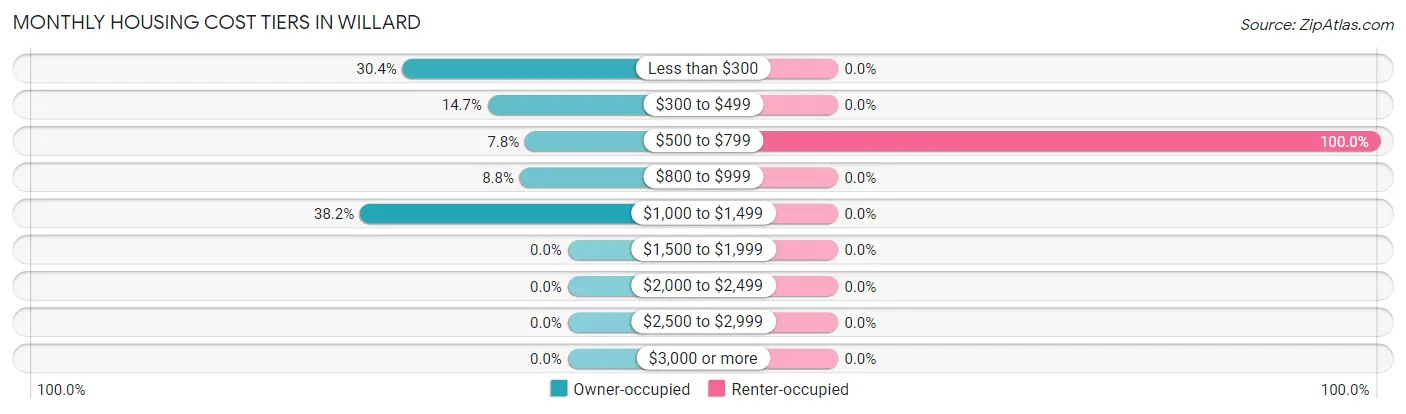
| Monthly Cost | Owner-occupied | Renter-occupied |
| Less than $300 | 31 (30.4%) | 0 (0.0%) |
| $300 to $499 | 15 (14.7%) | 0 (0.0%) |
| $500 to $799 | 8 (7.8%) | 3 (100.0%) |
| $800 to $999 | 9 (8.8%) | 0 (0.0%) |
| $1,000 to $1,499 | 39 (38.2%) | 0 (0.0%) |
| $1,500 to $1,999 | 0 (0.0%) | 0 (0.0%) |
| $2,000 to $2,499 | 0 (0.0%) | 0 (0.0%) |
| $2,500 to $2,999 | 0 (0.0%) | 0 (0.0%) |
| $3,000 or more | 0 (0.0%) | 0 (0.0%) |
| Total | 102 (100.0%) | 3 (100.0%) |
Physical Housing Characteristics in Willard
Housing Structures in Willard
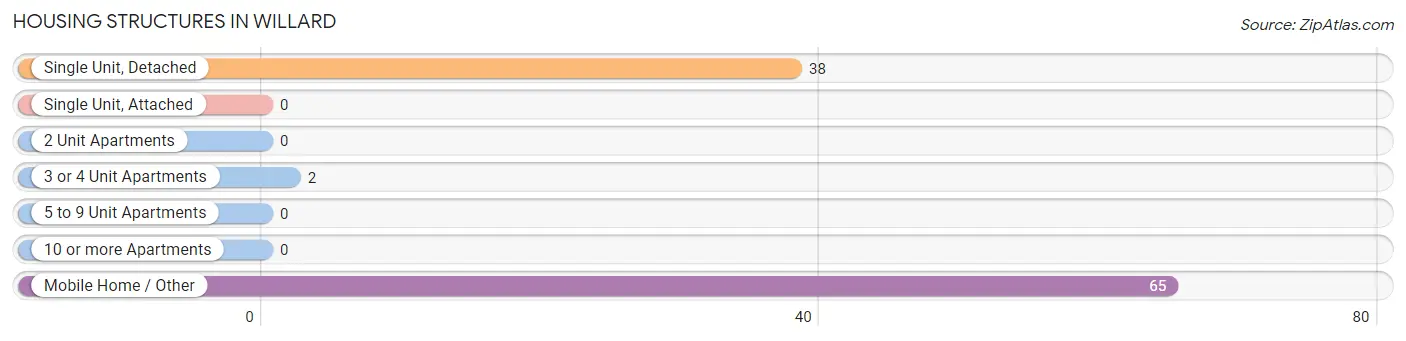
| Structure Type | # Housing Units | % Housing Units |
| Single Unit, Detached | 38 | 36.2% |
| Single Unit, Attached | 0 | 0.0% |
| 2 Unit Apartments | 0 | 0.0% |
| 3 or 4 Unit Apartments | 2 | 1.9% |
| 5 to 9 Unit Apartments | 0 | 0.0% |
| 10 or more Apartments | 0 | 0.0% |
| Mobile Home / Other | 65 | 61.9% |
| Total | 105 | 100.0% |
Housing Structures by Occupancy in Willard
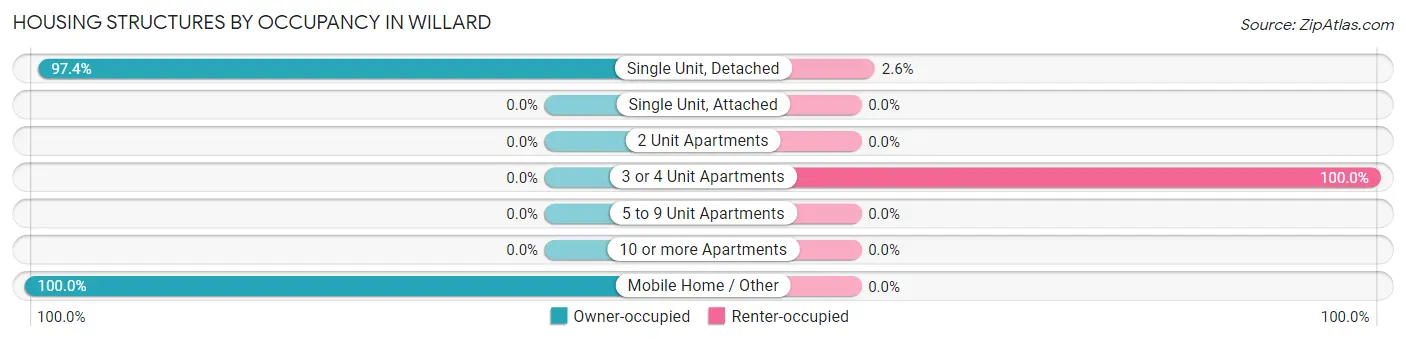
| Structure Type | Owner-occupied | Renter-occupied |
| Single Unit, Detached | 37 (97.4%) | 1 (2.6%) |
| Single Unit, Attached | 0 (0.0%) | 0 (0.0%) |
| 2 Unit Apartments | 0 (0.0%) | 0 (0.0%) |
| 3 or 4 Unit Apartments | 0 (0.0%) | 2 (100.0%) |
| 5 to 9 Unit Apartments | 0 (0.0%) | 0 (0.0%) |
| 10 or more Apartments | 0 (0.0%) | 0 (0.0%) |
| Mobile Home / Other | 65 (100.0%) | 0 (0.0%) |
| Total | 102 (97.1%) | 3 (2.9%) |
Housing Structures by Number of Rooms in Willard
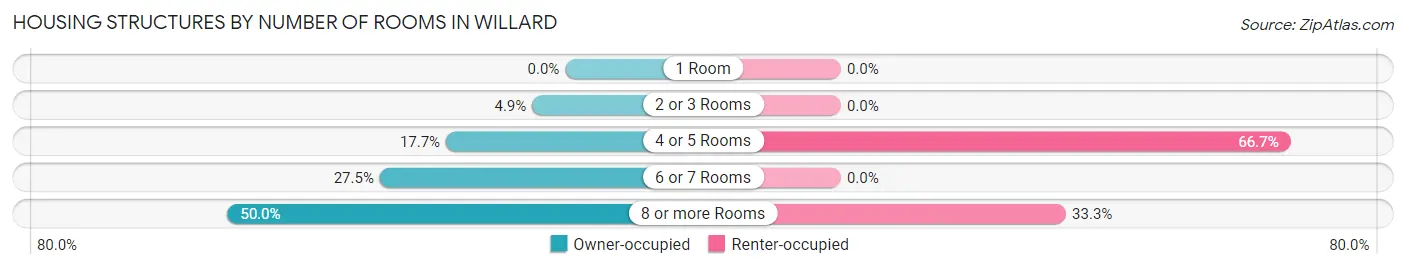
| Number of Rooms | Owner-occupied | Renter-occupied |
| 1 Room | 0 (0.0%) | 0 (0.0%) |
| 2 or 3 Rooms | 5 (4.9%) | 0 (0.0%) |
| 4 or 5 Rooms | 18 (17.6%) | 2 (66.7%) |
| 6 or 7 Rooms | 28 (27.5%) | 0 (0.0%) |
| 8 or more Rooms | 51 (50.0%) | 1 (33.3%) |
| Total | 102 (100.0%) | 3 (100.0%) |
Housing Structure by Heating Type in Willard
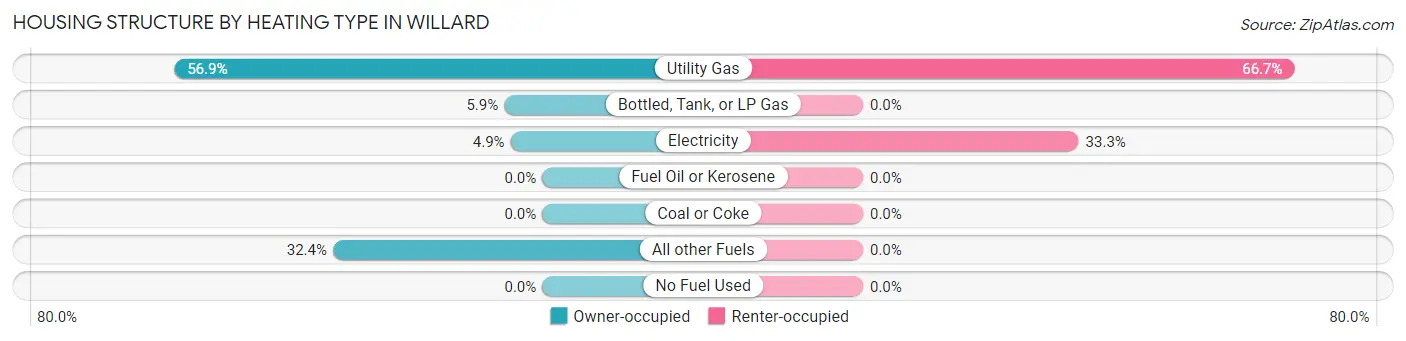
| Heating Type | Owner-occupied | Renter-occupied |
| Utility Gas | 58 (56.9%) | 2 (66.7%) |
| Bottled, Tank, or LP Gas | 6 (5.9%) | 0 (0.0%) |
| Electricity | 5 (4.9%) | 1 (33.3%) |
| Fuel Oil or Kerosene | 0 (0.0%) | 0 (0.0%) |
| Coal or Coke | 0 (0.0%) | 0 (0.0%) |
| All other Fuels | 33 (32.4%) | 0 (0.0%) |
| No Fuel Used | 0 (0.0%) | 0 (0.0%) |
| Total | 102 (100.0%) | 3 (100.0%) |
Household Vehicle Usage in Willard
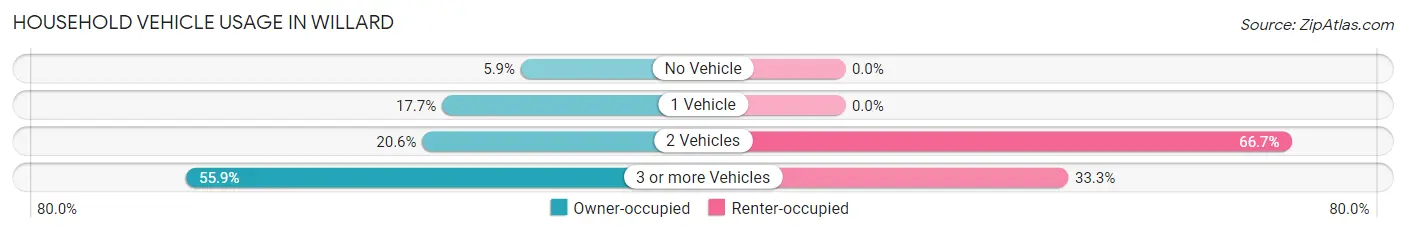
| Vehicles per Household | Owner-occupied | Renter-occupied |
| No Vehicle | 6 (5.9%) | 0 (0.0%) |
| 1 Vehicle | 18 (17.6%) | 0 (0.0%) |
| 2 Vehicles | 21 (20.6%) | 2 (66.7%) |
| 3 or more Vehicles | 57 (55.9%) | 1 (33.3%) |
| Total | 102 (100.0%) | 3 (100.0%) |
Real Estate & Mortgages in Willard
Real Estate and Mortgage Overview in Willard
| Characteristic | Without Mortgage | With Mortgage |
| Housing Units | 54 | 48 |
| Median Property Value | $86,700 | $94,500 |
| Median Household Income | $28,462 | $0 |
| Monthly Housing Costs | $285 | $0 |
| Real Estate Taxes | $357 | $0 |
Property Value by Mortgage Status in Willard
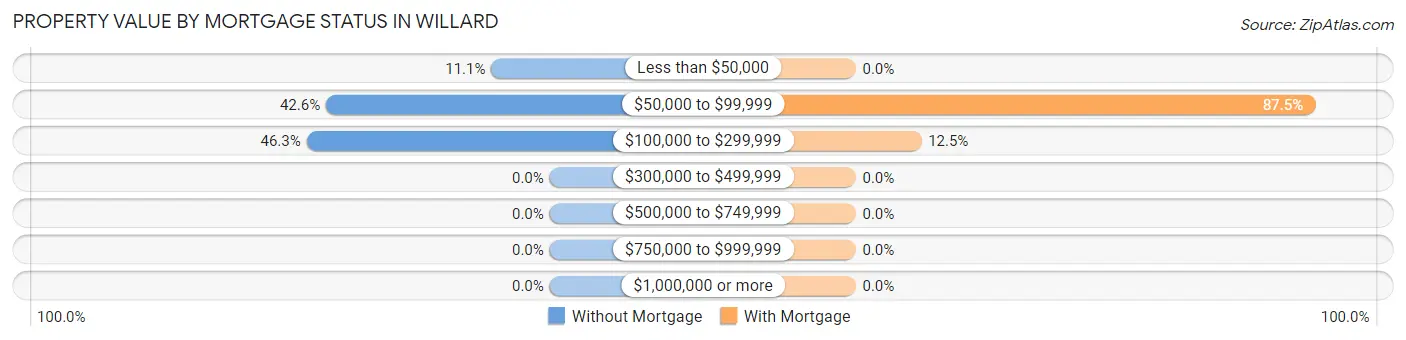
| Property Value | Without Mortgage | With Mortgage |
| Less than $50,000 | 6 (11.1%) | 0 (0.0%) |
| $50,000 to $99,999 | 23 (42.6%) | 42 (87.5%) |
| $100,000 to $299,999 | 25 (46.3%) | 6 (12.5%) |
| $300,000 to $499,999 | 0 (0.0%) | 0 (0.0%) |
| $500,000 to $749,999 | 0 (0.0%) | 0 (0.0%) |
| $750,000 to $999,999 | 0 (0.0%) | 0 (0.0%) |
| $1,000,000 or more | 0 (0.0%) | 0 (0.0%) |
| Total | 54 (100.0%) | 48 (100.0%) |
Household Income by Mortgage Status in Willard
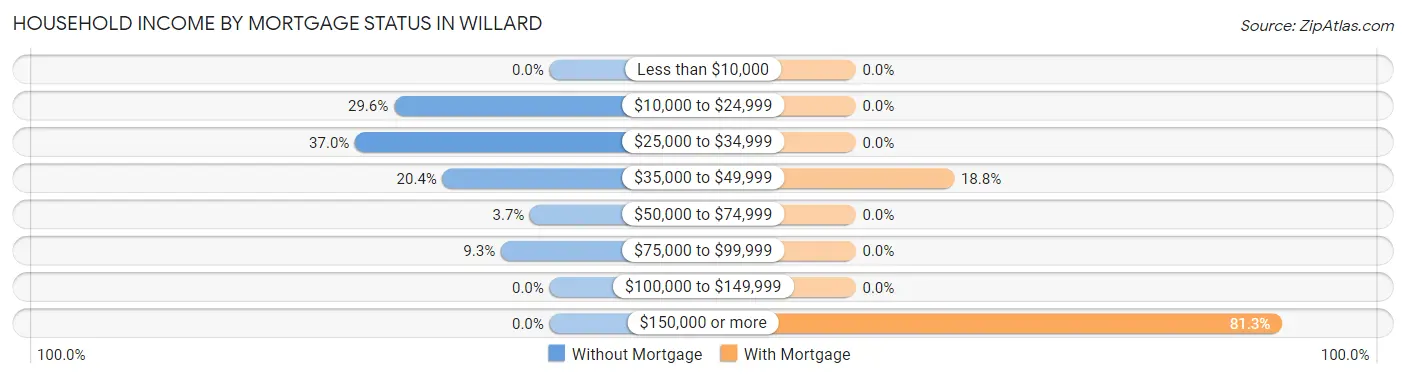
| Household Income | Without Mortgage | With Mortgage |
| Less than $10,000 | 0 (0.0%) | 0 (0.0%) |
| $10,000 to $24,999 | 16 (29.6%) | 0 (0.0%) |
| $25,000 to $34,999 | 20 (37.0%) | 0 (0.0%) |
| $35,000 to $49,999 | 11 (20.4%) | 9 (18.8%) |
| $50,000 to $74,999 | 2 (3.7%) | 0 (0.0%) |
| $75,000 to $99,999 | 5 (9.3%) | 0 (0.0%) |
| $100,000 to $149,999 | 0 (0.0%) | 0 (0.0%) |
| $150,000 or more | 0 (0.0%) | 39 (81.2%) |
| Total | 54 (100.0%) | 48 (100.0%) |
Property Value to Household Income Ratio in Willard
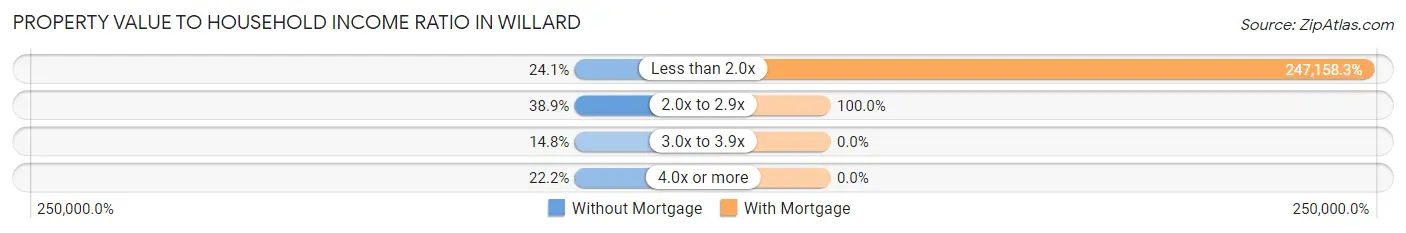
| Value-to-Income Ratio | Without Mortgage | With Mortgage |
| Less than 2.0x | 13 (24.1%) | 118,636 (247,158.3%) |
| 2.0x to 2.9x | 21 (38.9%) | 48 (100.0%) |
| 3.0x to 3.9x | 8 (14.8%) | 0 (0.0%) |
| 4.0x or more | 12 (22.2%) | 0 (0.0%) |
| Total | 54 (100.0%) | 48 (100.0%) |
Real Estate Taxes by Mortgage Status in Willard
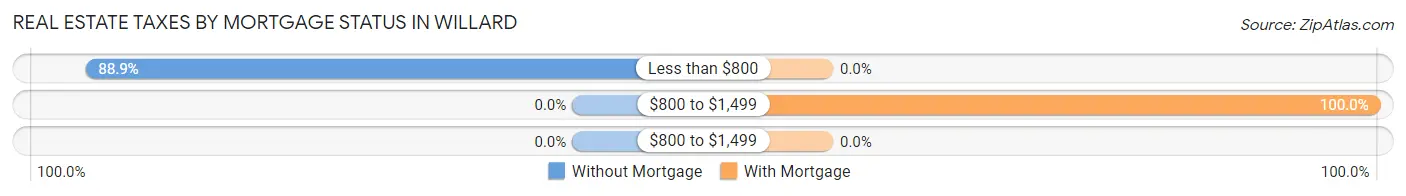
| Property Taxes | Without Mortgage | With Mortgage |
| Less than $800 | 48 (88.9%) | 0 (0.0%) |
| $800 to $1,499 | 0 (0.0%) | 48 (100.0%) |
| $800 to $1,499 | 0 (0.0%) | 0 (0.0%) |
| Total | 54 (100.0%) | 48 (100.0%) |
Health & Disability in Willard
Health Insurance Coverage by Age in Willard
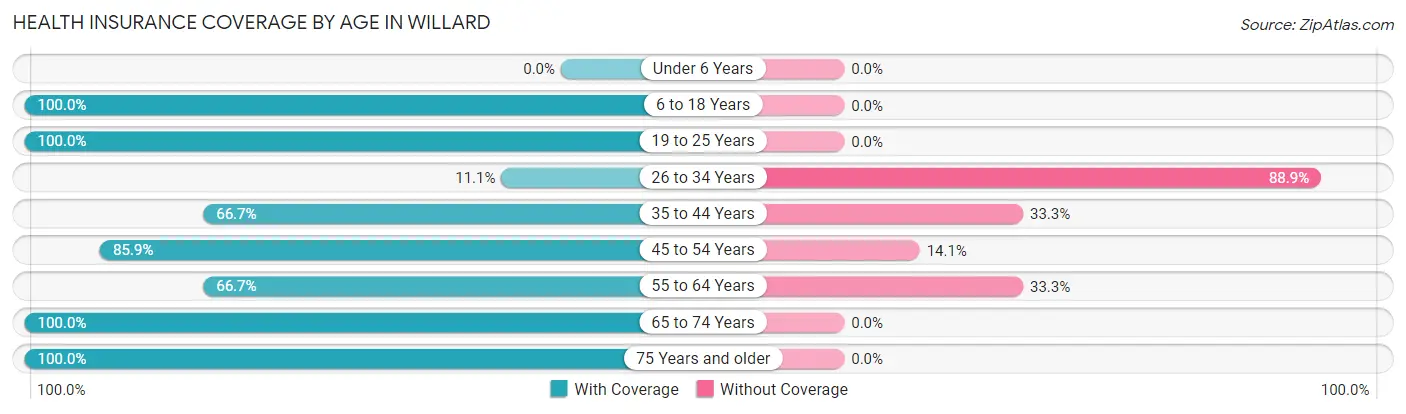
| Age Bracket | With Coverage | Without Coverage |
| Under 6 Years | 0 (0.0%) | 0 (0.0%) |
| 6 to 18 Years | 110 (100.0%) | 0 (0.0%) |
| 19 to 25 Years | 58 (100.0%) | 0 (0.0%) |
| 26 to 34 Years | 2 (11.1%) | 16 (88.9%) |
| 35 to 44 Years | 30 (66.7%) | 15 (33.3%) |
| 45 to 54 Years | 55 (85.9%) | 9 (14.1%) |
| 55 to 64 Years | 2 (66.7%) | 1 (33.3%) |
| 65 to 74 Years | 44 (100.0%) | 0 (0.0%) |
| 75 Years and older | 18 (100.0%) | 0 (0.0%) |
| Total | 319 (88.6%) | 41 (11.4%) |
Health Insurance Coverage by Citizenship Status in Willard
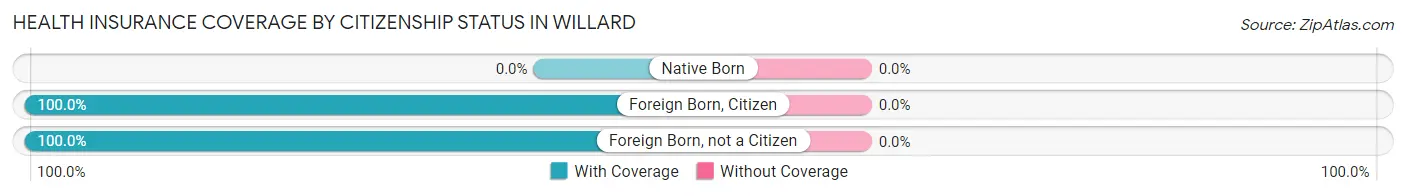
| Citizenship Status | With Coverage | Without Coverage |
| Native Born | 0 (0.0%) | 0 (0.0%) |
| Foreign Born, Citizen | 110 (100.0%) | 0 (0.0%) |
| Foreign Born, not a Citizen | 58 (100.0%) | 0 (0.0%) |
Health Insurance Coverage by Household Income in Willard
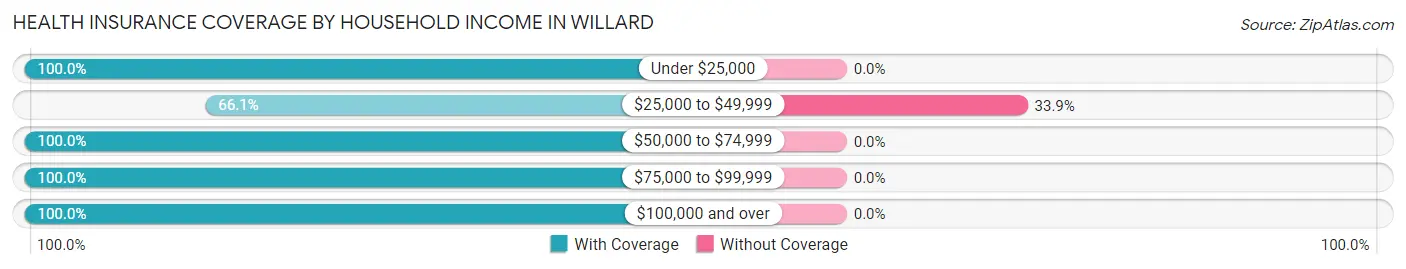
| Household Income | With Coverage | Without Coverage |
| Under $25,000 | 48 (100.0%) | 0 (0.0%) |
| $25,000 to $49,999 | 80 (66.1%) | 41 (33.9%) |
| $50,000 to $74,999 | 29 (100.0%) | 0 (0.0%) |
| $75,000 to $99,999 | 12 (100.0%) | 0 (0.0%) |
| $100,000 and over | 150 (100.0%) | 0 (0.0%) |
Public vs Private Health Insurance Coverage by Age in Willard
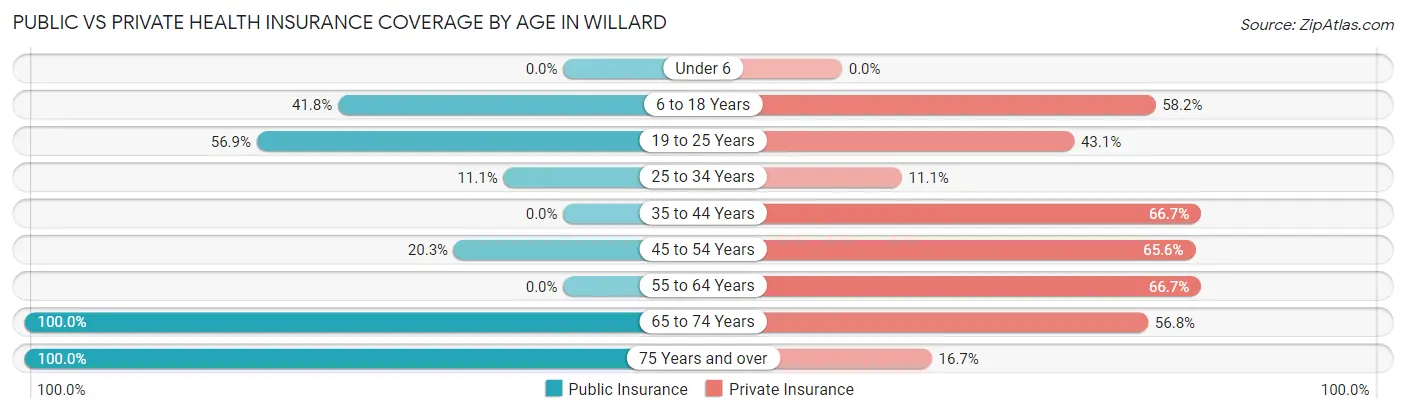
| Age Bracket | Public Insurance | Private Insurance |
| Under 6 | 0 (0.0%) | 0 (0.0%) |
| 6 to 18 Years | 46 (41.8%) | 64 (58.2%) |
| 19 to 25 Years | 33 (56.9%) | 25 (43.1%) |
| 25 to 34 Years | 2 (11.1%) | 2 (11.1%) |
| 35 to 44 Years | 0 (0.0%) | 30 (66.7%) |
| 45 to 54 Years | 13 (20.3%) | 42 (65.6%) |
| 55 to 64 Years | 0 (0.0%) | 2 (66.7%) |
| 65 to 74 Years | 44 (100.0%) | 25 (56.8%) |
| 75 Years and over | 18 (100.0%) | 3 (16.7%) |
| Total | 156 (43.3%) | 193 (53.6%) |
Disability Status by Sex by Age in Willard
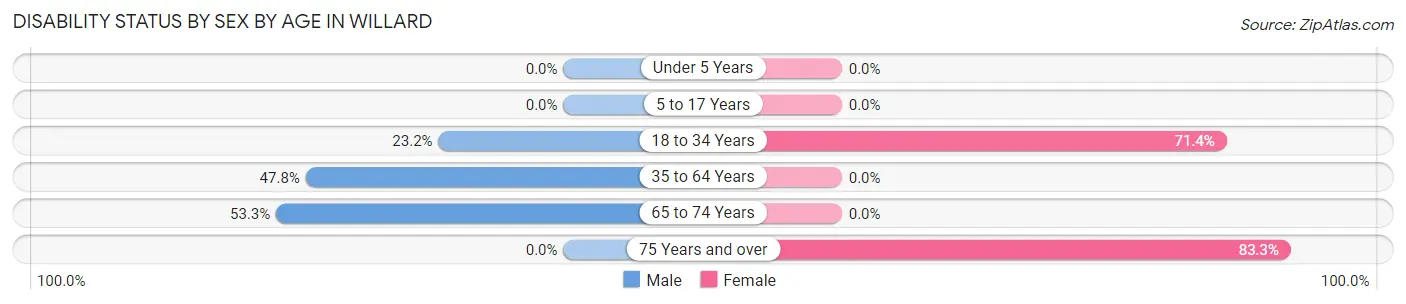
| Age Bracket | Male | Female |
| Under 5 Years | 0 (0.0%) | 0 (0.0%) |
| 5 to 17 Years | 0 (0.0%) | 0 (0.0%) |
| 18 to 34 Years | 16 (23.2%) | 5 (71.4%) |
| 35 to 64 Years | 33 (47.8%) | 0 (0.0%) |
| 65 to 74 Years | 8 (53.3%) | 0 (0.0%) |
| 75 Years and over | 0 (0.0%) | 15 (83.3%) |
Disability Class by Sex by Age in Willard
Disability Class: Hearing Difficulty
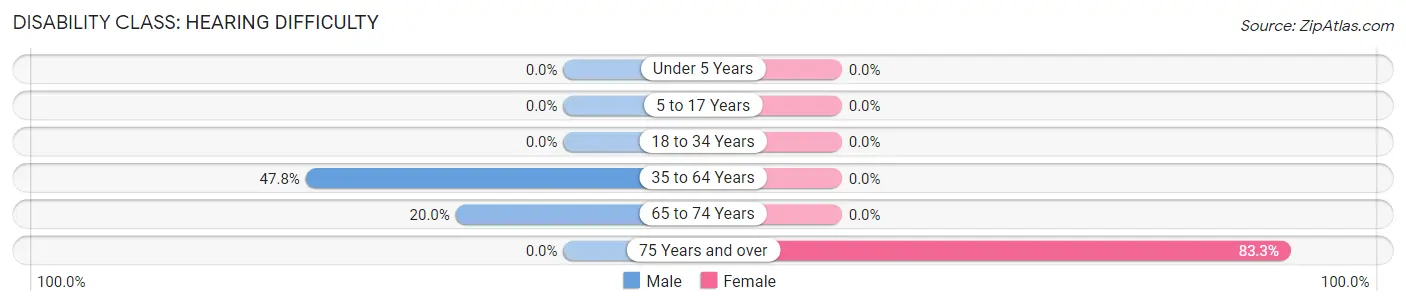
| Age Bracket | Male | Female |
| Under 5 Years | 0 (0.0%) | 0 (0.0%) |
| 5 to 17 Years | 0 (0.0%) | 0 (0.0%) |
| 18 to 34 Years | 0 (0.0%) | 0 (0.0%) |
| 35 to 64 Years | 33 (47.8%) | 0 (0.0%) |
| 65 to 74 Years | 3 (20.0%) | 0 (0.0%) |
| 75 Years and over | 0 (0.0%) | 15 (83.3%) |
Disability Class: Vision Difficulty
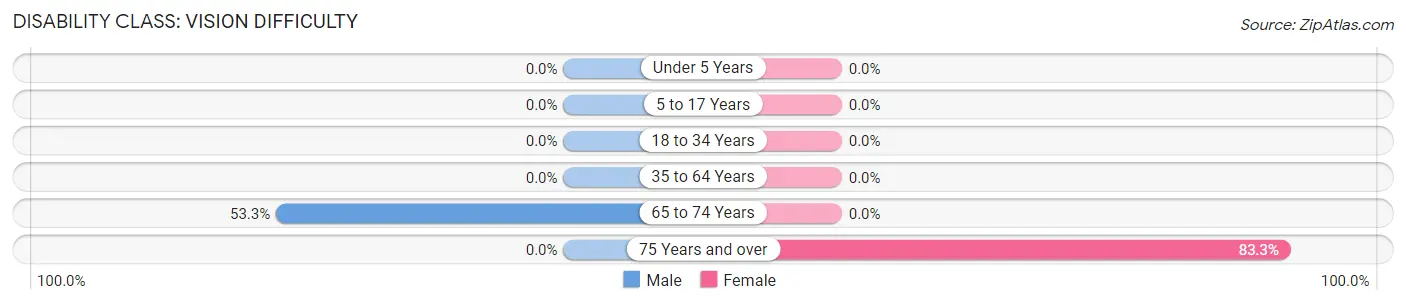
| Age Bracket | Male | Female |
| Under 5 Years | 0 (0.0%) | 0 (0.0%) |
| 5 to 17 Years | 0 (0.0%) | 0 (0.0%) |
| 18 to 34 Years | 0 (0.0%) | 0 (0.0%) |
| 35 to 64 Years | 0 (0.0%) | 0 (0.0%) |
| 65 to 74 Years | 8 (53.3%) | 0 (0.0%) |
| 75 Years and over | 0 (0.0%) | 15 (83.3%) |
Disability Class: Cognitive Difficulty
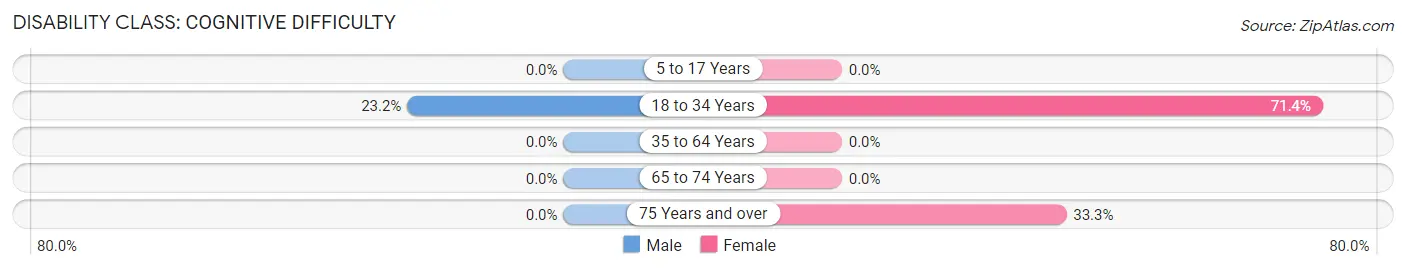
| Age Bracket | Male | Female |
| 5 to 17 Years | 0 (0.0%) | 0 (0.0%) |
| 18 to 34 Years | 16 (23.2%) | 5 (71.4%) |
| 35 to 64 Years | 0 (0.0%) | 0 (0.0%) |
| 65 to 74 Years | 0 (0.0%) | 0 (0.0%) |
| 75 Years and over | 0 (0.0%) | 6 (33.3%) |
Disability Class: Ambulatory Difficulty
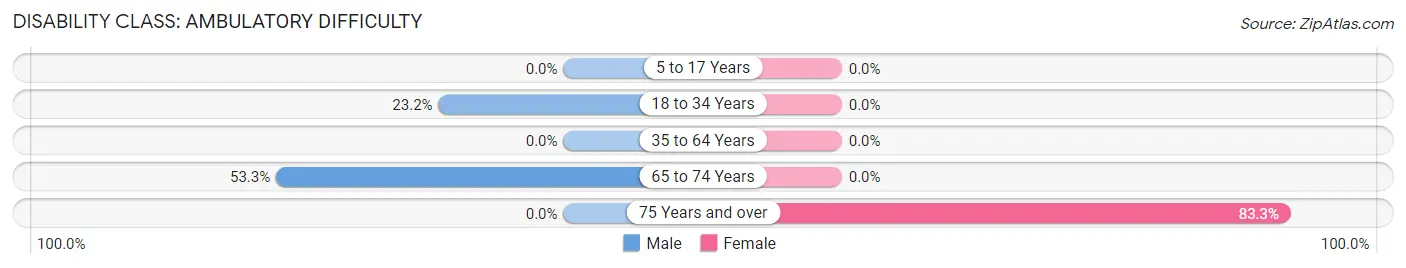
| Age Bracket | Male | Female |
| 5 to 17 Years | 0 (0.0%) | 0 (0.0%) |
| 18 to 34 Years | 16 (23.2%) | 0 (0.0%) |
| 35 to 64 Years | 0 (0.0%) | 0 (0.0%) |
| 65 to 74 Years | 8 (53.3%) | 0 (0.0%) |
| 75 Years and over | 0 (0.0%) | 15 (83.3%) |
Disability Class: Self-Care Difficulty
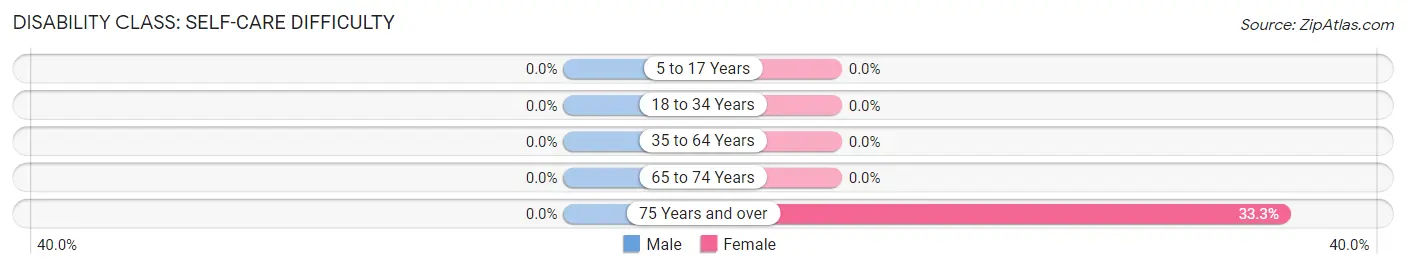
| Age Bracket | Male | Female |
| 5 to 17 Years | 0 (0.0%) | 0 (0.0%) |
| 18 to 34 Years | 0 (0.0%) | 0 (0.0%) |
| 35 to 64 Years | 0 (0.0%) | 0 (0.0%) |
| 65 to 74 Years | 0 (0.0%) | 0 (0.0%) |
| 75 Years and over | 0 (0.0%) | 6 (33.3%) |
Technology Access in Willard
Computing Device Access in Willard
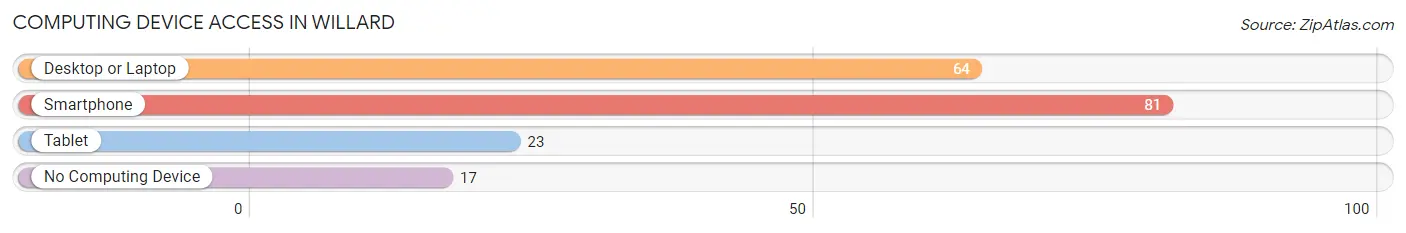
| Device Type | # Households | % Households |
| Desktop or Laptop | 64 | 61.0% |
| Smartphone | 81 | 77.1% |
| Tablet | 23 | 21.9% |
| No Computing Device | 17 | 16.2% |
| Total | 105 | 100.0% |
Internet Access in Willard
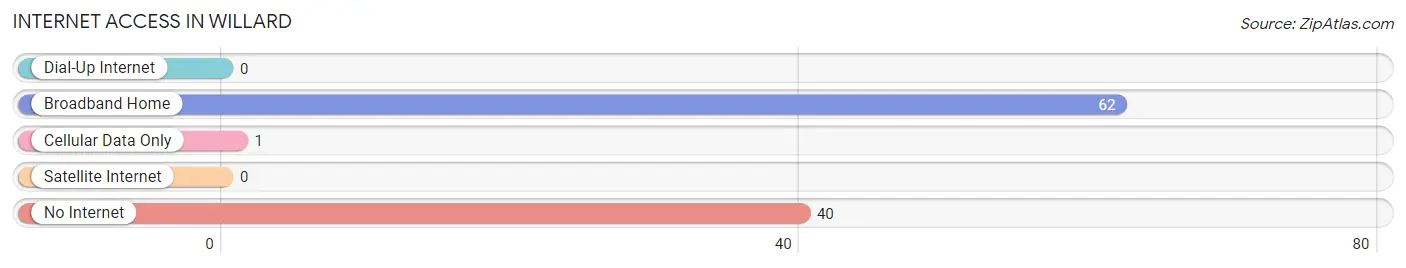
| Internet Type | # Households | % Households |
| Dial-Up Internet | 0 | 0.0% |
| Broadband Home | 62 | 59.1% |
| Cellular Data Only | 1 | 0.9% |
| Satellite Internet | 0 | 0.0% |
| No Internet | 40 | 38.1% |
| Total | 105 | 100.0% |
Willard Summary
Willard is a small unincorporated community located in the state of New Mexico. It is situated in the northwest corner of the state, near the border with Arizona. The town is located in the San Juan County, and is part of the Farmington Metropolitan Statistical Area. As of the 2010 census, the population of Willard was estimated to be around 1,000 people.
History
Willard was founded in the late 1800s by a group of settlers from the nearby town of Farmington. The settlers were looking for a place to settle and farm, and they chose the area around Willard because of its fertile soil and abundant water supply. The town was named after one of the settlers, William Willard.
The town grew slowly over the years, and by the early 1900s it had become a thriving agricultural community. The town was home to several stores, a post office, a school, and a church. In the 1920s, the town was connected to the rest of the state by a railroad line, which allowed for the transportation of goods and people.
Geography
Willard is located in the northwest corner of New Mexico, near the border with Arizona. The town is situated in the San Juan County, and is part of the Farmington Metropolitan Statistical Area. The town is located at an elevation of 4,890 feet above sea level.
The town is surrounded by a variety of landscapes, including desert, grasslands, and mountains. The nearby Chuska Mountains provide a stunning backdrop to the town. The nearby San Juan River also provides a source of water for the town.
Economy
The economy of Willard is largely based on agriculture. The town is home to several farms, which produce a variety of crops, including alfalfa, corn, and wheat. The town is also home to several small businesses, including a grocery store, a hardware store, and a gas station.
The town is also home to a number of tourist attractions, including the nearby Chuska Mountains and the San Juan River. The town is also home to a number of historic sites, including the old Willard Schoolhouse and the Willard Post Office.
Demographics
As of the 2010 census, the population of Willard was estimated to be around 1,000 people. The town is predominantly white, with around 90% of the population being of Caucasian descent. The remaining 10% of the population is made up of Native Americans, Hispanics, and African Americans.
The median household income in Willard is around $30,000, which is slightly lower than the national average. The town has a poverty rate of around 20%, which is higher than the national average. The town also has a high unemployment rate, with around 10% of the population being unemployed.
Willard is a small, rural town with a rich history and a unique culture. The town is home to a variety of landscapes, and is a popular destination for tourists. The town is also home to a number of small businesses, which provide employment opportunities for the local population. The town is a great place to live, work, and raise a family.
Common Questions
What is Per Capita Income in Willard?
Per Capita income in Willard is $19,778.
What is Inequality or Gini Index in Willard?
Inequality or Gini Index in Willard is 0.37.
What is the Total Population of Willard?
Total Population of Willard is 360.
What is the Total Male Population of Willard?
Total Male Population of Willard is 225.
What is the Total Female Population of Willard?
Total Female Population of Willard is 135.
What is the Ratio of Males per 100 Females in Willard?
There are 166.67 Males per 100 Females in Willard.
What is the Ratio of Females per 100 Males in Willard?
There are 60.00 Females per 100 Males in Willard.
What is the Median Population Age in Willard?
Median Population Age in Willard is 28.8 Years.
What is the Average Family Size in Willard
Average Family Size in Willard is 4.2 People.
What is the Average Household Size in Willard
Average Household Size in Willard is 3.4 People.
How Large is the Labor Force in Willard?
There are 150 People in the Labor Forcein in Willard.
What is the Percentage of People in the Labor Force in Willard?
47.8% of People are in the Labor Force in Willard.
What is the Unemployment Rate in Willard?
Unemployment Rate in Willard is 16.7%.