Estancia, NM Map & Demographics
Estancia Map
Estancia Overview
$25,162
PER CAPITA INCOME
$54,306
AVG FAMILY INCOME
$32,286
AVG HOUSEHOLD INCOME
24.1%
WAGE / INCOME GAP [ % ]
75.9¢/ $1
WAGE / INCOME GAP [ $ ]
0.48
INEQUALITY / GINI INDEX
1,591
TOTAL POPULATION
822
MALE POPULATION
769
FEMALE POPULATION
106.89
MALES / 100 FEMALES
93.55
FEMALES / 100 MALES
43.8
MEDIAN AGE
3.5
AVG FAMILY SIZE
2.5
AVG HOUSEHOLD SIZE
707
LABOR FORCE [ PEOPLE ]
51.8%
PERCENT IN LABOR FORCE
34.9%
UNEMPLOYMENT RATE
Estancia Zip Codes
Estancia Area Codes
Income in Estancia
Income Overview in Estancia
Per Capita Income in Estancia is $25,162, while median incomes of families and households are $54,306 and $32,286 respectively.
| Characteristic | Number | Measure |
| Per Capita Income | 1,591 | $25,162 |
| Median Family Income | 374 | $54,306 |
| Mean Family Income | 374 | $63,791 |
| Median Household Income | 626 | $32,286 |
| Mean Household Income | 626 | $53,518 |
| Income Deficit | 374 | $0 |
| Wage / Income Gap (%) | 1,591 | 24.11% |
| Wage / Income Gap ($) | 1,591 | 75.89¢ per $1 |
| Gini / Inequality Index | 1,591 | 0.48 |
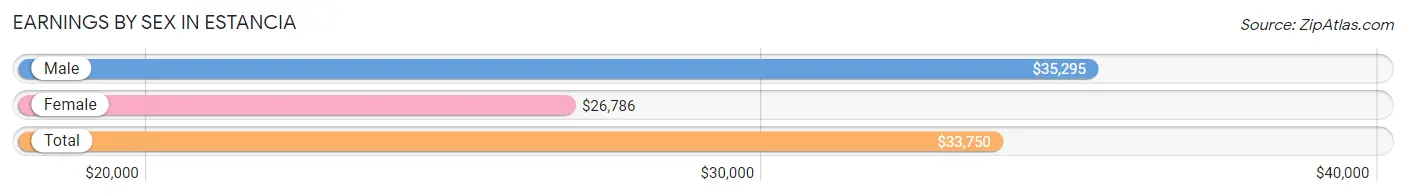
Earnings by Sex in Estancia
Average Earnings in Estancia are $33,750, $35,295 for men and $26,786 for women, a difference of 24.1%.
| Sex | Number | Average Earnings |
| Male | 455 (63.6%) | $35,295 |
| Female | 260 (36.4%) | $26,786 |
| Total | 715 (100.0%) | $33,750 |
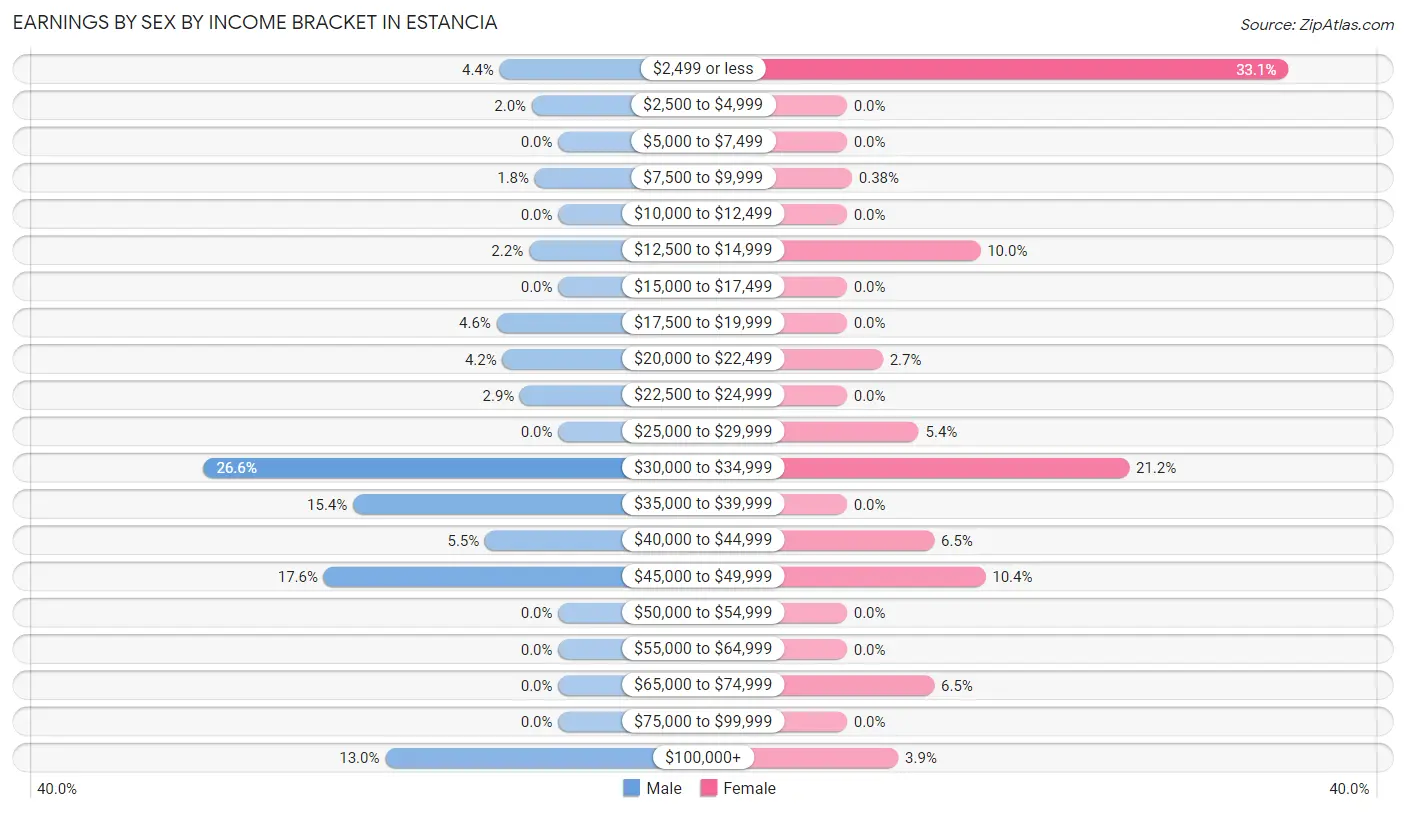
Earnings by Sex by Income Bracket in Estancia
The most common earnings brackets in Estancia are $30,000 to $34,999 for men (121 | 26.6%) and $2,499 or less for women (86 | 33.1%).
| Income | Male | Female |
| $2,499 or less | 20 (4.4%) | 86 (33.1%) |
| $2,500 to $4,999 | 9 (2.0%) | 0 (0.0%) |
| $5,000 to $7,499 | 0 (0.0%) | 0 (0.0%) |
| $7,500 to $9,999 | 8 (1.8%) | 1 (0.4%) |
| $10,000 to $12,499 | 0 (0.0%) | 0 (0.0%) |
| $12,500 to $14,999 | 10 (2.2%) | 26 (10.0%) |
| $15,000 to $17,499 | 0 (0.0%) | 0 (0.0%) |
| $17,500 to $19,999 | 21 (4.6%) | 0 (0.0%) |
| $20,000 to $22,499 | 19 (4.2%) | 7 (2.7%) |
| $22,500 to $24,999 | 13 (2.9%) | 0 (0.0%) |
| $25,000 to $29,999 | 0 (0.0%) | 14 (5.4%) |
| $30,000 to $34,999 | 121 (26.6%) | 55 (21.1%) |
| $35,000 to $39,999 | 70 (15.4%) | 0 (0.0%) |
| $40,000 to $44,999 | 25 (5.5%) | 17 (6.5%) |
| $45,000 to $49,999 | 80 (17.6%) | 27 (10.4%) |
| $50,000 to $54,999 | 0 (0.0%) | 0 (0.0%) |
| $55,000 to $64,999 | 0 (0.0%) | 0 (0.0%) |
| $65,000 to $74,999 | 0 (0.0%) | 17 (6.5%) |
| $75,000 to $99,999 | 0 (0.0%) | 0 (0.0%) |
| $100,000+ | 59 (13.0%) | 10 (3.8%) |
| Total | 455 (100.0%) | 260 (100.0%) |
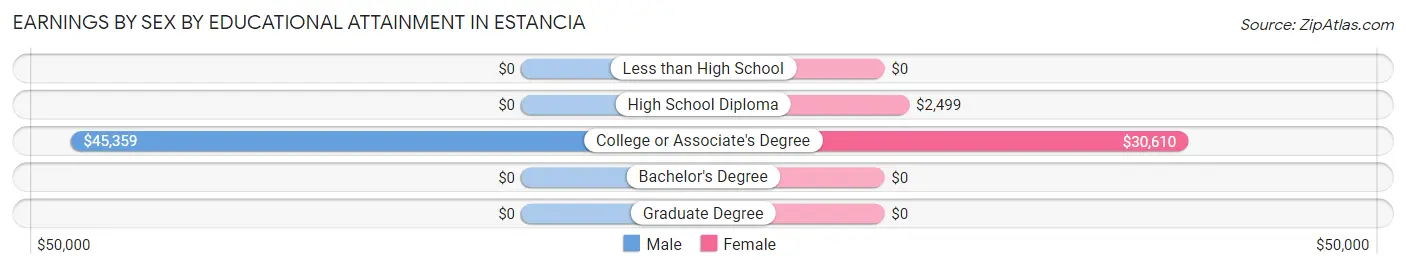
Earnings by Sex by Educational Attainment in Estancia
Average earnings in Estancia are $44,550 for men and $30,409 for women, a difference of 31.7%. Men with an educational attainment of college or associate's degree enjoy the highest average annual earnings of $45,359, while those with college or associate's degree education earn the least with $45,359. Women with an educational attainment of college or associate's degree earn the most with the average annual earnings of $30,610, while those with high school diploma education have the smallest earnings of $2,499.
| Educational Attainment | Male Income | Female Income |
| Less than High School | - | - |
| High School Diploma | - | - |
| College or Associate's Degree | $45,359 | $30,610 |
| Bachelor's Degree | - | - |
| Graduate Degree | - | - |
| Total | $44,550 | $30,409 |
Family Income in Estancia
Family Income Brackets in Estancia
According to the Estancia family income data, there are 84 families falling into the $50,000 to $74,999 income range, which is the most common income bracket and makes up 22.5% of all families.
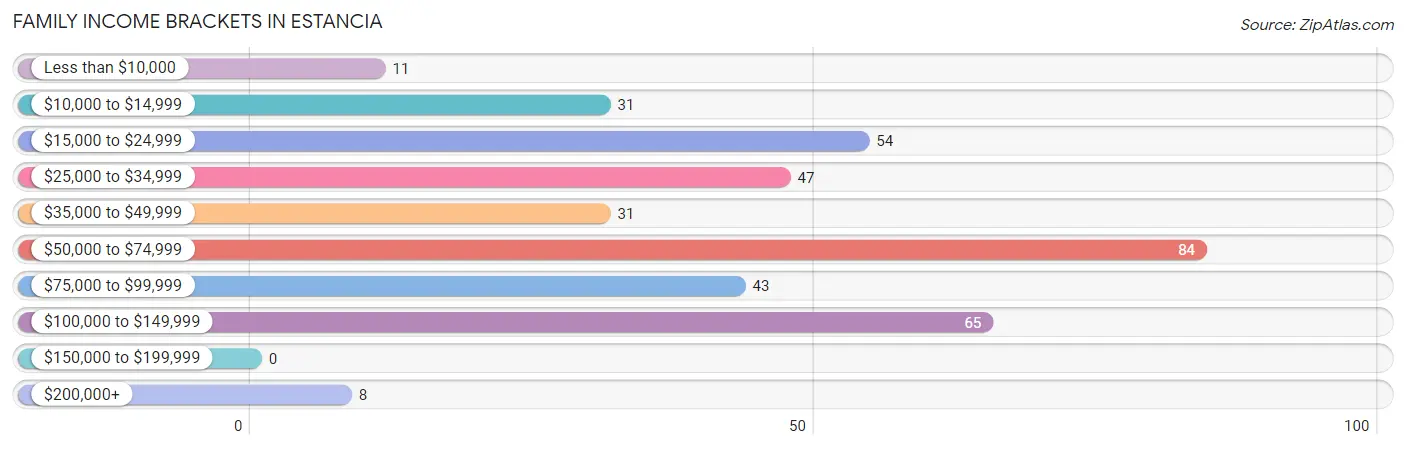
| Income Bracket | # Families | % Families |
| Less than $10,000 | 11 | 2.9% |
| $10,000 to $14,999 | 31 | 8.3% |
| $15,000 to $24,999 | 54 | 14.4% |
| $25,000 to $34,999 | 47 | 12.6% |
| $35,000 to $49,999 | 31 | 8.3% |
| $50,000 to $74,999 | 84 | 22.5% |
| $75,000 to $99,999 | 43 | 11.5% |
| $100,000 to $149,999 | 65 | 17.4% |
| $150,000 to $199,999 | 0 | 0.0% |
| $200,000+ | 8 | 2.1% |
Family Income by Famaliy Size in Estancia
5-person families (25 | 6.7%) account for the highest median family income in Estancia with $117,344 per family, while 5-person families (25 | 6.7%) have the highest median income of $23,469 per family member.
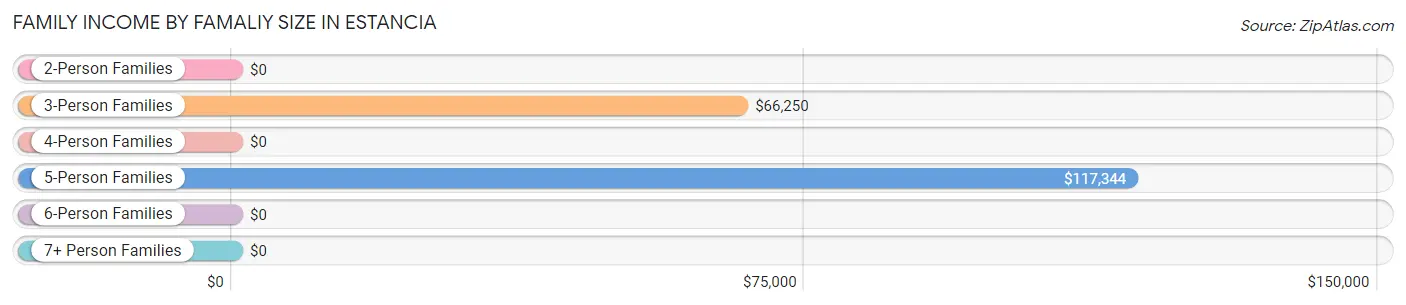
| Income Bracket | # Families | Median Income |
| 2-Person Families | 157 (42.0%) | $0 |
| 3-Person Families | 176 (47.1%) | $66,250 |
| 4-Person Families | 16 (4.3%) | $0 |
| 5-Person Families | 25 (6.7%) | $117,344 |
| 6-Person Families | 0 (0.0%) | $0 |
| 7+ Person Families | 0 (0.0%) | $0 |
| Total | 374 (100.0%) | $54,306 |
Family Income by Number of Earners in Estancia
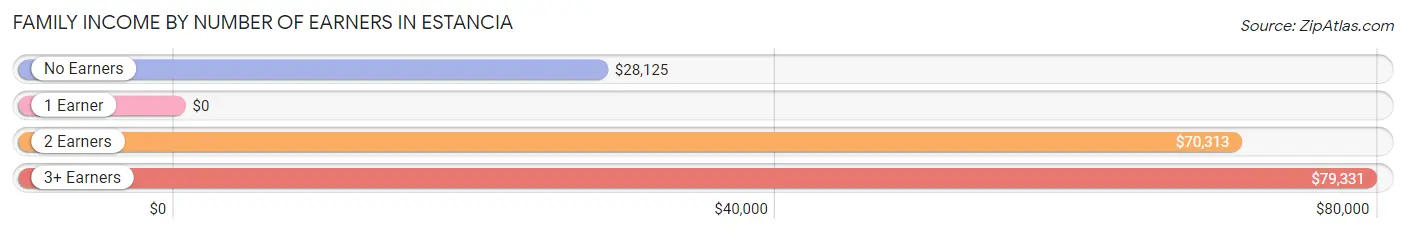
| Number of Earners | # Families | Median Income |
| No Earners | 152 (40.6%) | $28,125 |
| 1 Earner | 83 (22.2%) | $0 |
| 2 Earners | 76 (20.3%) | $70,313 |
| 3+ Earners | 63 (16.8%) | $79,331 |
| Total | 374 (100.0%) | $54,306 |
Household Income in Estancia
Household Income Brackets in Estancia
With 103 households falling in the category, the $15,000 to $24,999 income range is the most frequent in Estancia, accounting for 16.5% of all households.
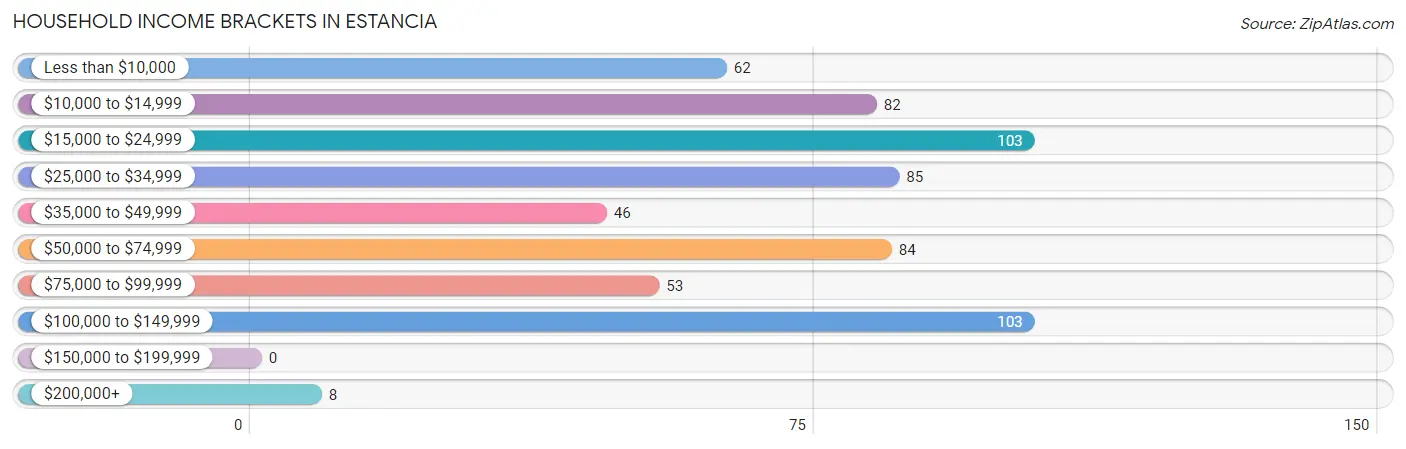
| Income Bracket | # Households | % Households |
| Less than $10,000 | 62 | 9.9% |
| $10,000 to $14,999 | 82 | 13.1% |
| $15,000 to $24,999 | 103 | 16.5% |
| $25,000 to $34,999 | 85 | 13.6% |
| $35,000 to $49,999 | 46 | 7.3% |
| $50,000 to $74,999 | 84 | 13.4% |
| $75,000 to $99,999 | 53 | 8.5% |
| $100,000 to $149,999 | 103 | 16.5% |
| $150,000 to $199,999 | 0 | 0.0% |
| $200,000+ | 8 | 1.3% |
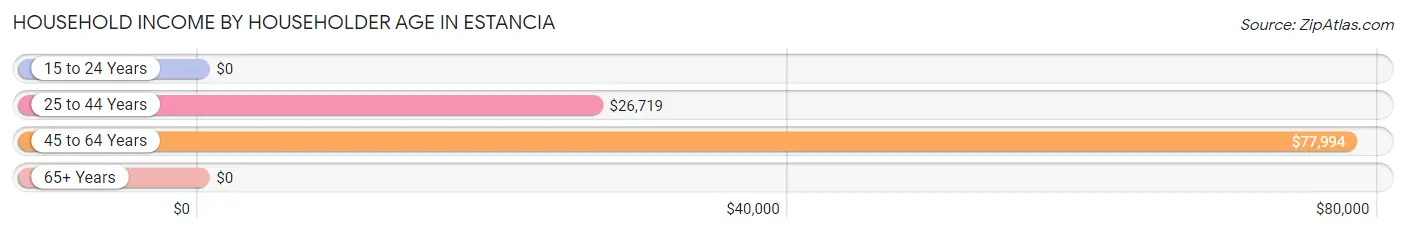
Household Income by Householder Age in Estancia
The median household income in Estancia is $32,286, with the highest median household income of $77,994 found in the 45 to 64 years age bracket for the primary householder. A total of 185 households (29.5%) fall into this category. Meanwhile, the 15 to 24 years age bracket for the primary householder has the lowest median household income of $0, with 36 households (5.8%) in this group.
| Income Bracket | # Households | Median Income |
| 15 to 24 Years | 36 (5.8%) | $0 |
| 25 to 44 Years | 133 (21.2%) | $26,719 |
| 45 to 64 Years | 185 (29.5%) | $77,994 |
| 65+ Years | 272 (43.4%) | $0 |
| Total | 626 (100.0%) | $32,286 |
Poverty in Estancia
Income Below Poverty by Sex and Age in Estancia
With 20.9% poverty level for males and 16.5% for females among the residents of Estancia, under 5 year old males and 25 to 34 year old females are the most vulnerable to poverty, with 14 males (100.0%) and 18 females (51.4%) in their respective age groups living below the poverty level.
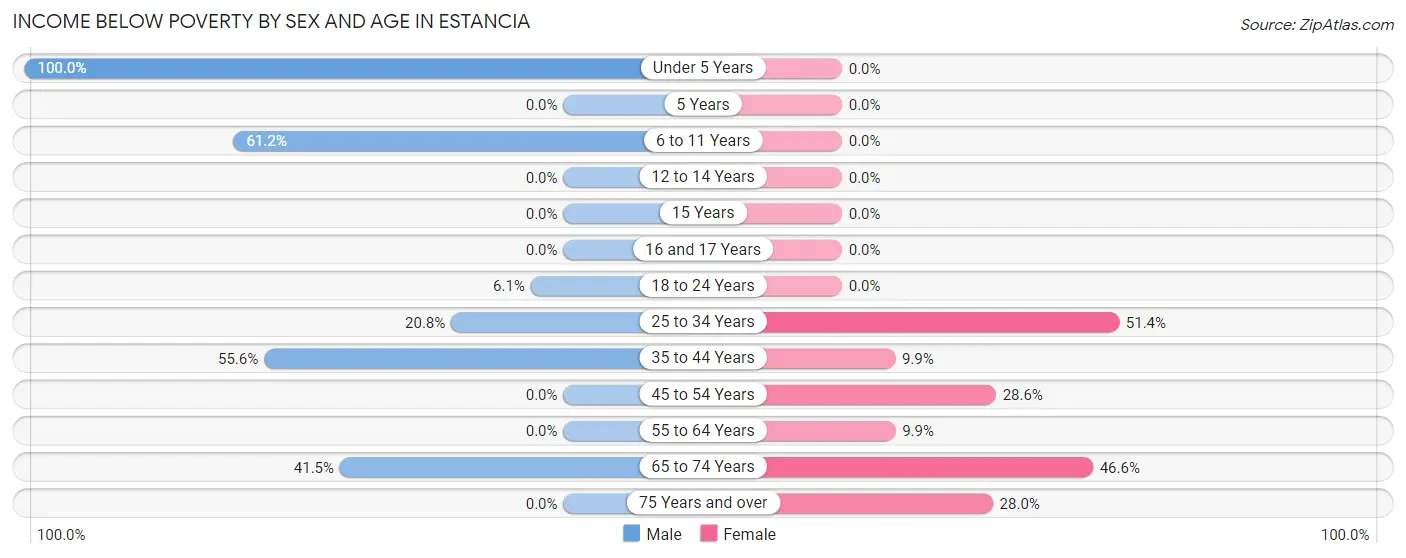
| Age Bracket | Male | Female |
| Under 5 Years | 14 (100.0%) | 0 (0.0%) |
| 5 Years | 0 (0.0%) | 0 (0.0%) |
| 6 to 11 Years | 30 (61.2%) | 0 (0.0%) |
| 12 to 14 Years | 0 (0.0%) | 0 (0.0%) |
| 15 Years | 0 (0.0%) | 0 (0.0%) |
| 16 and 17 Years | 0 (0.0%) | 0 (0.0%) |
| 18 to 24 Years | 10 (6.1%) | 0 (0.0%) |
| 25 to 34 Years | 25 (20.8%) | 18 (51.4%) |
| 35 to 44 Years | 20 (55.6%) | 15 (9.9%) |
| 45 to 54 Years | 0 (0.0%) | 34 (28.6%) |
| 55 to 64 Years | 0 (0.0%) | 12 (9.9%) |
| 65 to 74 Years | 73 (41.5%) | 34 (46.6%) |
| 75 Years and over | 0 (0.0%) | 14 (28.0%) |
| Total | 172 (20.9%) | 127 (16.5%) |
Income Above Poverty by Sex and Age in Estancia
According to the poverty statistics in Estancia, males aged 16 and 17 years and females aged under 5 years are the age groups that are most secure financially, with 100.0% of males and 100.0% of females in these age groups living above the poverty line.
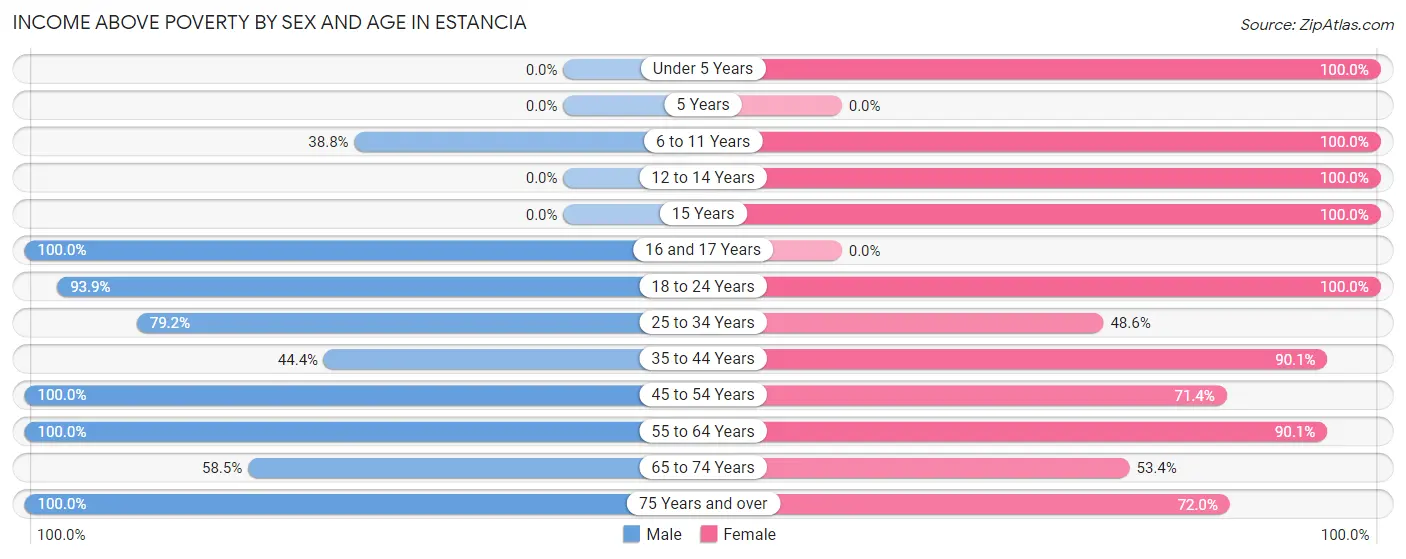
| Age Bracket | Male | Female |
| Under 5 Years | 0 (0.0%) | 73 (100.0%) |
| 5 Years | 0 (0.0%) | 0 (0.0%) |
| 6 to 11 Years | 19 (38.8%) | 17 (100.0%) |
| 12 to 14 Years | 0 (0.0%) | 21 (100.0%) |
| 15 Years | 0 (0.0%) | 52 (100.0%) |
| 16 and 17 Years | 29 (100.0%) | 0 (0.0%) |
| 18 to 24 Years | 155 (93.9%) | 56 (100.0%) |
| 25 to 34 Years | 95 (79.2%) | 17 (48.6%) |
| 35 to 44 Years | 16 (44.4%) | 137 (90.1%) |
| 45 to 54 Years | 58 (100.0%) | 85 (71.4%) |
| 55 to 64 Years | 99 (100.0%) | 109 (90.1%) |
| 65 to 74 Years | 103 (58.5%) | 39 (53.4%) |
| 75 Years and over | 76 (100.0%) | 36 (72.0%) |
| Total | 650 (79.1%) | 642 (83.5%) |
Income Below Poverty Among Married-Couple Families in Estancia
The poverty statistics for married-couple families in Estancia show that 4.7% or 13 of the total 275 families live below the poverty line. Families with no children have the highest poverty rate of 7.3%, comprising of 13 families. On the other hand, families with 1 or 2 children have the lowest poverty rate of 0.0%, which includes 0 families.
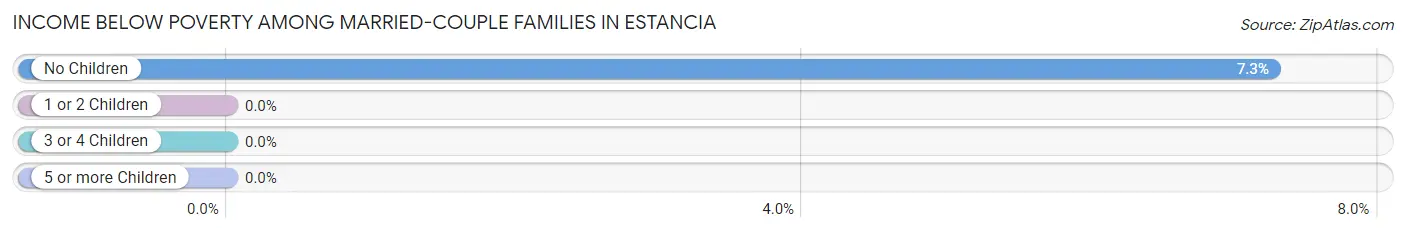
| Children | Above Poverty | Below Poverty |
| No Children | 166 (92.7%) | 13 (7.3%) |
| 1 or 2 Children | 83 (100.0%) | 0 (0.0%) |
| 3 or 4 Children | 13 (100.0%) | 0 (0.0%) |
| 5 or more Children | 0 (0.0%) | 0 (0.0%) |
| Total | 262 (95.3%) | 13 (4.7%) |
Income Below Poverty Among Single-Parent Households in Estancia
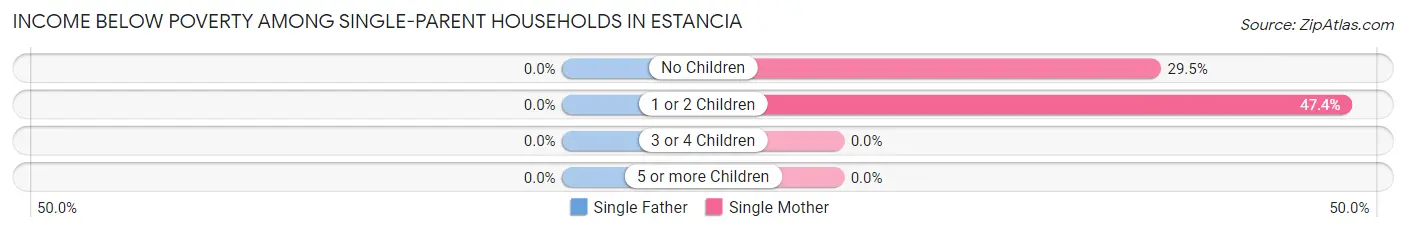
| Children | Single Father | Single Mother |
| No Children | 0 (0.0%) | 18 (29.5%) |
| 1 or 2 Children | 0 (0.0%) | 18 (47.4%) |
| 3 or 4 Children | 0 (0.0%) | 0 (0.0%) |
| 5 or more Children | 0 (0.0%) | 0 (0.0%) |
| Total | 0 (0.0%) | 36 (36.4%) |
Income Below Poverty Among Married-Couple vs Single-Parent Households in Estancia
The poverty data for Estancia shows that 13 of the married-couple family households (4.7%) and 36 of the single-parent households (36.4%) are living below the poverty level. Within the married-couple family households, those with no children have the highest poverty rate, with 13 households (7.3%) falling below the poverty line. Among the single-parent households, those with 1 or 2 children have the highest poverty rate, with 18 household (47.4%) living below poverty.
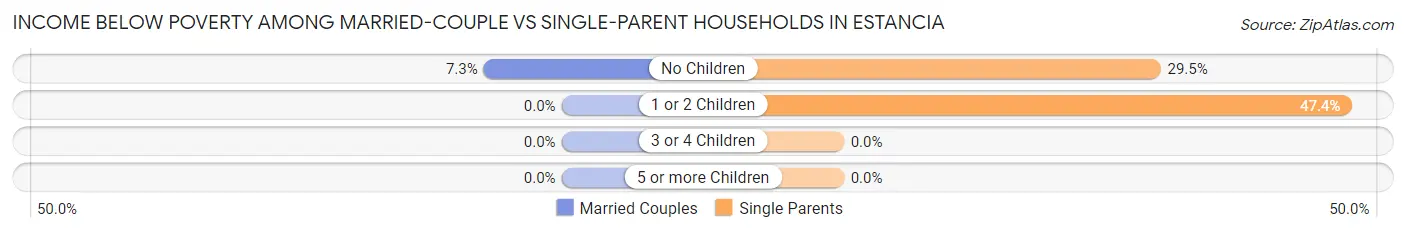
| Children | Married-Couple Families | Single-Parent Households |
| No Children | 13 (7.3%) | 18 (29.5%) |
| 1 or 2 Children | 0 (0.0%) | 18 (47.4%) |
| 3 or 4 Children | 0 (0.0%) | 0 (0.0%) |
| 5 or more Children | 0 (0.0%) | 0 (0.0%) |
| Total | 13 (4.7%) | 36 (36.4%) |
Race in Estancia
The most populous races in Estancia are Hispanic or Latino (1,116 | 70.1%), White / Caucasian (1,029 | 64.7%), and Some other Race (471 | 29.6%).
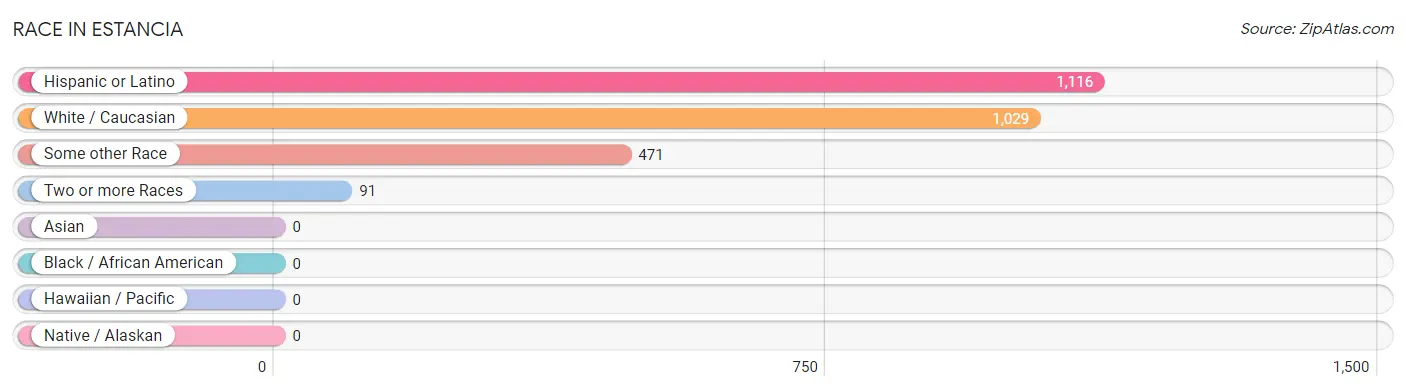
| Race | # Population | % Population |
| Asian | 0 | 0.0% |
| Black / African American | 0 | 0.0% |
| Hawaiian / Pacific | 0 | 0.0% |
| Hispanic or Latino | 1,116 | 70.1% |
| Native / Alaskan | 0 | 0.0% |
| White / Caucasian | 1,029 | 64.7% |
| Two or more Races | 91 | 5.7% |
| Some other Race | 471 | 29.6% |
| Total | 1,591 | 100.0% |
Ancestry in Estancia
The most populous ancestries reported in Estancia are Mexican (632 | 39.7%), Spanish (223 | 14.0%), German (189 | 11.9%), English (106 | 6.7%), and Irish (86 | 5.4%), together accounting for 77.7% of all Estancia residents.
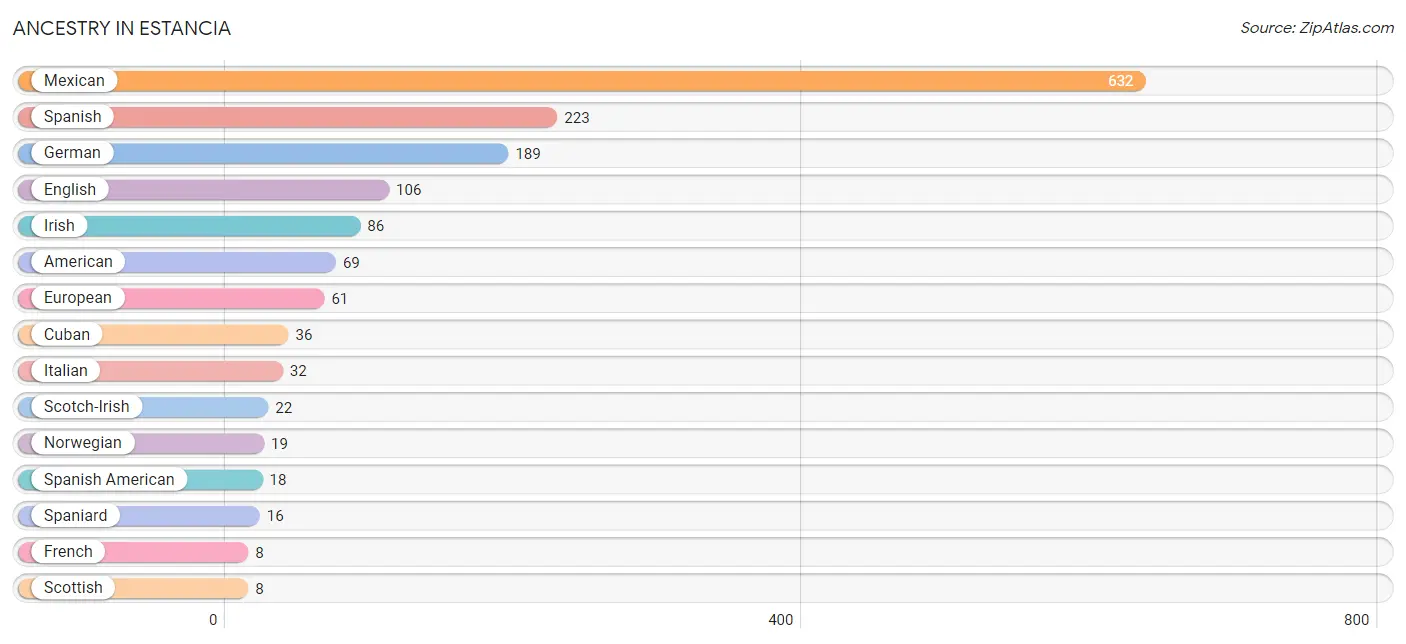
| Ancestry | # Population | % Population |
| American | 69 | 4.3% |
| Apache | 6 | 0.4% |
| Cuban | 36 | 2.3% |
| English | 106 | 6.7% |
| European | 61 | 3.8% |
| French | 8 | 0.5% |
| German | 189 | 11.9% |
| Irish | 86 | 5.4% |
| Italian | 32 | 2.0% |
| Mexican | 632 | 39.7% |
| Norwegian | 19 | 1.2% |
| Pueblo | 6 | 0.4% |
| Scotch-Irish | 22 | 1.4% |
| Scottish | 8 | 0.5% |
| Spaniard | 16 | 1.0% |
| Spanish | 223 | 14.0% |
| Spanish American | 18 | 1.1% | View All 17 Rows |
Immigrants in Estancia
The most numerous immigrant groups reported in Estancia came from Latin America (164 | 10.3%), Central America (132 | 8.3%), Mexico (132 | 8.3%), Argentina (32 | 2.0%), and South America (32 | 2.0%), together accounting for 30.9% of all Estancia residents.
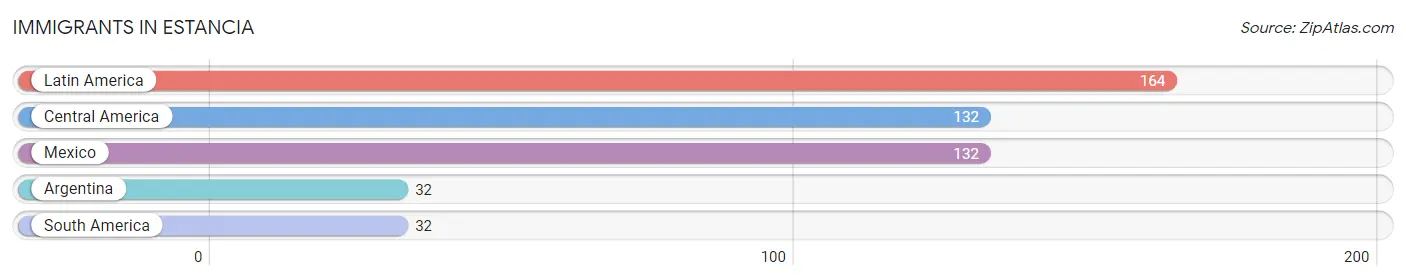
| Immigration Origin | # Population | % Population |
| Argentina | 32 | 2.0% |
| Central America | 132 | 8.3% |
| Latin America | 164 | 10.3% |
| Mexico | 132 | 8.3% |
| South America | 32 | 2.0% | View All 5 Rows |
Sex and Age in Estancia
Sex and Age in Estancia
The most populous age groups in Estancia are 20 to 24 Years (139 | 16.9%) for men and 35 to 39 Years (132 | 17.2%) for women.
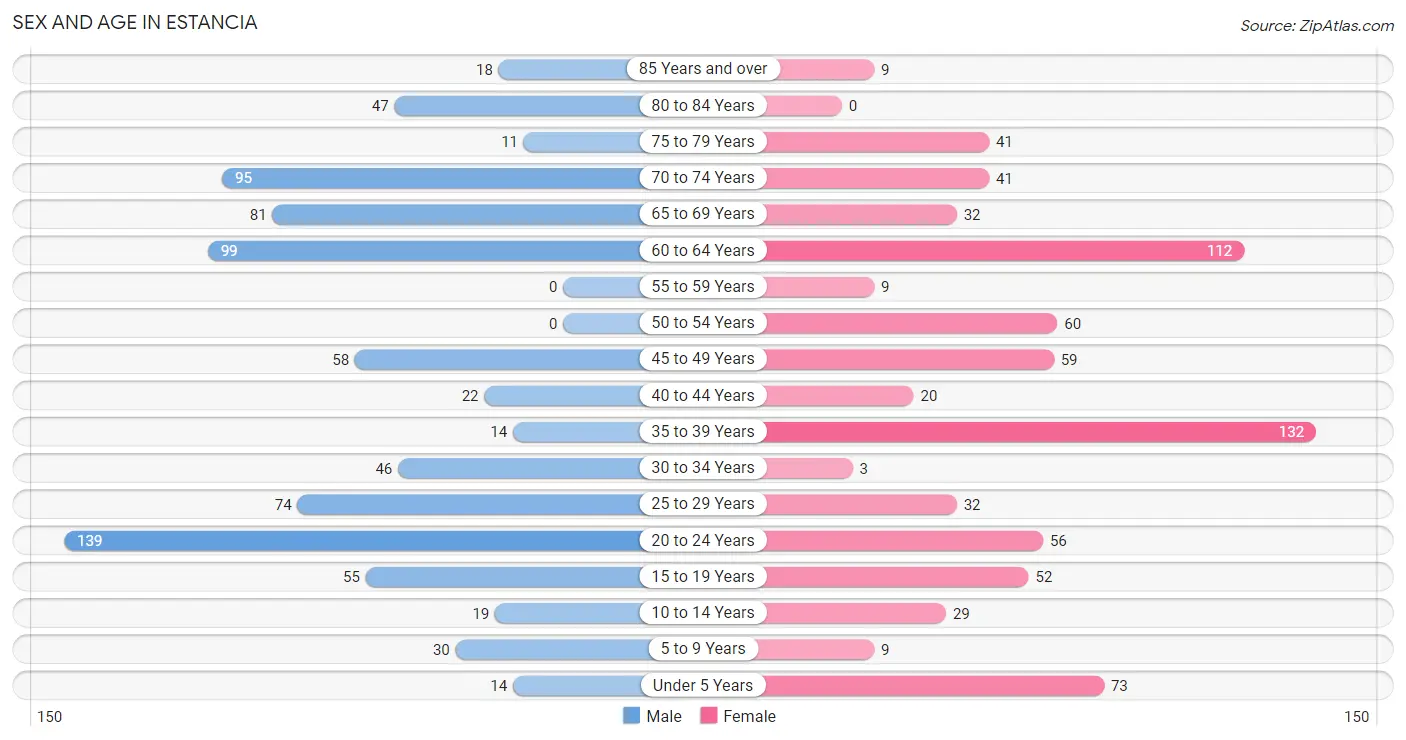
| Age Bracket | Male | Female |
| Under 5 Years | 14 (1.7%) | 73 (9.5%) |
| 5 to 9 Years | 30 (3.6%) | 9 (1.2%) |
| 10 to 14 Years | 19 (2.3%) | 29 (3.8%) |
| 15 to 19 Years | 55 (6.7%) | 52 (6.8%) |
| 20 to 24 Years | 139 (16.9%) | 56 (7.3%) |
| 25 to 29 Years | 74 (9.0%) | 32 (4.2%) |
| 30 to 34 Years | 46 (5.6%) | 3 (0.4%) |
| 35 to 39 Years | 14 (1.7%) | 132 (17.2%) |
| 40 to 44 Years | 22 (2.7%) | 20 (2.6%) |
| 45 to 49 Years | 58 (7.1%) | 59 (7.7%) |
| 50 to 54 Years | 0 (0.0%) | 60 (7.8%) |
| 55 to 59 Years | 0 (0.0%) | 9 (1.2%) |
| 60 to 64 Years | 99 (12.0%) | 112 (14.6%) |
| 65 to 69 Years | 81 (9.9%) | 32 (4.2%) |
| 70 to 74 Years | 95 (11.6%) | 41 (5.3%) |
| 75 to 79 Years | 11 (1.3%) | 41 (5.3%) |
| 80 to 84 Years | 47 (5.7%) | 0 (0.0%) |
| 85 Years and over | 18 (2.2%) | 9 (1.2%) |
| Total | 822 (100.0%) | 769 (100.0%) |
Families and Households in Estancia
Median Family Size in Estancia
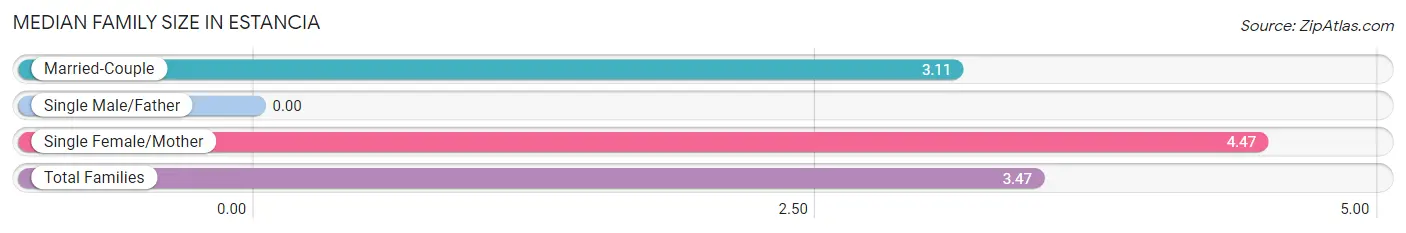
| Family Type | # Families | Family Size |
| Married-Couple | 275 (73.5%) | 3.11 |
| Single Male/Father | 0 (0.0%) | - |
| Single Female/Mother | 99 (26.5%) | 4.47 |
| Total Families | 374 (100.0%) | 3.47 |
Median Household Size in Estancia
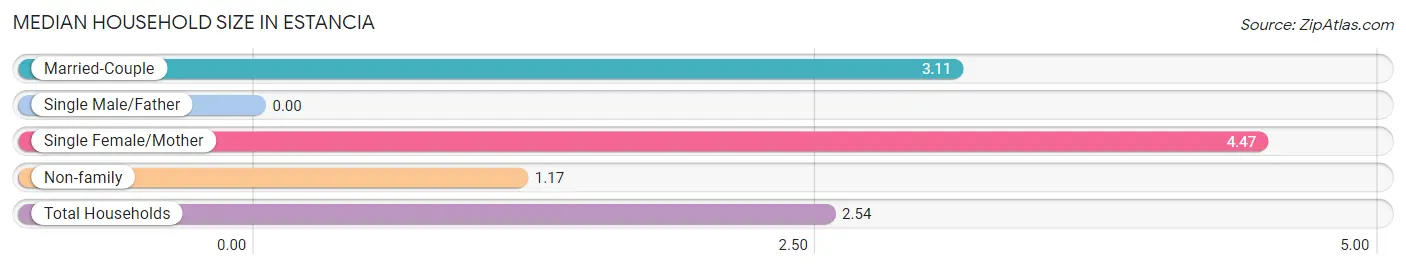
| Household Type | # Households | Household Size |
| Married-Couple | 275 (43.9%) | 3.11 |
| Single Male/Father | 0 (0.0%) | - |
| Single Female/Mother | 99 (15.8%) | 4.47 |
| Non-family | 252 (40.3%) | 1.17 |
| Total Households | 626 (100.0%) | 2.54 |
Household Size by Marriage Status in Estancia
Out of a total of 626 households in Estancia, 374 (59.7%) are family households, while 252 (40.3%) are nonfamily households. The most numerous type of family households are 3-person households, comprising 176, and the most common type of nonfamily households are 1-person households, comprising 236.
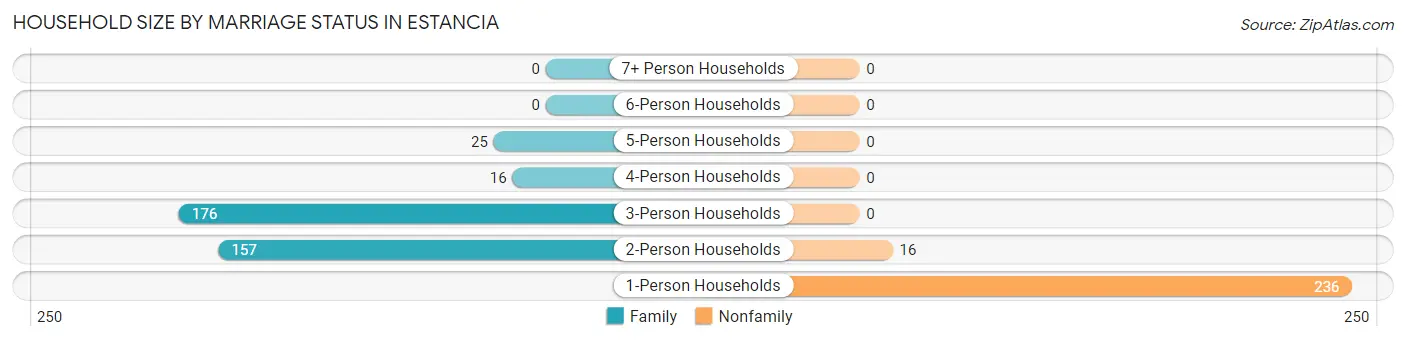
| Household Size | Family Households | Nonfamily Households |
| 1-Person Households | - | 236 (37.7%) |
| 2-Person Households | 157 (25.1%) | 16 (2.6%) |
| 3-Person Households | 176 (28.1%) | 0 (0.0%) |
| 4-Person Households | 16 (2.6%) | 0 (0.0%) |
| 5-Person Households | 25 (4.0%) | 0 (0.0%) |
| 6-Person Households | 0 (0.0%) | 0 (0.0%) |
| 7+ Person Households | 0 (0.0%) | 0 (0.0%) |
| Total | 374 (59.7%) | 252 (40.3%) |
Female Fertility in Estancia
Fertility by Age in Estancia
Average fertility rate in Estancia is 82.0 births per 1,000 women. Women in the age bracket of 20 to 34 years have the highest fertility rate with 319.0 births per 1,000 women. Women in the age bracket of 20 to 34 years acount for 100.0% of all women with births.
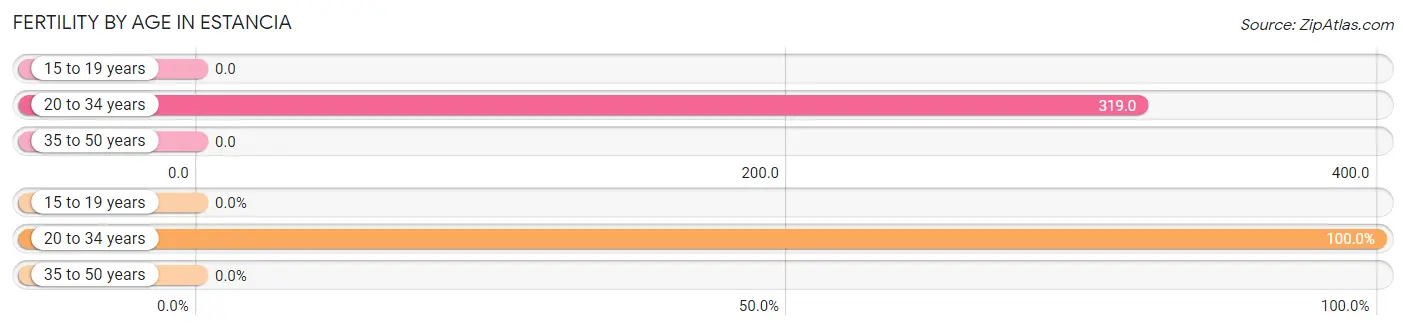
| Age Bracket | Women with Births | Births / 1,000 Women |
| 15 to 19 years | 0 (0.0%) | 0.0 |
| 20 to 34 years | 29 (100.0%) | 319.0 |
| 35 to 50 years | 0 (0.0%) | 0.0 |
| Total | 29 (100.0%) | 82.0 |
Fertility by Age by Marriage Status in Estancia
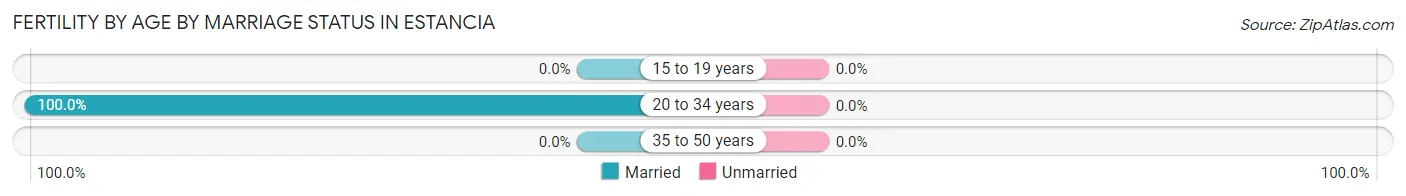
| Age Bracket | Married | Unmarried |
| 15 to 19 years | 0 (0.0%) | 0 (0.0%) |
| 20 to 34 years | 29 (100.0%) | 0 (0.0%) |
| 35 to 50 years | 0 (0.0%) | 0 (0.0%) |
| Total | 29 (100.0%) | 0 (0.0%) |
Fertility by Education in Estancia
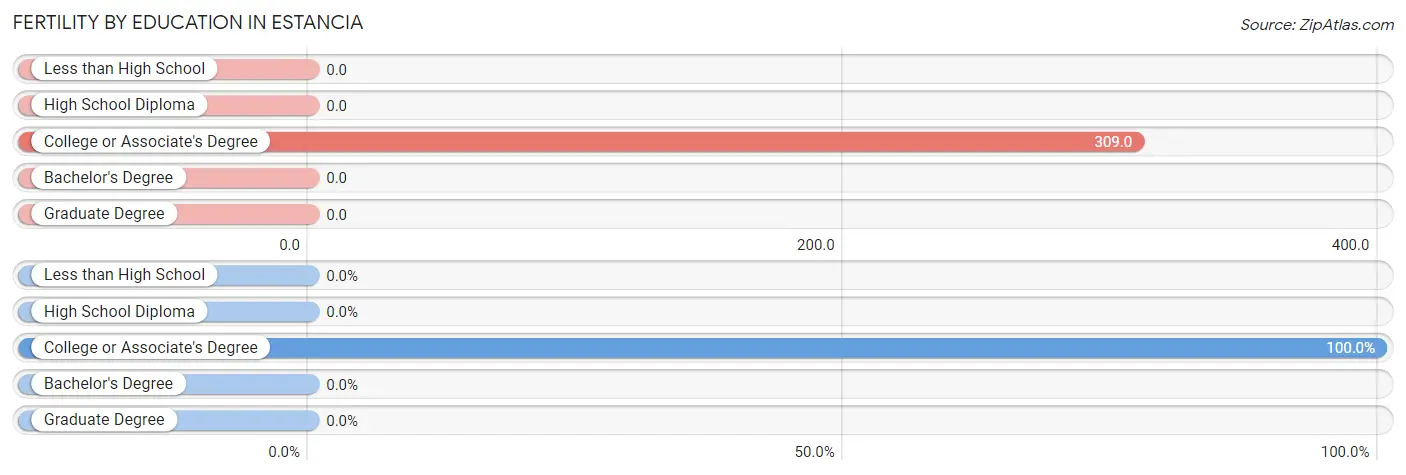
| Educational Attainment | Women with Births | Births / 1,000 Women |
| Less than High School | 0 (0.0%) | 0.0 |
| High School Diploma | 0 (0.0%) | 0.0 |
| College or Associate's Degree | 29 (100.0%) | 309.0 |
| Bachelor's Degree | 0 (0.0%) | 0.0 |
| Graduate Degree | 0 (0.0%) | 0.0 |
| Total | 29 (100.0%) | 82.0 |
Fertility by Education by Marriage Status in Estancia
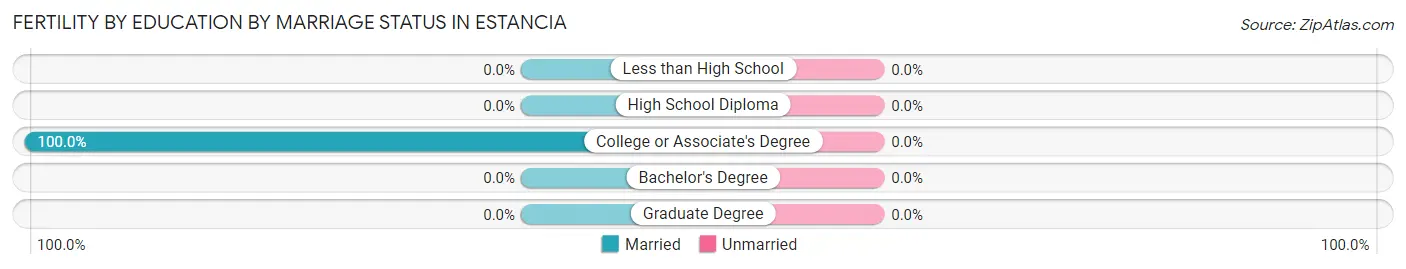
| Educational Attainment | Married | Unmarried |
| Less than High School | 0 (0.0%) | 0 (0.0%) |
| High School Diploma | 0 (0.0%) | 0 (0.0%) |
| College or Associate's Degree | 29 (100.0%) | 0 (0.0%) |
| Bachelor's Degree | 0 (0.0%) | 0 (0.0%) |
| Graduate Degree | 0 (0.0%) | 0 (0.0%) |
| Total | 29 (100.0%) | 0 (0.0%) |
Employment Characteristics in Estancia
Employment by Class of Employer in Estancia
Among the 434 employed individuals in Estancia, private company employees (214 | 49.3%), state government employees (108 | 24.9%), and local government employees (69 | 15.9%) make up the most common classes of employment.
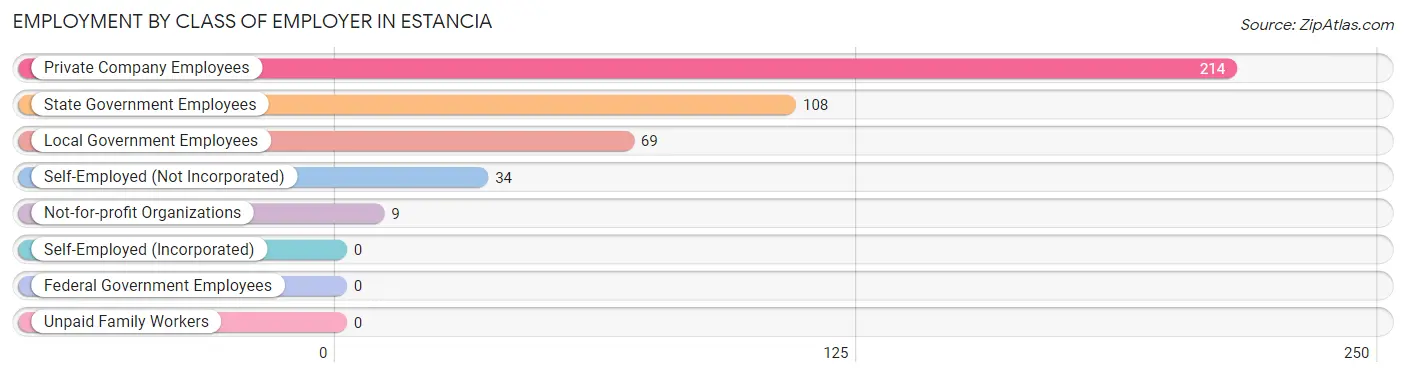
| Employer Class | # Employees | % Employees |
| Private Company Employees | 214 | 49.3% |
| Self-Employed (Incorporated) | 0 | 0.0% |
| Self-Employed (Not Incorporated) | 34 | 7.8% |
| Not-for-profit Organizations | 9 | 2.1% |
| Local Government Employees | 69 | 15.9% |
| State Government Employees | 108 | 24.9% |
| Federal Government Employees | 0 | 0.0% |
| Unpaid Family Workers | 0 | 0.0% |
| Total | 434 | 100.0% |
Employment Status by Age in Estancia
According to the labor force statistics for Estancia, out of the total population over 16 years of age (1,365), 51.8% or 707 individuals are in the labor force, with 34.9% or 247 of them unemployed. The age group with the highest labor force participation rate is 30 to 34 years, with 100.0% or 49 individuals in the labor force. Within the labor force, the 60 to 64 years age range has the highest percentage of unemployed individuals, with 84.2% or 123 of them being unemployed.
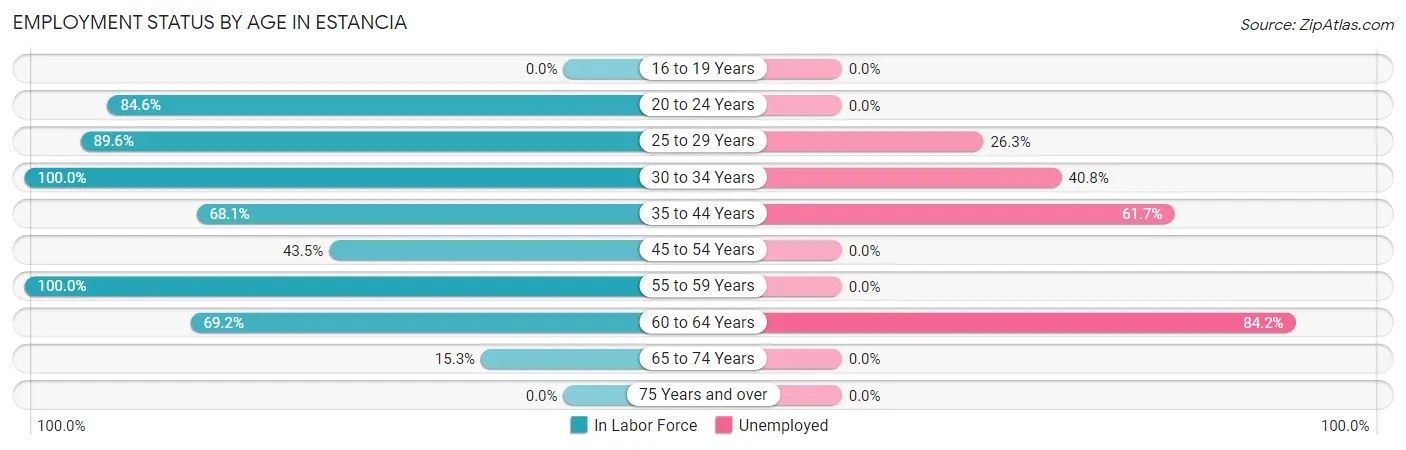
| Age Bracket | In Labor Force | Unemployed |
| 16 to 19 Years | 0 (0.0%) | 0 (0.0%) |
| 20 to 24 Years | 165 (84.6%) | 0 (0.0%) |
| 25 to 29 Years | 95 (89.6%) | 25 (26.3%) |
| 30 to 34 Years | 49 (100.0%) | 20 (40.8%) |
| 35 to 44 Years | 128 (68.1%) | 79 (61.7%) |
| 45 to 54 Years | 77 (43.5%) | 0 (0.0%) |
| 55 to 59 Years | 9 (100.0%) | 0 (0.0%) |
| 60 to 64 Years | 146 (69.2%) | 123 (84.2%) |
| 65 to 74 Years | 38 (15.3%) | 0 (0.0%) |
| 75 Years and over | 0 (0.0%) | 0 (0.0%) |
| Total | 707 (51.8%) | 247 (34.9%) |
Employment Status by Educational Attainment in Estancia
According to labor force statistics for Estancia, 68.1% of individuals (504) out of the total population between 25 and 64 years of age (740) are in the labor force, with 49.0% or 247 of them being unemployed. The group with the highest labor force participation rate are those with the educational attainment of college / associate degree, with 89.4% or 279 individuals in the labor force. Within the labor force, individuals with high school diploma education have the highest percentage of unemployment, with 62.7% or 79 of them being unemployed.
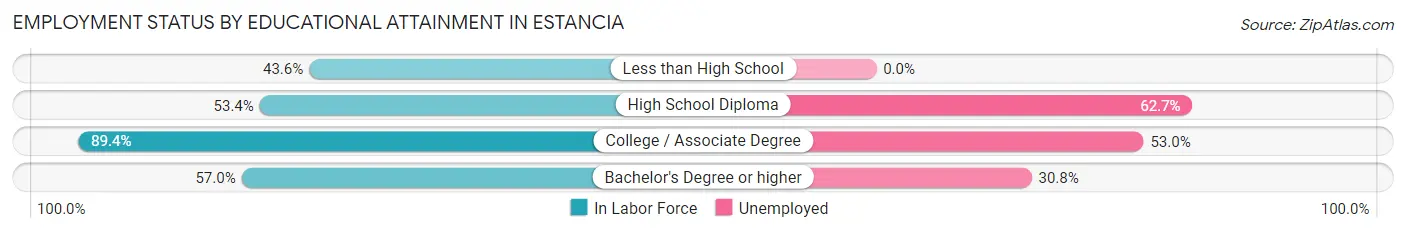
| Educational Attainment | In Labor Force | Unemployed |
| Less than High School | 34 (43.6%) | 0 (0.0%) |
| High School Diploma | 126 (53.4%) | 148 (62.7%) |
| College / Associate Degree | 279 (89.4%) | 165 (53.0%) |
| Bachelor's Degree or higher | 65 (57.0%) | 35 (30.8%) |
| Total | 504 (68.1%) | 363 (49.0%) |
Employment Occupations by Sex in Estancia
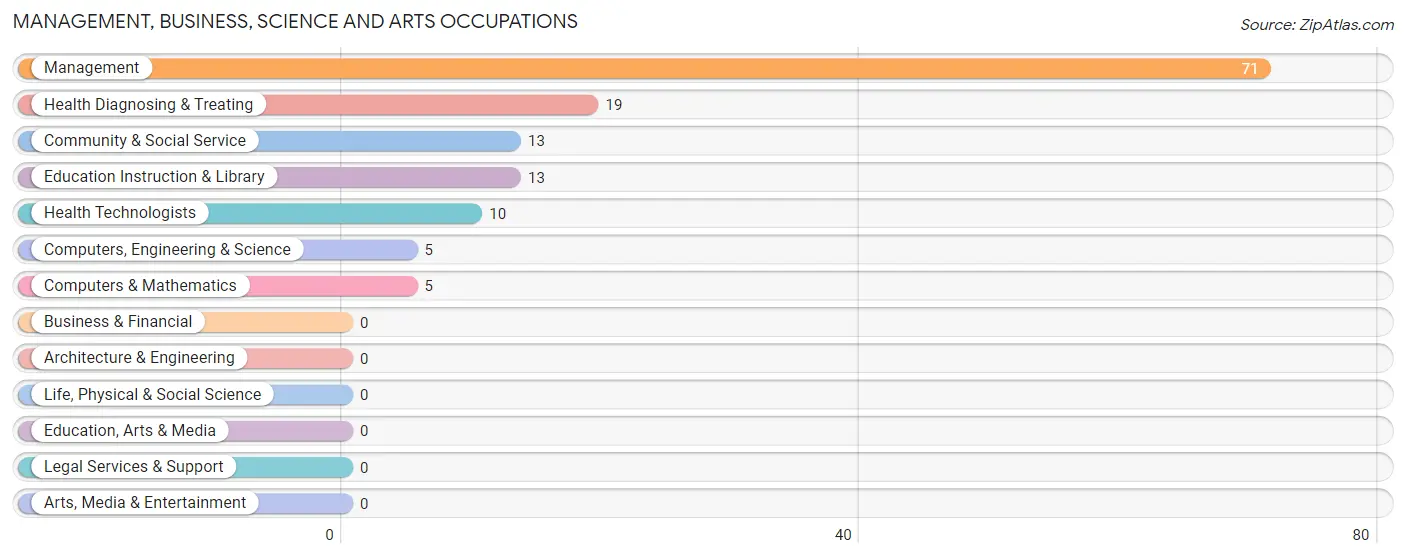
Management, Business, Science and Arts Occupations
The most common Management, Business, Science and Arts occupations in Estancia are Management (71 | 15.4%), Health Diagnosing & Treating (19 | 4.1%), Community & Social Service (13 | 2.8%), Education Instruction & Library (13 | 2.8%), and Health Technologists (10 | 2.2%).
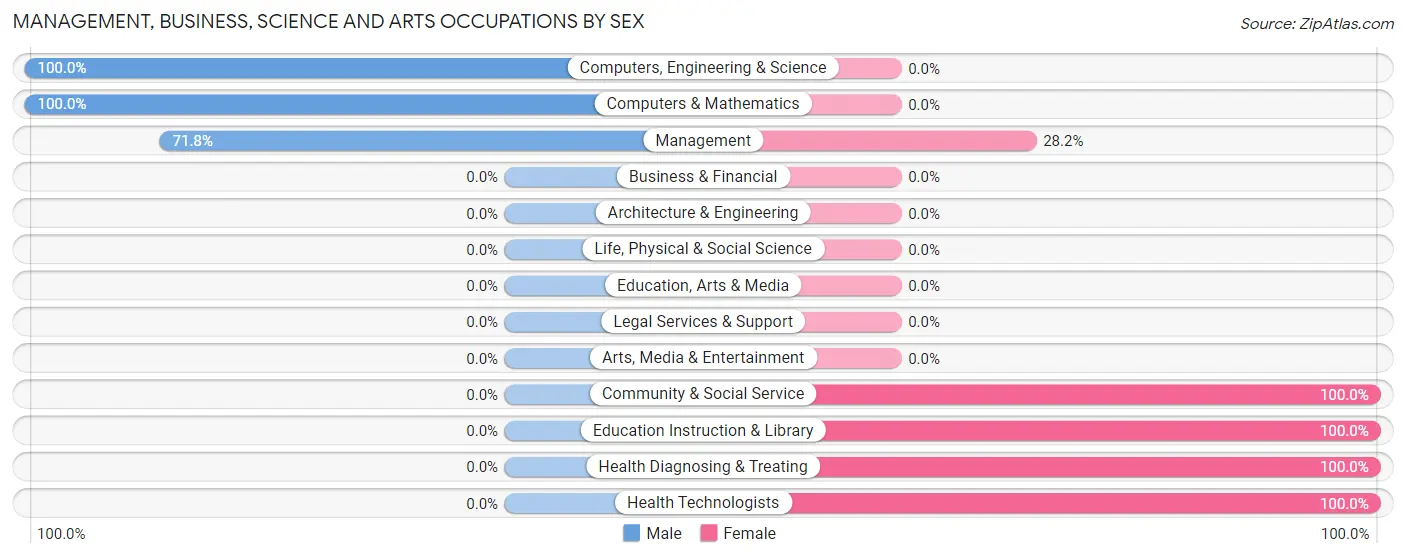
Management, Business, Science and Arts Occupations by Sex
Within the Management, Business, Science and Arts occupations in Estancia, the most male-oriented occupations are Computers, Engineering & Science (100.0%), Computers & Mathematics (100.0%), and Management (71.8%), while the most female-oriented occupations are Community & Social Service (100.0%), Education Instruction & Library (100.0%), and Health Diagnosing & Treating (100.0%).
| Occupation | Male | Female |
| Management | 51 (71.8%) | 20 (28.2%) |
| Business & Financial | 0 (0.0%) | 0 (0.0%) |
| Computers, Engineering & Science | 5 (100.0%) | 0 (0.0%) |
| Computers & Mathematics | 5 (100.0%) | 0 (0.0%) |
| Architecture & Engineering | 0 (0.0%) | 0 (0.0%) |
| Life, Physical & Social Science | 0 (0.0%) | 0 (0.0%) |
| Community & Social Service | 0 (0.0%) | 13 (100.0%) |
| Education, Arts & Media | 0 (0.0%) | 0 (0.0%) |
| Legal Services & Support | 0 (0.0%) | 0 (0.0%) |
| Education Instruction & Library | 0 (0.0%) | 13 (100.0%) |
| Arts, Media & Entertainment | 0 (0.0%) | 0 (0.0%) |
| Health Diagnosing & Treating | 0 (0.0%) | 19 (100.0%) |
| Health Technologists | 0 (0.0%) | 10 (100.0%) |
| Total (Category) | 56 (51.8%) | 52 (48.1%) |
| Total (Overall) | 326 (70.9%) | 134 (29.1%) |
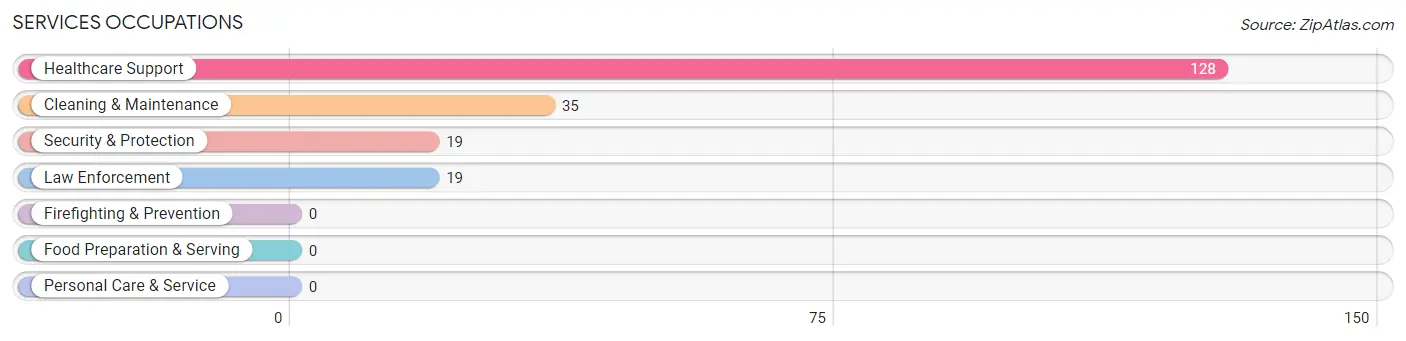
Services Occupations
The most common Services occupations in Estancia are Healthcare Support (128 | 27.8%), Cleaning & Maintenance (35 | 7.6%), Security & Protection (19 | 4.1%), and Law Enforcement (19 | 4.1%).
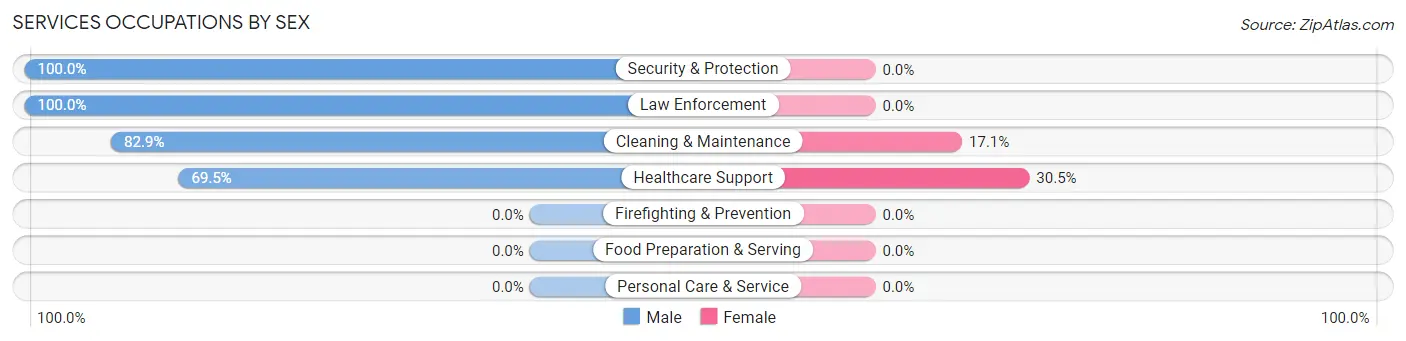
Services Occupations by Sex
Within the Services occupations in Estancia, the most male-oriented occupations are Security & Protection (100.0%), Law Enforcement (100.0%), and Cleaning & Maintenance (82.9%), while the most female-oriented occupations are Healthcare Support (30.5%), and Cleaning & Maintenance (17.1%).
| Occupation | Male | Female |
| Healthcare Support | 89 (69.5%) | 39 (30.5%) |
| Security & Protection | 19 (100.0%) | 0 (0.0%) |
| Firefighting & Prevention | 0 (0.0%) | 0 (0.0%) |
| Law Enforcement | 19 (100.0%) | 0 (0.0%) |
| Food Preparation & Serving | 0 (0.0%) | 0 (0.0%) |
| Cleaning & Maintenance | 29 (82.9%) | 6 (17.1%) |
| Personal Care & Service | 0 (0.0%) | 0 (0.0%) |
| Total (Category) | 137 (75.3%) | 45 (24.7%) |
| Total (Overall) | 326 (70.9%) | 134 (29.1%) |
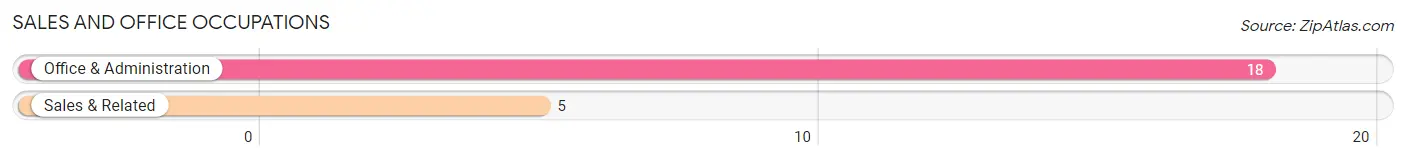
Sales and Office Occupations
The most common Sales and Office occupations in Estancia are Office & Administration (18 | 3.9%), and Sales & Related (5 | 1.1%).
Sales and Office Occupations by Sex
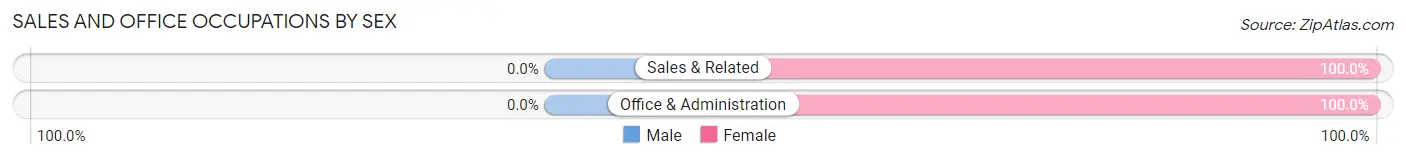
| Occupation | Male | Female |
| Sales & Related | 0 (0.0%) | 5 (100.0%) |
| Office & Administration | 0 (0.0%) | 18 (100.0%) |
| Total (Category) | 0 (0.0%) | 23 (100.0%) |
| Total (Overall) | 326 (70.9%) | 134 (29.1%) |
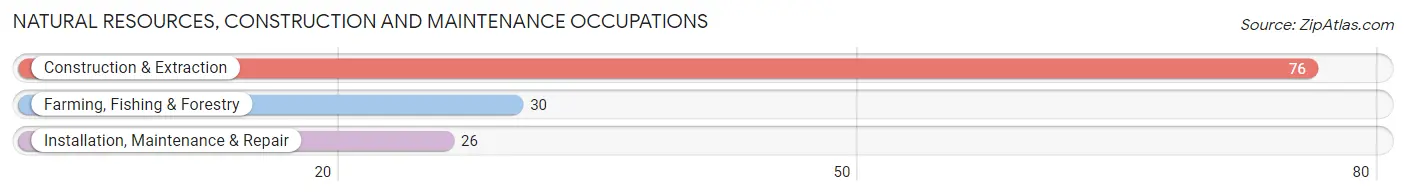
Natural Resources, Construction and Maintenance Occupations
The most common Natural Resources, Construction and Maintenance occupations in Estancia are Construction & Extraction (76 | 16.5%), Farming, Fishing & Forestry (30 | 6.5%), and Installation, Maintenance & Repair (26 | 5.7%).
Natural Resources, Construction and Maintenance Occupations by Sex
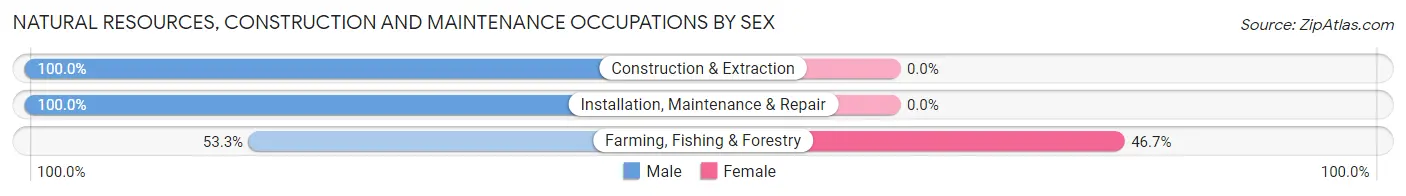
| Occupation | Male | Female |
| Farming, Fishing & Forestry | 16 (53.3%) | 14 (46.7%) |
| Construction & Extraction | 76 (100.0%) | 0 (0.0%) |
| Installation, Maintenance & Repair | 26 (100.0%) | 0 (0.0%) |
| Total (Category) | 118 (89.4%) | 14 (10.6%) |
| Total (Overall) | 326 (70.9%) | 134 (29.1%) |
Production, Transportation and Moving Occupations
The most common Production, Transportation and Moving occupations in Estancia are , and Transportation (15 | 3.3%).
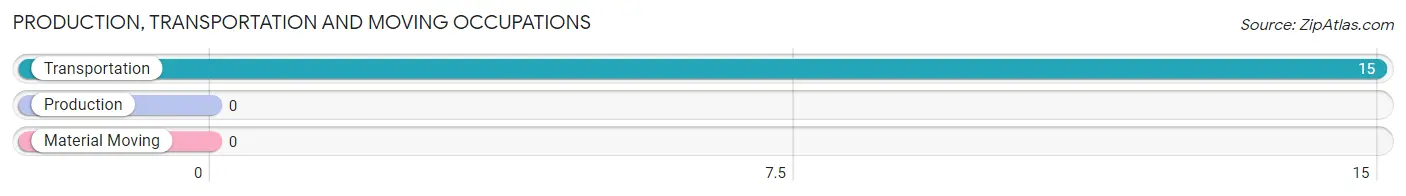
Production, Transportation and Moving Occupations by Sex
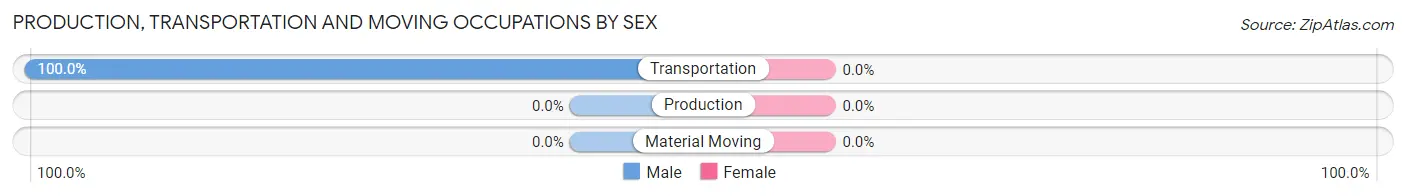
| Occupation | Male | Female |
| Production | 0 (0.0%) | 0 (0.0%) |
| Transportation | 15 (100.0%) | 0 (0.0%) |
| Material Moving | 0 (0.0%) | 0 (0.0%) |
| Total (Category) | 15 (100.0%) | 0 (0.0%) |
| Total (Overall) | 326 (70.9%) | 134 (29.1%) |
Employment Industries by Sex in Estancia
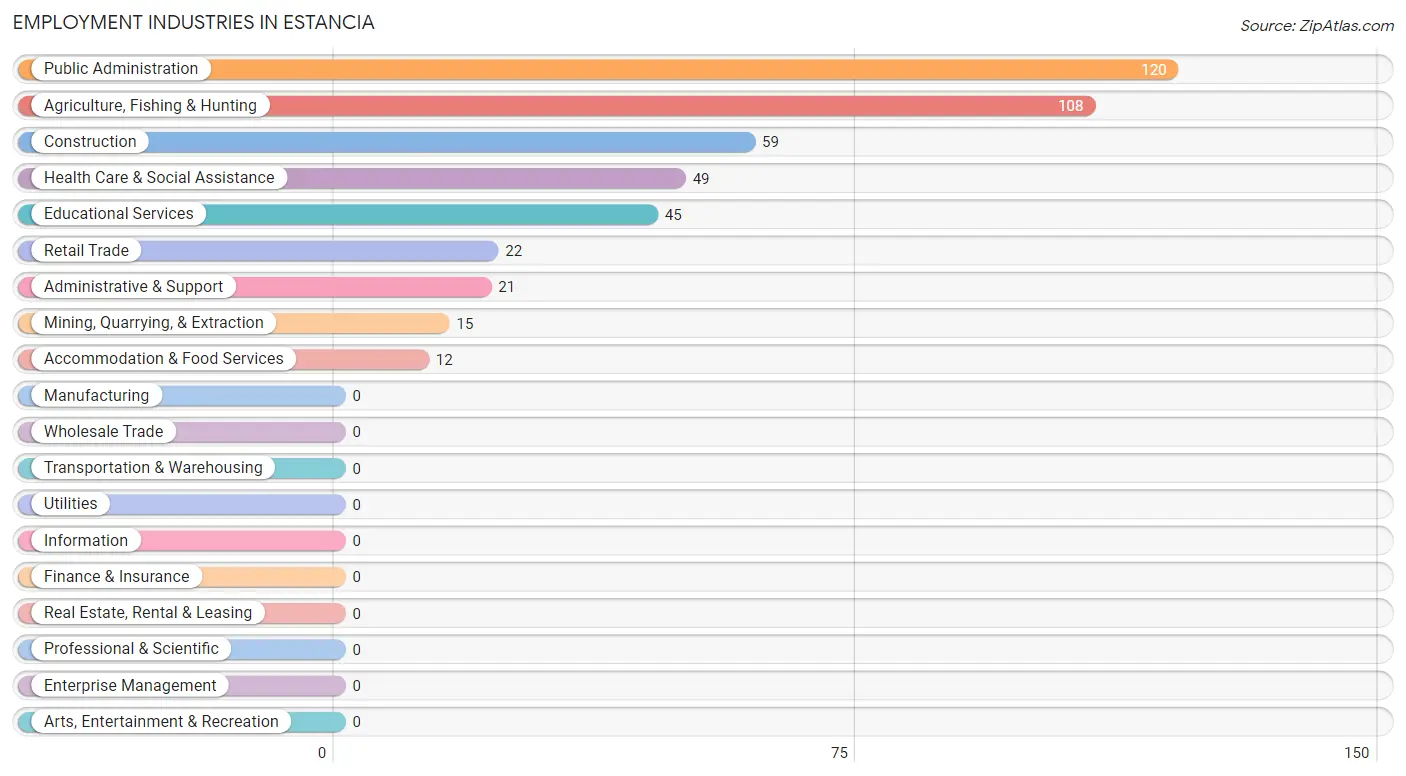
Employment Industries in Estancia
The major employment industries in Estancia include Public Administration (120 | 26.1%), Agriculture, Fishing & Hunting (108 | 23.5%), Construction (59 | 12.8%), Health Care & Social Assistance (49 | 10.6%), and Educational Services (45 | 9.8%).
Employment Industries by Sex in Estancia
The Estancia industries that see more men than women are Mining, Quarrying, & Extraction (100.0%), Construction (100.0%), and Administrative & Support (100.0%), whereas the industries that tend to have a higher number of women are Health Care & Social Assistance (100.0%), Accommodation & Food Services (100.0%), and Educational Services (71.1%).
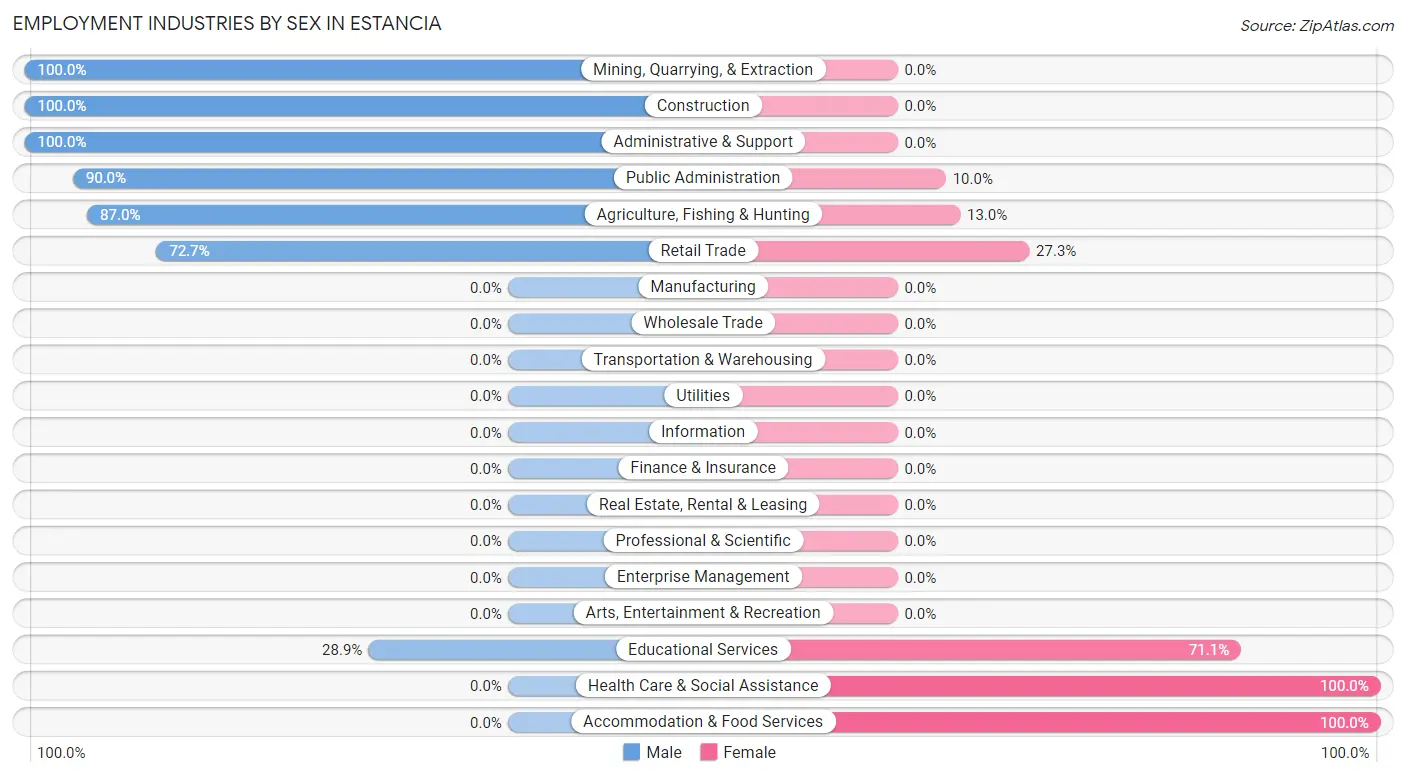
| Industry | Male | Female |
| Agriculture, Fishing & Hunting | 94 (87.0%) | 14 (13.0%) |
| Mining, Quarrying, & Extraction | 15 (100.0%) | 0 (0.0%) |
| Construction | 59 (100.0%) | 0 (0.0%) |
| Manufacturing | 0 (0.0%) | 0 (0.0%) |
| Wholesale Trade | 0 (0.0%) | 0 (0.0%) |
| Retail Trade | 16 (72.7%) | 6 (27.3%) |
| Transportation & Warehousing | 0 (0.0%) | 0 (0.0%) |
| Utilities | 0 (0.0%) | 0 (0.0%) |
| Information | 0 (0.0%) | 0 (0.0%) |
| Finance & Insurance | 0 (0.0%) | 0 (0.0%) |
| Real Estate, Rental & Leasing | 0 (0.0%) | 0 (0.0%) |
| Professional & Scientific | 0 (0.0%) | 0 (0.0%) |
| Enterprise Management | 0 (0.0%) | 0 (0.0%) |
| Administrative & Support | 21 (100.0%) | 0 (0.0%) |
| Educational Services | 13 (28.9%) | 32 (71.1%) |
| Health Care & Social Assistance | 0 (0.0%) | 49 (100.0%) |
| Arts, Entertainment & Recreation | 0 (0.0%) | 0 (0.0%) |
| Accommodation & Food Services | 0 (0.0%) | 12 (100.0%) |
| Public Administration | 108 (90.0%) | 12 (10.0%) |
| Total | 326 (70.9%) | 134 (29.1%) |
Education in Estancia
School Enrollment in Estancia
The most common levels of schooling among the 321 students in Estancia are college / undergraduate (153 | 47.7%), high school (81 | 25.2%), and middle school (48 | 14.9%).
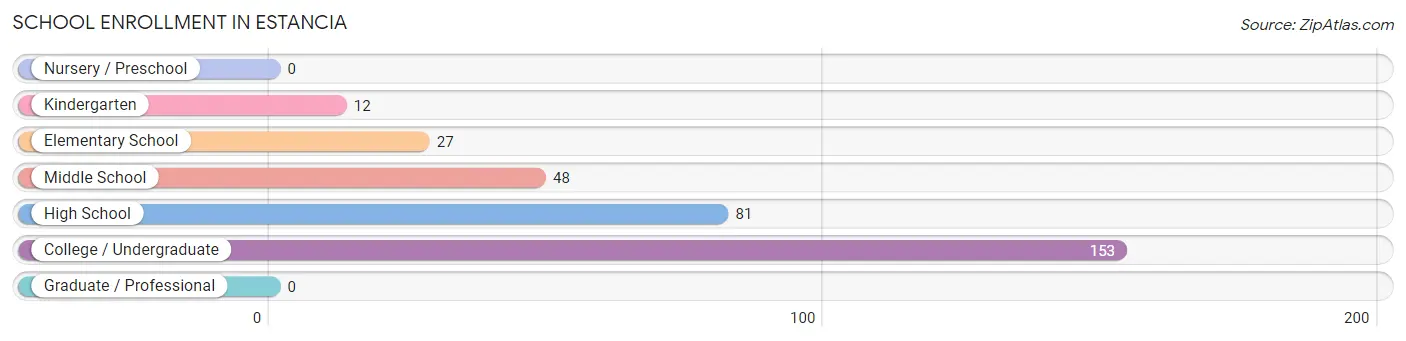
| School Level | # Students | % Students |
| Nursery / Preschool | 0 | 0.0% |
| Kindergarten | 12 | 3.7% |
| Elementary School | 27 | 8.4% |
| Middle School | 48 | 14.9% |
| High School | 81 | 25.2% |
| College / Undergraduate | 153 | 47.7% |
| Graduate / Professional | 0 | 0.0% |
| Total | 321 | 100.0% |
School Enrollment by Age by Funding Source in Estancia
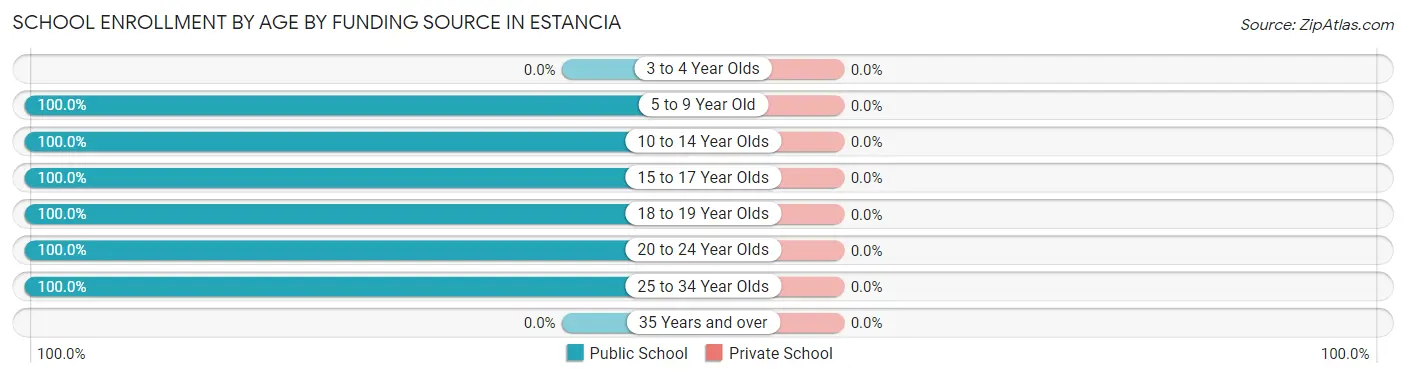
| Age Bracket | Public School | Private School |
| 3 to 4 Year Olds | 0 (0.0%) | 0 (0.0%) |
| 5 to 9 Year Old | 39 (100.0%) | 0 (0.0%) |
| 10 to 14 Year Olds | 48 (100.0%) | 0 (0.0%) |
| 15 to 17 Year Olds | 81 (100.0%) | 0 (0.0%) |
| 18 to 19 Year Olds | 26 (100.0%) | 0 (0.0%) |
| 20 to 24 Year Olds | 119 (100.0%) | 0 (0.0%) |
| 25 to 34 Year Olds | 8 (100.0%) | 0 (0.0%) |
| 35 Years and over | 0 (0.0%) | 0 (0.0%) |
| Total | 321 (100.0%) | 0 (0.0%) |
Educational Attainment by Field of Study in Estancia
Bio, nature & agricultural (41 | 19.5%), business (32 | 15.2%), psychology (30 | 14.3%), social sciences (21 | 10.0%), and education (21 | 10.0%) are the most common fields of study among 210 individuals in Estancia who have obtained a bachelor's degree or higher.
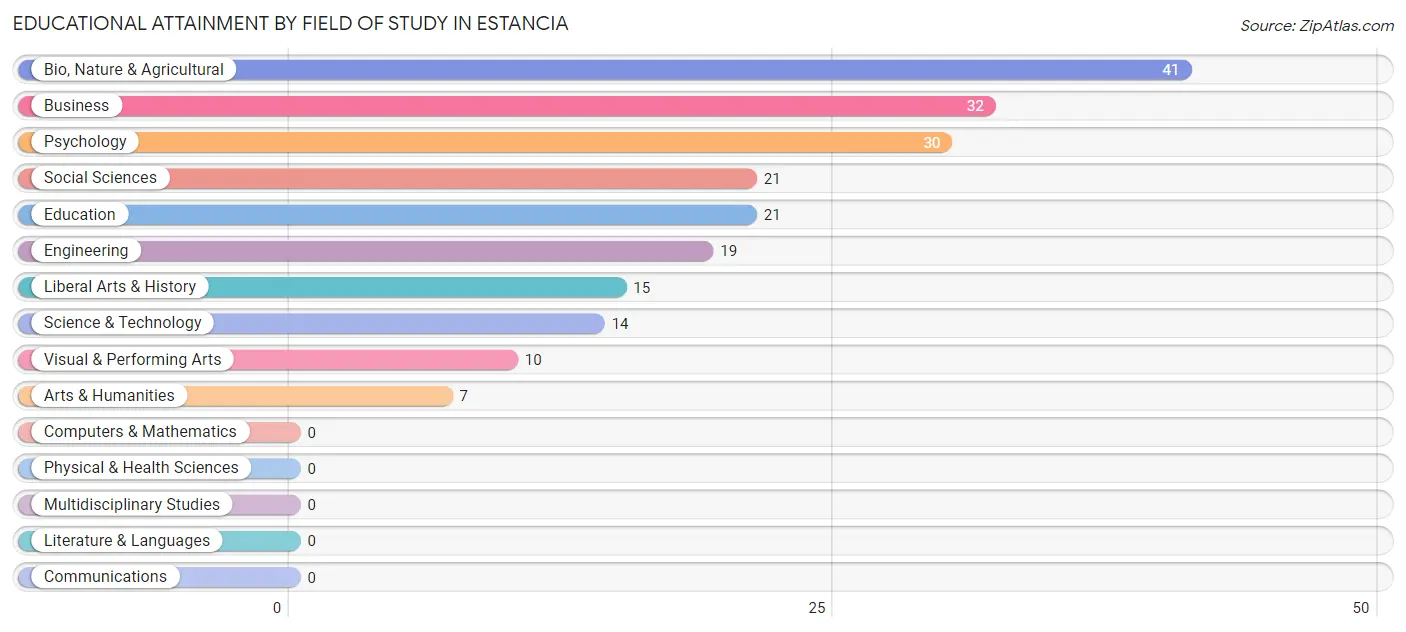
| Field of Study | # Graduates | % Graduates |
| Computers & Mathematics | 0 | 0.0% |
| Bio, Nature & Agricultural | 41 | 19.5% |
| Physical & Health Sciences | 0 | 0.0% |
| Psychology | 30 | 14.3% |
| Social Sciences | 21 | 10.0% |
| Engineering | 19 | 9.0% |
| Multidisciplinary Studies | 0 | 0.0% |
| Science & Technology | 14 | 6.7% |
| Business | 32 | 15.2% |
| Education | 21 | 10.0% |
| Literature & Languages | 0 | 0.0% |
| Liberal Arts & History | 15 | 7.1% |
| Visual & Performing Arts | 10 | 4.8% |
| Communications | 0 | 0.0% |
| Arts & Humanities | 7 | 3.3% |
| Total | 210 | 100.0% |
Transportation & Commute in Estancia
Vehicle Availability by Sex in Estancia
The most prevalent vehicle ownership categories in Estancia are males with 5 or more vehicles (148, accounting for 45.4%) and females with 5 or more vehicles (12, making up 137.0%).
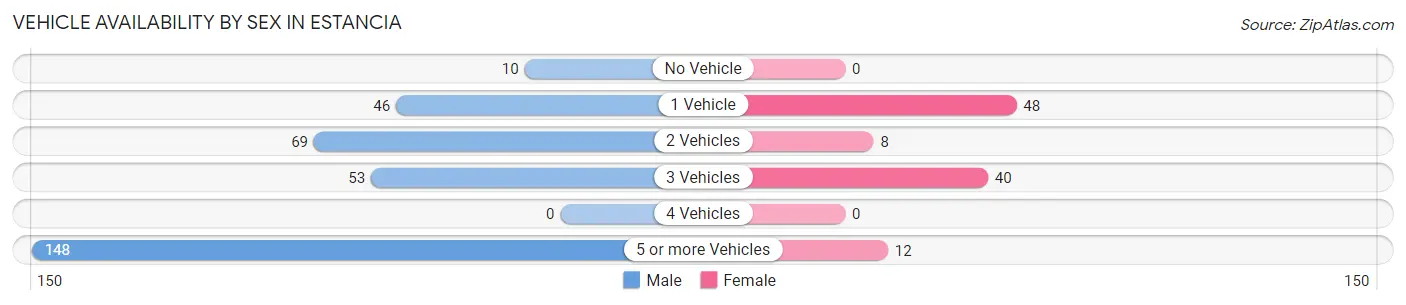
| Vehicles Available | Male | Female |
| No Vehicle | 10 (3.1%) | 0 (0.0%) |
| 1 Vehicle | 46 (14.1%) | 48 (44.4%) |
| 2 Vehicles | 69 (21.2%) | 8 (7.4%) |
| 3 Vehicles | 53 (16.3%) | 40 (37.0%) |
| 4 Vehicles | 0 (0.0%) | 0 (0.0%) |
| 5 or more Vehicles | 148 (45.4%) | 12 (11.1%) |
| Total | 326 (100.0%) | 108 (100.0%) |
Commute Time in Estancia
The most frequently occuring commute durations in Estancia are 60 to 89 minutes (117 commuters, 27.0%), 5 to 9 minutes (77 commuters, 17.7%), and 15 to 19 minutes (47 commuters, 10.8%).
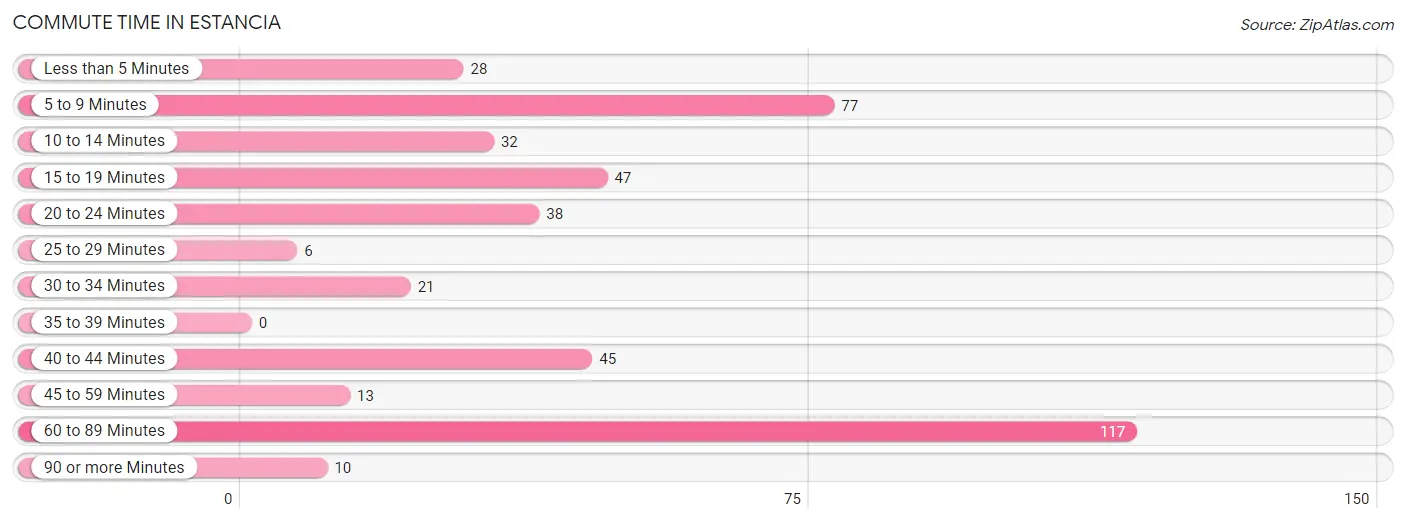
| Commute Time | # Commuters | % Commuters |
| Less than 5 Minutes | 28 | 6.5% |
| 5 to 9 Minutes | 77 | 17.7% |
| 10 to 14 Minutes | 32 | 7.4% |
| 15 to 19 Minutes | 47 | 10.8% |
| 20 to 24 Minutes | 38 | 8.8% |
| 25 to 29 Minutes | 6 | 1.4% |
| 30 to 34 Minutes | 21 | 4.8% |
| 35 to 39 Minutes | 0 | 0.0% |
| 40 to 44 Minutes | 45 | 10.4% |
| 45 to 59 Minutes | 13 | 3.0% |
| 60 to 89 Minutes | 117 | 27.0% |
| 90 or more Minutes | 10 | 2.3% |
Commute Time by Sex in Estancia
The most common commute times in Estancia are 60 to 89 minutes (96 commuters, 29.4%) for males and 15 to 19 minutes (31 commuters, 28.7%) for females.
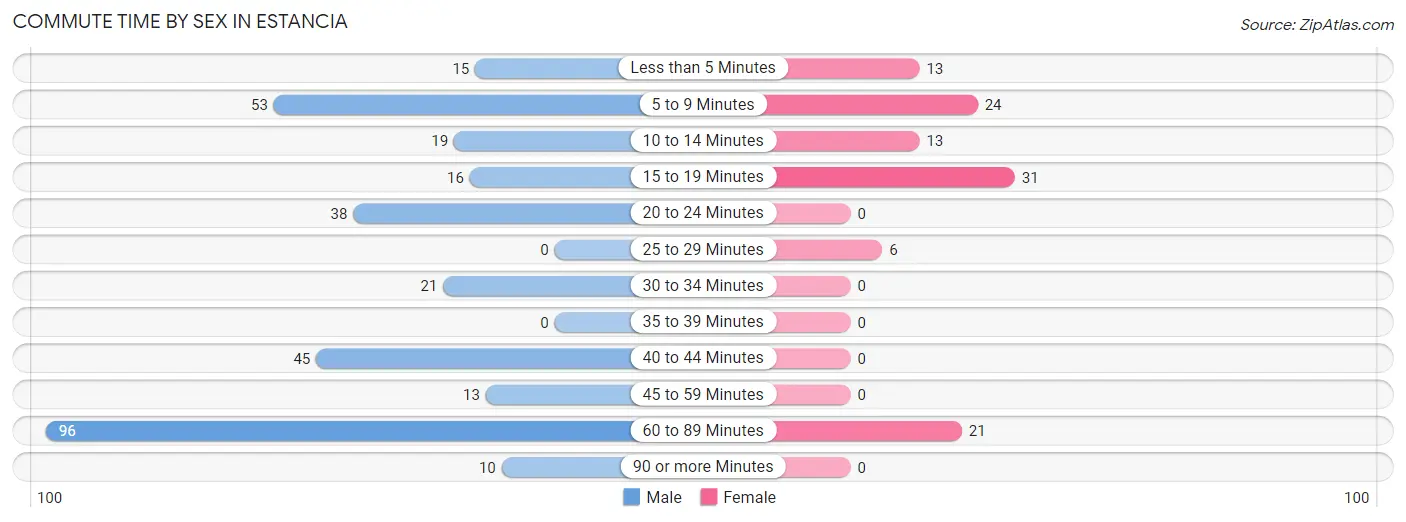
| Commute Time | Male | Female |
| Less than 5 Minutes | 15 (4.6%) | 13 (12.0%) |
| 5 to 9 Minutes | 53 (16.3%) | 24 (22.2%) |
| 10 to 14 Minutes | 19 (5.8%) | 13 (12.0%) |
| 15 to 19 Minutes | 16 (4.9%) | 31 (28.7%) |
| 20 to 24 Minutes | 38 (11.7%) | 0 (0.0%) |
| 25 to 29 Minutes | 0 (0.0%) | 6 (5.6%) |
| 30 to 34 Minutes | 21 (6.4%) | 0 (0.0%) |
| 35 to 39 Minutes | 0 (0.0%) | 0 (0.0%) |
| 40 to 44 Minutes | 45 (13.8%) | 0 (0.0%) |
| 45 to 59 Minutes | 13 (4.0%) | 0 (0.0%) |
| 60 to 89 Minutes | 96 (29.4%) | 21 (19.4%) |
| 90 or more Minutes | 10 (3.1%) | 0 (0.0%) |
Time of Departure to Work by Sex in Estancia
The most frequent times of departure to work in Estancia are 6:30 AM to 6:59 AM (101, 31.0%) for males and 7:00 AM to 7:29 AM (24, 22.2%) for females.
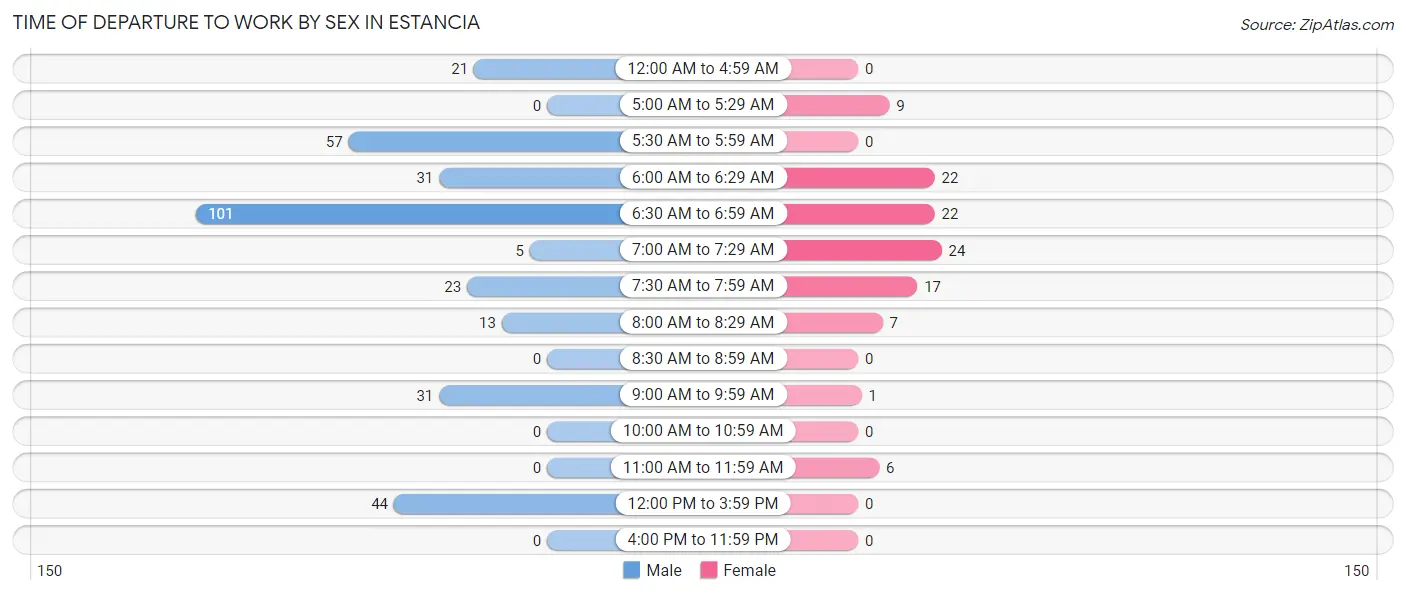
| Time of Departure | Male | Female |
| 12:00 AM to 4:59 AM | 21 (6.4%) | 0 (0.0%) |
| 5:00 AM to 5:29 AM | 0 (0.0%) | 9 (8.3%) |
| 5:30 AM to 5:59 AM | 57 (17.5%) | 0 (0.0%) |
| 6:00 AM to 6:29 AM | 31 (9.5%) | 22 (20.4%) |
| 6:30 AM to 6:59 AM | 101 (31.0%) | 22 (20.4%) |
| 7:00 AM to 7:29 AM | 5 (1.5%) | 24 (22.2%) |
| 7:30 AM to 7:59 AM | 23 (7.1%) | 17 (15.7%) |
| 8:00 AM to 8:29 AM | 13 (4.0%) | 7 (6.5%) |
| 8:30 AM to 8:59 AM | 0 (0.0%) | 0 (0.0%) |
| 9:00 AM to 9:59 AM | 31 (9.5%) | 1 (0.9%) |
| 10:00 AM to 10:59 AM | 0 (0.0%) | 0 (0.0%) |
| 11:00 AM to 11:59 AM | 0 (0.0%) | 6 (5.6%) |
| 12:00 PM to 3:59 PM | 44 (13.5%) | 0 (0.0%) |
| 4:00 PM to 11:59 PM | 0 (0.0%) | 0 (0.0%) |
| Total | 326 (100.0%) | 108 (100.0%) |
Housing Occupancy in Estancia
Occupancy by Ownership in Estancia
Of the total 626 dwellings in Estancia, owner-occupied units account for 439 (70.1%), while renter-occupied units make up 187 (29.9%).
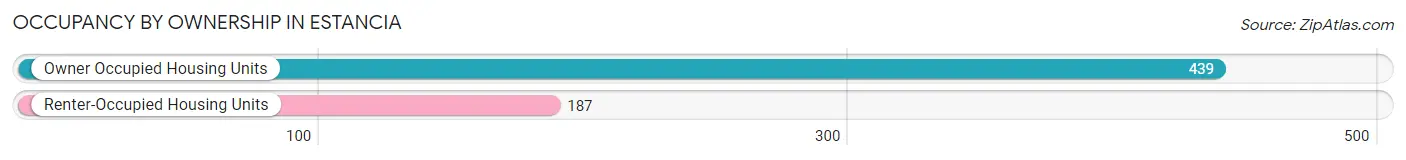
| Occupancy | # Housing Units | % Housing Units |
| Owner Occupied Housing Units | 439 | 70.1% |
| Renter-Occupied Housing Units | 187 | 29.9% |
| Total Occupied Housing Units | 626 | 100.0% |
Occupancy by Household Size in Estancia
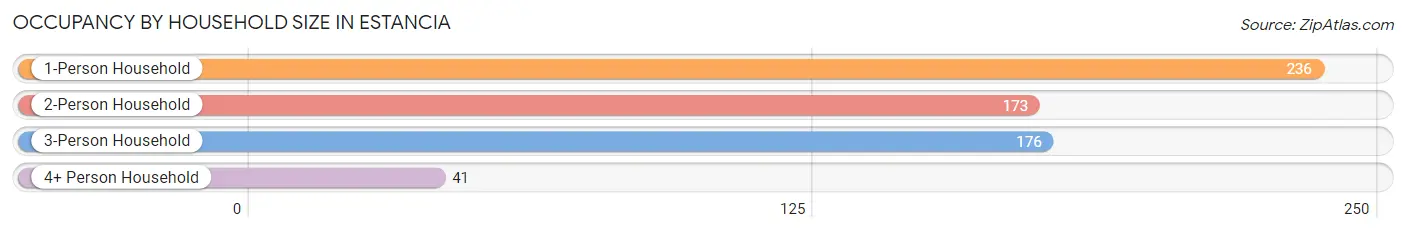
| Household Size | # Housing Units | % Housing Units |
| 1-Person Household | 236 | 37.7% |
| 2-Person Household | 173 | 27.6% |
| 3-Person Household | 176 | 28.1% |
| 4+ Person Household | 41 | 6.6% |
| Total Housing Units | 626 | 100.0% |
Occupancy by Ownership by Household Size in Estancia
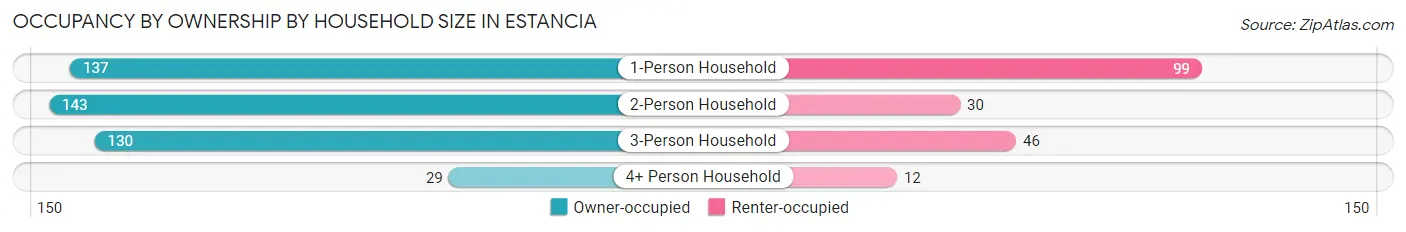
| Household Size | Owner-occupied | Renter-occupied |
| 1-Person Household | 137 (58.1%) | 99 (41.9%) |
| 2-Person Household | 143 (82.7%) | 30 (17.3%) |
| 3-Person Household | 130 (73.9%) | 46 (26.1%) |
| 4+ Person Household | 29 (70.7%) | 12 (29.3%) |
| Total Housing Units | 439 (70.1%) | 187 (29.9%) |
Occupancy by Educational Attainment in Estancia
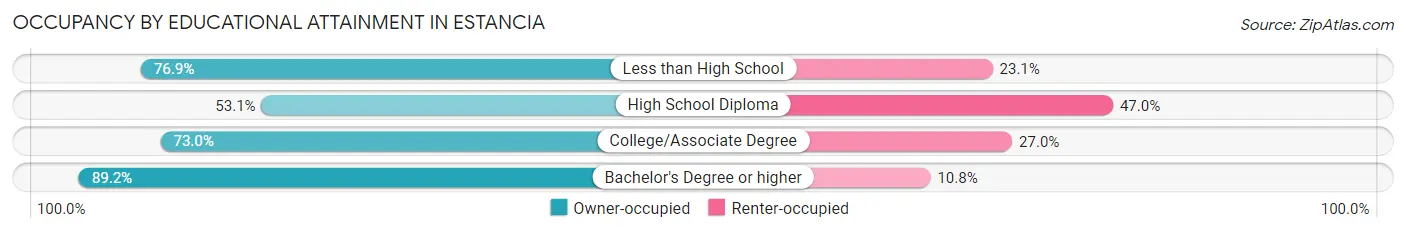
| Household Size | Owner-occupied | Renter-occupied |
| Less than High School | 80 (76.9%) | 24 (23.1%) |
| High School Diploma | 87 (53.0%) | 77 (46.9%) |
| College/Associate Degree | 214 (73.0%) | 79 (27.0%) |
| Bachelor's Degree or higher | 58 (89.2%) | 7 (10.8%) |
Occupancy by Age of Householder in Estancia
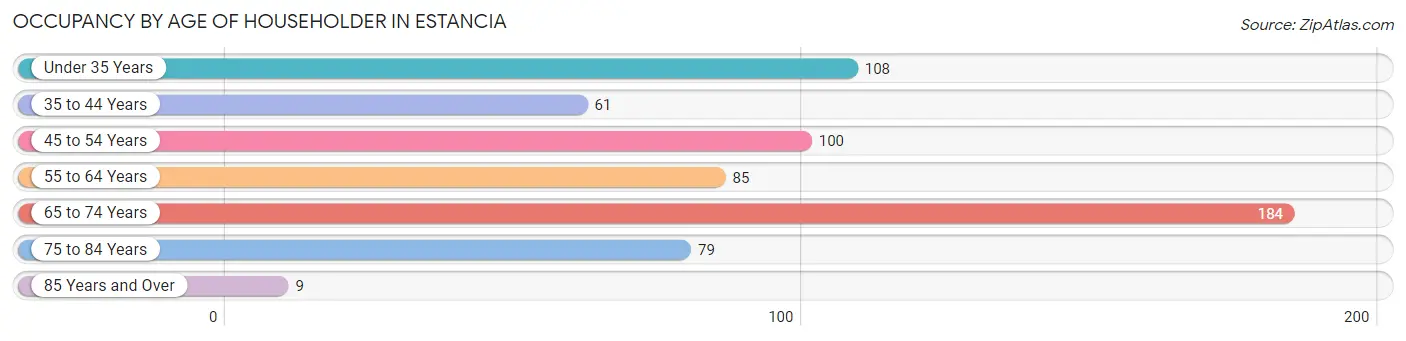
| Age Bracket | # Households | % Households |
| Under 35 Years | 108 | 17.2% |
| 35 to 44 Years | 61 | 9.7% |
| 45 to 54 Years | 100 | 16.0% |
| 55 to 64 Years | 85 | 13.6% |
| 65 to 74 Years | 184 | 29.4% |
| 75 to 84 Years | 79 | 12.6% |
| 85 Years and Over | 9 | 1.4% |
| Total | 626 | 100.0% |
Housing Finances in Estancia
Median Income by Occupancy in Estancia
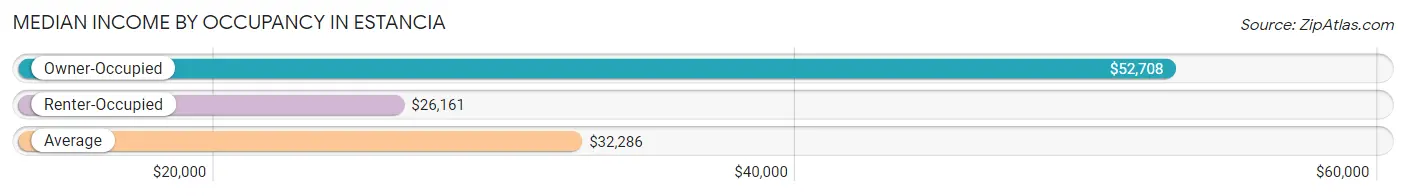
| Occupancy Type | # Households | Median Income |
| Owner-Occupied | 439 (70.1%) | $52,708 |
| Renter-Occupied | 187 (29.9%) | $26,161 |
| Average | 626 (100.0%) | $32,286 |
Occupancy by Householder Income Bracket in Estancia
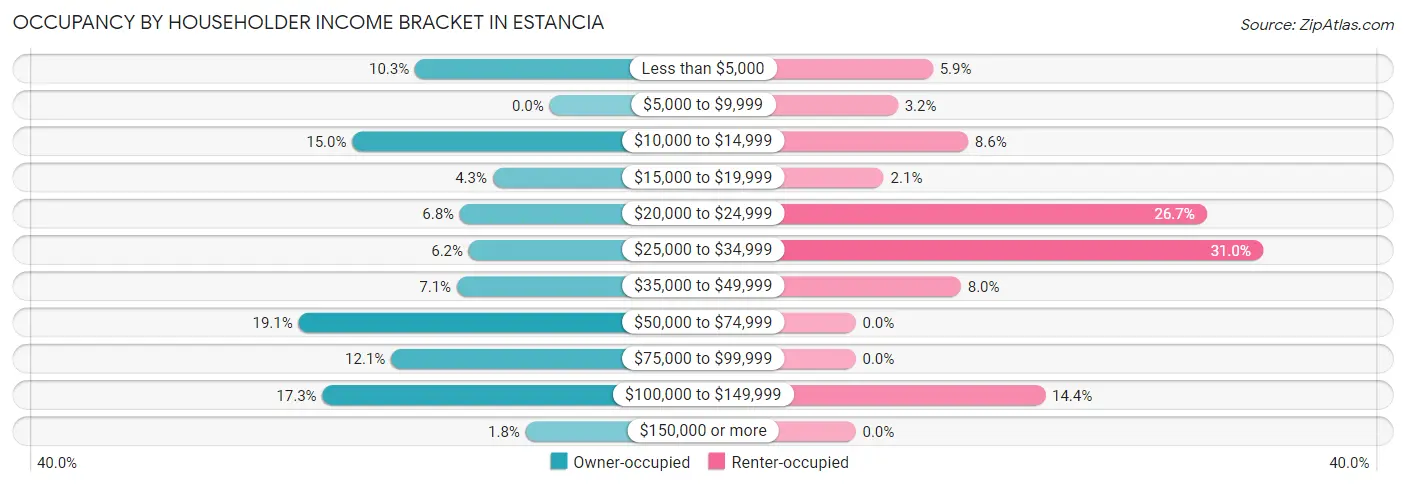
| Income Bracket | Owner-occupied | Renter-occupied |
| Less than $5,000 | 45 (10.2%) | 11 (5.9%) |
| $5,000 to $9,999 | 0 (0.0%) | 6 (3.2%) |
| $10,000 to $14,999 | 66 (15.0%) | 16 (8.6%) |
| $15,000 to $19,999 | 19 (4.3%) | 4 (2.1%) |
| $20,000 to $24,999 | 30 (6.8%) | 50 (26.7%) |
| $25,000 to $34,999 | 27 (6.1%) | 58 (31.0%) |
| $35,000 to $49,999 | 31 (7.1%) | 15 (8.0%) |
| $50,000 to $74,999 | 84 (19.1%) | 0 (0.0%) |
| $75,000 to $99,999 | 53 (12.1%) | 0 (0.0%) |
| $100,000 to $149,999 | 76 (17.3%) | 27 (14.4%) |
| $150,000 or more | 8 (1.8%) | 0 (0.0%) |
| Total | 439 (100.0%) | 187 (100.0%) |
Monthly Housing Cost Tiers in Estancia
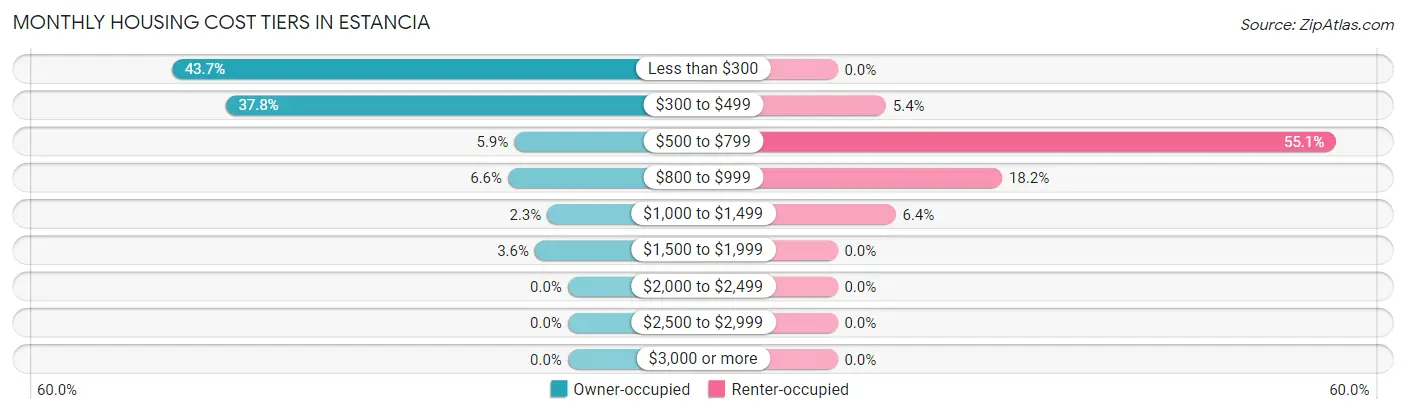
| Monthly Cost | Owner-occupied | Renter-occupied |
| Less than $300 | 192 (43.7%) | 0 (0.0%) |
| $300 to $499 | 166 (37.8%) | 10 (5.3%) |
| $500 to $799 | 26 (5.9%) | 103 (55.1%) |
| $800 to $999 | 29 (6.6%) | 34 (18.2%) |
| $1,000 to $1,499 | 10 (2.3%) | 12 (6.4%) |
| $1,500 to $1,999 | 16 (3.6%) | 0 (0.0%) |
| $2,000 to $2,499 | 0 (0.0%) | 0 (0.0%) |
| $2,500 to $2,999 | 0 (0.0%) | 0 (0.0%) |
| $3,000 or more | 0 (0.0%) | 0 (0.0%) |
| Total | 439 (100.0%) | 187 (100.0%) |
Physical Housing Characteristics in Estancia
Housing Structures in Estancia
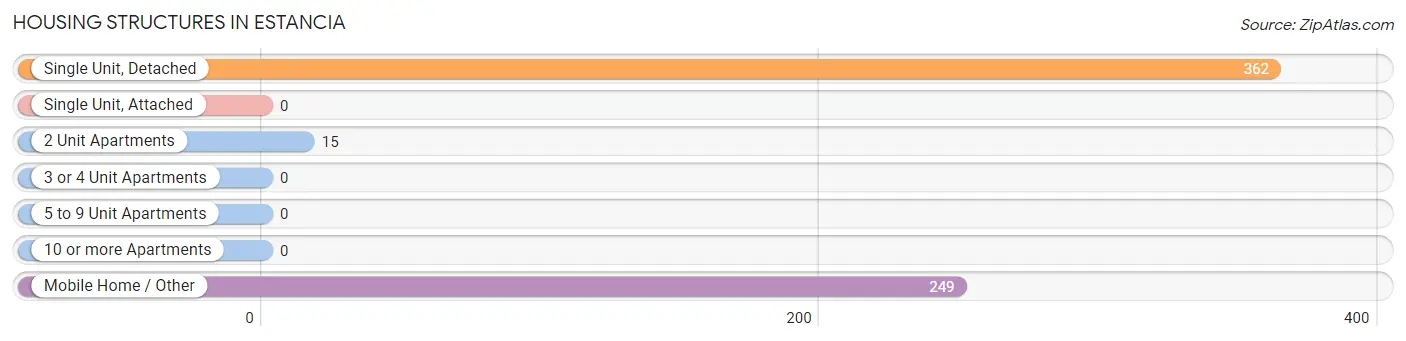
| Structure Type | # Housing Units | % Housing Units |
| Single Unit, Detached | 362 | 57.8% |
| Single Unit, Attached | 0 | 0.0% |
| 2 Unit Apartments | 15 | 2.4% |
| 3 or 4 Unit Apartments | 0 | 0.0% |
| 5 to 9 Unit Apartments | 0 | 0.0% |
| 10 or more Apartments | 0 | 0.0% |
| Mobile Home / Other | 249 | 39.8% |
| Total | 626 | 100.0% |
Housing Structures by Occupancy in Estancia
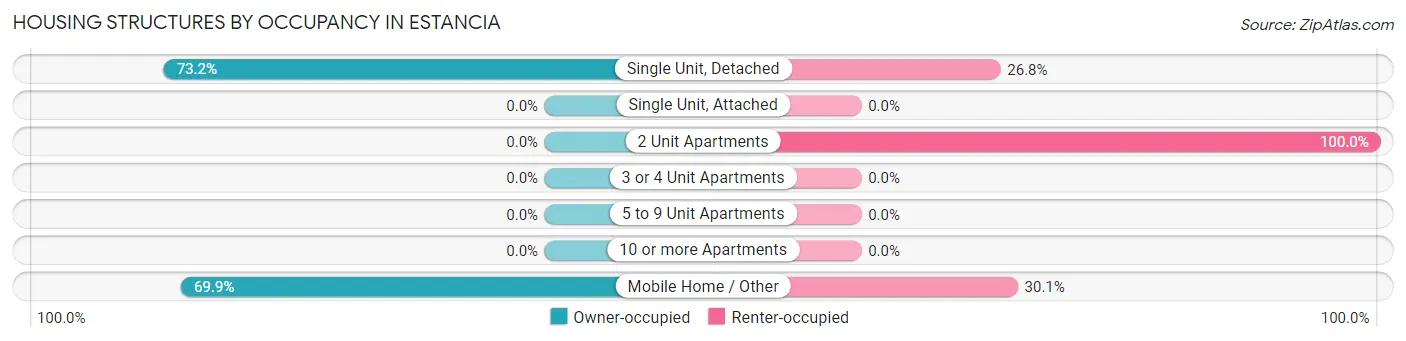
| Structure Type | Owner-occupied | Renter-occupied |
| Single Unit, Detached | 265 (73.2%) | 97 (26.8%) |
| Single Unit, Attached | 0 (0.0%) | 0 (0.0%) |
| 2 Unit Apartments | 0 (0.0%) | 15 (100.0%) |
| 3 or 4 Unit Apartments | 0 (0.0%) | 0 (0.0%) |
| 5 to 9 Unit Apartments | 0 (0.0%) | 0 (0.0%) |
| 10 or more Apartments | 0 (0.0%) | 0 (0.0%) |
| Mobile Home / Other | 174 (69.9%) | 75 (30.1%) |
| Total | 439 (70.1%) | 187 (29.9%) |
Housing Structures by Number of Rooms in Estancia
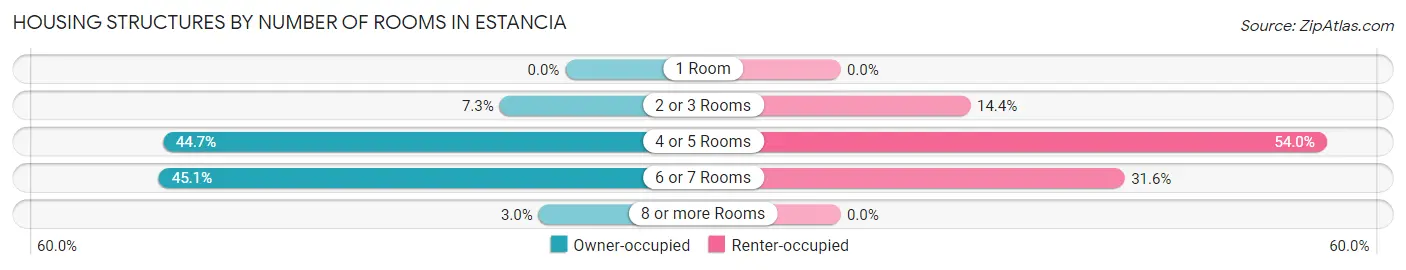
| Number of Rooms | Owner-occupied | Renter-occupied |
| 1 Room | 0 (0.0%) | 0 (0.0%) |
| 2 or 3 Rooms | 32 (7.3%) | 27 (14.4%) |
| 4 or 5 Rooms | 196 (44.7%) | 101 (54.0%) |
| 6 or 7 Rooms | 198 (45.1%) | 59 (31.6%) |
| 8 or more Rooms | 13 (3.0%) | 0 (0.0%) |
| Total | 439 (100.0%) | 187 (100.0%) |
Housing Structure by Heating Type in Estancia
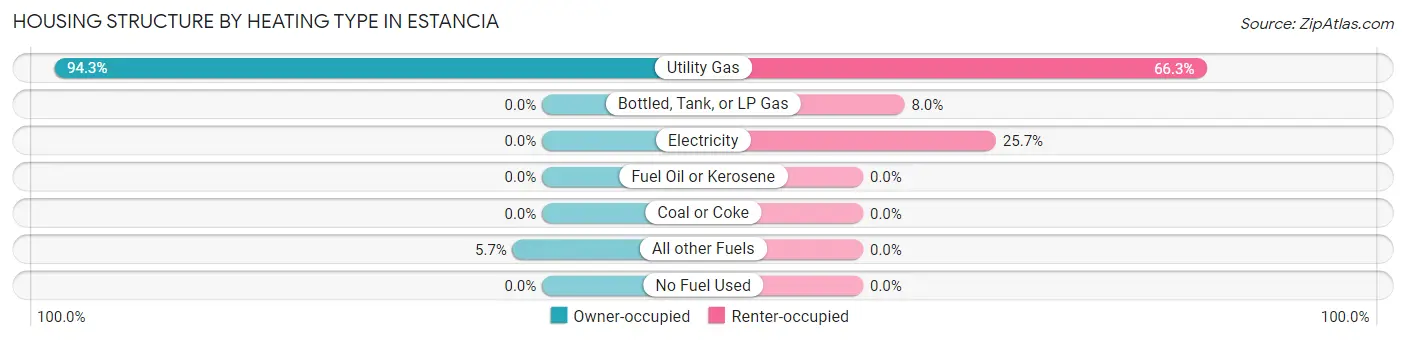
| Heating Type | Owner-occupied | Renter-occupied |
| Utility Gas | 414 (94.3%) | 124 (66.3%) |
| Bottled, Tank, or LP Gas | 0 (0.0%) | 15 (8.0%) |
| Electricity | 0 (0.0%) | 48 (25.7%) |
| Fuel Oil or Kerosene | 0 (0.0%) | 0 (0.0%) |
| Coal or Coke | 0 (0.0%) | 0 (0.0%) |
| All other Fuels | 25 (5.7%) | 0 (0.0%) |
| No Fuel Used | 0 (0.0%) | 0 (0.0%) |
| Total | 439 (100.0%) | 187 (100.0%) |
Household Vehicle Usage in Estancia
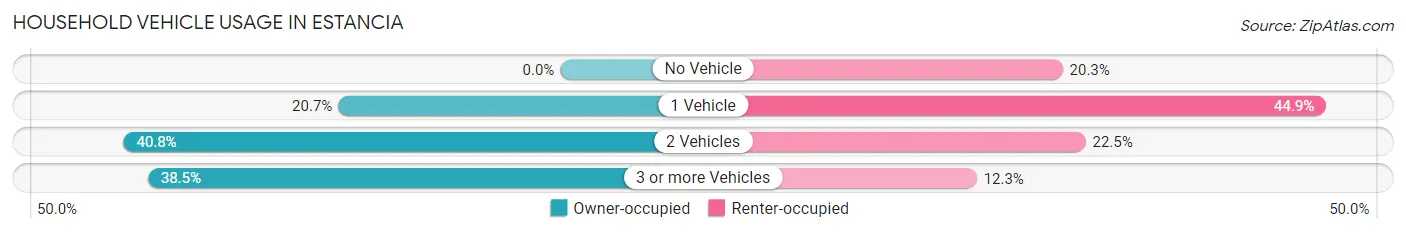
| Vehicles per Household | Owner-occupied | Renter-occupied |
| No Vehicle | 0 (0.0%) | 38 (20.3%) |
| 1 Vehicle | 91 (20.7%) | 84 (44.9%) |
| 2 Vehicles | 179 (40.8%) | 42 (22.5%) |
| 3 or more Vehicles | 169 (38.5%) | 23 (12.3%) |
| Total | 439 (100.0%) | 187 (100.0%) |
Real Estate & Mortgages in Estancia
Real Estate and Mortgage Overview in Estancia
| Characteristic | Without Mortgage | With Mortgage |
| Housing Units | 379 | 60 |
| Median Property Value | $96,100 | $0 |
| Median Household Income | $43,750 | $0 |
| Monthly Housing Costs | $297 | $0 |
| Real Estate Taxes | $471 | $0 |
Property Value by Mortgage Status in Estancia
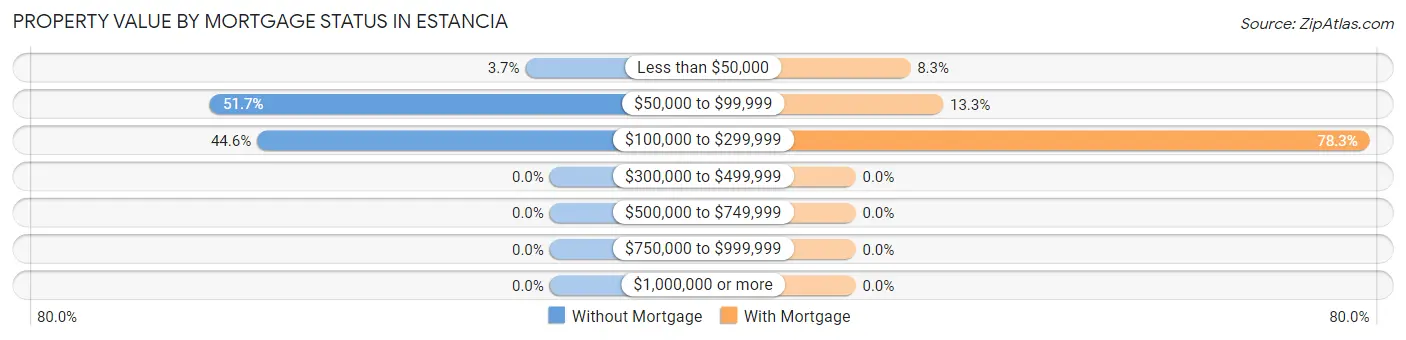
| Property Value | Without Mortgage | With Mortgage |
| Less than $50,000 | 14 (3.7%) | 5 (8.3%) |
| $50,000 to $99,999 | 196 (51.7%) | 8 (13.3%) |
| $100,000 to $299,999 | 169 (44.6%) | 47 (78.3%) |
| $300,000 to $499,999 | 0 (0.0%) | 0 (0.0%) |
| $500,000 to $749,999 | 0 (0.0%) | 0 (0.0%) |
| $750,000 to $999,999 | 0 (0.0%) | 0 (0.0%) |
| $1,000,000 or more | 0 (0.0%) | 0 (0.0%) |
| Total | 379 (100.0%) | 60 (100.0%) |
Household Income by Mortgage Status in Estancia
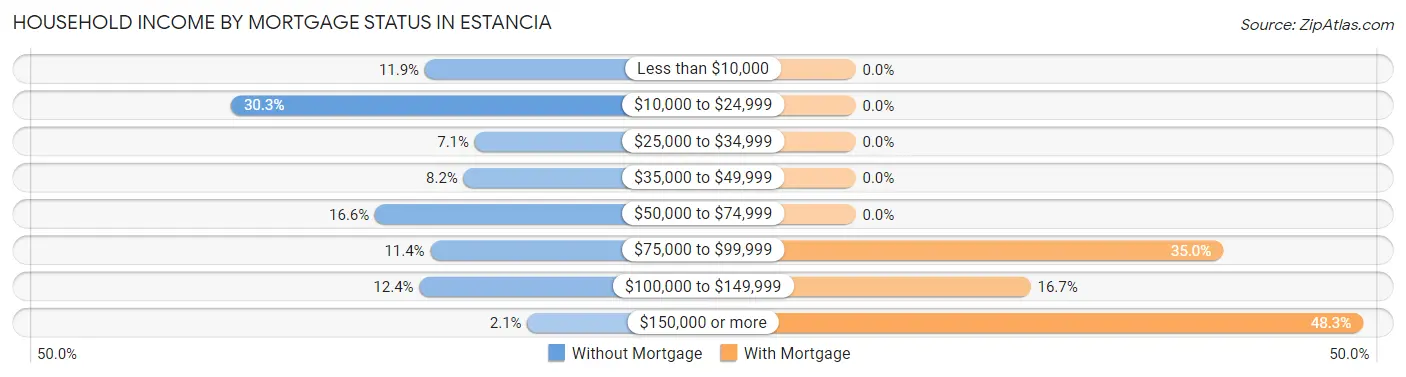
| Household Income | Without Mortgage | With Mortgage |
| Less than $10,000 | 45 (11.9%) | 0 (0.0%) |
| $10,000 to $24,999 | 115 (30.3%) | 0 (0.0%) |
| $25,000 to $34,999 | 27 (7.1%) | 0 (0.0%) |
| $35,000 to $49,999 | 31 (8.2%) | 0 (0.0%) |
| $50,000 to $74,999 | 63 (16.6%) | 0 (0.0%) |
| $75,000 to $99,999 | 43 (11.4%) | 21 (35.0%) |
| $100,000 to $149,999 | 47 (12.4%) | 10 (16.7%) |
| $150,000 or more | 8 (2.1%) | 29 (48.3%) |
| Total | 379 (100.0%) | 60 (100.0%) |
Property Value to Household Income Ratio in Estancia
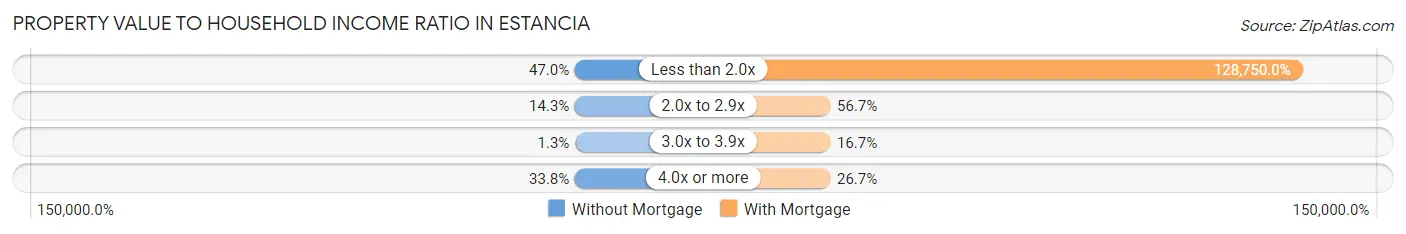
| Value-to-Income Ratio | Without Mortgage | With Mortgage |
| Less than 2.0x | 178 (47.0%) | 77,250 (128,750.0%) |
| 2.0x to 2.9x | 54 (14.2%) | 34 (56.7%) |
| 3.0x to 3.9x | 5 (1.3%) | 10 (16.7%) |
| 4.0x or more | 128 (33.8%) | 16 (26.7%) |
| Total | 379 (100.0%) | 60 (100.0%) |
Real Estate Taxes by Mortgage Status in Estancia
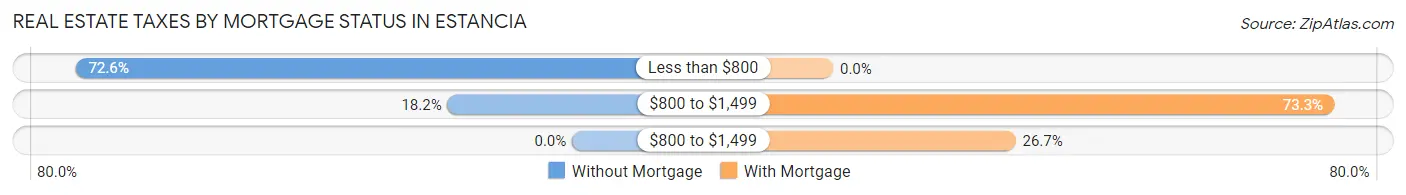
| Property Taxes | Without Mortgage | With Mortgage |
| Less than $800 | 275 (72.6%) | 0 (0.0%) |
| $800 to $1,499 | 69 (18.2%) | 44 (73.3%) |
| $800 to $1,499 | 0 (0.0%) | 16 (26.7%) |
| Total | 379 (100.0%) | 60 (100.0%) |
Health & Disability in Estancia
Health Insurance Coverage by Age in Estancia
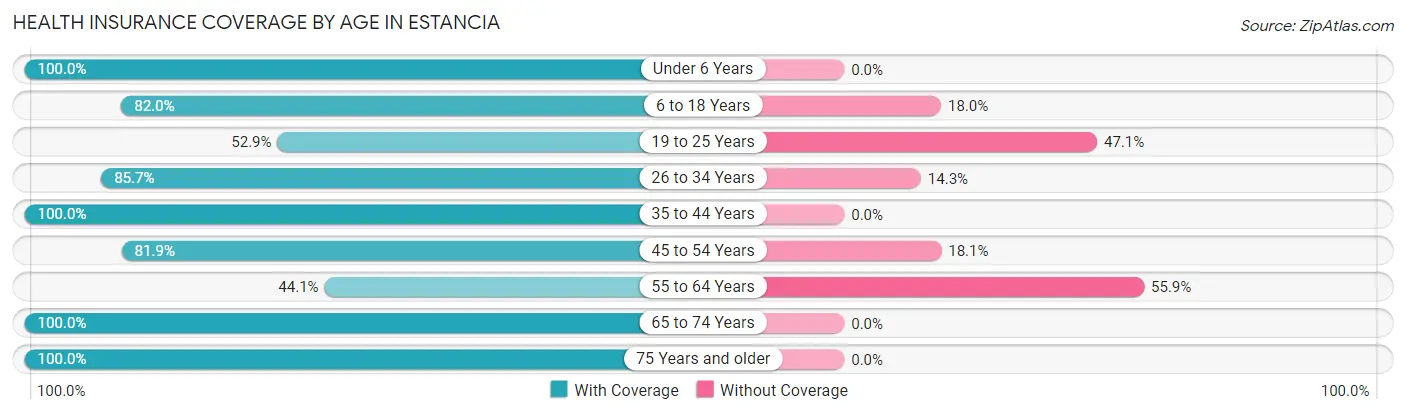
| Age Bracket | With Coverage | Without Coverage |
| Under 6 Years | 87 (100.0%) | 0 (0.0%) |
| 6 to 18 Years | 159 (82.0%) | 35 (18.0%) |
| 19 to 25 Years | 111 (52.9%) | 99 (47.1%) |
| 26 to 34 Years | 120 (85.7%) | 20 (14.3%) |
| 35 to 44 Years | 188 (100.0%) | 0 (0.0%) |
| 45 to 54 Years | 145 (81.9%) | 32 (18.1%) |
| 55 to 64 Years | 97 (44.1%) | 123 (55.9%) |
| 65 to 74 Years | 249 (100.0%) | 0 (0.0%) |
| 75 Years and older | 126 (100.0%) | 0 (0.0%) |
| Total | 1,282 (80.6%) | 309 (19.4%) |
Health Insurance Coverage by Citizenship Status in Estancia
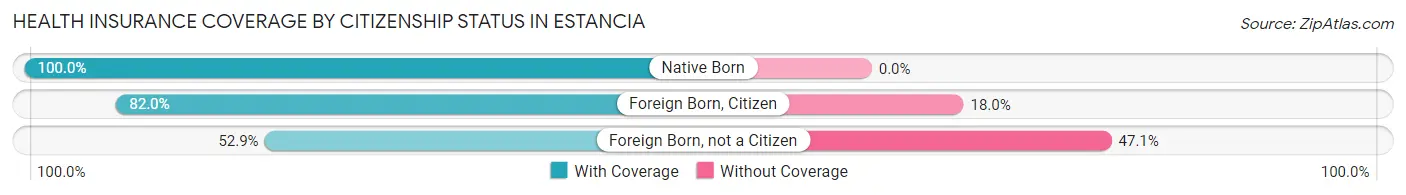
| Citizenship Status | With Coverage | Without Coverage |
| Native Born | 87 (100.0%) | 0 (0.0%) |
| Foreign Born, Citizen | 159 (82.0%) | 35 (18.0%) |
| Foreign Born, not a Citizen | 111 (52.9%) | 99 (47.1%) |
Health Insurance Coverage by Household Income in Estancia
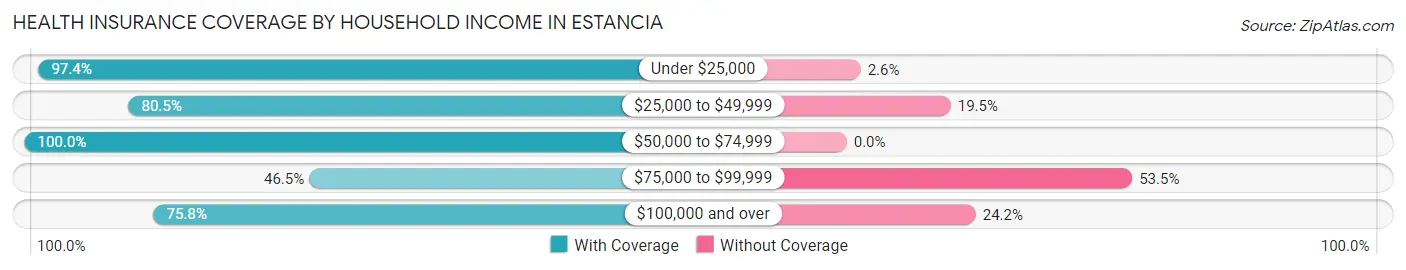
| Household Income | With Coverage | Without Coverage |
| Under $25,000 | 373 (97.4%) | 10 (2.6%) |
| $25,000 to $49,999 | 277 (80.5%) | 67 (19.5%) |
| $50,000 to $74,999 | 183 (100.0%) | 0 (0.0%) |
| $75,000 to $99,999 | 107 (46.5%) | 123 (53.5%) |
| $100,000 and over | 342 (75.8%) | 109 (24.2%) |
Public vs Private Health Insurance Coverage by Age in Estancia
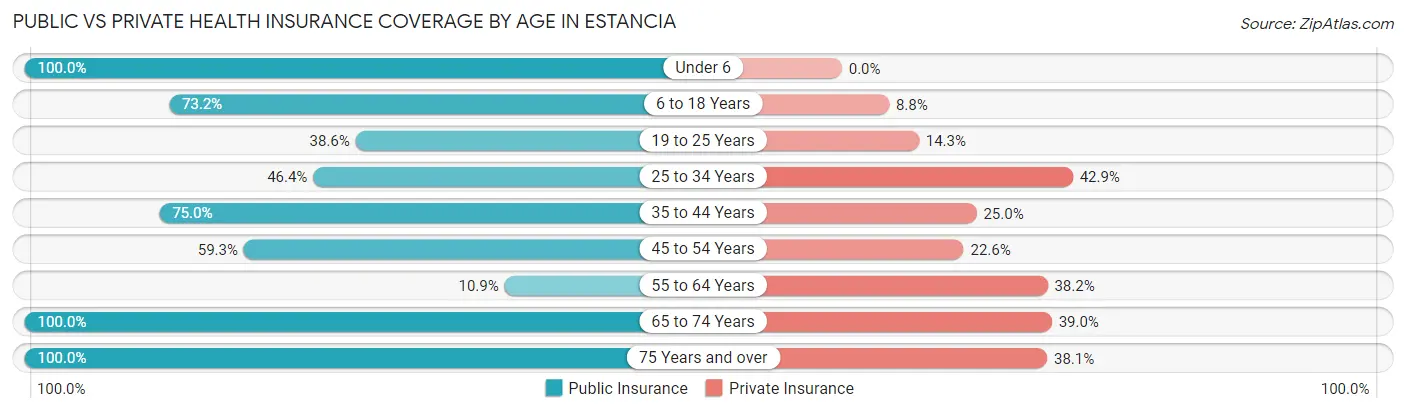
| Age Bracket | Public Insurance | Private Insurance |
| Under 6 | 87 (100.0%) | 0 (0.0%) |
| 6 to 18 Years | 142 (73.2%) | 17 (8.8%) |
| 19 to 25 Years | 81 (38.6%) | 30 (14.3%) |
| 25 to 34 Years | 65 (46.4%) | 60 (42.9%) |
| 35 to 44 Years | 141 (75.0%) | 47 (25.0%) |
| 45 to 54 Years | 105 (59.3%) | 40 (22.6%) |
| 55 to 64 Years | 24 (10.9%) | 84 (38.2%) |
| 65 to 74 Years | 249 (100.0%) | 97 (39.0%) |
| 75 Years and over | 126 (100.0%) | 48 (38.1%) |
| Total | 1,020 (64.1%) | 423 (26.6%) |
Disability Status by Sex by Age in Estancia
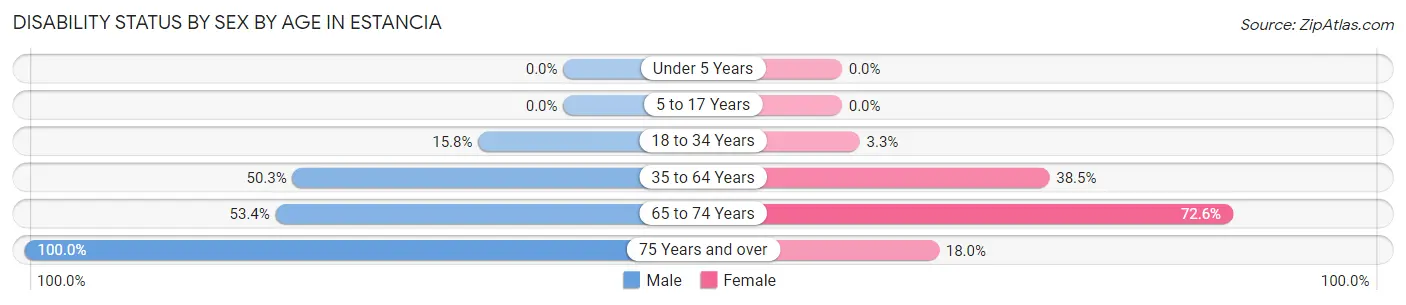
| Age Bracket | Male | Female |
| Under 5 Years | 0 (0.0%) | 0 (0.0%) |
| 5 to 17 Years | 0 (0.0%) | 0 (0.0%) |
| 18 to 34 Years | 45 (15.8%) | 3 (3.3%) |
| 35 to 64 Years | 97 (50.3%) | 151 (38.5%) |
| 65 to 74 Years | 94 (53.4%) | 53 (72.6%) |
| 75 Years and over | 76 (100.0%) | 9 (18.0%) |
Disability Class by Sex by Age in Estancia
Disability Class: Hearing Difficulty
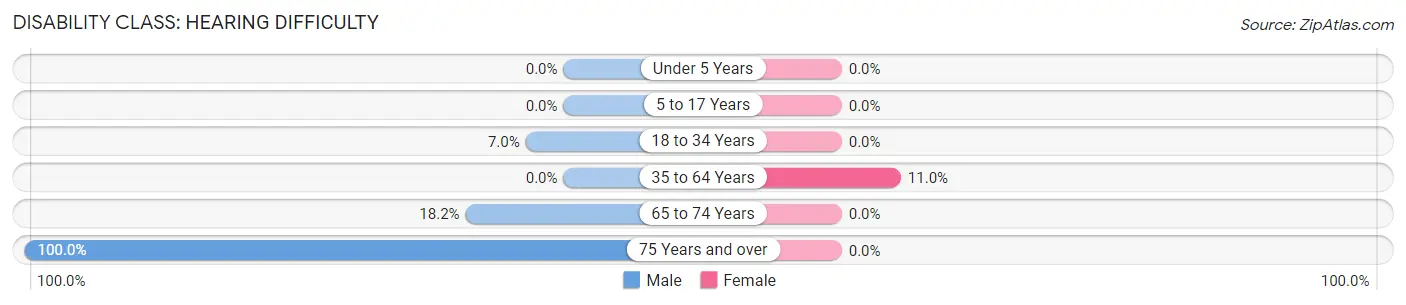
| Age Bracket | Male | Female |
| Under 5 Years | 0 (0.0%) | 0 (0.0%) |
| 5 to 17 Years | 0 (0.0%) | 0 (0.0%) |
| 18 to 34 Years | 20 (7.0%) | 0 (0.0%) |
| 35 to 64 Years | 0 (0.0%) | 43 (11.0%) |
| 65 to 74 Years | 32 (18.2%) | 0 (0.0%) |
| 75 Years and over | 76 (100.0%) | 0 (0.0%) |
Disability Class: Vision Difficulty
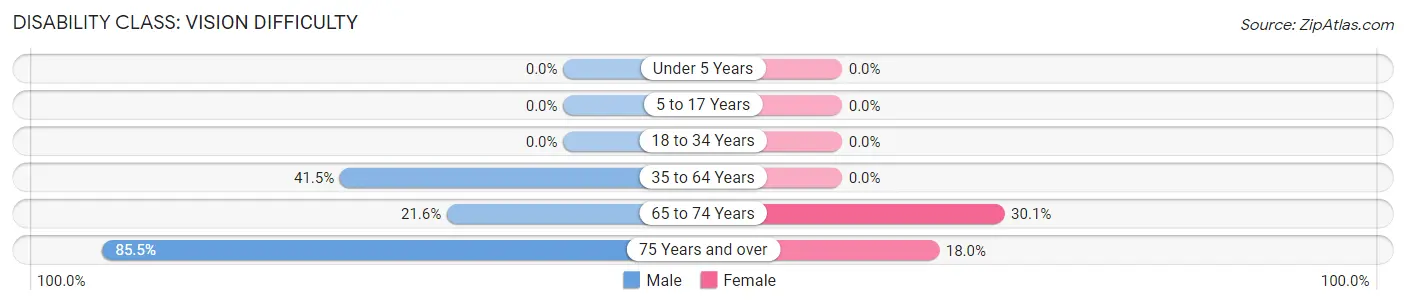
| Age Bracket | Male | Female |
| Under 5 Years | 0 (0.0%) | 0 (0.0%) |
| 5 to 17 Years | 0 (0.0%) | 0 (0.0%) |
| 18 to 34 Years | 0 (0.0%) | 0 (0.0%) |
| 35 to 64 Years | 80 (41.4%) | 0 (0.0%) |
| 65 to 74 Years | 38 (21.6%) | 22 (30.1%) |
| 75 Years and over | 65 (85.5%) | 9 (18.0%) |
Disability Class: Cognitive Difficulty
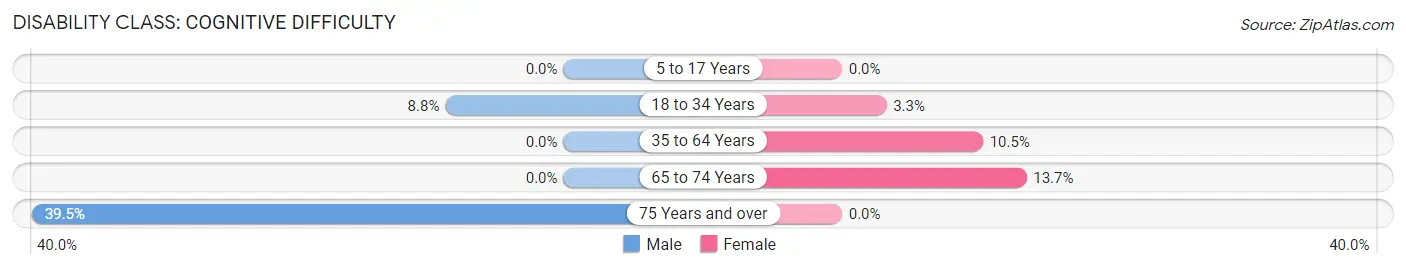
| Age Bracket | Male | Female |
| 5 to 17 Years | 0 (0.0%) | 0 (0.0%) |
| 18 to 34 Years | 25 (8.8%) | 3 (3.3%) |
| 35 to 64 Years | 0 (0.0%) | 41 (10.5%) |
| 65 to 74 Years | 0 (0.0%) | 10 (13.7%) |
| 75 Years and over | 30 (39.5%) | 0 (0.0%) |
Disability Class: Ambulatory Difficulty
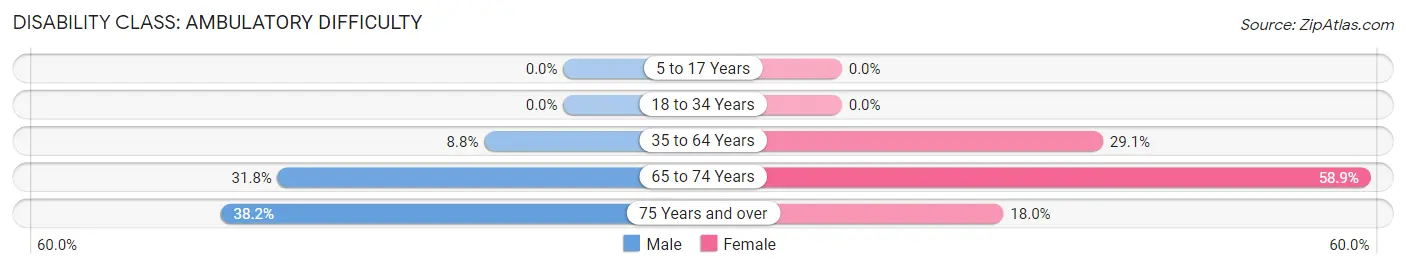
| Age Bracket | Male | Female |
| 5 to 17 Years | 0 (0.0%) | 0 (0.0%) |
| 18 to 34 Years | 0 (0.0%) | 0 (0.0%) |
| 35 to 64 Years | 17 (8.8%) | 114 (29.1%) |
| 65 to 74 Years | 56 (31.8%) | 43 (58.9%) |
| 75 Years and over | 29 (38.2%) | 9 (18.0%) |
Disability Class: Self-Care Difficulty
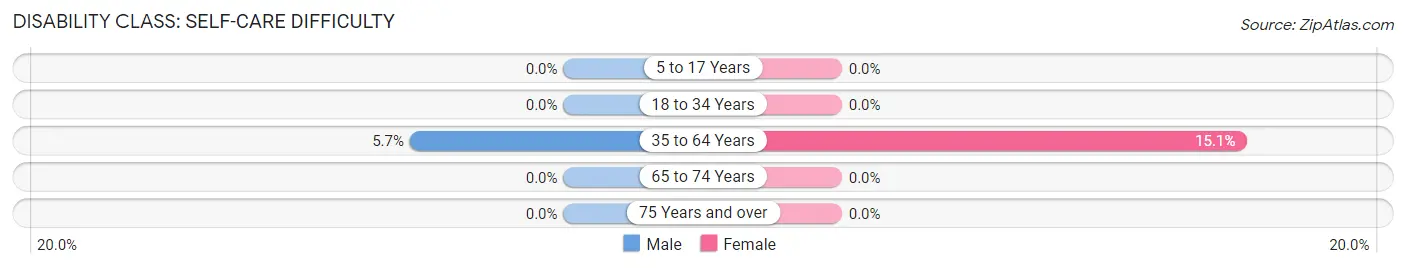
| Age Bracket | Male | Female |
| 5 to 17 Years | 0 (0.0%) | 0 (0.0%) |
| 18 to 34 Years | 0 (0.0%) | 0 (0.0%) |
| 35 to 64 Years | 11 (5.7%) | 59 (15.0%) |
| 65 to 74 Years | 0 (0.0%) | 0 (0.0%) |
| 75 Years and over | 0 (0.0%) | 0 (0.0%) |
Technology Access in Estancia
Computing Device Access in Estancia
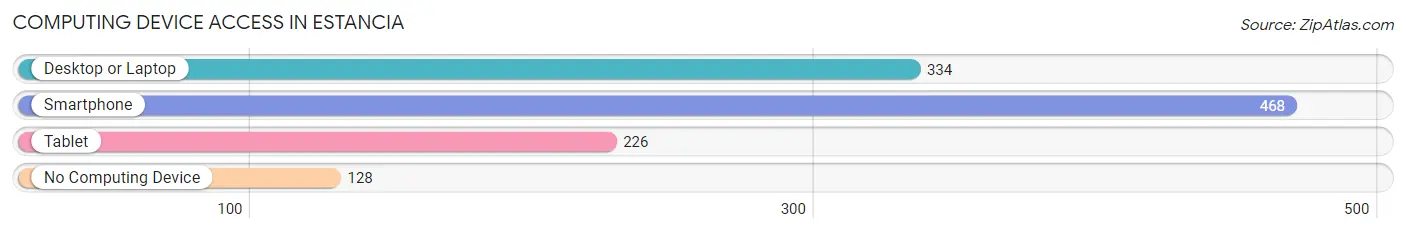
| Device Type | # Households | % Households |
| Desktop or Laptop | 334 | 53.3% |
| Smartphone | 468 | 74.8% |
| Tablet | 226 | 36.1% |
| No Computing Device | 128 | 20.4% |
| Total | 626 | 100.0% |
Internet Access in Estancia
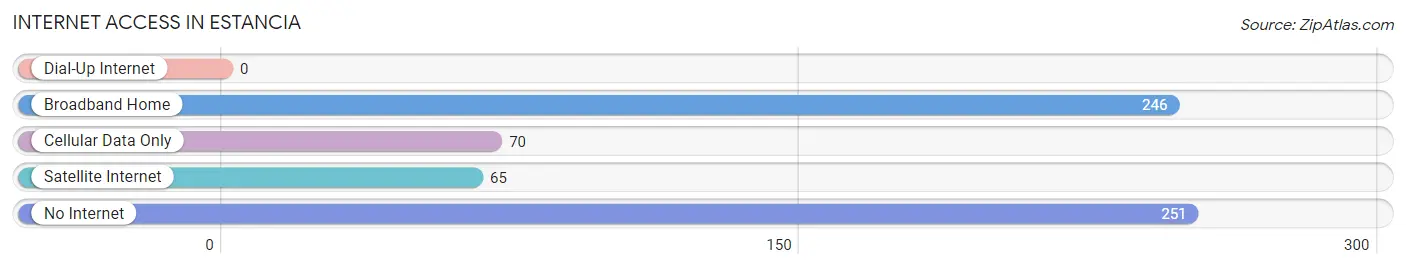
| Internet Type | # Households | % Households |
| Dial-Up Internet | 0 | 0.0% |
| Broadband Home | 246 | 39.3% |
| Cellular Data Only | 70 | 11.2% |
| Satellite Internet | 65 | 10.4% |
| No Internet | 251 | 40.1% |
| Total | 626 | 100.0% |
Estancia Summary
Estancia, New Mexico is a small town located in Torrance County, in the central part of the state. It is situated at the intersection of Interstate 40 and U.S. Route 60, about 40 miles east of Albuquerque. Estancia has a population of 1,719 people, according to the 2010 census.
History
Estancia was founded in 1881 by a group of settlers from the nearby town of Manzano. The town was originally called Manzano Station, but was later renamed Estancia, which is Spanish for “station”. The town was established as a stop on the Atchison, Topeka and Santa Fe Railway.
The town grew quickly, and by the early 1900s, it had become a major agricultural center. The town was home to several large farms, as well as a number of small businesses.
In the 1950s, Estancia began to experience a decline in population as people moved away to larger cities. However, the town has seen a resurgence in recent years, as people have moved back to the area to take advantage of the small-town atmosphere and the nearby outdoor recreation opportunities.
Geography
Estancia is located in the Manzano Mountains, which are part of the larger Rocky Mountains. The town is situated at an elevation of 5,890 feet, and is surrounded by rolling hills and grasslands. The Manzano Mountains are home to a variety of wildlife, including deer, elk, and bighorn sheep.
The climate in Estancia is semi-arid, with hot summers and cold winters. The average annual temperature is around 60 degrees Fahrenheit. The town receives an average of 12 inches of precipitation per year.
Economy
Estancia’s economy is largely based on agriculture. The town is home to several large farms, which produce a variety of crops, including alfalfa, corn, wheat, and hay. The town is also home to a number of small businesses, including restaurants, gas stations, and convenience stores.
The town is also home to a number of tourist attractions, including the Manzano Mountains State Park, which offers camping, hiking, and fishing opportunities. The nearby Cibola National Forest also offers a variety of outdoor activities, including camping, hiking, and horseback riding.
Demographics
Estancia has a population of 1,719 people, according to the 2010 census. The town is predominantly Hispanic, with a population that is 77.3% Hispanic, 19.2% White, and 2.5% Native American. The median household income in Estancia is $30,938, and the median age is 33.7 years.
Estancia is a small town with a rich history and a vibrant culture. The town is home to a variety of businesses and attractions, and offers a variety of outdoor recreation opportunities. Estancia is a great place to live, work, and play.
Common Questions
What is Per Capita Income in Estancia?
Per Capita income in Estancia is $25,162.
What is the Median Family Income in Estancia?
Median Family Income in Estancia is $54,306.
What is the Median Household income in Estancia?
Median Household Income in Estancia is $32,286.
What is Income or Wage Gap in Estancia?
Income or Wage Gap in Estancia is 24.1%.
Women in Estancia earn 75.9 cents for every dollar earned by a man.
What is Inequality or Gini Index in Estancia?
Inequality or Gini Index in Estancia is 0.48.
What is the Total Population of Estancia?
Total Population of Estancia is 1,591.
What is the Total Male Population of Estancia?
Total Male Population of Estancia is 822.
What is the Total Female Population of Estancia?
Total Female Population of Estancia is 769.
What is the Ratio of Males per 100 Females in Estancia?
There are 106.89 Males per 100 Females in Estancia.
What is the Ratio of Females per 100 Males in Estancia?
There are 93.55 Females per 100 Males in Estancia.
What is the Median Population Age in Estancia?
Median Population Age in Estancia is 43.8 Years.
What is the Average Family Size in Estancia
Average Family Size in Estancia is 3.5 People.
What is the Average Household Size in Estancia
Average Household Size in Estancia is 2.5 People.
How Large is the Labor Force in Estancia?
There are 707 People in the Labor Forcein in Estancia.
What is the Percentage of People in the Labor Force in Estancia?
51.8% of People are in the Labor Force in Estancia.
What is the Unemployment Rate in Estancia?
Unemployment Rate in Estancia is 34.9%.