Tularosa, NM Map & Demographics
Tularosa Map
Tularosa Overview
$20,440
PER CAPITA INCOME
$49,688
AVG FAMILY INCOME
$47,234
AVG HOUSEHOLD INCOME
34.3%
WAGE / INCOME GAP [ % ]
65.7¢/ $1
WAGE / INCOME GAP [ $ ]
0.52
INEQUALITY / GINI INDEX
2,590
TOTAL POPULATION
1,157
MALE POPULATION
1,433
FEMALE POPULATION
80.74
MALES / 100 FEMALES
123.85
FEMALES / 100 MALES
25.9
MEDIAN AGE
5.4
AVG FAMILY SIZE
4.2
AVG HOUSEHOLD SIZE
863
LABOR FORCE [ PEOPLE ]
47.9%
PERCENT IN LABOR FORCE
21.3%
UNEMPLOYMENT RATE
Tularosa Zip Codes
Tularosa Area Codes
Income in Tularosa
Income Overview in Tularosa
Per Capita Income in Tularosa is $20,440, while median incomes of families and households are $49,688 and $47,234 respectively.
| Characteristic | Number | Measure |
| Per Capita Income | 2,590 | $20,440 |
| Median Family Income | 411 | $49,688 |
| Mean Family Income | 411 | $89,731 |
| Median Household Income | 622 | $47,234 |
| Mean Household Income | 622 | $74,978 |
| Income Deficit | 411 | $0 |
| Wage / Income Gap (%) | 2,590 | 34.34% |
| Wage / Income Gap ($) | 2,590 | 65.66¢ per $1 |
| Gini / Inequality Index | 2,590 | 0.52 |
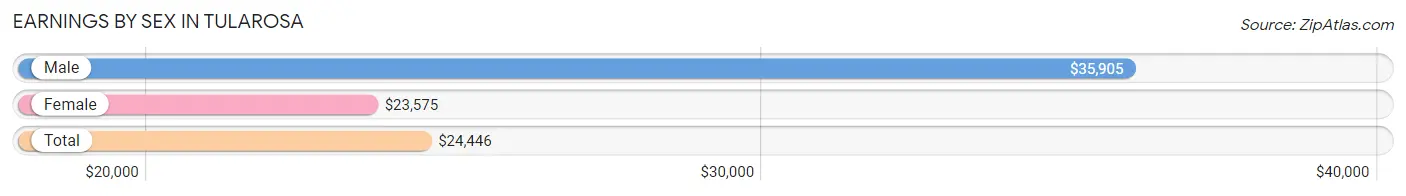
Earnings by Sex in Tularosa
Average Earnings in Tularosa are $24,446, $35,905 for men and $23,575 for women, a difference of 34.3%.
| Sex | Number | Average Earnings |
| Male | 369 (44.6%) | $35,905 |
| Female | 458 (55.4%) | $23,575 |
| Total | 827 (100.0%) | $24,446 |
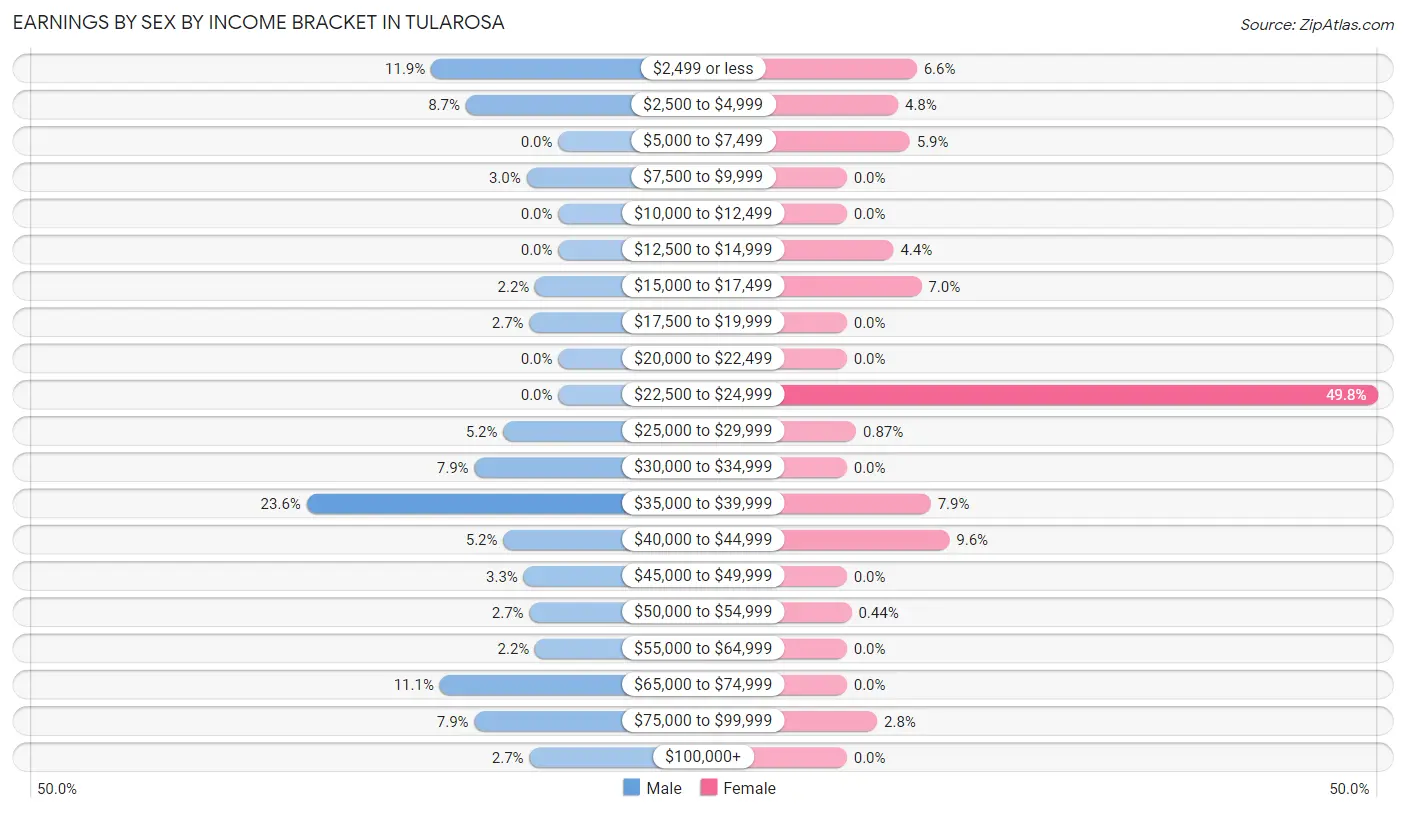
Earnings by Sex by Income Bracket in Tularosa
The most common earnings brackets in Tularosa are $35,000 to $39,999 for men (87 | 23.6%) and $22,500 to $24,999 for women (228 | 49.8%).
| Income | Male | Female |
| $2,499 or less | 44 (11.9%) | 30 (6.6%) |
| $2,500 to $4,999 | 32 (8.7%) | 22 (4.8%) |
| $5,000 to $7,499 | 0 (0.0%) | 27 (5.9%) |
| $7,500 to $9,999 | 11 (3.0%) | 0 (0.0%) |
| $10,000 to $12,499 | 0 (0.0%) | 0 (0.0%) |
| $12,500 to $14,999 | 0 (0.0%) | 20 (4.4%) |
| $15,000 to $17,499 | 8 (2.2%) | 32 (7.0%) |
| $17,500 to $19,999 | 10 (2.7%) | 0 (0.0%) |
| $20,000 to $22,499 | 0 (0.0%) | 0 (0.0%) |
| $22,500 to $24,999 | 0 (0.0%) | 228 (49.8%) |
| $25,000 to $29,999 | 19 (5.1%) | 4 (0.9%) |
| $30,000 to $34,999 | 29 (7.9%) | 0 (0.0%) |
| $35,000 to $39,999 | 87 (23.6%) | 36 (7.9%) |
| $40,000 to $44,999 | 19 (5.1%) | 44 (9.6%) |
| $45,000 to $49,999 | 12 (3.3%) | 0 (0.0%) |
| $50,000 to $54,999 | 10 (2.7%) | 2 (0.4%) |
| $55,000 to $64,999 | 8 (2.2%) | 0 (0.0%) |
| $65,000 to $74,999 | 41 (11.1%) | 0 (0.0%) |
| $75,000 to $99,999 | 29 (7.9%) | 13 (2.8%) |
| $100,000+ | 10 (2.7%) | 0 (0.0%) |
| Total | 369 (100.0%) | 458 (100.0%) |
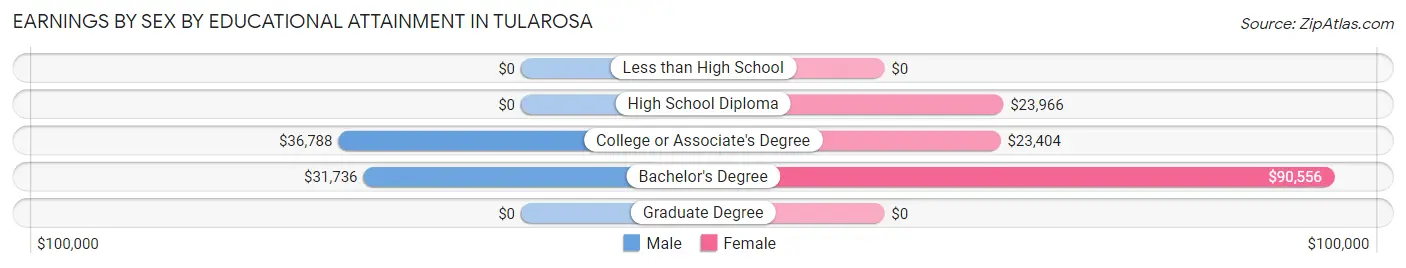
Earnings by Sex by Educational Attainment in Tularosa
Average earnings in Tularosa are $36,652 for men and $23,668 for women, a difference of 35.4%. Men with an educational attainment of college or associate's degree enjoy the highest average annual earnings of $36,788, while those with bachelor's degree education earn the least with $31,736. Women with an educational attainment of bachelor's degree earn the most with the average annual earnings of $90,556, while those with college or associate's degree education have the smallest earnings of $23,404.
| Educational Attainment | Male Income | Female Income |
| Less than High School | - | - |
| High School Diploma | - | - |
| College or Associate's Degree | $36,788 | $23,404 |
| Bachelor's Degree | $31,736 | $90,556 |
| Graduate Degree | - | - |
| Total | $36,652 | $23,668 |
Family Income in Tularosa
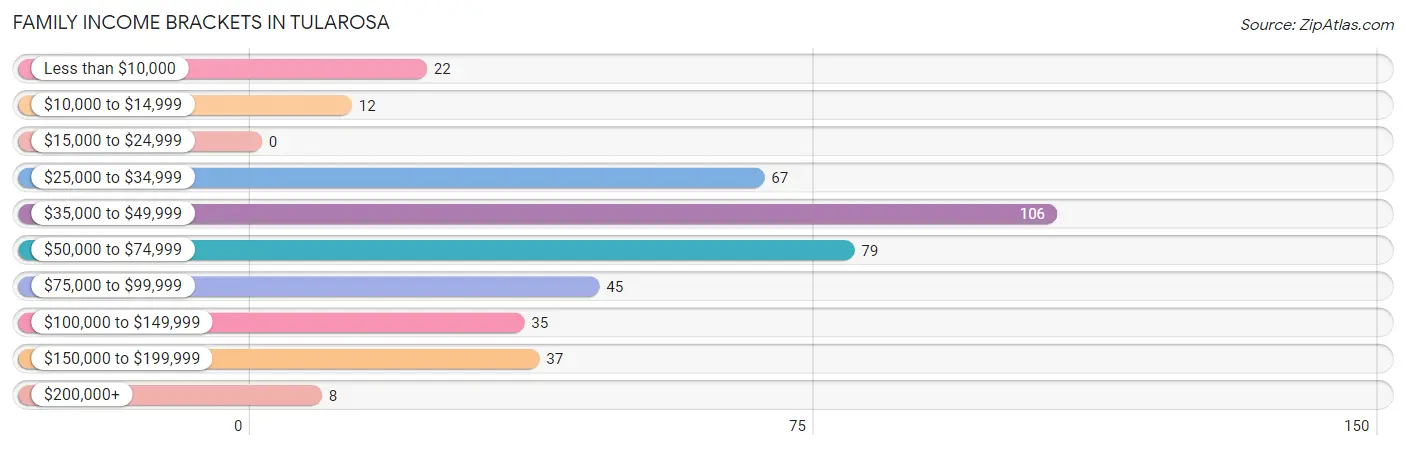
Family Income Brackets in Tularosa
According to the Tularosa family income data, there are 106 families falling into the $35,000 to $49,999 income range, which is the most common income bracket and makes up 25.8% of all families.
| Income Bracket | # Families | % Families |
| Less than $10,000 | 22 | 5.4% |
| $10,000 to $14,999 | 12 | 2.9% |
| $15,000 to $24,999 | 0 | 0.0% |
| $25,000 to $34,999 | 67 | 16.3% |
| $35,000 to $49,999 | 106 | 25.8% |
| $50,000 to $74,999 | 79 | 19.2% |
| $75,000 to $99,999 | 45 | 10.9% |
| $100,000 to $149,999 | 35 | 8.5% |
| $150,000 to $199,999 | 37 | 9.0% |
| $200,000+ | 8 | 1.9% |
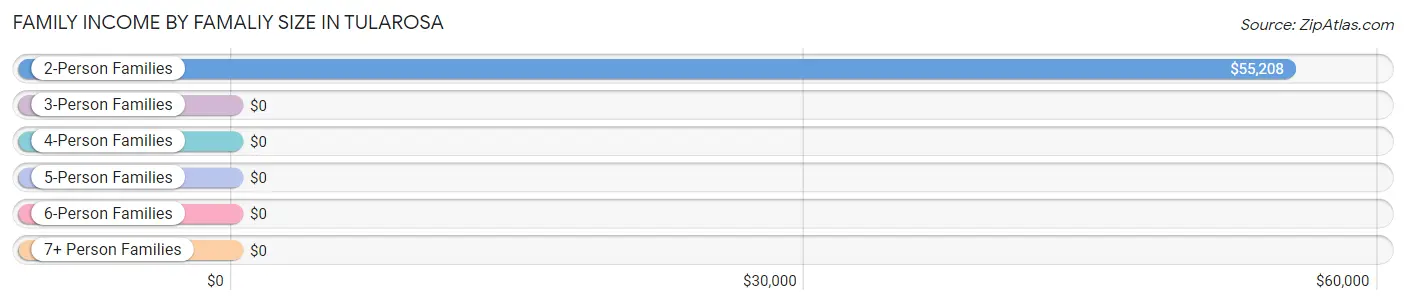
Family Income by Famaliy Size in Tularosa
2-person families (161 | 39.2%) account for the highest median family income in Tularosa with $55,208 per family, while 2-person families (161 | 39.2%) have the highest median income of $27,604 per family member.
| Income Bracket | # Families | Median Income |
| 2-Person Families | 161 (39.2%) | $55,208 |
| 3-Person Families | 65 (15.8%) | $0 |
| 4-Person Families | 73 (17.8%) | $0 |
| 5-Person Families | 12 (2.9%) | $0 |
| 6-Person Families | 54 (13.1%) | $0 |
| 7+ Person Families | 46 (11.2%) | $0 |
| Total | 411 (100.0%) | $49,688 |
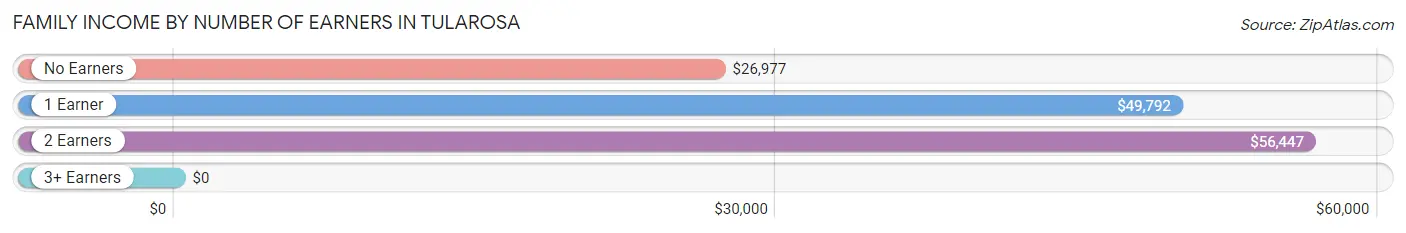
Family Income by Number of Earners in Tularosa
| Number of Earners | # Families | Median Income |
| No Earners | 95 (23.1%) | $26,977 |
| 1 Earner | 196 (47.7%) | $49,792 |
| 2 Earners | 74 (18.0%) | $56,447 |
| 3+ Earners | 46 (11.2%) | $0 |
| Total | 411 (100.0%) | $49,688 |
Household Income in Tularosa
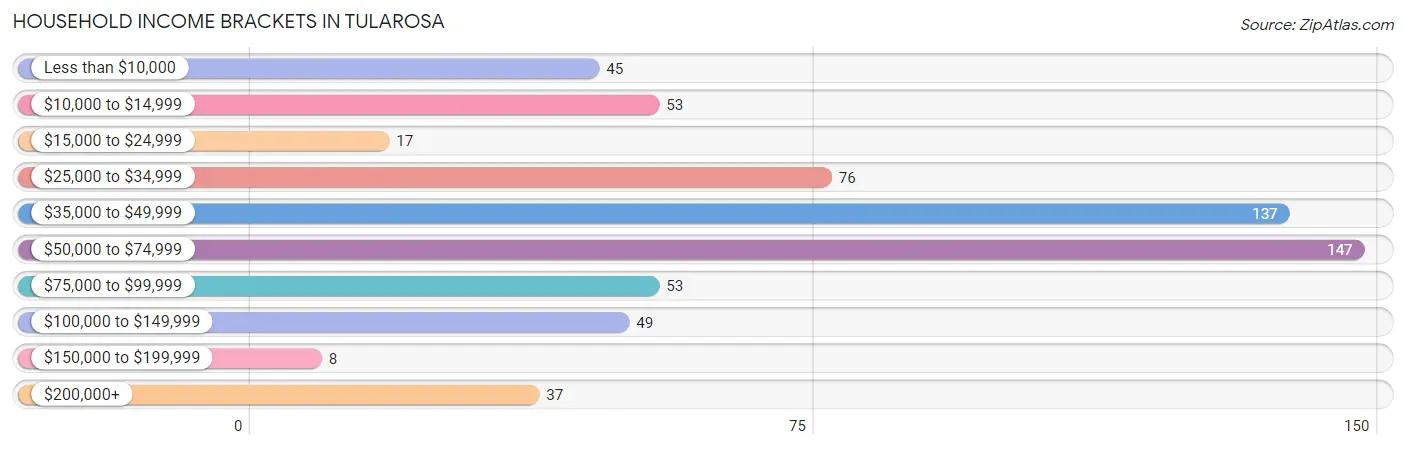
Household Income Brackets in Tularosa
With 147 households falling in the category, the $50,000 to $74,999 income range is the most frequent in Tularosa, accounting for 23.6% of all households. In contrast, only 8 households (1.3%) fall into the $150,000 to $199,999 income bracket, making it the least populous group.
| Income Bracket | # Households | % Households |
| Less than $10,000 | 45 | 7.2% |
| $10,000 to $14,999 | 53 | 8.5% |
| $15,000 to $24,999 | 17 | 2.7% |
| $25,000 to $34,999 | 76 | 12.2% |
| $35,000 to $49,999 | 137 | 22.0% |
| $50,000 to $74,999 | 147 | 23.6% |
| $75,000 to $99,999 | 53 | 8.5% |
| $100,000 to $149,999 | 49 | 7.9% |
| $150,000 to $199,999 | 8 | 1.3% |
| $200,000+ | 37 | 5.9% |
Household Income by Householder Age in Tularosa
The median household income in Tularosa is $47,234, with the highest median household income of $55,451 found in the 65+ years age bracket for the primary householder. A total of 288 households (46.3%) fall into this category.
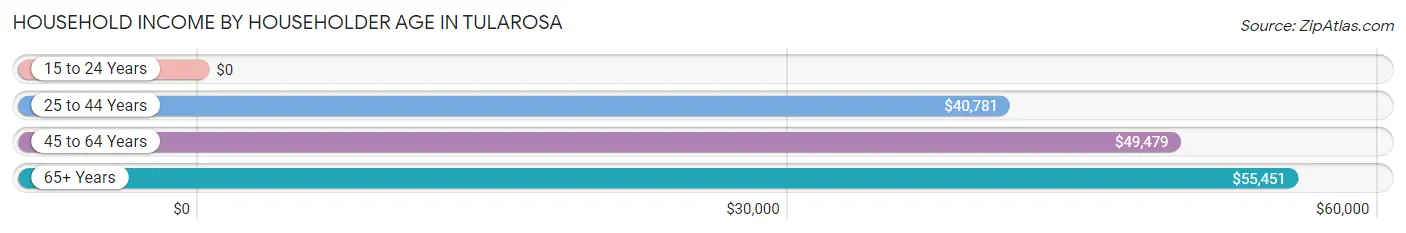
| Income Bracket | # Households | Median Income |
| 15 to 24 Years | 0 (0.0%) | $0 |
| 25 to 44 Years | 117 (18.8%) | $40,781 |
| 45 to 64 Years | 217 (34.9%) | $49,479 |
| 65+ Years | 288 (46.3%) | $55,451 |
| Total | 622 (100.0%) | $47,234 |
Poverty in Tularosa
Income Below Poverty by Sex and Age in Tularosa
With 18.1% poverty level for males and 30.8% for females among the residents of Tularosa, 18 to 24 year old males and under 5 year old females are the most vulnerable to poverty, with 52 males (100.0%) and 4 females (100.0%) in their respective age groups living below the poverty level.
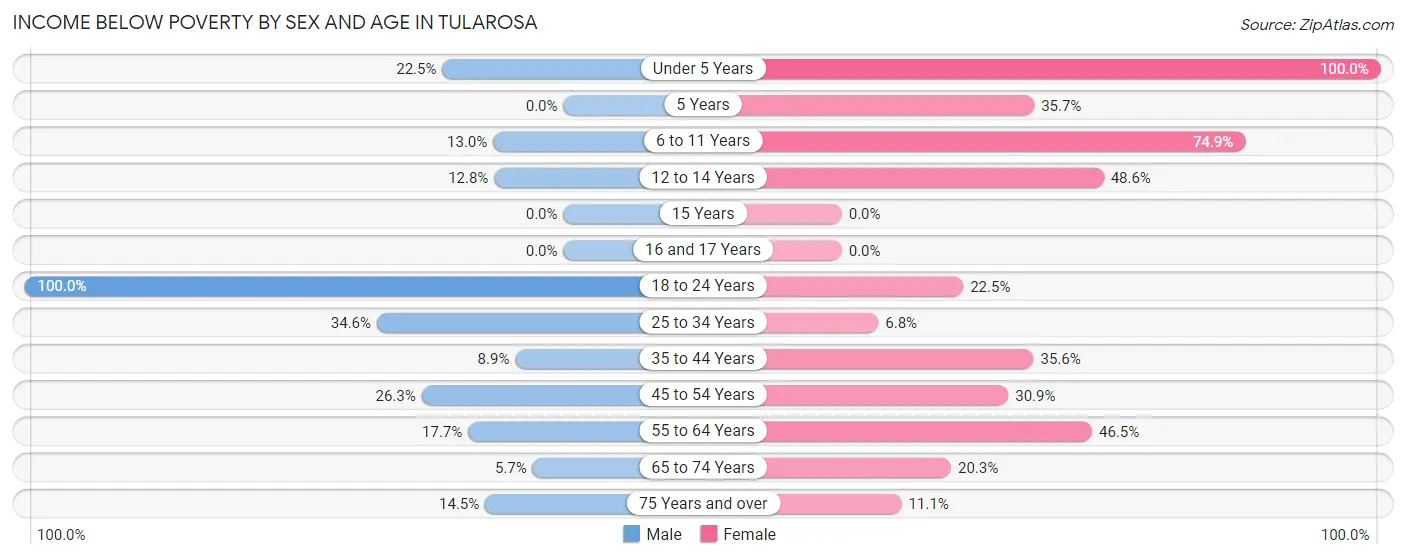
| Age Bracket | Male | Female |
| Under 5 Years | 20 (22.5%) | 4 (100.0%) |
| 5 Years | 0 (0.0%) | 35 (35.7%) |
| 6 to 11 Years | 18 (13.0%) | 143 (74.9%) |
| 12 to 14 Years | 19 (12.8%) | 35 (48.6%) |
| 15 Years | 0 (0.0%) | 0 (0.0%) |
| 16 and 17 Years | 0 (0.0%) | 0 (0.0%) |
| 18 to 24 Years | 52 (100.0%) | 16 (22.5%) |
| 25 to 34 Years | 18 (34.6%) | 24 (6.8%) |
| 35 to 44 Years | 5 (8.9%) | 79 (35.6%) |
| 45 to 54 Years | 20 (26.3%) | 34 (30.9%) |
| 55 to 64 Years | 32 (17.7%) | 46 (46.5%) |
| 65 to 74 Years | 8 (5.7%) | 14 (20.3%) |
| 75 Years and over | 17 (14.5%) | 11 (11.1%) |
| Total | 209 (18.1%) | 441 (30.8%) |
Income Above Poverty by Sex and Age in Tularosa
According to the poverty statistics in Tularosa, males aged 5 years and females aged 16 and 17 years are the age groups that are most secure financially, with 100.0% of males and 100.0% of females in these age groups living above the poverty line.
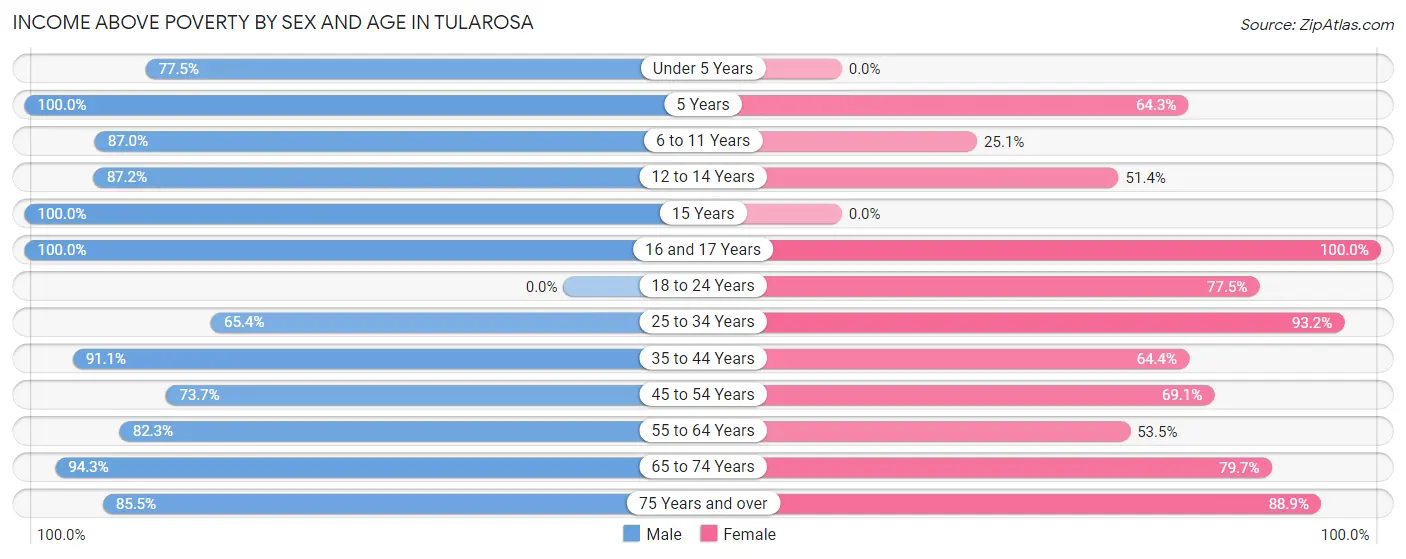
| Age Bracket | Male | Female |
| Under 5 Years | 69 (77.5%) | 0 (0.0%) |
| 5 Years | 31 (100.0%) | 63 (64.3%) |
| 6 to 11 Years | 120 (87.0%) | 48 (25.1%) |
| 12 to 14 Years | 129 (87.2%) | 37 (51.4%) |
| 15 Years | 18 (100.0%) | 0 (0.0%) |
| 16 and 17 Years | 59 (100.0%) | 44 (100.0%) |
| 18 to 24 Years | 0 (0.0%) | 55 (77.5%) |
| 25 to 34 Years | 34 (65.4%) | 330 (93.2%) |
| 35 to 44 Years | 51 (91.1%) | 143 (64.4%) |
| 45 to 54 Years | 56 (73.7%) | 76 (69.1%) |
| 55 to 64 Years | 149 (82.3%) | 53 (53.5%) |
| 65 to 74 Years | 132 (94.3%) | 55 (79.7%) |
| 75 Years and over | 100 (85.5%) | 88 (88.9%) |
| Total | 948 (81.9%) | 992 (69.2%) |
Income Below Poverty Among Married-Couple Families in Tularosa
The poverty statistics for married-couple families in Tularosa show that 5.4% or 14 of the total 258 families live below the poverty line. Families with no children have the highest poverty rate of 8.2%, comprising of 14 families. On the other hand, families with 1 or 2 children have the lowest poverty rate of 0.0%, which includes 0 families.
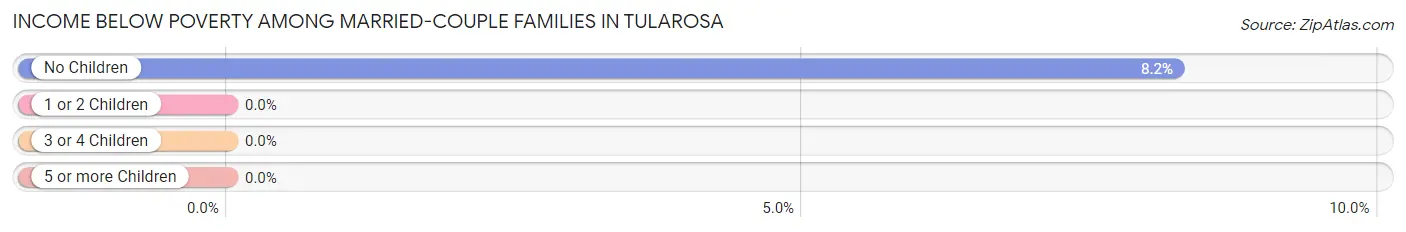
| Children | Above Poverty | Below Poverty |
| No Children | 156 (91.8%) | 14 (8.2%) |
| 1 or 2 Children | 54 (100.0%) | 0 (0.0%) |
| 3 or 4 Children | 34 (100.0%) | 0 (0.0%) |
| 5 or more Children | 0 (0.0%) | 0 (0.0%) |
| Total | 244 (94.6%) | 14 (5.4%) |
Income Below Poverty Among Single-Parent Households in Tularosa
According to the poverty data in Tularosa, 41.0% or 16 single-father households and 36.8% or 42 single-mother households are living below the poverty line. Among single-father households, those with 5 or more children have the highest poverty rate, with 8 households (100.0%) experiencing poverty. Likewise, among single-mother households, those with 5 or more children have the highest poverty rate, with 38 households (65.5%) falling below the poverty line.
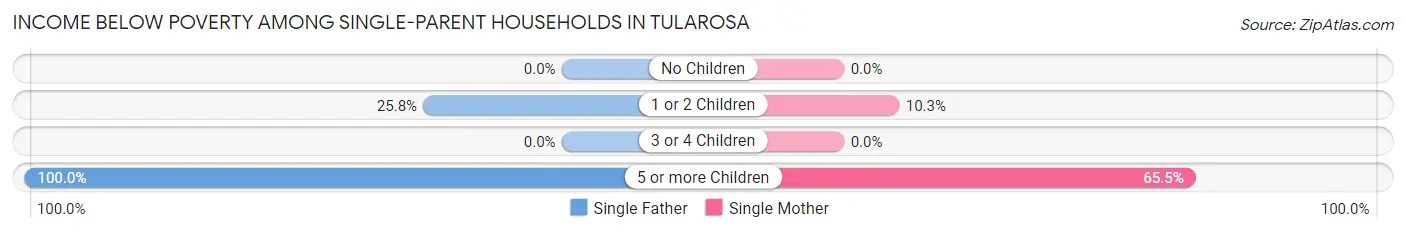
| Children | Single Father | Single Mother |
| No Children | 0 (0.0%) | 0 (0.0%) |
| 1 or 2 Children | 8 (25.8%) | 4 (10.3%) |
| 3 or 4 Children | 0 (0.0%) | 0 (0.0%) |
| 5 or more Children | 8 (100.0%) | 38 (65.5%) |
| Total | 16 (41.0%) | 42 (36.8%) |
Income Below Poverty Among Married-Couple vs Single-Parent Households in Tularosa
The poverty data for Tularosa shows that 14 of the married-couple family households (5.4%) and 58 of the single-parent households (37.9%) are living below the poverty level. Within the married-couple family households, those with no children have the highest poverty rate, with 14 households (8.2%) falling below the poverty line. Among the single-parent households, those with 5 or more children have the highest poverty rate, with 46 household (69.7%) living below poverty.
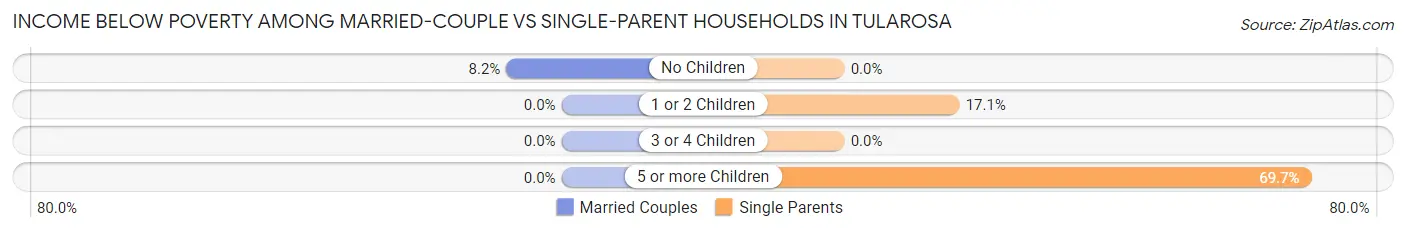
| Children | Married-Couple Families | Single-Parent Households |
| No Children | 14 (8.2%) | 0 (0.0%) |
| 1 or 2 Children | 0 (0.0%) | 12 (17.1%) |
| 3 or 4 Children | 0 (0.0%) | 0 (0.0%) |
| 5 or more Children | 0 (0.0%) | 46 (69.7%) |
| Total | 14 (5.4%) | 58 (37.9%) |
Race in Tularosa
The most populous races in Tularosa are Hispanic or Latino (1,661 | 64.1%), White / Caucasian (1,584 | 61.2%), and Two or more Races (809 | 31.2%).
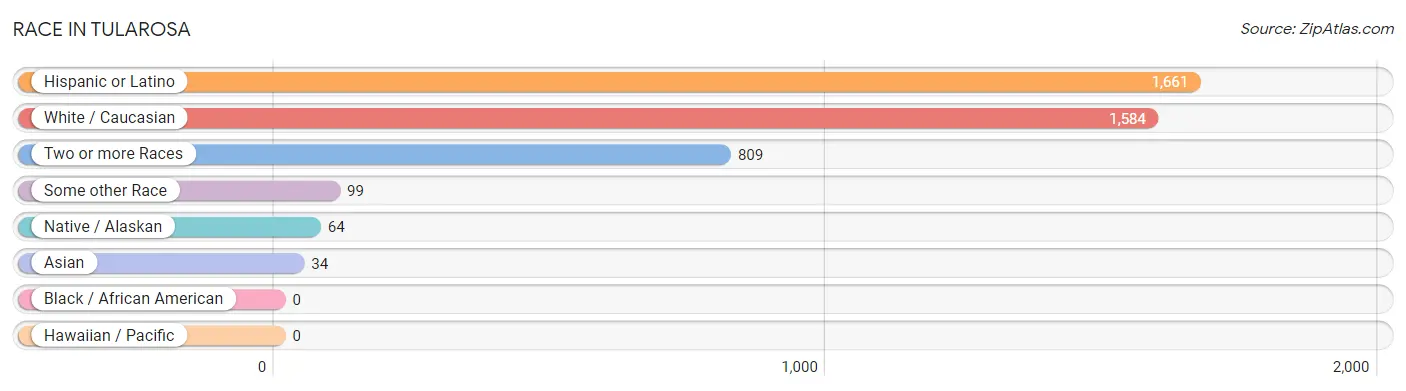
| Race | # Population | % Population |
| Asian | 34 | 1.3% |
| Black / African American | 0 | 0.0% |
| Hawaiian / Pacific | 0 | 0.0% |
| Hispanic or Latino | 1,661 | 64.1% |
| Native / Alaskan | 64 | 2.5% |
| White / Caucasian | 1,584 | 61.2% |
| Two or more Races | 809 | 31.2% |
| Some other Race | 99 | 3.8% |
| Total | 2,590 | 100.0% |
Ancestry in Tularosa
The most populous ancestries reported in Tularosa are Mexican (977 | 37.7%), Spaniard (603 | 23.3%), English (259 | 10.0%), American (208 | 8.0%), and Irish (193 | 7.4%), together accounting for 86.5% of all Tularosa residents.
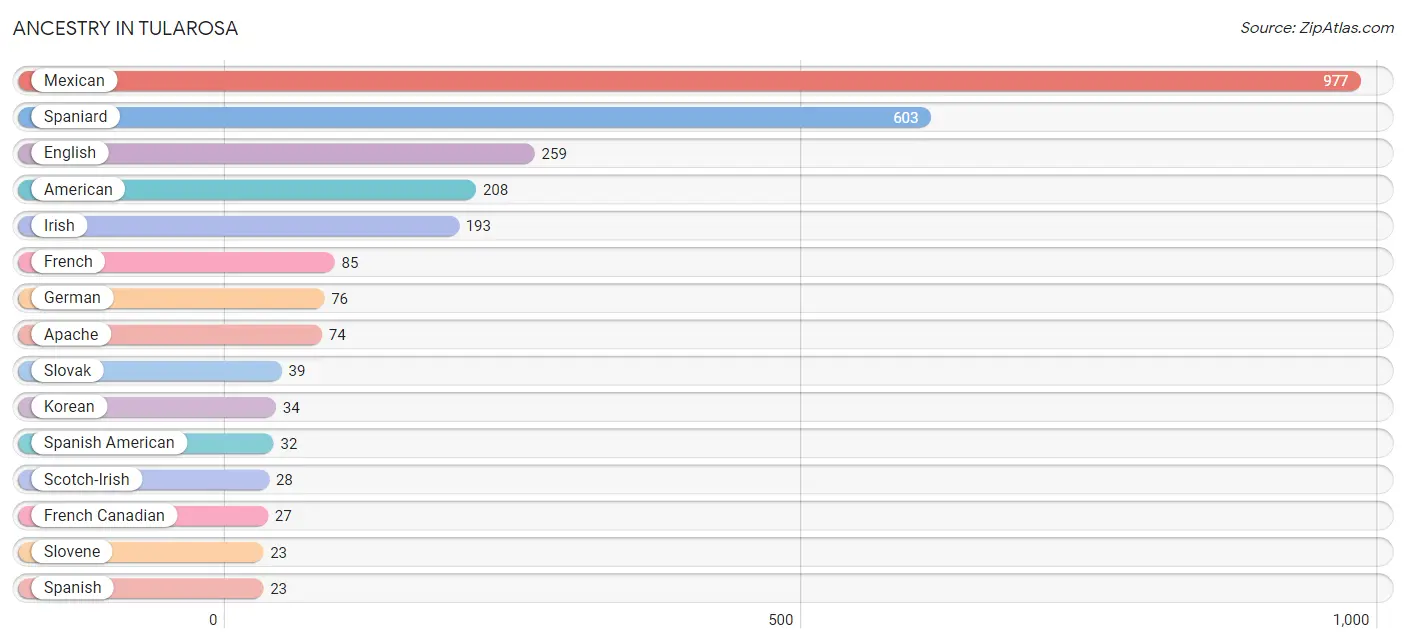
| Ancestry | # Population | % Population |
| African | 15 | 0.6% |
| American | 208 | 8.0% |
| Apache | 74 | 2.9% |
| Arab | 8 | 0.3% |
| Austrian | 2 | 0.1% |
| Blackfeet | 8 | 0.3% |
| Celtic | 20 | 0.8% |
| Cherokee | 8 | 0.3% |
| Czechoslovakian | 9 | 0.4% |
| Dutch | 4 | 0.2% |
| English | 259 | 10.0% |
| European | 12 | 0.5% |
| French | 85 | 3.3% |
| French Canadian | 27 | 1.0% |
| German | 76 | 2.9% |
| Irish | 193 | 7.4% |
| Italian | 15 | 0.6% |
| Korean | 34 | 1.3% |
| Latvian | 4 | 0.2% |
| Lebanese | 8 | 0.3% |
| Mexican | 977 | 37.7% |
| Norwegian | 14 | 0.5% |
| Scotch-Irish | 28 | 1.1% |
| Scottish | 20 | 0.8% |
| Slovak | 39 | 1.5% |
| Slovene | 23 | 0.9% |
| South American | 2 | 0.1% |
| Spaniard | 603 | 23.3% |
| Spanish | 23 | 0.9% |
| Spanish American | 32 | 1.2% |
| Subsaharan African | 15 | 0.6% |
| Swedish | 11 | 0.4% |
| Ukrainian | 5 | 0.2% |
| Venezuelan | 2 | 0.1% | View All 34 Rows |
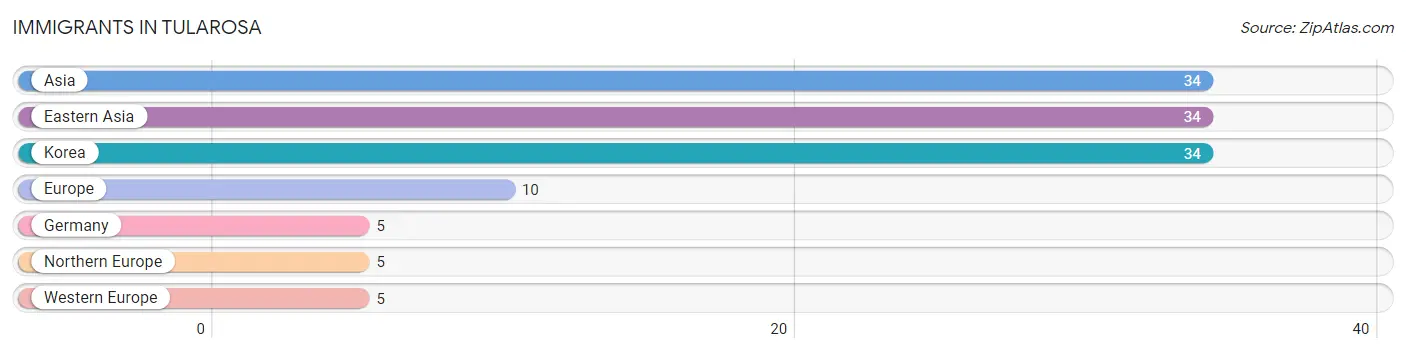
Immigrants in Tularosa
The most numerous immigrant groups reported in Tularosa came from Asia (34 | 1.3%), Eastern Asia (34 | 1.3%), Korea (34 | 1.3%), Europe (10 | 0.4%), and Germany (5 | 0.2%), together accounting for 4.5% of all Tularosa residents.
| Immigration Origin | # Population | % Population |
| Asia | 34 | 1.3% |
| Eastern Asia | 34 | 1.3% |
| Europe | 10 | 0.4% |
| Germany | 5 | 0.2% |
| Korea | 34 | 1.3% |
| Northern Europe | 5 | 0.2% |
| Western Europe | 5 | 0.2% | View All 7 Rows |
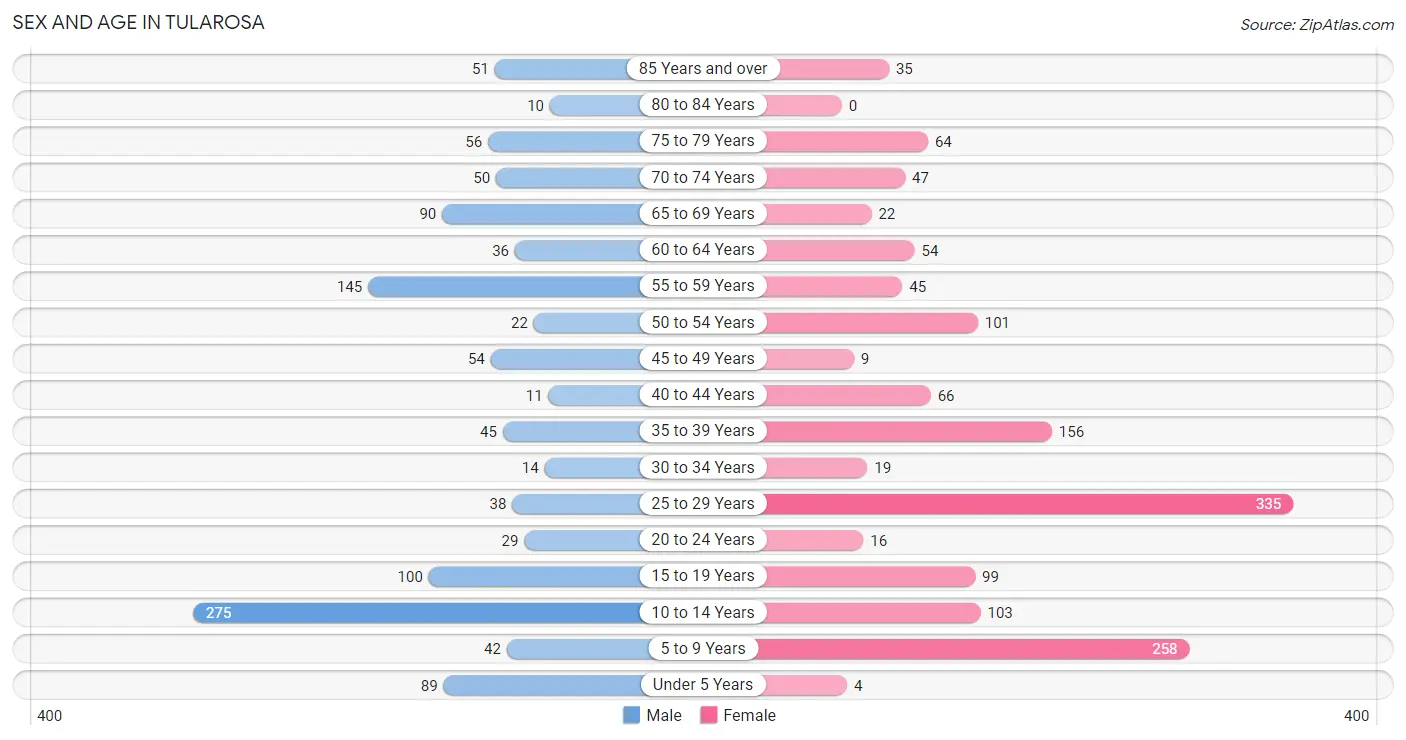
Sex and Age in Tularosa
Sex and Age in Tularosa
The most populous age groups in Tularosa are 10 to 14 Years (275 | 23.8%) for men and 25 to 29 Years (335 | 23.4%) for women.
| Age Bracket | Male | Female |
| Under 5 Years | 89 (7.7%) | 4 (0.3%) |
| 5 to 9 Years | 42 (3.6%) | 258 (18.0%) |
| 10 to 14 Years | 275 (23.8%) | 103 (7.2%) |
| 15 to 19 Years | 100 (8.6%) | 99 (6.9%) |
| 20 to 24 Years | 29 (2.5%) | 16 (1.1%) |
| 25 to 29 Years | 38 (3.3%) | 335 (23.4%) |
| 30 to 34 Years | 14 (1.2%) | 19 (1.3%) |
| 35 to 39 Years | 45 (3.9%) | 156 (10.9%) |
| 40 to 44 Years | 11 (0.9%) | 66 (4.6%) |
| 45 to 49 Years | 54 (4.7%) | 9 (0.6%) |
| 50 to 54 Years | 22 (1.9%) | 101 (7.0%) |
| 55 to 59 Years | 145 (12.5%) | 45 (3.1%) |
| 60 to 64 Years | 36 (3.1%) | 54 (3.8%) |
| 65 to 69 Years | 90 (7.8%) | 22 (1.5%) |
| 70 to 74 Years | 50 (4.3%) | 47 (3.3%) |
| 75 to 79 Years | 56 (4.8%) | 64 (4.5%) |
| 80 to 84 Years | 10 (0.9%) | 0 (0.0%) |
| 85 Years and over | 51 (4.4%) | 35 (2.4%) |
| Total | 1,157 (100.0%) | 1,433 (100.0%) |
Families and Households in Tularosa
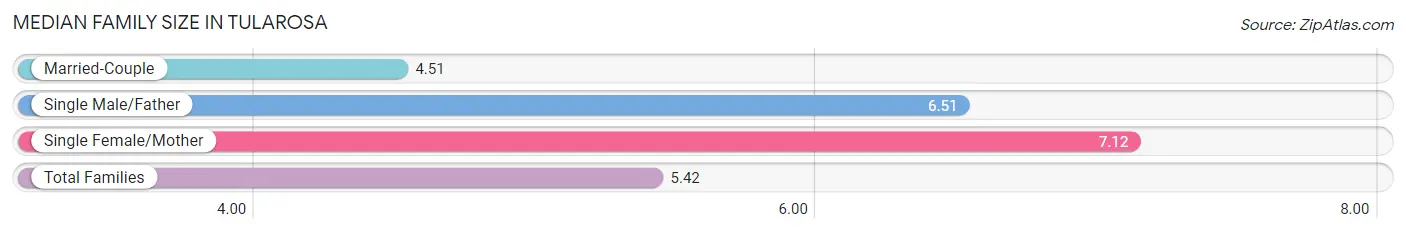
Median Family Size in Tularosa
The median family size in Tularosa is 5.42 persons per family, with single female/mother families (114 | 27.7%) accounting for the largest median family size of 7.12 persons per family. On the other hand, married-couple families (258 | 62.8%) represent the smallest median family size with 4.51 persons per family.
| Family Type | # Families | Family Size |
| Married-Couple | 258 (62.8%) | 4.51 |
| Single Male/Father | 39 (9.5%) | 6.51 |
| Single Female/Mother | 114 (27.7%) | 7.12 |
| Total Families | 411 (100.0%) | 5.42 |
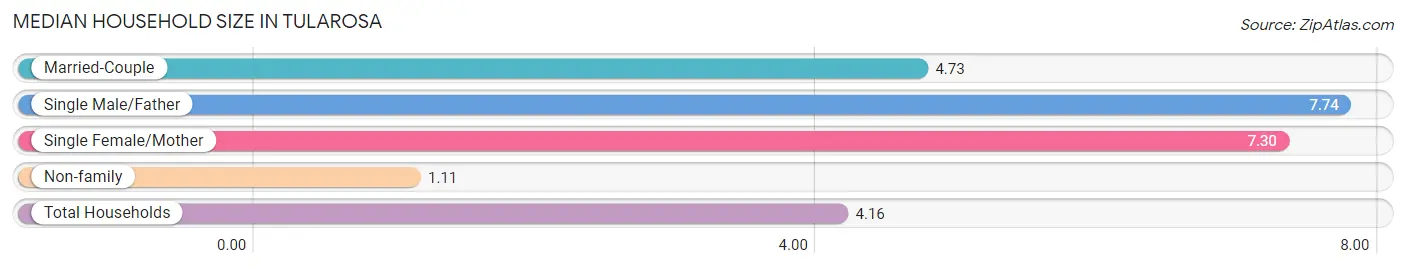
Median Household Size in Tularosa
The median household size in Tularosa is 4.16 persons per household, with single male/father households (39 | 6.3%) accounting for the largest median household size of 7.74 persons per household. non-family households (211 | 33.9%) represent the smallest median household size with 1.11 persons per household.
| Household Type | # Households | Household Size |
| Married-Couple | 258 (41.5%) | 4.73 |
| Single Male/Father | 39 (6.3%) | 7.74 |
| Single Female/Mother | 114 (18.3%) | 7.30 |
| Non-family | 211 (33.9%) | 1.11 |
| Total Households | 622 (100.0%) | 4.16 |
Household Size by Marriage Status in Tularosa
Out of a total of 622 households in Tularosa, 411 (66.1%) are family households, while 211 (33.9%) are nonfamily households. The most numerous type of family households are 2-person households, comprising 161, and the most common type of nonfamily households are 1-person households, comprising 199.
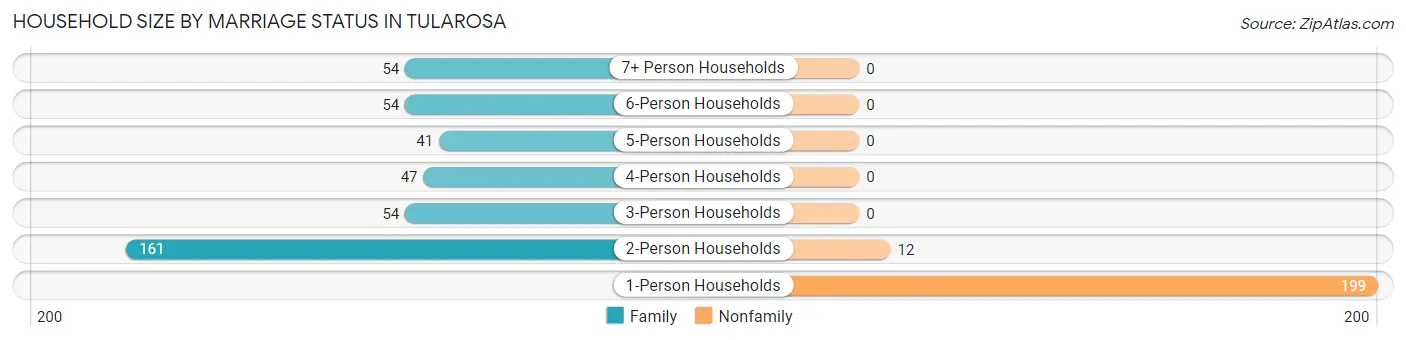
| Household Size | Family Households | Nonfamily Households |
| 1-Person Households | - | 199 (32.0%) |
| 2-Person Households | 161 (25.9%) | 12 (1.9%) |
| 3-Person Households | 54 (8.7%) | 0 (0.0%) |
| 4-Person Households | 47 (7.6%) | 0 (0.0%) |
| 5-Person Households | 41 (6.6%) | 0 (0.0%) |
| 6-Person Households | 54 (8.7%) | 0 (0.0%) |
| 7+ Person Households | 54 (8.7%) | 0 (0.0%) |
| Total | 411 (66.1%) | 211 (33.9%) |
Female Fertility in Tularosa
Fertility by Age in Tularosa
Average fertility rate in Tularosa is 21.0 births per 1,000 women. Women in the age bracket of 20 to 34 years have the highest fertility rate with 43.0 births per 1,000 women. Women in the age bracket of 20 to 34 years acount for 100.0% of all women with births.
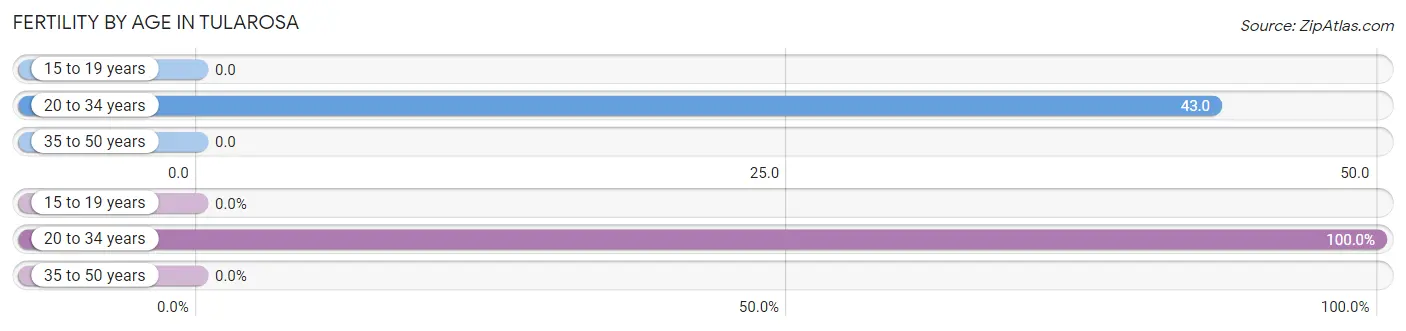
| Age Bracket | Women with Births | Births / 1,000 Women |
| 15 to 19 years | 0 (0.0%) | 0.0 |
| 20 to 34 years | 16 (100.0%) | 43.0 |
| 35 to 50 years | 0 (0.0%) | 0.0 |
| Total | 16 (100.0%) | 21.0 |
Fertility by Age by Marriage Status in Tularosa
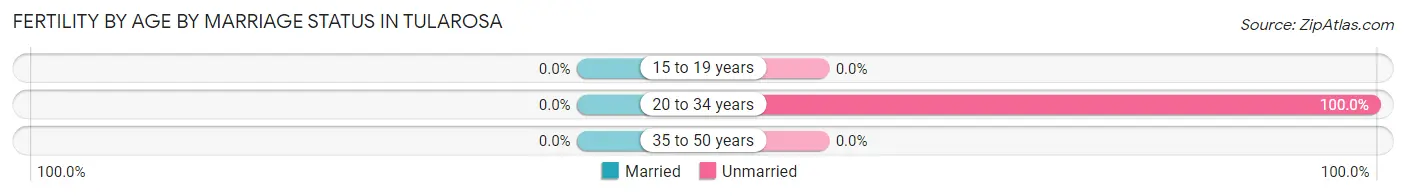
| Age Bracket | Married | Unmarried |
| 15 to 19 years | 0 (0.0%) | 0 (0.0%) |
| 20 to 34 years | 0 (0.0%) | 16 (100.0%) |
| 35 to 50 years | 0 (0.0%) | 0 (0.0%) |
| Total | 0 (0.0%) | 16 (100.0%) |
Fertility by Education in Tularosa
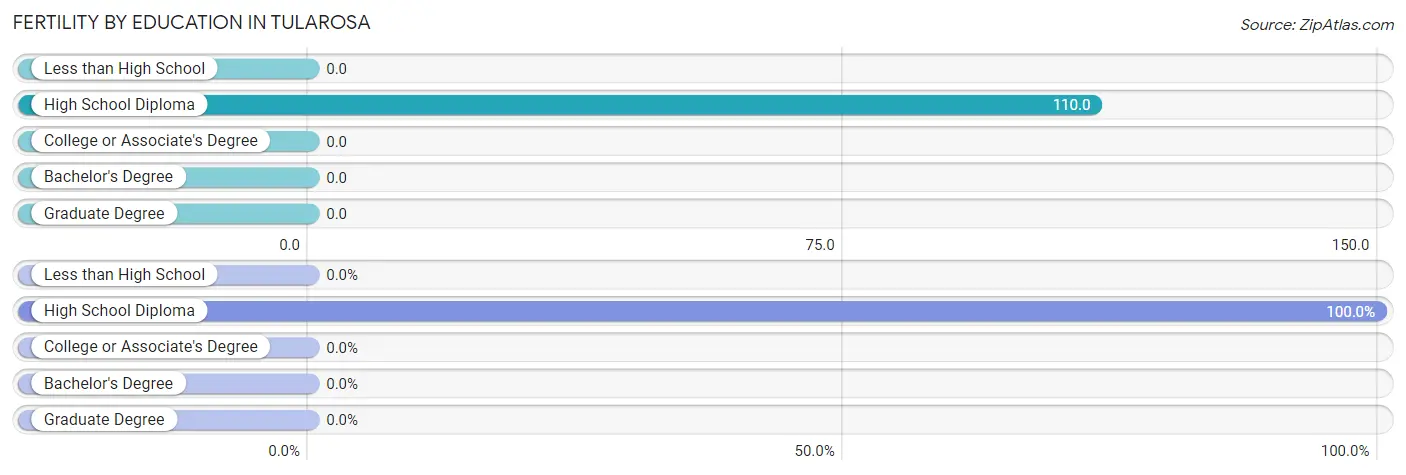
| Educational Attainment | Women with Births | Births / 1,000 Women |
| Less than High School | 0 (0.0%) | 0.0 |
| High School Diploma | 16 (100.0%) | 110.0 |
| College or Associate's Degree | 0 (0.0%) | 0.0 |
| Bachelor's Degree | 0 (0.0%) | 0.0 |
| Graduate Degree | 0 (0.0%) | 0.0 |
| Total | 16 (100.0%) | 21.0 |
Fertility by Education by Marriage Status in Tularosa
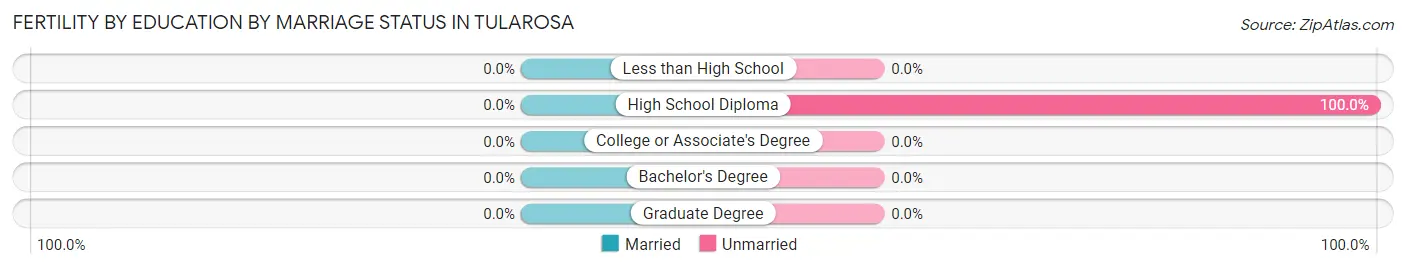
| Educational Attainment | Married | Unmarried |
| Less than High School | 0 (0.0%) | 0 (0.0%) |
| High School Diploma | 0 (0.0%) | 16 (100.0%) |
| College or Associate's Degree | 0 (0.0%) | 0 (0.0%) |
| Bachelor's Degree | 0 (0.0%) | 0 (0.0%) |
| Graduate Degree | 0 (0.0%) | 0 (0.0%) |
| Total | 0 (0.0%) | 16 (100.0%) |
Employment Characteristics in Tularosa
Employment by Class of Employer in Tularosa
Among the 664 employed individuals in Tularosa, private company employees (462 | 69.6%), federal government employees (79 | 11.9%), and state government employees (36 | 5.4%) make up the most common classes of employment.
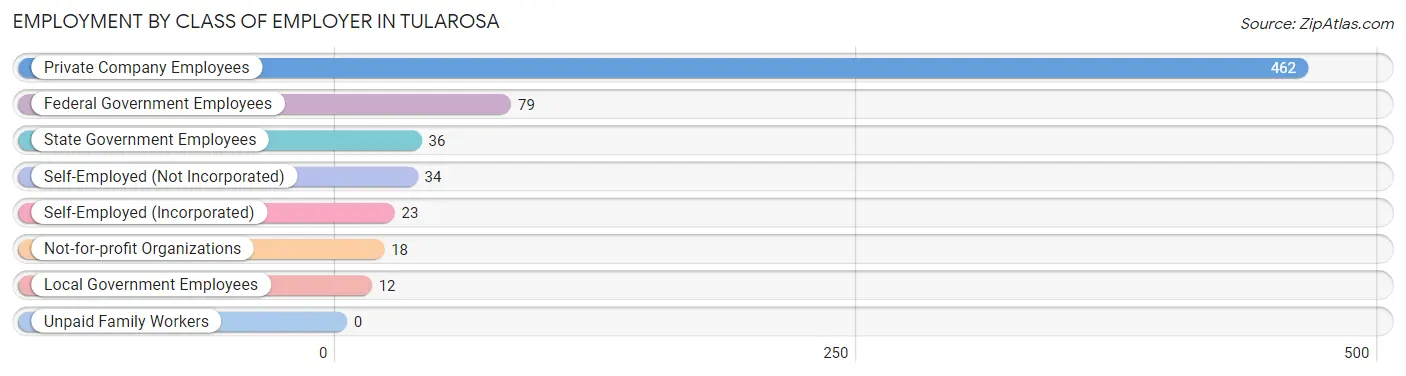
| Employer Class | # Employees | % Employees |
| Private Company Employees | 462 | 69.6% |
| Self-Employed (Incorporated) | 23 | 3.5% |
| Self-Employed (Not Incorporated) | 34 | 5.1% |
| Not-for-profit Organizations | 18 | 2.7% |
| Local Government Employees | 12 | 1.8% |
| State Government Employees | 36 | 5.4% |
| Federal Government Employees | 79 | 11.9% |
| Unpaid Family Workers | 0 | 0.0% |
| Total | 664 | 100.0% |
Employment Status by Age in Tularosa
According to the labor force statistics for Tularosa, out of the total population over 16 years of age (1,801), 47.9% or 863 individuals are in the labor force, with 21.3% or 184 of them unemployed. The age group with the highest labor force participation rate is 20 to 24 years, with 100.0% or 45 individuals in the labor force. Within the labor force, the 25 to 29 years age range has the highest percentage of unemployed individuals, with 38.3% or 126 of them being unemployed.
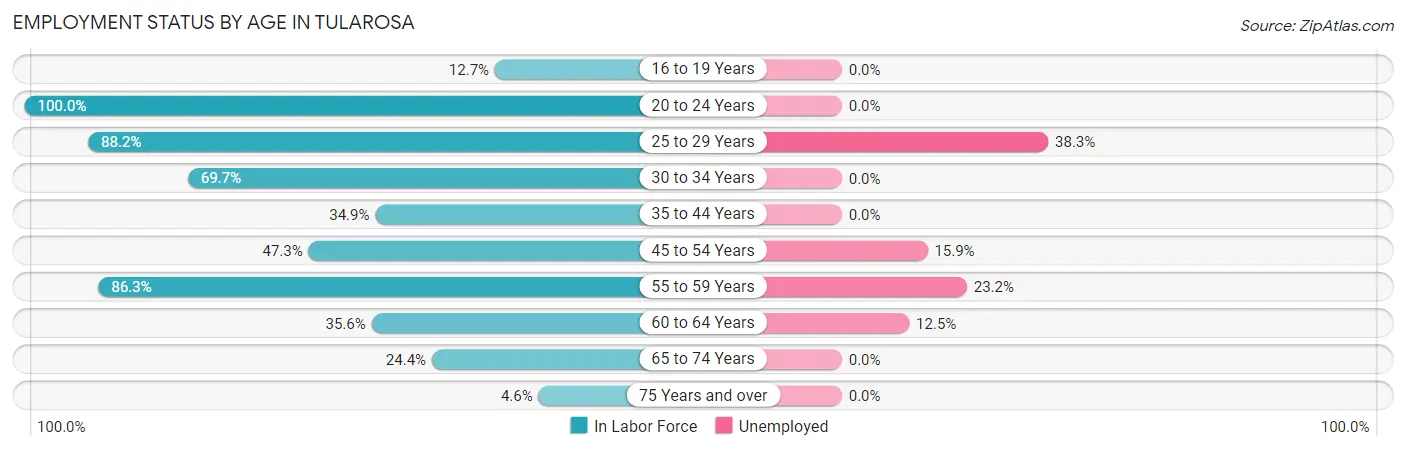
| Age Bracket | In Labor Force | Unemployed |
| 16 to 19 Years | 23 (12.7%) | 0 (0.0%) |
| 20 to 24 Years | 45 (100.0%) | 0 (0.0%) |
| 25 to 29 Years | 329 (88.2%) | 126 (38.3%) |
| 30 to 34 Years | 23 (69.7%) | 0 (0.0%) |
| 35 to 44 Years | 97 (34.9%) | 0 (0.0%) |
| 45 to 54 Years | 88 (47.3%) | 14 (15.9%) |
| 55 to 59 Years | 164 (86.3%) | 38 (23.2%) |
| 60 to 64 Years | 32 (35.6%) | 4 (12.5%) |
| 65 to 74 Years | 51 (24.4%) | 0 (0.0%) |
| 75 Years and over | 10 (4.6%) | 0 (0.0%) |
| Total | 863 (47.9%) | 184 (21.3%) |
Employment Status by Educational Attainment in Tularosa
According to labor force statistics for Tularosa, 63.7% of individuals (733) out of the total population between 25 and 64 years of age (1,150) are in the labor force, with 25.1% or 184 of them being unemployed. The group with the highest labor force participation rate are those with the educational attainment of bachelor's degree or higher, with 87.7% or 178 individuals in the labor force. Within the labor force, individuals with bachelor's degree or higher education have the highest percentage of unemployment, with 73.0% or 130 of them being unemployed.
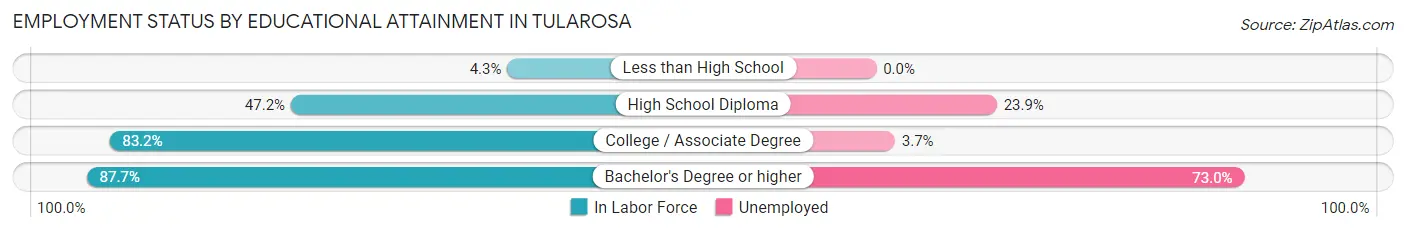
| Educational Attainment | In Labor Force | Unemployed |
| Less than High School | 6 (4.3%) | 0 (0.0%) |
| High School Diploma | 159 (47.2%) | 81 (23.9%) |
| College / Associate Degree | 390 (83.2%) | 17 (3.7%) |
| Bachelor's Degree or higher | 178 (87.7%) | 148 (73.0%) |
| Total | 733 (63.7%) | 289 (25.1%) |
Employment Occupations by Sex in Tularosa
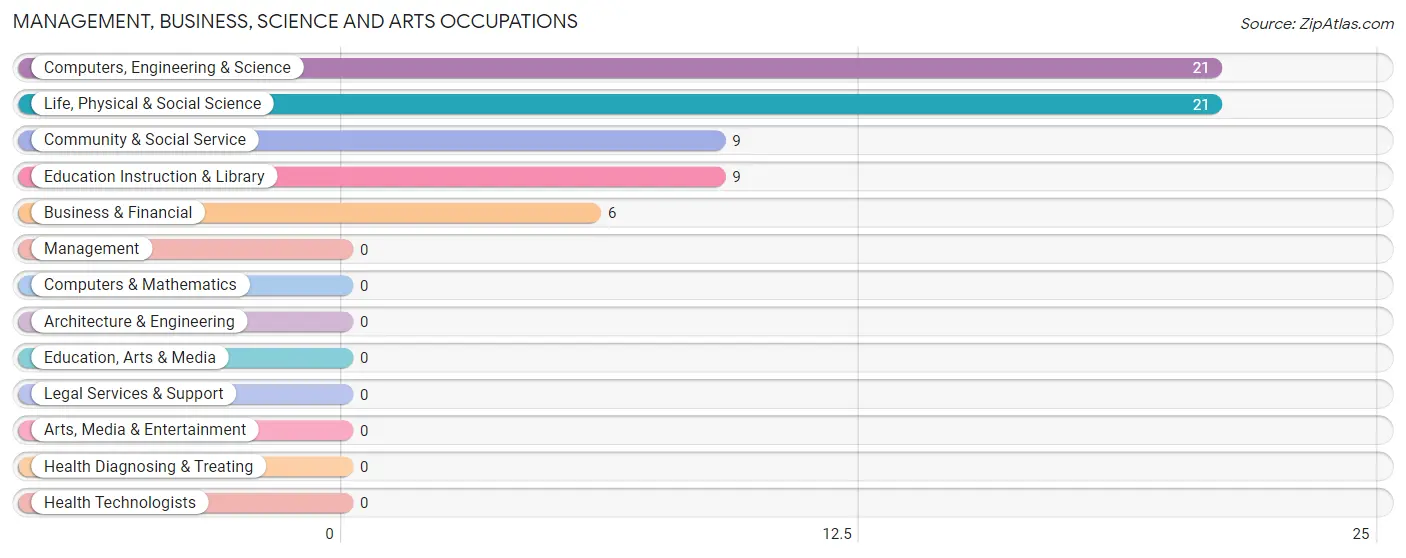
Management, Business, Science and Arts Occupations
The most common Management, Business, Science and Arts occupations in Tularosa are Computers, Engineering & Science (21 | 3.1%), Life, Physical & Social Science (21 | 3.1%), Community & Social Service (9 | 1.3%), Education Instruction & Library (9 | 1.3%), and Business & Financial (6 | 0.9%).
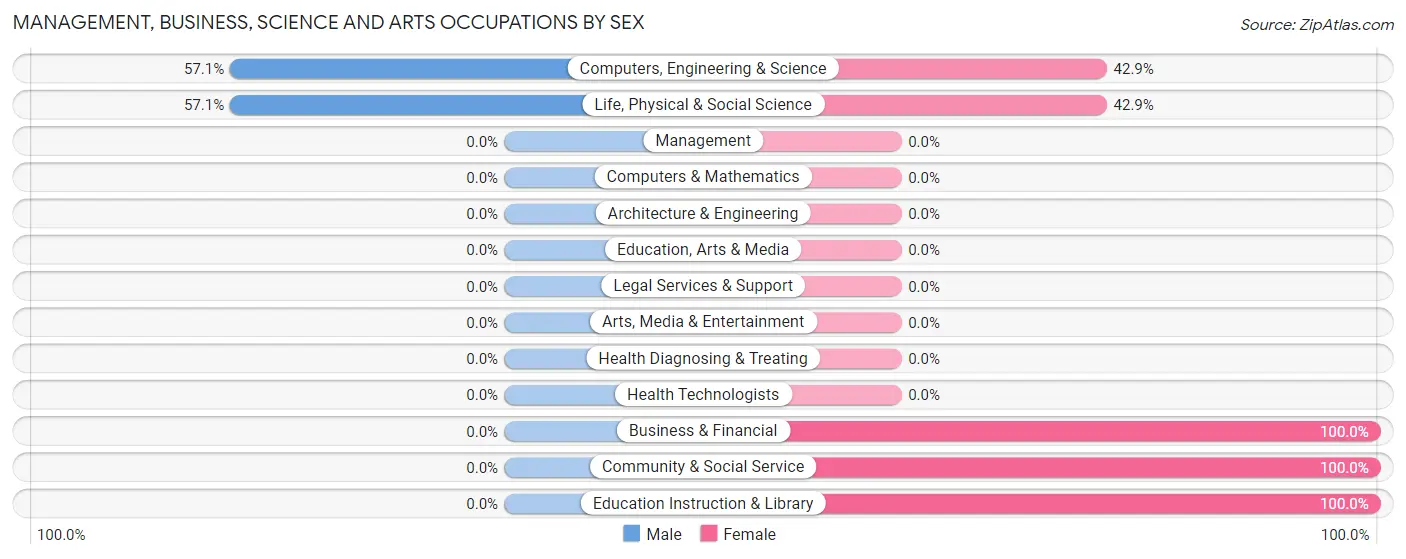
Management, Business, Science and Arts Occupations by Sex
Within the Management, Business, Science and Arts occupations in Tularosa, the most male-oriented occupations are Computers, Engineering & Science (57.1%), and Life, Physical & Social Science (57.1%), while the most female-oriented occupations are Business & Financial (100.0%), Community & Social Service (100.0%), and Education Instruction & Library (100.0%).
| Occupation | Male | Female |
| Management | 0 (0.0%) | 0 (0.0%) |
| Business & Financial | 0 (0.0%) | 6 (100.0%) |
| Computers, Engineering & Science | 12 (57.1%) | 9 (42.9%) |
| Computers & Mathematics | 0 (0.0%) | 0 (0.0%) |
| Architecture & Engineering | 0 (0.0%) | 0 (0.0%) |
| Life, Physical & Social Science | 12 (57.1%) | 9 (42.9%) |
| Community & Social Service | 0 (0.0%) | 9 (100.0%) |
| Education, Arts & Media | 0 (0.0%) | 0 (0.0%) |
| Legal Services & Support | 0 (0.0%) | 0 (0.0%) |
| Education Instruction & Library | 0 (0.0%) | 9 (100.0%) |
| Arts, Media & Entertainment | 0 (0.0%) | 0 (0.0%) |
| Health Diagnosing & Treating | 0 (0.0%) | 0 (0.0%) |
| Health Technologists | 0 (0.0%) | 0 (0.0%) |
| Total (Category) | 12 (33.3%) | 24 (66.7%) |
| Total (Overall) | 338 (50.2%) | 335 (49.8%) |
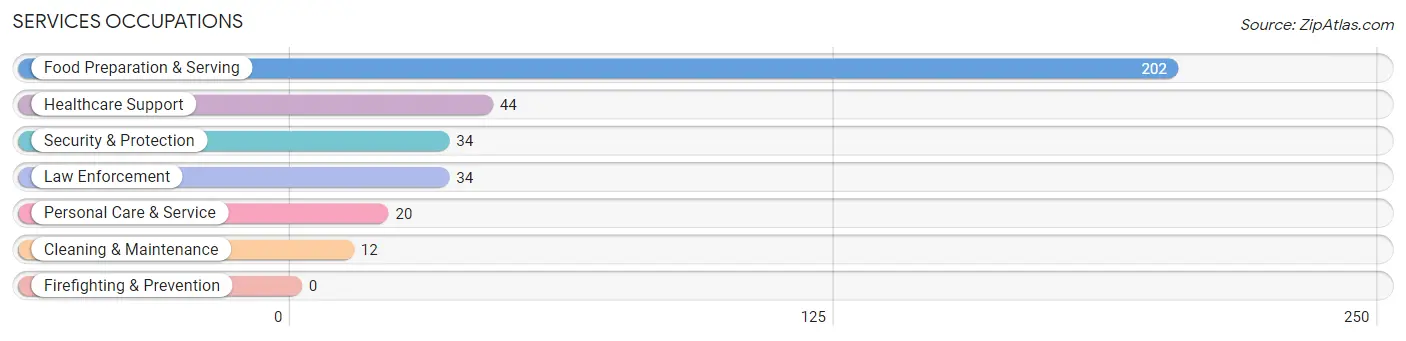
Services Occupations
The most common Services occupations in Tularosa are Food Preparation & Serving (202 | 30.0%), Healthcare Support (44 | 6.5%), Security & Protection (34 | 5.1%), Law Enforcement (34 | 5.1%), and Personal Care & Service (20 | 3.0%).
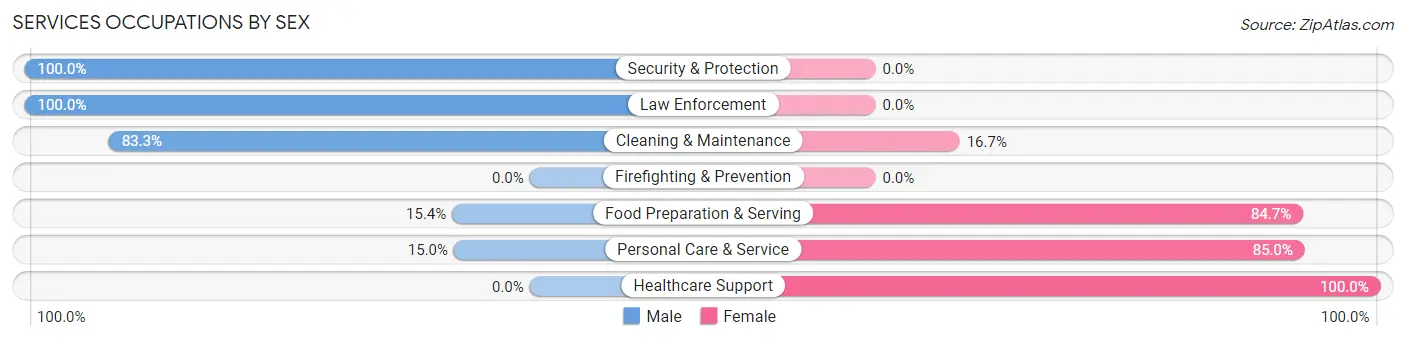
Services Occupations by Sex
Within the Services occupations in Tularosa, the most male-oriented occupations are Security & Protection (100.0%), Law Enforcement (100.0%), and Cleaning & Maintenance (83.3%), while the most female-oriented occupations are Healthcare Support (100.0%), Personal Care & Service (85.0%), and Food Preparation & Serving (84.7%).
| Occupation | Male | Female |
| Healthcare Support | 0 (0.0%) | 44 (100.0%) |
| Security & Protection | 34 (100.0%) | 0 (0.0%) |
| Firefighting & Prevention | 0 (0.0%) | 0 (0.0%) |
| Law Enforcement | 34 (100.0%) | 0 (0.0%) |
| Food Preparation & Serving | 31 (15.3%) | 171 (84.7%) |
| Cleaning & Maintenance | 10 (83.3%) | 2 (16.7%) |
| Personal Care & Service | 3 (15.0%) | 17 (85.0%) |
| Total (Category) | 78 (25.0%) | 234 (75.0%) |
| Total (Overall) | 338 (50.2%) | 335 (49.8%) |
Sales and Office Occupations
The most common Sales and Office occupations in Tularosa are Sales & Related (66 | 9.8%), and Office & Administration (14 | 2.1%).
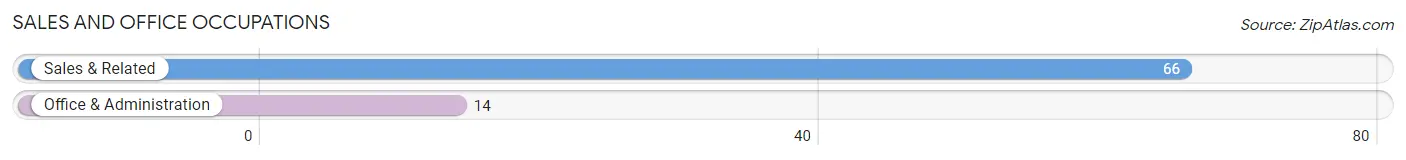
Sales and Office Occupations by Sex

| Occupation | Male | Female |
| Sales & Related | 23 (34.8%) | 43 (65.1%) |
| Office & Administration | 0 (0.0%) | 14 (100.0%) |
| Total (Category) | 23 (28.7%) | 57 (71.3%) |
| Total (Overall) | 338 (50.2%) | 335 (49.8%) |
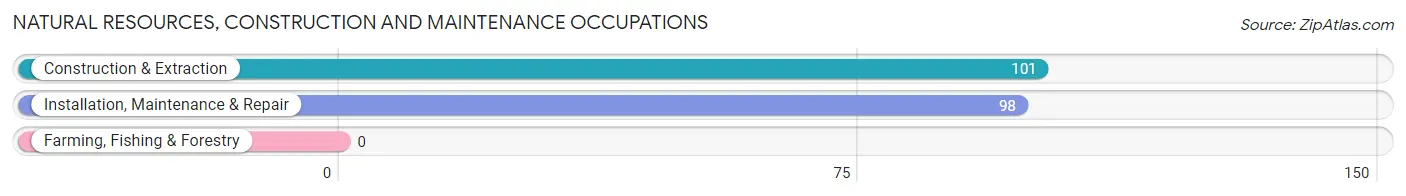
Natural Resources, Construction and Maintenance Occupations
The most common Natural Resources, Construction and Maintenance occupations in Tularosa are Construction & Extraction (101 | 15.0%), and Installation, Maintenance & Repair (98 | 14.6%).
Natural Resources, Construction and Maintenance Occupations by Sex
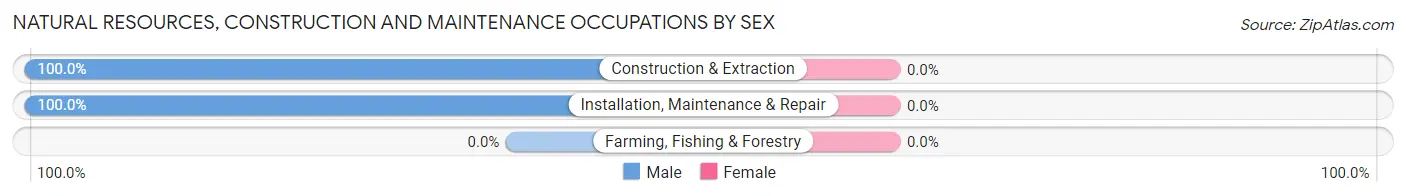
| Occupation | Male | Female |
| Farming, Fishing & Forestry | 0 (0.0%) | 0 (0.0%) |
| Construction & Extraction | 101 (100.0%) | 0 (0.0%) |
| Installation, Maintenance & Repair | 98 (100.0%) | 0 (0.0%) |
| Total (Category) | 199 (100.0%) | 0 (0.0%) |
| Total (Overall) | 338 (50.2%) | 335 (49.8%) |
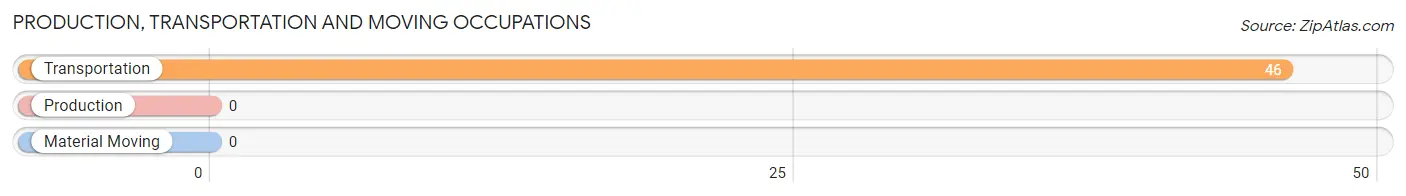
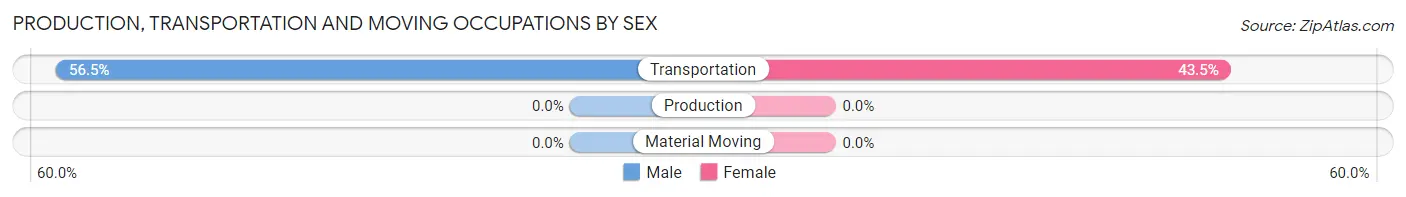
Production, Transportation and Moving Occupations
The most common Production, Transportation and Moving occupations in Tularosa are , and Transportation (46 | 6.8%).
Production, Transportation and Moving Occupations by Sex
| Occupation | Male | Female |
| Production | 0 (0.0%) | 0 (0.0%) |
| Transportation | 26 (56.5%) | 20 (43.5%) |
| Material Moving | 0 (0.0%) | 0 (0.0%) |
| Total (Category) | 26 (56.5%) | 20 (43.5%) |
| Total (Overall) | 338 (50.2%) | 335 (49.8%) |
Employment Industries by Sex in Tularosa
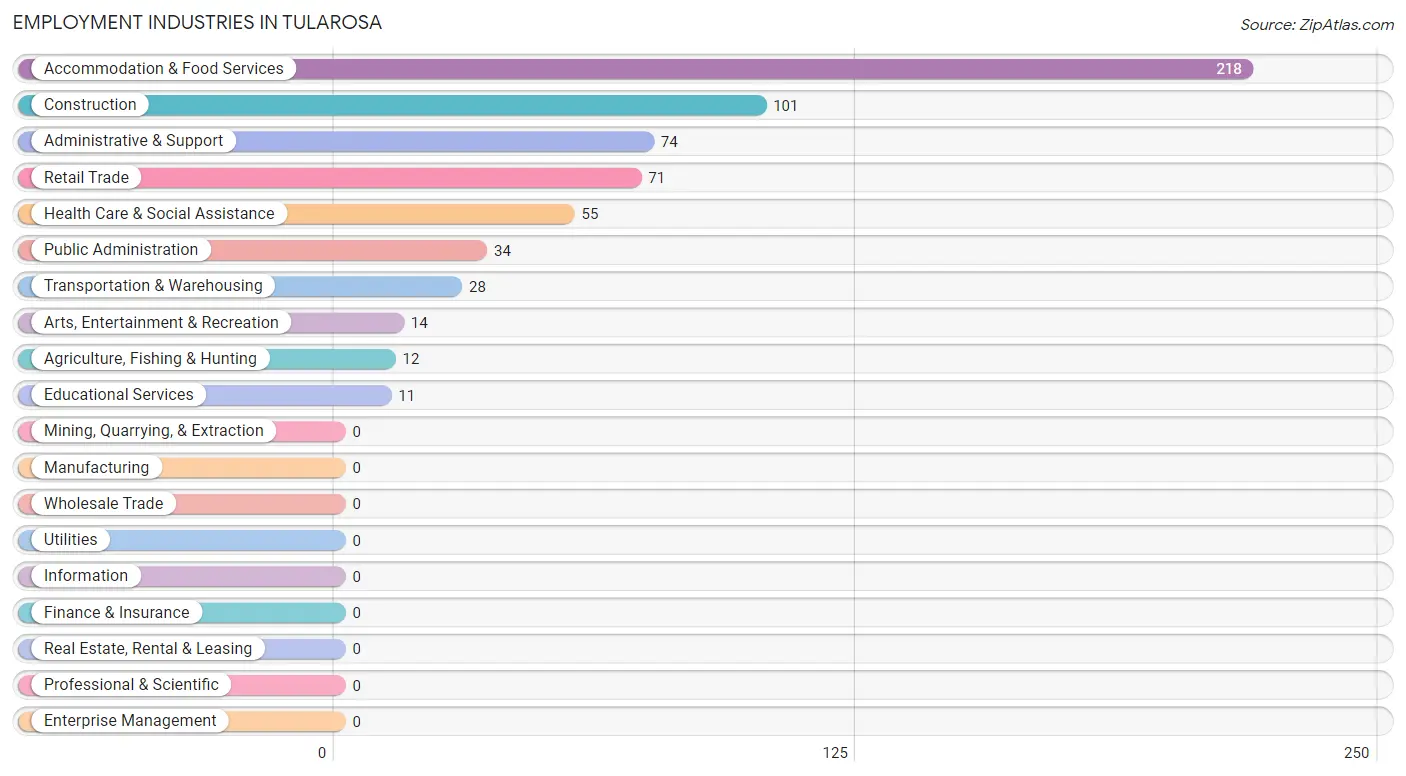
Employment Industries in Tularosa
The major employment industries in Tularosa include Accommodation & Food Services (218 | 32.4%), Construction (101 | 15.0%), Administrative & Support (74 | 11.0%), Retail Trade (71 | 10.5%), and Health Care & Social Assistance (55 | 8.2%).
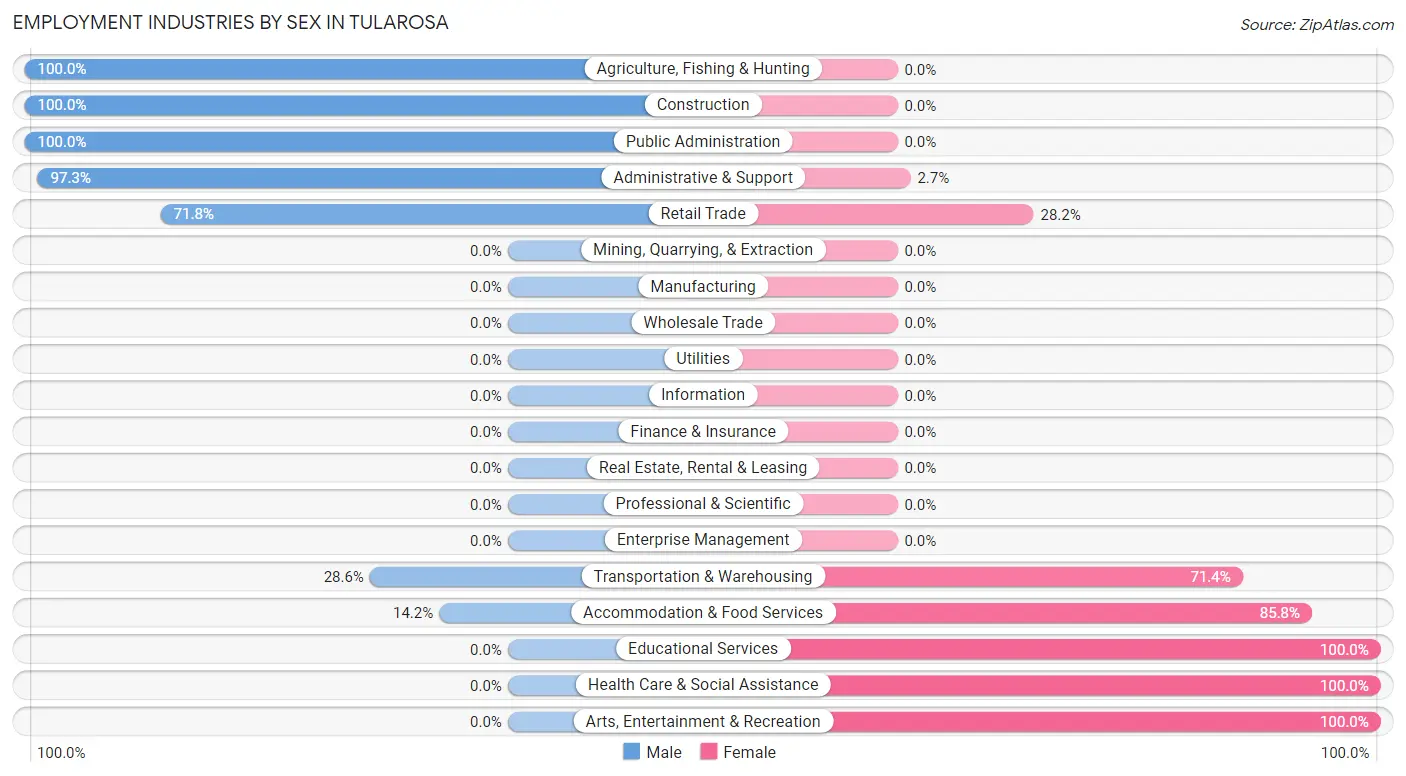
Employment Industries by Sex in Tularosa
The Tularosa industries that see more men than women are Agriculture, Fishing & Hunting (100.0%), Construction (100.0%), and Public Administration (100.0%), whereas the industries that tend to have a higher number of women are Educational Services (100.0%), Health Care & Social Assistance (100.0%), and Arts, Entertainment & Recreation (100.0%).
| Industry | Male | Female |
| Agriculture, Fishing & Hunting | 12 (100.0%) | 0 (0.0%) |
| Mining, Quarrying, & Extraction | 0 (0.0%) | 0 (0.0%) |
| Construction | 101 (100.0%) | 0 (0.0%) |
| Manufacturing | 0 (0.0%) | 0 (0.0%) |
| Wholesale Trade | 0 (0.0%) | 0 (0.0%) |
| Retail Trade | 51 (71.8%) | 20 (28.2%) |
| Transportation & Warehousing | 8 (28.6%) | 20 (71.4%) |
| Utilities | 0 (0.0%) | 0 (0.0%) |
| Information | 0 (0.0%) | 0 (0.0%) |
| Finance & Insurance | 0 (0.0%) | 0 (0.0%) |
| Real Estate, Rental & Leasing | 0 (0.0%) | 0 (0.0%) |
| Professional & Scientific | 0 (0.0%) | 0 (0.0%) |
| Enterprise Management | 0 (0.0%) | 0 (0.0%) |
| Administrative & Support | 72 (97.3%) | 2 (2.7%) |
| Educational Services | 0 (0.0%) | 11 (100.0%) |
| Health Care & Social Assistance | 0 (0.0%) | 55 (100.0%) |
| Arts, Entertainment & Recreation | 0 (0.0%) | 14 (100.0%) |
| Accommodation & Food Services | 31 (14.2%) | 187 (85.8%) |
| Public Administration | 34 (100.0%) | 0 (0.0%) |
| Total | 338 (50.2%) | 335 (49.8%) |
Education in Tularosa
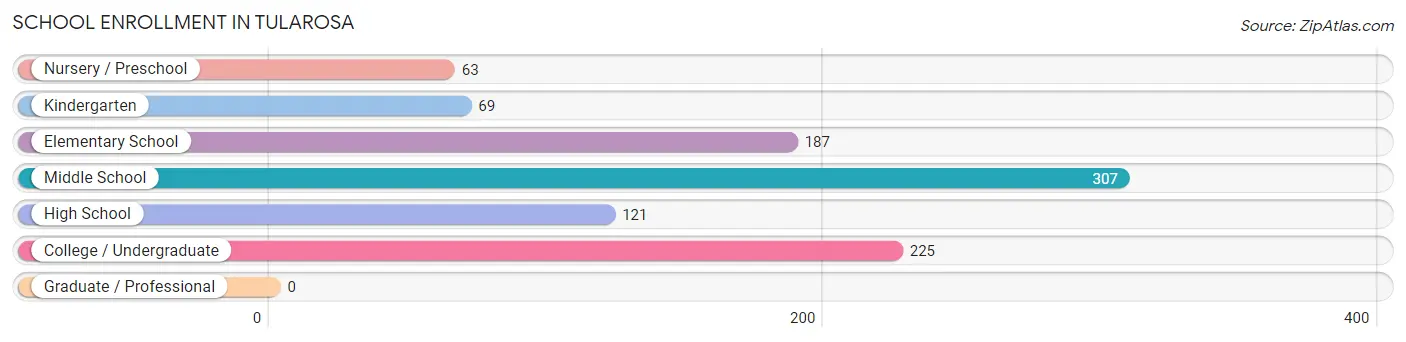
School Enrollment in Tularosa
The most common levels of schooling among the 972 students in Tularosa are middle school (307 | 31.6%), college / undergraduate (225 | 23.2%), and elementary school (187 | 19.2%).
| School Level | # Students | % Students |
| Nursery / Preschool | 63 | 6.5% |
| Kindergarten | 69 | 7.1% |
| Elementary School | 187 | 19.2% |
| Middle School | 307 | 31.6% |
| High School | 121 | 12.4% |
| College / Undergraduate | 225 | 23.2% |
| Graduate / Professional | 0 | 0.0% |
| Total | 972 | 100.0% |
School Enrollment by Age by Funding Source in Tularosa
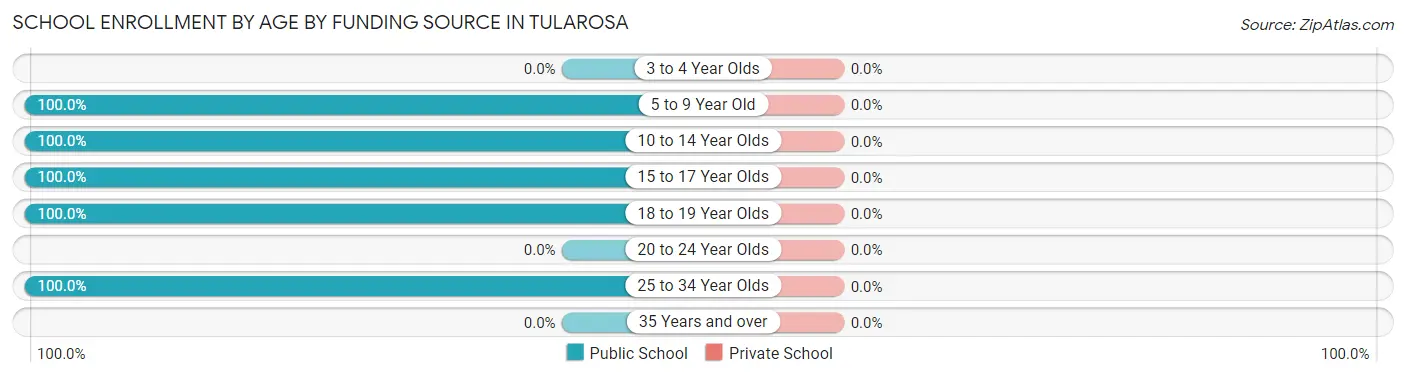
| Age Bracket | Public School | Private School |
| 3 to 4 Year Olds | 0 (0.0%) | 0 (0.0%) |
| 5 to 9 Year Old | 267 (100.0%) | 0 (0.0%) |
| 10 to 14 Year Olds | 359 (100.0%) | 0 (0.0%) |
| 15 to 17 Year Olds | 121 (100.0%) | 0 (0.0%) |
| 18 to 19 Year Olds | 55 (100.0%) | 0 (0.0%) |
| 20 to 24 Year Olds | 0 (0.0%) | 0 (0.0%) |
| 25 to 34 Year Olds | 170 (100.0%) | 0 (0.0%) |
| 35 Years and over | 0 (0.0%) | 0 (0.0%) |
| Total | 972 (100.0%) | 0 (0.0%) |
Educational Attainment by Field of Study in Tularosa
Science & technology (137 | 43.2%), education (64 | 20.2%), physical & health sciences (24 | 7.6%), liberal arts & history (24 | 7.6%), and arts & humanities (18 | 5.7%) are the most common fields of study among 317 individuals in Tularosa who have obtained a bachelor's degree or higher.
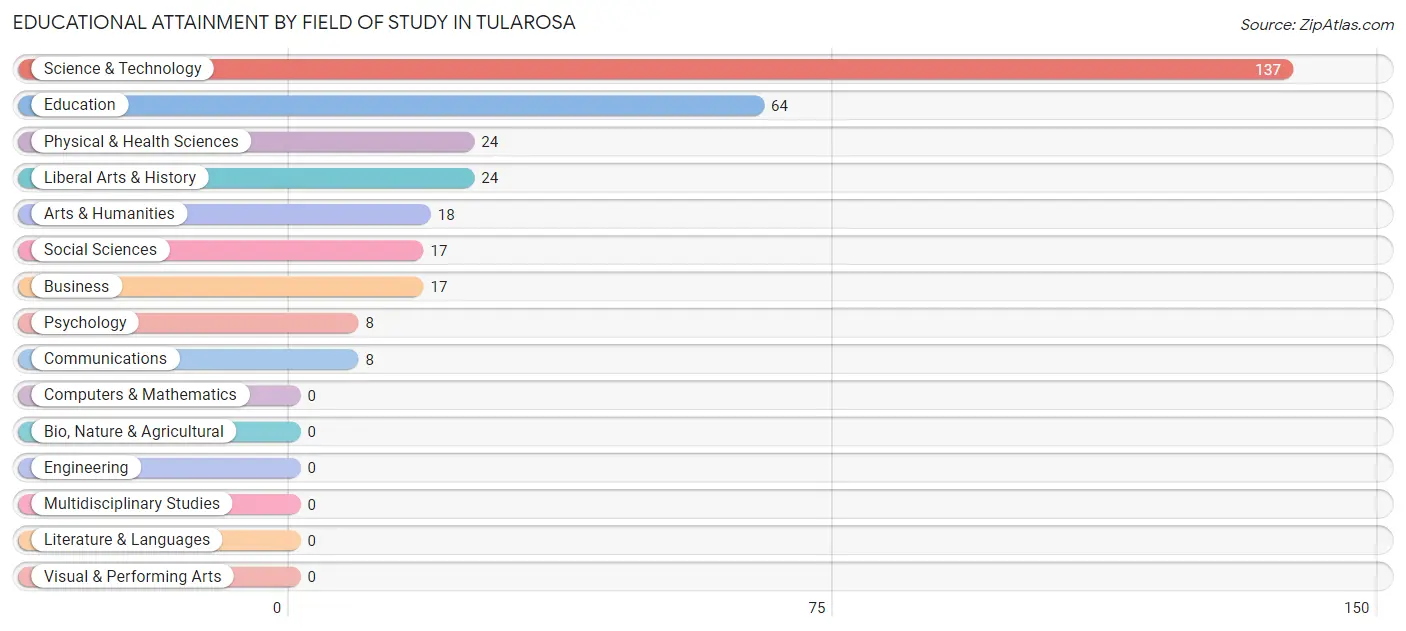
| Field of Study | # Graduates | % Graduates |
| Computers & Mathematics | 0 | 0.0% |
| Bio, Nature & Agricultural | 0 | 0.0% |
| Physical & Health Sciences | 24 | 7.6% |
| Psychology | 8 | 2.5% |
| Social Sciences | 17 | 5.4% |
| Engineering | 0 | 0.0% |
| Multidisciplinary Studies | 0 | 0.0% |
| Science & Technology | 137 | 43.2% |
| Business | 17 | 5.4% |
| Education | 64 | 20.2% |
| Literature & Languages | 0 | 0.0% |
| Liberal Arts & History | 24 | 7.6% |
| Visual & Performing Arts | 0 | 0.0% |
| Communications | 8 | 2.5% |
| Arts & Humanities | 18 | 5.7% |
| Total | 317 | 100.0% |
Transportation & Commute in Tularosa
Vehicle Availability by Sex in Tularosa
The most prevalent vehicle ownership categories in Tularosa are males with 3 vehicles (91, accounting for 27.7%) and females with 3 vehicles (41, making up 27.2%).
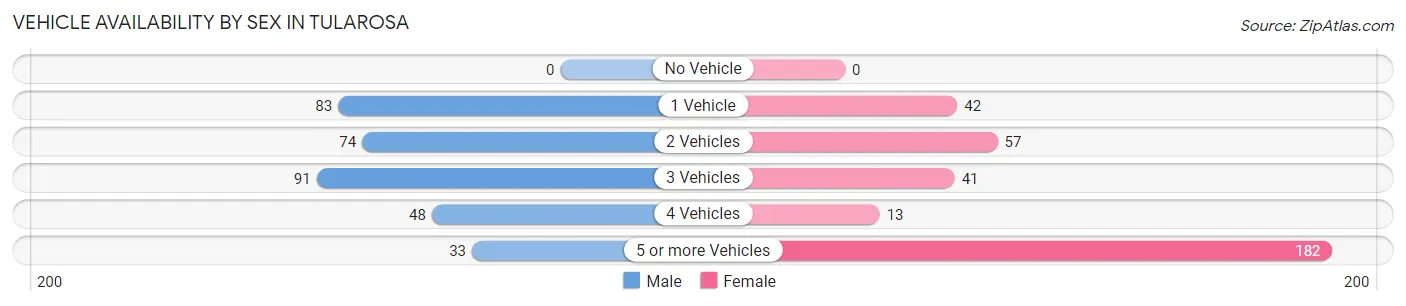
| Vehicles Available | Male | Female |
| No Vehicle | 0 (0.0%) | 0 (0.0%) |
| 1 Vehicle | 83 (25.2%) | 42 (12.5%) |
| 2 Vehicles | 74 (22.5%) | 57 (17.0%) |
| 3 Vehicles | 91 (27.7%) | 41 (12.2%) |
| 4 Vehicles | 48 (14.6%) | 13 (3.9%) |
| 5 or more Vehicles | 33 (10.0%) | 182 (54.3%) |
| Total | 329 (100.0%) | 335 (100.0%) |
Commute Time in Tularosa
The most frequently occuring commute durations in Tularosa are 20 to 24 minutes (248 commuters, 39.1%), 30 to 34 minutes (166 commuters, 26.1%), and 40 to 44 minutes (72 commuters, 11.3%).
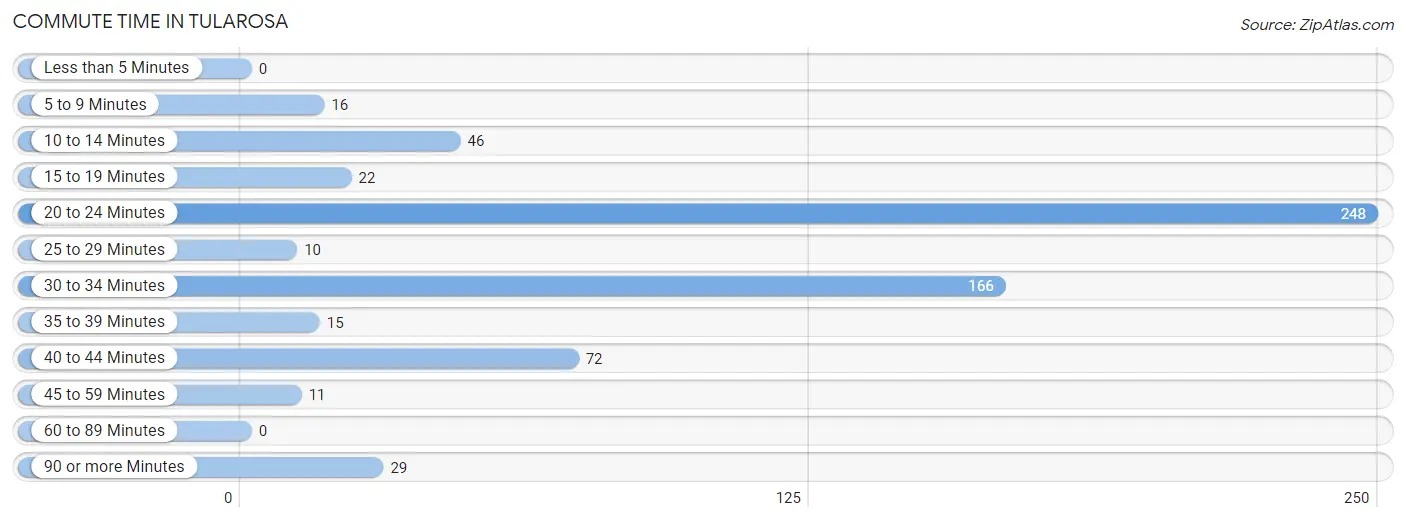
| Commute Time | # Commuters | % Commuters |
| Less than 5 Minutes | 0 | 0.0% |
| 5 to 9 Minutes | 16 | 2.5% |
| 10 to 14 Minutes | 46 | 7.2% |
| 15 to 19 Minutes | 22 | 3.5% |
| 20 to 24 Minutes | 248 | 39.1% |
| 25 to 29 Minutes | 10 | 1.6% |
| 30 to 34 Minutes | 166 | 26.1% |
| 35 to 39 Minutes | 15 | 2.4% |
| 40 to 44 Minutes | 72 | 11.3% |
| 45 to 59 Minutes | 11 | 1.7% |
| 60 to 89 Minutes | 0 | 0.0% |
| 90 or more Minutes | 29 | 4.6% |
Commute Time by Sex in Tularosa
The most common commute times in Tularosa are 30 to 34 minutes (100 commuters, 30.4%) for males and 20 to 24 minutes (209 commuters, 68.3%) for females.
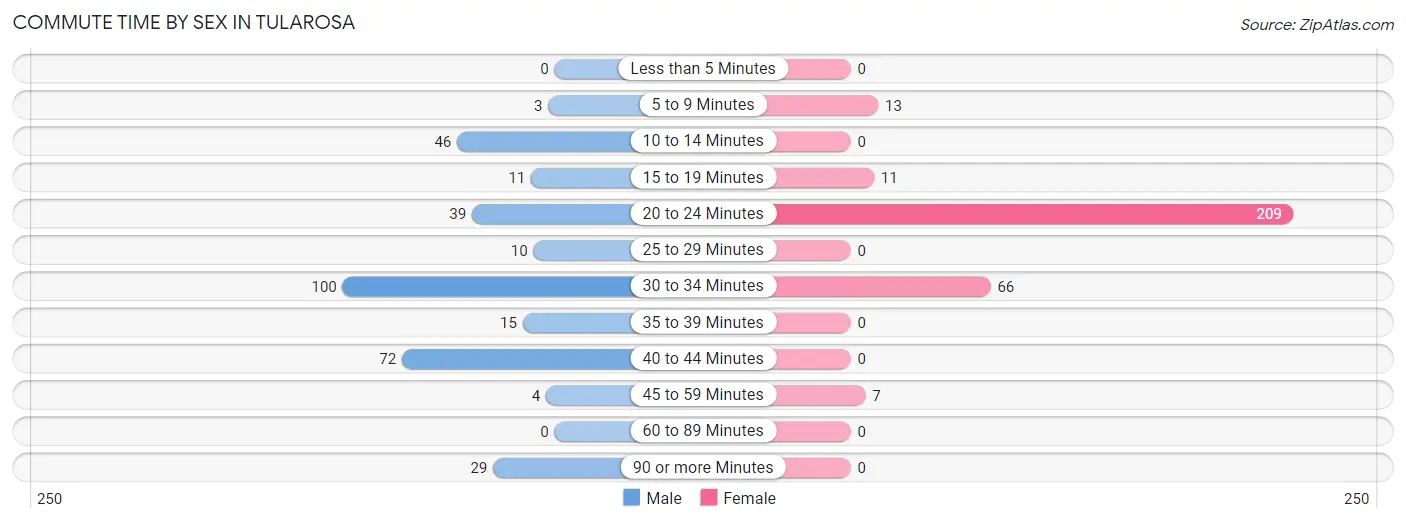
| Commute Time | Male | Female |
| Less than 5 Minutes | 0 (0.0%) | 0 (0.0%) |
| 5 to 9 Minutes | 3 (0.9%) | 13 (4.3%) |
| 10 to 14 Minutes | 46 (14.0%) | 0 (0.0%) |
| 15 to 19 Minutes | 11 (3.3%) | 11 (3.6%) |
| 20 to 24 Minutes | 39 (11.8%) | 209 (68.3%) |
| 25 to 29 Minutes | 10 (3.0%) | 0 (0.0%) |
| 30 to 34 Minutes | 100 (30.4%) | 66 (21.6%) |
| 35 to 39 Minutes | 15 (4.6%) | 0 (0.0%) |
| 40 to 44 Minutes | 72 (21.9%) | 0 (0.0%) |
| 45 to 59 Minutes | 4 (1.2%) | 7 (2.3%) |
| 60 to 89 Minutes | 0 (0.0%) | 0 (0.0%) |
| 90 or more Minutes | 29 (8.8%) | 0 (0.0%) |
Time of Departure to Work by Sex in Tularosa
The most frequent times of departure to work in Tularosa are 12:00 AM to 4:59 AM (79, 24.0%) for males and 6:30 AM to 6:59 AM (185, 60.5%) for females.
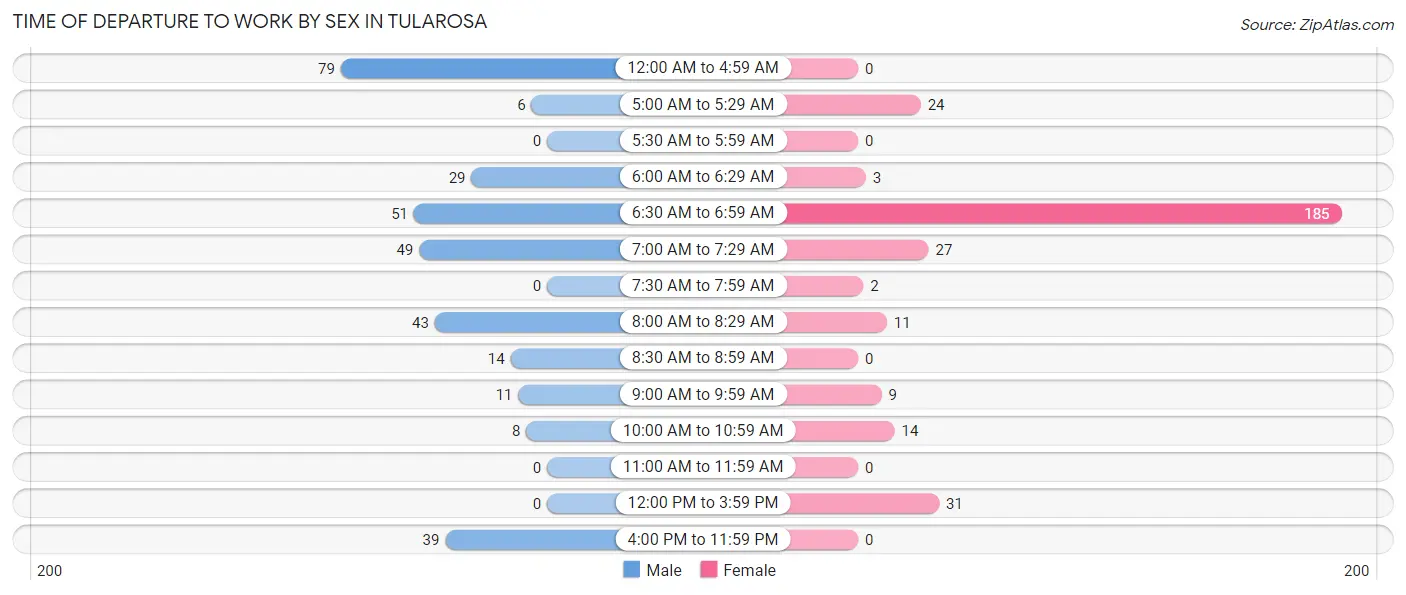
| Time of Departure | Male | Female |
| 12:00 AM to 4:59 AM | 79 (24.0%) | 0 (0.0%) |
| 5:00 AM to 5:29 AM | 6 (1.8%) | 24 (7.8%) |
| 5:30 AM to 5:59 AM | 0 (0.0%) | 0 (0.0%) |
| 6:00 AM to 6:29 AM | 29 (8.8%) | 3 (1.0%) |
| 6:30 AM to 6:59 AM | 51 (15.5%) | 185 (60.5%) |
| 7:00 AM to 7:29 AM | 49 (14.9%) | 27 (8.8%) |
| 7:30 AM to 7:59 AM | 0 (0.0%) | 2 (0.6%) |
| 8:00 AM to 8:29 AM | 43 (13.1%) | 11 (3.6%) |
| 8:30 AM to 8:59 AM | 14 (4.3%) | 0 (0.0%) |
| 9:00 AM to 9:59 AM | 11 (3.3%) | 9 (2.9%) |
| 10:00 AM to 10:59 AM | 8 (2.4%) | 14 (4.6%) |
| 11:00 AM to 11:59 AM | 0 (0.0%) | 0 (0.0%) |
| 12:00 PM to 3:59 PM | 0 (0.0%) | 31 (10.1%) |
| 4:00 PM to 11:59 PM | 39 (11.8%) | 0 (0.0%) |
| Total | 329 (100.0%) | 306 (100.0%) |
Housing Occupancy in Tularosa
Occupancy by Ownership in Tularosa
Of the total 622 dwellings in Tularosa, owner-occupied units account for 533 (85.7%), while renter-occupied units make up 89 (14.3%).
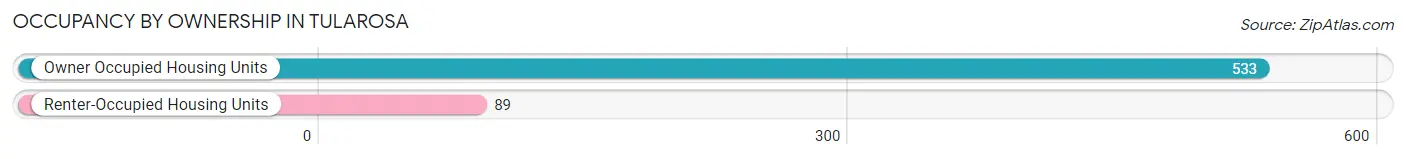
| Occupancy | # Housing Units | % Housing Units |
| Owner Occupied Housing Units | 533 | 85.7% |
| Renter-Occupied Housing Units | 89 | 14.3% |
| Total Occupied Housing Units | 622 | 100.0% |
Occupancy by Household Size in Tularosa
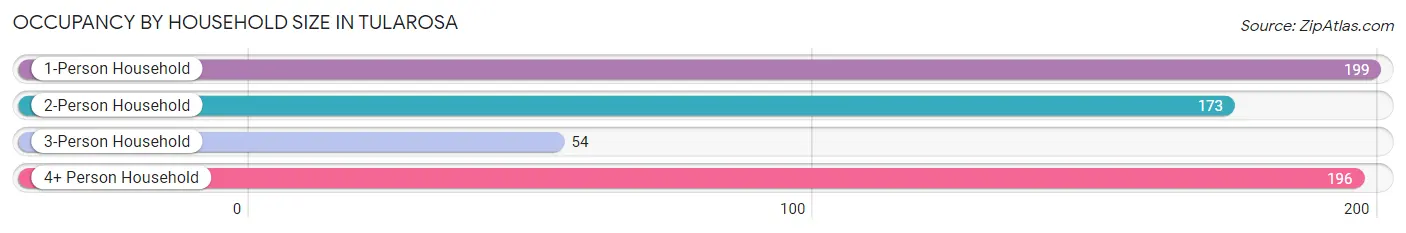
| Household Size | # Housing Units | % Housing Units |
| 1-Person Household | 199 | 32.0% |
| 2-Person Household | 173 | 27.8% |
| 3-Person Household | 54 | 8.7% |
| 4+ Person Household | 196 | 31.5% |
| Total Housing Units | 622 | 100.0% |
Occupancy by Ownership by Household Size in Tularosa
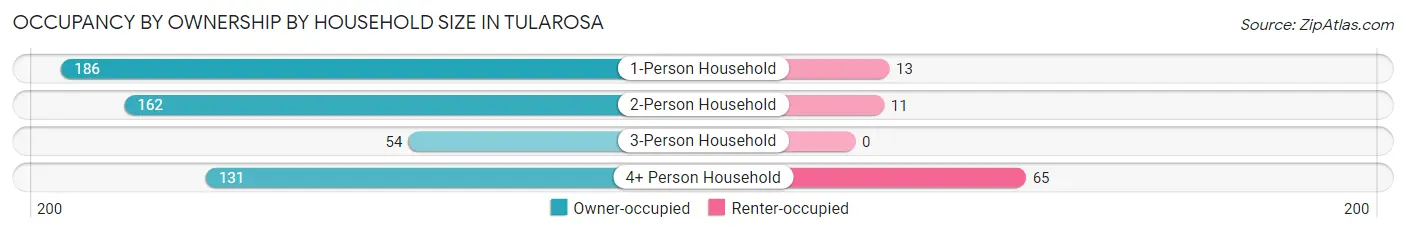
| Household Size | Owner-occupied | Renter-occupied |
| 1-Person Household | 186 (93.5%) | 13 (6.5%) |
| 2-Person Household | 162 (93.6%) | 11 (6.4%) |
| 3-Person Household | 54 (100.0%) | 0 (0.0%) |
| 4+ Person Household | 131 (66.8%) | 65 (33.2%) |
| Total Housing Units | 533 (85.7%) | 89 (14.3%) |
Occupancy by Educational Attainment in Tularosa
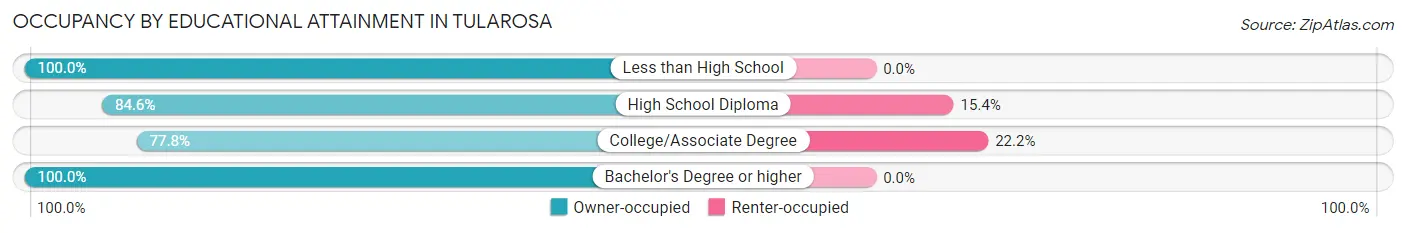
| Household Size | Owner-occupied | Renter-occupied |
| Less than High School | 7 (100.0%) | 0 (0.0%) |
| High School Diploma | 226 (84.6%) | 41 (15.4%) |
| College/Associate Degree | 168 (77.8%) | 48 (22.2%) |
| Bachelor's Degree or higher | 132 (100.0%) | 0 (0.0%) |
Occupancy by Age of Householder in Tularosa
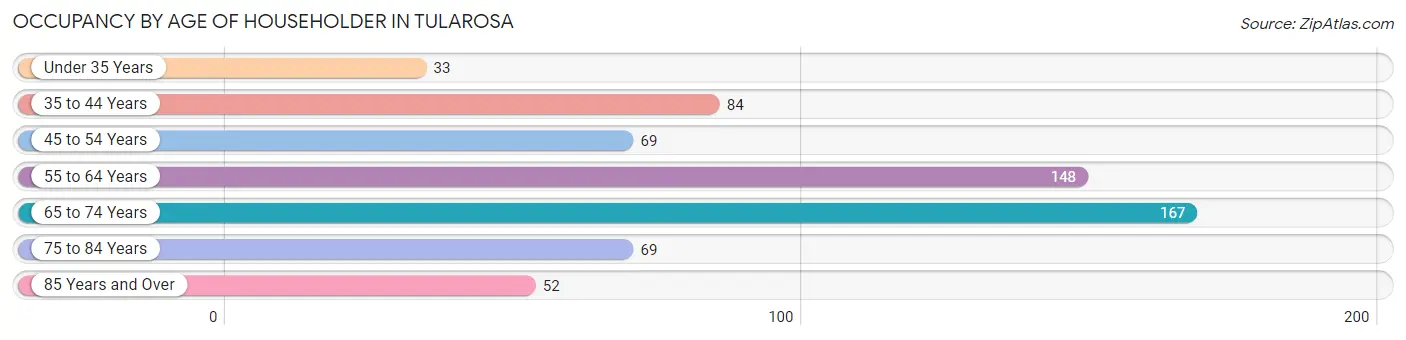
| Age Bracket | # Households | % Households |
| Under 35 Years | 33 | 5.3% |
| 35 to 44 Years | 84 | 13.5% |
| 45 to 54 Years | 69 | 11.1% |
| 55 to 64 Years | 148 | 23.8% |
| 65 to 74 Years | 167 | 26.9% |
| 75 to 84 Years | 69 | 11.1% |
| 85 Years and Over | 52 | 8.4% |
| Total | 622 | 100.0% |
Housing Finances in Tularosa
Median Income by Occupancy in Tularosa
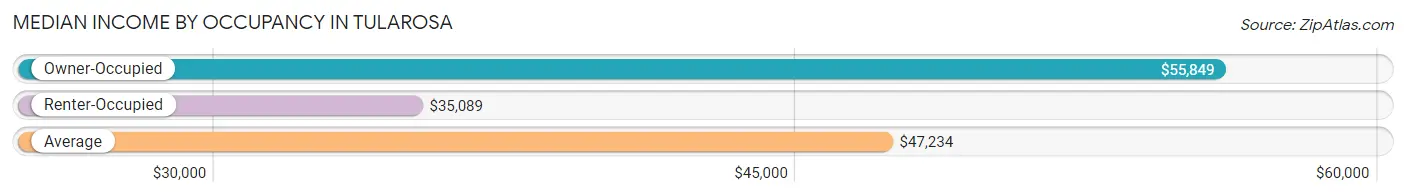
| Occupancy Type | # Households | Median Income |
| Owner-Occupied | 533 (85.7%) | $55,849 |
| Renter-Occupied | 89 (14.3%) | $35,089 |
| Average | 622 (100.0%) | $47,234 |
Occupancy by Householder Income Bracket in Tularosa
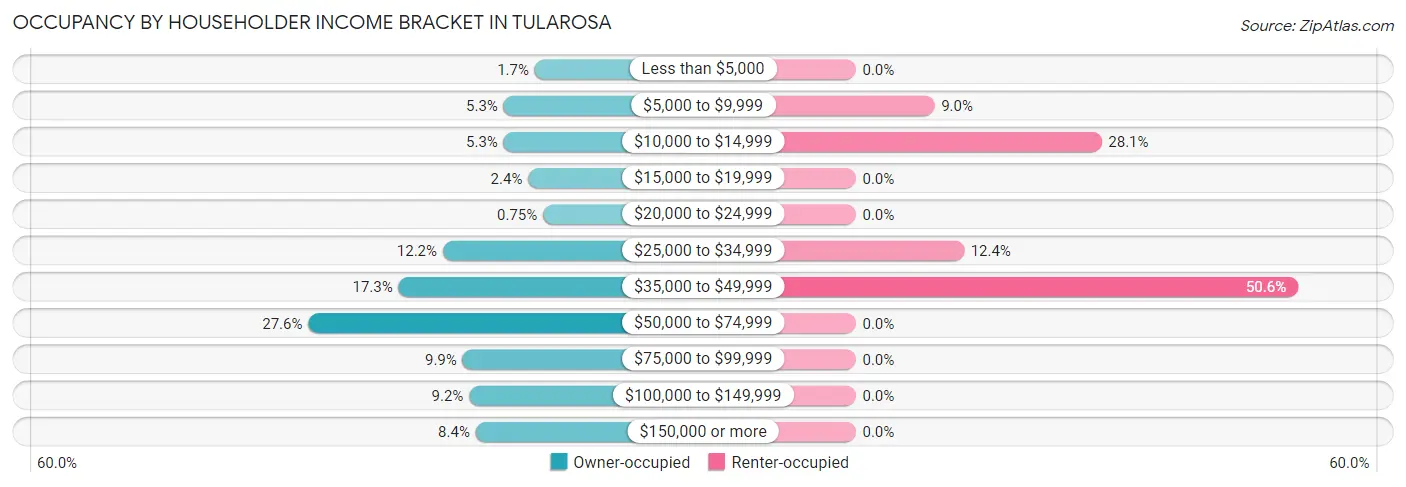
| Income Bracket | Owner-occupied | Renter-occupied |
| Less than $5,000 | 9 (1.7%) | 0 (0.0%) |
| $5,000 to $9,999 | 28 (5.2%) | 8 (9.0%) |
| $10,000 to $14,999 | 28 (5.2%) | 25 (28.1%) |
| $15,000 to $19,999 | 13 (2.4%) | 0 (0.0%) |
| $20,000 to $24,999 | 4 (0.7%) | 0 (0.0%) |
| $25,000 to $34,999 | 65 (12.2%) | 11 (12.4%) |
| $35,000 to $49,999 | 92 (17.3%) | 45 (50.6%) |
| $50,000 to $74,999 | 147 (27.6%) | 0 (0.0%) |
| $75,000 to $99,999 | 53 (9.9%) | 0 (0.0%) |
| $100,000 to $149,999 | 49 (9.2%) | 0 (0.0%) |
| $150,000 or more | 45 (8.4%) | 0 (0.0%) |
| Total | 533 (100.0%) | 89 (100.0%) |
Monthly Housing Cost Tiers in Tularosa
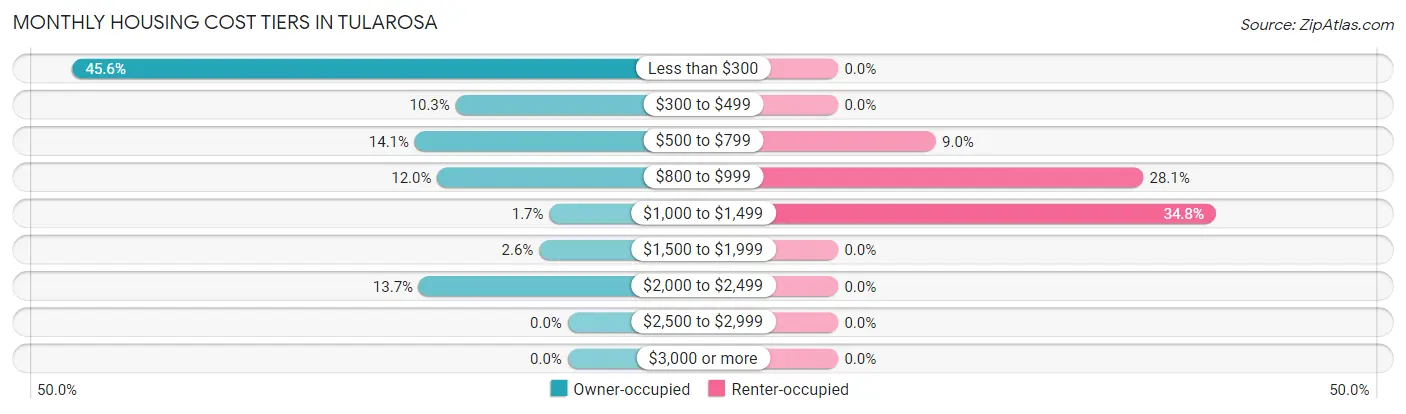
| Monthly Cost | Owner-occupied | Renter-occupied |
| Less than $300 | 243 (45.6%) | 0 (0.0%) |
| $300 to $499 | 55 (10.3%) | 0 (0.0%) |
| $500 to $799 | 75 (14.1%) | 8 (9.0%) |
| $800 to $999 | 64 (12.0%) | 25 (28.1%) |
| $1,000 to $1,499 | 9 (1.7%) | 31 (34.8%) |
| $1,500 to $1,999 | 14 (2.6%) | 0 (0.0%) |
| $2,000 to $2,499 | 73 (13.7%) | 0 (0.0%) |
| $2,500 to $2,999 | 0 (0.0%) | 0 (0.0%) |
| $3,000 or more | 0 (0.0%) | 0 (0.0%) |
| Total | 533 (100.0%) | 89 (100.0%) |
Physical Housing Characteristics in Tularosa
Housing Structures in Tularosa
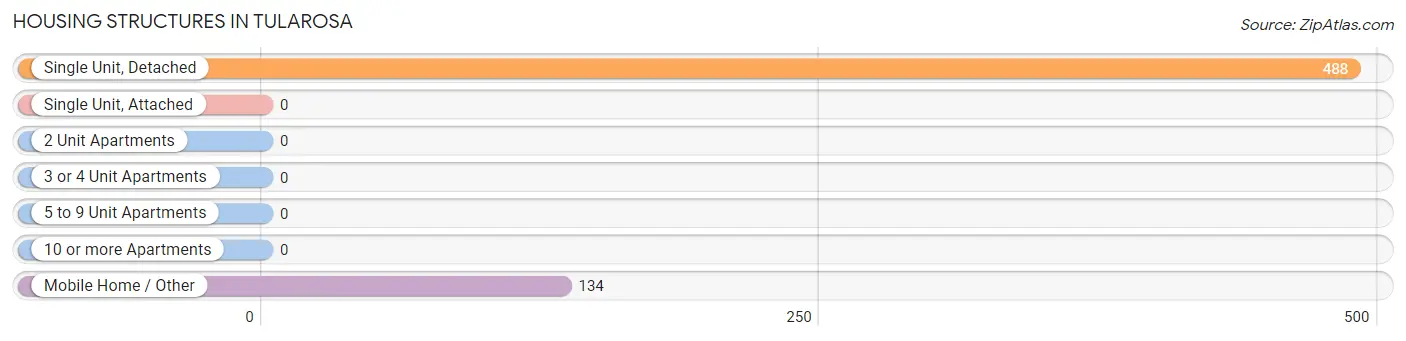
| Structure Type | # Housing Units | % Housing Units |
| Single Unit, Detached | 488 | 78.5% |
| Single Unit, Attached | 0 | 0.0% |
| 2 Unit Apartments | 0 | 0.0% |
| 3 or 4 Unit Apartments | 0 | 0.0% |
| 5 to 9 Unit Apartments | 0 | 0.0% |
| 10 or more Apartments | 0 | 0.0% |
| Mobile Home / Other | 134 | 21.5% |
| Total | 622 | 100.0% |
Housing Structures by Occupancy in Tularosa
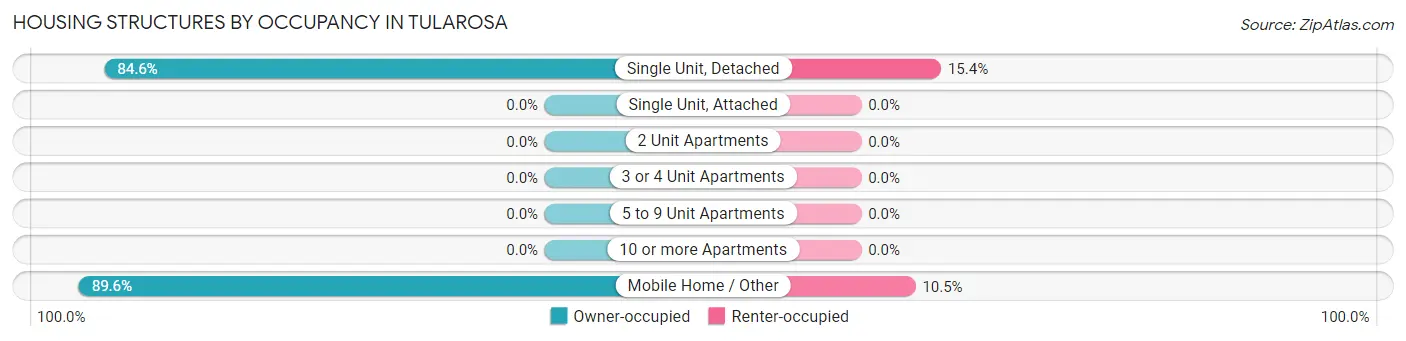
| Structure Type | Owner-occupied | Renter-occupied |
| Single Unit, Detached | 413 (84.6%) | 75 (15.4%) |
| Single Unit, Attached | 0 (0.0%) | 0 (0.0%) |
| 2 Unit Apartments | 0 (0.0%) | 0 (0.0%) |
| 3 or 4 Unit Apartments | 0 (0.0%) | 0 (0.0%) |
| 5 to 9 Unit Apartments | 0 (0.0%) | 0 (0.0%) |
| 10 or more Apartments | 0 (0.0%) | 0 (0.0%) |
| Mobile Home / Other | 120 (89.5%) | 14 (10.4%) |
| Total | 533 (85.7%) | 89 (14.3%) |
Housing Structures by Number of Rooms in Tularosa
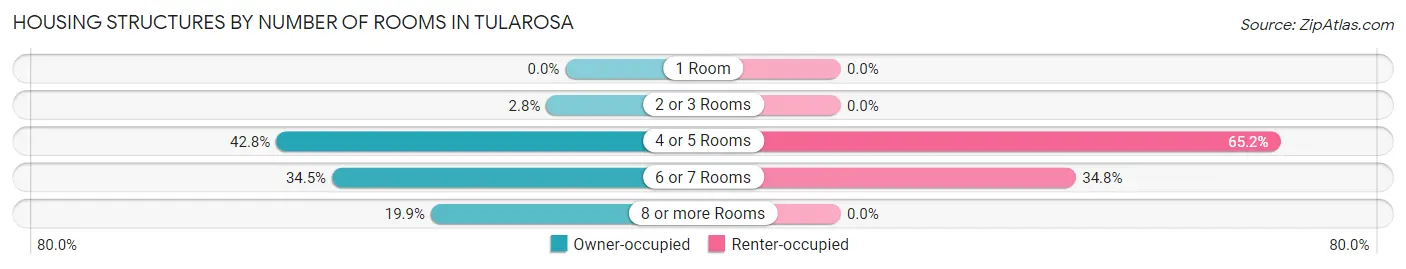
| Number of Rooms | Owner-occupied | Renter-occupied |
| 1 Room | 0 (0.0%) | 0 (0.0%) |
| 2 or 3 Rooms | 15 (2.8%) | 0 (0.0%) |
| 4 or 5 Rooms | 228 (42.8%) | 58 (65.2%) |
| 6 or 7 Rooms | 184 (34.5%) | 31 (34.8%) |
| 8 or more Rooms | 106 (19.9%) | 0 (0.0%) |
| Total | 533 (100.0%) | 89 (100.0%) |
Housing Structure by Heating Type in Tularosa
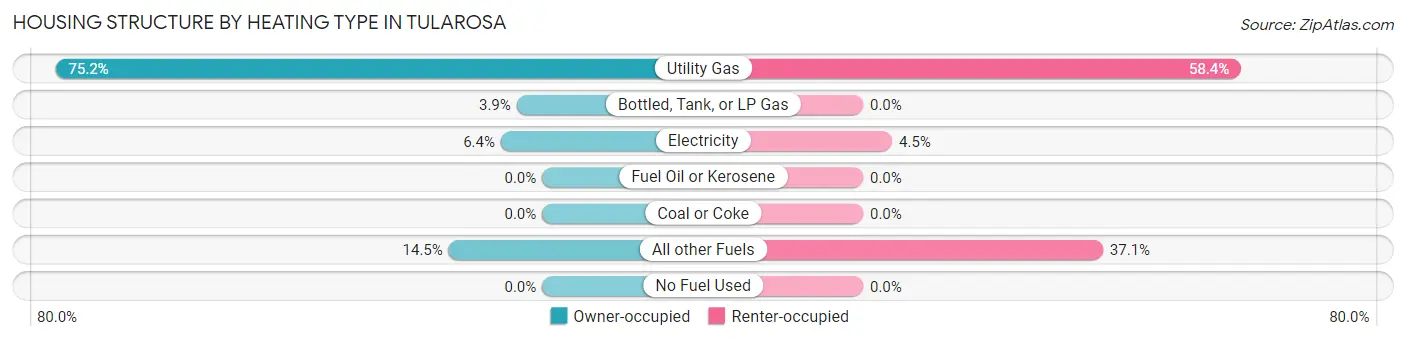
| Heating Type | Owner-occupied | Renter-occupied |
| Utility Gas | 401 (75.2%) | 52 (58.4%) |
| Bottled, Tank, or LP Gas | 21 (3.9%) | 0 (0.0%) |
| Electricity | 34 (6.4%) | 4 (4.5%) |
| Fuel Oil or Kerosene | 0 (0.0%) | 0 (0.0%) |
| Coal or Coke | 0 (0.0%) | 0 (0.0%) |
| All other Fuels | 77 (14.4%) | 33 (37.1%) |
| No Fuel Used | 0 (0.0%) | 0 (0.0%) |
| Total | 533 (100.0%) | 89 (100.0%) |
Household Vehicle Usage in Tularosa
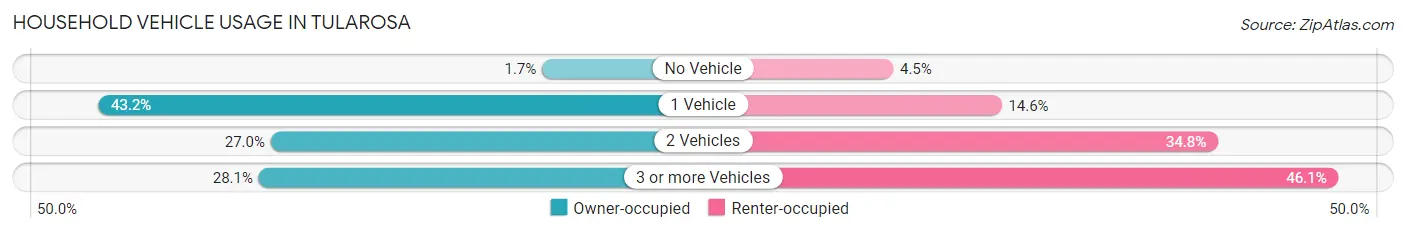
| Vehicles per Household | Owner-occupied | Renter-occupied |
| No Vehicle | 9 (1.7%) | 4 (4.5%) |
| 1 Vehicle | 230 (43.1%) | 13 (14.6%) |
| 2 Vehicles | 144 (27.0%) | 31 (34.8%) |
| 3 or more Vehicles | 150 (28.1%) | 41 (46.1%) |
| Total | 533 (100.0%) | 89 (100.0%) |
Real Estate & Mortgages in Tularosa
Real Estate and Mortgage Overview in Tularosa
| Characteristic | Without Mortgage | With Mortgage |
| Housing Units | 299 | 234 |
| Median Property Value | $77,900 | $153,500 |
| Median Household Income | $55,885 | $37 |
| Monthly Housing Costs | $236 | $0 |
| Real Estate Taxes | $478 | $14 |
Property Value by Mortgage Status in Tularosa
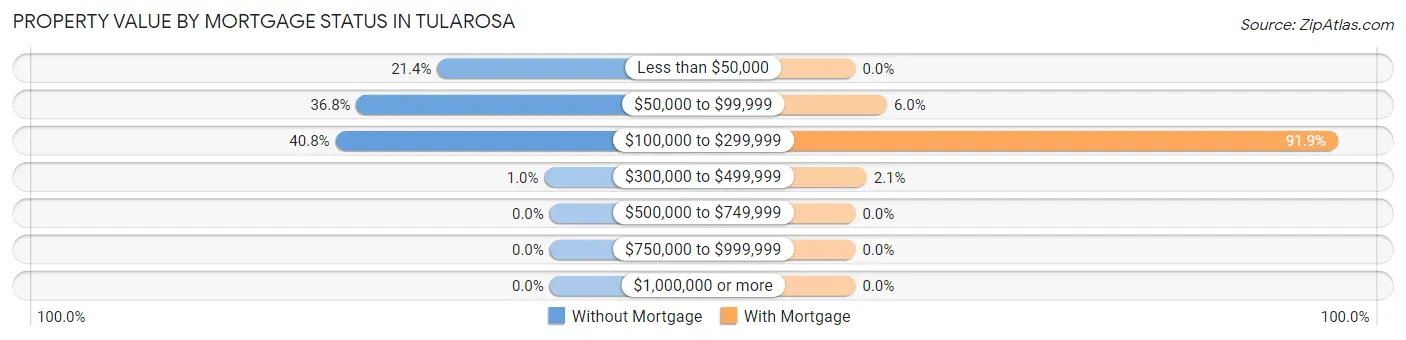
| Property Value | Without Mortgage | With Mortgage |
| Less than $50,000 | 64 (21.4%) | 0 (0.0%) |
| $50,000 to $99,999 | 110 (36.8%) | 14 (6.0%) |
| $100,000 to $299,999 | 122 (40.8%) | 215 (91.9%) |
| $300,000 to $499,999 | 3 (1.0%) | 5 (2.1%) |
| $500,000 to $749,999 | 0 (0.0%) | 0 (0.0%) |
| $750,000 to $999,999 | 0 (0.0%) | 0 (0.0%) |
| $1,000,000 or more | 0 (0.0%) | 0 (0.0%) |
| Total | 299 (100.0%) | 234 (100.0%) |
Household Income by Mortgage Status in Tularosa
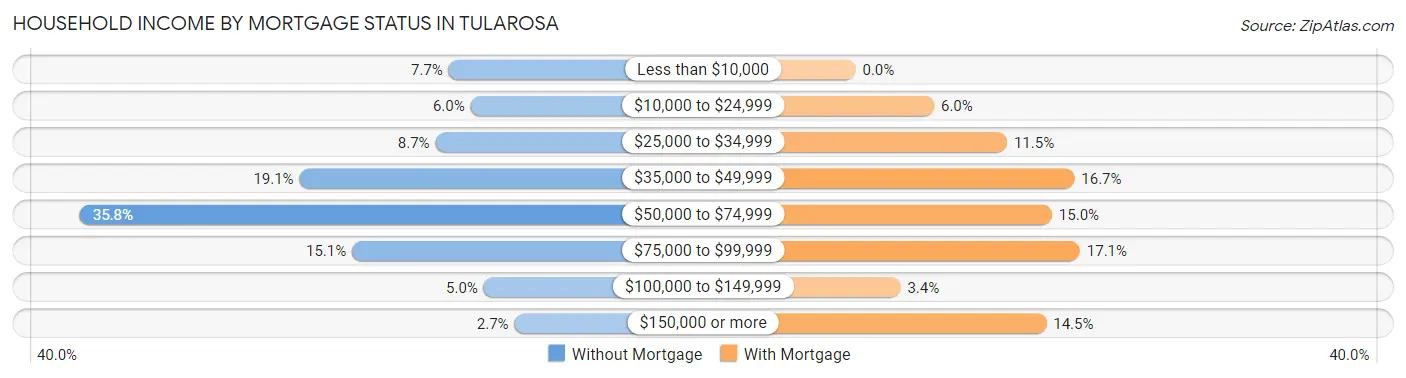
| Household Income | Without Mortgage | With Mortgage |
| Less than $10,000 | 23 (7.7%) | 0 (0.0%) |
| $10,000 to $24,999 | 18 (6.0%) | 14 (6.0%) |
| $25,000 to $34,999 | 26 (8.7%) | 27 (11.5%) |
| $35,000 to $49,999 | 57 (19.1%) | 39 (16.7%) |
| $50,000 to $74,999 | 107 (35.8%) | 35 (15.0%) |
| $75,000 to $99,999 | 45 (15.0%) | 40 (17.1%) |
| $100,000 to $149,999 | 15 (5.0%) | 8 (3.4%) |
| $150,000 or more | 8 (2.7%) | 34 (14.5%) |
| Total | 299 (100.0%) | 234 (100.0%) |
Property Value to Household Income Ratio in Tularosa
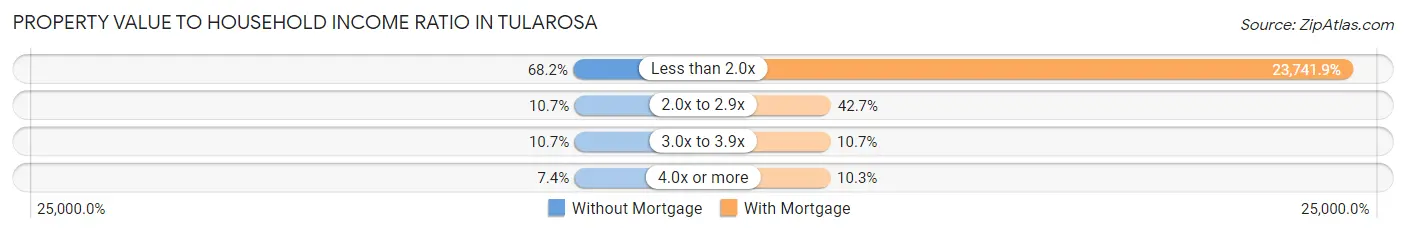
| Value-to-Income Ratio | Without Mortgage | With Mortgage |
| Less than 2.0x | 204 (68.2%) | 55,556 (23,741.9%) |
| 2.0x to 2.9x | 32 (10.7%) | 100 (42.7%) |
| 3.0x to 3.9x | 32 (10.7%) | 25 (10.7%) |
| 4.0x or more | 22 (7.4%) | 24 (10.3%) |
| Total | 299 (100.0%) | 234 (100.0%) |
Real Estate Taxes by Mortgage Status in Tularosa
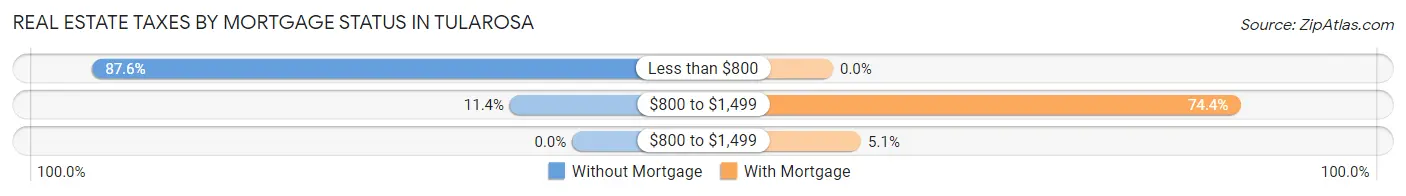
| Property Taxes | Without Mortgage | With Mortgage |
| Less than $800 | 262 (87.6%) | 0 (0.0%) |
| $800 to $1,499 | 34 (11.4%) | 174 (74.4%) |
| $800 to $1,499 | 0 (0.0%) | 12 (5.1%) |
| Total | 299 (100.0%) | 234 (100.0%) |
Health & Disability in Tularosa
Health Insurance Coverage by Age in Tularosa
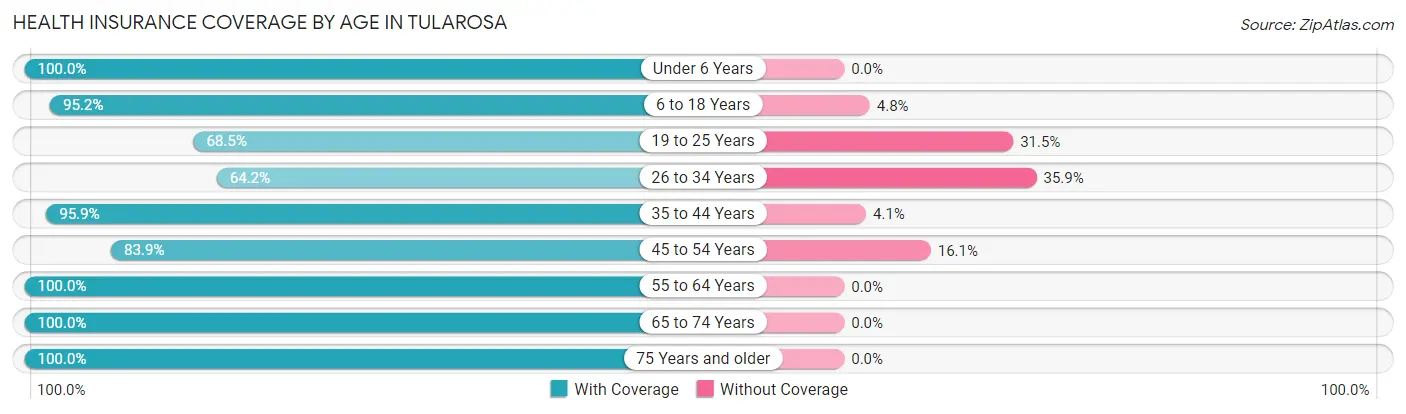
| Age Bracket | With Coverage | Without Coverage |
| Under 6 Years | 222 (100.0%) | 0 (0.0%) |
| 6 to 18 Years | 660 (95.2%) | 33 (4.8%) |
| 19 to 25 Years | 274 (68.5%) | 126 (31.5%) |
| 26 to 34 Years | 68 (64.1%) | 38 (35.8%) |
| 35 to 44 Years | 260 (95.9%) | 11 (4.1%) |
| 45 to 54 Years | 156 (83.9%) | 30 (16.1%) |
| 55 to 64 Years | 280 (100.0%) | 0 (0.0%) |
| 65 to 74 Years | 209 (100.0%) | 0 (0.0%) |
| 75 Years and older | 216 (100.0%) | 0 (0.0%) |
| Total | 2,345 (90.8%) | 238 (9.2%) |
Health Insurance Coverage by Citizenship Status in Tularosa
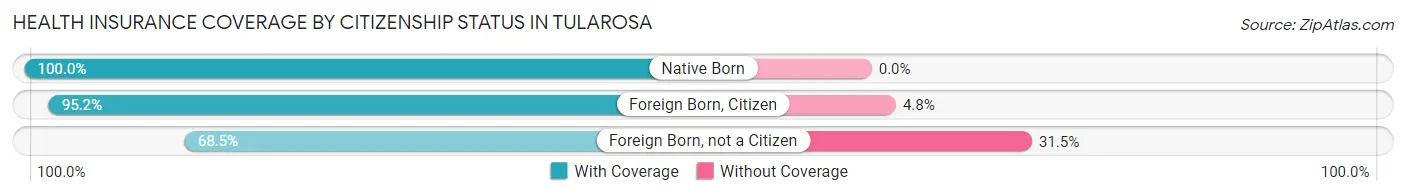
| Citizenship Status | With Coverage | Without Coverage |
| Native Born | 222 (100.0%) | 0 (0.0%) |
| Foreign Born, Citizen | 660 (95.2%) | 33 (4.8%) |
| Foreign Born, not a Citizen | 274 (68.5%) | 126 (31.5%) |
Health Insurance Coverage by Household Income in Tularosa
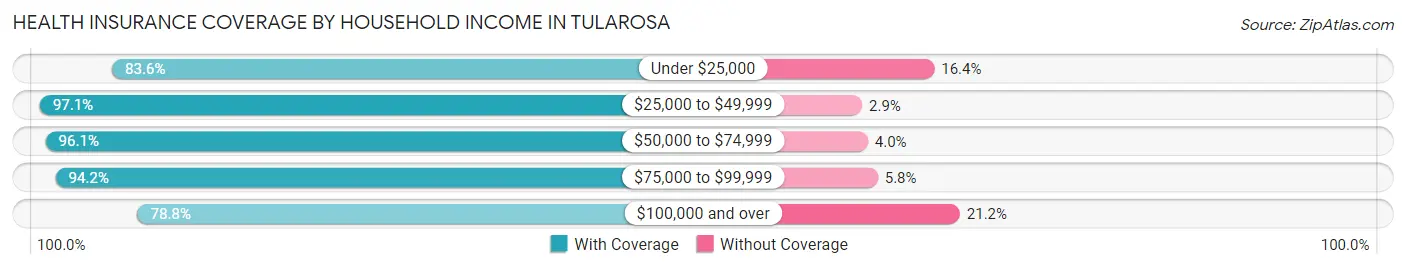
| Household Income | With Coverage | Without Coverage |
| Under $25,000 | 260 (83.6%) | 51 (16.4%) |
| $25,000 to $49,999 | 1,048 (97.1%) | 31 (2.9%) |
| $50,000 to $74,999 | 243 (96.1%) | 10 (4.0%) |
| $75,000 to $99,999 | 325 (94.2%) | 20 (5.8%) |
| $100,000 and over | 469 (78.8%) | 126 (21.2%) |
Public vs Private Health Insurance Coverage by Age in Tularosa
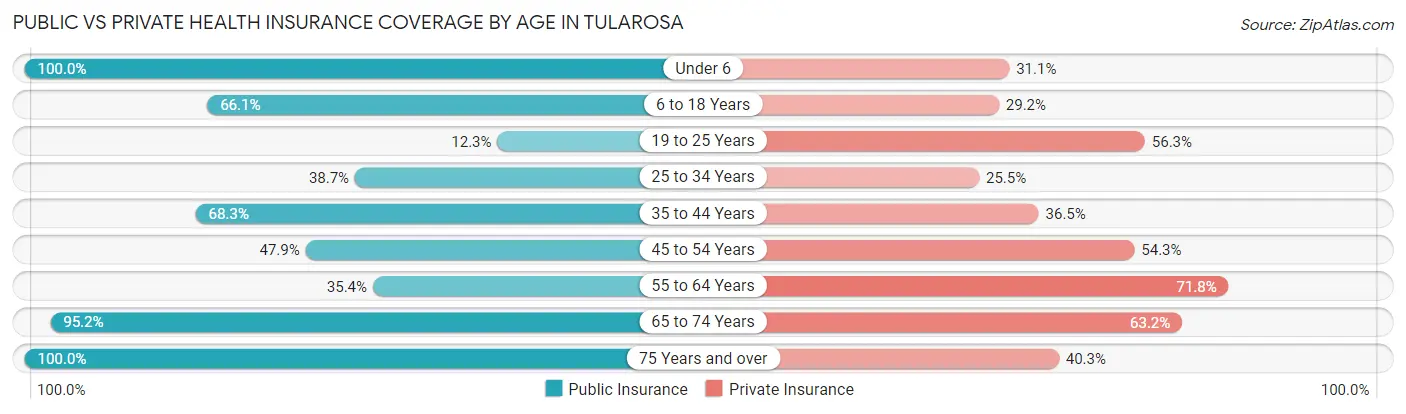
| Age Bracket | Public Insurance | Private Insurance |
| Under 6 | 222 (100.0%) | 69 (31.1%) |
| 6 to 18 Years | 458 (66.1%) | 202 (29.1%) |
| 19 to 25 Years | 49 (12.2%) | 225 (56.2%) |
| 25 to 34 Years | 41 (38.7%) | 27 (25.5%) |
| 35 to 44 Years | 185 (68.3%) | 99 (36.5%) |
| 45 to 54 Years | 89 (47.8%) | 101 (54.3%) |
| 55 to 64 Years | 99 (35.4%) | 201 (71.8%) |
| 65 to 74 Years | 199 (95.2%) | 132 (63.2%) |
| 75 Years and over | 216 (100.0%) | 87 (40.3%) |
| Total | 1,558 (60.3%) | 1,143 (44.3%) |
Disability Status by Sex by Age in Tularosa
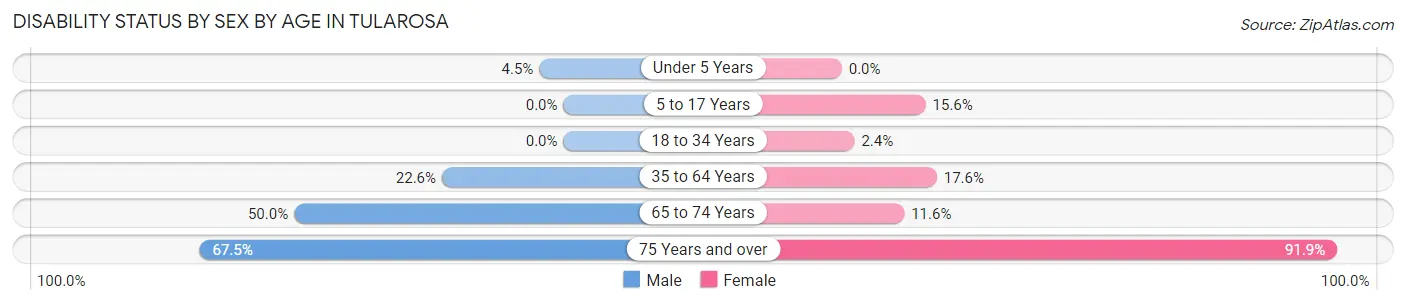
| Age Bracket | Male | Female |
| Under 5 Years | 4 (4.5%) | 0 (0.0%) |
| 5 to 17 Years | 0 (0.0%) | 63 (15.6%) |
| 18 to 34 Years | 0 (0.0%) | 10 (2.4%) |
| 35 to 64 Years | 69 (22.6%) | 76 (17.6%) |
| 65 to 74 Years | 70 (50.0%) | 8 (11.6%) |
| 75 Years and over | 79 (67.5%) | 91 (91.9%) |
Disability Class by Sex by Age in Tularosa
Disability Class: Hearing Difficulty
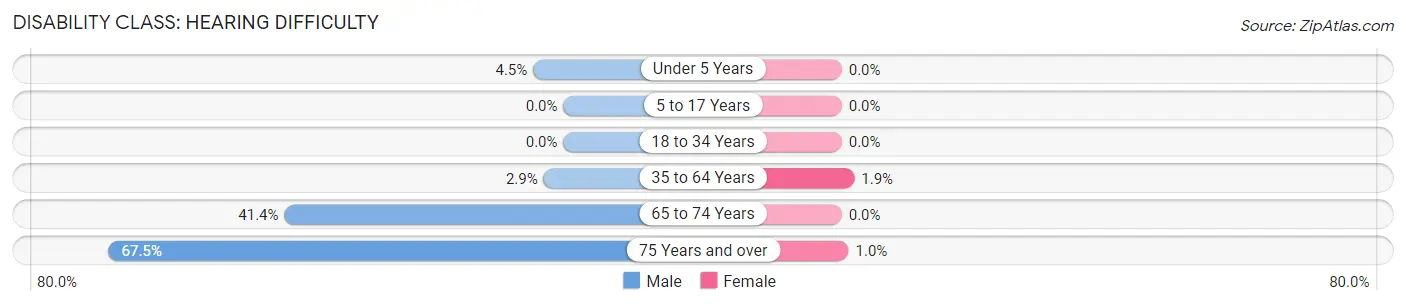
| Age Bracket | Male | Female |
| Under 5 Years | 4 (4.5%) | 0 (0.0%) |
| 5 to 17 Years | 0 (0.0%) | 0 (0.0%) |
| 18 to 34 Years | 0 (0.0%) | 0 (0.0%) |
| 35 to 64 Years | 9 (2.9%) | 8 (1.9%) |
| 65 to 74 Years | 58 (41.4%) | 0 (0.0%) |
| 75 Years and over | 79 (67.5%) | 1 (1.0%) |
Disability Class: Vision Difficulty
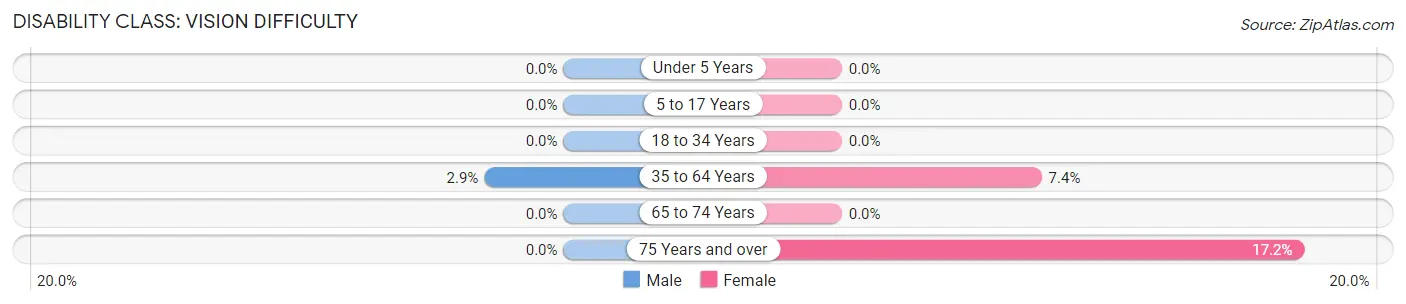
| Age Bracket | Male | Female |
| Under 5 Years | 0 (0.0%) | 0 (0.0%) |
| 5 to 17 Years | 0 (0.0%) | 0 (0.0%) |
| 18 to 34 Years | 0 (0.0%) | 0 (0.0%) |
| 35 to 64 Years | 9 (2.9%) | 32 (7.4%) |
| 65 to 74 Years | 0 (0.0%) | 0 (0.0%) |
| 75 Years and over | 0 (0.0%) | 17 (17.2%) |
Disability Class: Cognitive Difficulty
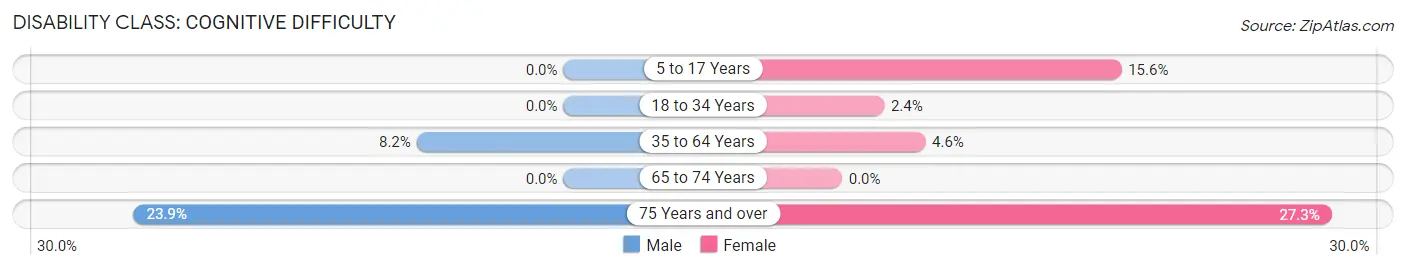
| Age Bracket | Male | Female |
| 5 to 17 Years | 0 (0.0%) | 63 (15.6%) |
| 18 to 34 Years | 0 (0.0%) | 10 (2.4%) |
| 35 to 64 Years | 25 (8.2%) | 20 (4.6%) |
| 65 to 74 Years | 0 (0.0%) | 0 (0.0%) |
| 75 Years and over | 28 (23.9%) | 27 (27.3%) |
Disability Class: Ambulatory Difficulty
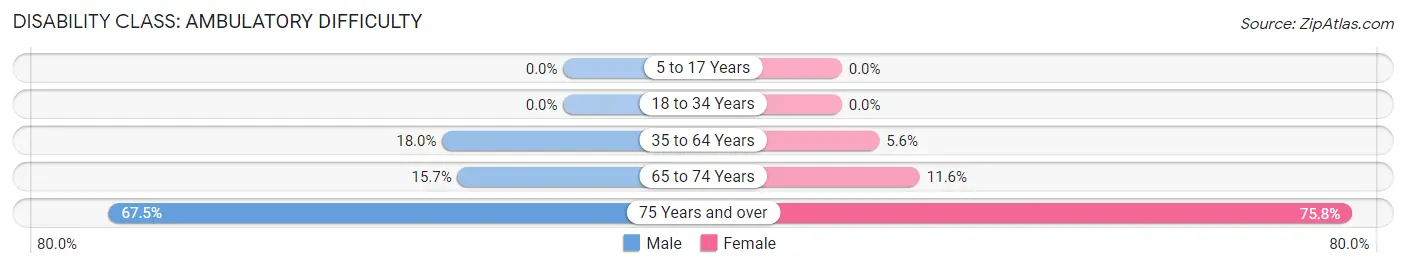
| Age Bracket | Male | Female |
| 5 to 17 Years | 0 (0.0%) | 0 (0.0%) |
| 18 to 34 Years | 0 (0.0%) | 0 (0.0%) |
| 35 to 64 Years | 55 (18.0%) | 24 (5.6%) |
| 65 to 74 Years | 22 (15.7%) | 8 (11.6%) |
| 75 Years and over | 79 (67.5%) | 75 (75.8%) |
Disability Class: Self-Care Difficulty
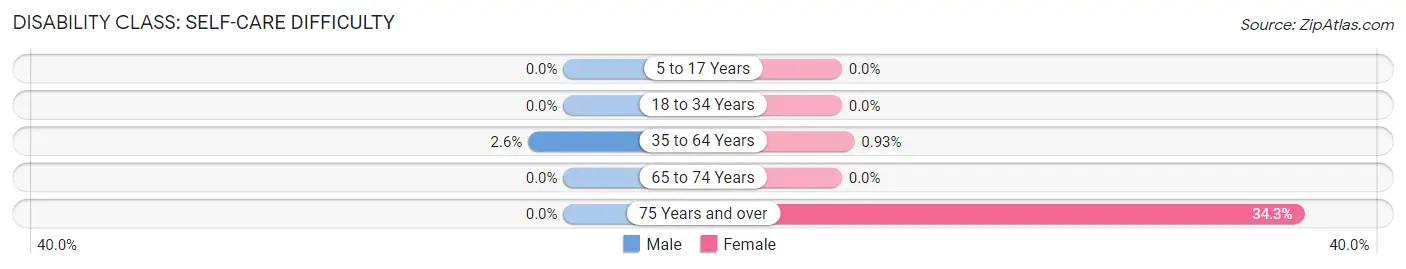
| Age Bracket | Male | Female |
| 5 to 17 Years | 0 (0.0%) | 0 (0.0%) |
| 18 to 34 Years | 0 (0.0%) | 0 (0.0%) |
| 35 to 64 Years | 8 (2.6%) | 4 (0.9%) |
| 65 to 74 Years | 0 (0.0%) | 0 (0.0%) |
| 75 Years and over | 0 (0.0%) | 34 (34.3%) |
Technology Access in Tularosa
Computing Device Access in Tularosa
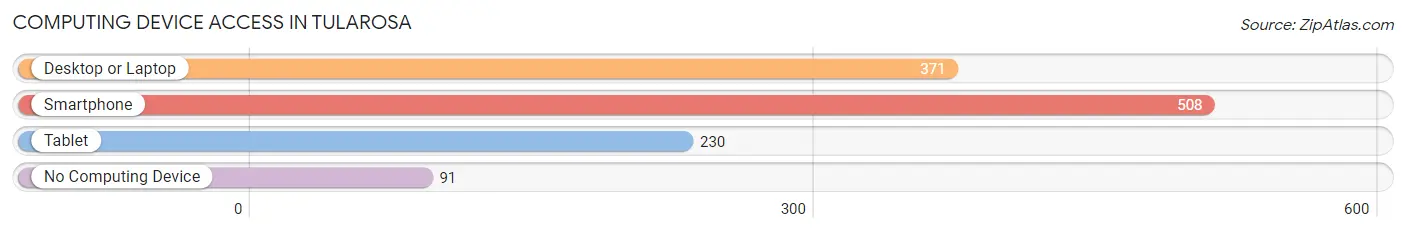
| Device Type | # Households | % Households |
| Desktop or Laptop | 371 | 59.7% |
| Smartphone | 508 | 81.7% |
| Tablet | 230 | 37.0% |
| No Computing Device | 91 | 14.6% |
| Total | 622 | 100.0% |
Internet Access in Tularosa
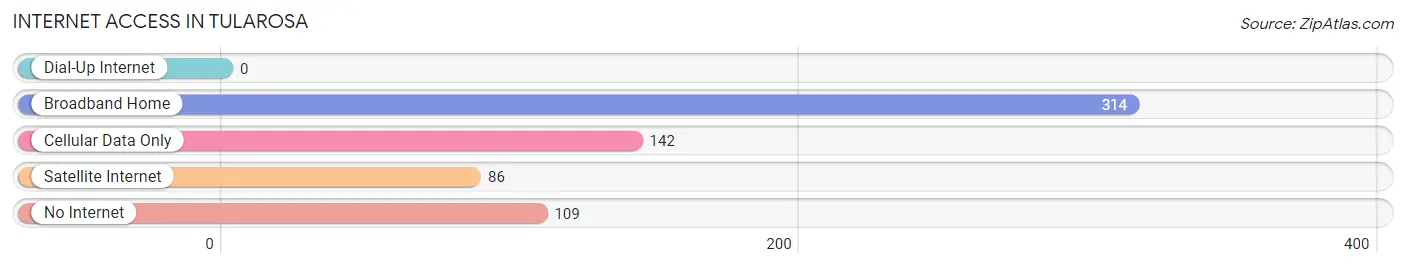
| Internet Type | # Households | % Households |
| Dial-Up Internet | 0 | 0.0% |
| Broadband Home | 314 | 50.5% |
| Cellular Data Only | 142 | 22.8% |
| Satellite Internet | 86 | 13.8% |
| No Internet | 109 | 17.5% |
| Total | 622 | 100.0% |
Tularosa Summary
Tularosa is a small town located in Otero County, New Mexico. It is situated in the Tularosa Basin, a large desert valley surrounded by the Sacramento Mountains to the east and the San Andres Mountains to the west. The town is located approximately 45 miles north of Alamogordo and 60 miles south of Roswell. The population of Tularosa was 1,843 as of the 2010 census.
History
Tularosa was founded in 1883 by a group of settlers from Texas. The town was named after the Tularosa River, which flows through the area. The town was originally a farming and ranching community, but it soon became a popular stop for travelers on the Southern Pacific Railroad. In the early 1900s, the town began to grow and develop, and by the 1920s it had become a popular tourist destination.
In the 1940s, the town was chosen as the site of the White Sands Missile Range, a military testing facility. This brought a large influx of military personnel to the area, and the population of Tularosa grew significantly. The town also became a popular destination for tourists, who came to visit the nearby White Sands National Monument.
Geography
Tularosa is located in the Tularosa Basin, a large desert valley surrounded by the Sacramento Mountains to the east and the San Andres Mountains to the west. The town is situated at an elevation of 4,400 feet above sea level. The climate in Tularosa is semi-arid, with hot summers and mild winters. The average annual precipitation is 8.5 inches.
Economy
The economy of Tularosa is largely based on tourism and the military. The White Sands Missile Range is the largest employer in the area, and it provides jobs for many of the town’s residents. Tourism is also an important part of the local economy, as visitors come to the area to visit the nearby White Sands National Monument. Other industries in the area include agriculture, ranching, and retail.
Demographics
As of the 2010 census, the population of Tularosa was 1,843. The racial makeup of the town was 79.3% White, 0.7% African American, 1.2% Native American, 0.2% Asian, 0.1% Pacific Islander, 16.2% from other races, and 2.5% from two or more races. Hispanic or Latino of any race were 44.2% of the population.
The median household income in Tularosa was $30,938, and the median family income was $35,938. The per capita income was $15,938. About 18.2% of the population was below the poverty line.
Tularosa is a small town with a rich history and a diverse population. It is a popular tourist destination, and it is home to the White Sands Missile Range, which provides jobs for many of the town’s residents. The town has a semi-arid climate and a strong economy based on tourism and the military.
Common Questions
What is Per Capita Income in Tularosa?
Per Capita income in Tularosa is $20,440.
What is the Median Family Income in Tularosa?
Median Family Income in Tularosa is $49,688.
What is the Median Household income in Tularosa?
Median Household Income in Tularosa is $47,234.
What is Income or Wage Gap in Tularosa?
Income or Wage Gap in Tularosa is 34.3%.
Women in Tularosa earn 65.7 cents for every dollar earned by a man.
What is Inequality or Gini Index in Tularosa?
Inequality or Gini Index in Tularosa is 0.52.
What is the Total Population of Tularosa?
Total Population of Tularosa is 2,590.
What is the Total Male Population of Tularosa?
Total Male Population of Tularosa is 1,157.
What is the Total Female Population of Tularosa?
Total Female Population of Tularosa is 1,433.
What is the Ratio of Males per 100 Females in Tularosa?
There are 80.74 Males per 100 Females in Tularosa.
What is the Ratio of Females per 100 Males in Tularosa?
There are 123.85 Females per 100 Males in Tularosa.
What is the Median Population Age in Tularosa?
Median Population Age in Tularosa is 25.9 Years.
What is the Average Family Size in Tularosa
Average Family Size in Tularosa is 5.4 People.
What is the Average Household Size in Tularosa
Average Household Size in Tularosa is 4.2 People.
How Large is the Labor Force in Tularosa?
There are 863 People in the Labor Forcein in Tularosa.
What is the Percentage of People in the Labor Force in Tularosa?
47.9% of People are in the Labor Force in Tularosa.
What is the Unemployment Rate in Tularosa?
Unemployment Rate in Tularosa is 21.3%.