La Puebla, NM Map & Demographics
La Puebla Map
La Puebla Overview
$31,832
PER CAPITA INCOME
$60,110
AVG FAMILY INCOME
$68,393
AVG HOUSEHOLD INCOME
0.43
INEQUALITY / GINI INDEX
1,036
TOTAL POPULATION
536
MALE POPULATION
500
FEMALE POPULATION
107.20
MALES / 100 FEMALES
93.28
FEMALES / 100 MALES
42.2
MEDIAN AGE
3.2
AVG FAMILY SIZE
3.3
AVG HOUSEHOLD SIZE
451
LABOR FORCE [ PEOPLE ]
57.4%
PERCENT IN LABOR FORCE
18.2%
UNEMPLOYMENT RATE
Income in La Puebla
Income Overview in La Puebla
Per Capita Income in La Puebla is $31,832, while median incomes of families and households are $60,110 and $68,393 respectively.
| Characteristic | Number | Measure |
| Per Capita Income | 1,036 | $31,832 |
| Median Family Income | 317 | $60,110 |
| Mean Family Income | 317 | $85,862 |
| Median Household Income | 317 | $68,393 |
| Mean Household Income | 317 | $99,676 |
| Income Deficit | 317 | $0 |
| Wage / Income Gap (%) | 1,036 | 0.00% |
| Wage / Income Gap ($) | 1,036 | 100.00¢ per $1 |
| Gini / Inequality Index | 1,036 | 0.43 |
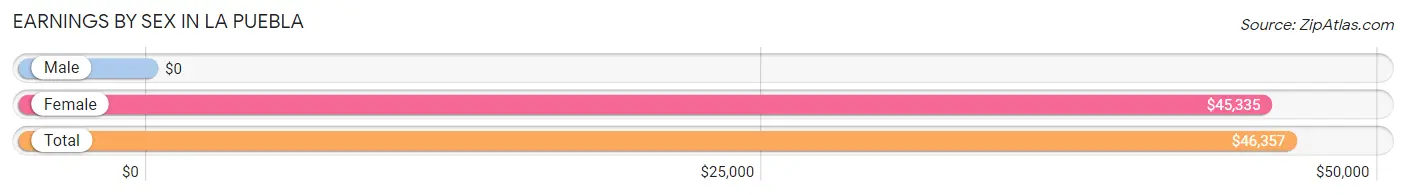
Earnings by Sex in La Puebla
| Sex | Number | Average Earnings |
| Male | 227 (48.6%) | $0 |
| Female | 240 (51.4%) | $45,335 |
| Total | 467 (100.0%) | $46,357 |
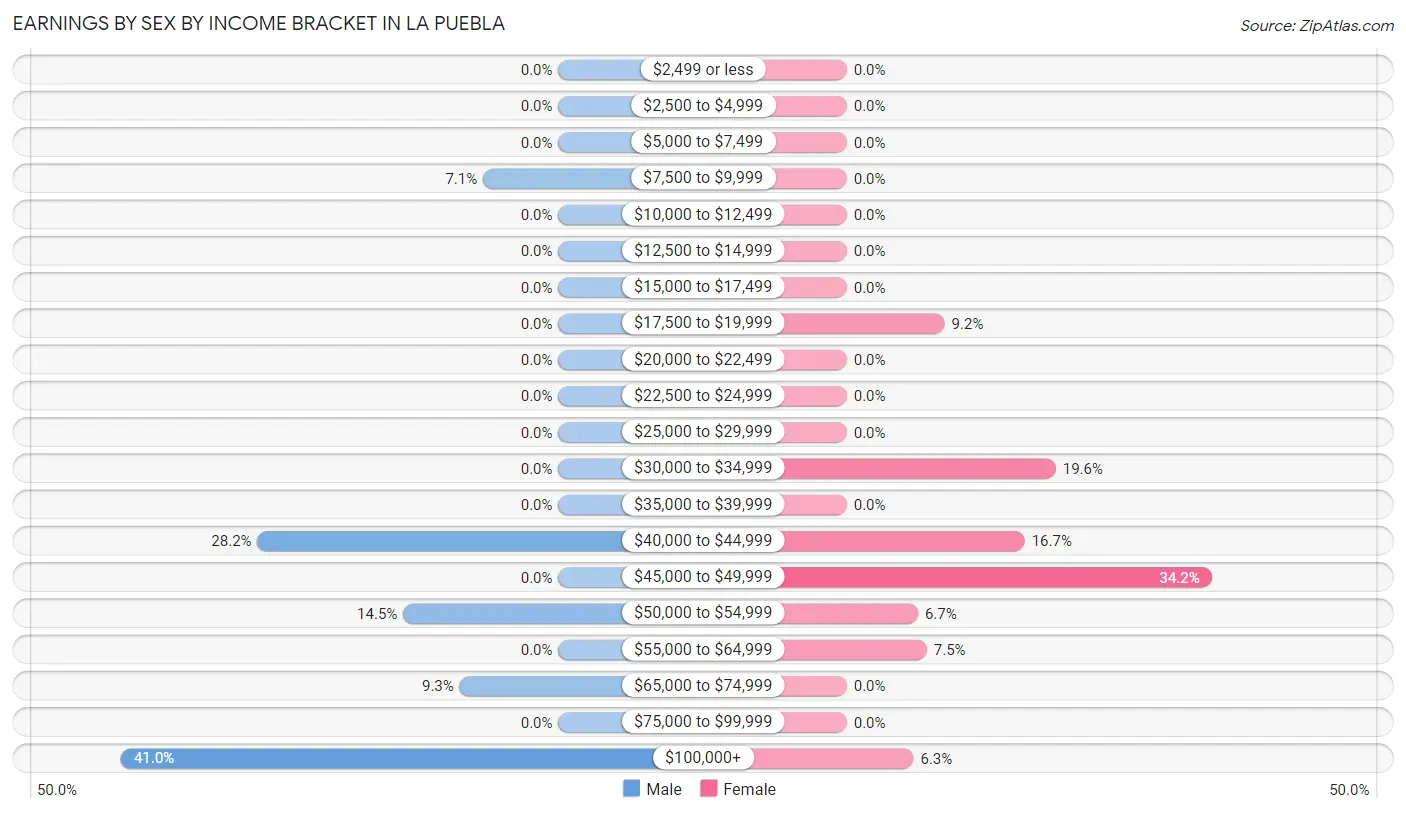
Earnings by Sex by Income Bracket in La Puebla
The most common earnings brackets in La Puebla are $100,000+ for men (93 | 41.0%) and $45,000 to $49,999 for women (82 | 34.2%).
| Income | Male | Female |
| $2,499 or less | 0 (0.0%) | 0 (0.0%) |
| $2,500 to $4,999 | 0 (0.0%) | 0 (0.0%) |
| $5,000 to $7,499 | 0 (0.0%) | 0 (0.0%) |
| $7,500 to $9,999 | 16 (7.0%) | 0 (0.0%) |
| $10,000 to $12,499 | 0 (0.0%) | 0 (0.0%) |
| $12,500 to $14,999 | 0 (0.0%) | 0 (0.0%) |
| $15,000 to $17,499 | 0 (0.0%) | 0 (0.0%) |
| $17,500 to $19,999 | 0 (0.0%) | 22 (9.2%) |
| $20,000 to $22,499 | 0 (0.0%) | 0 (0.0%) |
| $22,500 to $24,999 | 0 (0.0%) | 0 (0.0%) |
| $25,000 to $29,999 | 0 (0.0%) | 0 (0.0%) |
| $30,000 to $34,999 | 0 (0.0%) | 47 (19.6%) |
| $35,000 to $39,999 | 0 (0.0%) | 0 (0.0%) |
| $40,000 to $44,999 | 64 (28.2%) | 40 (16.7%) |
| $45,000 to $49,999 | 0 (0.0%) | 82 (34.2%) |
| $50,000 to $54,999 | 33 (14.5%) | 16 (6.7%) |
| $55,000 to $64,999 | 0 (0.0%) | 18 (7.5%) |
| $65,000 to $74,999 | 21 (9.2%) | 0 (0.0%) |
| $75,000 to $99,999 | 0 (0.0%) | 0 (0.0%) |
| $100,000+ | 93 (41.0%) | 15 (6.2%) |
| Total | 227 (100.0%) | 240 (100.0%) |
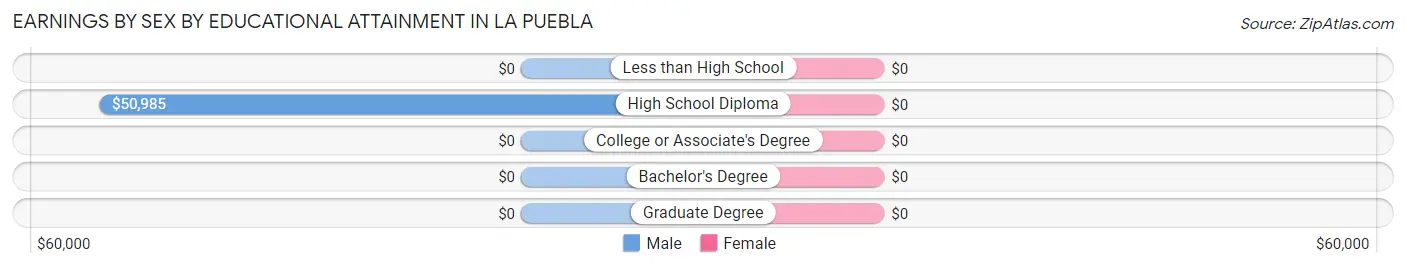
Earnings by Sex by Educational Attainment in La Puebla
| Educational Attainment | Male Income | Female Income |
| Less than High School | - | - |
| High School Diploma | $50,985 | $0 |
| College or Associate's Degree | - | - |
| Bachelor's Degree | - | - |
| Graduate Degree | - | - |
| Total | $51,212 | $45,335 |
Family Income in La Puebla
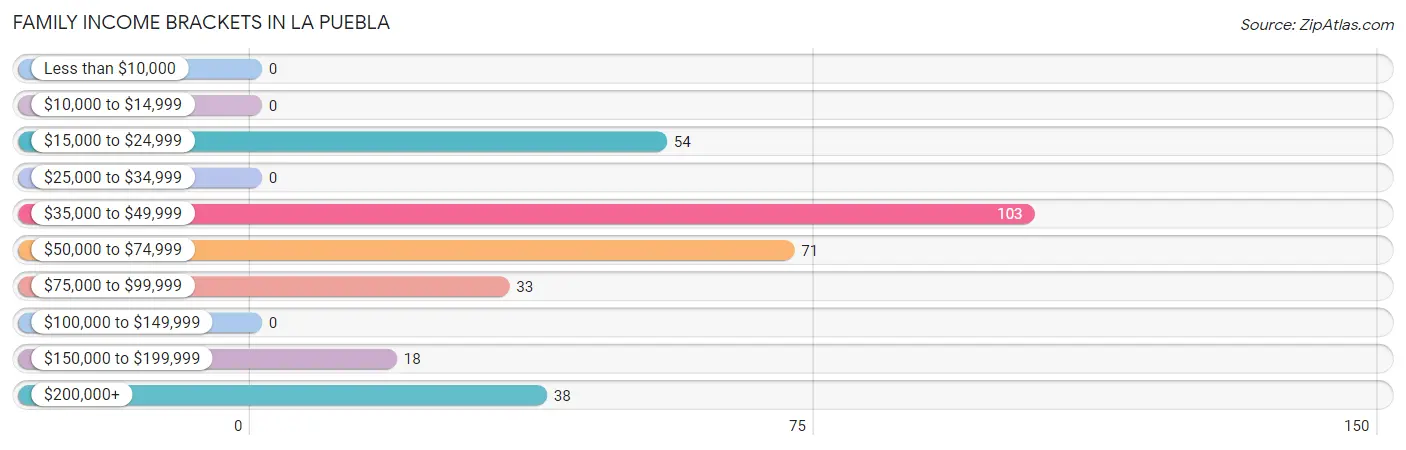
Family Income Brackets in La Puebla
According to the La Puebla family income data, there are 103 families falling into the $35,000 to $49,999 income range, which is the most common income bracket and makes up 32.5% of all families.
| Income Bracket | # Families | % Families |
| Less than $10,000 | 0 | 0.0% |
| $10,000 to $14,999 | 0 | 0.0% |
| $15,000 to $24,999 | 54 | 17.0% |
| $25,000 to $34,999 | 0 | 0.0% |
| $35,000 to $49,999 | 103 | 32.5% |
| $50,000 to $74,999 | 71 | 22.4% |
| $75,000 to $99,999 | 33 | 10.4% |
| $100,000 to $149,999 | 0 | 0.0% |
| $150,000 to $199,999 | 18 | 5.7% |
| $200,000+ | 38 | 12.0% |
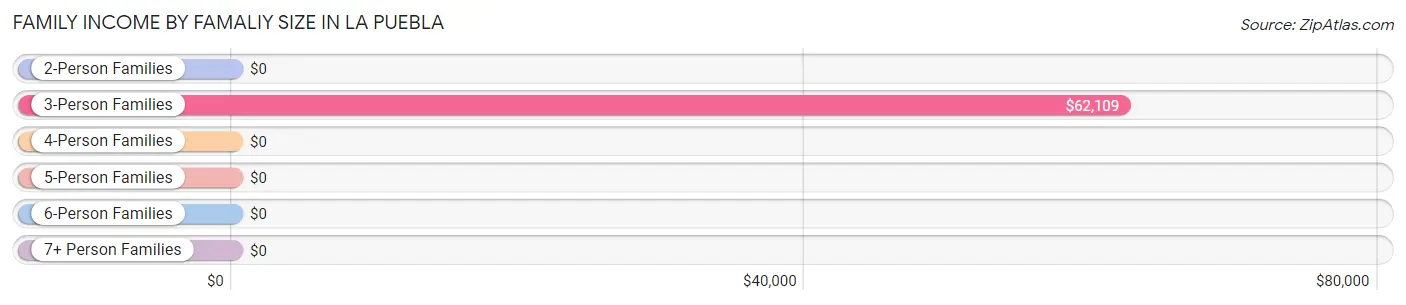
Family Income by Famaliy Size in La Puebla
3-person families (153 | 48.3%) account for the highest median family income in La Puebla with $62,109 per family, while 3-person families (153 | 48.3%) have the highest median income of $20,703 per family member.
| Income Bracket | # Families | Median Income |
| 2-Person Families | 130 (41.0%) | $0 |
| 3-Person Families | 153 (48.3%) | $62,109 |
| 4-Person Families | 34 (10.7%) | $0 |
| 5-Person Families | 0 (0.0%) | $0 |
| 6-Person Families | 0 (0.0%) | $0 |
| 7+ Person Families | 0 (0.0%) | $0 |
| Total | 317 (100.0%) | $60,110 |
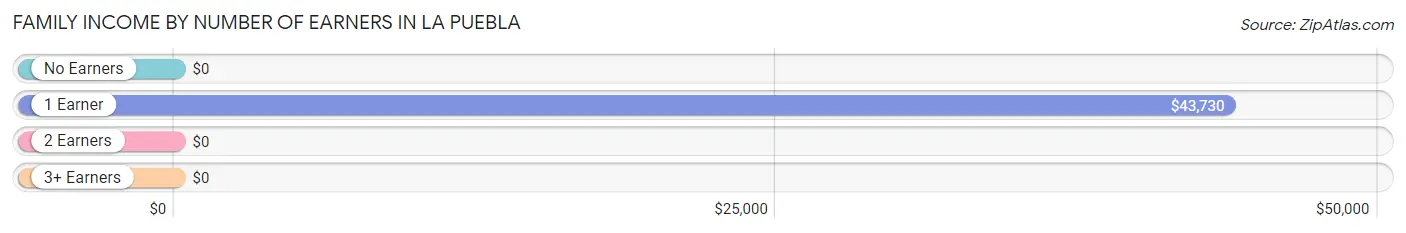
Family Income by Number of Earners in La Puebla
| Number of Earners | # Families | Median Income |
| No Earners | 54 (17.0%) | $0 |
| 1 Earner | 142 (44.8%) | $43,730 |
| 2 Earners | 121 (38.2%) | $0 |
| 3+ Earners | 0 (0.0%) | $0 |
| Total | 317 (100.0%) | $60,110 |
Household Income in La Puebla
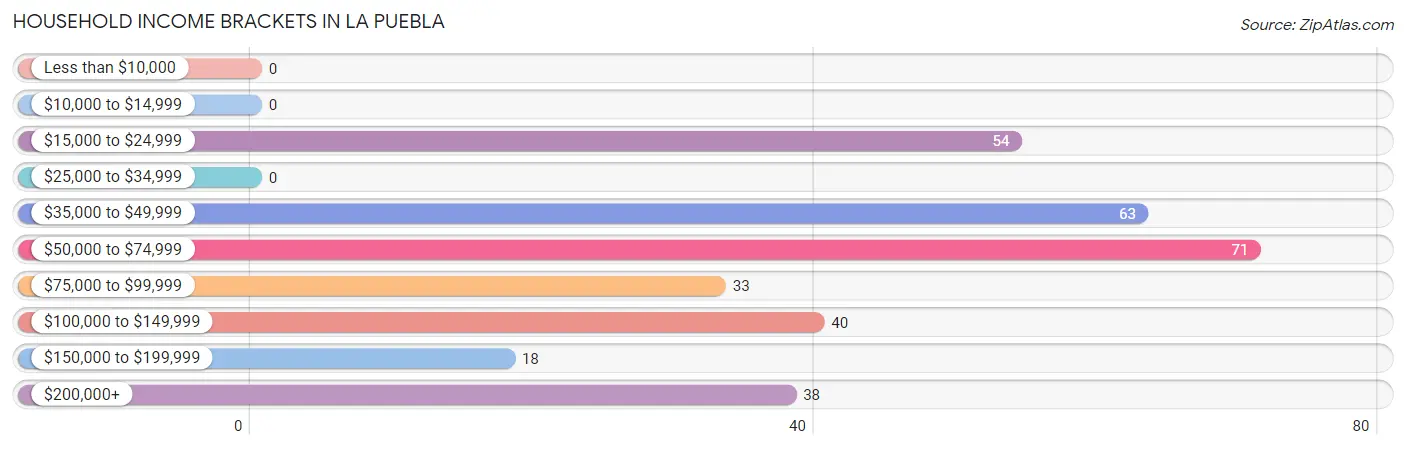
Household Income Brackets in La Puebla
With 71 households falling in the category, the $50,000 to $74,999 income range is the most frequent in La Puebla, accounting for 22.4% of all households.
| Income Bracket | # Households | % Households |
| Less than $10,000 | 0 | 0.0% |
| $10,000 to $14,999 | 0 | 0.0% |
| $15,000 to $24,999 | 54 | 17.0% |
| $25,000 to $34,999 | 0 | 0.0% |
| $35,000 to $49,999 | 63 | 19.9% |
| $50,000 to $74,999 | 71 | 22.4% |
| $75,000 to $99,999 | 33 | 10.4% |
| $100,000 to $149,999 | 40 | 12.6% |
| $150,000 to $199,999 | 18 | 5.7% |
| $200,000+ | 38 | 12.0% |
Household Income by Householder Age in La Puebla
| Income Bracket | # Households | Median Income |
| 15 to 24 Years | 0 (0.0%) | $0 |
| 25 to 44 Years | 56 (17.7%) | $0 |
| 45 to 64 Years | 140 (44.2%) | $0 |
| 65+ Years | 121 (38.2%) | $0 |
| Total | 317 (100.0%) | $68,393 |
Poverty in La Puebla
Income Below Poverty by Sex and Age in La Puebla
| Age Bracket | Male | Female |
| Under 5 Years | 0 (0.0%) | 0 (0.0%) |
| 5 Years | 0 (0.0%) | 0 (0.0%) |
| 6 to 11 Years | 0 (0.0%) | 0 (0.0%) |
| 12 to 14 Years | 0 (0.0%) | 0 (0.0%) |
| 15 Years | 0 (0.0%) | 0 (0.0%) |
| 16 and 17 Years | 0 (0.0%) | 0 (0.0%) |
| 18 to 24 Years | 0 (0.0%) | 0 (0.0%) |
| 25 to 34 Years | 0 (0.0%) | 0 (0.0%) |
| 35 to 44 Years | 0 (0.0%) | 0 (0.0%) |
| 45 to 54 Years | 0 (0.0%) | 0 (0.0%) |
| 55 to 64 Years | 0 (0.0%) | 0 (0.0%) |
| 65 to 74 Years | 0 (0.0%) | 0 (0.0%) |
| 75 Years and over | 0 (0.0%) | 0 (0.0%) |
| Total | 0 (0.0%) | 0 (0.0%) |
Income Above Poverty by Sex and Age in La Puebla
According to the poverty statistics in La Puebla, males aged under 5 years and females aged under 5 years are the age groups that are most secure financially, with 100.0% of males and 100.0% of females in these age groups living above the poverty line.
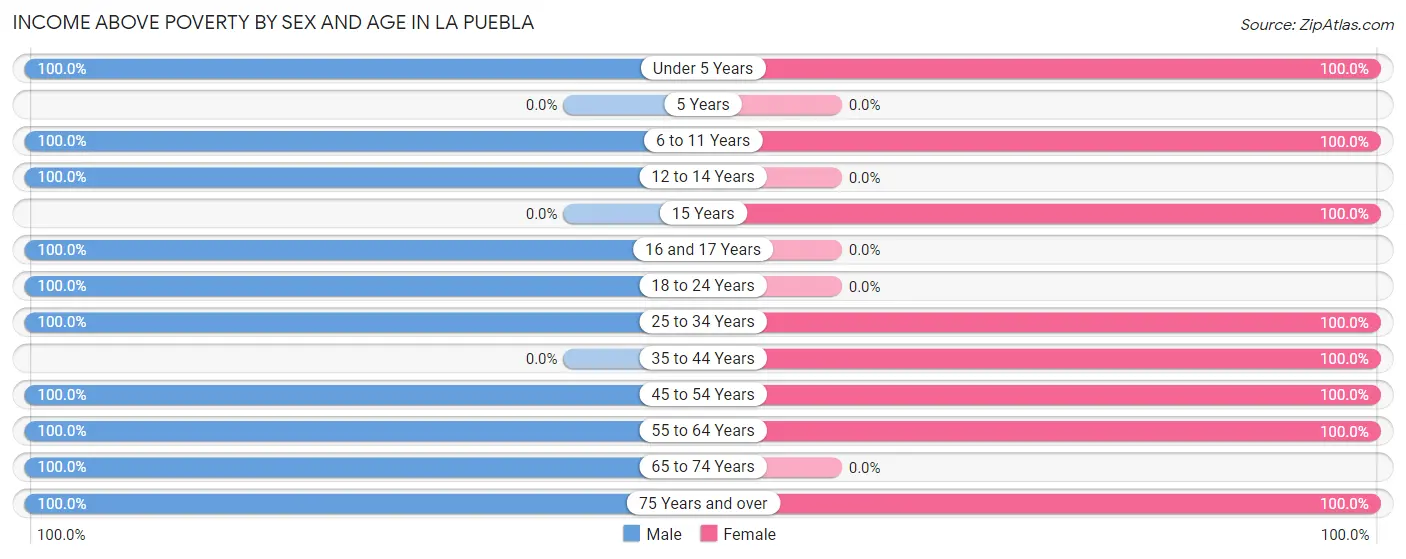
| Age Bracket | Male | Female |
| Under 5 Years | 19 (100.0%) | 29 (100.0%) |
| 5 Years | 0 (0.0%) | 0 (0.0%) |
| 6 to 11 Years | 146 (100.0%) | 19 (100.0%) |
| 12 to 14 Years | 18 (100.0%) | 0 (0.0%) |
| 15 Years | 0 (0.0%) | 19 (100.0%) |
| 16 and 17 Years | 16 (100.0%) | 0 (0.0%) |
| 18 to 24 Years | 84 (100.0%) | 0 (0.0%) |
| 25 to 34 Years | 16 (100.0%) | 132 (100.0%) |
| 35 to 44 Years | 0 (0.0%) | 82 (100.0%) |
| 45 to 54 Years | 59 (100.0%) | 116 (100.0%) |
| 55 to 64 Years | 68 (100.0%) | 49 (100.0%) |
| 65 to 74 Years | 67 (100.0%) | 0 (0.0%) |
| 75 Years and over | 43 (100.0%) | 54 (100.0%) |
| Total | 536 (100.0%) | 500 (100.0%) |
Income Below Poverty Among Married-Couple Families in La Puebla
| Children | Above Poverty | Below Poverty |
| No Children | 186 (100.0%) | 0 (0.0%) |
| 1 or 2 Children | 52 (100.0%) | 0 (0.0%) |
| 3 or 4 Children | 0 (0.0%) | 0 (0.0%) |
| 5 or more Children | 0 (0.0%) | 0 (0.0%) |
| Total | 238 (100.0%) | 0 (0.0%) |
Income Below Poverty Among Single-Parent Households in La Puebla
| Children | Single Father | Single Mother |
| No Children | 0 (0.0%) | 0 (0.0%) |
| 1 or 2 Children | 0 (0.0%) | 0 (0.0%) |
| 3 or 4 Children | 0 (0.0%) | 0 (0.0%) |
| 5 or more Children | 0 (0.0%) | 0 (0.0%) |
| Total | 0 (0.0%) | 0 (0.0%) |
Income Below Poverty Among Married-Couple vs Single-Parent Households in La Puebla
| Children | Married-Couple Families | Single-Parent Households |
| No Children | 0 (0.0%) | 0 (0.0%) |
| 1 or 2 Children | 0 (0.0%) | 0 (0.0%) |
| 3 or 4 Children | 0 (0.0%) | 0 (0.0%) |
| 5 or more Children | 0 (0.0%) | 0 (0.0%) |
| Total | 0 (0.0%) | 0 (0.0%) |
Race in La Puebla
The most populous races in La Puebla are Hispanic or Latino (891 | 86.0%), White / Caucasian (697 | 67.3%), and Two or more Races (161 | 15.5%).
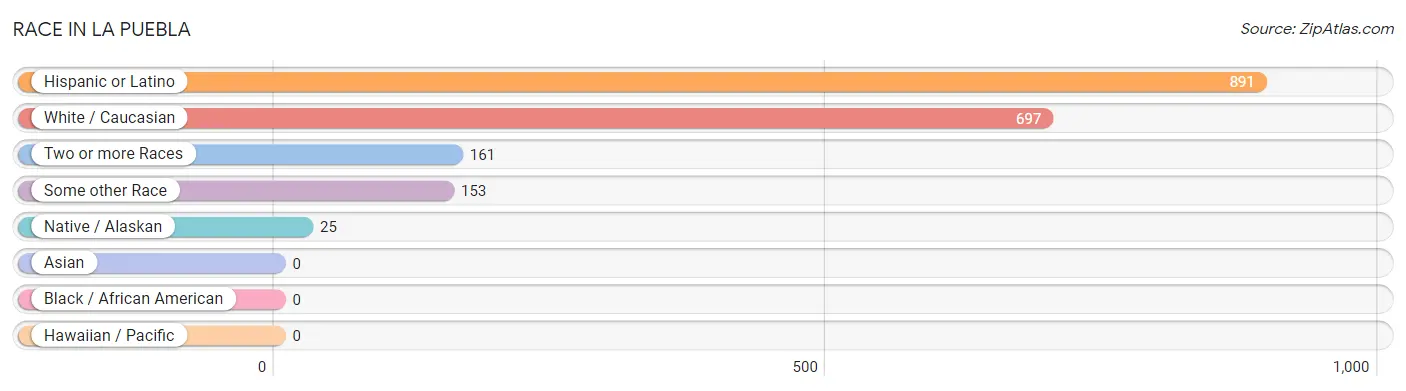
| Race | # Population | % Population |
| Asian | 0 | 0.0% |
| Black / African American | 0 | 0.0% |
| Hawaiian / Pacific | 0 | 0.0% |
| Hispanic or Latino | 891 | 86.0% |
| Native / Alaskan | 25 | 2.4% |
| White / Caucasian | 697 | 67.3% |
| Two or more Races | 161 | 15.5% |
| Some other Race | 153 | 14.8% |
| Total | 1,036 | 100.0% |
Ancestry in La Puebla
The most populous ancestries reported in La Puebla are Spaniard (457 | 44.1%), Mexican (128 | 12.4%), Spanish (97 | 9.4%), Basque (54 | 5.2%), and Scottish (54 | 5.2%), together accounting for 76.3% of all La Puebla residents.
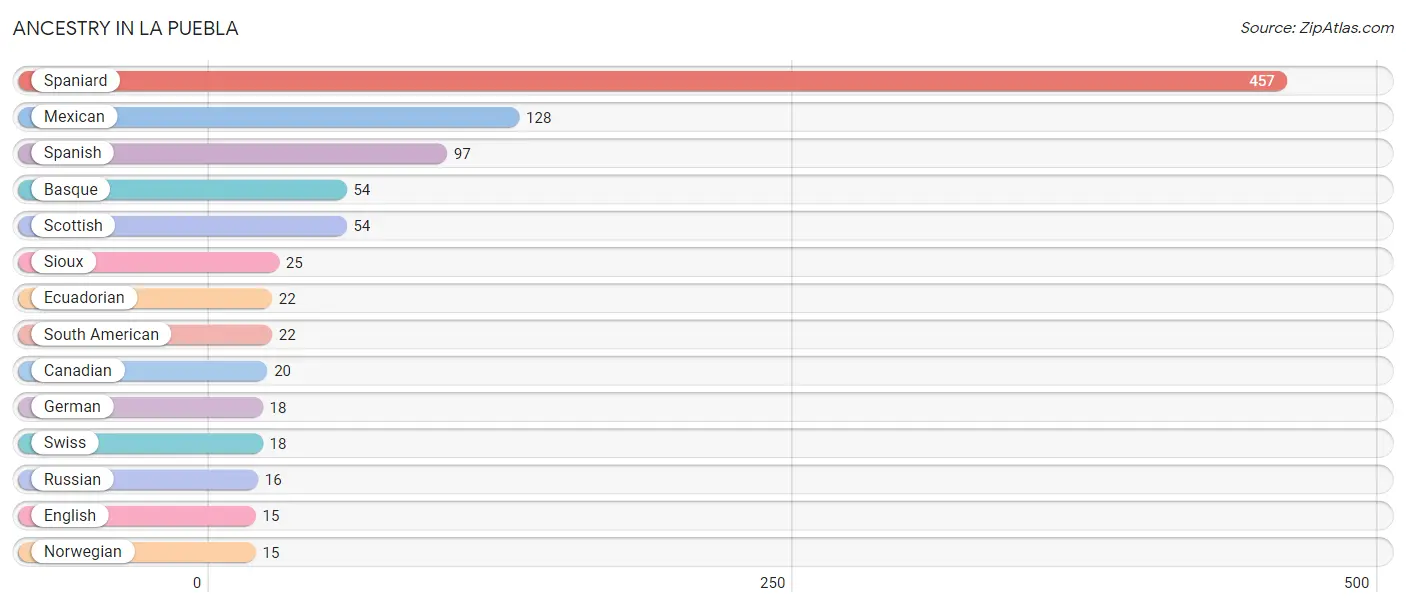
| Ancestry | # Population | % Population |
| Basque | 54 | 5.2% |
| Canadian | 20 | 1.9% |
| Ecuadorian | 22 | 2.1% |
| English | 15 | 1.5% |
| German | 18 | 1.7% |
| Mexican | 128 | 12.4% |
| Norwegian | 15 | 1.5% |
| Russian | 16 | 1.5% |
| Scottish | 54 | 5.2% |
| Sioux | 25 | 2.4% |
| South American | 22 | 2.1% |
| Spaniard | 457 | 44.1% |
| Spanish | 97 | 9.4% |
| Swiss | 18 | 1.7% | View All 14 Rows |
Immigrants in La Puebla
The most numerous immigrant groups reported in La Puebla came from Ecuador (22 | 2.1%), Latin America (22 | 2.1%), South America (22 | 2.1%), and Canada (20 | 1.9%), together accounting for 8.3% of all La Puebla residents.
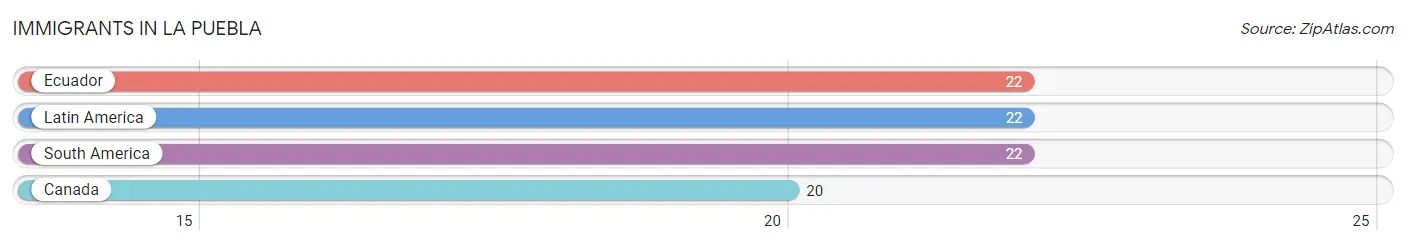
| Immigration Origin | # Population | % Population |
| Canada | 20 | 1.9% |
| Ecuador | 22 | 2.1% |
| Latin America | 22 | 2.1% |
| South America | 22 | 2.1% | View All 4 Rows |
Sex and Age in La Puebla
Sex and Age in La Puebla
The most populous age groups in La Puebla are 5 to 9 Years (146 | 27.2%) for men and 25 to 29 Years (132 | 26.4%) for women.
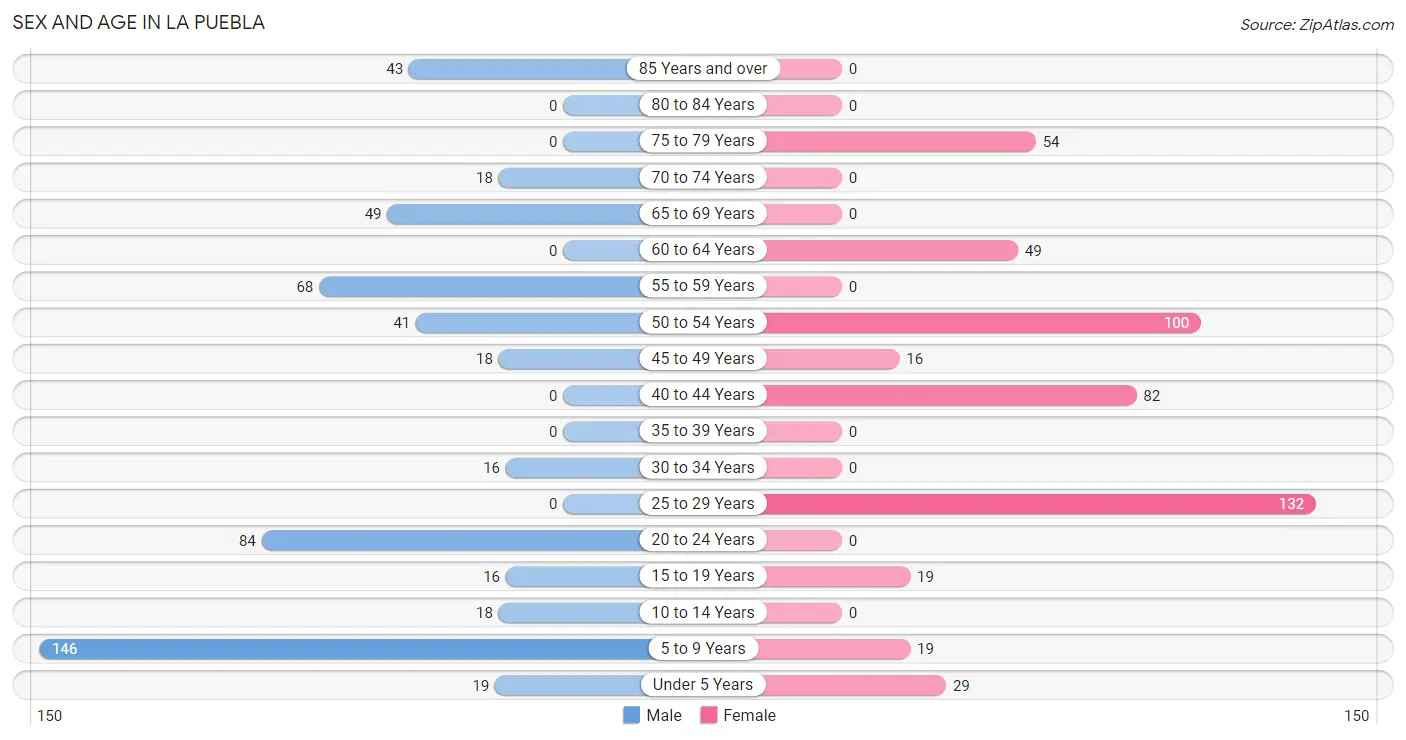
| Age Bracket | Male | Female |
| Under 5 Years | 19 (3.5%) | 29 (5.8%) |
| 5 to 9 Years | 146 (27.2%) | 19 (3.8%) |
| 10 to 14 Years | 18 (3.4%) | 0 (0.0%) |
| 15 to 19 Years | 16 (3.0%) | 19 (3.8%) |
| 20 to 24 Years | 84 (15.7%) | 0 (0.0%) |
| 25 to 29 Years | 0 (0.0%) | 132 (26.4%) |
| 30 to 34 Years | 16 (3.0%) | 0 (0.0%) |
| 35 to 39 Years | 0 (0.0%) | 0 (0.0%) |
| 40 to 44 Years | 0 (0.0%) | 82 (16.4%) |
| 45 to 49 Years | 18 (3.4%) | 16 (3.2%) |
| 50 to 54 Years | 41 (7.6%) | 100 (20.0%) |
| 55 to 59 Years | 68 (12.7%) | 0 (0.0%) |
| 60 to 64 Years | 0 (0.0%) | 49 (9.8%) |
| 65 to 69 Years | 49 (9.1%) | 0 (0.0%) |
| 70 to 74 Years | 18 (3.4%) | 0 (0.0%) |
| 75 to 79 Years | 0 (0.0%) | 54 (10.8%) |
| 80 to 84 Years | 0 (0.0%) | 0 (0.0%) |
| 85 Years and over | 43 (8.0%) | 0 (0.0%) |
| Total | 536 (100.0%) | 500 (100.0%) |
Families and Households in La Puebla
Median Family Size in La Puebla
The median family size in La Puebla is 3.16 persons per family, with single male/father families (39 | 12.3%) accounting for the largest median family size of 7.08 persons per family. On the other hand, single female/mother families (40 | 12.6%) represent the smallest median family size with 1.73 persons per family.
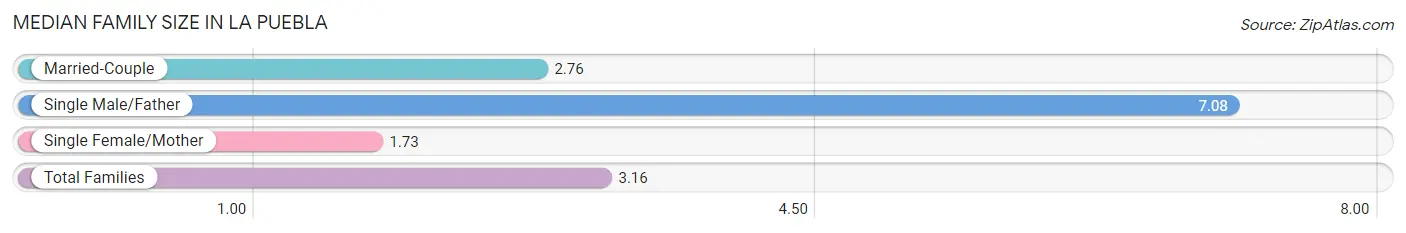
| Family Type | # Families | Family Size |
| Married-Couple | 238 (75.1%) | 2.76 |
| Single Male/Father | 39 (12.3%) | 7.08 |
| Single Female/Mother | 40 (12.6%) | 1.73 |
| Total Families | 317 (100.0%) | 3.16 |
Median Household Size in La Puebla
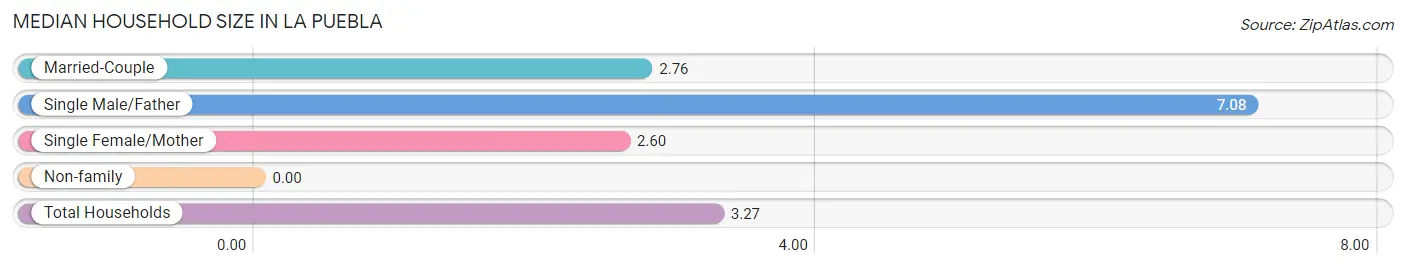
| Household Type | # Households | Household Size |
| Married-Couple | 238 (75.1%) | 2.76 |
| Single Male/Father | 39 (12.3%) | 7.08 |
| Single Female/Mother | 40 (12.6%) | 2.60 |
| Non-family | 0 (0.0%) | - |
| Total Households | 317 (100.0%) | 3.27 |
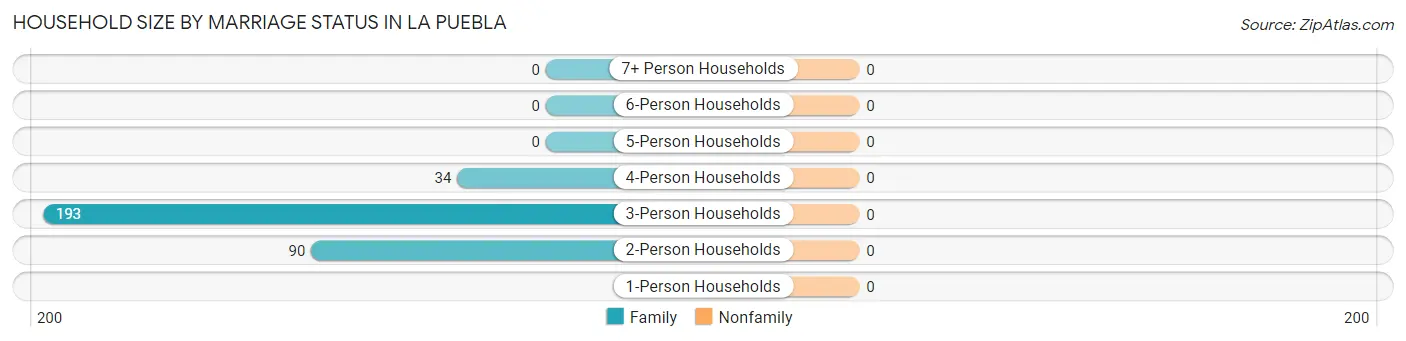
Household Size by Marriage Status in La Puebla
| Household Size | Family Households | Nonfamily Households |
| 1-Person Households | - | 0 (0.0%) |
| 2-Person Households | 90 (28.4%) | 0 (0.0%) |
| 3-Person Households | 193 (60.9%) | 0 (0.0%) |
| 4-Person Households | 34 (10.7%) | 0 (0.0%) |
| 5-Person Households | 0 (0.0%) | 0 (0.0%) |
| 6-Person Households | 0 (0.0%) | 0 (0.0%) |
| 7+ Person Households | 0 (0.0%) | 0 (0.0%) |
| Total | 317 (100.0%) | 0 (0.0%) |
Female Fertility in La Puebla
Fertility by Age in La Puebla
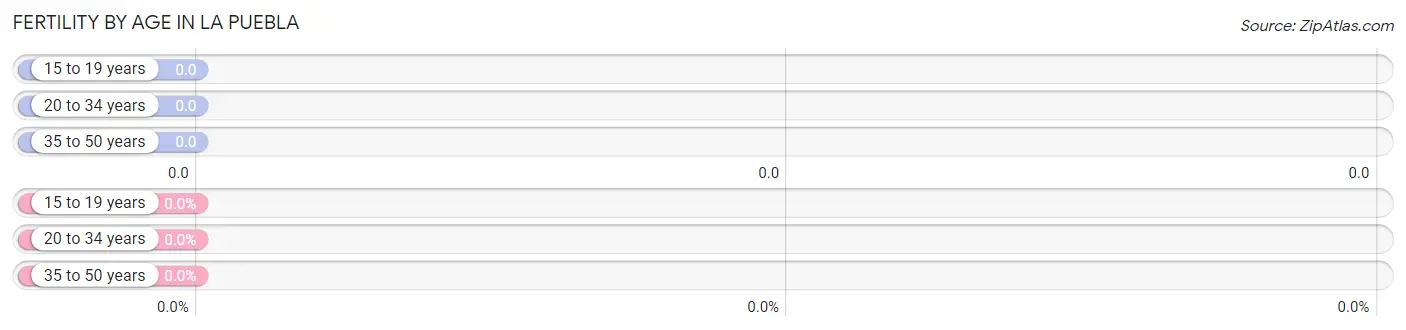
| Age Bracket | Women with Births | Births / 1,000 Women |
| 15 to 19 years | 0 (0.0%) | 0.0 |
| 20 to 34 years | 0 (0.0%) | 0.0 |
| 35 to 50 years | 0 (0.0%) | 0.0 |
| Total | 0 (0.0%) | 0.0 |
Fertility by Age by Marriage Status in La Puebla
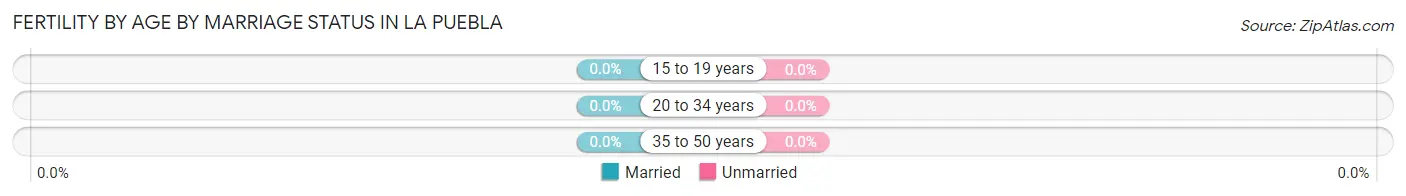
| Age Bracket | Married | Unmarried |
| 15 to 19 years | 0 (0.0%) | 0 (0.0%) |
| 20 to 34 years | 0 (0.0%) | 0 (0.0%) |
| 35 to 50 years | 0 (0.0%) | 0 (0.0%) |
| Total | 0 (0.0%) | 0 (0.0%) |
Fertility by Education in La Puebla
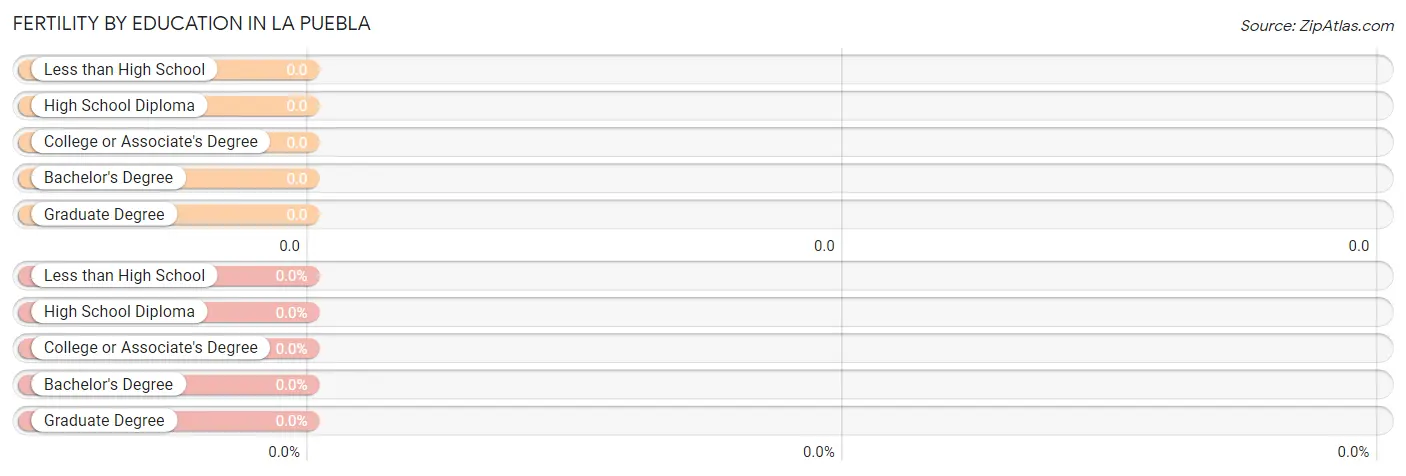
| Educational Attainment | Women with Births | Births / 1,000 Women |
| Less than High School | 0 (0.0%) | 0.0 |
| High School Diploma | 0 (0.0%) | 0.0 |
| College or Associate's Degree | 0 (0.0%) | 0.0 |
| Bachelor's Degree | 0 (0.0%) | 0.0 |
| Graduate Degree | 0 (0.0%) | 0.0 |
| Total | 0 (0.0%) | 0.0 |
Fertility by Education by Marriage Status in La Puebla
| Educational Attainment | Married | Unmarried |
| Less than High School | 0 (0.0%) | 0 (0.0%) |
| High School Diploma | 0 (0.0%) | 0 (0.0%) |
| College or Associate's Degree | 0 (0.0%) | 0 (0.0%) |
| Bachelor's Degree | 0 (0.0%) | 0 (0.0%) |
| Graduate Degree | 0 (0.0%) | 0 (0.0%) |
| Total | 0 (0.0%) | 0 (0.0%) |
Employment Characteristics in La Puebla
Employment by Class of Employer in La Puebla
Among the 369 employed individuals in La Puebla, federal government employees (103 | 27.9%), self-employed (incorporated) (80 | 21.7%), and local government employees (78 | 21.1%) make up the most common classes of employment.
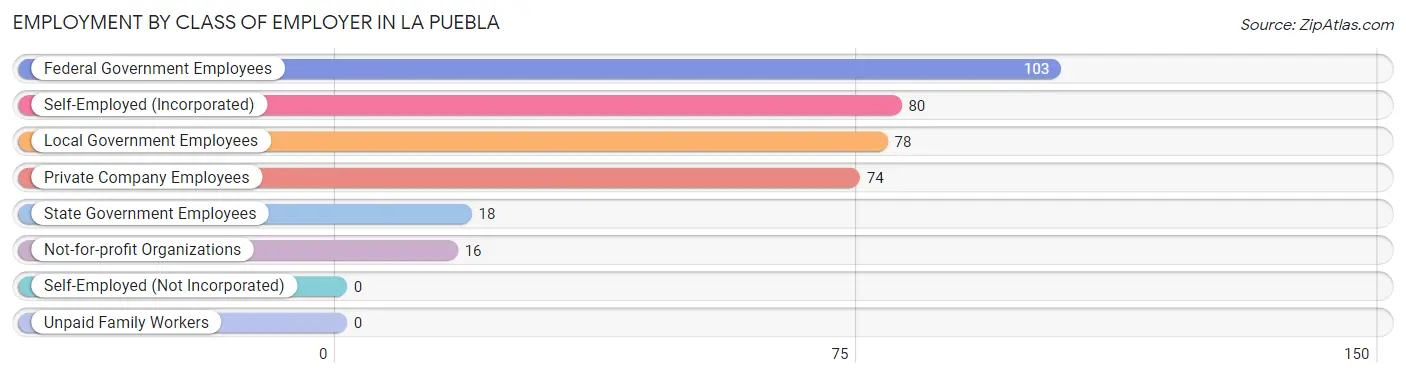
| Employer Class | # Employees | % Employees |
| Private Company Employees | 74 | 20.1% |
| Self-Employed (Incorporated) | 80 | 21.7% |
| Self-Employed (Not Incorporated) | 0 | 0.0% |
| Not-for-profit Organizations | 16 | 4.3% |
| Local Government Employees | 78 | 21.1% |
| State Government Employees | 18 | 4.9% |
| Federal Government Employees | 103 | 27.9% |
| Unpaid Family Workers | 0 | 0.0% |
| Total | 369 | 100.0% |
Employment Status by Age in La Puebla
According to the labor force statistics for La Puebla, out of the total population over 16 years of age (786), 57.4% or 451 individuals are in the labor force, with 18.2% or 82 of them unemployed. The age group with the highest labor force participation rate is 30 to 34 years, with 100.0% or 16 individuals in the labor force. Within the labor force, the 35 to 44 years age range has the highest percentage of unemployed individuals, with 100.0% or 82 of them being unemployed.
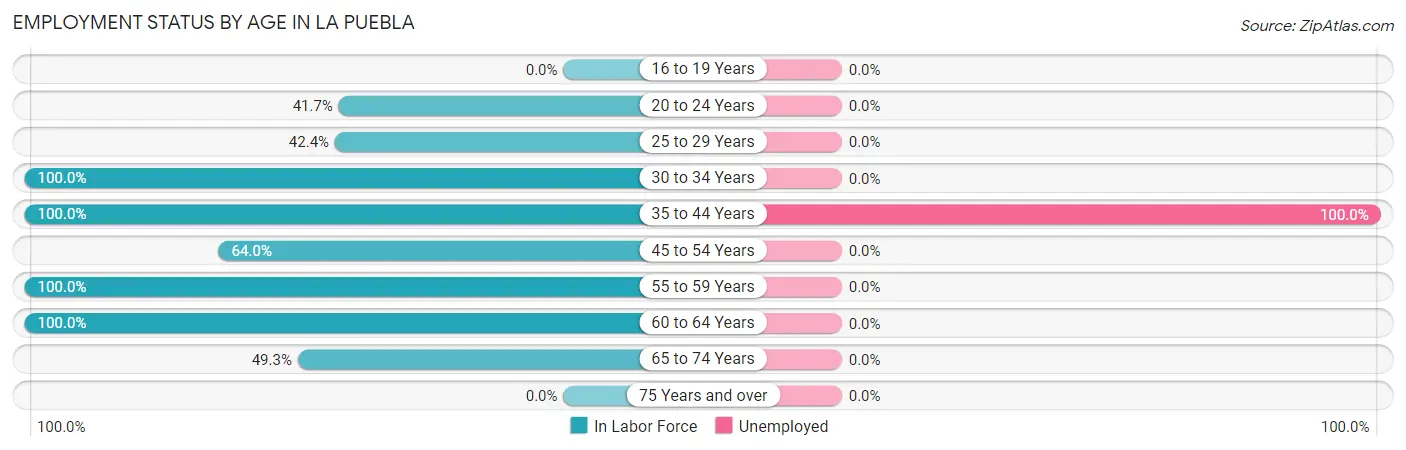
| Age Bracket | In Labor Force | Unemployed |
| 16 to 19 Years | 0 (0.0%) | 0 (0.0%) |
| 20 to 24 Years | 35 (41.7%) | 0 (0.0%) |
| 25 to 29 Years | 56 (42.4%) | 0 (0.0%) |
| 30 to 34 Years | 16 (100.0%) | 0 (0.0%) |
| 35 to 44 Years | 82 (100.0%) | 82 (100.0%) |
| 45 to 54 Years | 112 (64.0%) | 0 (0.0%) |
| 55 to 59 Years | 68 (100.0%) | 0 (0.0%) |
| 60 to 64 Years | 49 (100.0%) | 0 (0.0%) |
| 65 to 74 Years | 33 (49.3%) | 0 (0.0%) |
| 75 Years and over | 0 (0.0%) | 0 (0.0%) |
| Total | 451 (57.4%) | 82 (18.2%) |
Employment Status by Educational Attainment in La Puebla
According to labor force statistics for La Puebla, 73.4% of individuals (383) out of the total population between 25 and 64 years of age (522) are in the labor force, with 21.4% or 82 of them being unemployed. The group with the highest labor force participation rate are those with the educational attainment of less than high school, with 100.0% or 82 individuals in the labor force. Within the labor force, individuals with less than high school education have the highest percentage of unemployment, with 100.0% or 82 of them being unemployed.
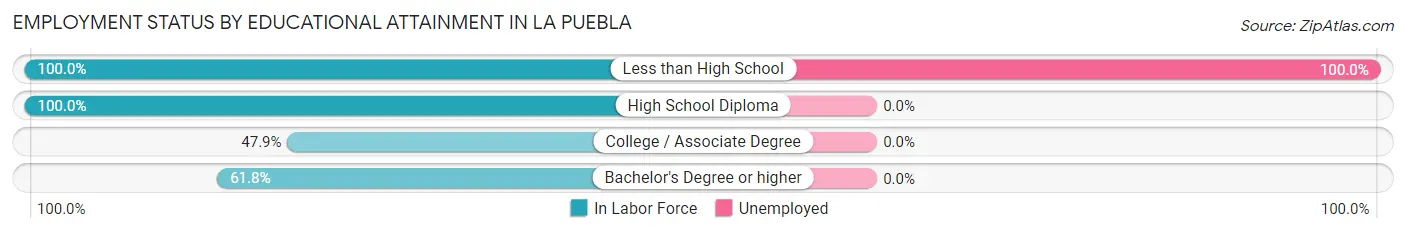
| Educational Attainment | In Labor Force | Unemployed |
| Less than High School | 82 (100.0%) | 82 (100.0%) |
| High School Diploma | 120 (100.0%) | 0 (0.0%) |
| College / Associate Degree | 58 (47.9%) | 0 (0.0%) |
| Bachelor's Degree or higher | 123 (61.8%) | 0 (0.0%) |
| Total | 383 (73.4%) | 112 (21.4%) |
Employment Occupations by Sex in La Puebla
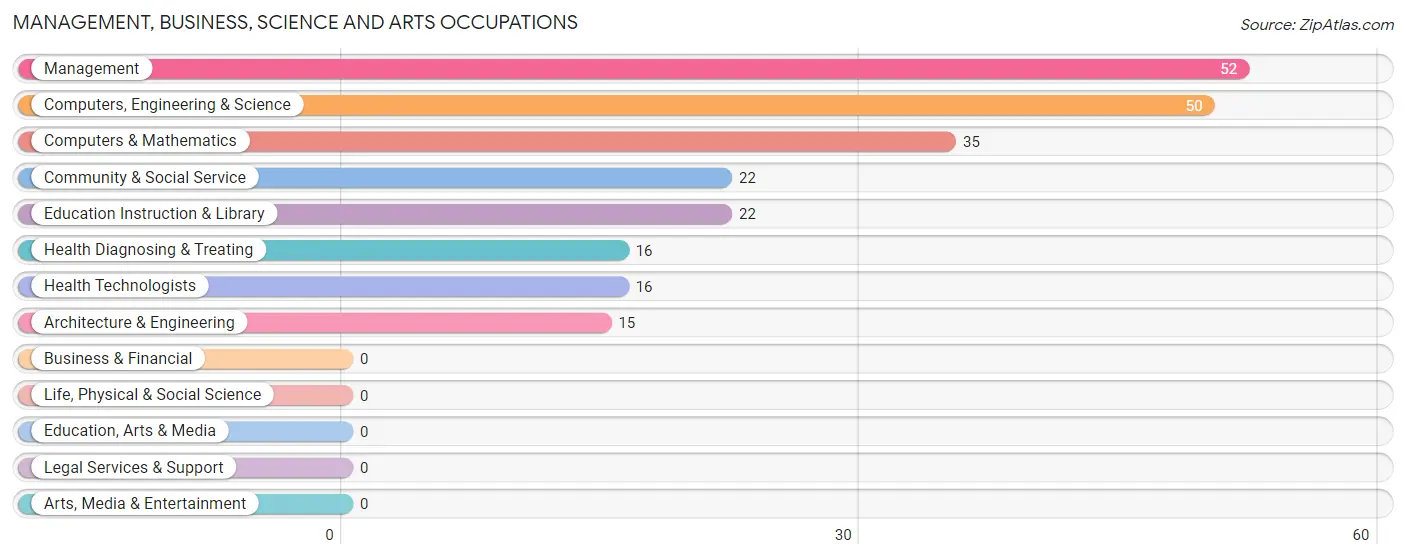
Management, Business, Science and Arts Occupations
The most common Management, Business, Science and Arts occupations in La Puebla are Management (52 | 14.1%), Computers, Engineering & Science (50 | 13.6%), Computers & Mathematics (35 | 9.5%), Community & Social Service (22 | 6.0%), and Education Instruction & Library (22 | 6.0%).
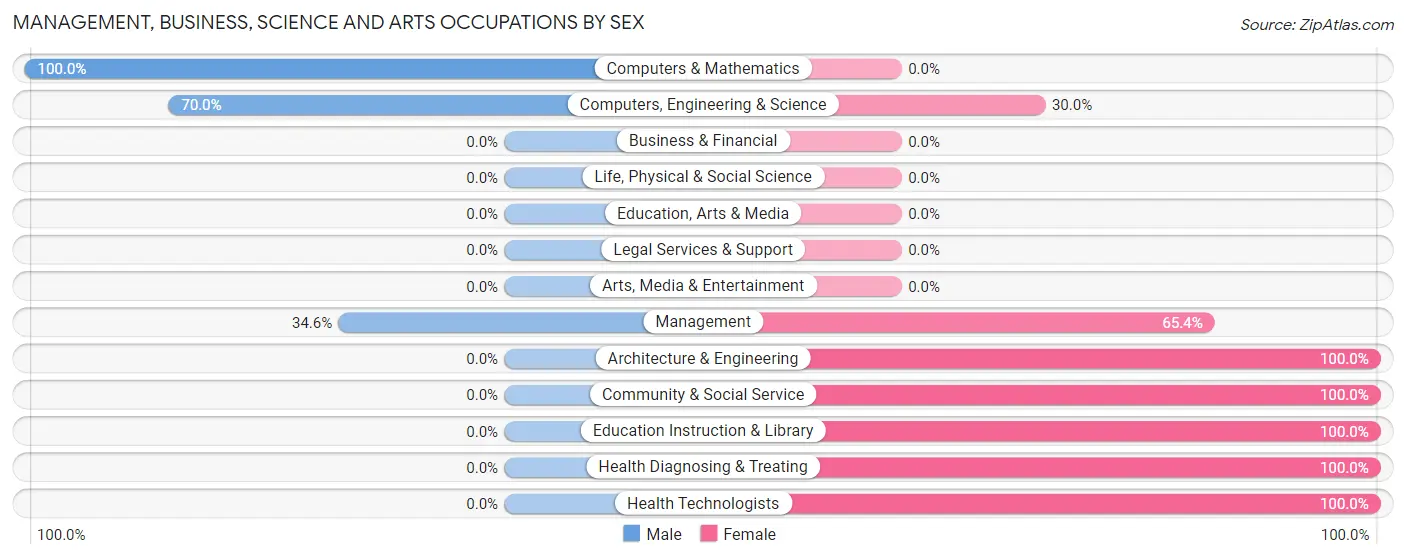
Management, Business, Science and Arts Occupations by Sex
Within the Management, Business, Science and Arts occupations in La Puebla, the most male-oriented occupations are Computers & Mathematics (100.0%), Computers, Engineering & Science (70.0%), and Management (34.6%), while the most female-oriented occupations are Architecture & Engineering (100.0%), Community & Social Service (100.0%), and Education Instruction & Library (100.0%).
| Occupation | Male | Female |
| Management | 18 (34.6%) | 34 (65.4%) |
| Business & Financial | 0 (0.0%) | 0 (0.0%) |
| Computers, Engineering & Science | 35 (70.0%) | 15 (30.0%) |
| Computers & Mathematics | 35 (100.0%) | 0 (0.0%) |
| Architecture & Engineering | 0 (0.0%) | 15 (100.0%) |
| Life, Physical & Social Science | 0 (0.0%) | 0 (0.0%) |
| Community & Social Service | 0 (0.0%) | 22 (100.0%) |
| Education, Arts & Media | 0 (0.0%) | 0 (0.0%) |
| Legal Services & Support | 0 (0.0%) | 0 (0.0%) |
| Education Instruction & Library | 0 (0.0%) | 22 (100.0%) |
| Arts, Media & Entertainment | 0 (0.0%) | 0 (0.0%) |
| Health Diagnosing & Treating | 0 (0.0%) | 16 (100.0%) |
| Health Technologists | 0 (0.0%) | 16 (100.0%) |
| Total (Category) | 53 (37.9%) | 87 (62.1%) |
| Total (Overall) | 211 (57.2%) | 158 (42.8%) |
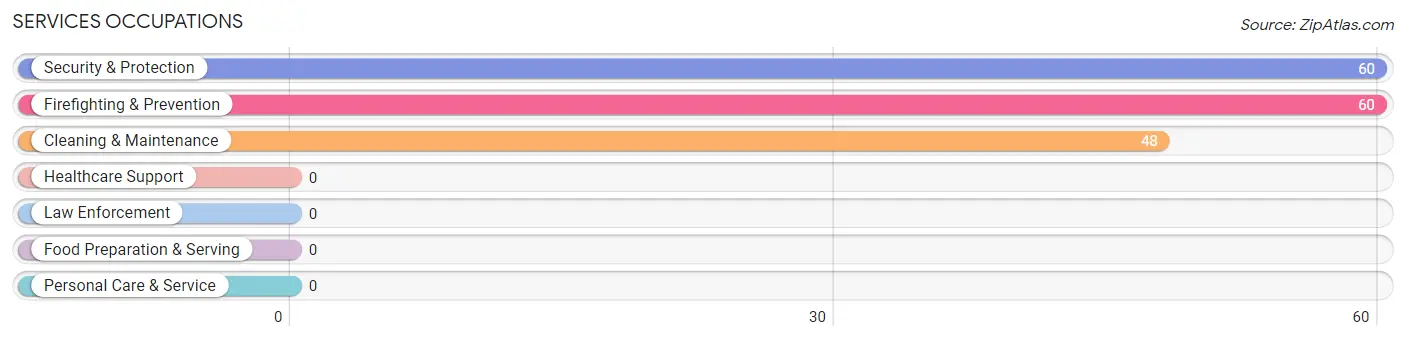
Services Occupations
The most common Services occupations in La Puebla are Security & Protection (60 | 16.3%), Firefighting & Prevention (60 | 16.3%), and Cleaning & Maintenance (48 | 13.0%).
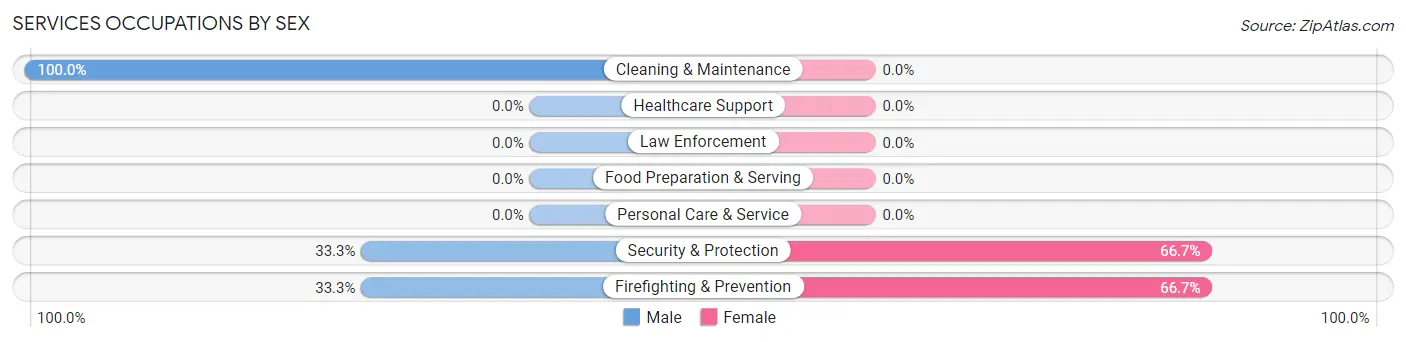
Services Occupations by Sex
Within the Services occupations in La Puebla, the most male-oriented occupations are Cleaning & Maintenance (100.0%), Security & Protection (33.3%), and Firefighting & Prevention (33.3%), while the most female-oriented occupations are Security & Protection (66.7%), and Firefighting & Prevention (66.7%).
| Occupation | Male | Female |
| Healthcare Support | 0 (0.0%) | 0 (0.0%) |
| Security & Protection | 20 (33.3%) | 40 (66.7%) |
| Firefighting & Prevention | 20 (33.3%) | 40 (66.7%) |
| Law Enforcement | 0 (0.0%) | 0 (0.0%) |
| Food Preparation & Serving | 0 (0.0%) | 0 (0.0%) |
| Cleaning & Maintenance | 48 (100.0%) | 0 (0.0%) |
| Personal Care & Service | 0 (0.0%) | 0 (0.0%) |
| Total (Category) | 68 (63.0%) | 40 (37.0%) |
| Total (Overall) | 211 (57.2%) | 158 (42.8%) |
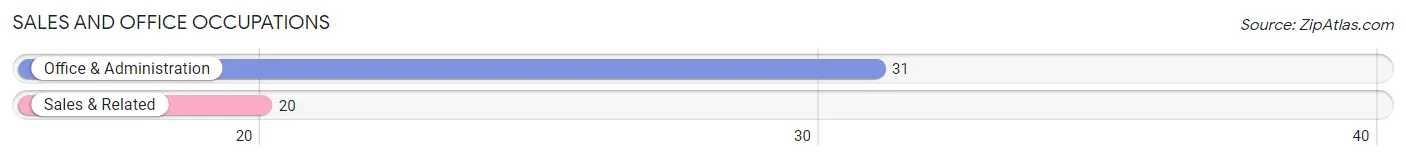
Sales and Office Occupations
The most common Sales and Office occupations in La Puebla are Office & Administration (31 | 8.4%), and Sales & Related (20 | 5.4%).
Sales and Office Occupations by Sex
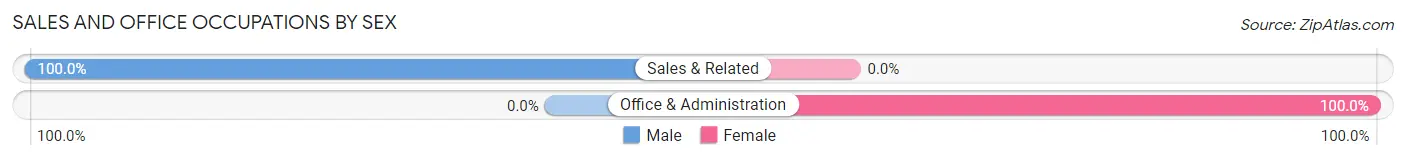
| Occupation | Male | Female |
| Sales & Related | 20 (100.0%) | 0 (0.0%) |
| Office & Administration | 0 (0.0%) | 31 (100.0%) |
| Total (Category) | 20 (39.2%) | 31 (60.8%) |
| Total (Overall) | 211 (57.2%) | 158 (42.8%) |
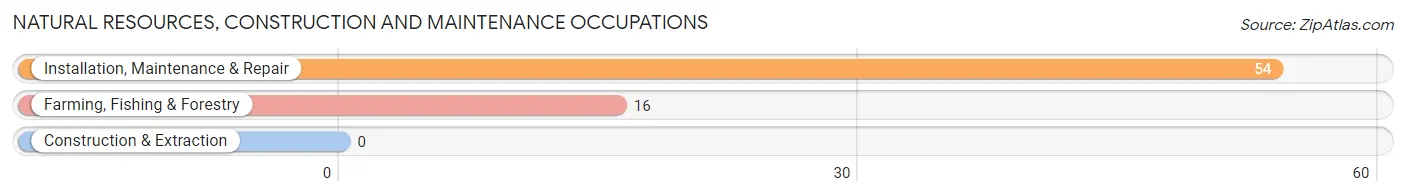
Natural Resources, Construction and Maintenance Occupations
The most common Natural Resources, Construction and Maintenance occupations in La Puebla are Installation, Maintenance & Repair (54 | 14.6%), and Farming, Fishing & Forestry (16 | 4.3%).
Natural Resources, Construction and Maintenance Occupations by Sex
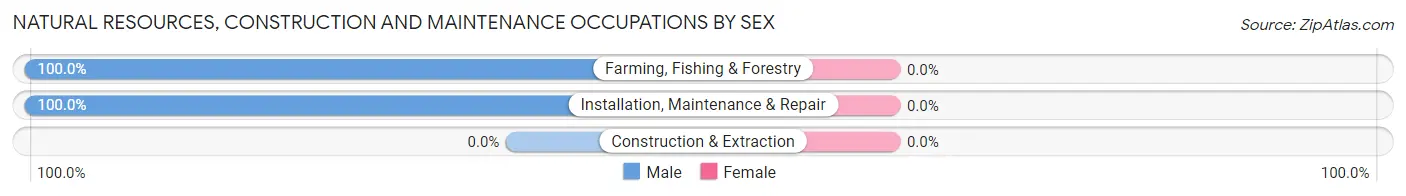
| Occupation | Male | Female |
| Farming, Fishing & Forestry | 16 (100.0%) | 0 (0.0%) |
| Construction & Extraction | 0 (0.0%) | 0 (0.0%) |
| Installation, Maintenance & Repair | 54 (100.0%) | 0 (0.0%) |
| Total (Category) | 70 (100.0%) | 0 (0.0%) |
| Total (Overall) | 211 (57.2%) | 158 (42.8%) |
Production, Transportation and Moving Occupations
Production, Transportation and Moving Occupations by Sex
| Occupation | Male | Female |
| Production | 0 (0.0%) | 0 (0.0%) |
| Transportation | 0 (0.0%) | 0 (0.0%) |
| Material Moving | 0 (0.0%) | 0 (0.0%) |
| Total (Category) | 0 (0.0%) | 0 (0.0%) |
| Total (Overall) | 211 (57.2%) | 158 (42.8%) |
Employment Industries by Sex in La Puebla
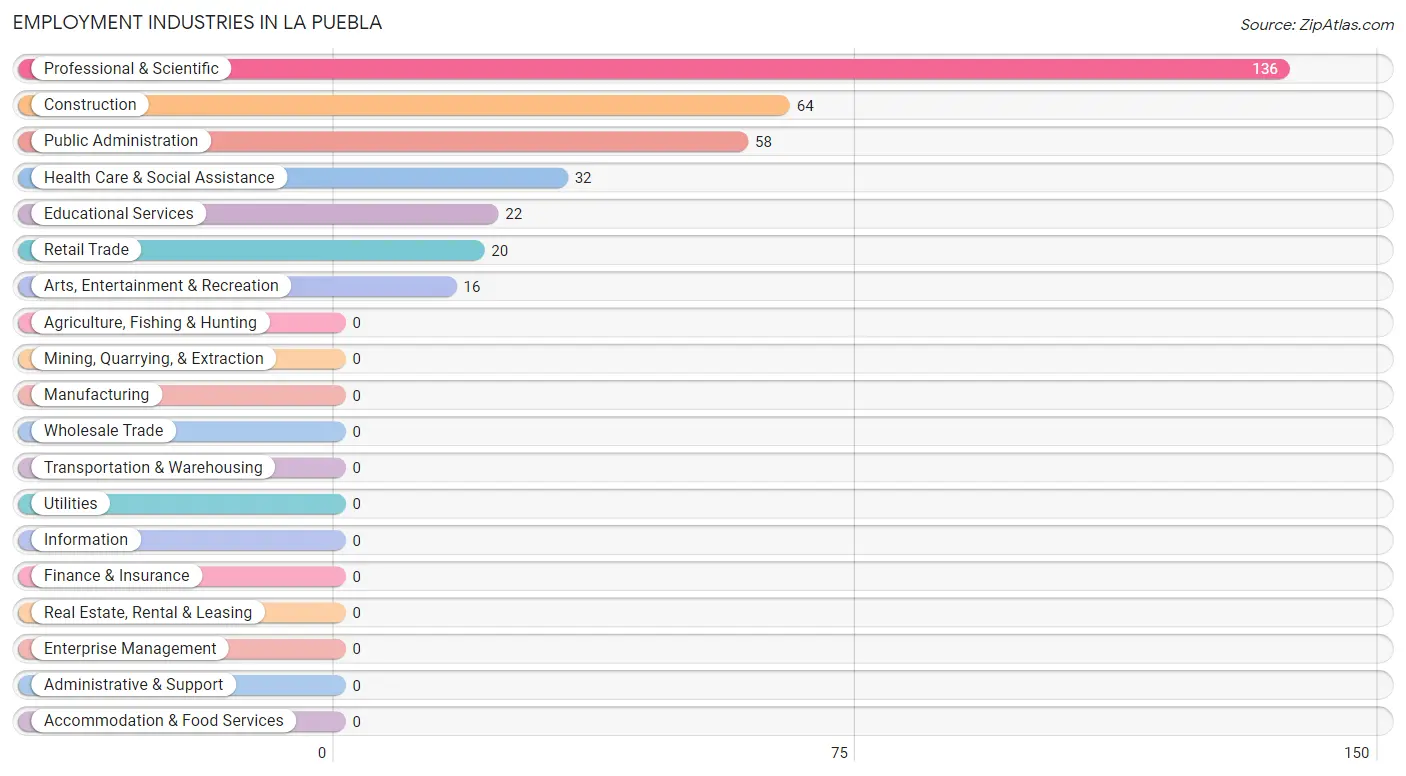
Employment Industries in La Puebla
The major employment industries in La Puebla include Professional & Scientific (136 | 36.9%), Construction (64 | 17.3%), Public Administration (58 | 15.7%), Health Care & Social Assistance (32 | 8.7%), and Educational Services (22 | 6.0%).
Employment Industries by Sex in La Puebla
The La Puebla industries that see more men than women are Retail Trade (100.0%), Arts, Entertainment & Recreation (100.0%), and Professional & Scientific (89.0%), whereas the industries that tend to have a higher number of women are Educational Services (100.0%), Health Care & Social Assistance (100.0%), and Public Administration (100.0%).
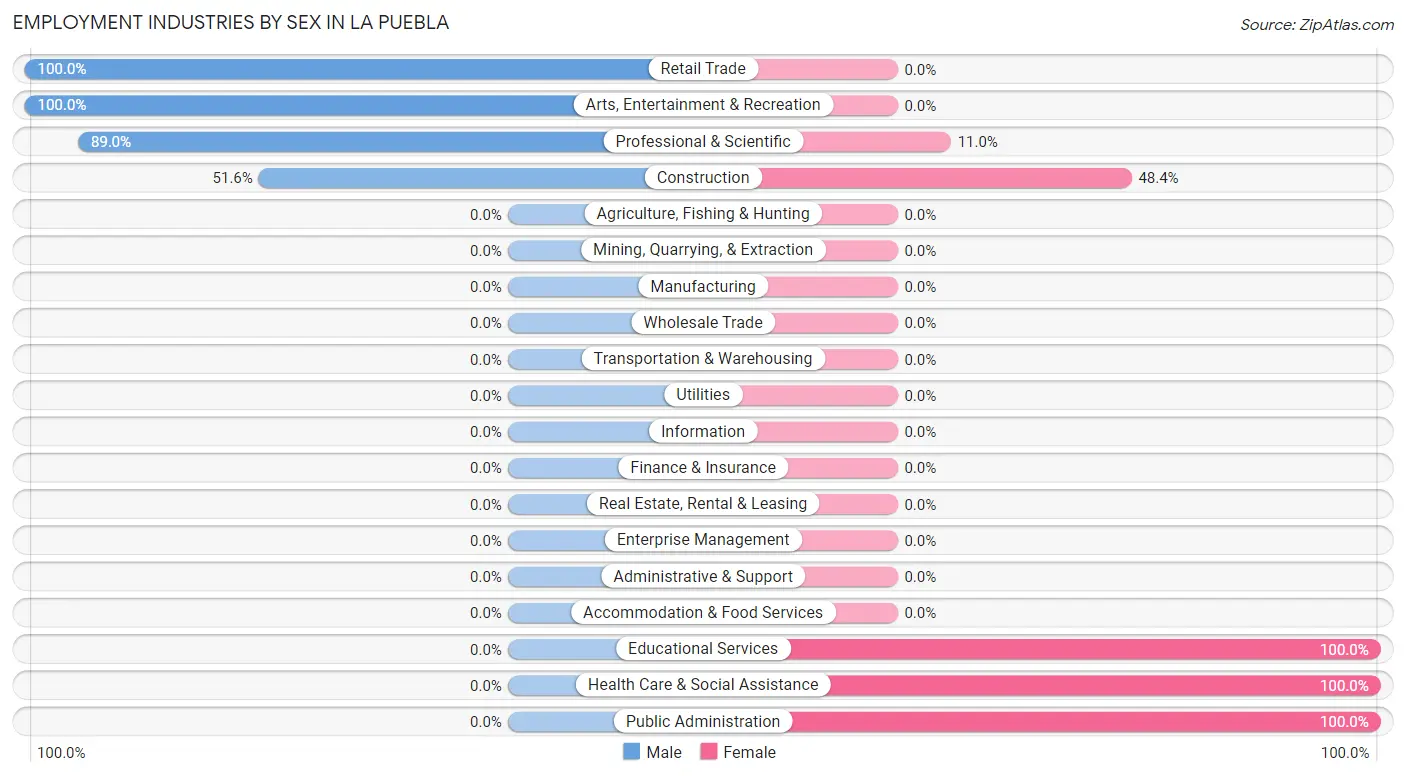
| Industry | Male | Female |
| Agriculture, Fishing & Hunting | 0 (0.0%) | 0 (0.0%) |
| Mining, Quarrying, & Extraction | 0 (0.0%) | 0 (0.0%) |
| Construction | 33 (51.6%) | 31 (48.4%) |
| Manufacturing | 0 (0.0%) | 0 (0.0%) |
| Wholesale Trade | 0 (0.0%) | 0 (0.0%) |
| Retail Trade | 20 (100.0%) | 0 (0.0%) |
| Transportation & Warehousing | 0 (0.0%) | 0 (0.0%) |
| Utilities | 0 (0.0%) | 0 (0.0%) |
| Information | 0 (0.0%) | 0 (0.0%) |
| Finance & Insurance | 0 (0.0%) | 0 (0.0%) |
| Real Estate, Rental & Leasing | 0 (0.0%) | 0 (0.0%) |
| Professional & Scientific | 121 (89.0%) | 15 (11.0%) |
| Enterprise Management | 0 (0.0%) | 0 (0.0%) |
| Administrative & Support | 0 (0.0%) | 0 (0.0%) |
| Educational Services | 0 (0.0%) | 22 (100.0%) |
| Health Care & Social Assistance | 0 (0.0%) | 32 (100.0%) |
| Arts, Entertainment & Recreation | 16 (100.0%) | 0 (0.0%) |
| Accommodation & Food Services | 0 (0.0%) | 0 (0.0%) |
| Public Administration | 0 (0.0%) | 58 (100.0%) |
| Total | 211 (57.2%) | 158 (42.8%) |
Education in La Puebla
School Enrollment in La Puebla
The most common levels of schooling among the 313 students in La Puebla are elementary school (84 | 26.8%), kindergarten (81 | 25.9%), and graduate / professional (76 | 24.3%).
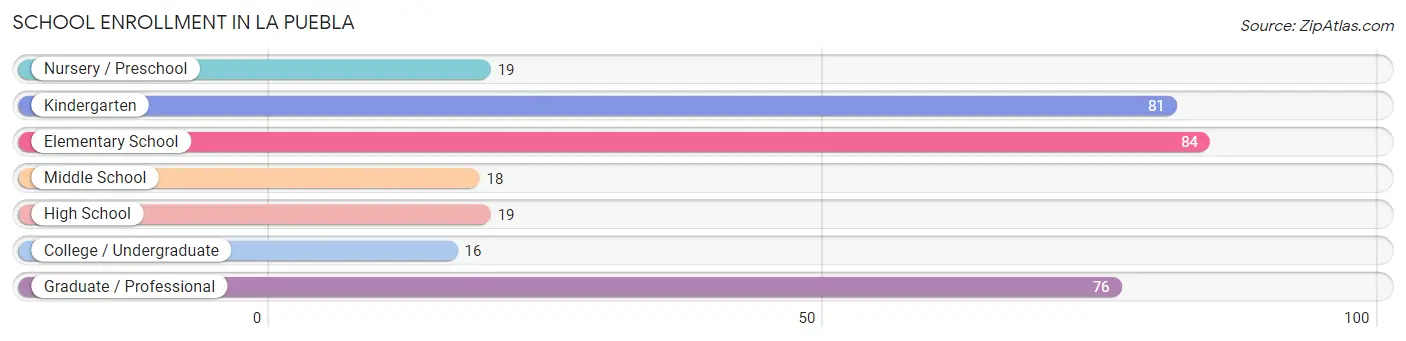
| School Level | # Students | % Students |
| Nursery / Preschool | 19 | 6.1% |
| Kindergarten | 81 | 25.9% |
| Elementary School | 84 | 26.8% |
| Middle School | 18 | 5.8% |
| High School | 19 | 6.1% |
| College / Undergraduate | 16 | 5.1% |
| Graduate / Professional | 76 | 24.3% |
| Total | 313 | 100.0% |
School Enrollment by Age by Funding Source in La Puebla
Out of a total of 313 students who are enrolled in schools in La Puebla, 19 (6.1%) attend a private institution, while the remaining 294 (93.9%) are enrolled in public schools. The age group of 5 to 9 year old has the highest likelihood of being enrolled in private schools, with 19 (11.5% in the age bracket) enrolled. Conversely, the age group of 3 to 4 year olds has the lowest likelihood of being enrolled in a private school, with 19 (100.0% in the age bracket) attending a public institution.
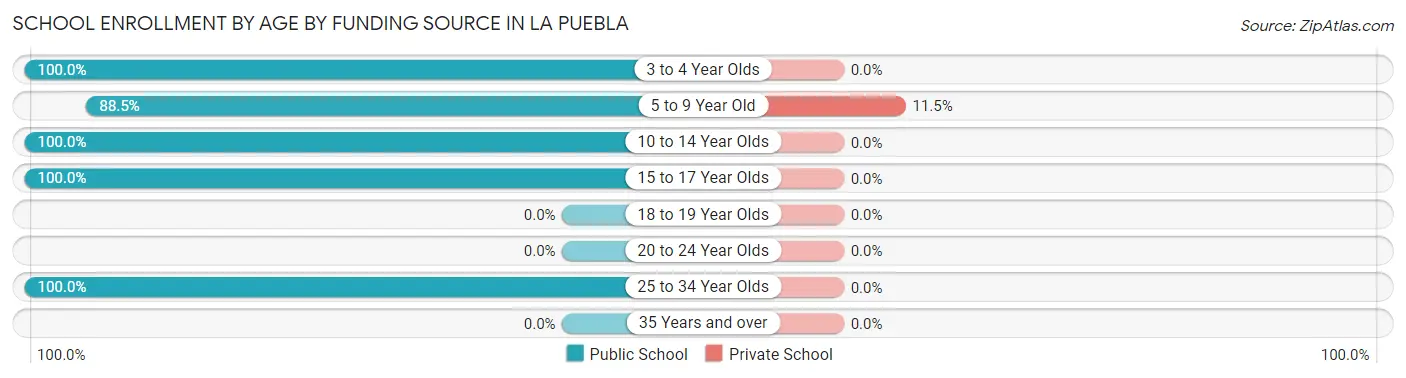
| Age Bracket | Public School | Private School |
| 3 to 4 Year Olds | 19 (100.0%) | 0 (0.0%) |
| 5 to 9 Year Old | 146 (88.5%) | 19 (11.5%) |
| 10 to 14 Year Olds | 18 (100.0%) | 0 (0.0%) |
| 15 to 17 Year Olds | 35 (100.0%) | 0 (0.0%) |
| 18 to 19 Year Olds | 0 (0.0%) | 0 (0.0%) |
| 20 to 24 Year Olds | 0 (0.0%) | 0 (0.0%) |
| 25 to 34 Year Olds | 76 (100.0%) | 0 (0.0%) |
| 35 Years and over | 0 (0.0%) | 0 (0.0%) |
| Total | 294 (93.9%) | 19 (6.1%) |
Educational Attainment by Field of Study in La Puebla
Arts & humanities (76 | 32.9%), liberal arts & history (32 | 13.9%), education (22 | 9.5%), business (20 | 8.7%), and communications (18 | 7.8%) are the most common fields of study among 231 individuals in La Puebla who have obtained a bachelor's degree or higher.
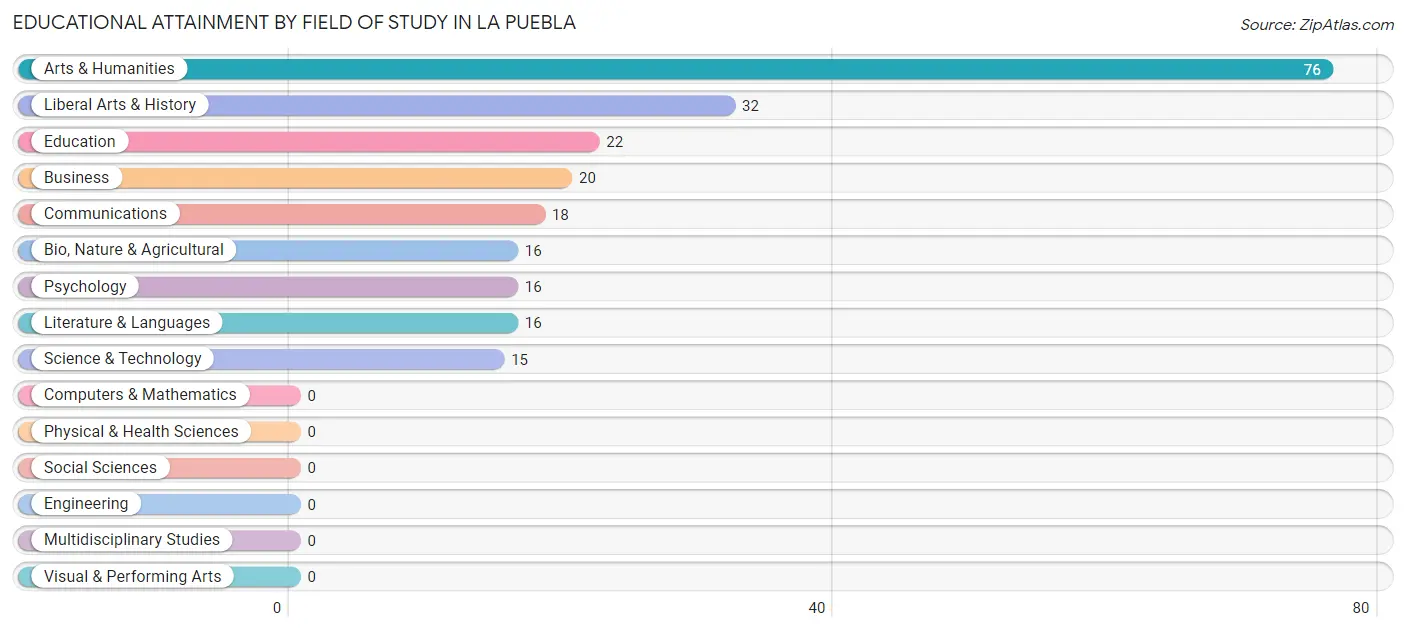
| Field of Study | # Graduates | % Graduates |
| Computers & Mathematics | 0 | 0.0% |
| Bio, Nature & Agricultural | 16 | 6.9% |
| Physical & Health Sciences | 0 | 0.0% |
| Psychology | 16 | 6.9% |
| Social Sciences | 0 | 0.0% |
| Engineering | 0 | 0.0% |
| Multidisciplinary Studies | 0 | 0.0% |
| Science & Technology | 15 | 6.5% |
| Business | 20 | 8.7% |
| Education | 22 | 9.5% |
| Literature & Languages | 16 | 6.9% |
| Liberal Arts & History | 32 | 13.9% |
| Visual & Performing Arts | 0 | 0.0% |
| Communications | 18 | 7.8% |
| Arts & Humanities | 76 | 32.9% |
| Total | 231 | 100.0% |
Transportation & Commute in La Puebla
Vehicle Availability by Sex in La Puebla
The most prevalent vehicle ownership categories in La Puebla are males with 5 or more vehicles (89, accounting for 42.2%) and females with 5 or more vehicles (18, making up 56.3%).
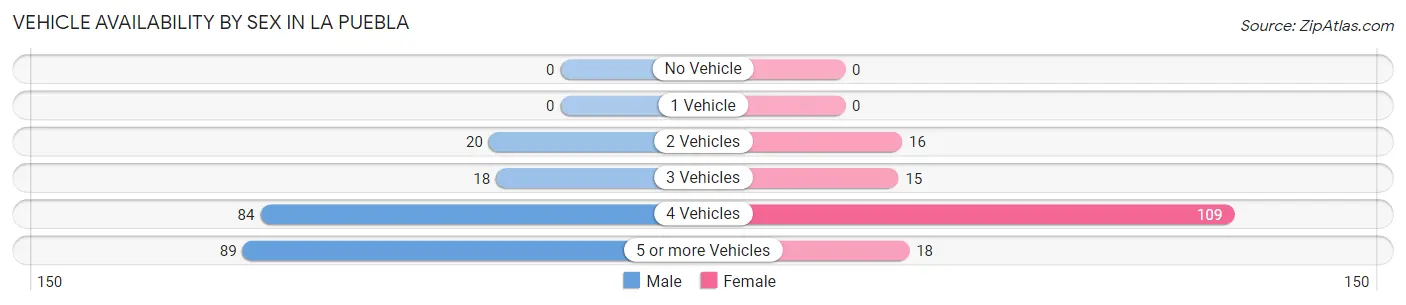
| Vehicles Available | Male | Female |
| No Vehicle | 0 (0.0%) | 0 (0.0%) |
| 1 Vehicle | 0 (0.0%) | 0 (0.0%) |
| 2 Vehicles | 20 (9.5%) | 16 (10.1%) |
| 3 Vehicles | 18 (8.5%) | 15 (9.5%) |
| 4 Vehicles | 84 (39.8%) | 109 (69.0%) |
| 5 or more Vehicles | 89 (42.2%) | 18 (11.4%) |
| Total | 211 (100.0%) | 158 (100.0%) |
Commute Time in La Puebla
The most frequently occuring commute durations in La Puebla are 45 to 59 minutes (139 commuters, 51.7%), 35 to 39 minutes (51 commuters, 19.0%), and 20 to 24 minutes (22 commuters, 8.2%).
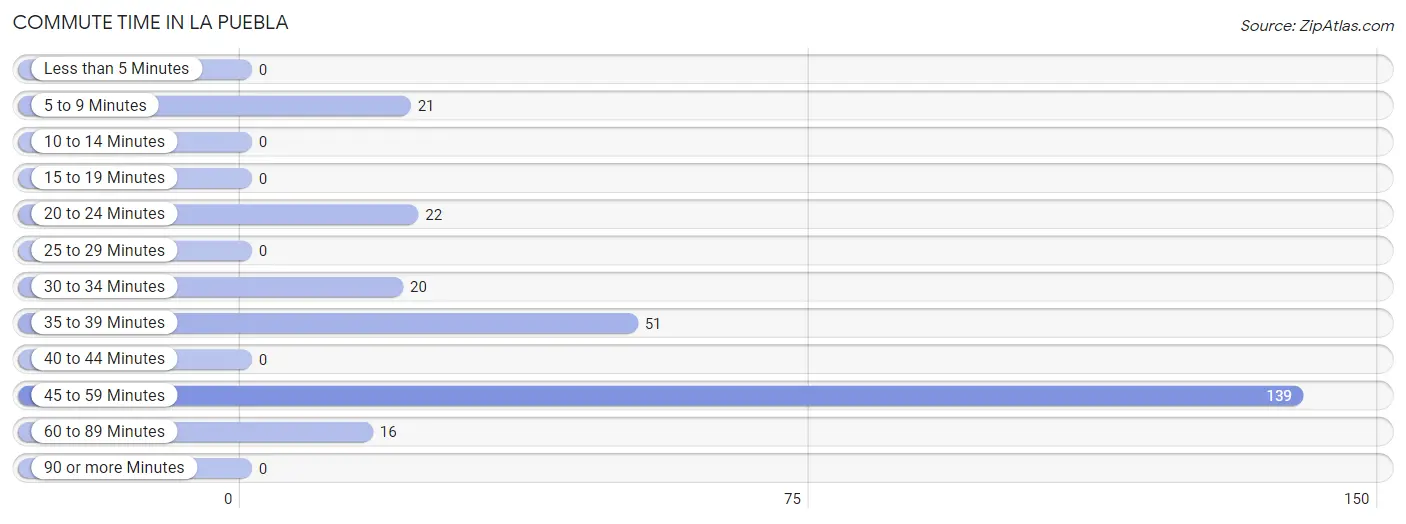
| Commute Time | # Commuters | % Commuters |
| Less than 5 Minutes | 0 | 0.0% |
| 5 to 9 Minutes | 21 | 7.8% |
| 10 to 14 Minutes | 0 | 0.0% |
| 15 to 19 Minutes | 0 | 0.0% |
| 20 to 24 Minutes | 22 | 8.2% |
| 25 to 29 Minutes | 0 | 0.0% |
| 30 to 34 Minutes | 20 | 7.4% |
| 35 to 39 Minutes | 51 | 19.0% |
| 40 to 44 Minutes | 0 | 0.0% |
| 45 to 59 Minutes | 139 | 51.7% |
| 60 to 89 Minutes | 16 | 5.9% |
| 90 or more Minutes | 0 | 0.0% |
Commute Time by Sex in La Puebla
The most common commute times in La Puebla are 45 to 59 minutes (99 commuters, 62.7%) for males and 45 to 59 minutes (40 commuters, 36.0%) for females.
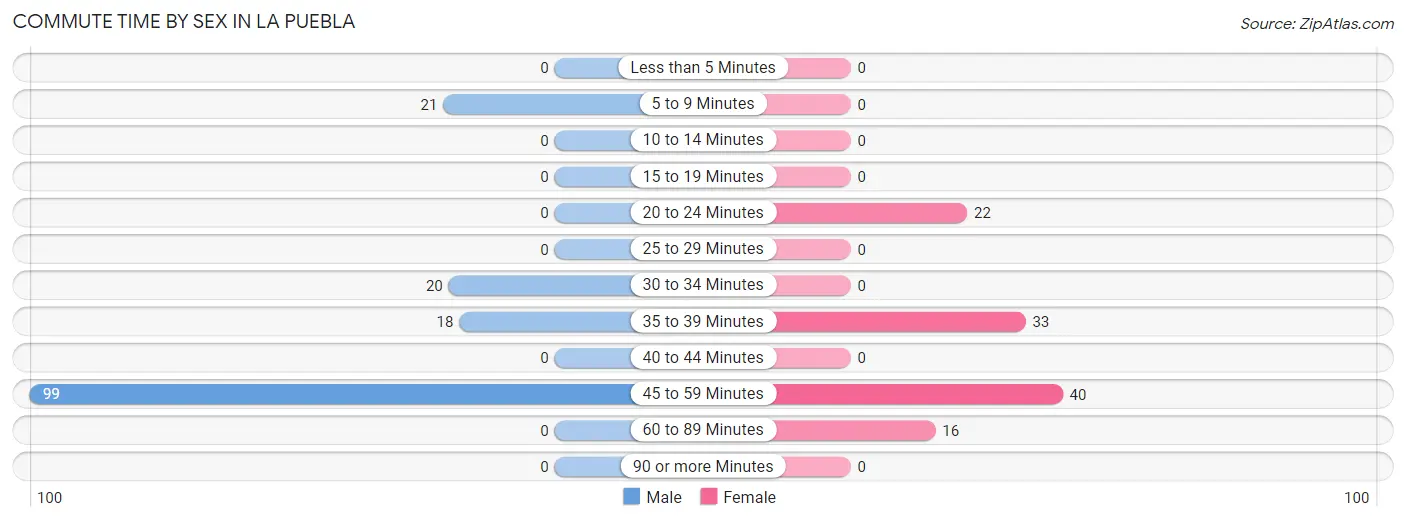
| Commute Time | Male | Female |
| Less than 5 Minutes | 0 (0.0%) | 0 (0.0%) |
| 5 to 9 Minutes | 21 (13.3%) | 0 (0.0%) |
| 10 to 14 Minutes | 0 (0.0%) | 0 (0.0%) |
| 15 to 19 Minutes | 0 (0.0%) | 0 (0.0%) |
| 20 to 24 Minutes | 0 (0.0%) | 22 (19.8%) |
| 25 to 29 Minutes | 0 (0.0%) | 0 (0.0%) |
| 30 to 34 Minutes | 20 (12.7%) | 0 (0.0%) |
| 35 to 39 Minutes | 18 (11.4%) | 33 (29.7%) |
| 40 to 44 Minutes | 0 (0.0%) | 0 (0.0%) |
| 45 to 59 Minutes | 99 (62.7%) | 40 (36.0%) |
| 60 to 89 Minutes | 0 (0.0%) | 16 (14.4%) |
| 90 or more Minutes | 0 (0.0%) | 0 (0.0%) |
Time of Departure to Work by Sex in La Puebla
The most frequent times of departure to work in La Puebla are 7:00 AM to 7:29 AM (83, 52.5%) for males and 6:00 AM to 6:29 AM (40, 36.0%) for females.
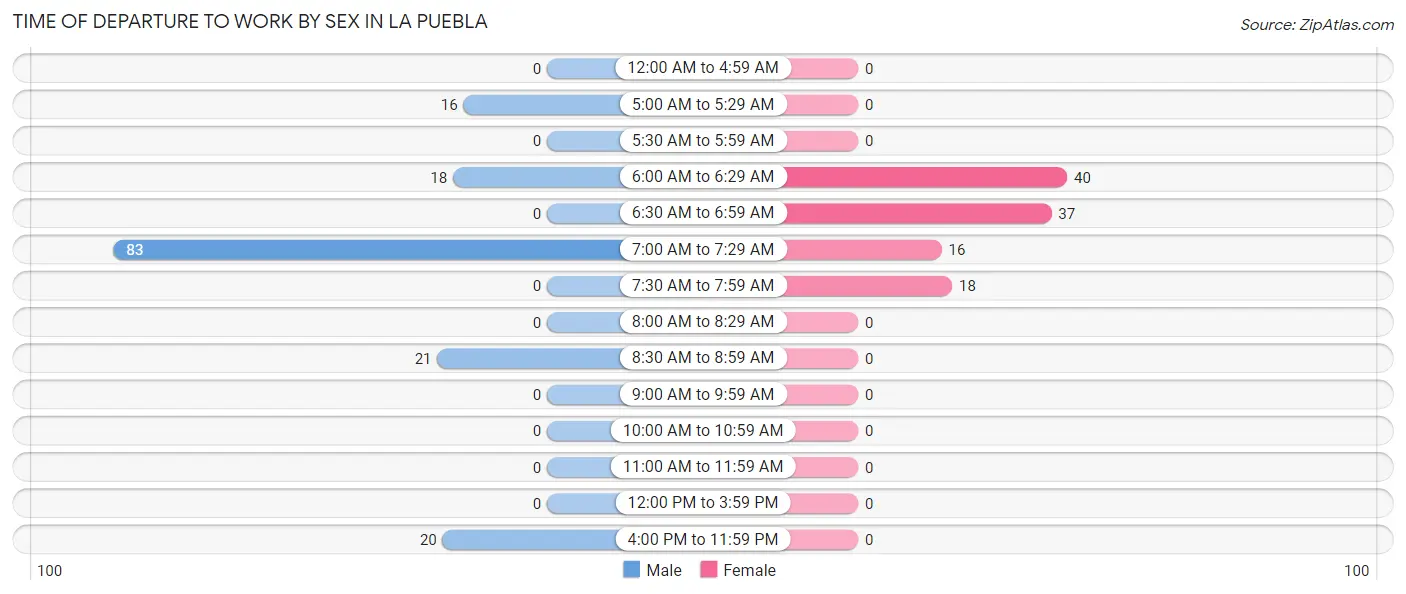
| Time of Departure | Male | Female |
| 12:00 AM to 4:59 AM | 0 (0.0%) | 0 (0.0%) |
| 5:00 AM to 5:29 AM | 16 (10.1%) | 0 (0.0%) |
| 5:30 AM to 5:59 AM | 0 (0.0%) | 0 (0.0%) |
| 6:00 AM to 6:29 AM | 18 (11.4%) | 40 (36.0%) |
| 6:30 AM to 6:59 AM | 0 (0.0%) | 37 (33.3%) |
| 7:00 AM to 7:29 AM | 83 (52.5%) | 16 (14.4%) |
| 7:30 AM to 7:59 AM | 0 (0.0%) | 18 (16.2%) |
| 8:00 AM to 8:29 AM | 0 (0.0%) | 0 (0.0%) |
| 8:30 AM to 8:59 AM | 21 (13.3%) | 0 (0.0%) |
| 9:00 AM to 9:59 AM | 0 (0.0%) | 0 (0.0%) |
| 10:00 AM to 10:59 AM | 0 (0.0%) | 0 (0.0%) |
| 11:00 AM to 11:59 AM | 0 (0.0%) | 0 (0.0%) |
| 12:00 PM to 3:59 PM | 0 (0.0%) | 0 (0.0%) |
| 4:00 PM to 11:59 PM | 20 (12.7%) | 0 (0.0%) |
| Total | 158 (100.0%) | 111 (100.0%) |
Housing Occupancy in La Puebla
Occupancy by Ownership in La Puebla
Of the total 317 dwellings in La Puebla, owner-occupied units account for 277 (87.4%), while renter-occupied units make up 40 (12.6%).
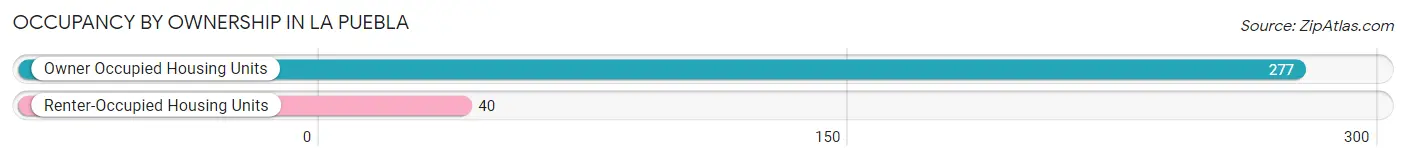
| Occupancy | # Housing Units | % Housing Units |
| Owner Occupied Housing Units | 277 | 87.4% |
| Renter-Occupied Housing Units | 40 | 12.6% |
| Total Occupied Housing Units | 317 | 100.0% |
Occupancy by Household Size in La Puebla
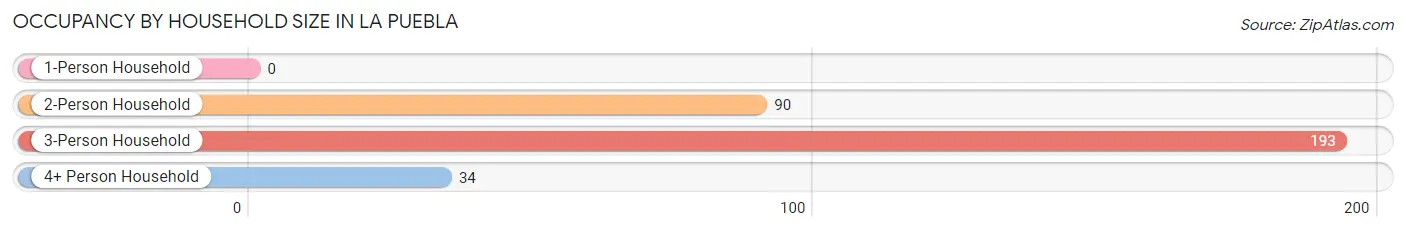
| Household Size | # Housing Units | % Housing Units |
| 1-Person Household | 0 | 0.0% |
| 2-Person Household | 90 | 28.4% |
| 3-Person Household | 193 | 60.9% |
| 4+ Person Household | 34 | 10.7% |
| Total Housing Units | 317 | 100.0% |
Occupancy by Ownership by Household Size in La Puebla
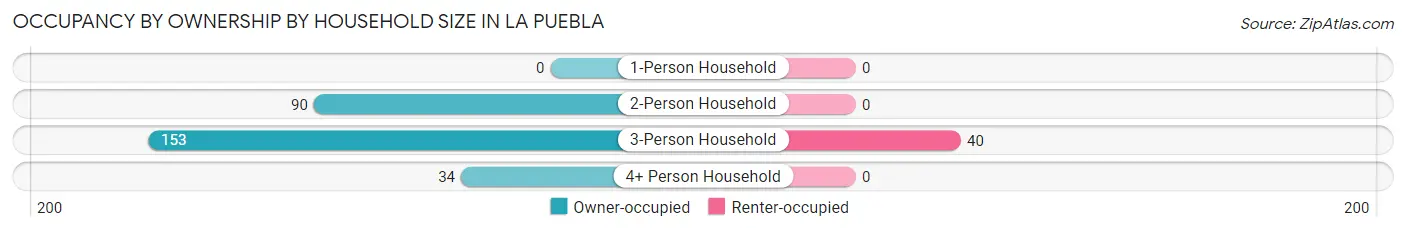
| Household Size | Owner-occupied | Renter-occupied |
| 1-Person Household | 0 (0.0%) | 0 (0.0%) |
| 2-Person Household | 90 (100.0%) | 0 (0.0%) |
| 3-Person Household | 153 (79.3%) | 40 (20.7%) |
| 4+ Person Household | 34 (100.0%) | 0 (0.0%) |
| Total Housing Units | 277 (87.4%) | 40 (12.6%) |
Occupancy by Educational Attainment in La Puebla
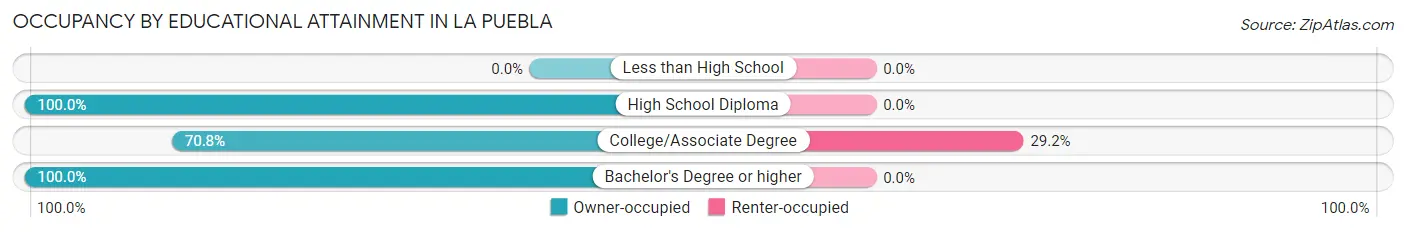
| Household Size | Owner-occupied | Renter-occupied |
| Less than High School | 0 (0.0%) | 0 (0.0%) |
| High School Diploma | 126 (100.0%) | 0 (0.0%) |
| College/Associate Degree | 97 (70.8%) | 40 (29.2%) |
| Bachelor's Degree or higher | 54 (100.0%) | 0 (0.0%) |
Occupancy by Age of Householder in La Puebla
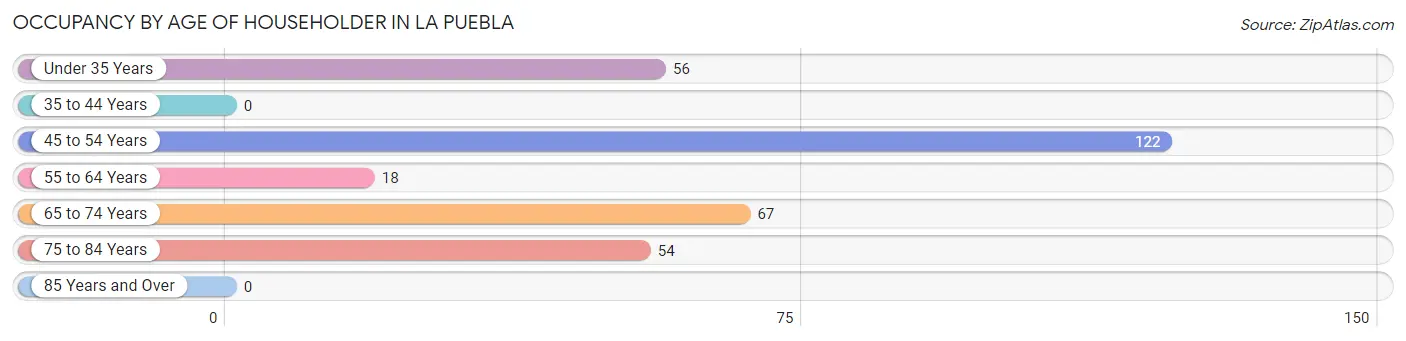
| Age Bracket | # Households | % Households |
| Under 35 Years | 56 | 17.7% |
| 35 to 44 Years | 0 | 0.0% |
| 45 to 54 Years | 122 | 38.5% |
| 55 to 64 Years | 18 | 5.7% |
| 65 to 74 Years | 67 | 21.1% |
| 75 to 84 Years | 54 | 17.0% |
| 85 Years and Over | 0 | 0.0% |
| Total | 317 | 100.0% |
Housing Finances in La Puebla
Median Income by Occupancy in La Puebla
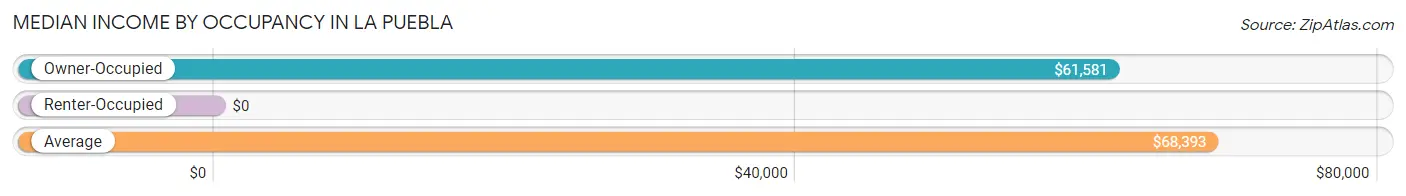
| Occupancy Type | # Households | Median Income |
| Owner-Occupied | 277 (87.4%) | $61,581 |
| Renter-Occupied | 40 (12.6%) | $0 |
| Average | 317 (100.0%) | $68,393 |
Occupancy by Householder Income Bracket in La Puebla
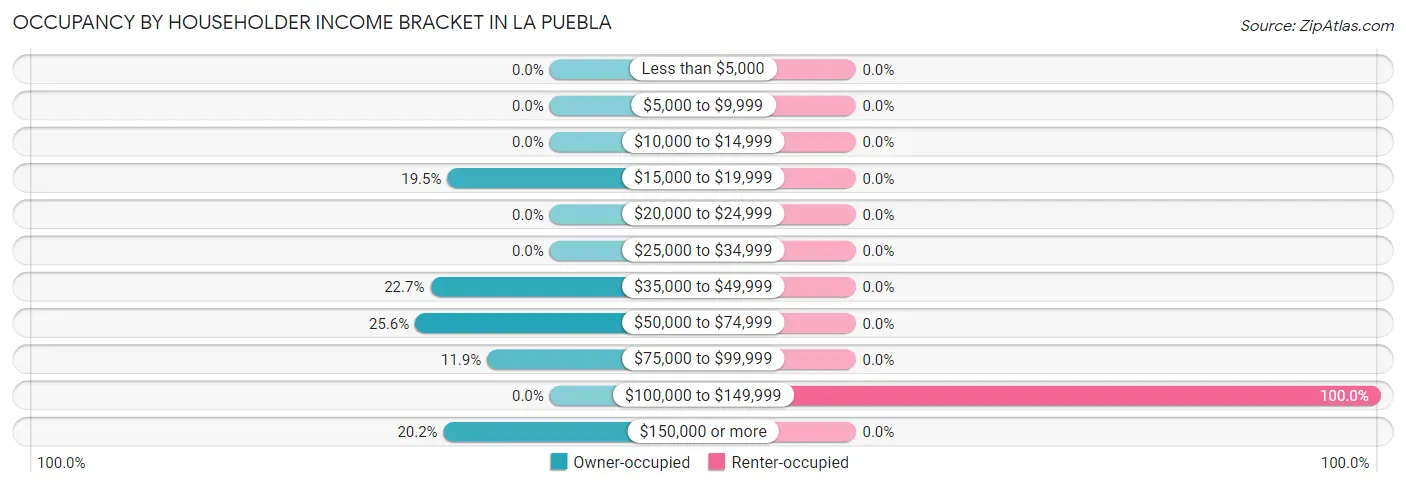
| Income Bracket | Owner-occupied | Renter-occupied |
| Less than $5,000 | 0 (0.0%) | 0 (0.0%) |
| $5,000 to $9,999 | 0 (0.0%) | 0 (0.0%) |
| $10,000 to $14,999 | 0 (0.0%) | 0 (0.0%) |
| $15,000 to $19,999 | 54 (19.5%) | 0 (0.0%) |
| $20,000 to $24,999 | 0 (0.0%) | 0 (0.0%) |
| $25,000 to $34,999 | 0 (0.0%) | 0 (0.0%) |
| $35,000 to $49,999 | 63 (22.7%) | 0 (0.0%) |
| $50,000 to $74,999 | 71 (25.6%) | 0 (0.0%) |
| $75,000 to $99,999 | 33 (11.9%) | 0 (0.0%) |
| $100,000 to $149,999 | 0 (0.0%) | 40 (100.0%) |
| $150,000 or more | 56 (20.2%) | 0 (0.0%) |
| Total | 277 (100.0%) | 40 (100.0%) |
Monthly Housing Cost Tiers in La Puebla
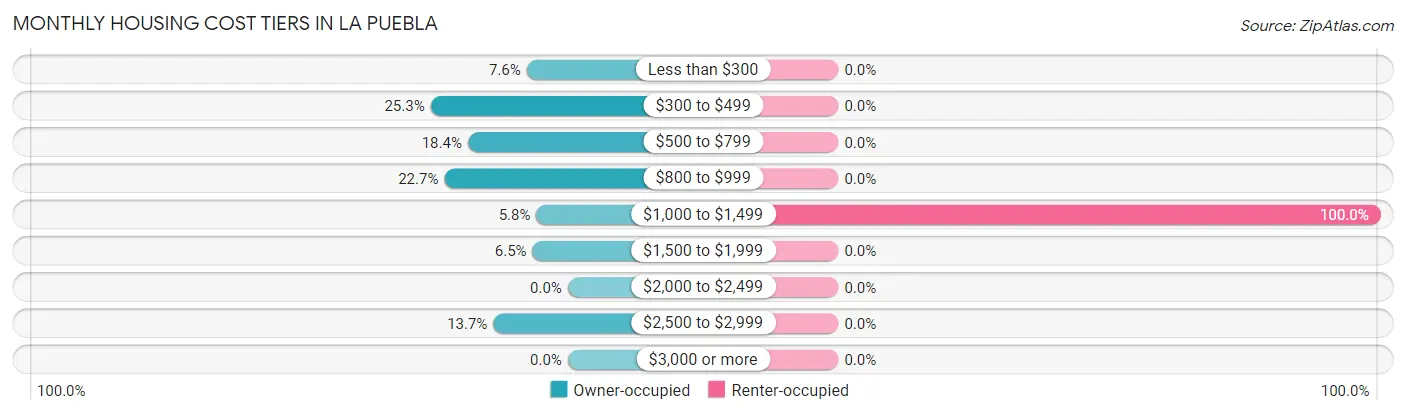
| Monthly Cost | Owner-occupied | Renter-occupied |
| Less than $300 | 21 (7.6%) | 0 (0.0%) |
| $300 to $499 | 70 (25.3%) | 0 (0.0%) |
| $500 to $799 | 51 (18.4%) | 0 (0.0%) |
| $800 to $999 | 63 (22.7%) | 0 (0.0%) |
| $1,000 to $1,499 | 16 (5.8%) | 40 (100.0%) |
| $1,500 to $1,999 | 18 (6.5%) | 0 (0.0%) |
| $2,000 to $2,499 | 0 (0.0%) | 0 (0.0%) |
| $2,500 to $2,999 | 38 (13.7%) | 0 (0.0%) |
| $3,000 or more | 0 (0.0%) | 0 (0.0%) |
| Total | 277 (100.0%) | 40 (100.0%) |
Physical Housing Characteristics in La Puebla
Housing Structures in La Puebla
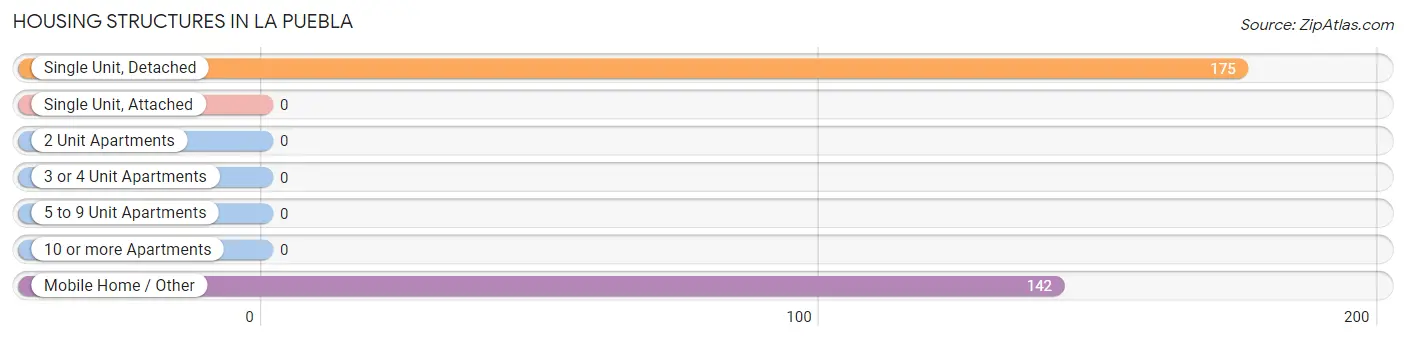
| Structure Type | # Housing Units | % Housing Units |
| Single Unit, Detached | 175 | 55.2% |
| Single Unit, Attached | 0 | 0.0% |
| 2 Unit Apartments | 0 | 0.0% |
| 3 or 4 Unit Apartments | 0 | 0.0% |
| 5 to 9 Unit Apartments | 0 | 0.0% |
| 10 or more Apartments | 0 | 0.0% |
| Mobile Home / Other | 142 | 44.8% |
| Total | 317 | 100.0% |
Housing Structures by Occupancy in La Puebla
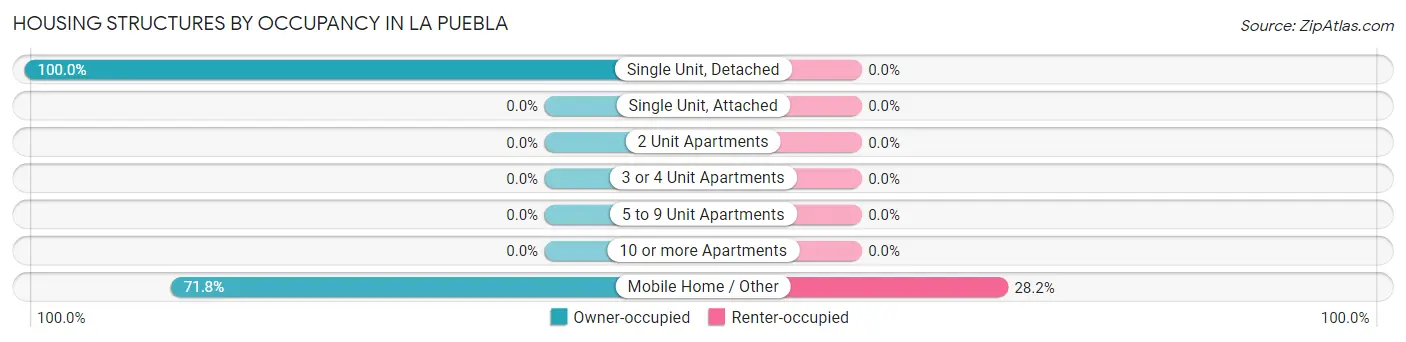
| Structure Type | Owner-occupied | Renter-occupied |
| Single Unit, Detached | 175 (100.0%) | 0 (0.0%) |
| Single Unit, Attached | 0 (0.0%) | 0 (0.0%) |
| 2 Unit Apartments | 0 (0.0%) | 0 (0.0%) |
| 3 or 4 Unit Apartments | 0 (0.0%) | 0 (0.0%) |
| 5 to 9 Unit Apartments | 0 (0.0%) | 0 (0.0%) |
| 10 or more Apartments | 0 (0.0%) | 0 (0.0%) |
| Mobile Home / Other | 102 (71.8%) | 40 (28.2%) |
| Total | 277 (87.4%) | 40 (12.6%) |
Housing Structures by Number of Rooms in La Puebla
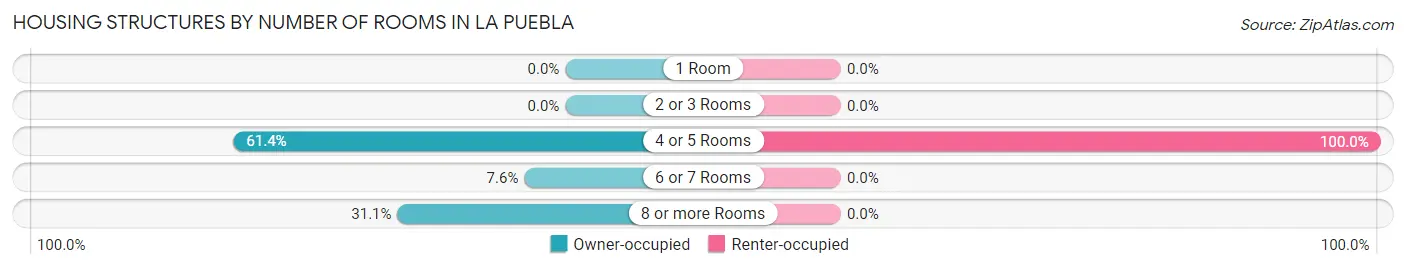
| Number of Rooms | Owner-occupied | Renter-occupied |
| 1 Room | 0 (0.0%) | 0 (0.0%) |
| 2 or 3 Rooms | 0 (0.0%) | 0 (0.0%) |
| 4 or 5 Rooms | 170 (61.4%) | 40 (100.0%) |
| 6 or 7 Rooms | 21 (7.6%) | 0 (0.0%) |
| 8 or more Rooms | 86 (31.0%) | 0 (0.0%) |
| Total | 277 (100.0%) | 40 (100.0%) |
Housing Structure by Heating Type in La Puebla
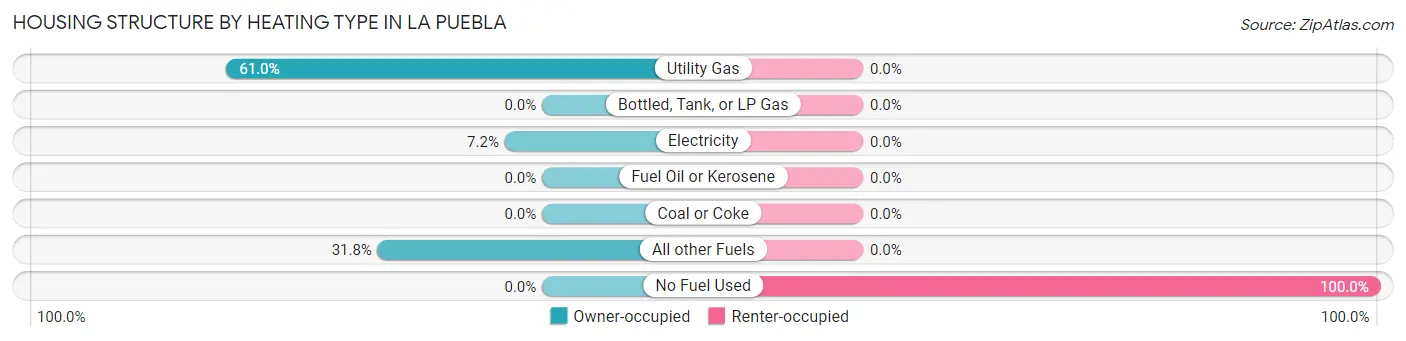
| Heating Type | Owner-occupied | Renter-occupied |
| Utility Gas | 169 (61.0%) | 0 (0.0%) |
| Bottled, Tank, or LP Gas | 0 (0.0%) | 0 (0.0%) |
| Electricity | 20 (7.2%) | 0 (0.0%) |
| Fuel Oil or Kerosene | 0 (0.0%) | 0 (0.0%) |
| Coal or Coke | 0 (0.0%) | 0 (0.0%) |
| All other Fuels | 88 (31.8%) | 0 (0.0%) |
| No Fuel Used | 0 (0.0%) | 40 (100.0%) |
| Total | 277 (100.0%) | 40 (100.0%) |
Household Vehicle Usage in La Puebla
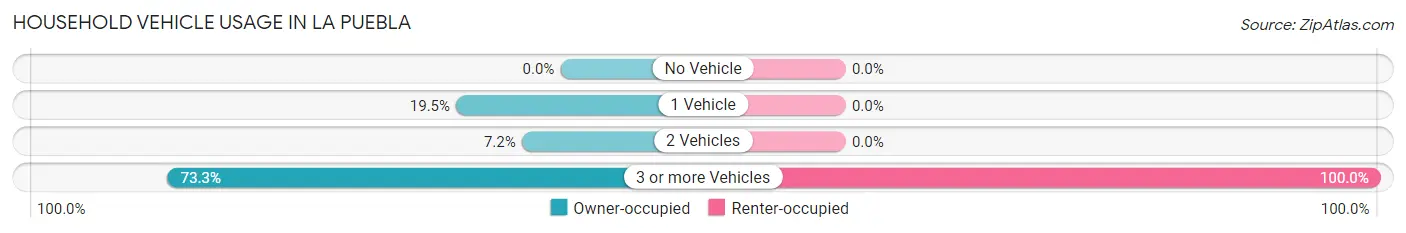
| Vehicles per Household | Owner-occupied | Renter-occupied |
| No Vehicle | 0 (0.0%) | 0 (0.0%) |
| 1 Vehicle | 54 (19.5%) | 0 (0.0%) |
| 2 Vehicles | 20 (7.2%) | 0 (0.0%) |
| 3 or more Vehicles | 203 (73.3%) | 40 (100.0%) |
| Total | 277 (100.0%) | 40 (100.0%) |
Real Estate & Mortgages in La Puebla
Real Estate and Mortgage Overview in La Puebla
| Characteristic | Without Mortgage | With Mortgage |
| Housing Units | 205 | 72 |
| Median Property Value | - | - |
| Median Household Income | $44,425 | $56 |
| Monthly Housing Costs | $564 | $0 |
| Real Estate Taxes | - | - |
Property Value by Mortgage Status in La Puebla
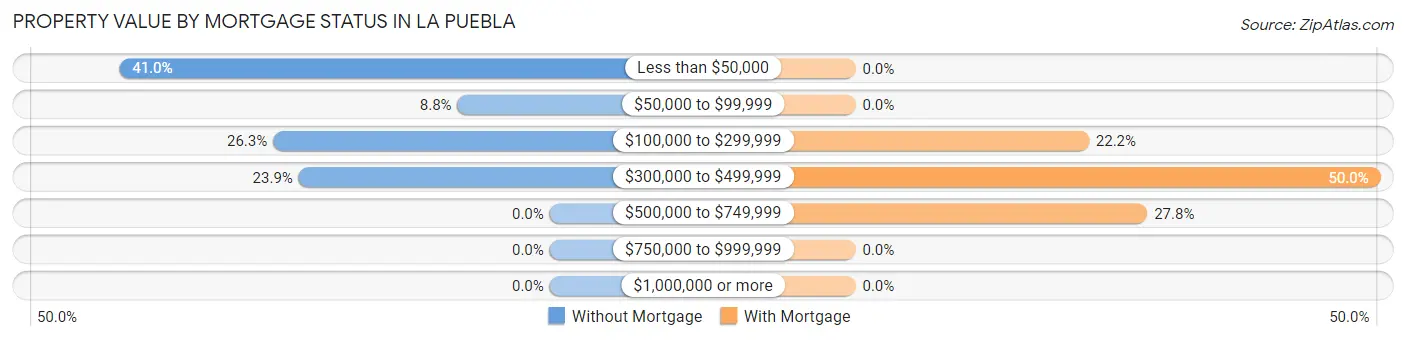
| Property Value | Without Mortgage | With Mortgage |
| Less than $50,000 | 84 (41.0%) | 0 (0.0%) |
| $50,000 to $99,999 | 18 (8.8%) | 0 (0.0%) |
| $100,000 to $299,999 | 54 (26.3%) | 16 (22.2%) |
| $300,000 to $499,999 | 49 (23.9%) | 36 (50.0%) |
| $500,000 to $749,999 | 0 (0.0%) | 20 (27.8%) |
| $750,000 to $999,999 | 0 (0.0%) | 0 (0.0%) |
| $1,000,000 or more | 0 (0.0%) | 0 (0.0%) |
| Total | 205 (100.0%) | 72 (100.0%) |
Household Income by Mortgage Status in La Puebla
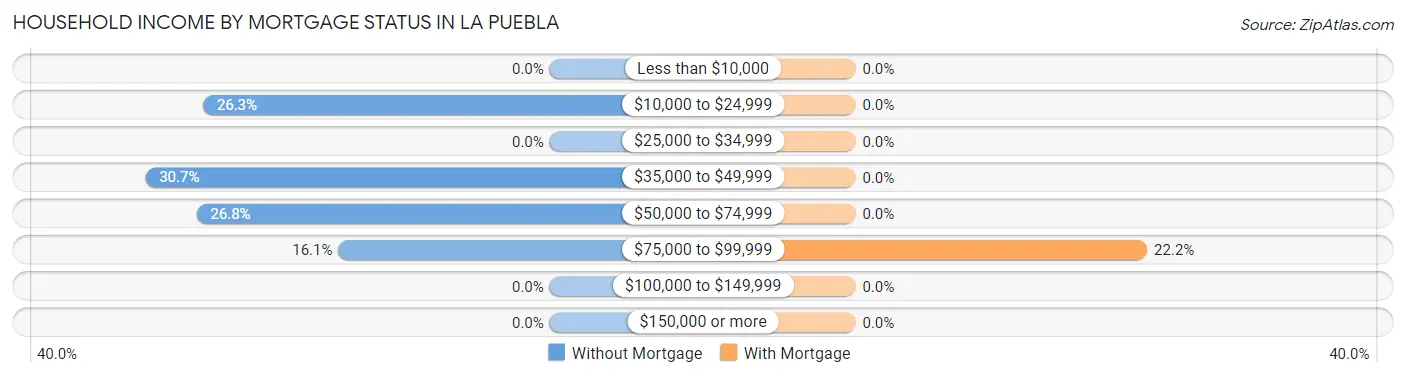
| Household Income | Without Mortgage | With Mortgage |
| Less than $10,000 | 0 (0.0%) | 0 (0.0%) |
| $10,000 to $24,999 | 54 (26.3%) | 0 (0.0%) |
| $25,000 to $34,999 | 0 (0.0%) | 0 (0.0%) |
| $35,000 to $49,999 | 63 (30.7%) | 0 (0.0%) |
| $50,000 to $74,999 | 55 (26.8%) | 0 (0.0%) |
| $75,000 to $99,999 | 33 (16.1%) | 16 (22.2%) |
| $100,000 to $149,999 | 0 (0.0%) | 0 (0.0%) |
| $150,000 or more | 0 (0.0%) | 0 (0.0%) |
| Total | 205 (100.0%) | 72 (100.0%) |
Property Value to Household Income Ratio in La Puebla
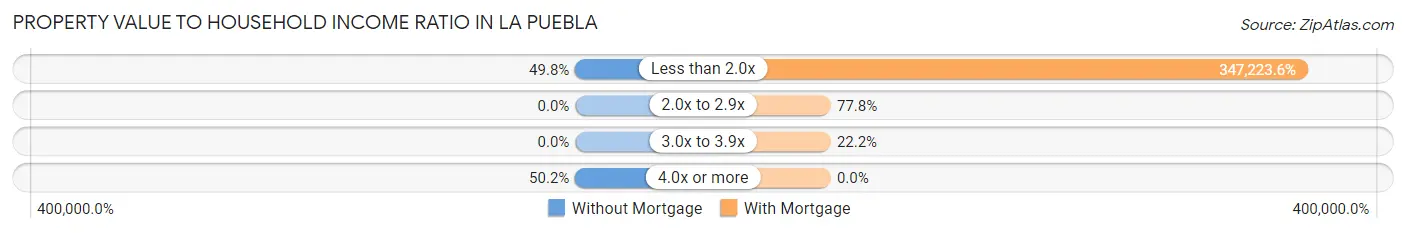
| Value-to-Income Ratio | Without Mortgage | With Mortgage |
| Less than 2.0x | 102 (49.8%) | 250,001 (347,223.6%) |
| 2.0x to 2.9x | 0 (0.0%) | 56 (77.8%) |
| 3.0x to 3.9x | 0 (0.0%) | 16 (22.2%) |
| 4.0x or more | 103 (50.2%) | 0 (0.0%) |
| Total | 205 (100.0%) | 72 (100.0%) |
Real Estate Taxes by Mortgage Status in La Puebla
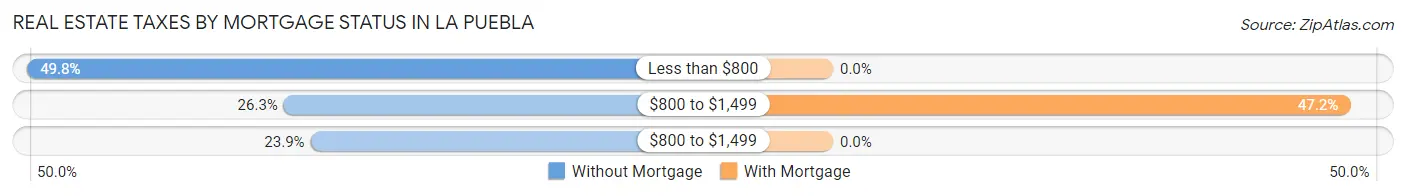
| Property Taxes | Without Mortgage | With Mortgage |
| Less than $800 | 102 (49.8%) | 0 (0.0%) |
| $800 to $1,499 | 54 (26.3%) | 34 (47.2%) |
| $800 to $1,499 | 49 (23.9%) | 0 (0.0%) |
| Total | 205 (100.0%) | 72 (100.0%) |
Health & Disability in La Puebla
Health Insurance Coverage by Age in La Puebla
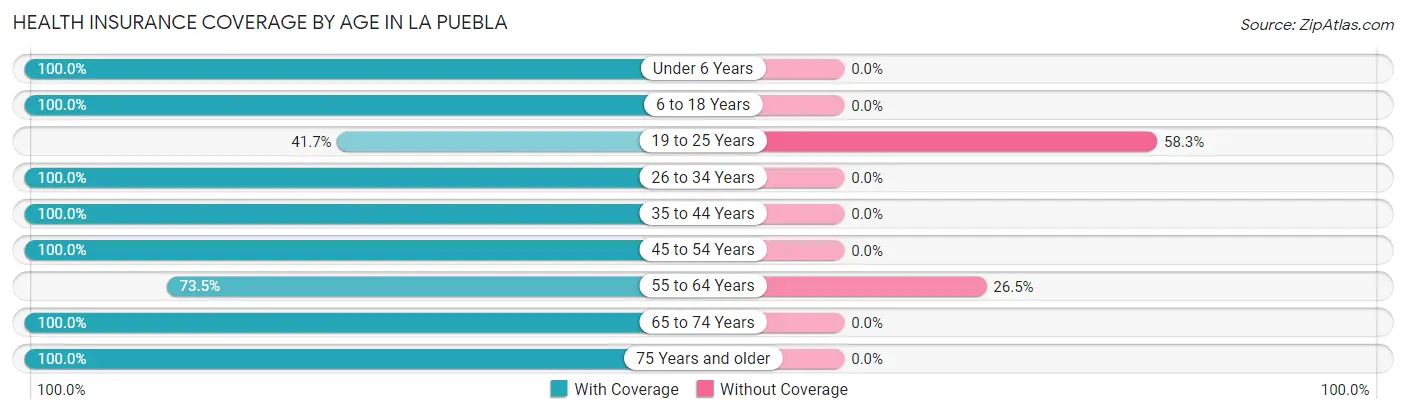
| Age Bracket | With Coverage | Without Coverage |
| Under 6 Years | 48 (100.0%) | 0 (0.0%) |
| 6 to 18 Years | 218 (100.0%) | 0 (0.0%) |
| 19 to 25 Years | 35 (41.7%) | 49 (58.3%) |
| 26 to 34 Years | 148 (100.0%) | 0 (0.0%) |
| 35 to 44 Years | 82 (100.0%) | 0 (0.0%) |
| 45 to 54 Years | 175 (100.0%) | 0 (0.0%) |
| 55 to 64 Years | 86 (73.5%) | 31 (26.5%) |
| 65 to 74 Years | 67 (100.0%) | 0 (0.0%) |
| 75 Years and older | 97 (100.0%) | 0 (0.0%) |
| Total | 956 (92.3%) | 80 (7.7%) |
Health Insurance Coverage by Citizenship Status in La Puebla
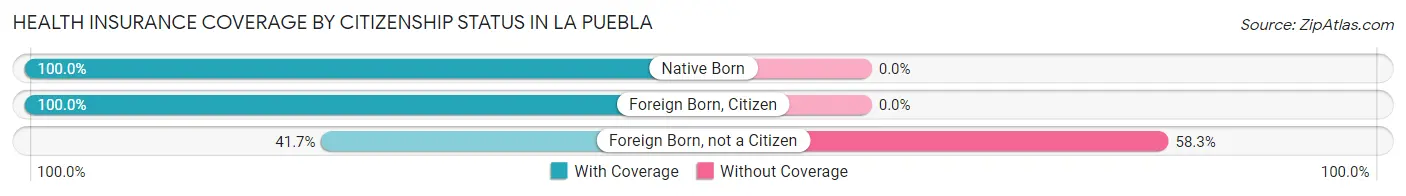
| Citizenship Status | With Coverage | Without Coverage |
| Native Born | 48 (100.0%) | 0 (0.0%) |
| Foreign Born, Citizen | 218 (100.0%) | 0 (0.0%) |
| Foreign Born, not a Citizen | 35 (41.7%) | 49 (58.3%) |
Health Insurance Coverage by Household Income in La Puebla
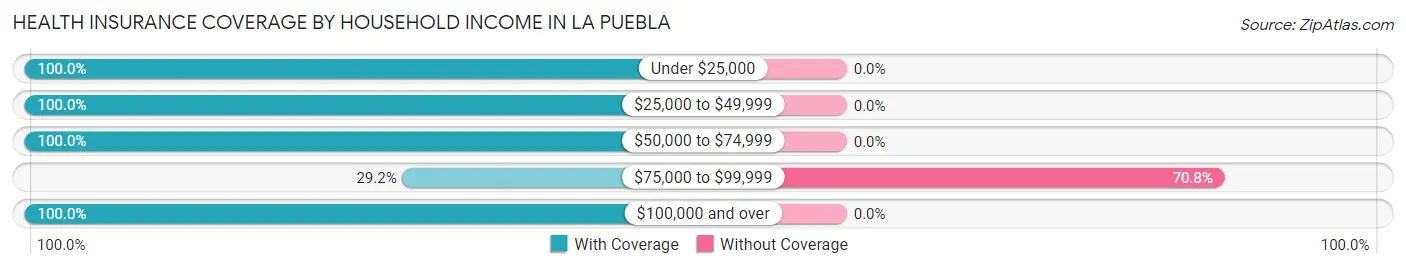
| Household Income | With Coverage | Without Coverage |
| Under $25,000 | 97 (100.0%) | 0 (0.0%) |
| $25,000 to $49,999 | 187 (100.0%) | 0 (0.0%) |
| $50,000 to $74,999 | 403 (100.0%) | 0 (0.0%) |
| $75,000 to $99,999 | 33 (29.2%) | 80 (70.8%) |
| $100,000 and over | 236 (100.0%) | 0 (0.0%) |
Public vs Private Health Insurance Coverage by Age in La Puebla
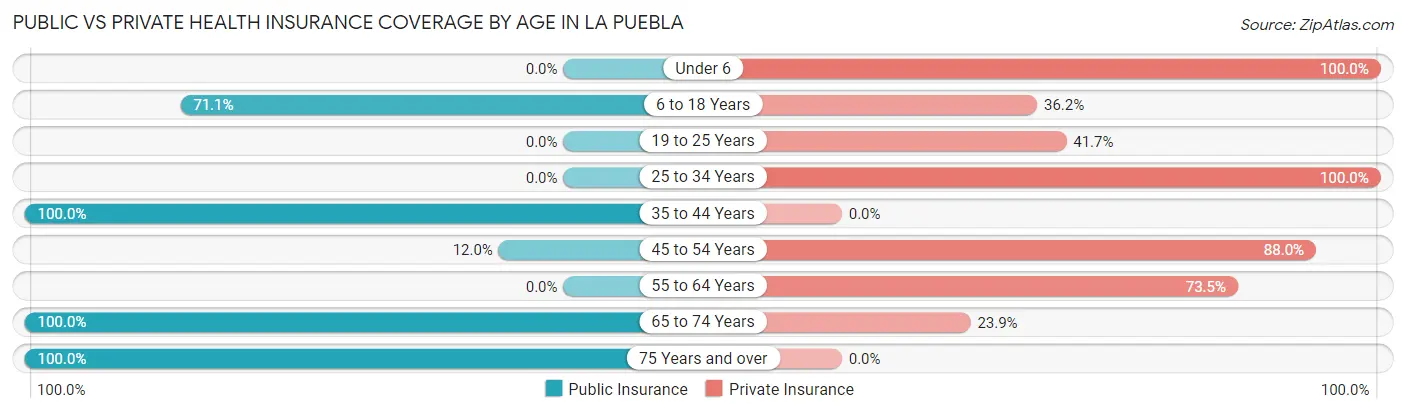
| Age Bracket | Public Insurance | Private Insurance |
| Under 6 | 0 (0.0%) | 48 (100.0%) |
| 6 to 18 Years | 155 (71.1%) | 79 (36.2%) |
| 19 to 25 Years | 0 (0.0%) | 35 (41.7%) |
| 25 to 34 Years | 0 (0.0%) | 148 (100.0%) |
| 35 to 44 Years | 82 (100.0%) | 0 (0.0%) |
| 45 to 54 Years | 21 (12.0%) | 154 (88.0%) |
| 55 to 64 Years | 0 (0.0%) | 86 (73.5%) |
| 65 to 74 Years | 67 (100.0%) | 16 (23.9%) |
| 75 Years and over | 97 (100.0%) | 0 (0.0%) |
| Total | 422 (40.7%) | 566 (54.6%) |
Disability Status by Sex by Age in La Puebla
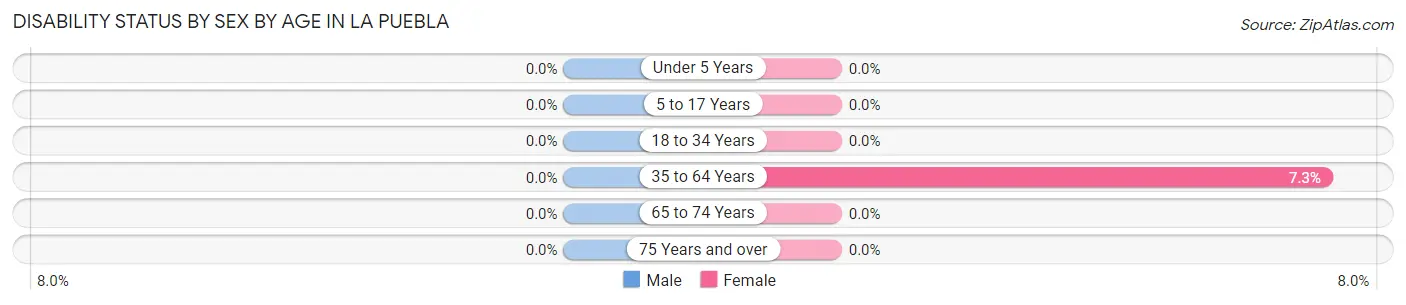
| Age Bracket | Male | Female |
| Under 5 Years | 0 (0.0%) | 0 (0.0%) |
| 5 to 17 Years | 0 (0.0%) | 0 (0.0%) |
| 18 to 34 Years | 0 (0.0%) | 0 (0.0%) |
| 35 to 64 Years | 0 (0.0%) | 18 (7.3%) |
| 65 to 74 Years | 0 (0.0%) | 0 (0.0%) |
| 75 Years and over | 0 (0.0%) | 0 (0.0%) |
Disability Class by Sex by Age in La Puebla
Disability Class: Hearing Difficulty
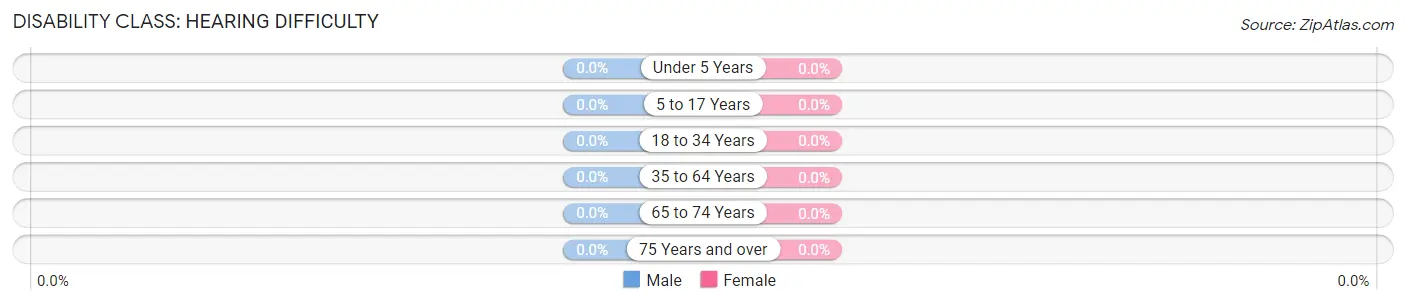
| Age Bracket | Male | Female |
| Under 5 Years | 0 (0.0%) | 0 (0.0%) |
| 5 to 17 Years | 0 (0.0%) | 0 (0.0%) |
| 18 to 34 Years | 0 (0.0%) | 0 (0.0%) |
| 35 to 64 Years | 0 (0.0%) | 0 (0.0%) |
| 65 to 74 Years | 0 (0.0%) | 0 (0.0%) |
| 75 Years and over | 0 (0.0%) | 0 (0.0%) |
Disability Class: Vision Difficulty
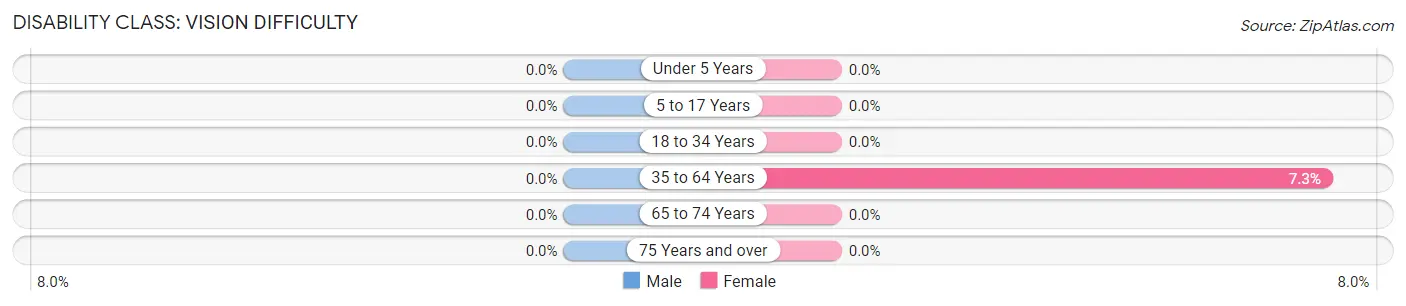
| Age Bracket | Male | Female |
| Under 5 Years | 0 (0.0%) | 0 (0.0%) |
| 5 to 17 Years | 0 (0.0%) | 0 (0.0%) |
| 18 to 34 Years | 0 (0.0%) | 0 (0.0%) |
| 35 to 64 Years | 0 (0.0%) | 18 (7.3%) |
| 65 to 74 Years | 0 (0.0%) | 0 (0.0%) |
| 75 Years and over | 0 (0.0%) | 0 (0.0%) |
Disability Class: Cognitive Difficulty
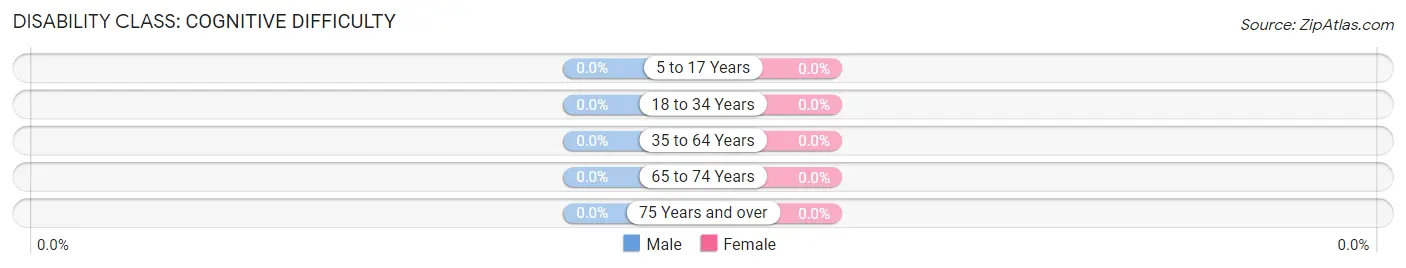
| Age Bracket | Male | Female |
| 5 to 17 Years | 0 (0.0%) | 0 (0.0%) |
| 18 to 34 Years | 0 (0.0%) | 0 (0.0%) |
| 35 to 64 Years | 0 (0.0%) | 0 (0.0%) |
| 65 to 74 Years | 0 (0.0%) | 0 (0.0%) |
| 75 Years and over | 0 (0.0%) | 0 (0.0%) |
Disability Class: Ambulatory Difficulty
| Age Bracket | Male | Female |
| 5 to 17 Years | 0 (0.0%) | 0 (0.0%) |
| 18 to 34 Years | 0 (0.0%) | 0 (0.0%) |
| 35 to 64 Years | 0 (0.0%) | 0 (0.0%) |
| 65 to 74 Years | 0 (0.0%) | 0 (0.0%) |
| 75 Years and over | 0 (0.0%) | 0 (0.0%) |
Disability Class: Self-Care Difficulty
| Age Bracket | Male | Female |
| 5 to 17 Years | 0 (0.0%) | 0 (0.0%) |
| 18 to 34 Years | 0 (0.0%) | 0 (0.0%) |
| 35 to 64 Years | 0 (0.0%) | 0 (0.0%) |
| 65 to 74 Years | 0 (0.0%) | 0 (0.0%) |
| 75 Years and over | 0 (0.0%) | 0 (0.0%) |
Technology Access in La Puebla
Computing Device Access in La Puebla
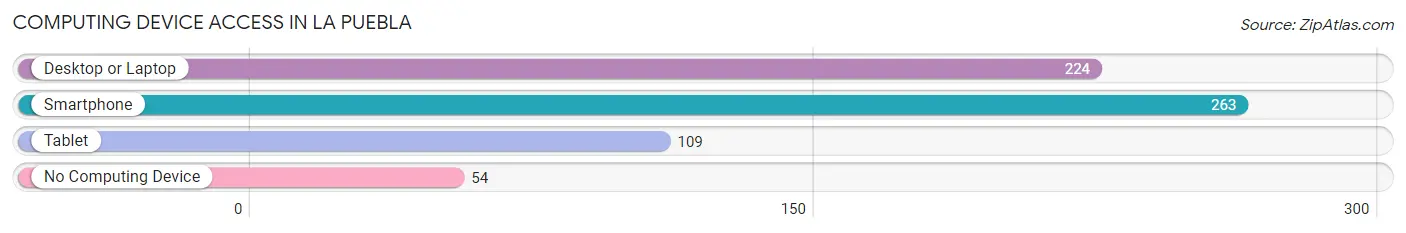
| Device Type | # Households | % Households |
| Desktop or Laptop | 224 | 70.7% |
| Smartphone | 263 | 83.0% |
| Tablet | 109 | 34.4% |
| No Computing Device | 54 | 17.0% |
| Total | 317 | 100.0% |
Internet Access in La Puebla
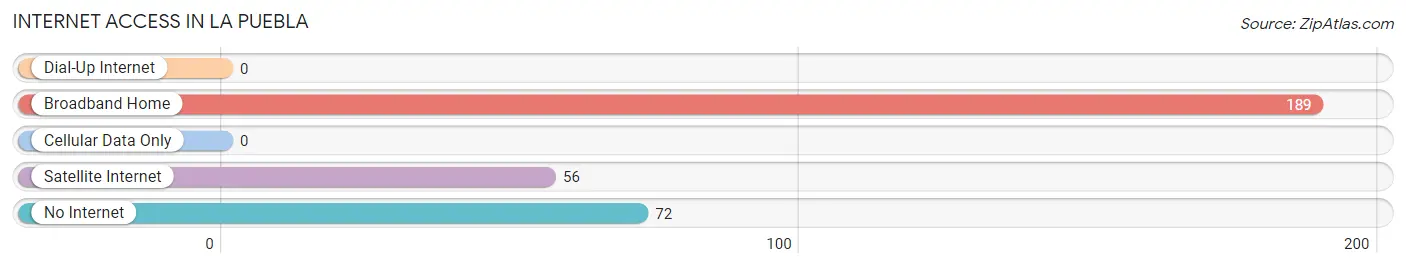
| Internet Type | # Households | % Households |
| Dial-Up Internet | 0 | 0.0% |
| Broadband Home | 189 | 59.6% |
| Cellular Data Only | 0 | 0.0% |
| Satellite Internet | 56 | 17.7% |
| No Internet | 72 | 22.7% |
| Total | 317 | 100.0% |
La Puebla Summary
La Puebla, New Mexico is a small town located in the northern part of the state, near the Colorado border. It is situated in the San Luis Valley, a large valley that stretches from the Sangre de Cristo Mountains in the east to the San Juan Mountains in the west. The town is located at an elevation of 7,000 feet and has a population of approximately 1,000 people.
History
La Puebla was founded in 1876 by a group of settlers from the nearby town of San Luis. The settlers were looking for a place to settle and farm, and they chose the area because of its fertile soil and abundant water supply. The town was originally called La Puebla de San Luis, but the name was eventually shortened to La Puebla.
The town grew quickly, and by the early 1900s it had become a thriving agricultural community. The main crops grown in the area were wheat, corn, and alfalfa. The town also had a number of small businesses, including a general store, a blacksmith shop, and a saloon.
In the early 1900s, La Puebla was also home to a large number of sheep and cattle ranches. The town was a major center for the wool industry, and it was home to several large wool warehouses.
Geography
La Puebla is located in the northern part of New Mexico, near the Colorado border. It is situated in the San Luis Valley, a large valley that stretches from the Sangre de Cristo Mountains in the east to the San Juan Mountains in the west. The town is located at an elevation of 7,000 feet and has a population of approximately 1,000 people.
The town is surrounded by rolling hills and mountains, and the area is known for its beautiful scenery. The nearby Rio Grande River provides a source of water for the town, and the area is also home to several small lakes and reservoirs.
Economy
The economy of La Puebla is largely based on agriculture. The main crops grown in the area are wheat, corn, and alfalfa. The town also has a number of small businesses, including a general store, a blacksmith shop, and a saloon.
The town is also home to several sheep and cattle ranches, and it is a major center for the wool industry. The town is home to several large wool warehouses, and it is also home to a number of small businesses that specialize in wool products.
Demographics
As of the 2010 census, the population of La Puebla was 1,000 people. The town is predominantly Hispanic, with approximately 95% of the population identifying as Hispanic or Latino. The median household income in the town is $25,000, and the median age is 33 years old.
La Puebla is a small, rural town with a close-knit community. The town is home to a number of churches, and it is also home to a number of small businesses. The town is known for its friendly atmosphere and its strong sense of community.
Common Questions
What is Per Capita Income in La Puebla?
Per Capita income in La Puebla is $31,832.
What is the Median Family Income in La Puebla?
Median Family Income in La Puebla is $60,110.
What is the Median Household income in La Puebla?
Median Household Income in La Puebla is $68,393.
What is Inequality or Gini Index in La Puebla?
Inequality or Gini Index in La Puebla is 0.43.
What is the Total Population of La Puebla?
Total Population of La Puebla is 1,036.
What is the Total Male Population of La Puebla?
Total Male Population of La Puebla is 536.
What is the Total Female Population of La Puebla?
Total Female Population of La Puebla is 500.
What is the Ratio of Males per 100 Females in La Puebla?
There are 107.20 Males per 100 Females in La Puebla.
What is the Ratio of Females per 100 Males in La Puebla?
There are 93.28 Females per 100 Males in La Puebla.
What is the Median Population Age in La Puebla?
Median Population Age in La Puebla is 42.2 Years.
What is the Average Family Size in La Puebla
Average Family Size in La Puebla is 3.2 People.
What is the Average Household Size in La Puebla
Average Household Size in La Puebla is 3.3 People.
How Large is the Labor Force in La Puebla?
There are 451 People in the Labor Forcein in La Puebla.
What is the Percentage of People in the Labor Force in La Puebla?
57.4% of People are in the Labor Force in La Puebla.
What is the Unemployment Rate in La Puebla?
Unemployment Rate in La Puebla is 18.2%.