Santa Clara Pueblo, NM Map & Demographics
Santa Clara Pueblo Map
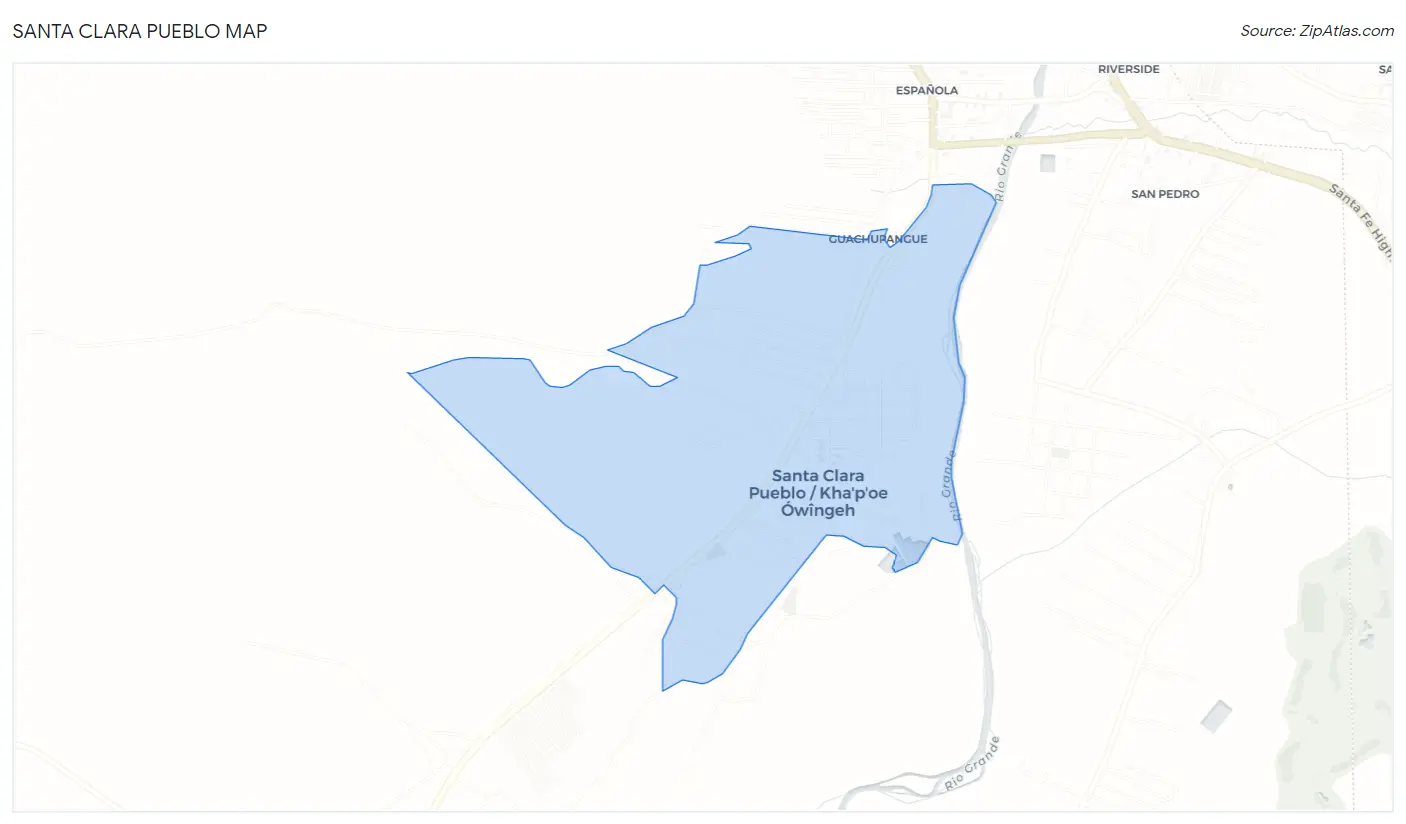
Santa Clara Pueblo Overview
$17,420
PER CAPITA INCOME
$73,333
AVG FAMILY INCOME
$48,625
AVG HOUSEHOLD INCOME
12.4%
WAGE / INCOME GAP [ % ]
87.6¢/ $1
WAGE / INCOME GAP [ $ ]
0.43
INEQUALITY / GINI INDEX
957
TOTAL POPULATION
522
MALE POPULATION
435
FEMALE POPULATION
120.00
MALES / 100 FEMALES
83.33
FEMALES / 100 MALES
28.8
MEDIAN AGE
6.0
AVG FAMILY SIZE
4.2
AVG HOUSEHOLD SIZE
298
LABOR FORCE [ PEOPLE ]
41.2%
PERCENT IN LABOR FORCE
1.3%
UNEMPLOYMENT RATE
Income in Santa Clara Pueblo
Income Overview in Santa Clara Pueblo
Per Capita Income in Santa Clara Pueblo is $17,420, while median incomes of families and households are $73,333 and $48,625 respectively.
| Characteristic | Number | Measure |
| Per Capita Income | 957 | $17,420 |
| Median Family Income | 136 | $73,333 |
| Mean Family Income | 136 | $71,040 |
| Median Household Income | 227 | $48,625 |
| Mean Household Income | 227 | $54,417 |
| Income Deficit | 136 | $0 |
| Wage / Income Gap (%) | 957 | 12.43% |
| Wage / Income Gap ($) | 957 | 87.57¢ per $1 |
| Gini / Inequality Index | 957 | 0.43 |
Earnings by Sex in Santa Clara Pueblo
Average Earnings in Santa Clara Pueblo are $41,797, $40,104 for men and $45,795 for women, a difference of 12.4%.
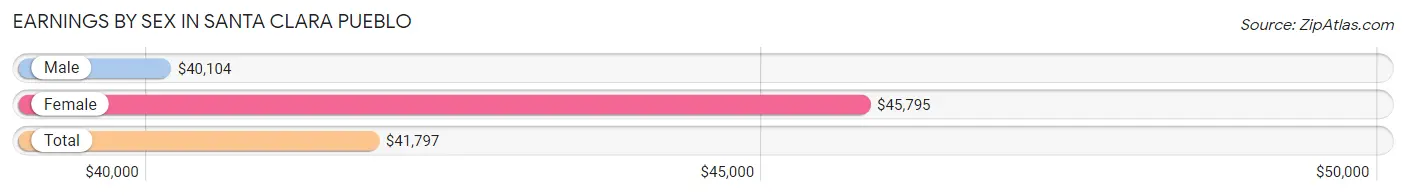
| Sex | Number | Average Earnings |
| Male | 145 (48.8%) | $40,104 |
| Female | 152 (51.2%) | $45,795 |
| Total | 297 (100.0%) | $41,797 |
Earnings by Sex by Income Bracket in Santa Clara Pueblo
The most common earnings brackets in Santa Clara Pueblo are $40,000 to $44,999 for men (26 | 17.9%) and $55,000 to $64,999 for women (31 | 20.4%).
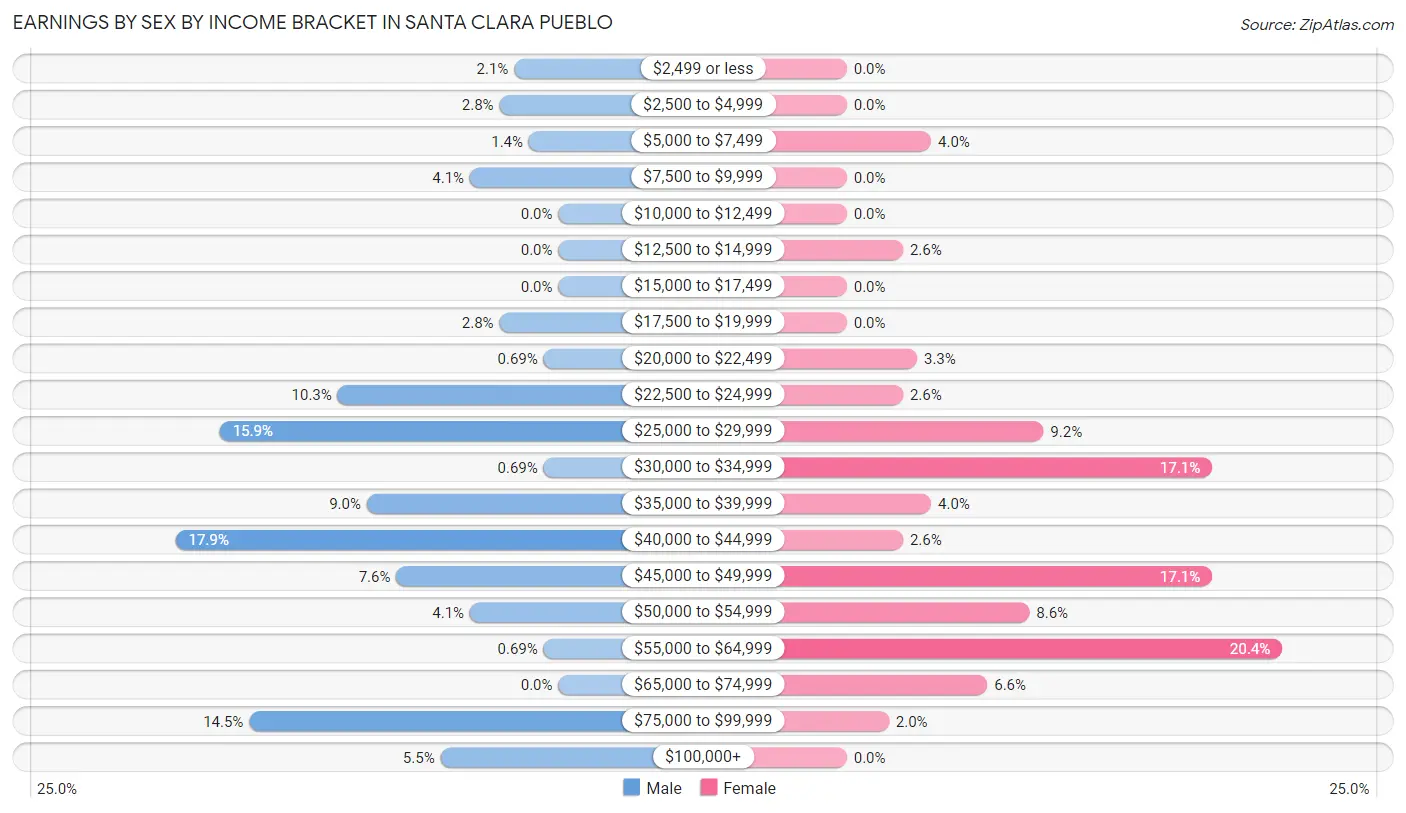
| Income | Male | Female |
| $2,499 or less | 3 (2.1%) | 0 (0.0%) |
| $2,500 to $4,999 | 4 (2.8%) | 0 (0.0%) |
| $5,000 to $7,499 | 2 (1.4%) | 6 (4.0%) |
| $7,500 to $9,999 | 6 (4.1%) | 0 (0.0%) |
| $10,000 to $12,499 | 0 (0.0%) | 0 (0.0%) |
| $12,500 to $14,999 | 0 (0.0%) | 4 (2.6%) |
| $15,000 to $17,499 | 0 (0.0%) | 0 (0.0%) |
| $17,500 to $19,999 | 4 (2.8%) | 0 (0.0%) |
| $20,000 to $22,499 | 1 (0.7%) | 5 (3.3%) |
| $22,500 to $24,999 | 15 (10.3%) | 4 (2.6%) |
| $25,000 to $29,999 | 23 (15.9%) | 14 (9.2%) |
| $30,000 to $34,999 | 1 (0.7%) | 26 (17.1%) |
| $35,000 to $39,999 | 13 (9.0%) | 6 (4.0%) |
| $40,000 to $44,999 | 26 (17.9%) | 4 (2.6%) |
| $45,000 to $49,999 | 11 (7.6%) | 26 (17.1%) |
| $50,000 to $54,999 | 6 (4.1%) | 13 (8.6%) |
| $55,000 to $64,999 | 1 (0.7%) | 31 (20.4%) |
| $65,000 to $74,999 | 0 (0.0%) | 10 (6.6%) |
| $75,000 to $99,999 | 21 (14.5%) | 3 (2.0%) |
| $100,000+ | 8 (5.5%) | 0 (0.0%) |
| Total | 145 (100.0%) | 152 (100.0%) |
Earnings by Sex by Educational Attainment in Santa Clara Pueblo
Average earnings in Santa Clara Pueblo are $42,500 for men and $45,795 for women, a difference of 7.2%. Men with an educational attainment of college or associate's degree enjoy the highest average annual earnings of $49,750, while those with bachelor's degree education earn the least with $40,000. Women with an educational attainment of bachelor's degree earn the most with the average annual earnings of $55,313, while those with college or associate's degree education have the smallest earnings of $45,395.
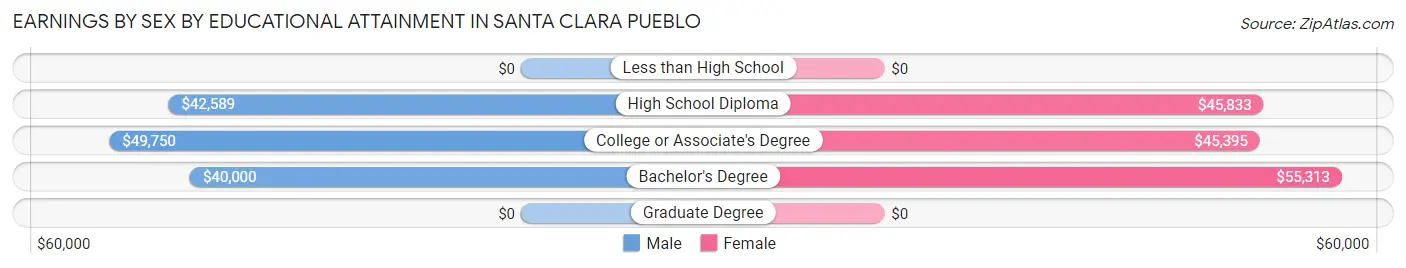
| Educational Attainment | Male Income | Female Income |
| Less than High School | - | - |
| High School Diploma | $42,589 | $45,833 |
| College or Associate's Degree | $49,750 | $45,395 |
| Bachelor's Degree | $40,000 | $55,313 |
| Graduate Degree | - | - |
| Total | $42,500 | $45,795 |
Family Income in Santa Clara Pueblo
Family Income Brackets in Santa Clara Pueblo
According to the Santa Clara Pueblo family income data, there are 34 families falling into the $100,000 to $149,999 income range, which is the most common income bracket and makes up 25.0% of all families.
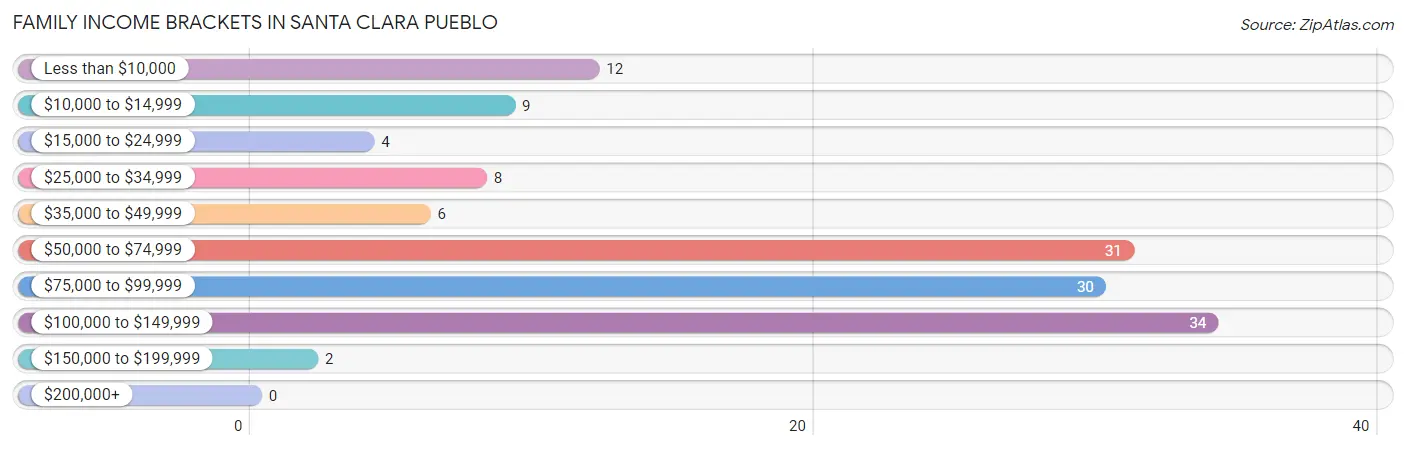
| Income Bracket | # Families | % Families |
| Less than $10,000 | 12 | 8.8% |
| $10,000 to $14,999 | 9 | 6.6% |
| $15,000 to $24,999 | 4 | 2.9% |
| $25,000 to $34,999 | 8 | 5.9% |
| $35,000 to $49,999 | 6 | 4.4% |
| $50,000 to $74,999 | 31 | 22.8% |
| $75,000 to $99,999 | 30 | 22.1% |
| $100,000 to $149,999 | 34 | 25.0% |
| $150,000 to $199,999 | 2 | 1.5% |
| $200,000+ | 0 | 0.0% |
Family Income by Famaliy Size in Santa Clara Pueblo
3-person families (32 | 23.5%) account for the highest median family income in Santa Clara Pueblo with $98,500 per family, while 2-person families (66 | 48.5%) have the highest median income of $46,250 per family member.
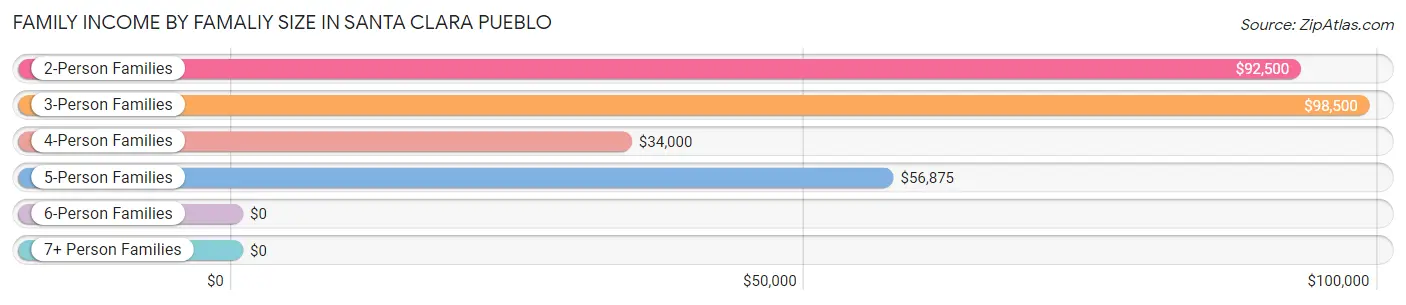
| Income Bracket | # Families | Median Income |
| 2-Person Families | 66 (48.5%) | $92,500 |
| 3-Person Families | 32 (23.5%) | $98,500 |
| 4-Person Families | 20 (14.7%) | $34,000 |
| 5-Person Families | 13 (9.6%) | $56,875 |
| 6-Person Families | 0 (0.0%) | $0 |
| 7+ Person Families | 5 (3.7%) | $0 |
| Total | 136 (100.0%) | $73,333 |
Family Income by Number of Earners in Santa Clara Pueblo
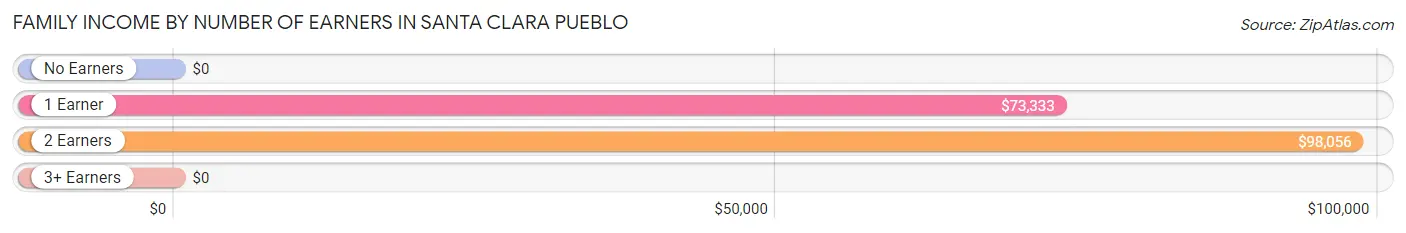
| Number of Earners | # Families | Median Income |
| No Earners | 35 (25.7%) | $0 |
| 1 Earner | 52 (38.2%) | $73,333 |
| 2 Earners | 48 (35.3%) | $98,056 |
| 3+ Earners | 1 (0.7%) | $0 |
| Total | 136 (100.0%) | $73,333 |
Household Income in Santa Clara Pueblo
Household Income Brackets in Santa Clara Pueblo
With 39 households falling in the category, the $50,000 to $74,999 income range is the most frequent in Santa Clara Pueblo, accounting for 17.2% of all households.
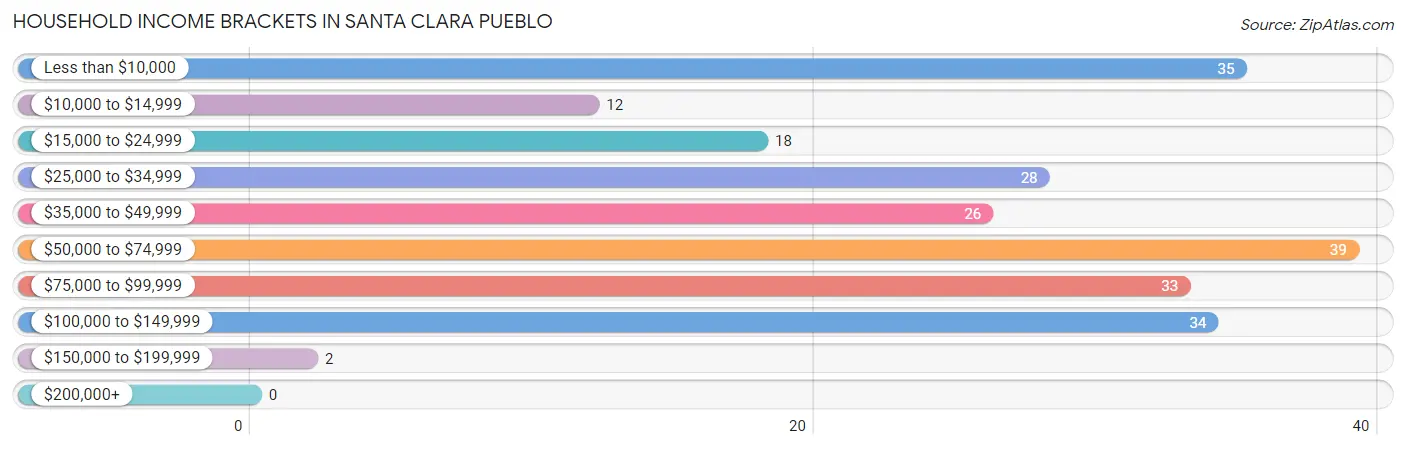
| Income Bracket | # Households | % Households |
| Less than $10,000 | 35 | 15.4% |
| $10,000 to $14,999 | 12 | 5.3% |
| $15,000 to $24,999 | 18 | 7.9% |
| $25,000 to $34,999 | 28 | 12.3% |
| $35,000 to $49,999 | 26 | 11.5% |
| $50,000 to $74,999 | 39 | 17.2% |
| $75,000 to $99,999 | 33 | 14.5% |
| $100,000 to $149,999 | 34 | 15.0% |
| $150,000 to $199,999 | 2 | 0.9% |
| $200,000+ | 0 | 0.0% |
Household Income by Householder Age in Santa Clara Pueblo
The median household income in Santa Clara Pueblo is $48,625, with the highest median household income of $64,375 found in the 45 to 64 years age bracket for the primary householder. A total of 123 households (54.2%) fall into this category.
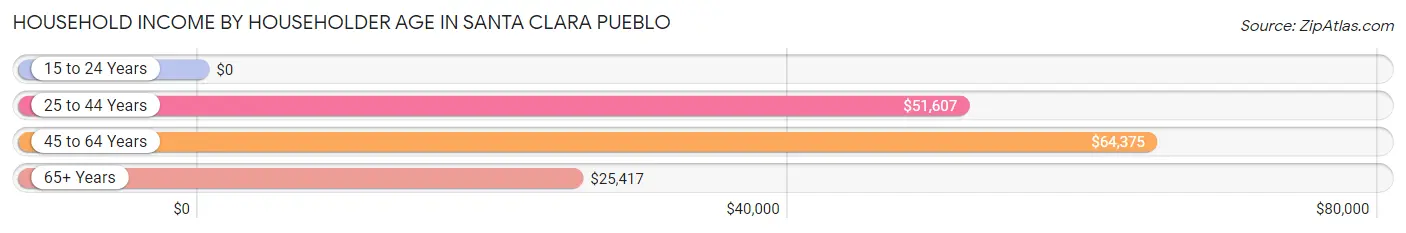
| Income Bracket | # Households | Median Income |
| 15 to 24 Years | 0 (0.0%) | $0 |
| 25 to 44 Years | 35 (15.4%) | $51,607 |
| 45 to 64 Years | 123 (54.2%) | $64,375 |
| 65+ Years | 69 (30.4%) | $25,417 |
| Total | 227 (100.0%) | $48,625 |
Poverty in Santa Clara Pueblo
Income Below Poverty by Sex and Age in Santa Clara Pueblo
With 36.2% poverty level for males and 20.0% for females among the residents of Santa Clara Pueblo, 5 year old males and 25 to 34 year old females are the most vulnerable to poverty, with 8 males (80.0%) and 17 females (46.0%) in their respective age groups living below the poverty level.
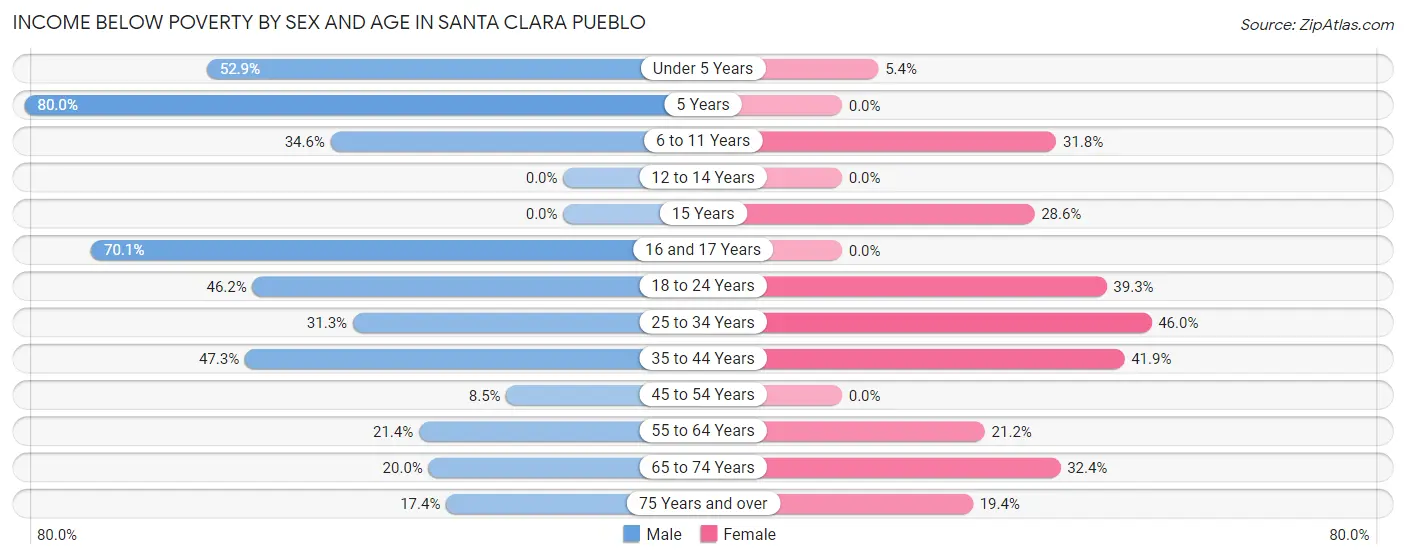
| Age Bracket | Male | Female |
| Under 5 Years | 9 (52.9%) | 2 (5.4%) |
| 5 Years | 8 (80.0%) | 0 (0.0%) |
| 6 to 11 Years | 19 (34.5%) | 14 (31.8%) |
| 12 to 14 Years | 0 (0.0%) | 0 (0.0%) |
| 15 Years | 0 (0.0%) | 4 (28.6%) |
| 16 and 17 Years | 54 (70.1%) | 0 (0.0%) |
| 18 to 24 Years | 42 (46.2%) | 11 (39.3%) |
| 25 to 34 Years | 5 (31.2%) | 17 (46.0%) |
| 35 to 44 Years | 26 (47.3%) | 13 (41.9%) |
| 45 to 54 Years | 6 (8.5%) | 0 (0.0%) |
| 55 to 64 Years | 12 (21.4%) | 7 (21.2%) |
| 65 to 74 Years | 4 (20.0%) | 12 (32.4%) |
| 75 Years and over | 4 (17.4%) | 7 (19.4%) |
| Total | 189 (36.2%) | 87 (20.0%) |
Income Above Poverty by Sex and Age in Santa Clara Pueblo
According to the poverty statistics in Santa Clara Pueblo, males aged 12 to 14 years and females aged 12 to 14 years are the age groups that are most secure financially, with 100.0% of males and 100.0% of females in these age groups living above the poverty line.
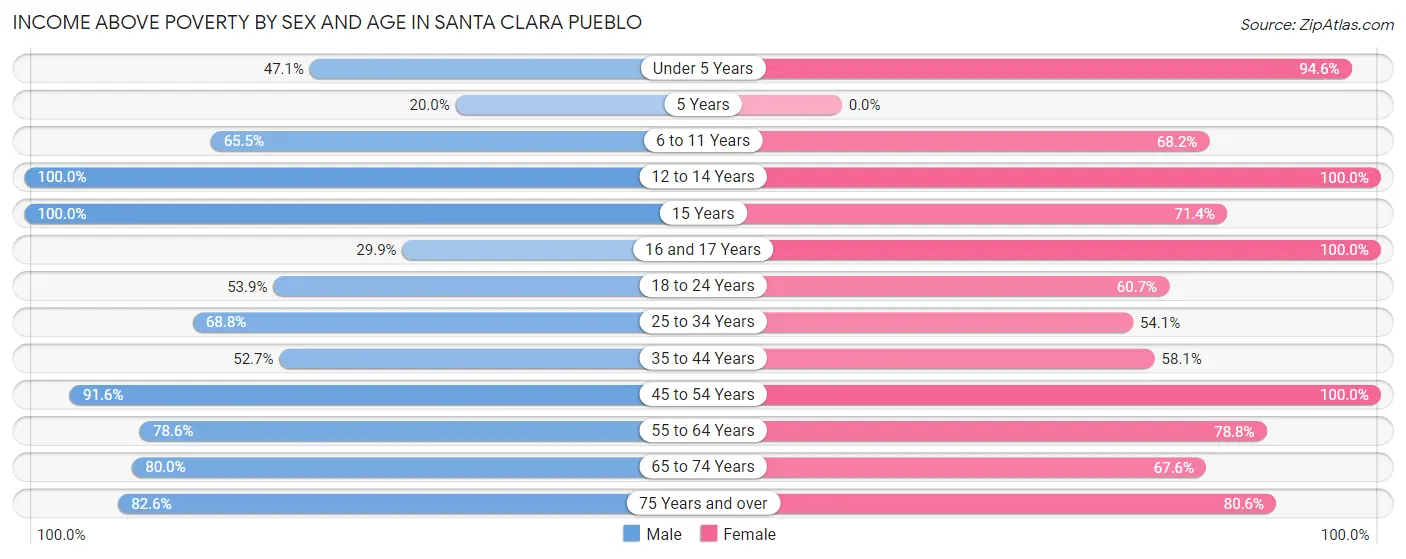
| Age Bracket | Male | Female |
| Under 5 Years | 8 (47.1%) | 35 (94.6%) |
| 5 Years | 2 (20.0%) | 0 (0.0%) |
| 6 to 11 Years | 36 (65.4%) | 30 (68.2%) |
| 12 to 14 Years | 22 (100.0%) | 26 (100.0%) |
| 15 Years | 9 (100.0%) | 10 (71.4%) |
| 16 and 17 Years | 23 (29.9%) | 22 (100.0%) |
| 18 to 24 Years | 49 (53.8%) | 17 (60.7%) |
| 25 to 34 Years | 11 (68.8%) | 20 (54.0%) |
| 35 to 44 Years | 29 (52.7%) | 18 (58.1%) |
| 45 to 54 Years | 65 (91.5%) | 90 (100.0%) |
| 55 to 64 Years | 44 (78.6%) | 26 (78.8%) |
| 65 to 74 Years | 16 (80.0%) | 25 (67.6%) |
| 75 Years and over | 19 (82.6%) | 29 (80.6%) |
| Total | 333 (63.8%) | 348 (80.0%) |
Income Below Poverty Among Married-Couple Families in Santa Clara Pueblo
The poverty statistics for married-couple families in Santa Clara Pueblo show that 11.6% or 8 of the total 69 families live below the poverty line. Families with 1 or 2 children have the highest poverty rate of 16.7%, comprising of 4 families. On the other hand, families with 3 or 4 children have the lowest poverty rate of 0.0%, which includes 0 families.
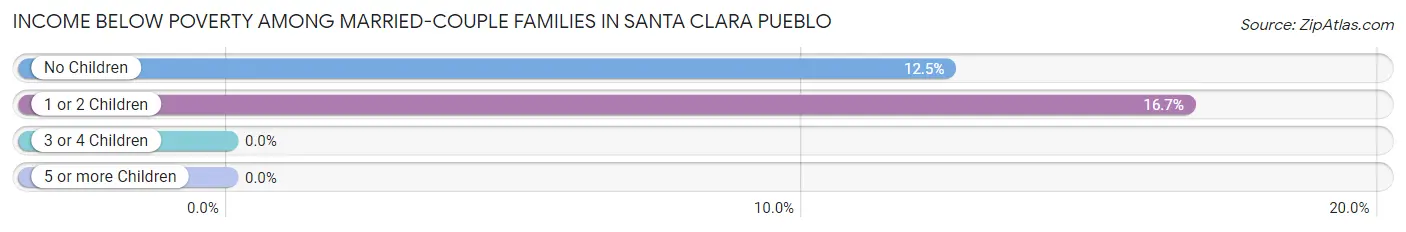
| Children | Above Poverty | Below Poverty |
| No Children | 28 (87.5%) | 4 (12.5%) |
| 1 or 2 Children | 20 (83.3%) | 4 (16.7%) |
| 3 or 4 Children | 13 (100.0%) | 0 (0.0%) |
| 5 or more Children | 0 (0.0%) | 0 (0.0%) |
| Total | 61 (88.4%) | 8 (11.6%) |
Income Below Poverty Among Single-Parent Households in Santa Clara Pueblo
According to the poverty data in Santa Clara Pueblo, 24.0% or 6 single-father households and 33.3% or 14 single-mother households are living below the poverty line. Among single-father households, those with no children have the highest poverty rate, with 6 households (33.3%) experiencing poverty. Likewise, among single-mother households, those with 1 or 2 children have the highest poverty rate, with 14 households (66.7%) falling below the poverty line.
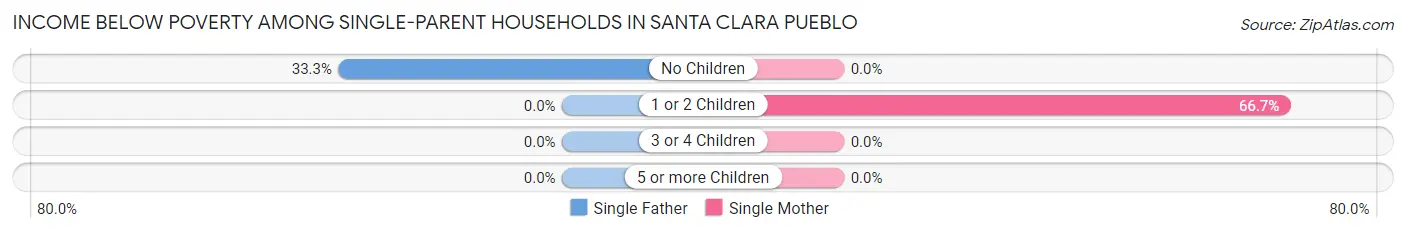
| Children | Single Father | Single Mother |
| No Children | 6 (33.3%) | 0 (0.0%) |
| 1 or 2 Children | 0 (0.0%) | 14 (66.7%) |
| 3 or 4 Children | 0 (0.0%) | 0 (0.0%) |
| 5 or more Children | 0 (0.0%) | 0 (0.0%) |
| Total | 6 (24.0%) | 14 (33.3%) |
Income Below Poverty Among Married-Couple vs Single-Parent Households in Santa Clara Pueblo
The poverty data for Santa Clara Pueblo shows that 8 of the married-couple family households (11.6%) and 20 of the single-parent households (29.8%) are living below the poverty level. Within the married-couple family households, those with 1 or 2 children have the highest poverty rate, with 4 households (16.7%) falling below the poverty line. Among the single-parent households, those with 1 or 2 children have the highest poverty rate, with 14 household (50.0%) living below poverty.
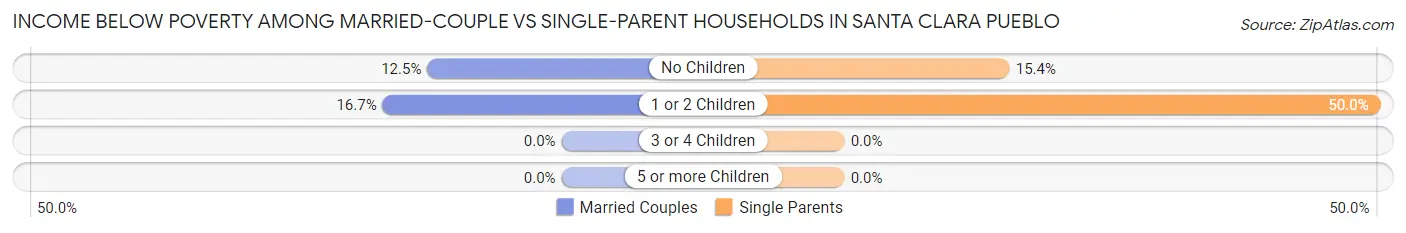
| Children | Married-Couple Families | Single-Parent Households |
| No Children | 4 (12.5%) | 6 (15.4%) |
| 1 or 2 Children | 4 (16.7%) | 14 (50.0%) |
| 3 or 4 Children | 0 (0.0%) | 0 (0.0%) |
| 5 or more Children | 0 (0.0%) | 0 (0.0%) |
| Total | 8 (11.6%) | 20 (29.8%) |
Race in Santa Clara Pueblo
The most populous races in Santa Clara Pueblo are Native / Alaskan (729 | 76.2%), Hispanic or Latino (170 | 17.8%), and Two or more Races (116 | 12.1%).
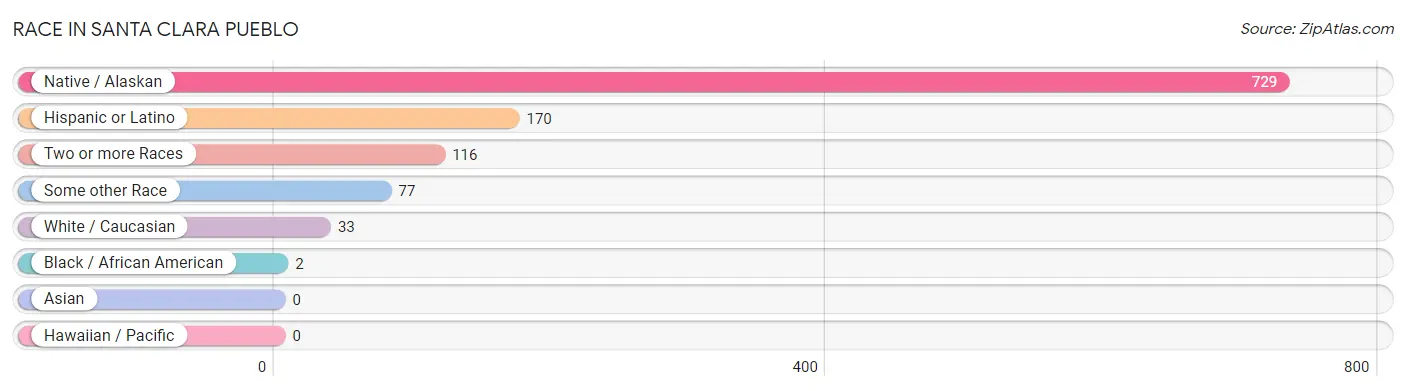
| Race | # Population | % Population |
| Asian | 0 | 0.0% |
| Black / African American | 2 | 0.2% |
| Hawaiian / Pacific | 0 | 0.0% |
| Hispanic or Latino | 170 | 17.8% |
| Native / Alaskan | 729 | 76.2% |
| White / Caucasian | 33 | 3.5% |
| Two or more Races | 116 | 12.1% |
| Some other Race | 77 | 8.1% |
| Total | 957 | 100.0% |
Ancestry in Santa Clara Pueblo
The most populous ancestries reported in Santa Clara Pueblo are Pueblo (691 | 72.2%), American (133 | 13.9%), Spaniard (99 | 10.3%), Navajo (65 | 6.8%), and Choctaw (25 | 2.6%), together accounting for 105.8% of all Santa Clara Pueblo residents.
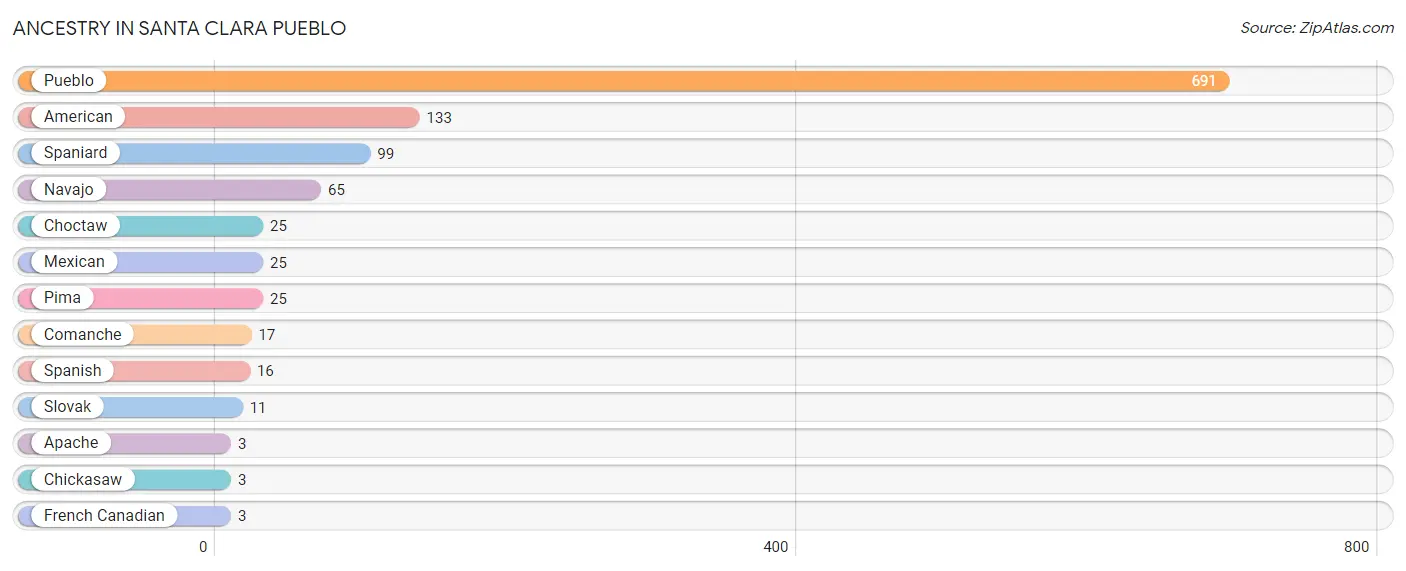
| Ancestry | # Population | % Population |
| American | 133 | 13.9% |
| Apache | 3 | 0.3% |
| Chickasaw | 3 | 0.3% |
| Choctaw | 25 | 2.6% |
| Comanche | 17 | 1.8% |
| French Canadian | 3 | 0.3% |
| Mexican | 25 | 2.6% |
| Navajo | 65 | 6.8% |
| Pima | 25 | 2.6% |
| Pueblo | 691 | 72.2% |
| Slovak | 11 | 1.1% |
| Spaniard | 99 | 10.3% |
| Spanish | 16 | 1.7% | View All 13 Rows |
Immigrants in Santa Clara Pueblo

| Immigration Origin | # Population | % Population | View All 0 Rows |
Sex and Age in Santa Clara Pueblo
Sex and Age in Santa Clara Pueblo
The most populous age groups in Santa Clara Pueblo are 15 to 19 Years (133 | 25.5%) for men and 15 to 19 Years (64 | 14.7%) for women.
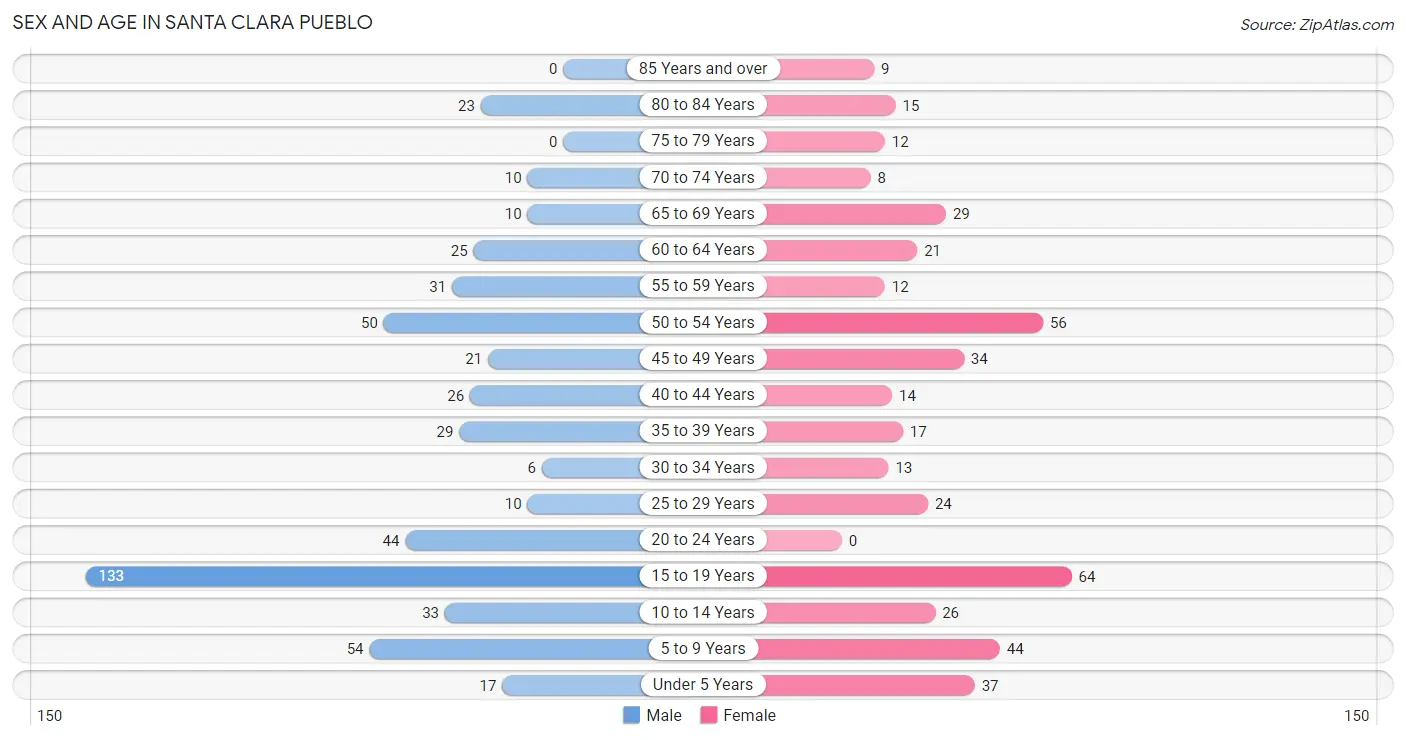
| Age Bracket | Male | Female |
| Under 5 Years | 17 (3.3%) | 37 (8.5%) |
| 5 to 9 Years | 54 (10.3%) | 44 (10.1%) |
| 10 to 14 Years | 33 (6.3%) | 26 (6.0%) |
| 15 to 19 Years | 133 (25.5%) | 64 (14.7%) |
| 20 to 24 Years | 44 (8.4%) | 0 (0.0%) |
| 25 to 29 Years | 10 (1.9%) | 24 (5.5%) |
| 30 to 34 Years | 6 (1.1%) | 13 (3.0%) |
| 35 to 39 Years | 29 (5.6%) | 17 (3.9%) |
| 40 to 44 Years | 26 (5.0%) | 14 (3.2%) |
| 45 to 49 Years | 21 (4.0%) | 34 (7.8%) |
| 50 to 54 Years | 50 (9.6%) | 56 (12.9%) |
| 55 to 59 Years | 31 (5.9%) | 12 (2.8%) |
| 60 to 64 Years | 25 (4.8%) | 21 (4.8%) |
| 65 to 69 Years | 10 (1.9%) | 29 (6.7%) |
| 70 to 74 Years | 10 (1.9%) | 8 (1.8%) |
| 75 to 79 Years | 0 (0.0%) | 12 (2.8%) |
| 80 to 84 Years | 23 (4.4%) | 15 (3.5%) |
| 85 Years and over | 0 (0.0%) | 9 (2.1%) |
| Total | 522 (100.0%) | 435 (100.0%) |
Families and Households in Santa Clara Pueblo
Median Family Size in Santa Clara Pueblo
The median family size in Santa Clara Pueblo is 5.98 persons per family, with single female/mother families (42 | 30.9%) accounting for the largest median family size of 7.43 persons per family. On the other hand, single male/father families (25 | 18.4%) represent the smallest median family size with 3.52 persons per family.
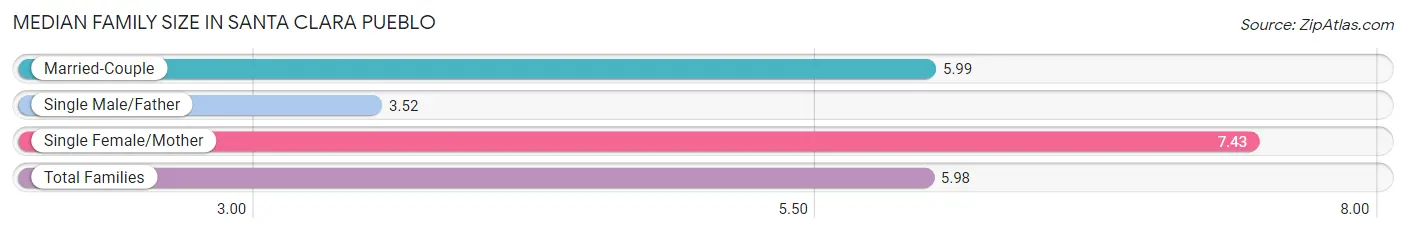
| Family Type | # Families | Family Size |
| Married-Couple | 69 (50.7%) | 5.99 |
| Single Male/Father | 25 (18.4%) | 3.52 |
| Single Female/Mother | 42 (30.9%) | 7.43 |
| Total Families | 136 (100.0%) | 5.98 |
Median Household Size in Santa Clara Pueblo
The median household size in Santa Clara Pueblo is 4.22 persons per household, with single female/mother households (42 | 18.5%) accounting for the largest median household size of 7.95 persons per household. non-family households (91 | 40.1%) represent the smallest median household size with 1.34 persons per household.
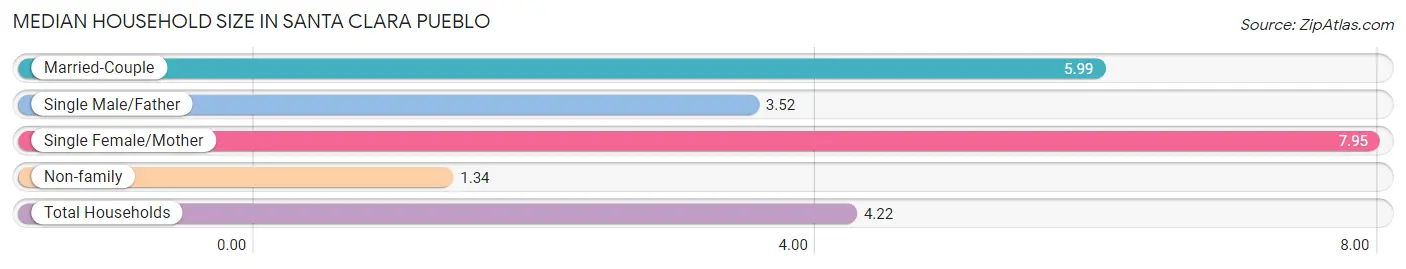
| Household Type | # Households | Household Size |
| Married-Couple | 69 (30.4%) | 5.99 |
| Single Male/Father | 25 (11.0%) | 3.52 |
| Single Female/Mother | 42 (18.5%) | 7.95 |
| Non-family | 91 (40.1%) | 1.34 |
| Total Households | 227 (100.0%) | 4.22 |
Household Size by Marriage Status in Santa Clara Pueblo
Out of a total of 227 households in Santa Clara Pueblo, 136 (59.9%) are family households, while 91 (40.1%) are nonfamily households. The most numerous type of family households are 2-person households, comprising 62, and the most common type of nonfamily households are 1-person households, comprising 70.
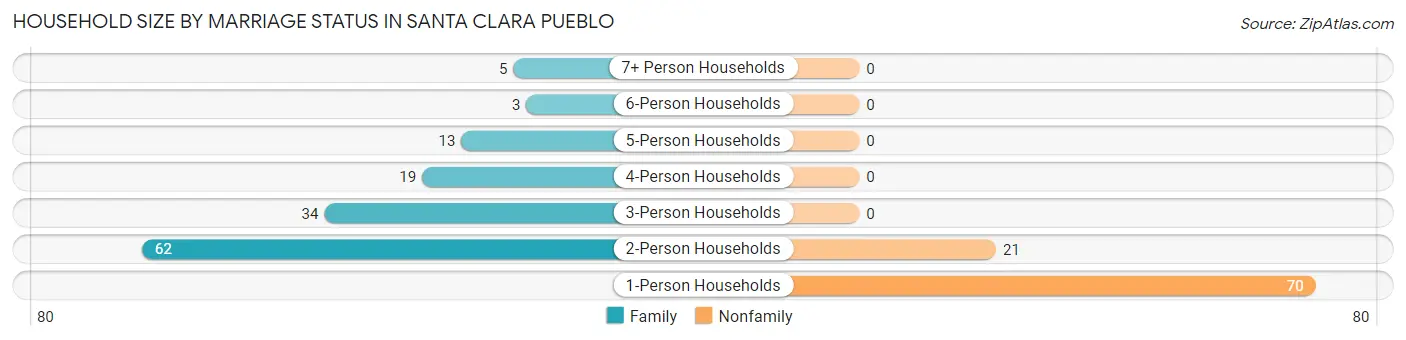
| Household Size | Family Households | Nonfamily Households |
| 1-Person Households | - | 70 (30.8%) |
| 2-Person Households | 62 (27.3%) | 21 (9.2%) |
| 3-Person Households | 34 (15.0%) | 0 (0.0%) |
| 4-Person Households | 19 (8.4%) | 0 (0.0%) |
| 5-Person Households | 13 (5.7%) | 0 (0.0%) |
| 6-Person Households | 3 (1.3%) | 0 (0.0%) |
| 7+ Person Households | 5 (2.2%) | 0 (0.0%) |
| Total | 136 (59.9%) | 91 (40.1%) |
Female Fertility in Santa Clara Pueblo
Fertility by Age in Santa Clara Pueblo
Average fertility rate in Santa Clara Pueblo is 12.0 births per 1,000 women. Women in the age bracket of 20 to 34 years have the highest fertility rate with 54.0 births per 1,000 women. Women in the age bracket of 20 to 34 years acount for 100.0% of all women with births.
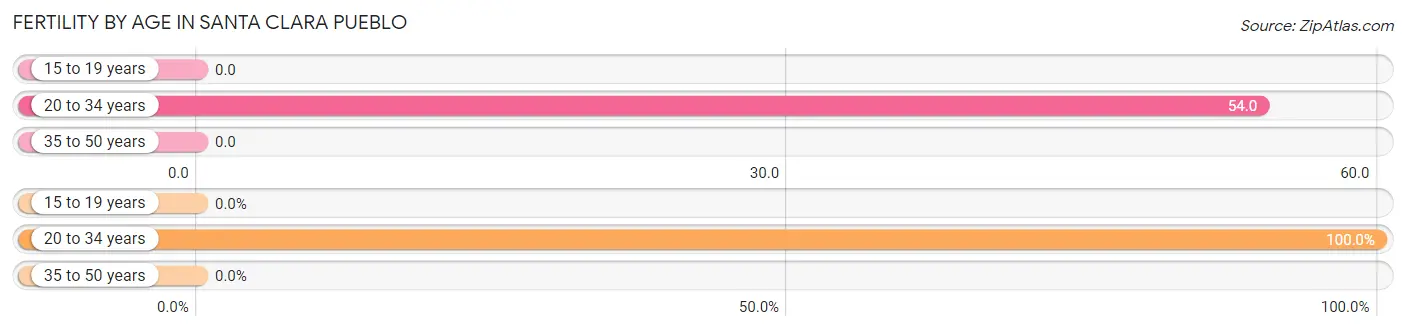
| Age Bracket | Women with Births | Births / 1,000 Women |
| 15 to 19 years | 0 (0.0%) | 0.0 |
| 20 to 34 years | 2 (100.0%) | 54.0 |
| 35 to 50 years | 0 (0.0%) | 0.0 |
| Total | 2 (100.0%) | 12.0 |
Fertility by Age by Marriage Status in Santa Clara Pueblo
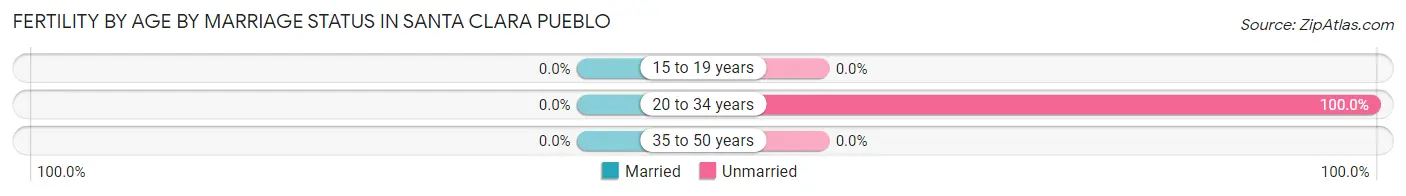
| Age Bracket | Married | Unmarried |
| 15 to 19 years | 0 (0.0%) | 0 (0.0%) |
| 20 to 34 years | 0 (0.0%) | 2 (100.0%) |
| 35 to 50 years | 0 (0.0%) | 0 (0.0%) |
| Total | 0 (0.0%) | 2 (100.0%) |
Fertility by Education in Santa Clara Pueblo
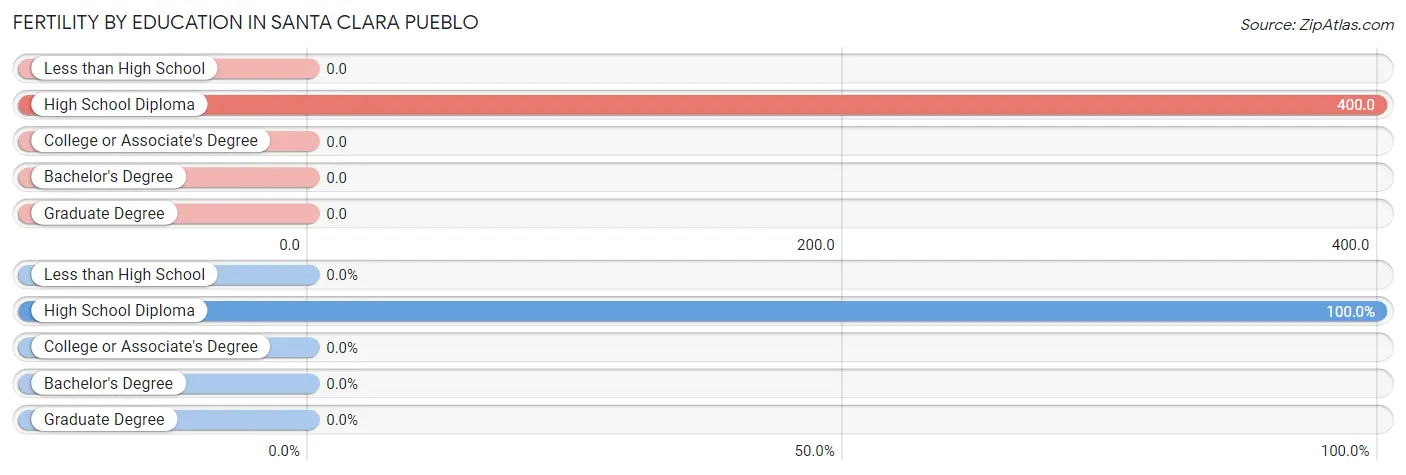
| Educational Attainment | Women with Births | Births / 1,000 Women |
| Less than High School | 0 (0.0%) | 0.0 |
| High School Diploma | 2 (100.0%) | 400.0 |
| College or Associate's Degree | 0 (0.0%) | 0.0 |
| Bachelor's Degree | 0 (0.0%) | 0.0 |
| Graduate Degree | 0 (0.0%) | 0.0 |
| Total | 2 (100.0%) | 12.0 |
Fertility by Education by Marriage Status in Santa Clara Pueblo
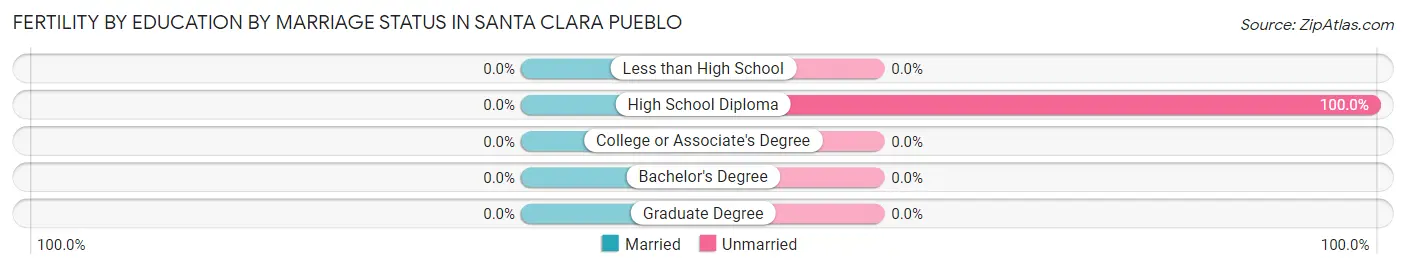
| Educational Attainment | Married | Unmarried |
| Less than High School | 0 (0.0%) | 0 (0.0%) |
| High School Diploma | 0 (0.0%) | 2 (100.0%) |
| College or Associate's Degree | 0 (0.0%) | 0 (0.0%) |
| Bachelor's Degree | 0 (0.0%) | 0 (0.0%) |
| Graduate Degree | 0 (0.0%) | 0 (0.0%) |
| Total | 0 (0.0%) | 2 (100.0%) |
Employment Characteristics in Santa Clara Pueblo
Employment by Class of Employer in Santa Clara Pueblo
Among the 286 employed individuals in Santa Clara Pueblo, private company employees (108 | 37.8%), local government employees (87 | 30.4%), and not-for-profit organizations (49 | 17.1%) make up the most common classes of employment.
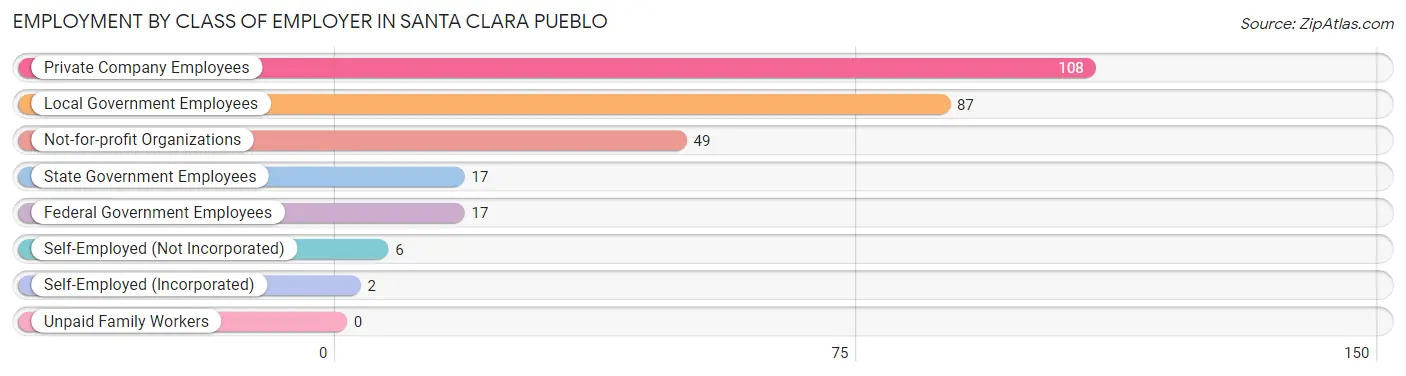
| Employer Class | # Employees | % Employees |
| Private Company Employees | 108 | 37.8% |
| Self-Employed (Incorporated) | 2 | 0.7% |
| Self-Employed (Not Incorporated) | 6 | 2.1% |
| Not-for-profit Organizations | 49 | 17.1% |
| Local Government Employees | 87 | 30.4% |
| State Government Employees | 17 | 5.9% |
| Federal Government Employees | 17 | 5.9% |
| Unpaid Family Workers | 0 | 0.0% |
| Total | 286 | 100.0% |
Employment Status by Age in Santa Clara Pueblo
According to the labor force statistics for Santa Clara Pueblo, out of the total population over 16 years of age (723), 41.2% or 298 individuals are in the labor force, with 1.3% or 4 of them unemployed. The age group with the highest labor force participation rate is 45 to 54 years, with 83.2% or 134 individuals in the labor force. Within the labor force, the 55 to 59 years age range has the highest percentage of unemployed individuals, with 14.3% or 4 of them being unemployed.
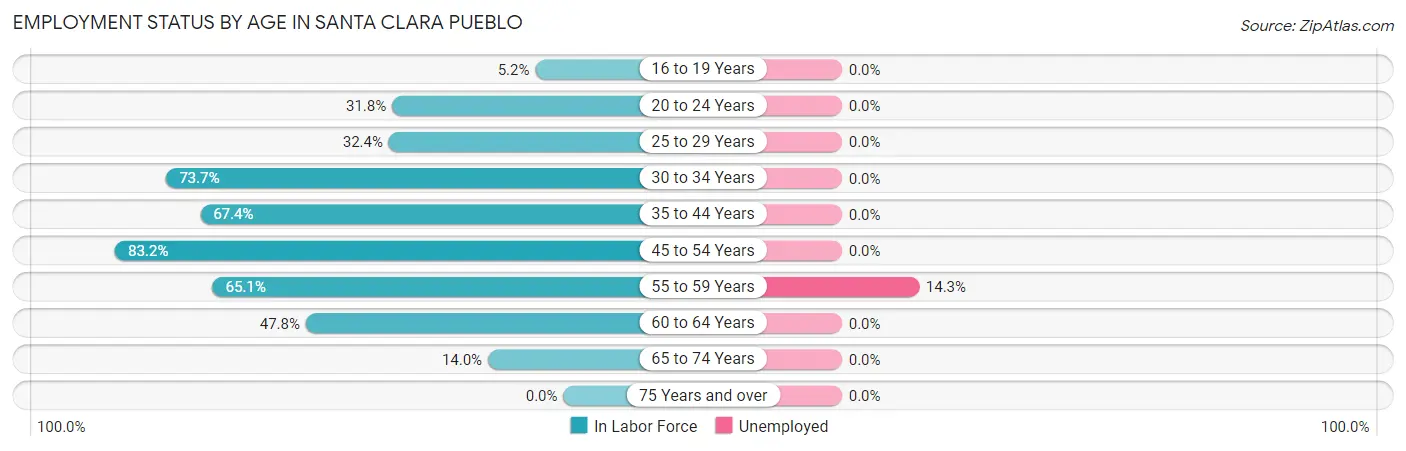
| Age Bracket | In Labor Force | Unemployed |
| 16 to 19 Years | 9 (5.2%) | 0 (0.0%) |
| 20 to 24 Years | 14 (31.8%) | 0 (0.0%) |
| 25 to 29 Years | 11 (32.4%) | 0 (0.0%) |
| 30 to 34 Years | 14 (73.7%) | 0 (0.0%) |
| 35 to 44 Years | 58 (67.4%) | 0 (0.0%) |
| 45 to 54 Years | 134 (83.2%) | 0 (0.0%) |
| 55 to 59 Years | 28 (65.1%) | 4 (14.3%) |
| 60 to 64 Years | 22 (47.8%) | 0 (0.0%) |
| 65 to 74 Years | 8 (14.0%) | 0 (0.0%) |
| 75 Years and over | 0 (0.0%) | 0 (0.0%) |
| Total | 298 (41.2%) | 4 (1.3%) |
Employment Status by Educational Attainment in Santa Clara Pueblo
According to labor force statistics for Santa Clara Pueblo, 68.6% of individuals (267) out of the total population between 25 and 64 years of age (389) are in the labor force, with 1.5% or 4 of them being unemployed. The group with the highest labor force participation rate are those with the educational attainment of bachelor's degree or higher, with 95.9% or 70 individuals in the labor force. Within the labor force, individuals with high school diploma education have the highest percentage of unemployment, with 4.7% or 4 of them being unemployed.
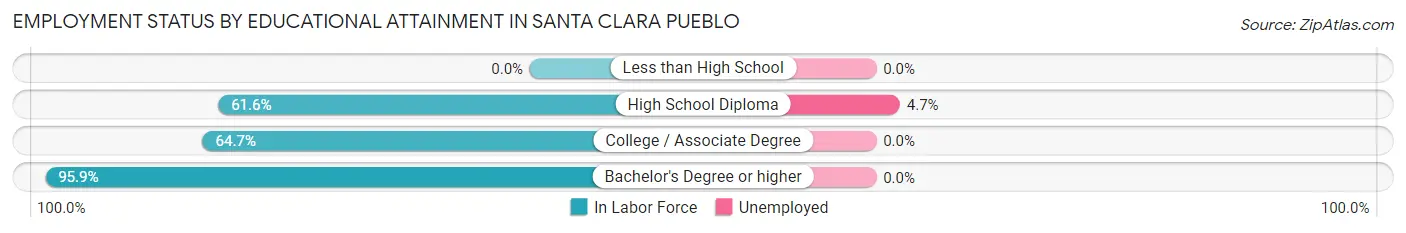
| Educational Attainment | In Labor Force | Unemployed |
| Less than High School | 0 (0.0%) | 0 (0.0%) |
| High School Diploma | 85 (61.6%) | 6 (4.7%) |
| College / Associate Degree | 112 (64.7%) | 0 (0.0%) |
| Bachelor's Degree or higher | 70 (95.9%) | 0 (0.0%) |
| Total | 267 (68.6%) | 6 (1.5%) |
Employment Occupations by Sex in Santa Clara Pueblo
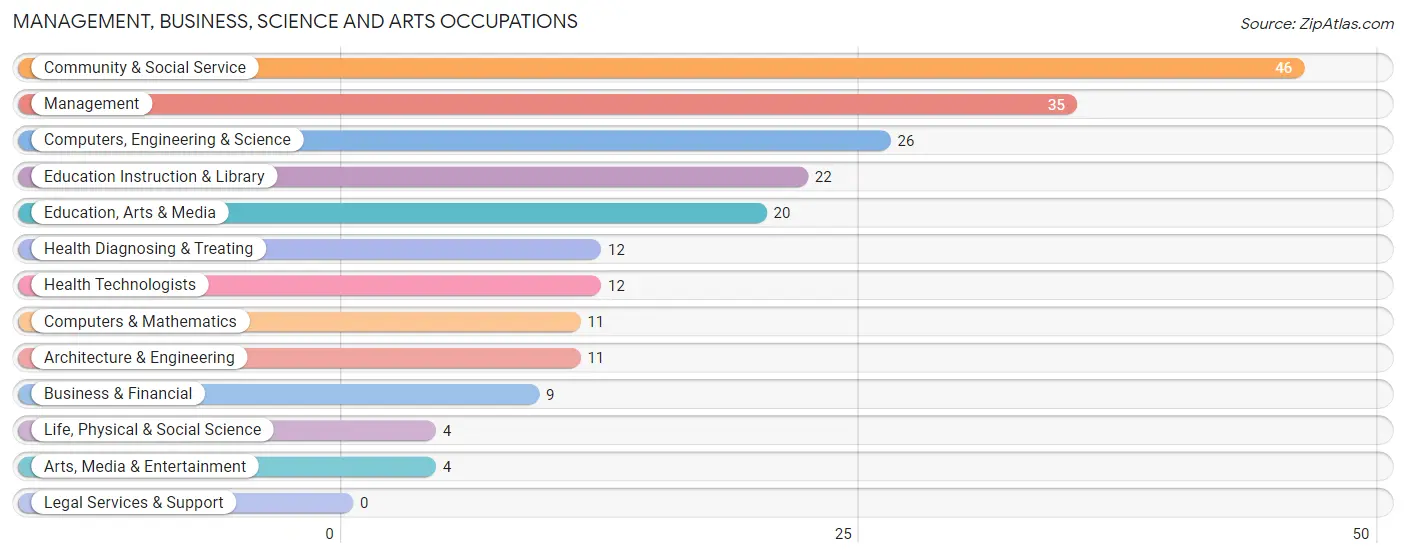
Management, Business, Science and Arts Occupations
The most common Management, Business, Science and Arts occupations in Santa Clara Pueblo are Community & Social Service (46 | 15.7%), Management (35 | 11.9%), Computers, Engineering & Science (26 | 8.8%), Education Instruction & Library (22 | 7.5%), and Education, Arts & Media (20 | 6.8%).
Management, Business, Science and Arts Occupations by Sex
Within the Management, Business, Science and Arts occupations in Santa Clara Pueblo, the most male-oriented occupations are Architecture & Engineering (100.0%), Life, Physical & Social Science (100.0%), and Computers, Engineering & Science (69.2%), while the most female-oriented occupations are Business & Financial (100.0%), Education Instruction & Library (100.0%), and Arts, Media & Entertainment (100.0%).
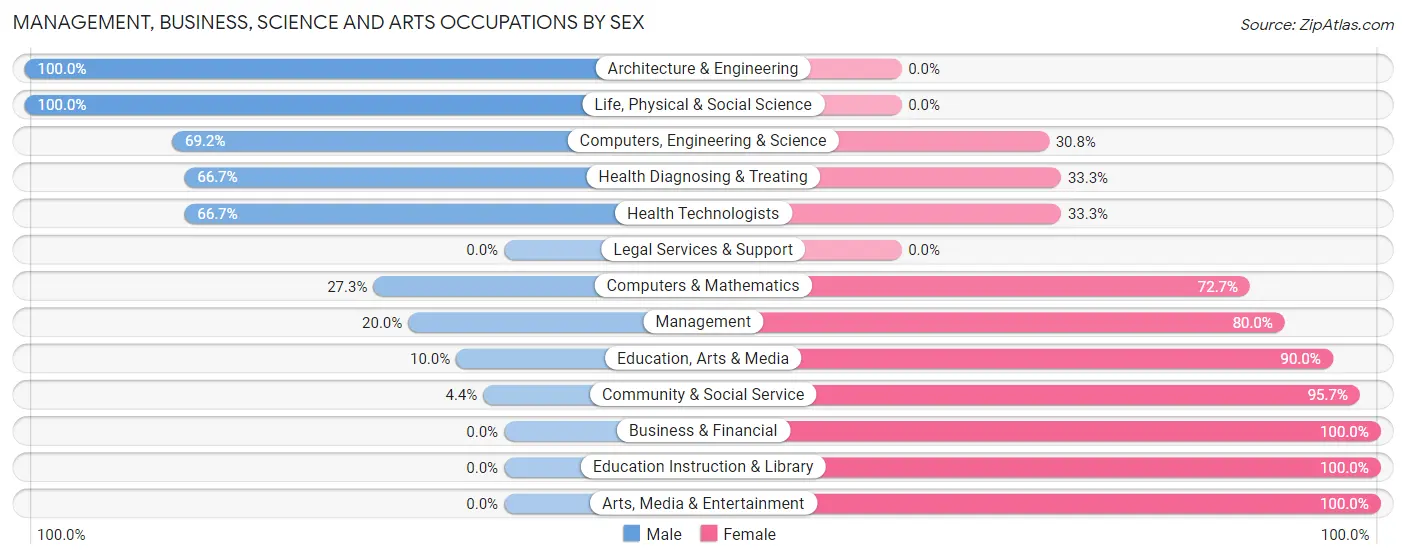
| Occupation | Male | Female |
| Management | 7 (20.0%) | 28 (80.0%) |
| Business & Financial | 0 (0.0%) | 9 (100.0%) |
| Computers, Engineering & Science | 18 (69.2%) | 8 (30.8%) |
| Computers & Mathematics | 3 (27.3%) | 8 (72.7%) |
| Architecture & Engineering | 11 (100.0%) | 0 (0.0%) |
| Life, Physical & Social Science | 4 (100.0%) | 0 (0.0%) |
| Community & Social Service | 2 (4.3%) | 44 (95.7%) |
| Education, Arts & Media | 2 (10.0%) | 18 (90.0%) |
| Legal Services & Support | 0 (0.0%) | 0 (0.0%) |
| Education Instruction & Library | 0 (0.0%) | 22 (100.0%) |
| Arts, Media & Entertainment | 0 (0.0%) | 4 (100.0%) |
| Health Diagnosing & Treating | 8 (66.7%) | 4 (33.3%) |
| Health Technologists | 8 (66.7%) | 4 (33.3%) |
| Total (Category) | 35 (27.3%) | 93 (72.7%) |
| Total (Overall) | 142 (48.3%) | 152 (51.7%) |
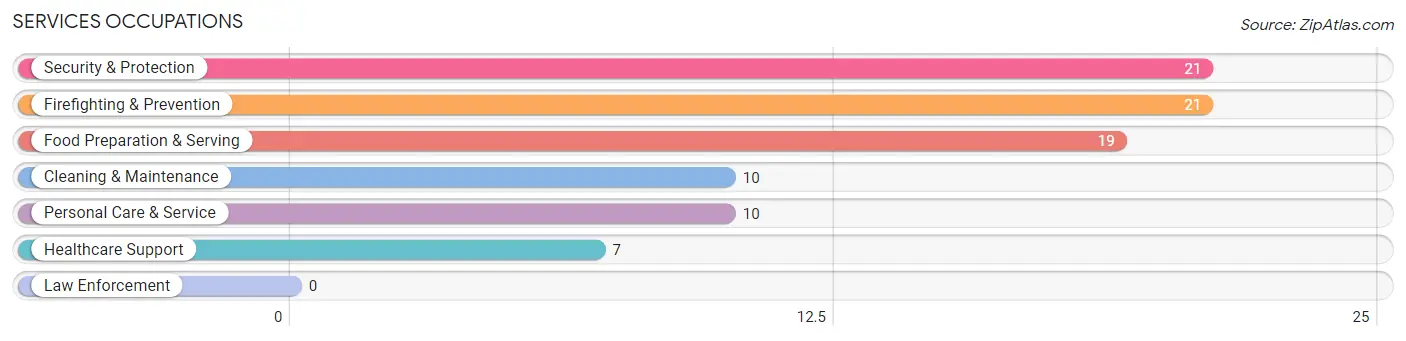
Services Occupations
The most common Services occupations in Santa Clara Pueblo are Security & Protection (21 | 7.1%), Firefighting & Prevention (21 | 7.1%), Food Preparation & Serving (19 | 6.5%), Cleaning & Maintenance (10 | 3.4%), and Personal Care & Service (10 | 3.4%).
Services Occupations by Sex
Within the Services occupations in Santa Clara Pueblo, the most male-oriented occupations are Cleaning & Maintenance (100.0%), Personal Care & Service (100.0%), and Security & Protection (85.7%), while the most female-oriented occupations are Food Preparation & Serving (100.0%), Healthcare Support (71.4%), and Security & Protection (14.3%).
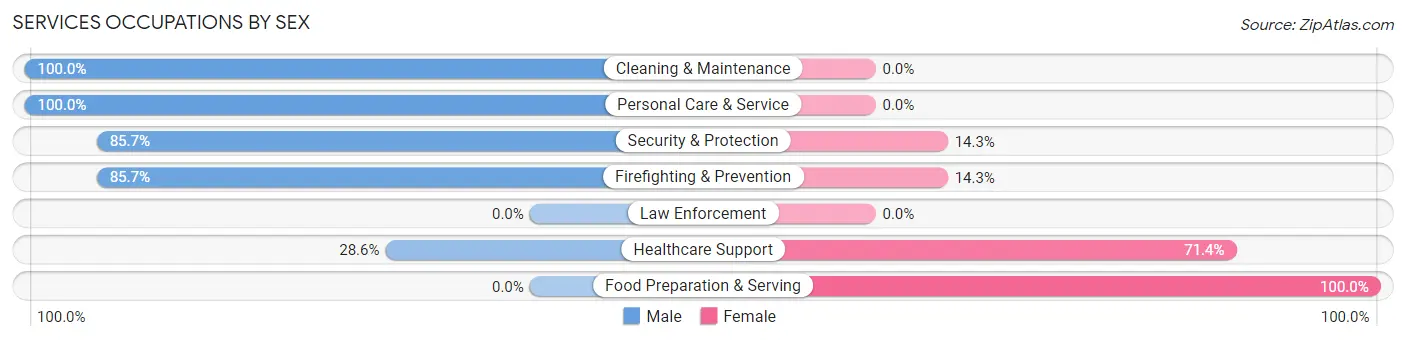
| Occupation | Male | Female |
| Healthcare Support | 2 (28.6%) | 5 (71.4%) |
| Security & Protection | 18 (85.7%) | 3 (14.3%) |
| Firefighting & Prevention | 18 (85.7%) | 3 (14.3%) |
| Law Enforcement | 0 (0.0%) | 0 (0.0%) |
| Food Preparation & Serving | 0 (0.0%) | 19 (100.0%) |
| Cleaning & Maintenance | 10 (100.0%) | 0 (0.0%) |
| Personal Care & Service | 10 (100.0%) | 0 (0.0%) |
| Total (Category) | 40 (59.7%) | 27 (40.3%) |
| Total (Overall) | 142 (48.3%) | 152 (51.7%) |
Sales and Office Occupations
The most common Sales and Office occupations in Santa Clara Pueblo are Office & Administration (59 | 20.1%), and Sales & Related (8 | 2.7%).
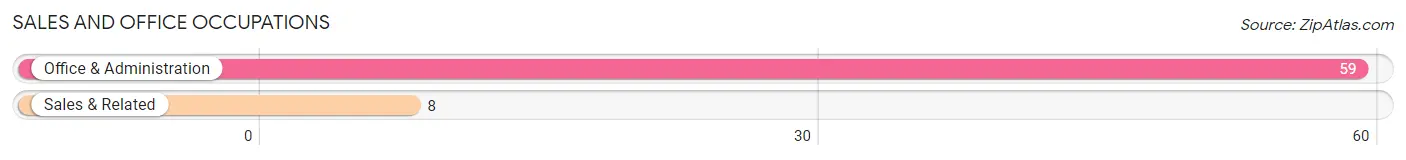
Sales and Office Occupations by Sex
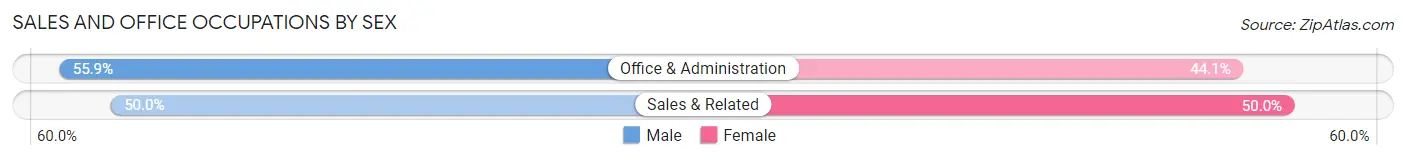
| Occupation | Male | Female |
| Sales & Related | 4 (50.0%) | 4 (50.0%) |
| Office & Administration | 33 (55.9%) | 26 (44.1%) |
| Total (Category) | 37 (55.2%) | 30 (44.8%) |
| Total (Overall) | 142 (48.3%) | 152 (51.7%) |
Natural Resources, Construction and Maintenance Occupations
The most common Natural Resources, Construction and Maintenance occupations in Santa Clara Pueblo are Installation, Maintenance & Repair (11 | 3.7%), Construction & Extraction (6 | 2.0%), and Farming, Fishing & Forestry (4 | 1.4%).
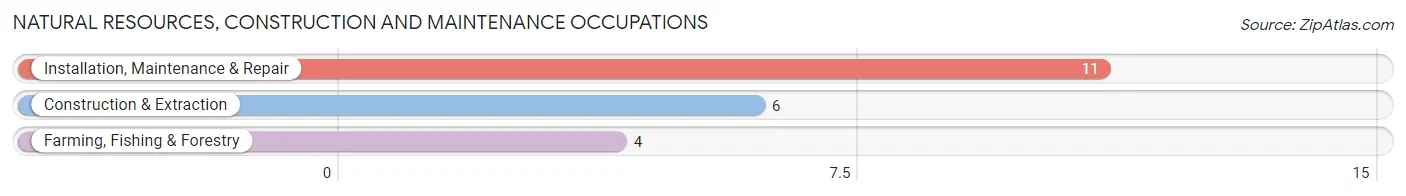
Natural Resources, Construction and Maintenance Occupations by Sex
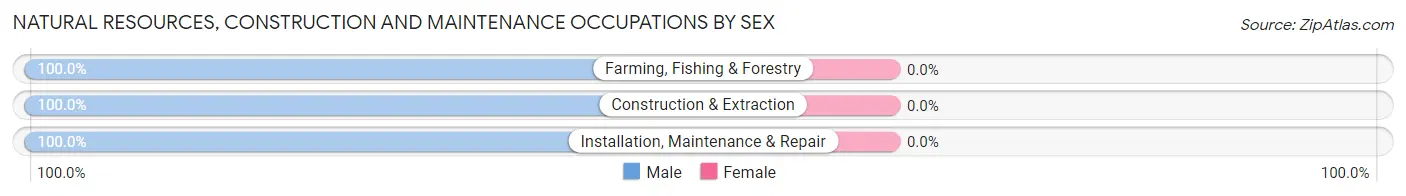
| Occupation | Male | Female |
| Farming, Fishing & Forestry | 4 (100.0%) | 0 (0.0%) |
| Construction & Extraction | 6 (100.0%) | 0 (0.0%) |
| Installation, Maintenance & Repair | 11 (100.0%) | 0 (0.0%) |
| Total (Category) | 21 (100.0%) | 0 (0.0%) |
| Total (Overall) | 142 (48.3%) | 152 (51.7%) |
Production, Transportation and Moving Occupations
The most common Production, Transportation and Moving occupations in Santa Clara Pueblo are Material Moving (9 | 3.1%), and Production (2 | 0.7%).
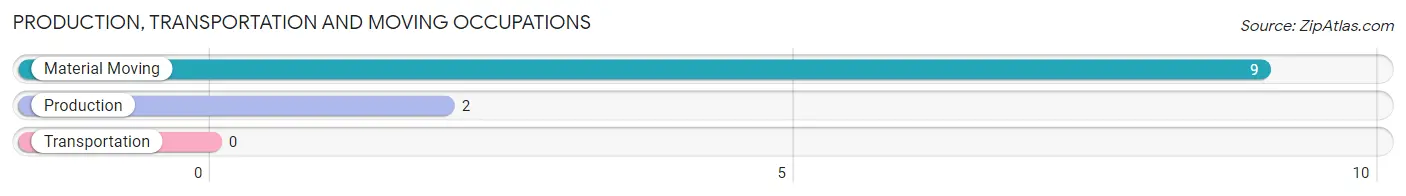
Production, Transportation and Moving Occupations by Sex
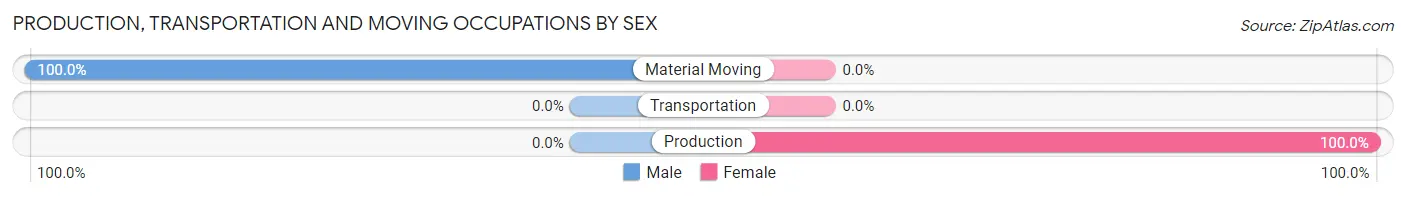
| Occupation | Male | Female |
| Production | 0 (0.0%) | 2 (100.0%) |
| Transportation | 0 (0.0%) | 0 (0.0%) |
| Material Moving | 9 (100.0%) | 0 (0.0%) |
| Total (Category) | 9 (81.8%) | 2 (18.2%) |
| Total (Overall) | 142 (48.3%) | 152 (51.7%) |
Employment Industries by Sex in Santa Clara Pueblo
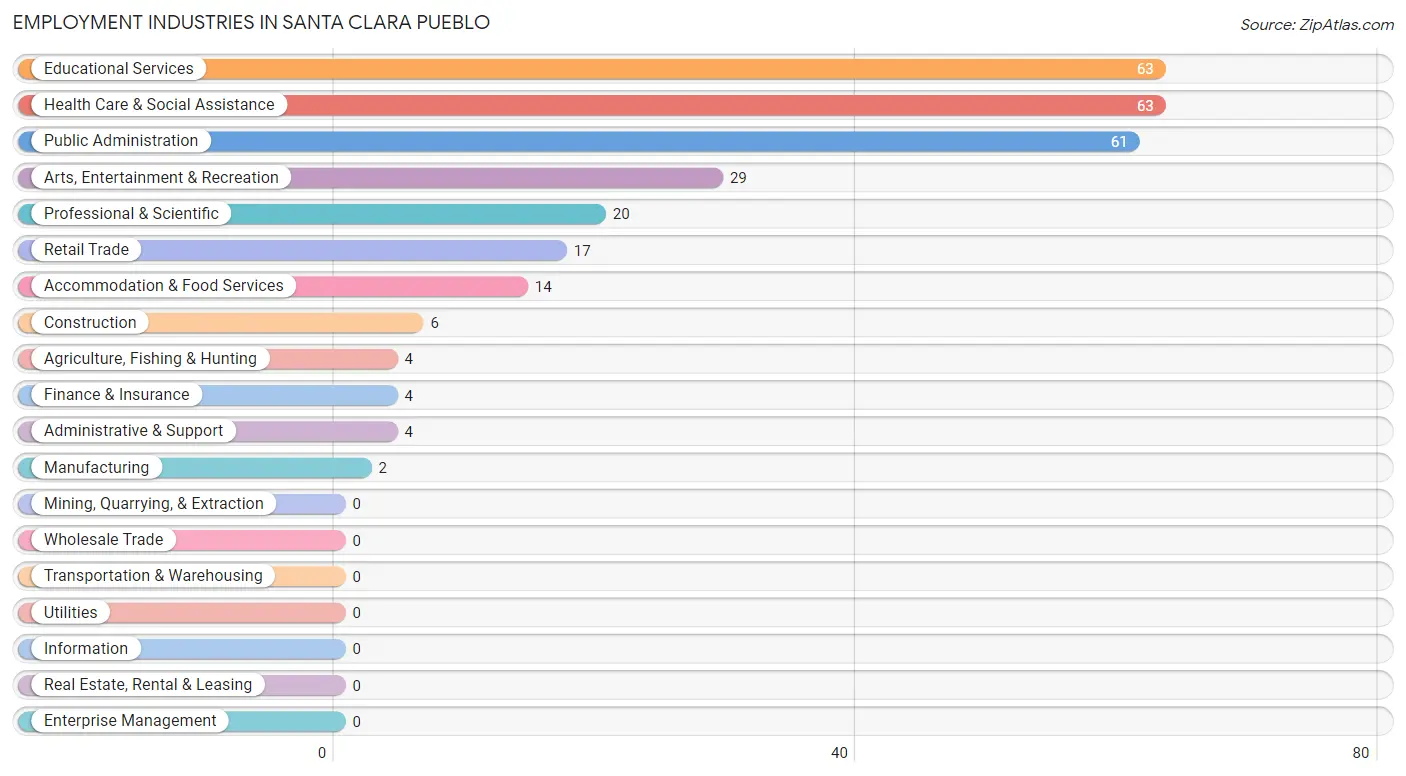
Employment Industries in Santa Clara Pueblo
The major employment industries in Santa Clara Pueblo include Educational Services (63 | 21.4%), Health Care & Social Assistance (63 | 21.4%), Public Administration (61 | 20.7%), Arts, Entertainment & Recreation (29 | 9.9%), and Professional & Scientific (20 | 6.8%).
Employment Industries by Sex in Santa Clara Pueblo
The Santa Clara Pueblo industries that see more men than women are Agriculture, Fishing & Hunting (100.0%), Construction (100.0%), and Retail Trade (100.0%), whereas the industries that tend to have a higher number of women are Manufacturing (100.0%), Finance & Insurance (100.0%), and Arts, Entertainment & Recreation (79.3%).
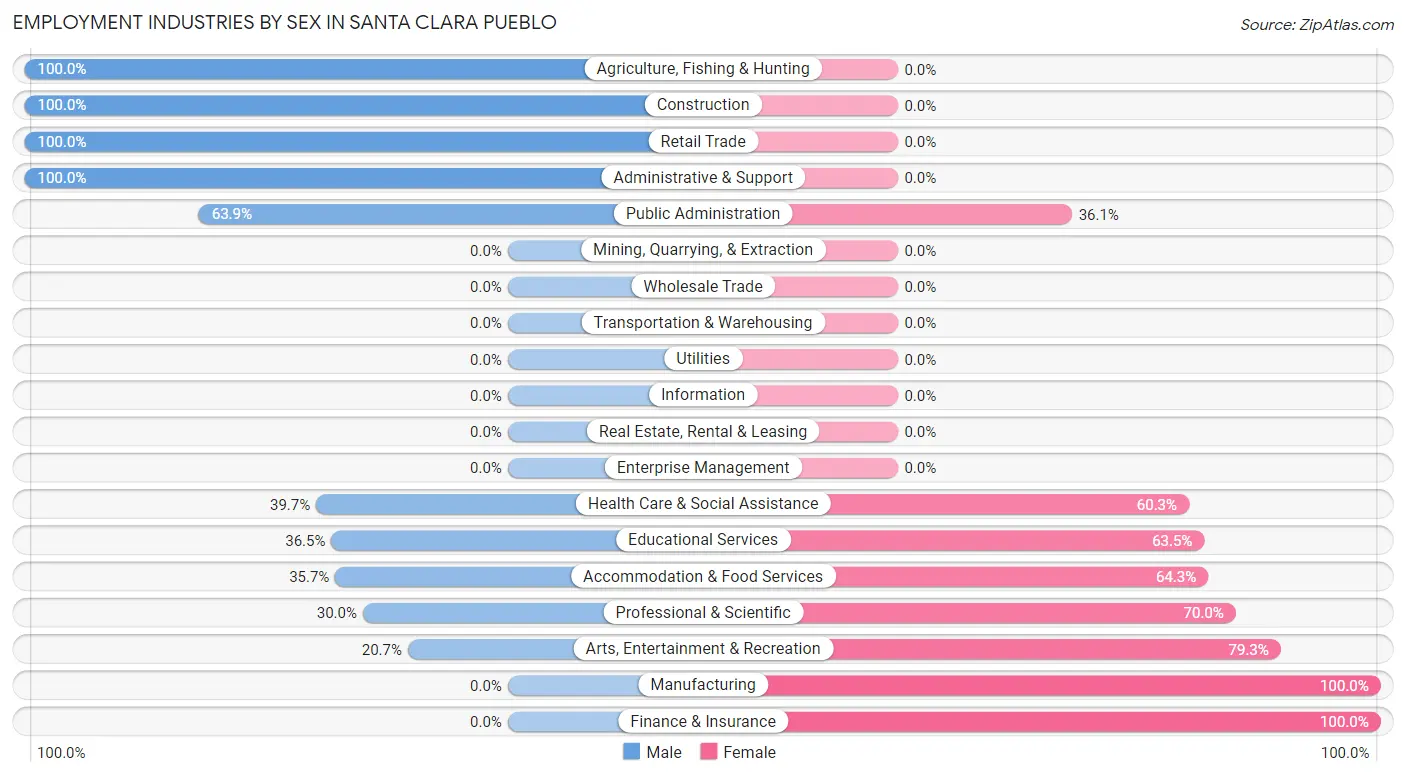
| Industry | Male | Female |
| Agriculture, Fishing & Hunting | 4 (100.0%) | 0 (0.0%) |
| Mining, Quarrying, & Extraction | 0 (0.0%) | 0 (0.0%) |
| Construction | 6 (100.0%) | 0 (0.0%) |
| Manufacturing | 0 (0.0%) | 2 (100.0%) |
| Wholesale Trade | 0 (0.0%) | 0 (0.0%) |
| Retail Trade | 17 (100.0%) | 0 (0.0%) |
| Transportation & Warehousing | 0 (0.0%) | 0 (0.0%) |
| Utilities | 0 (0.0%) | 0 (0.0%) |
| Information | 0 (0.0%) | 0 (0.0%) |
| Finance & Insurance | 0 (0.0%) | 4 (100.0%) |
| Real Estate, Rental & Leasing | 0 (0.0%) | 0 (0.0%) |
| Professional & Scientific | 6 (30.0%) | 14 (70.0%) |
| Enterprise Management | 0 (0.0%) | 0 (0.0%) |
| Administrative & Support | 4 (100.0%) | 0 (0.0%) |
| Educational Services | 23 (36.5%) | 40 (63.5%) |
| Health Care & Social Assistance | 25 (39.7%) | 38 (60.3%) |
| Arts, Entertainment & Recreation | 6 (20.7%) | 23 (79.3%) |
| Accommodation & Food Services | 5 (35.7%) | 9 (64.3%) |
| Public Administration | 39 (63.9%) | 22 (36.1%) |
| Total | 142 (48.3%) | 152 (51.7%) |
Education in Santa Clara Pueblo
School Enrollment in Santa Clara Pueblo
The most common levels of schooling among the 360 students in Santa Clara Pueblo are high school (151 | 41.9%), elementary school (87 | 24.2%), and middle school (53 | 14.7%).
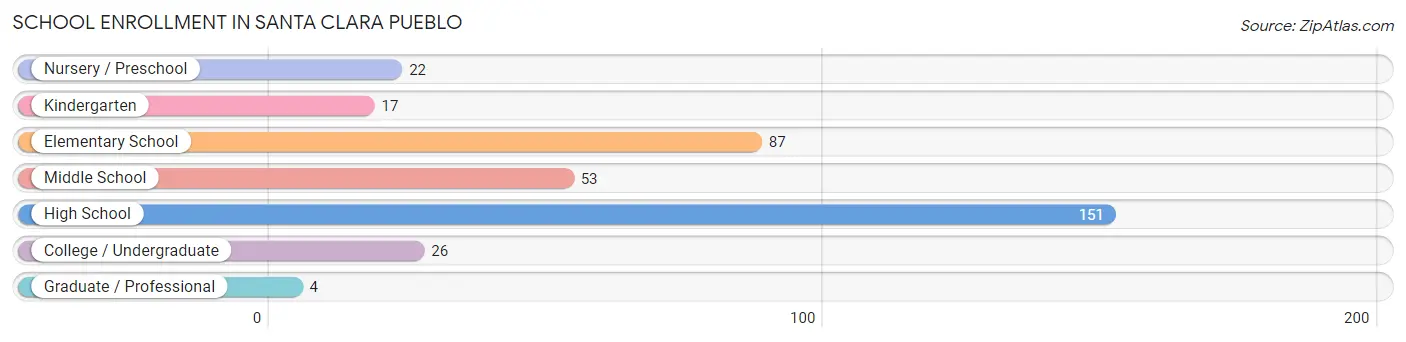
| School Level | # Students | % Students |
| Nursery / Preschool | 22 | 6.1% |
| Kindergarten | 17 | 4.7% |
| Elementary School | 87 | 24.2% |
| Middle School | 53 | 14.7% |
| High School | 151 | 41.9% |
| College / Undergraduate | 26 | 7.2% |
| Graduate / Professional | 4 | 1.1% |
| Total | 360 | 100.0% |
School Enrollment by Age by Funding Source in Santa Clara Pueblo
Out of a total of 360 students who are enrolled in schools in Santa Clara Pueblo, 138 (38.3%) attend a private institution, while the remaining 222 (61.7%) are enrolled in public schools. The age group of 5 to 9 year old has the highest likelihood of being enrolled in private schools, with 60 (61.2% in the age bracket) enrolled. Conversely, the age group of 3 to 4 year olds has the lowest likelihood of being enrolled in a private school, with 22 (100.0% in the age bracket) attending a public institution.
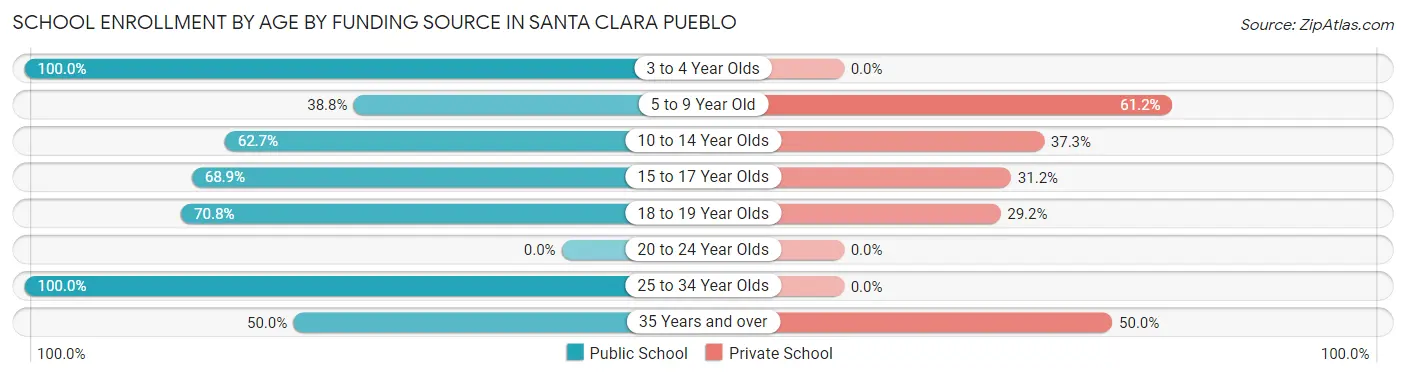
| Age Bracket | Public School | Private School |
| 3 to 4 Year Olds | 22 (100.0%) | 0 (0.0%) |
| 5 to 9 Year Old | 38 (38.8%) | 60 (61.2%) |
| 10 to 14 Year Olds | 37 (62.7%) | 22 (37.3%) |
| 15 to 17 Year Olds | 84 (68.9%) | 38 (31.1%) |
| 18 to 19 Year Olds | 34 (70.8%) | 14 (29.2%) |
| 20 to 24 Year Olds | 0 (0.0%) | 0 (0.0%) |
| 25 to 34 Year Olds | 3 (100.0%) | 0 (0.0%) |
| 35 Years and over | 4 (50.0%) | 4 (50.0%) |
| Total | 222 (61.7%) | 138 (38.3%) |
Educational Attainment by Field of Study in Santa Clara Pueblo
Business (39 | 37.1%), social sciences (20 | 19.1%), visual & performing arts (13 | 12.4%), education (11 | 10.5%), and science & technology (7 | 6.7%) are the most common fields of study among 105 individuals in Santa Clara Pueblo who have obtained a bachelor's degree or higher.
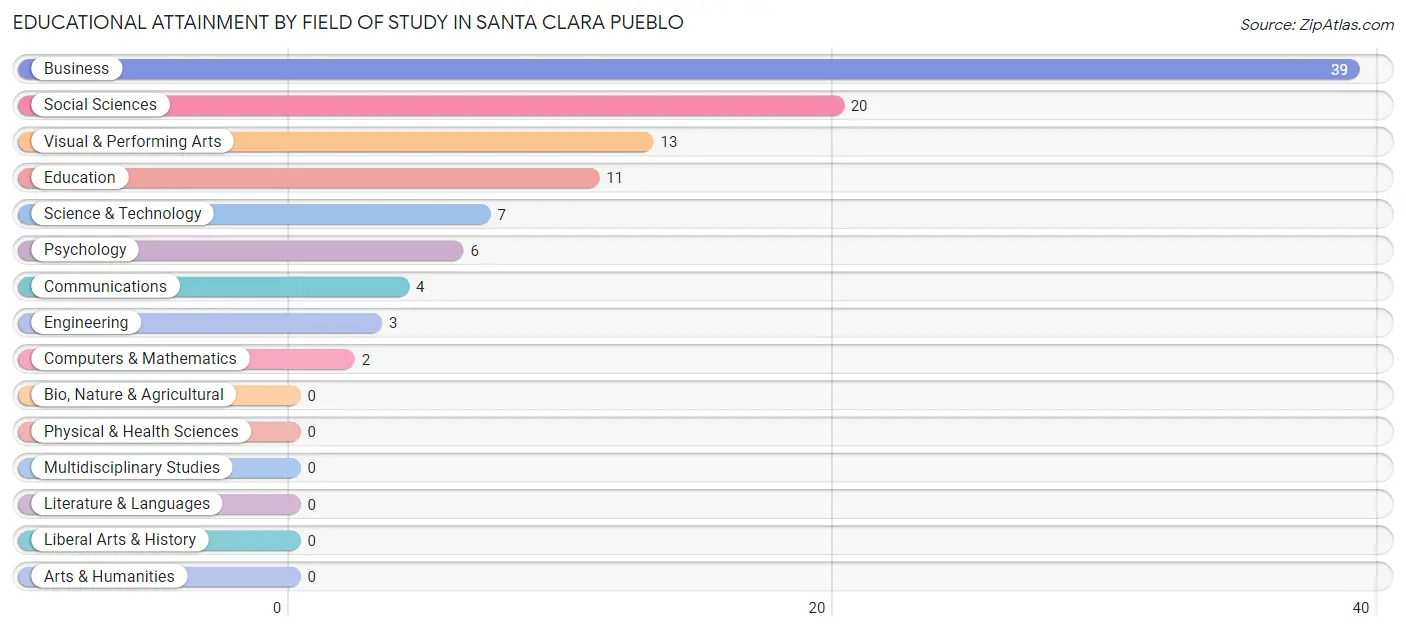
| Field of Study | # Graduates | % Graduates |
| Computers & Mathematics | 2 | 1.9% |
| Bio, Nature & Agricultural | 0 | 0.0% |
| Physical & Health Sciences | 0 | 0.0% |
| Psychology | 6 | 5.7% |
| Social Sciences | 20 | 19.1% |
| Engineering | 3 | 2.9% |
| Multidisciplinary Studies | 0 | 0.0% |
| Science & Technology | 7 | 6.7% |
| Business | 39 | 37.1% |
| Education | 11 | 10.5% |
| Literature & Languages | 0 | 0.0% |
| Liberal Arts & History | 0 | 0.0% |
| Visual & Performing Arts | 13 | 12.4% |
| Communications | 4 | 3.8% |
| Arts & Humanities | 0 | 0.0% |
| Total | 105 | 100.0% |
Transportation & Commute in Santa Clara Pueblo
Vehicle Availability by Sex in Santa Clara Pueblo
The most prevalent vehicle ownership categories in Santa Clara Pueblo are males with 2 vehicles (46, accounting for 34.3%) and females with 2 vehicles (71, making up 30.3%).
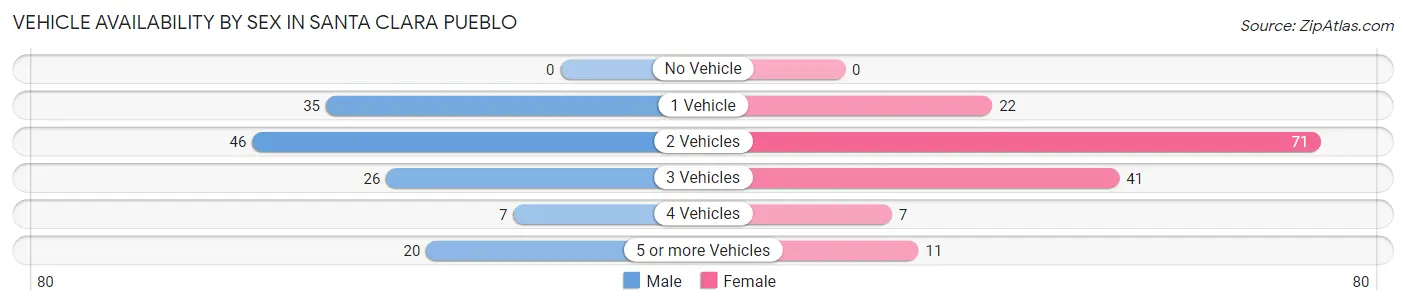
| Vehicles Available | Male | Female |
| No Vehicle | 0 (0.0%) | 0 (0.0%) |
| 1 Vehicle | 35 (26.1%) | 22 (14.5%) |
| 2 Vehicles | 46 (34.3%) | 71 (46.7%) |
| 3 Vehicles | 26 (19.4%) | 41 (27.0%) |
| 4 Vehicles | 7 (5.2%) | 7 (4.6%) |
| 5 or more Vehicles | 20 (14.9%) | 11 (7.2%) |
| Total | 134 (100.0%) | 152 (100.0%) |
Commute Time in Santa Clara Pueblo
The most frequently occuring commute durations in Santa Clara Pueblo are 45 to 59 minutes (55 commuters, 19.7%), 10 to 14 minutes (49 commuters, 17.6%), and 15 to 19 minutes (44 commuters, 15.8%).
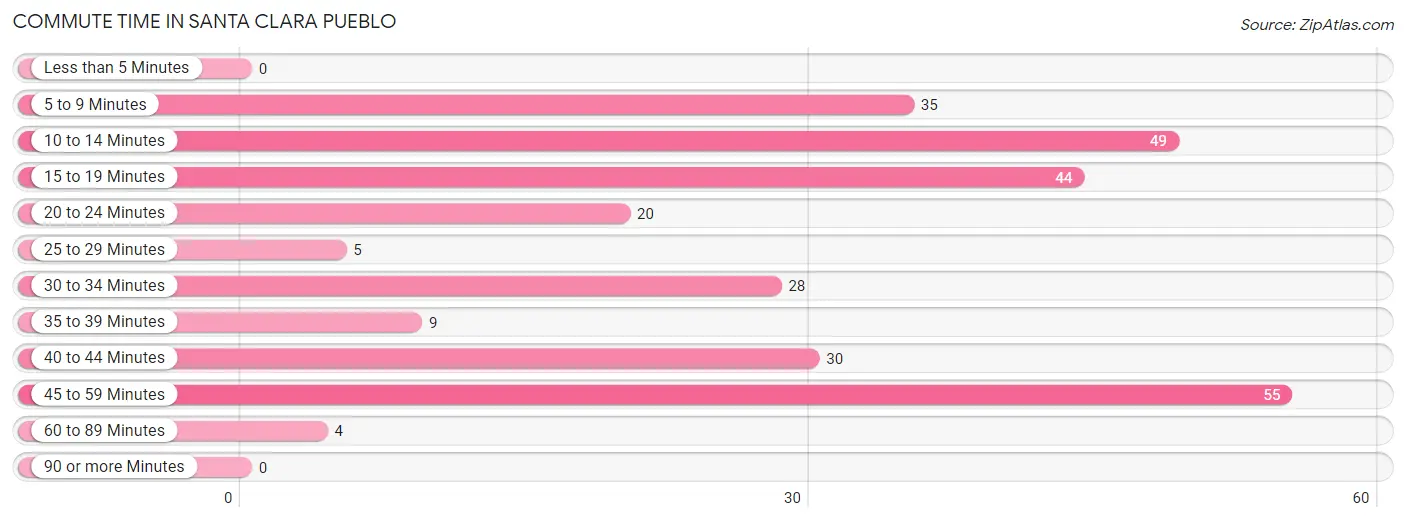
| Commute Time | # Commuters | % Commuters |
| Less than 5 Minutes | 0 | 0.0% |
| 5 to 9 Minutes | 35 | 12.5% |
| 10 to 14 Minutes | 49 | 17.6% |
| 15 to 19 Minutes | 44 | 15.8% |
| 20 to 24 Minutes | 20 | 7.2% |
| 25 to 29 Minutes | 5 | 1.8% |
| 30 to 34 Minutes | 28 | 10.0% |
| 35 to 39 Minutes | 9 | 3.2% |
| 40 to 44 Minutes | 30 | 10.7% |
| 45 to 59 Minutes | 55 | 19.7% |
| 60 to 89 Minutes | 4 | 1.4% |
| 90 or more Minutes | 0 | 0.0% |
Commute Time by Sex in Santa Clara Pueblo
The most common commute times in Santa Clara Pueblo are 5 to 9 minutes (29 commuters, 21.8%) for males and 10 to 14 minutes (40 commuters, 27.4%) for females.
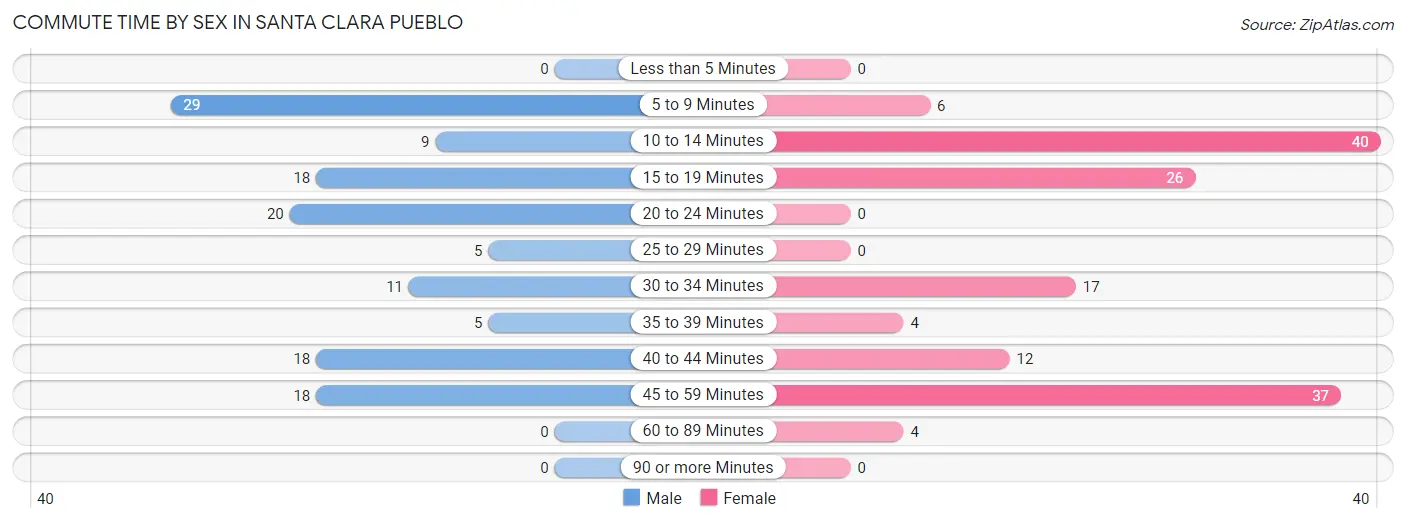
| Commute Time | Male | Female |
| Less than 5 Minutes | 0 (0.0%) | 0 (0.0%) |
| 5 to 9 Minutes | 29 (21.8%) | 6 (4.1%) |
| 10 to 14 Minutes | 9 (6.8%) | 40 (27.4%) |
| 15 to 19 Minutes | 18 (13.5%) | 26 (17.8%) |
| 20 to 24 Minutes | 20 (15.0%) | 0 (0.0%) |
| 25 to 29 Minutes | 5 (3.8%) | 0 (0.0%) |
| 30 to 34 Minutes | 11 (8.3%) | 17 (11.6%) |
| 35 to 39 Minutes | 5 (3.8%) | 4 (2.7%) |
| 40 to 44 Minutes | 18 (13.5%) | 12 (8.2%) |
| 45 to 59 Minutes | 18 (13.5%) | 37 (25.3%) |
| 60 to 89 Minutes | 0 (0.0%) | 4 (2.7%) |
| 90 or more Minutes | 0 (0.0%) | 0 (0.0%) |
Time of Departure to Work by Sex in Santa Clara Pueblo
The most frequent times of departure to work in Santa Clara Pueblo are 7:30 AM to 7:59 AM (38, 28.6%) for males and 7:30 AM to 7:59 AM (58, 39.7%) for females.
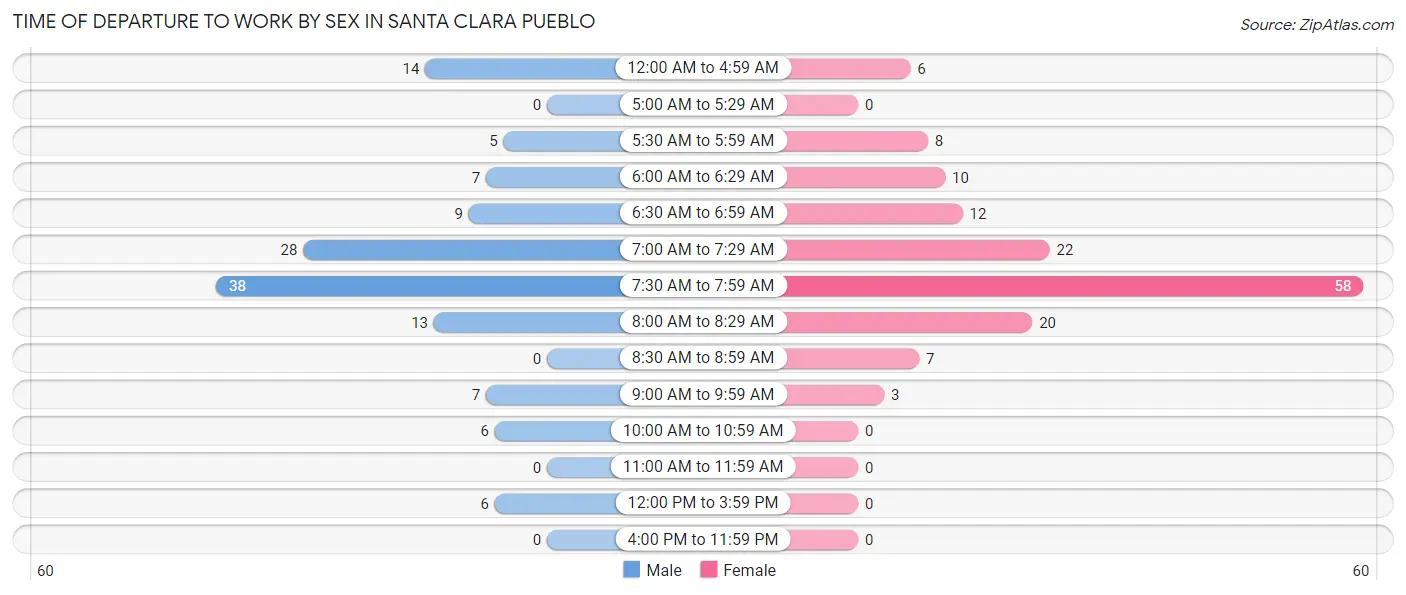
| Time of Departure | Male | Female |
| 12:00 AM to 4:59 AM | 14 (10.5%) | 6 (4.1%) |
| 5:00 AM to 5:29 AM | 0 (0.0%) | 0 (0.0%) |
| 5:30 AM to 5:59 AM | 5 (3.8%) | 8 (5.5%) |
| 6:00 AM to 6:29 AM | 7 (5.3%) | 10 (6.9%) |
| 6:30 AM to 6:59 AM | 9 (6.8%) | 12 (8.2%) |
| 7:00 AM to 7:29 AM | 28 (21.0%) | 22 (15.1%) |
| 7:30 AM to 7:59 AM | 38 (28.6%) | 58 (39.7%) |
| 8:00 AM to 8:29 AM | 13 (9.8%) | 20 (13.7%) |
| 8:30 AM to 8:59 AM | 0 (0.0%) | 7 (4.8%) |
| 9:00 AM to 9:59 AM | 7 (5.3%) | 3 (2.1%) |
| 10:00 AM to 10:59 AM | 6 (4.5%) | 0 (0.0%) |
| 11:00 AM to 11:59 AM | 0 (0.0%) | 0 (0.0%) |
| 12:00 PM to 3:59 PM | 6 (4.5%) | 0 (0.0%) |
| 4:00 PM to 11:59 PM | 0 (0.0%) | 0 (0.0%) |
| Total | 133 (100.0%) | 146 (100.0%) |
Housing Occupancy in Santa Clara Pueblo
Occupancy by Ownership in Santa Clara Pueblo
Of the total 227 dwellings in Santa Clara Pueblo, owner-occupied units account for 183 (80.6%), while renter-occupied units make up 44 (19.4%).
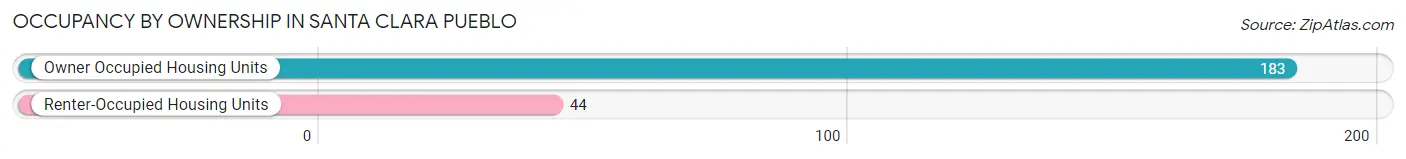
| Occupancy | # Housing Units | % Housing Units |
| Owner Occupied Housing Units | 183 | 80.6% |
| Renter-Occupied Housing Units | 44 | 19.4% |
| Total Occupied Housing Units | 227 | 100.0% |
Occupancy by Household Size in Santa Clara Pueblo
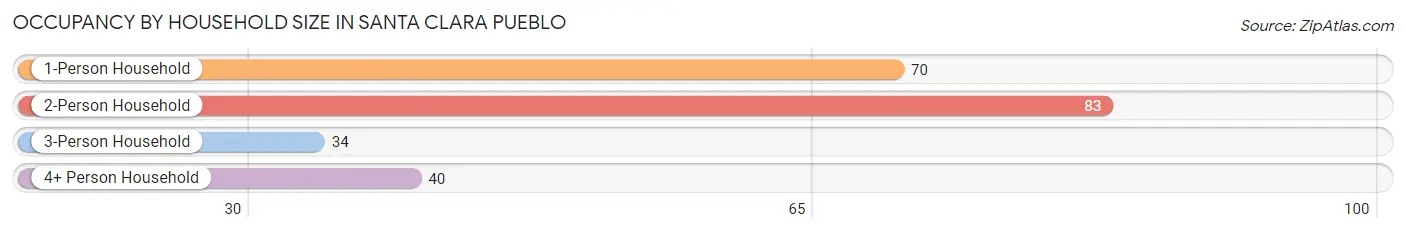
| Household Size | # Housing Units | % Housing Units |
| 1-Person Household | 70 | 30.8% |
| 2-Person Household | 83 | 36.6% |
| 3-Person Household | 34 | 15.0% |
| 4+ Person Household | 40 | 17.6% |
| Total Housing Units | 227 | 100.0% |
Occupancy by Ownership by Household Size in Santa Clara Pueblo
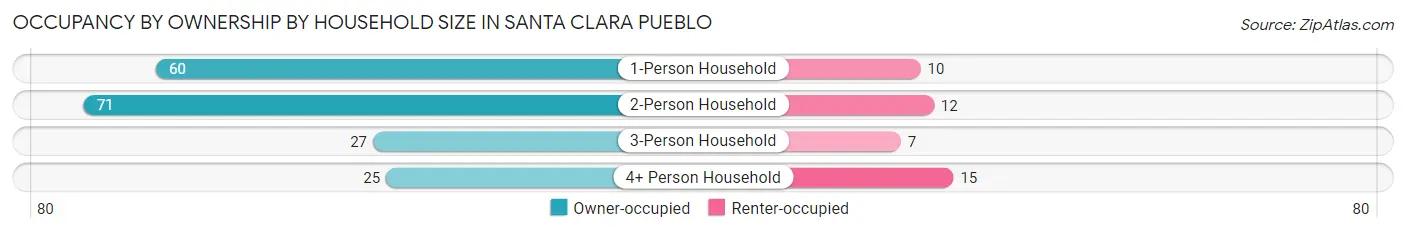
| Household Size | Owner-occupied | Renter-occupied |
| 1-Person Household | 60 (85.7%) | 10 (14.3%) |
| 2-Person Household | 71 (85.5%) | 12 (14.5%) |
| 3-Person Household | 27 (79.4%) | 7 (20.6%) |
| 4+ Person Household | 25 (62.5%) | 15 (37.5%) |
| Total Housing Units | 183 (80.6%) | 44 (19.4%) |
Occupancy by Educational Attainment in Santa Clara Pueblo
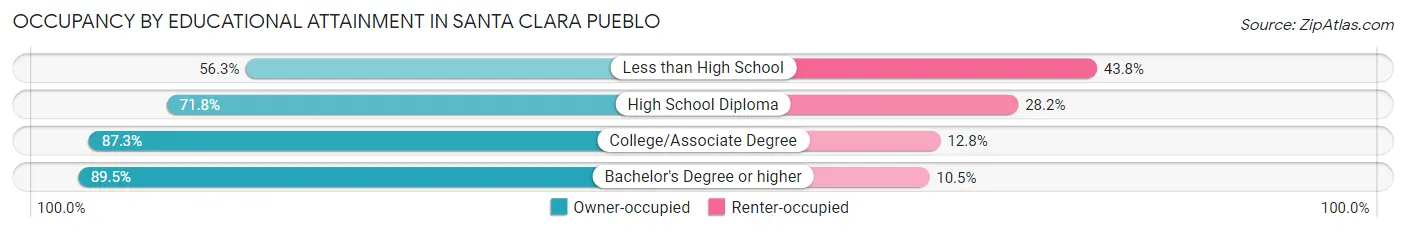
| Household Size | Owner-occupied | Renter-occupied |
| Less than High School | 9 (56.2%) | 7 (43.8%) |
| High School Diploma | 51 (71.8%) | 20 (28.2%) |
| College/Associate Degree | 89 (87.3%) | 13 (12.8%) |
| Bachelor's Degree or higher | 34 (89.5%) | 4 (10.5%) |
Occupancy by Age of Householder in Santa Clara Pueblo
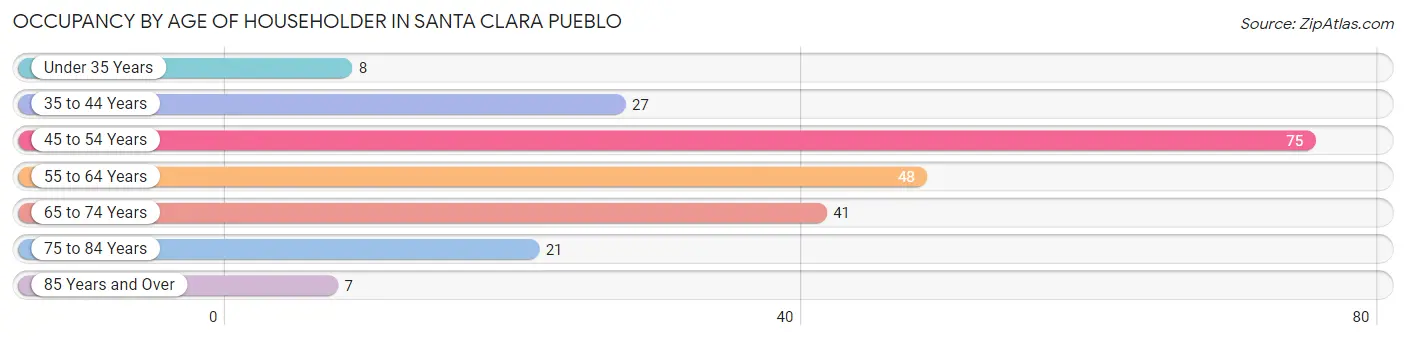
| Age Bracket | # Households | % Households |
| Under 35 Years | 8 | 3.5% |
| 35 to 44 Years | 27 | 11.9% |
| 45 to 54 Years | 75 | 33.0% |
| 55 to 64 Years | 48 | 21.1% |
| 65 to 74 Years | 41 | 18.1% |
| 75 to 84 Years | 21 | 9.2% |
| 85 Years and Over | 7 | 3.1% |
| Total | 227 | 100.0% |
Housing Finances in Santa Clara Pueblo
Median Income by Occupancy in Santa Clara Pueblo
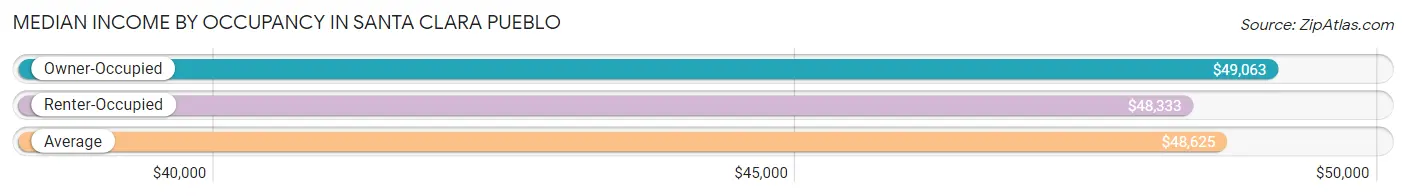
| Occupancy Type | # Households | Median Income |
| Owner-Occupied | 183 (80.6%) | $49,063 |
| Renter-Occupied | 44 (19.4%) | $48,333 |
| Average | 227 (100.0%) | $48,625 |
Occupancy by Householder Income Bracket in Santa Clara Pueblo
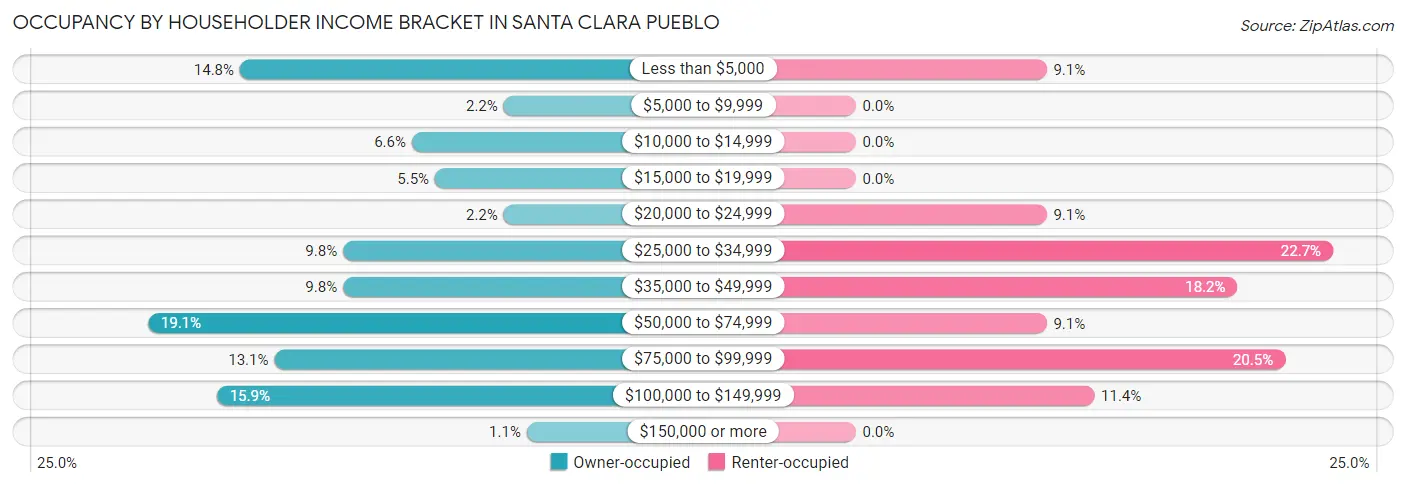
| Income Bracket | Owner-occupied | Renter-occupied |
| Less than $5,000 | 27 (14.7%) | 4 (9.1%) |
| $5,000 to $9,999 | 4 (2.2%) | 0 (0.0%) |
| $10,000 to $14,999 | 12 (6.6%) | 0 (0.0%) |
| $15,000 to $19,999 | 10 (5.5%) | 0 (0.0%) |
| $20,000 to $24,999 | 4 (2.2%) | 4 (9.1%) |
| $25,000 to $34,999 | 18 (9.8%) | 10 (22.7%) |
| $35,000 to $49,999 | 18 (9.8%) | 8 (18.2%) |
| $50,000 to $74,999 | 35 (19.1%) | 4 (9.1%) |
| $75,000 to $99,999 | 24 (13.1%) | 9 (20.4%) |
| $100,000 to $149,999 | 29 (15.9%) | 5 (11.4%) |
| $150,000 or more | 2 (1.1%) | 0 (0.0%) |
| Total | 183 (100.0%) | 44 (100.0%) |
Monthly Housing Cost Tiers in Santa Clara Pueblo
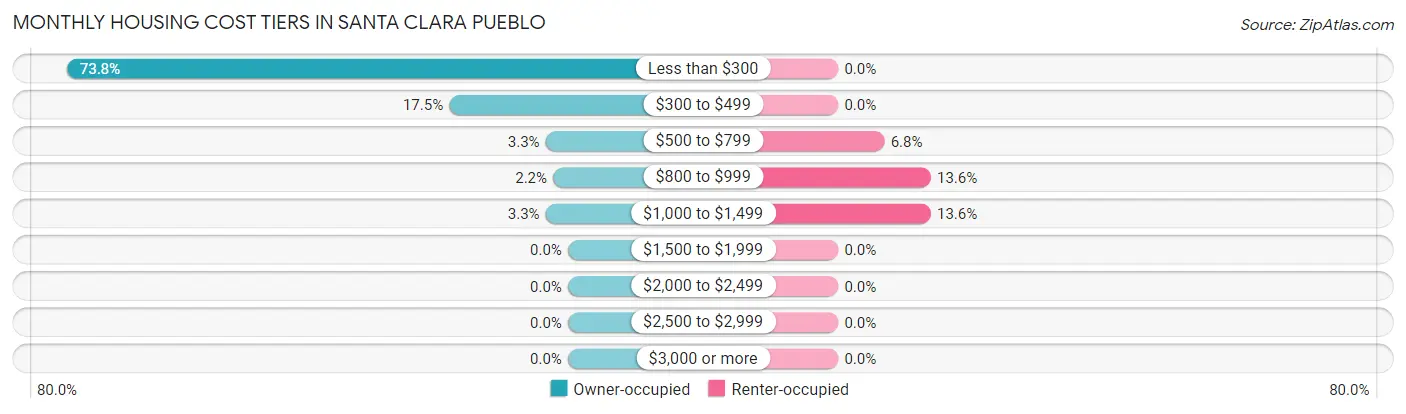
| Monthly Cost | Owner-occupied | Renter-occupied |
| Less than $300 | 135 (73.8%) | 0 (0.0%) |
| $300 to $499 | 32 (17.5%) | 0 (0.0%) |
| $500 to $799 | 6 (3.3%) | 3 (6.8%) |
| $800 to $999 | 4 (2.2%) | 6 (13.6%) |
| $1,000 to $1,499 | 6 (3.3%) | 6 (13.6%) |
| $1,500 to $1,999 | 0 (0.0%) | 0 (0.0%) |
| $2,000 to $2,499 | 0 (0.0%) | 0 (0.0%) |
| $2,500 to $2,999 | 0 (0.0%) | 0 (0.0%) |
| $3,000 or more | 0 (0.0%) | 0 (0.0%) |
| Total | 183 (100.0%) | 44 (100.0%) |
Physical Housing Characteristics in Santa Clara Pueblo
Housing Structures in Santa Clara Pueblo
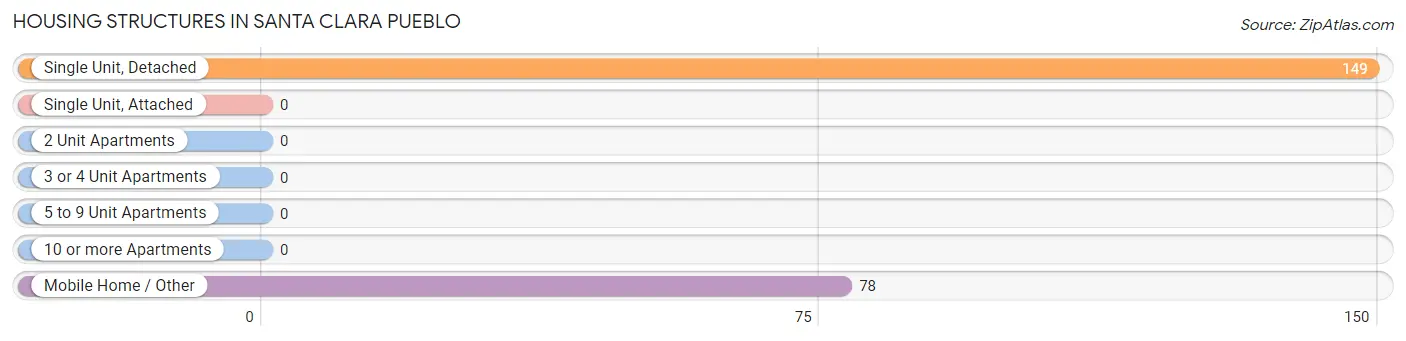
| Structure Type | # Housing Units | % Housing Units |
| Single Unit, Detached | 149 | 65.6% |
| Single Unit, Attached | 0 | 0.0% |
| 2 Unit Apartments | 0 | 0.0% |
| 3 or 4 Unit Apartments | 0 | 0.0% |
| 5 to 9 Unit Apartments | 0 | 0.0% |
| 10 or more Apartments | 0 | 0.0% |
| Mobile Home / Other | 78 | 34.4% |
| Total | 227 | 100.0% |
Housing Structures by Occupancy in Santa Clara Pueblo
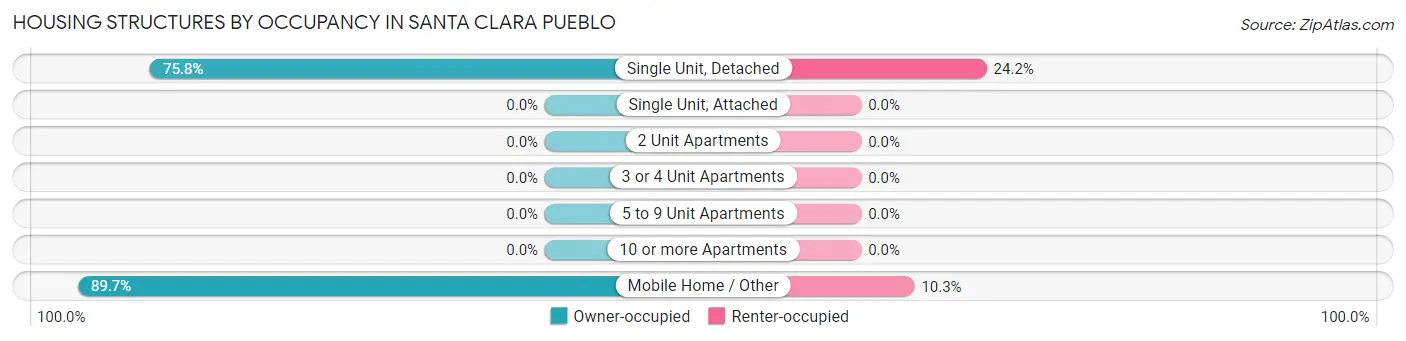
| Structure Type | Owner-occupied | Renter-occupied |
| Single Unit, Detached | 113 (75.8%) | 36 (24.2%) |
| Single Unit, Attached | 0 (0.0%) | 0 (0.0%) |
| 2 Unit Apartments | 0 (0.0%) | 0 (0.0%) |
| 3 or 4 Unit Apartments | 0 (0.0%) | 0 (0.0%) |
| 5 to 9 Unit Apartments | 0 (0.0%) | 0 (0.0%) |
| 10 or more Apartments | 0 (0.0%) | 0 (0.0%) |
| Mobile Home / Other | 70 (89.7%) | 8 (10.3%) |
| Total | 183 (80.6%) | 44 (19.4%) |
Housing Structures by Number of Rooms in Santa Clara Pueblo
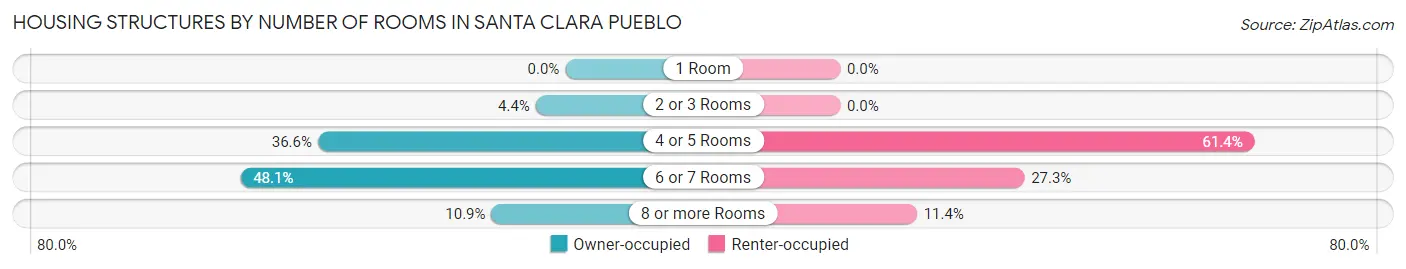
| Number of Rooms | Owner-occupied | Renter-occupied |
| 1 Room | 0 (0.0%) | 0 (0.0%) |
| 2 or 3 Rooms | 8 (4.4%) | 0 (0.0%) |
| 4 or 5 Rooms | 67 (36.6%) | 27 (61.4%) |
| 6 or 7 Rooms | 88 (48.1%) | 12 (27.3%) |
| 8 or more Rooms | 20 (10.9%) | 5 (11.4%) |
| Total | 183 (100.0%) | 44 (100.0%) |
Housing Structure by Heating Type in Santa Clara Pueblo
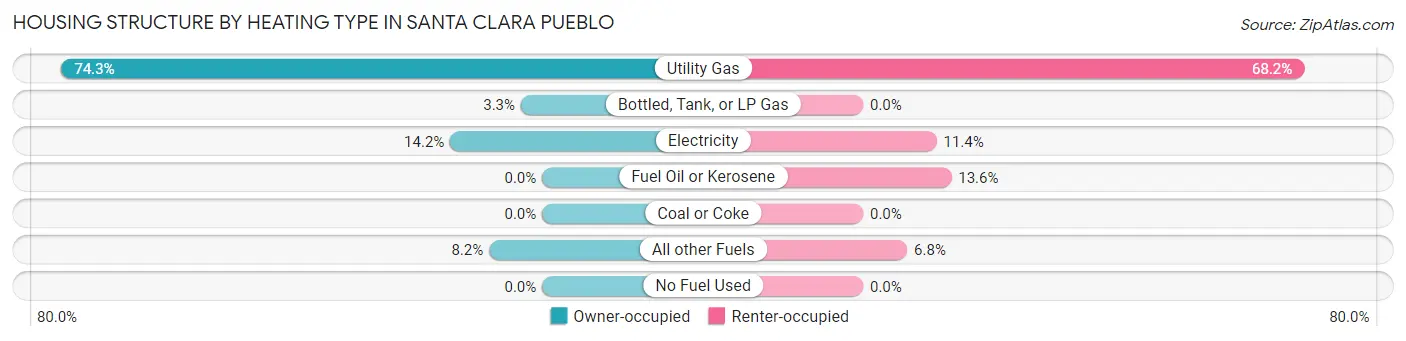
| Heating Type | Owner-occupied | Renter-occupied |
| Utility Gas | 136 (74.3%) | 30 (68.2%) |
| Bottled, Tank, or LP Gas | 6 (3.3%) | 0 (0.0%) |
| Electricity | 26 (14.2%) | 5 (11.4%) |
| Fuel Oil or Kerosene | 0 (0.0%) | 6 (13.6%) |
| Coal or Coke | 0 (0.0%) | 0 (0.0%) |
| All other Fuels | 15 (8.2%) | 3 (6.8%) |
| No Fuel Used | 0 (0.0%) | 0 (0.0%) |
| Total | 183 (100.0%) | 44 (100.0%) |
Household Vehicle Usage in Santa Clara Pueblo
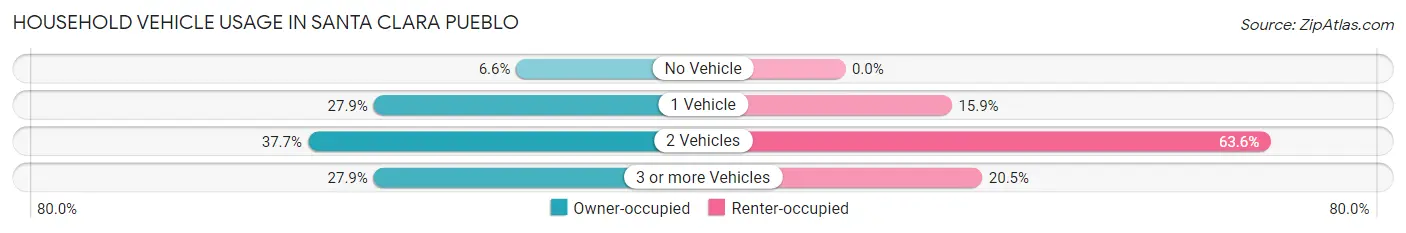
| Vehicles per Household | Owner-occupied | Renter-occupied |
| No Vehicle | 12 (6.6%) | 0 (0.0%) |
| 1 Vehicle | 51 (27.9%) | 7 (15.9%) |
| 2 Vehicles | 69 (37.7%) | 28 (63.6%) |
| 3 or more Vehicles | 51 (27.9%) | 9 (20.4%) |
| Total | 183 (100.0%) | 44 (100.0%) |
Real Estate & Mortgages in Santa Clara Pueblo
Real Estate and Mortgage Overview in Santa Clara Pueblo
| Characteristic | Without Mortgage | With Mortgage |
| Housing Units | 169 | 14 |
| Median Property Value | $212,500 | $0 |
| Median Household Income | $44,583 | $0 |
| Monthly Housing Costs | $206 | $0 |
| Real Estate Taxes | $509 | $8 |
Property Value by Mortgage Status in Santa Clara Pueblo
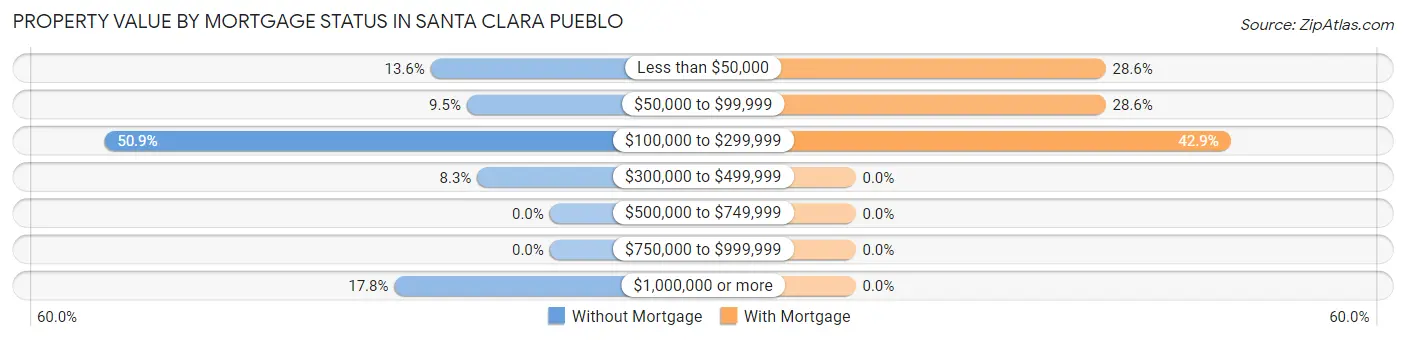
| Property Value | Without Mortgage | With Mortgage |
| Less than $50,000 | 23 (13.6%) | 4 (28.6%) |
| $50,000 to $99,999 | 16 (9.5%) | 4 (28.6%) |
| $100,000 to $299,999 | 86 (50.9%) | 6 (42.9%) |
| $300,000 to $499,999 | 14 (8.3%) | 0 (0.0%) |
| $500,000 to $749,999 | 0 (0.0%) | 0 (0.0%) |
| $750,000 to $999,999 | 0 (0.0%) | 0 (0.0%) |
| $1,000,000 or more | 30 (17.7%) | 0 (0.0%) |
| Total | 169 (100.0%) | 14 (100.0%) |
Household Income by Mortgage Status in Santa Clara Pueblo
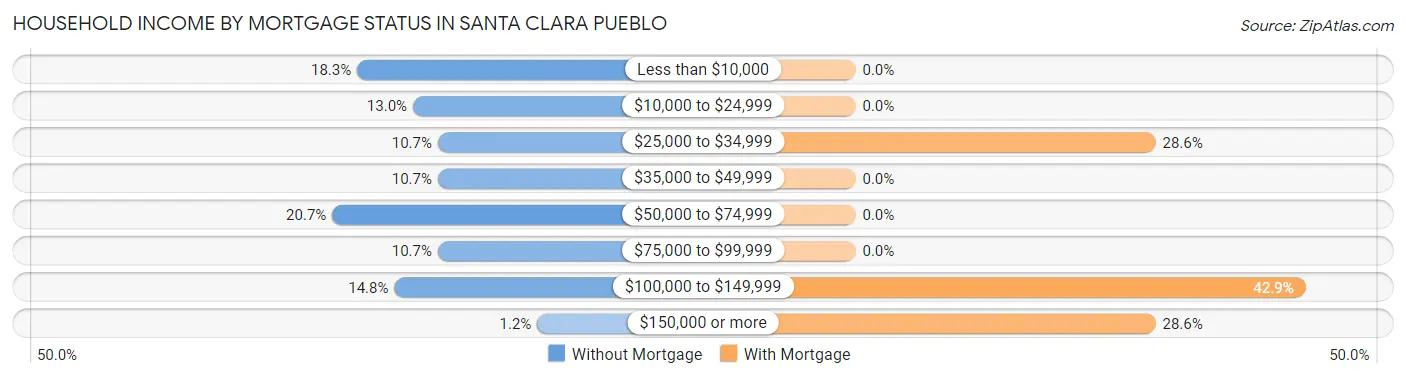
| Household Income | Without Mortgage | With Mortgage |
| Less than $10,000 | 31 (18.3%) | 0 (0.0%) |
| $10,000 to $24,999 | 22 (13.0%) | 0 (0.0%) |
| $25,000 to $34,999 | 18 (10.6%) | 4 (28.6%) |
| $35,000 to $49,999 | 18 (10.6%) | 0 (0.0%) |
| $50,000 to $74,999 | 35 (20.7%) | 0 (0.0%) |
| $75,000 to $99,999 | 18 (10.6%) | 0 (0.0%) |
| $100,000 to $149,999 | 25 (14.8%) | 6 (42.9%) |
| $150,000 or more | 2 (1.2%) | 4 (28.6%) |
| Total | 169 (100.0%) | 14 (100.0%) |
Property Value to Household Income Ratio in Santa Clara Pueblo
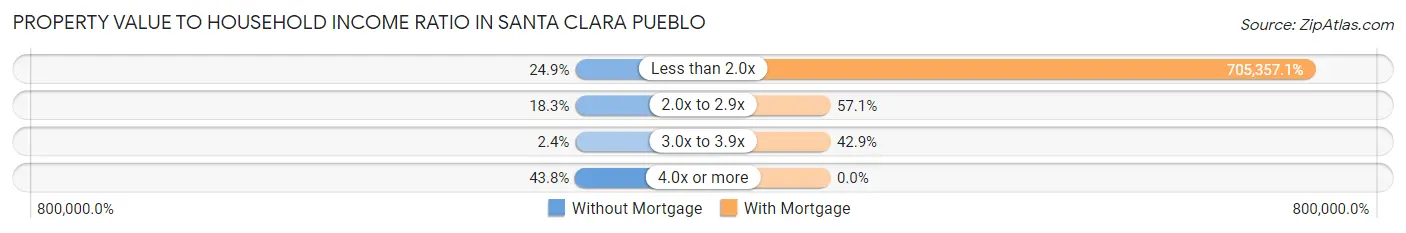
| Value-to-Income Ratio | Without Mortgage | With Mortgage |
| Less than 2.0x | 42 (24.8%) | 98,750 (705,357.1%) |
| 2.0x to 2.9x | 31 (18.3%) | 8 (57.1%) |
| 3.0x to 3.9x | 4 (2.4%) | 6 (42.9%) |
| 4.0x or more | 74 (43.8%) | 0 (0.0%) |
| Total | 169 (100.0%) | 14 (100.0%) |
Real Estate Taxes by Mortgage Status in Santa Clara Pueblo
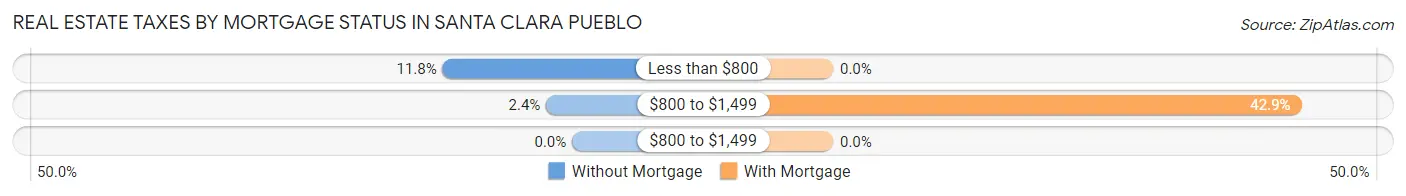
| Property Taxes | Without Mortgage | With Mortgage |
| Less than $800 | 20 (11.8%) | 0 (0.0%) |
| $800 to $1,499 | 4 (2.4%) | 6 (42.9%) |
| $800 to $1,499 | 0 (0.0%) | 0 (0.0%) |
| Total | 169 (100.0%) | 14 (100.0%) |
Health & Disability in Santa Clara Pueblo
Health Insurance Coverage by Age in Santa Clara Pueblo
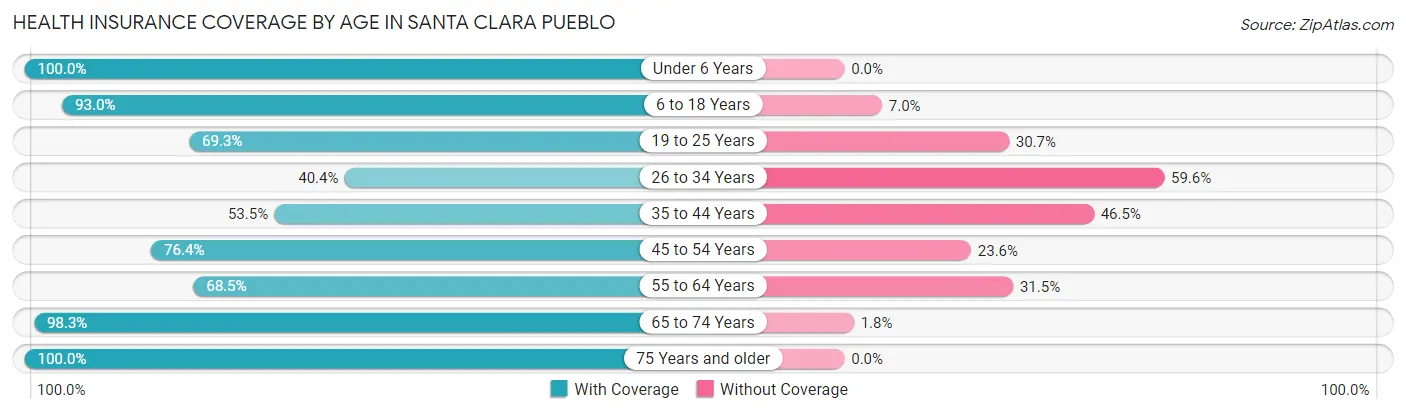
| Age Bracket | With Coverage | Without Coverage |
| Under 6 Years | 64 (100.0%) | 0 (0.0%) |
| 6 to 18 Years | 292 (93.0%) | 22 (7.0%) |
| 19 to 25 Years | 52 (69.3%) | 23 (30.7%) |
| 26 to 34 Years | 21 (40.4%) | 31 (59.6%) |
| 35 to 44 Years | 46 (53.5%) | 40 (46.5%) |
| 45 to 54 Years | 123 (76.4%) | 38 (23.6%) |
| 55 to 64 Years | 61 (68.5%) | 28 (31.5%) |
| 65 to 74 Years | 56 (98.3%) | 1 (1.8%) |
| 75 Years and older | 59 (100.0%) | 0 (0.0%) |
| Total | 774 (80.9%) | 183 (19.1%) |
Health Insurance Coverage by Citizenship Status in Santa Clara Pueblo
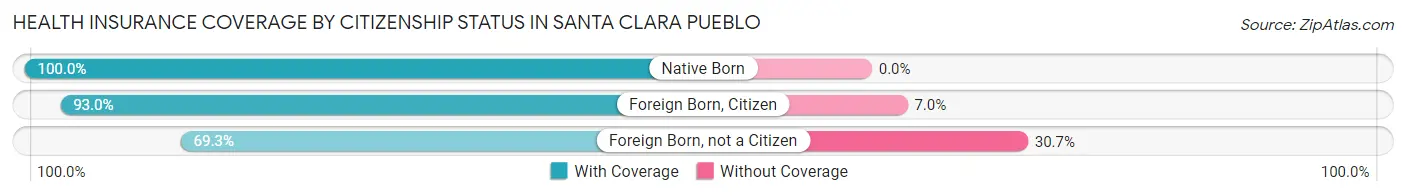
| Citizenship Status | With Coverage | Without Coverage |
| Native Born | 64 (100.0%) | 0 (0.0%) |
| Foreign Born, Citizen | 292 (93.0%) | 22 (7.0%) |
| Foreign Born, not a Citizen | 52 (69.3%) | 23 (30.7%) |
Health Insurance Coverage by Household Income in Santa Clara Pueblo
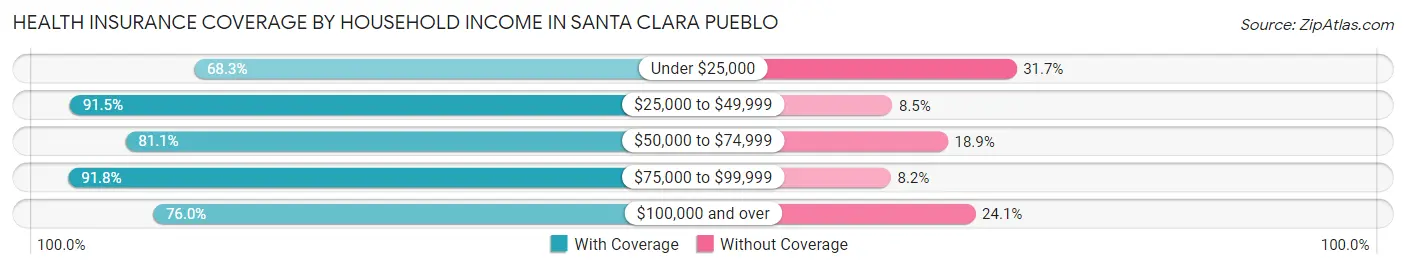
| Household Income | With Coverage | Without Coverage |
| Under $25,000 | 157 (68.3%) | 73 (31.7%) |
| $25,000 to $49,999 | 151 (91.5%) | 14 (8.5%) |
| $50,000 to $74,999 | 189 (81.1%) | 44 (18.9%) |
| $75,000 to $99,999 | 157 (91.8%) | 14 (8.2%) |
| $100,000 and over | 120 (75.9%) | 38 (24.0%) |
Public vs Private Health Insurance Coverage by Age in Santa Clara Pueblo
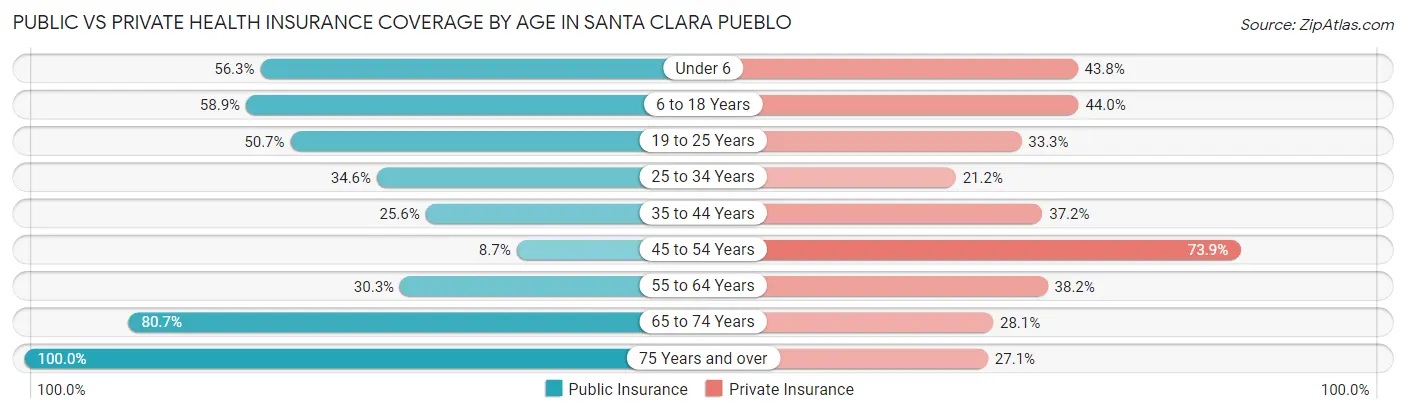
| Age Bracket | Public Insurance | Private Insurance |
| Under 6 | 36 (56.2%) | 28 (43.8%) |
| 6 to 18 Years | 185 (58.9%) | 138 (44.0%) |
| 19 to 25 Years | 38 (50.7%) | 25 (33.3%) |
| 25 to 34 Years | 18 (34.6%) | 11 (21.1%) |
| 35 to 44 Years | 22 (25.6%) | 32 (37.2%) |
| 45 to 54 Years | 14 (8.7%) | 119 (73.9%) |
| 55 to 64 Years | 27 (30.3%) | 34 (38.2%) |
| 65 to 74 Years | 46 (80.7%) | 16 (28.1%) |
| 75 Years and over | 59 (100.0%) | 16 (27.1%) |
| Total | 445 (46.5%) | 419 (43.8%) |
Disability Status by Sex by Age in Santa Clara Pueblo
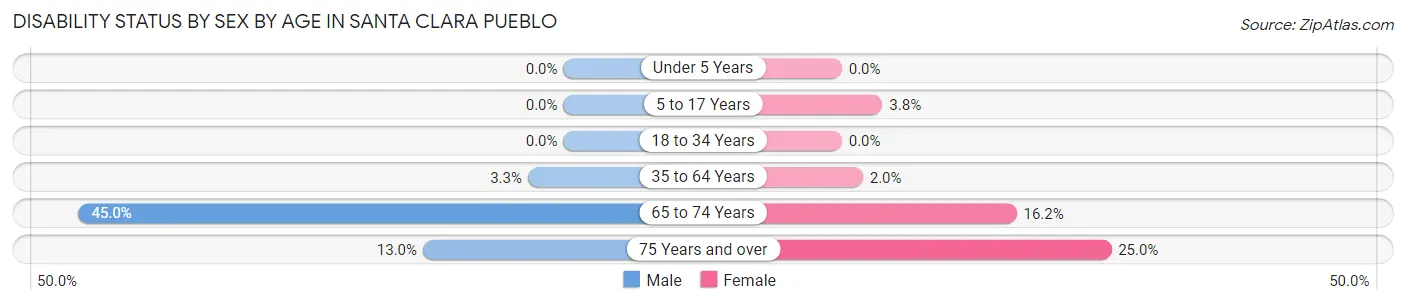
| Age Bracket | Male | Female |
| Under 5 Years | 0 (0.0%) | 0 (0.0%) |
| 5 to 17 Years | 0 (0.0%) | 4 (3.8%) |
| 18 to 34 Years | 0 (0.0%) | 0 (0.0%) |
| 35 to 64 Years | 6 (3.3%) | 3 (1.9%) |
| 65 to 74 Years | 9 (45.0%) | 6 (16.2%) |
| 75 Years and over | 3 (13.0%) | 9 (25.0%) |
Disability Class by Sex by Age in Santa Clara Pueblo
Disability Class: Hearing Difficulty
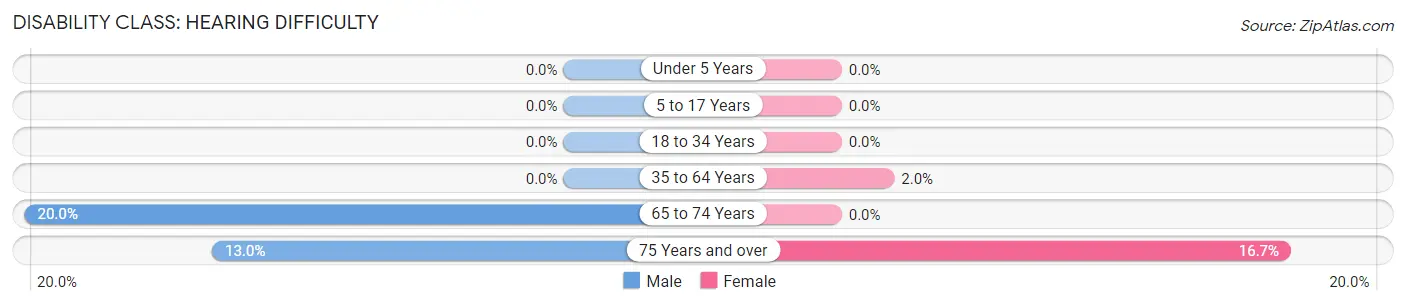
| Age Bracket | Male | Female |
| Under 5 Years | 0 (0.0%) | 0 (0.0%) |
| 5 to 17 Years | 0 (0.0%) | 0 (0.0%) |
| 18 to 34 Years | 0 (0.0%) | 0 (0.0%) |
| 35 to 64 Years | 0 (0.0%) | 3 (1.9%) |
| 65 to 74 Years | 4 (20.0%) | 0 (0.0%) |
| 75 Years and over | 3 (13.0%) | 6 (16.7%) |
Disability Class: Vision Difficulty
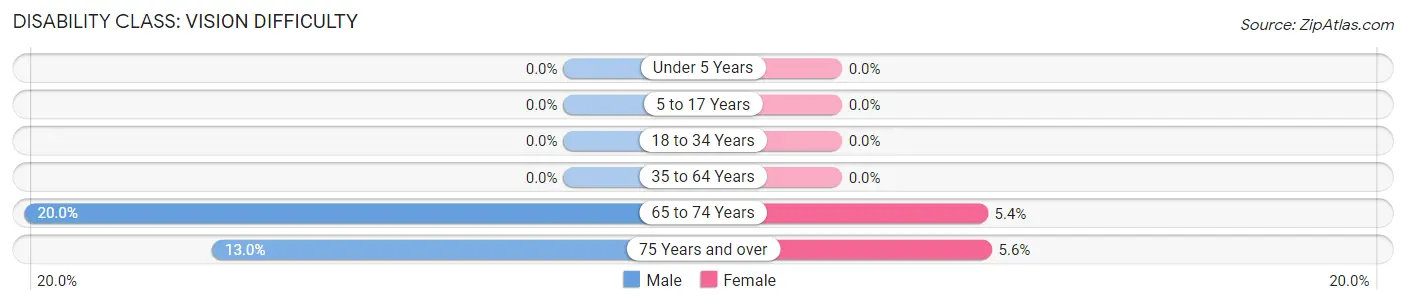
| Age Bracket | Male | Female |
| Under 5 Years | 0 (0.0%) | 0 (0.0%) |
| 5 to 17 Years | 0 (0.0%) | 0 (0.0%) |
| 18 to 34 Years | 0 (0.0%) | 0 (0.0%) |
| 35 to 64 Years | 0 (0.0%) | 0 (0.0%) |
| 65 to 74 Years | 4 (20.0%) | 2 (5.4%) |
| 75 Years and over | 3 (13.0%) | 2 (5.6%) |
Disability Class: Cognitive Difficulty
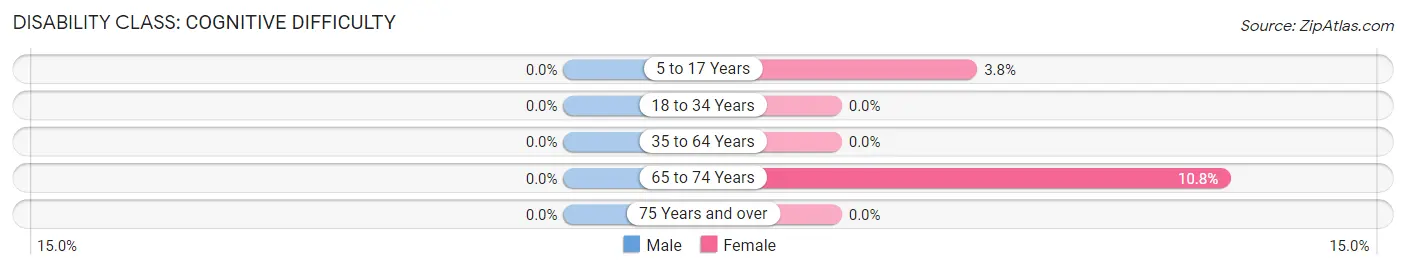
| Age Bracket | Male | Female |
| 5 to 17 Years | 0 (0.0%) | 4 (3.8%) |
| 18 to 34 Years | 0 (0.0%) | 0 (0.0%) |
| 35 to 64 Years | 0 (0.0%) | 0 (0.0%) |
| 65 to 74 Years | 0 (0.0%) | 4 (10.8%) |
| 75 Years and over | 0 (0.0%) | 0 (0.0%) |
Disability Class: Ambulatory Difficulty
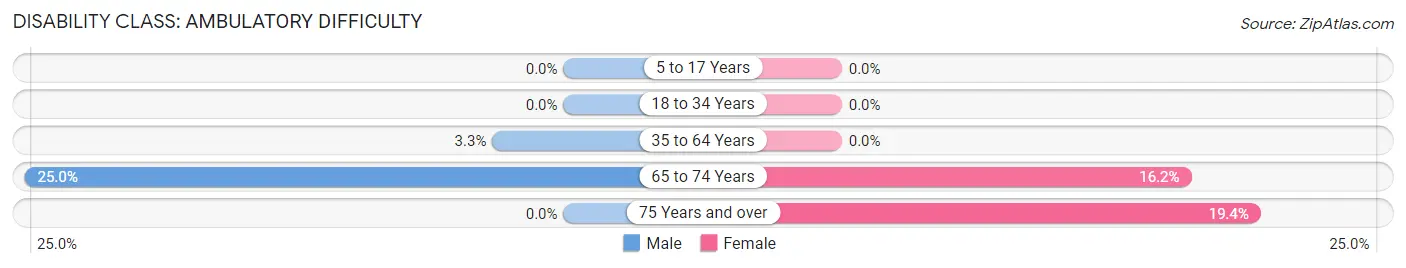
| Age Bracket | Male | Female |
| 5 to 17 Years | 0 (0.0%) | 0 (0.0%) |
| 18 to 34 Years | 0 (0.0%) | 0 (0.0%) |
| 35 to 64 Years | 6 (3.3%) | 0 (0.0%) |
| 65 to 74 Years | 5 (25.0%) | 6 (16.2%) |
| 75 Years and over | 0 (0.0%) | 7 (19.4%) |
Disability Class: Self-Care Difficulty
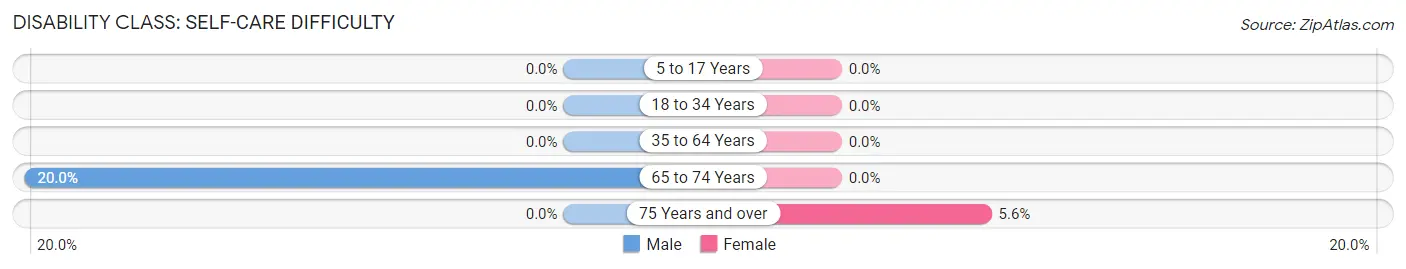
| Age Bracket | Male | Female |
| 5 to 17 Years | 0 (0.0%) | 0 (0.0%) |
| 18 to 34 Years | 0 (0.0%) | 0 (0.0%) |
| 35 to 64 Years | 0 (0.0%) | 0 (0.0%) |
| 65 to 74 Years | 4 (20.0%) | 0 (0.0%) |
| 75 Years and over | 0 (0.0%) | 2 (5.6%) |
Technology Access in Santa Clara Pueblo
Computing Device Access in Santa Clara Pueblo
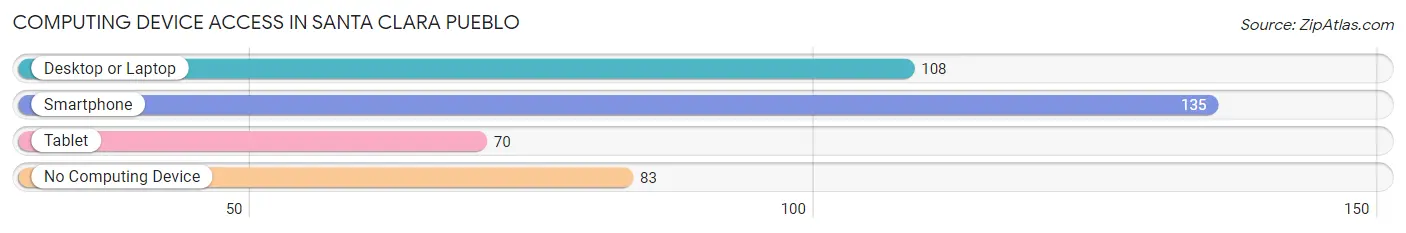
| Device Type | # Households | % Households |
| Desktop or Laptop | 108 | 47.6% |
| Smartphone | 135 | 59.5% |
| Tablet | 70 | 30.8% |
| No Computing Device | 83 | 36.6% |
| Total | 227 | 100.0% |
Internet Access in Santa Clara Pueblo
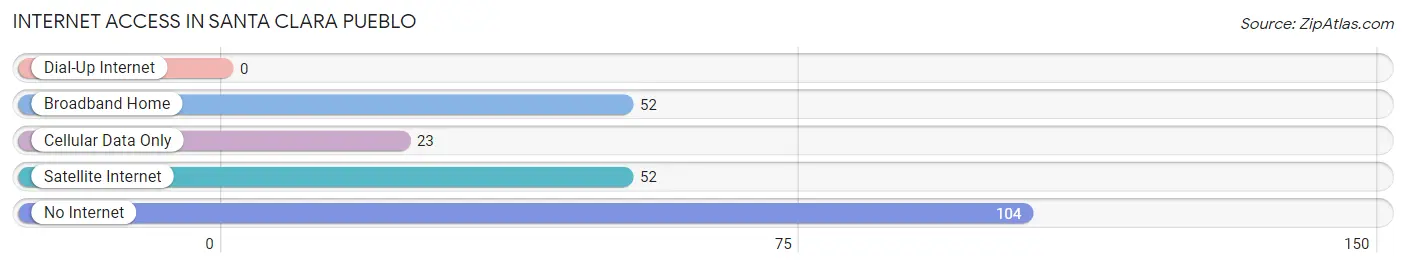
| Internet Type | # Households | % Households |
| Dial-Up Internet | 0 | 0.0% |
| Broadband Home | 52 | 22.9% |
| Cellular Data Only | 23 | 10.1% |
| Satellite Internet | 52 | 22.9% |
| No Internet | 104 | 45.8% |
| Total | 227 | 100.0% |
Santa Clara Pueblo Summary
Santa Clara Pueblo is a Native American Pueblo located in the Rio Grande Valley of northern New Mexico. It is one of the 19 Pueblos of New Mexico, and is home to the Santa Clara people, a Tewa-speaking tribe. The Pueblo is located about 15 miles north of Española, and is bordered by the Santa Fe National Forest to the east and the Jemez Mountains to the west.
History
The Santa Clara Pueblo has a long and rich history, dating back to the 13th century. The Pueblo was first established by the Tewa people, who migrated from the Mesa Verde region of Colorado. The Tewa people were a farming and hunting society, and the Santa Clara Pueblo was established as a place of refuge and safety. The Pueblo was built on the banks of the Rio Grande, and the Tewa people used the river for irrigation and transportation.
The Santa Clara Pueblo was first encountered by Europeans in 1540, when the Spanish explorer Francisco Vásquez de Coronado arrived in the area. The Pueblo was initially friendly to the Spanish, but tensions soon arose between the two groups. In 1680, the Pueblo Revolt occurred, in which the Pueblo people rose up against the Spanish and drove them out of the area. The revolt was successful, and the Pueblo people regained control of their land.
In the 19th century, the Santa Clara Pueblo was ceded to the United States as part of the Treaty of Guadalupe Hidalgo. The Pueblo people were granted a reservation, and the Santa Clara Pueblo was officially recognized by the United States government in 1876.
Geography
The Santa Clara Pueblo is located in the Rio Grande Valley of northern New Mexico. The Pueblo is situated on the banks of the Rio Grande, and is bordered by the Santa Fe National Forest to the east and the Jemez Mountains to the west. The Pueblo is about 15 miles north of Española, and is about 40 miles north of Santa Fe.
The Santa Clara Pueblo is located at an elevation of 5,400 feet, and the climate is semi-arid. The average annual temperature is about 50 degrees Fahrenheit, and the average annual precipitation is about 12 inches.
Economy
The economy of the Santa Clara Pueblo is largely based on tourism and agriculture. The Pueblo is home to a number of tourist attractions, including the Santa Clara Museum and the Santa Clara Cultural Center. The Pueblo also hosts a number of annual events, such as the Santa Clara Feast Day and the Santa Clara Indian Market.
Agriculture is also an important part of the economy of the Santa Clara Pueblo. The Pueblo is home to a number of farms, which produce a variety of crops, including corn, beans, squash, and melons. The Pueblo also produces a variety of traditional crafts, such as pottery, jewelry, and textiles.
Demographics
As of the 2010 census, the population of the Santa Clara Pueblo was 2,788. The population is primarily Native American, with about 95% of the population identifying as Native American. The majority of the population is Tewa-speaking, and the Pueblo is home to a number of other Native American tribes, including the Hopi, Zuni, and Navajo.
The median household income in the Santa Clara Pueblo is $30,000, and the median home value is $150,000. The unemployment rate is about 8%, and the poverty rate is about 25%. The majority of the population is Roman Catholic, and the Pueblo is home to a number of churches.
Common Questions
What is Per Capita Income in Santa Clara Pueblo?
Per Capita income in Santa Clara Pueblo is $17,420.
What is the Median Family Income in Santa Clara Pueblo?
Median Family Income in Santa Clara Pueblo is $73,333.
What is the Median Household income in Santa Clara Pueblo?
Median Household Income in Santa Clara Pueblo is $48,625.
What is Income or Wage Gap in Santa Clara Pueblo?
Income or Wage Gap in Santa Clara Pueblo is 12.4%.
Women in Santa Clara Pueblo earn 87.6 cents for every dollar earned by a man.
What is Inequality or Gini Index in Santa Clara Pueblo?
Inequality or Gini Index in Santa Clara Pueblo is 0.43.
What is the Total Population of Santa Clara Pueblo?
Total Population of Santa Clara Pueblo is 957.
What is the Total Male Population of Santa Clara Pueblo?
Total Male Population of Santa Clara Pueblo is 522.
What is the Total Female Population of Santa Clara Pueblo?
Total Female Population of Santa Clara Pueblo is 435.
What is the Ratio of Males per 100 Females in Santa Clara Pueblo?
There are 120.00 Males per 100 Females in Santa Clara Pueblo.
What is the Ratio of Females per 100 Males in Santa Clara Pueblo?
There are 83.33 Females per 100 Males in Santa Clara Pueblo.
What is the Median Population Age in Santa Clara Pueblo?
Median Population Age in Santa Clara Pueblo is 28.8 Years.
What is the Average Family Size in Santa Clara Pueblo
Average Family Size in Santa Clara Pueblo is 6.0 People.
What is the Average Household Size in Santa Clara Pueblo
Average Household Size in Santa Clara Pueblo is 4.2 People.
How Large is the Labor Force in Santa Clara Pueblo?
There are 298 People in the Labor Forcein in Santa Clara Pueblo.
What is the Percentage of People in the Labor Force in Santa Clara Pueblo?
41.2% of People are in the Labor Force in Santa Clara Pueblo.
What is the Unemployment Rate in Santa Clara Pueblo?
Unemployment Rate in Santa Clara Pueblo is 1.3%.