Paraje, NM Map & Demographics
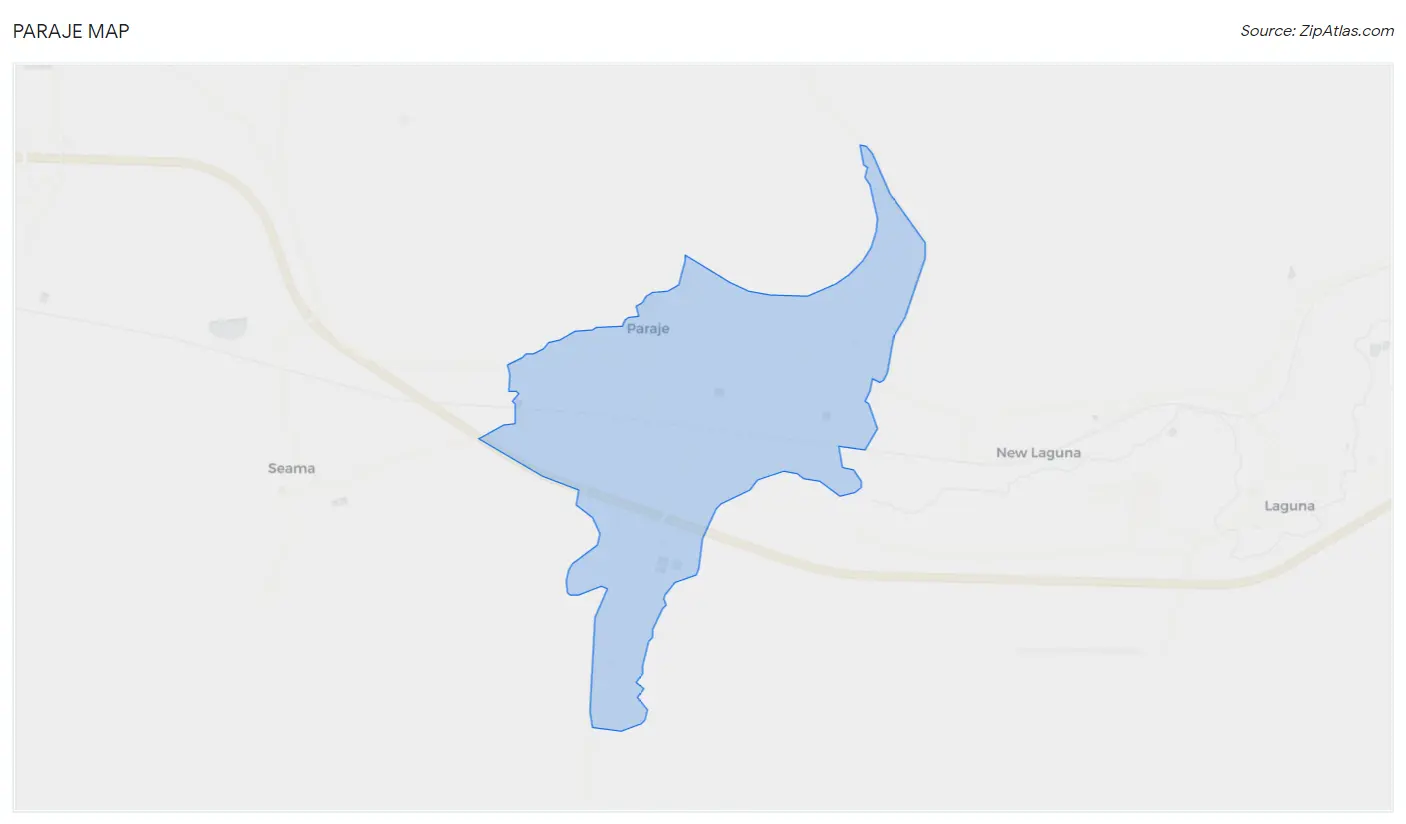
Paraje Map
Paraje Overview
$11,828
PER CAPITA INCOME
$29,856
AVG FAMILY INCOME
$28,942
AVG HOUSEHOLD INCOME
42.6%
WAGE / INCOME GAP [ % ]
57.4¢/ $1
WAGE / INCOME GAP [ $ ]
0.42
INEQUALITY / GINI INDEX
1,362
TOTAL POPULATION
686
MALE POPULATION
676
FEMALE POPULATION
101.48
MALES / 100 FEMALES
98.54
FEMALES / 100 MALES
27.8
MEDIAN AGE
4.8
AVG FAMILY SIZE
4.5
AVG HOUSEHOLD SIZE
456
LABOR FORCE [ PEOPLE ]
40.8%
PERCENT IN LABOR FORCE
Paraje Area Codes
Income in Paraje
Income Overview in Paraje
Per Capita Income in Paraje is $11,828, while median incomes of families and households are $29,856 and $28,942 respectively.
| Characteristic | Number | Measure |
| Per Capita Income | 1,362 | $11,828 |
| Median Family Income | 269 | $29,856 |
| Mean Family Income | 269 | $41,836 |
| Median Household Income | 288 | $28,942 |
| Mean Household Income | 288 | $39,380 |
| Income Deficit | 269 | $0 |
| Wage / Income Gap (%) | 1,362 | 42.61% |
| Wage / Income Gap ($) | 1,362 | 57.39¢ per $1 |
| Gini / Inequality Index | 1,362 | 0.42 |
Earnings by Sex in Paraje
Average Earnings in Paraje are $25,313, $28,185 for men and $16,174 for women, a difference of 42.6%.
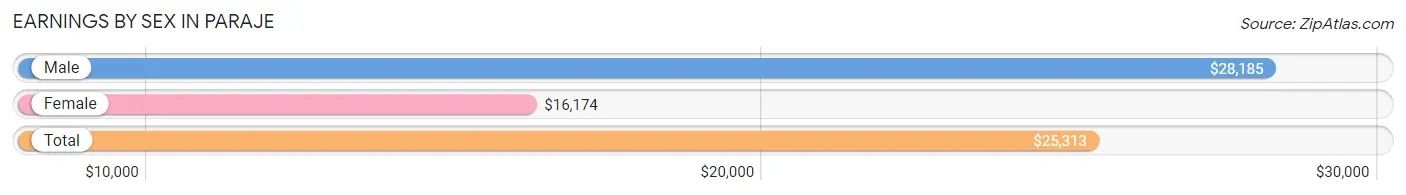
| Sex | Number | Average Earnings |
| Male | 283 (62.1%) | $28,185 |
| Female | 173 (37.9%) | $16,174 |
| Total | 456 (100.0%) | $25,313 |
Earnings by Sex by Income Bracket in Paraje
The most common earnings brackets in Paraje are $25,000 to $29,999 for men (98 | 34.6%) and $7,500 to $9,999 for women (50 | 28.9%).
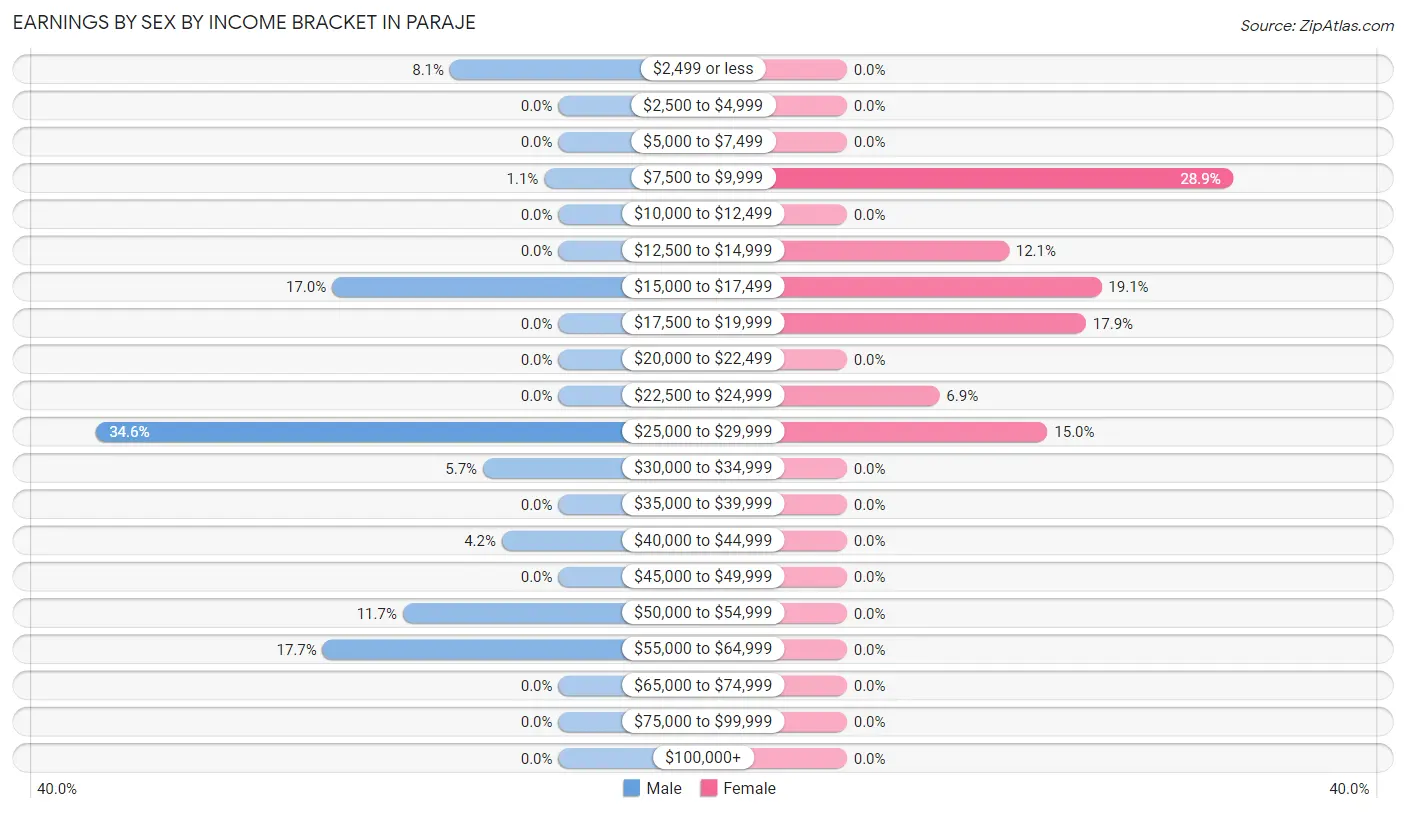
| Income | Male | Female |
| $2,499 or less | 23 (8.1%) | 0 (0.0%) |
| $2,500 to $4,999 | 0 (0.0%) | 0 (0.0%) |
| $5,000 to $7,499 | 0 (0.0%) | 0 (0.0%) |
| $7,500 to $9,999 | 3 (1.1%) | 50 (28.9%) |
| $10,000 to $12,499 | 0 (0.0%) | 0 (0.0%) |
| $12,500 to $14,999 | 0 (0.0%) | 21 (12.1%) |
| $15,000 to $17,499 | 48 (17.0%) | 33 (19.1%) |
| $17,500 to $19,999 | 0 (0.0%) | 31 (17.9%) |
| $20,000 to $22,499 | 0 (0.0%) | 0 (0.0%) |
| $22,500 to $24,999 | 0 (0.0%) | 12 (6.9%) |
| $25,000 to $29,999 | 98 (34.6%) | 26 (15.0%) |
| $30,000 to $34,999 | 16 (5.7%) | 0 (0.0%) |
| $35,000 to $39,999 | 0 (0.0%) | 0 (0.0%) |
| $40,000 to $44,999 | 12 (4.2%) | 0 (0.0%) |
| $45,000 to $49,999 | 0 (0.0%) | 0 (0.0%) |
| $50,000 to $54,999 | 33 (11.7%) | 0 (0.0%) |
| $55,000 to $64,999 | 50 (17.7%) | 0 (0.0%) |
| $65,000 to $74,999 | 0 (0.0%) | 0 (0.0%) |
| $75,000 to $99,999 | 0 (0.0%) | 0 (0.0%) |
| $100,000+ | 0 (0.0%) | 0 (0.0%) |
| Total | 283 (100.0%) | 173 (100.0%) |
Earnings by Sex by Educational Attainment in Paraje
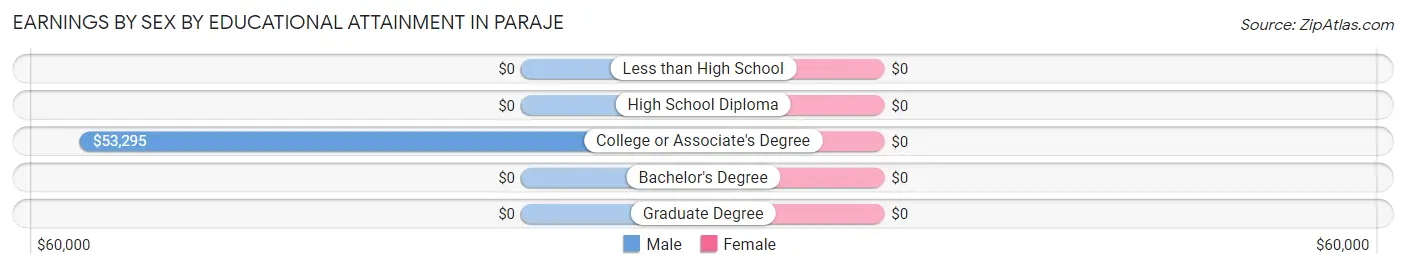
| Educational Attainment | Male Income | Female Income |
| Less than High School | - | - |
| High School Diploma | - | - |
| College or Associate's Degree | $53,295 | $0 |
| Bachelor's Degree | - | - |
| Graduate Degree | - | - |
| Total | $36,250 | $19,435 |
Family Income in Paraje
Family Income Brackets in Paraje
According to the Paraje family income data, there are 67 families falling into the $15,000 to $24,999 income range, which is the most common income bracket and makes up 24.9% of all families.
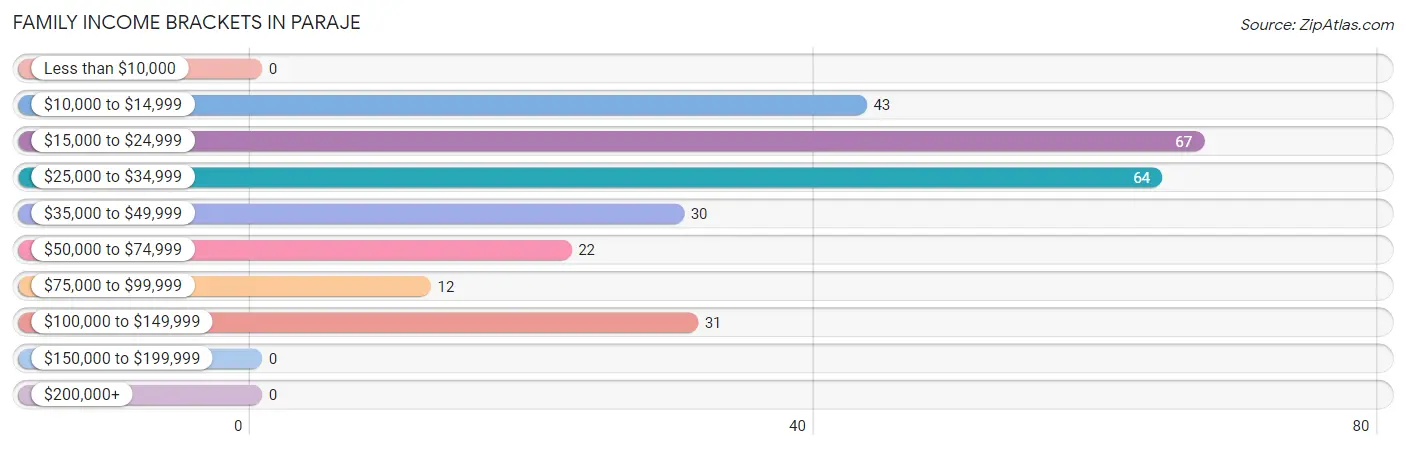
| Income Bracket | # Families | % Families |
| Less than $10,000 | 0 | 0.0% |
| $10,000 to $14,999 | 43 | 16.0% |
| $15,000 to $24,999 | 67 | 24.9% |
| $25,000 to $34,999 | 64 | 23.8% |
| $35,000 to $49,999 | 30 | 11.2% |
| $50,000 to $74,999 | 22 | 8.2% |
| $75,000 to $99,999 | 12 | 4.5% |
| $100,000 to $149,999 | 31 | 11.5% |
| $150,000 to $199,999 | 0 | 0.0% |
| $200,000+ | 0 | 0.0% |
Family Income by Famaliy Size in Paraje
| Income Bracket | # Families | Median Income |
| 2-Person Families | 71 (26.4%) | $0 |
| 3-Person Families | 71 (26.4%) | $0 |
| 4-Person Families | 36 (13.4%) | $0 |
| 5-Person Families | 60 (22.3%) | $0 |
| 6-Person Families | 0 (0.0%) | $0 |
| 7+ Person Families | 31 (11.5%) | $0 |
| Total | 269 (100.0%) | $29,856 |
Family Income by Number of Earners in Paraje
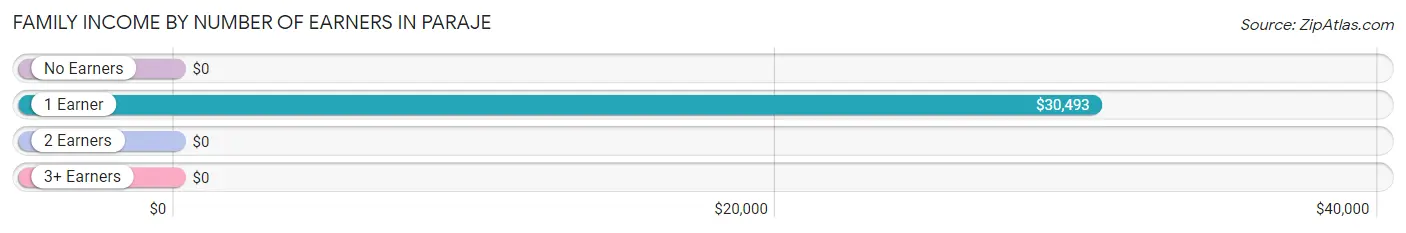
| Number of Earners | # Families | Median Income |
| No Earners | 81 (30.1%) | $0 |
| 1 Earner | 109 (40.5%) | $30,493 |
| 2 Earners | 48 (17.8%) | $0 |
| 3+ Earners | 31 (11.5%) | $0 |
| Total | 269 (100.0%) | $29,856 |
Household Income in Paraje
Household Income Brackets in Paraje
With 67 households falling in the category, the $15,000 to $24,999 income range is the most frequent in Paraje, accounting for 23.3% of all households.
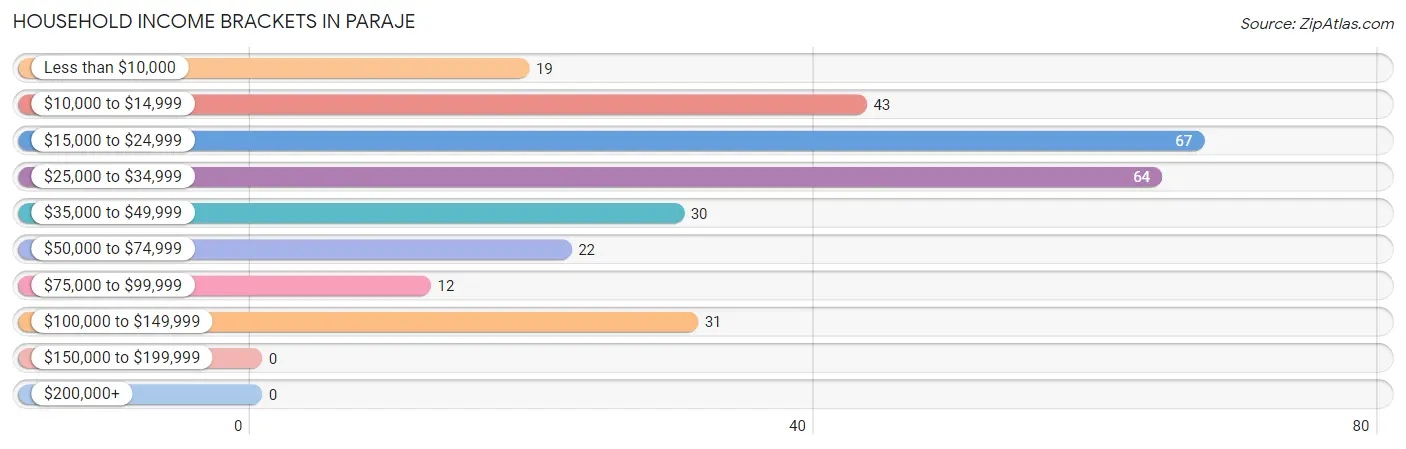
| Income Bracket | # Households | % Households |
| Less than $10,000 | 19 | 6.6% |
| $10,000 to $14,999 | 43 | 14.9% |
| $15,000 to $24,999 | 67 | 23.3% |
| $25,000 to $34,999 | 64 | 22.2% |
| $35,000 to $49,999 | 30 | 10.4% |
| $50,000 to $74,999 | 22 | 7.6% |
| $75,000 to $99,999 | 12 | 4.2% |
| $100,000 to $149,999 | 31 | 10.8% |
| $150,000 to $199,999 | 0 | 0.0% |
| $200,000+ | 0 | 0.0% |
Household Income by Householder Age in Paraje
The median household income in Paraje is $28,942, with the highest median household income of $30,341 found in the 45 to 64 years age bracket for the primary householder. A total of 160 households (55.6%) fall into this category.
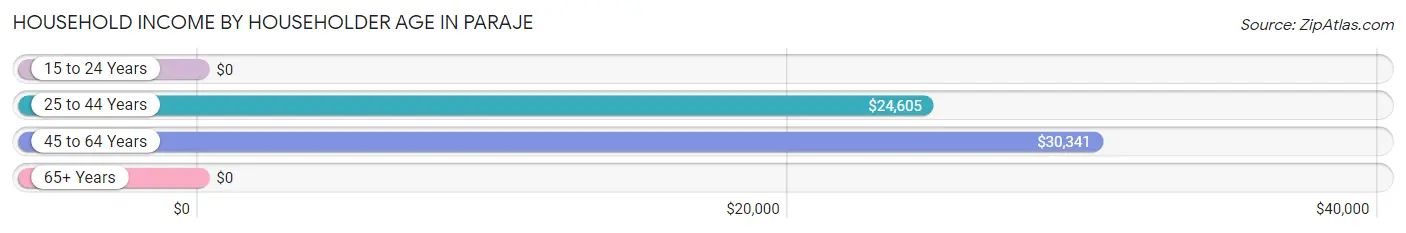
| Income Bracket | # Households | Median Income |
| 15 to 24 Years | 0 (0.0%) | $0 |
| 25 to 44 Years | 64 (22.2%) | $24,605 |
| 45 to 64 Years | 160 (55.6%) | $30,341 |
| 65+ Years | 64 (22.2%) | $0 |
| Total | 288 (100.0%) | $28,942 |
Poverty in Paraje
Income Below Poverty by Sex and Age in Paraje
With 45.8% poverty level for males and 65.2% for females among the residents of Paraje, 12 to 14 year old males and 6 to 11 year old females are the most vulnerable to poverty, with 40 males (100.0%) and 77 females (100.0%) in their respective age groups living below the poverty level.
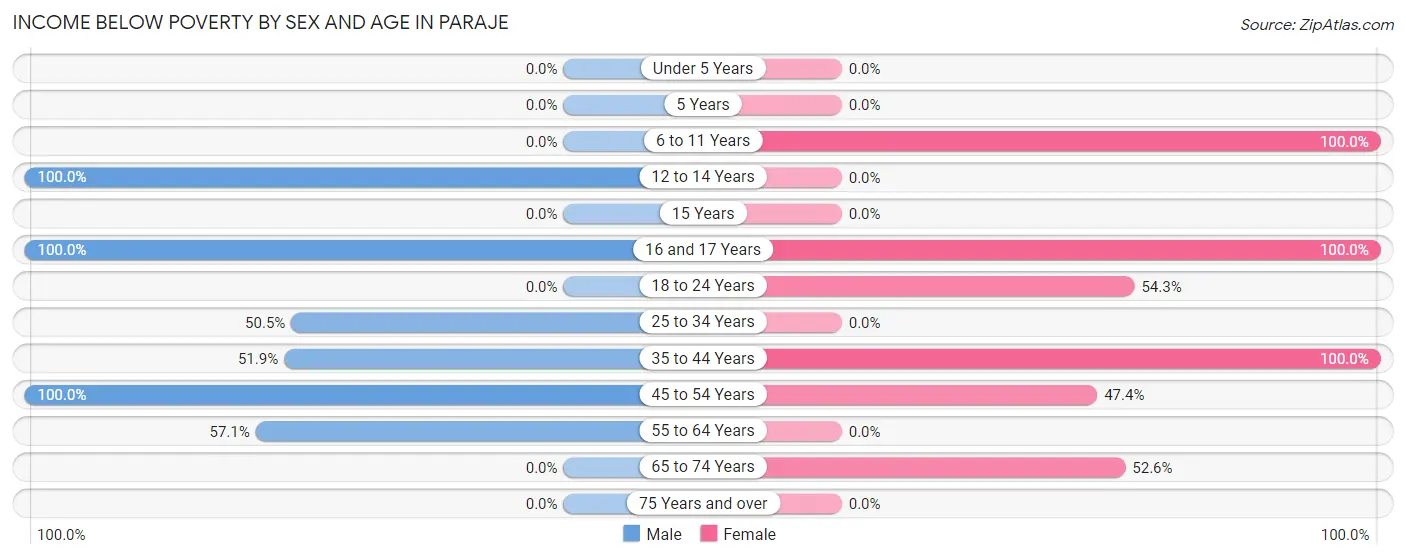
| Age Bracket | Male | Female |
| Under 5 Years | 0 (0.0%) | 0 (0.0%) |
| 5 Years | 0 (0.0%) | 0 (0.0%) |
| 6 to 11 Years | 0 (0.0%) | 77 (100.0%) |
| 12 to 14 Years | 40 (100.0%) | 0 (0.0%) |
| 15 Years | 0 (0.0%) | 0 (0.0%) |
| 16 and 17 Years | 51 (100.0%) | 17 (100.0%) |
| 18 to 24 Years | 0 (0.0%) | 113 (54.3%) |
| 25 to 34 Years | 98 (50.5%) | 0 (0.0%) |
| 35 to 44 Years | 28 (51.8%) | 125 (100.0%) |
| 45 to 54 Years | 38 (100.0%) | 55 (47.4%) |
| 55 to 64 Years | 44 (57.1%) | 0 (0.0%) |
| 65 to 74 Years | 0 (0.0%) | 40 (52.6%) |
| 75 Years and over | 0 (0.0%) | 0 (0.0%) |
| Total | 299 (45.8%) | 427 (65.2%) |
Income Above Poverty by Sex and Age in Paraje
According to the poverty statistics in Paraje, males aged under 5 years and females aged 12 to 14 years are the age groups that are most secure financially, with 100.0% of males and 100.0% of females in these age groups living above the poverty line.
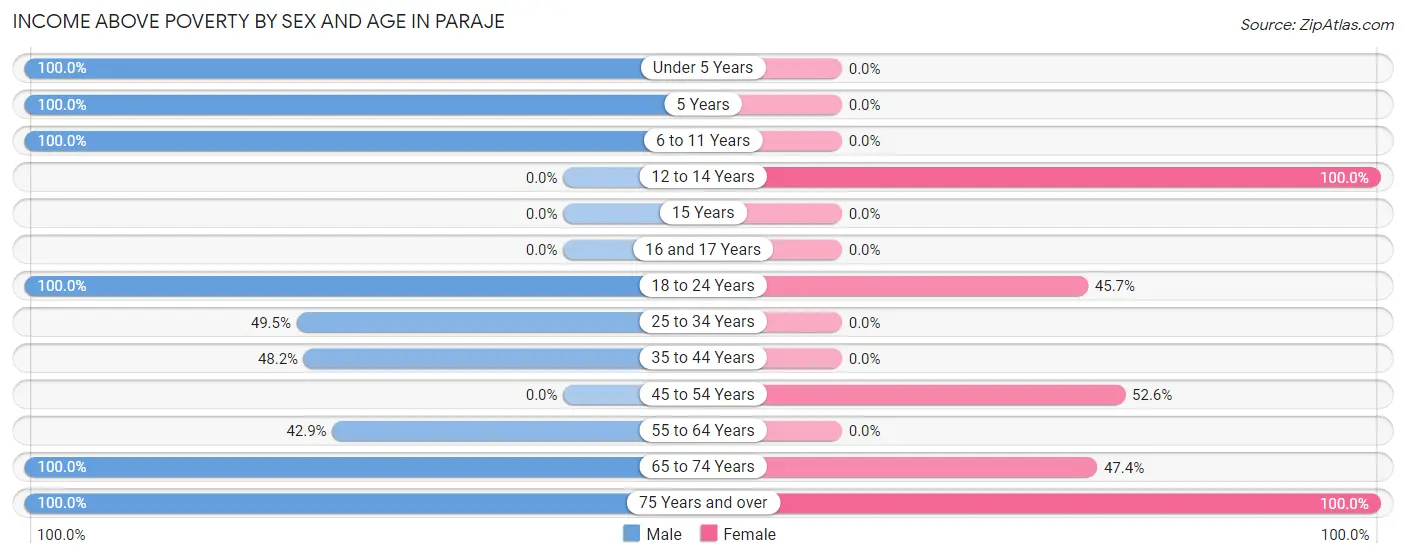
| Age Bracket | Male | Female |
| Under 5 Years | 41 (100.0%) | 0 (0.0%) |
| 5 Years | 23 (100.0%) | 0 (0.0%) |
| 6 to 11 Years | 39 (100.0%) | 0 (0.0%) |
| 12 to 14 Years | 0 (0.0%) | 24 (100.0%) |
| 15 Years | 0 (0.0%) | 0 (0.0%) |
| 16 and 17 Years | 0 (0.0%) | 0 (0.0%) |
| 18 to 24 Years | 42 (100.0%) | 95 (45.7%) |
| 25 to 34 Years | 96 (49.5%) | 0 (0.0%) |
| 35 to 44 Years | 26 (48.1%) | 0 (0.0%) |
| 45 to 54 Years | 0 (0.0%) | 61 (52.6%) |
| 55 to 64 Years | 33 (42.9%) | 0 (0.0%) |
| 65 to 74 Years | 43 (100.0%) | 36 (47.4%) |
| 75 Years and over | 11 (100.0%) | 12 (100.0%) |
| Total | 354 (54.2%) | 228 (34.8%) |
Income Below Poverty Among Married-Couple Families in Paraje
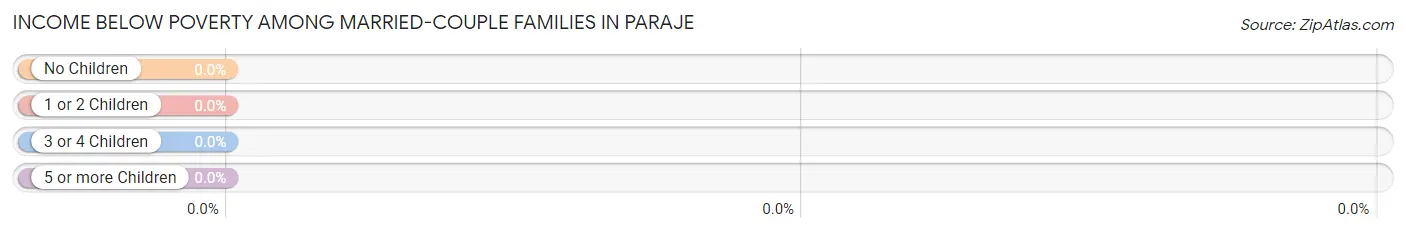
| Children | Above Poverty | Below Poverty |
| No Children | 12 (100.0%) | 0 (0.0%) |
| 1 or 2 Children | 0 (0.0%) | 0 (0.0%) |
| 3 or 4 Children | 0 (0.0%) | 0 (0.0%) |
| 5 or more Children | 0 (0.0%) | 0 (0.0%) |
| Total | 12 (100.0%) | 0 (0.0%) |
Income Below Poverty Among Single-Parent Households in Paraje
According to the poverty data in Paraje, 62.9% or 44 single-father households and 61.0% or 114 single-mother households are living below the poverty line. Among single-father households, those with no children have the highest poverty rate, with 44 households (100.0%) experiencing poverty. Likewise, among single-mother households, those with 3 or 4 children have the highest poverty rate, with 64 households (100.0%) falling below the poverty line.
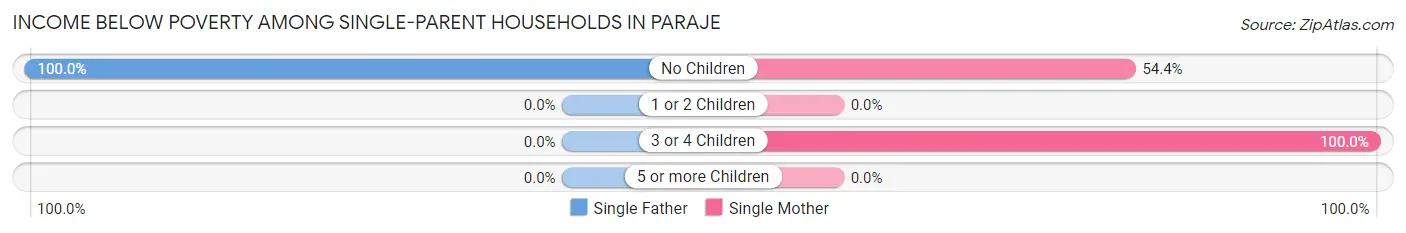
| Children | Single Father | Single Mother |
| No Children | 44 (100.0%) | 50 (54.3%) |
| 1 or 2 Children | 0 (0.0%) | 0 (0.0%) |
| 3 or 4 Children | 0 (0.0%) | 64 (100.0%) |
| 5 or more Children | 0 (0.0%) | 0 (0.0%) |
| Total | 44 (62.9%) | 114 (61.0%) |
Income Below Poverty Among Married-Couple vs Single-Parent Households in Paraje
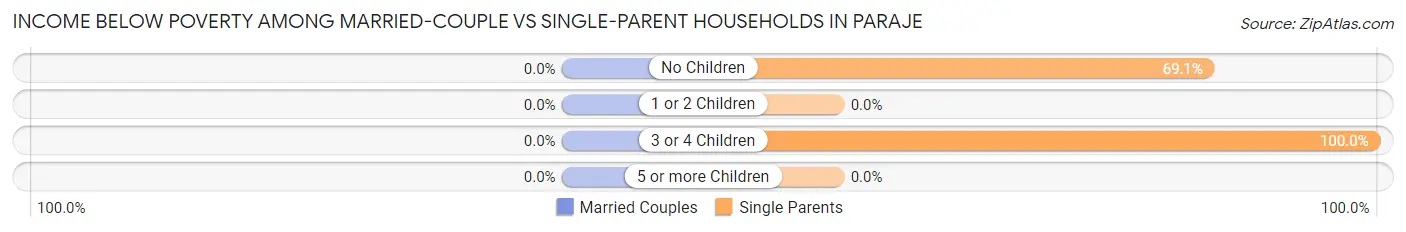
| Children | Married-Couple Families | Single-Parent Households |
| No Children | 0 (0.0%) | 94 (69.1%) |
| 1 or 2 Children | 0 (0.0%) | 0 (0.0%) |
| 3 or 4 Children | 0 (0.0%) | 64 (100.0%) |
| 5 or more Children | 0 (0.0%) | 0 (0.0%) |
| Total | 0 (0.0%) | 158 (61.5%) |
Race in Paraje
The most populous races in Paraje are Native / Alaskan (1,310 | 96.2%), Hispanic or Latino (47 | 3.5%), and White / Caucasian (42 | 3.1%).
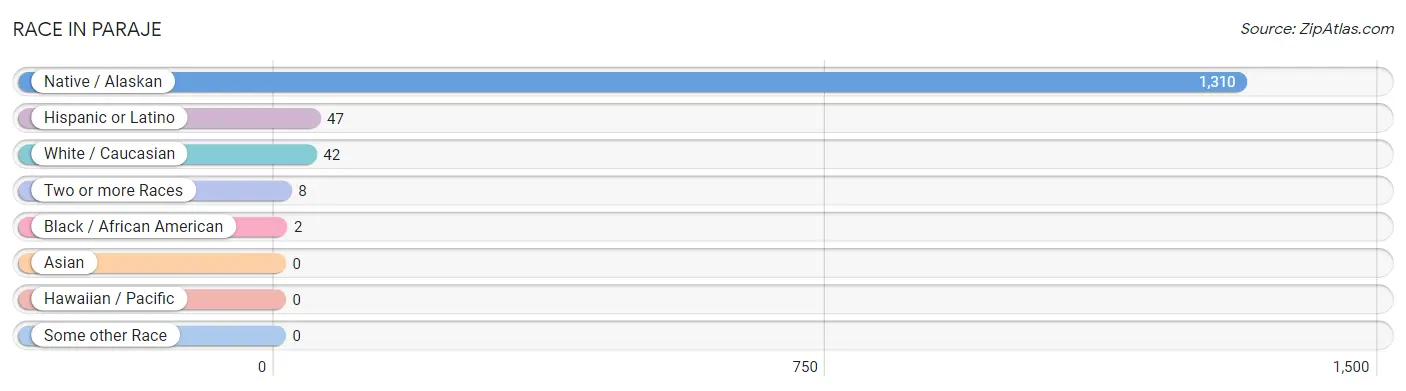
| Race | # Population | % Population |
| Asian | 0 | 0.0% |
| Black / African American | 2 | 0.2% |
| Hawaiian / Pacific | 0 | 0.0% |
| Hispanic or Latino | 47 | 3.5% |
| Native / Alaskan | 1,310 | 96.2% |
| White / Caucasian | 42 | 3.1% |
| Two or more Races | 8 | 0.6% |
| Some other Race | 0 | 0.0% |
| Total | 1,362 | 100.0% |
Ancestry in Paraje
The most populous ancestries reported in Paraje are Pueblo (1,300 | 95.5%), Sioux (175 | 12.9%), Mexican (39 | 2.9%), Scotch-Irish (26 | 1.9%), and Navajo (10 | 0.7%), together accounting for 113.8% of all Paraje residents.
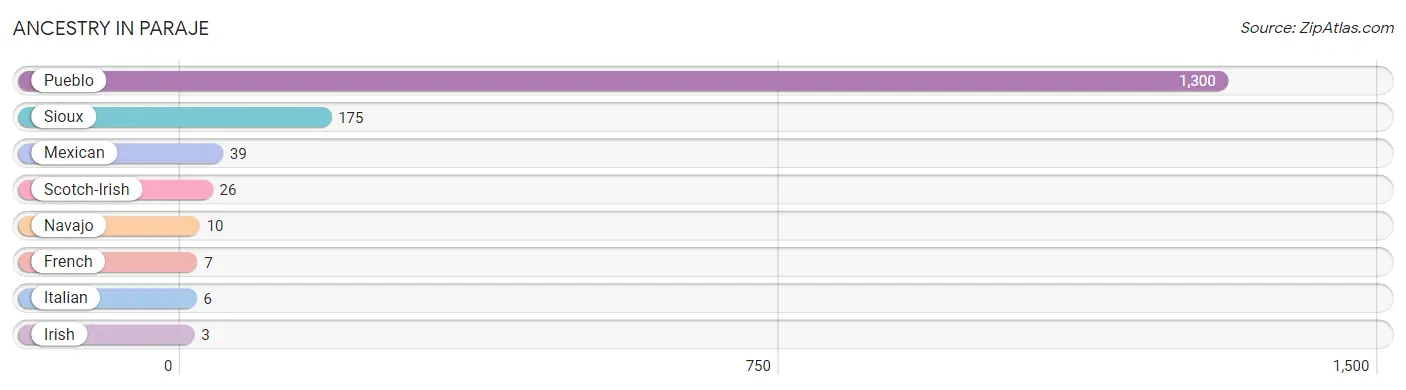
| Ancestry | # Population | % Population |
| French | 7 | 0.5% |
| Irish | 3 | 0.2% |
| Italian | 6 | 0.4% |
| Mexican | 39 | 2.9% |
| Navajo | 10 | 0.7% |
| Pueblo | 1,300 | 95.5% |
| Scotch-Irish | 26 | 1.9% |
| Sioux | 175 | 12.9% | View All 8 Rows |
Immigrants in Paraje

| Immigration Origin | # Population | % Population | View All 0 Rows |
Sex and Age in Paraje
Sex and Age in Paraje
The most populous age groups in Paraje are 25 to 29 Years (136 | 19.8%) for men and 15 to 19 Years (134 | 19.8%) for women.
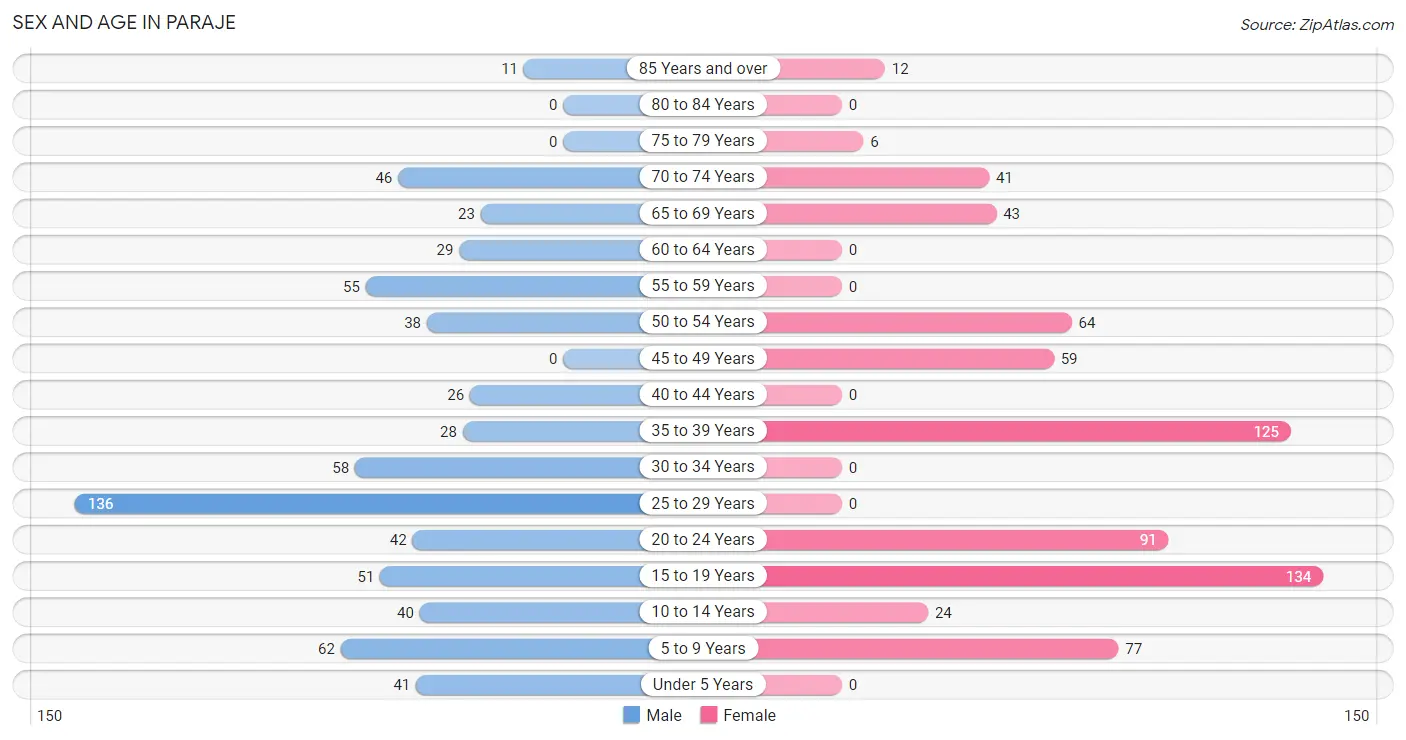
| Age Bracket | Male | Female |
| Under 5 Years | 41 (6.0%) | 0 (0.0%) |
| 5 to 9 Years | 62 (9.0%) | 77 (11.4%) |
| 10 to 14 Years | 40 (5.8%) | 24 (3.5%) |
| 15 to 19 Years | 51 (7.4%) | 134 (19.8%) |
| 20 to 24 Years | 42 (6.1%) | 91 (13.5%) |
| 25 to 29 Years | 136 (19.8%) | 0 (0.0%) |
| 30 to 34 Years | 58 (8.5%) | 0 (0.0%) |
| 35 to 39 Years | 28 (4.1%) | 125 (18.5%) |
| 40 to 44 Years | 26 (3.8%) | 0 (0.0%) |
| 45 to 49 Years | 0 (0.0%) | 59 (8.7%) |
| 50 to 54 Years | 38 (5.5%) | 64 (9.5%) |
| 55 to 59 Years | 55 (8.0%) | 0 (0.0%) |
| 60 to 64 Years | 29 (4.2%) | 0 (0.0%) |
| 65 to 69 Years | 23 (3.4%) | 43 (6.4%) |
| 70 to 74 Years | 46 (6.7%) | 41 (6.1%) |
| 75 to 79 Years | 0 (0.0%) | 6 (0.9%) |
| 80 to 84 Years | 0 (0.0%) | 0 (0.0%) |
| 85 Years and over | 11 (1.6%) | 12 (1.8%) |
| Total | 686 (100.0%) | 676 (100.0%) |
Families and Households in Paraje
Median Family Size in Paraje
The median family size in Paraje is 4.76 persons per family, with single male/father families (70 | 26.0%) accounting for the largest median family size of 5.37 persons per family. On the other hand, single female/mother families (187 | 69.5%) represent the smallest median family size with 4.54 persons per family.
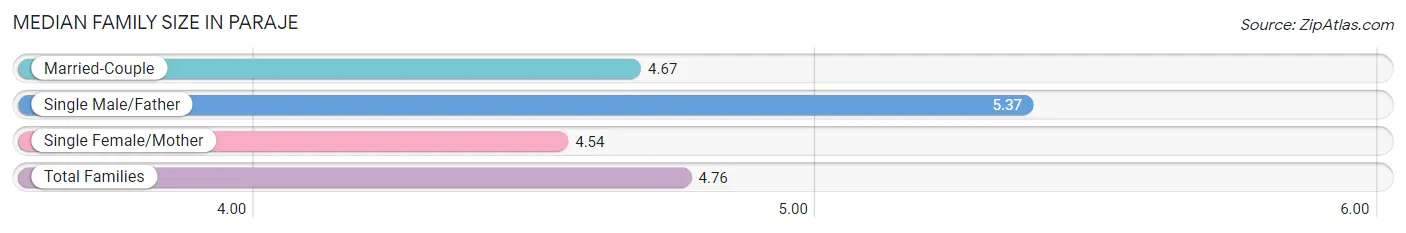
| Family Type | # Families | Family Size |
| Married-Couple | 12 (4.5%) | 4.67 |
| Single Male/Father | 70 (26.0%) | 5.37 |
| Single Female/Mother | 187 (69.5%) | 4.54 |
| Total Families | 269 (100.0%) | 4.76 |
Median Household Size in Paraje
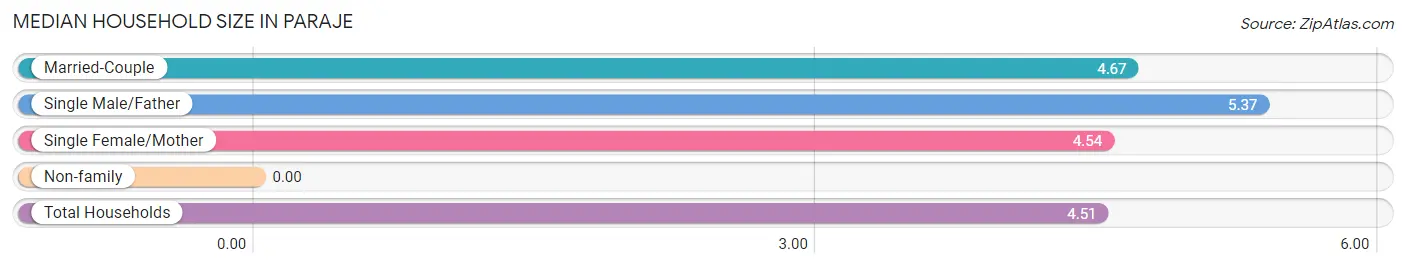
| Household Type | # Households | Household Size |
| Married-Couple | 12 (4.2%) | 4.67 |
| Single Male/Father | 70 (24.3%) | 5.37 |
| Single Female/Mother | 187 (64.9%) | 4.54 |
| Non-family | 19 (6.6%) | - |
| Total Households | 288 (100.0%) | 4.51 |
Household Size by Marriage Status in Paraje
Out of a total of 288 households in Paraje, 269 (93.4%) are family households, while 19 (6.6%) are nonfamily households. The most numerous type of family households are 2-person households, comprising 71, and the most common type of nonfamily households are 1-person households, comprising 19.
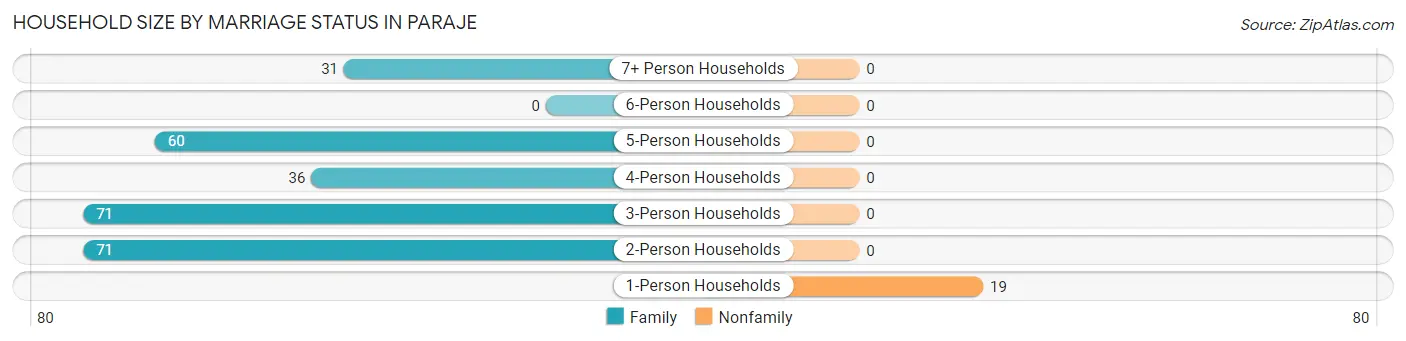
| Household Size | Family Households | Nonfamily Households |
| 1-Person Households | - | 19 (6.6%) |
| 2-Person Households | 71 (24.6%) | 0 (0.0%) |
| 3-Person Households | 71 (24.6%) | 0 (0.0%) |
| 4-Person Households | 36 (12.5%) | 0 (0.0%) |
| 5-Person Households | 60 (20.8%) | 0 (0.0%) |
| 6-Person Households | 0 (0.0%) | 0 (0.0%) |
| 7+ Person Households | 31 (10.8%) | 0 (0.0%) |
| Total | 269 (93.4%) | 19 (6.6%) |
Female Fertility in Paraje
Fertility by Age in Paraje
| Age Bracket | Women with Births | Births / 1,000 Women |
| 15 to 19 years | 0 (0.0%) | 0.0 |
| 20 to 34 years | 0 (0.0%) | 0.0 |
| 35 to 50 years | 0 (0.0%) | 0.0 |
| Total | 0 (0.0%) | 0.0 |
Fertility by Age by Marriage Status in Paraje
| Age Bracket | Married | Unmarried |
| 15 to 19 years | 0 (0.0%) | 0 (0.0%) |
| 20 to 34 years | 0 (0.0%) | 0 (0.0%) |
| 35 to 50 years | 0 (0.0%) | 0 (0.0%) |
| Total | 0 (0.0%) | 0 (0.0%) |
Fertility by Education in Paraje
| Educational Attainment | Women with Births | Births / 1,000 Women |
| Less than High School | 0 (0.0%) | 0.0 |
| High School Diploma | 0 (0.0%) | 0.0 |
| College or Associate's Degree | 0 (0.0%) | 0.0 |
| Bachelor's Degree | 0 (0.0%) | 0.0 |
| Graduate Degree | 0 (0.0%) | 0.0 |
| Total | 0 (0.0%) | 0.0 |
Fertility by Education by Marriage Status in Paraje
| Educational Attainment | Married | Unmarried |
| Less than High School | 0 (0.0%) | 0 (0.0%) |
| High School Diploma | 0 (0.0%) | 0 (0.0%) |
| College or Associate's Degree | 0 (0.0%) | 0 (0.0%) |
| Bachelor's Degree | 0 (0.0%) | 0 (0.0%) |
| Graduate Degree | 0 (0.0%) | 0 (0.0%) |
| Total | 0 (0.0%) | 0 (0.0%) |
Employment Characteristics in Paraje
Employment by Class of Employer in Paraje
Among the 456 employed individuals in Paraje, private company employees (263 | 57.7%), federal government employees (135 | 29.6%), and local government employees (33 | 7.2%) make up the most common classes of employment.
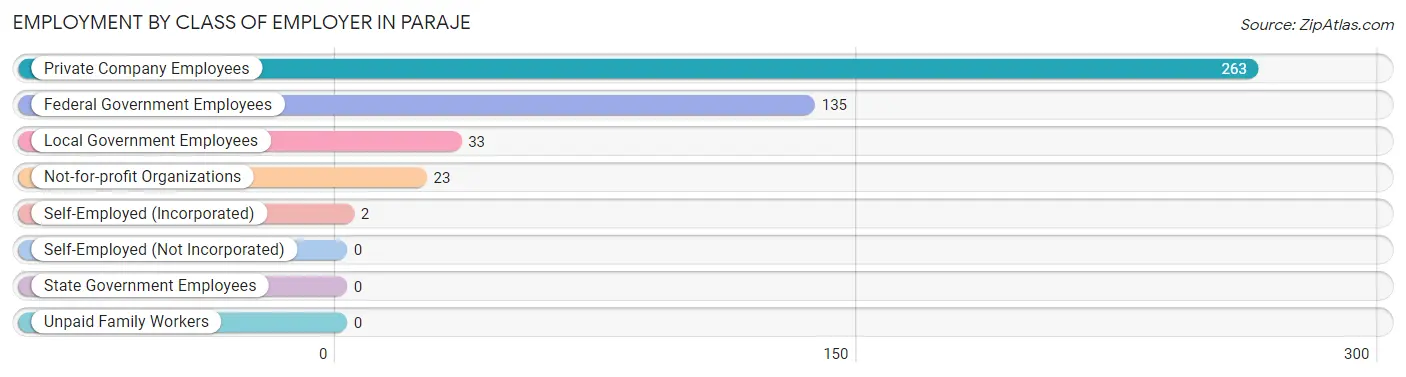
| Employer Class | # Employees | % Employees |
| Private Company Employees | 263 | 57.7% |
| Self-Employed (Incorporated) | 2 | 0.4% |
| Self-Employed (Not Incorporated) | 0 | 0.0% |
| Not-for-profit Organizations | 23 | 5.0% |
| Local Government Employees | 33 | 7.2% |
| State Government Employees | 0 | 0.0% |
| Federal Government Employees | 135 | 29.6% |
| Unpaid Family Workers | 0 | 0.0% |
| Total | 456 | 100.0% |
Employment Status by Age in Paraje
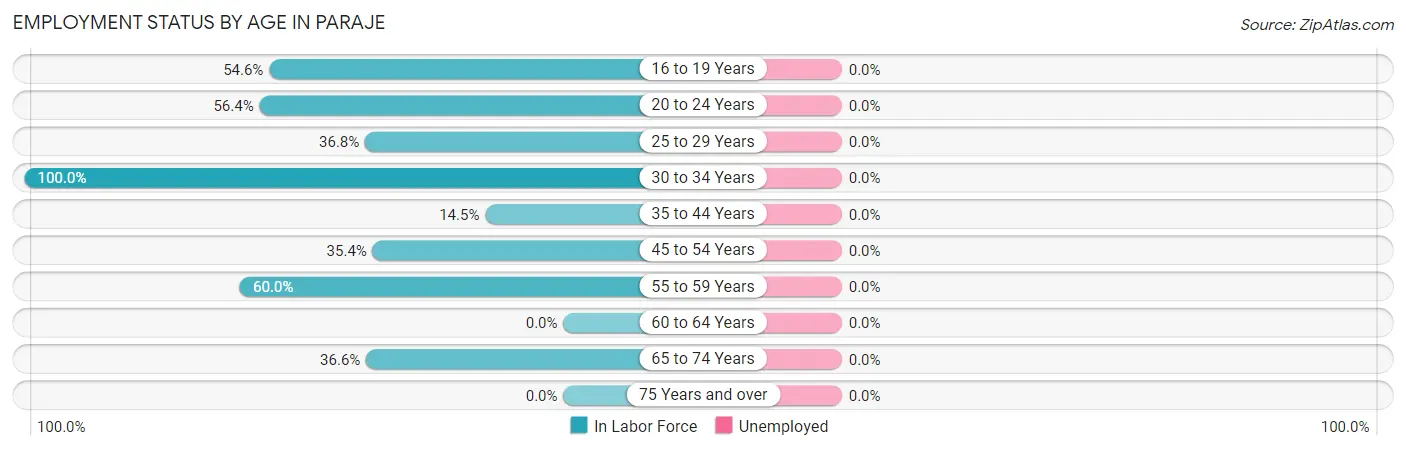
| Age Bracket | In Labor Force | Unemployed |
| 16 to 19 Years | 101 (54.6%) | 0 (0.0%) |
| 20 to 24 Years | 75 (56.4%) | 0 (0.0%) |
| 25 to 29 Years | 50 (36.8%) | 0 (0.0%) |
| 30 to 34 Years | 58 (100.0%) | 0 (0.0%) |
| 35 to 44 Years | 26 (14.5%) | 0 (0.0%) |
| 45 to 54 Years | 57 (35.4%) | 0 (0.0%) |
| 55 to 59 Years | 33 (60.0%) | 0 (0.0%) |
| 60 to 64 Years | 0 (0.0%) | 0 (0.0%) |
| 65 to 74 Years | 56 (36.6%) | 0 (0.0%) |
| 75 Years and over | 0 (0.0%) | 0 (0.0%) |
| Total | 456 (40.8%) | 0 (0.0%) |
Employment Status by Educational Attainment in Paraje
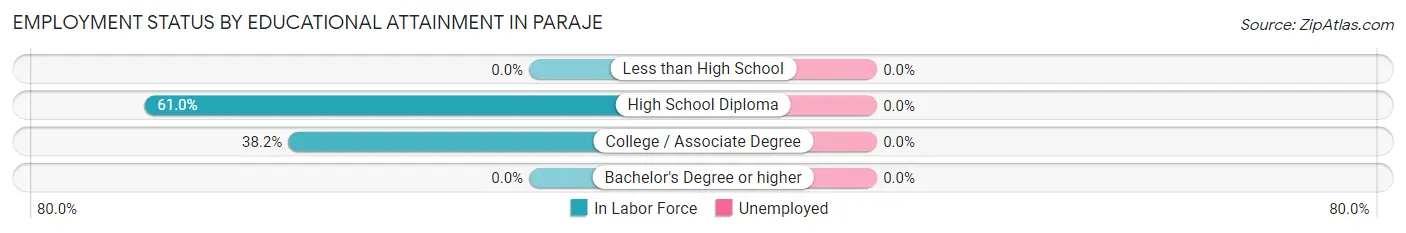
| Educational Attainment | In Labor Force | Unemployed |
| Less than High School | 0 (0.0%) | 0 (0.0%) |
| High School Diploma | 153 (61.0%) | 0 (0.0%) |
| College / Associate Degree | 71 (38.2%) | 0 (0.0%) |
| Bachelor's Degree or higher | 0 (0.0%) | 0 (0.0%) |
| Total | 224 (36.2%) | 0 (0.0%) |
Employment Occupations by Sex in Paraje
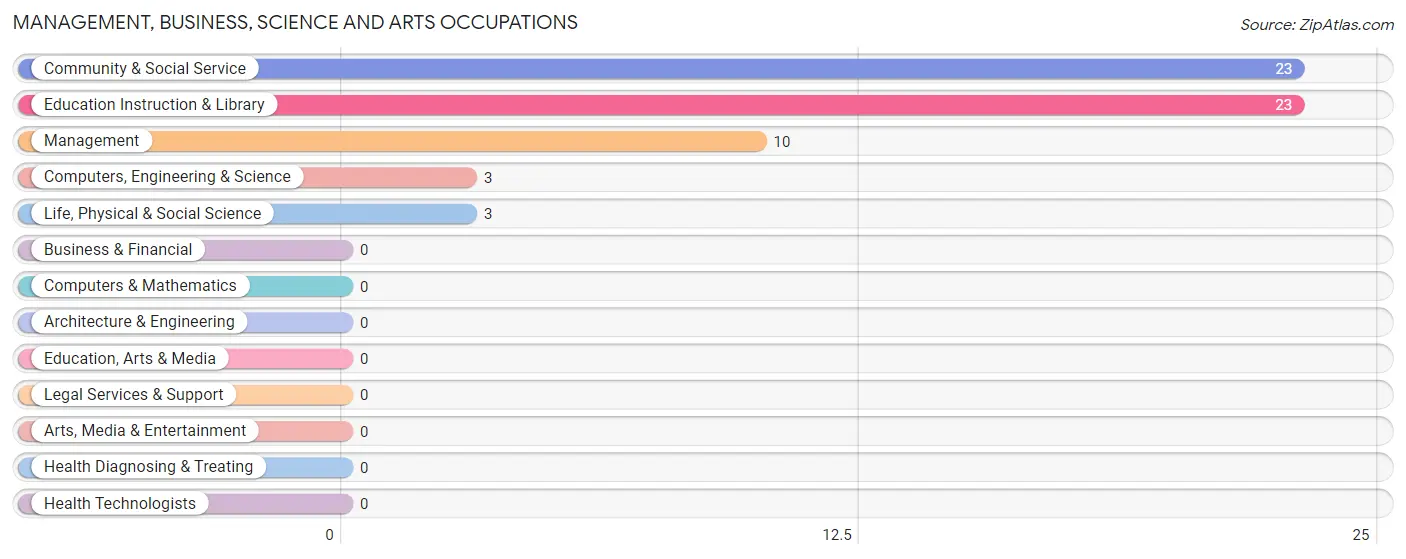
Management, Business, Science and Arts Occupations
The most common Management, Business, Science and Arts occupations in Paraje are Community & Social Service (23 | 5.0%), Education Instruction & Library (23 | 5.0%), Management (10 | 2.2%), Computers, Engineering & Science (3 | 0.7%), and Life, Physical & Social Science (3 | 0.7%).
Management, Business, Science and Arts Occupations by Sex
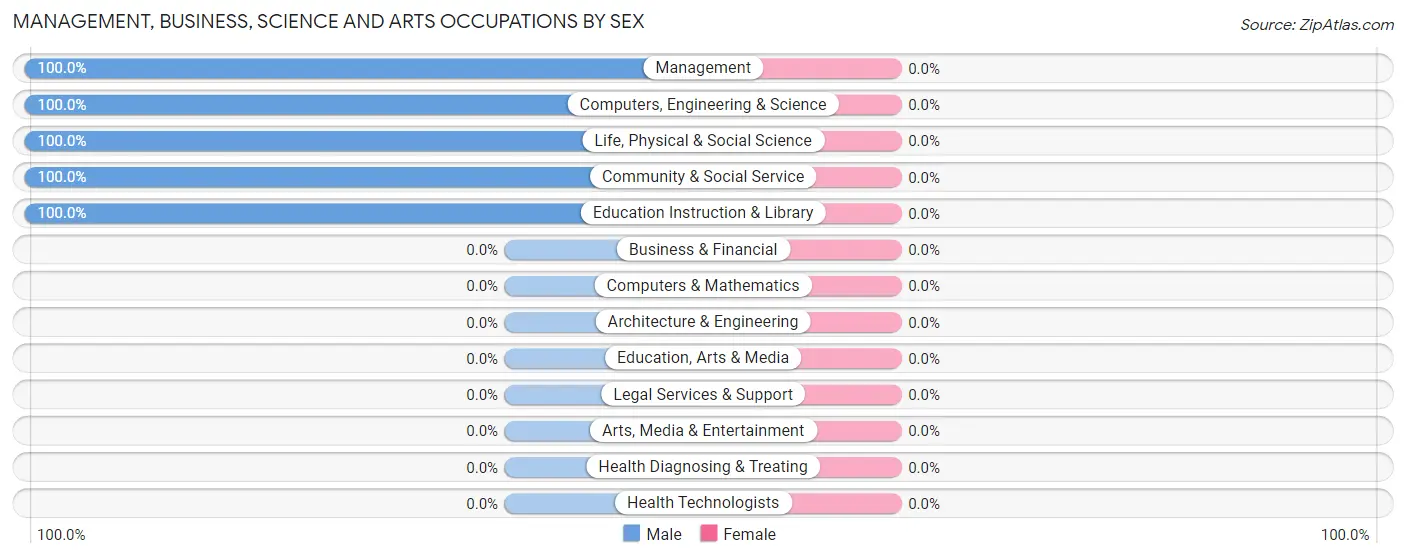
| Occupation | Male | Female |
| Management | 10 (100.0%) | 0 (0.0%) |
| Business & Financial | 0 (0.0%) | 0 (0.0%) |
| Computers, Engineering & Science | 3 (100.0%) | 0 (0.0%) |
| Computers & Mathematics | 0 (0.0%) | 0 (0.0%) |
| Architecture & Engineering | 0 (0.0%) | 0 (0.0%) |
| Life, Physical & Social Science | 3 (100.0%) | 0 (0.0%) |
| Community & Social Service | 23 (100.0%) | 0 (0.0%) |
| Education, Arts & Media | 0 (0.0%) | 0 (0.0%) |
| Legal Services & Support | 0 (0.0%) | 0 (0.0%) |
| Education Instruction & Library | 23 (100.0%) | 0 (0.0%) |
| Arts, Media & Entertainment | 0 (0.0%) | 0 (0.0%) |
| Health Diagnosing & Treating | 0 (0.0%) | 0 (0.0%) |
| Health Technologists | 0 (0.0%) | 0 (0.0%) |
| Total (Category) | 36 (100.0%) | 0 (0.0%) |
| Total (Overall) | 283 (62.1%) | 173 (37.9%) |
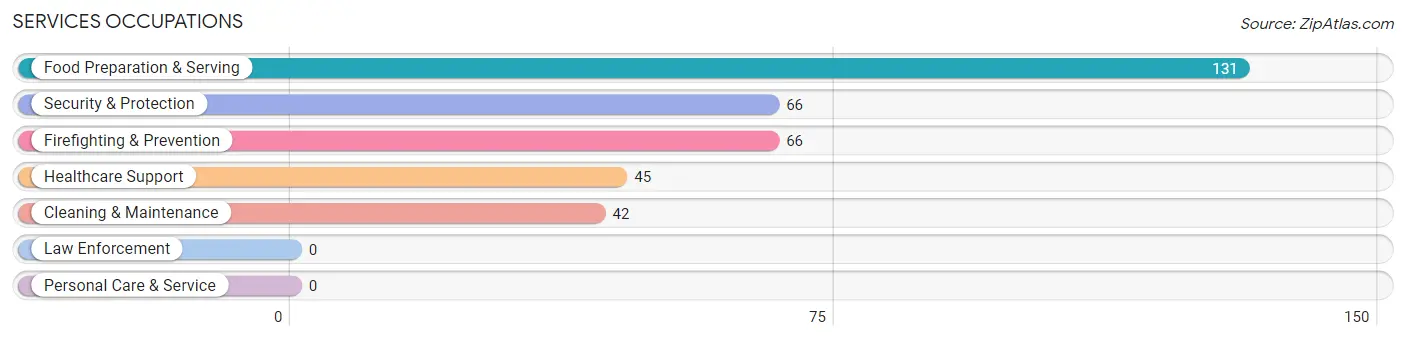
Services Occupations
The most common Services occupations in Paraje are Food Preparation & Serving (131 | 28.7%), Security & Protection (66 | 14.5%), Firefighting & Prevention (66 | 14.5%), Healthcare Support (45 | 9.9%), and Cleaning & Maintenance (42 | 9.2%).
Services Occupations by Sex
Within the Services occupations in Paraje, the most male-oriented occupations are Security & Protection (100.0%), Firefighting & Prevention (100.0%), and Cleaning & Maintenance (100.0%), while the most female-oriented occupations are Food Preparation & Serving (61.8%), and Healthcare Support (26.7%).
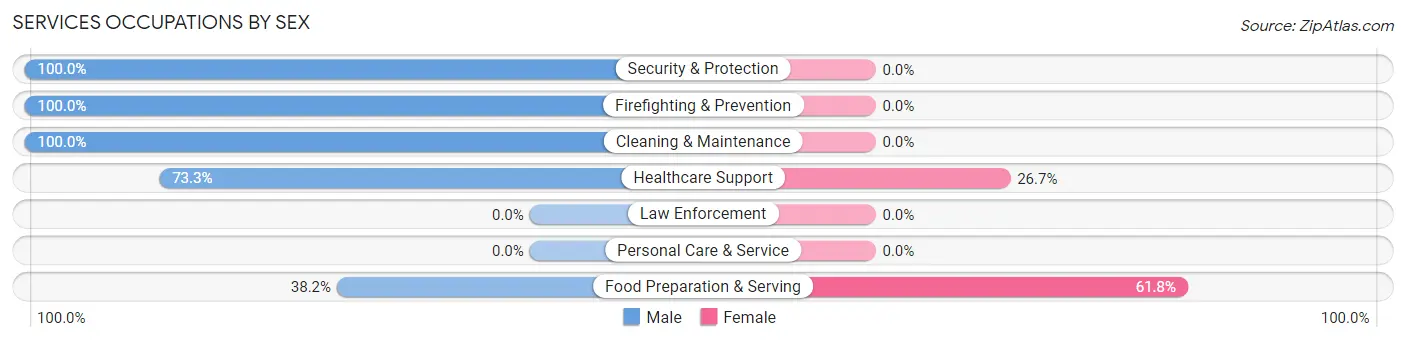
| Occupation | Male | Female |
| Healthcare Support | 33 (73.3%) | 12 (26.7%) |
| Security & Protection | 66 (100.0%) | 0 (0.0%) |
| Firefighting & Prevention | 66 (100.0%) | 0 (0.0%) |
| Law Enforcement | 0 (0.0%) | 0 (0.0%) |
| Food Preparation & Serving | 50 (38.2%) | 81 (61.8%) |
| Cleaning & Maintenance | 42 (100.0%) | 0 (0.0%) |
| Personal Care & Service | 0 (0.0%) | 0 (0.0%) |
| Total (Category) | 191 (67.2%) | 93 (32.8%) |
| Total (Overall) | 283 (62.1%) | 173 (37.9%) |
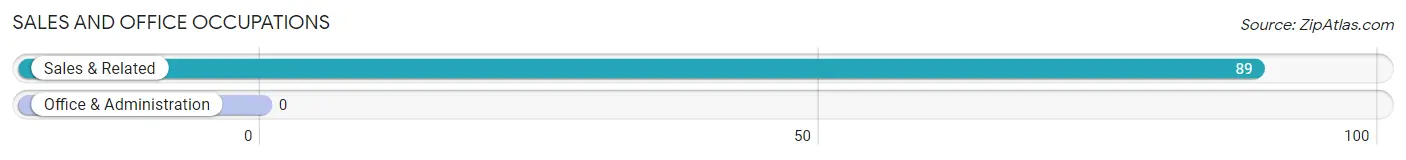
Sales and Office Occupations
The most common Sales and Office occupations in Paraje are , and Sales & Related (89 | 19.5%).
Sales and Office Occupations by Sex
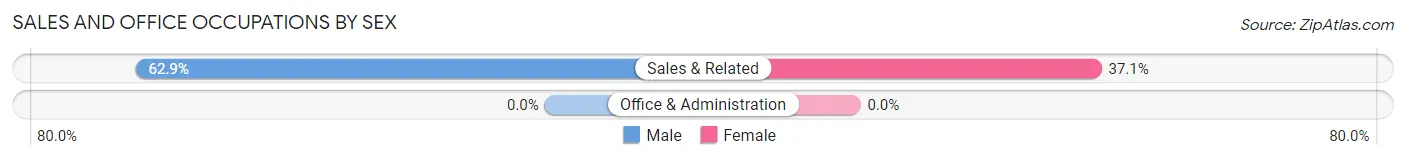
| Occupation | Male | Female |
| Sales & Related | 56 (62.9%) | 33 (37.1%) |
| Office & Administration | 0 (0.0%) | 0 (0.0%) |
| Total (Category) | 56 (62.9%) | 33 (37.1%) |
| Total (Overall) | 283 (62.1%) | 173 (37.9%) |
Natural Resources, Construction and Maintenance Occupations
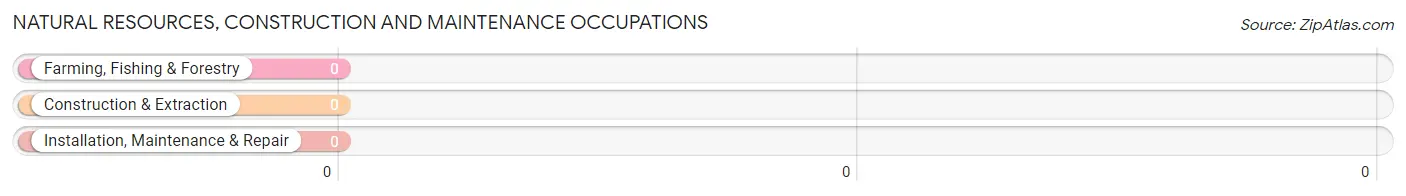
Natural Resources, Construction and Maintenance Occupations by Sex
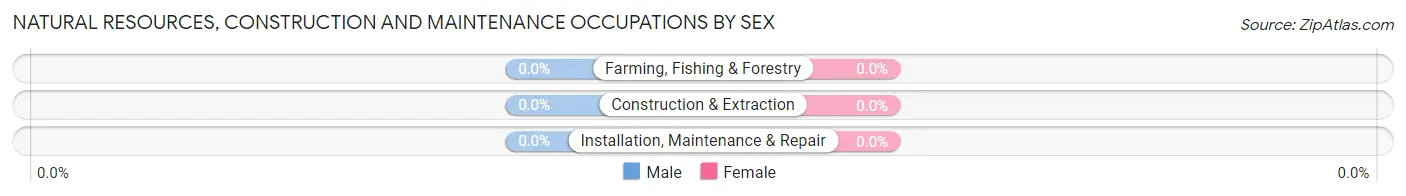
| Occupation | Male | Female |
| Farming, Fishing & Forestry | 0 (0.0%) | 0 (0.0%) |
| Construction & Extraction | 0 (0.0%) | 0 (0.0%) |
| Installation, Maintenance & Repair | 0 (0.0%) | 0 (0.0%) |
| Total (Category) | 0 (0.0%) | 0 (0.0%) |
| Total (Overall) | 283 (62.1%) | 173 (37.9%) |
Production, Transportation and Moving Occupations
The most common Production, Transportation and Moving occupations in Paraje are Transportation (26 | 5.7%), and Production (21 | 4.6%).
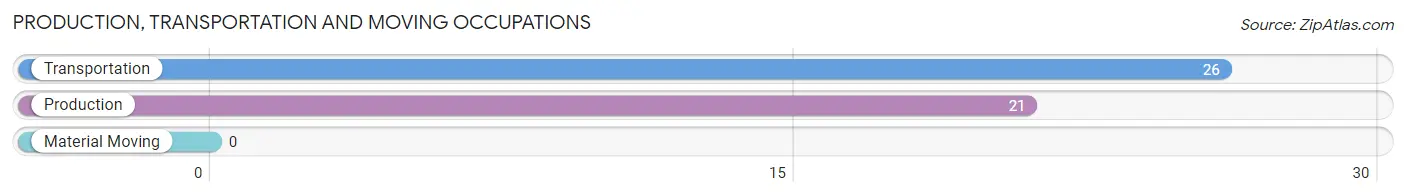
Production, Transportation and Moving Occupations by Sex
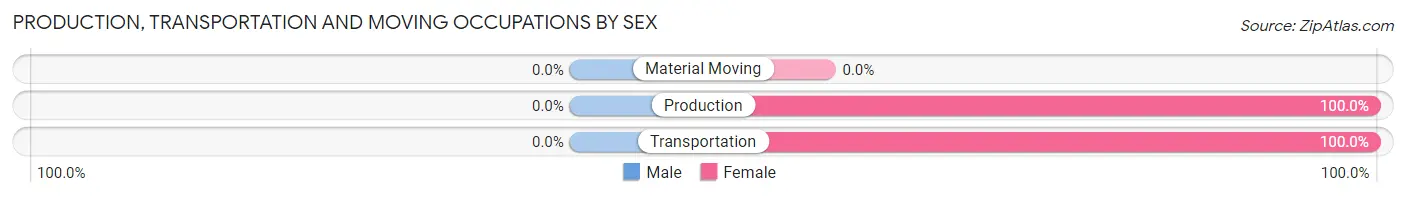
| Occupation | Male | Female |
| Production | 0 (0.0%) | 21 (100.0%) |
| Transportation | 0 (0.0%) | 26 (100.0%) |
| Material Moving | 0 (0.0%) | 0 (0.0%) |
| Total (Category) | 0 (0.0%) | 47 (100.0%) |
| Total (Overall) | 283 (62.1%) | 173 (37.9%) |
Employment Industries by Sex in Paraje
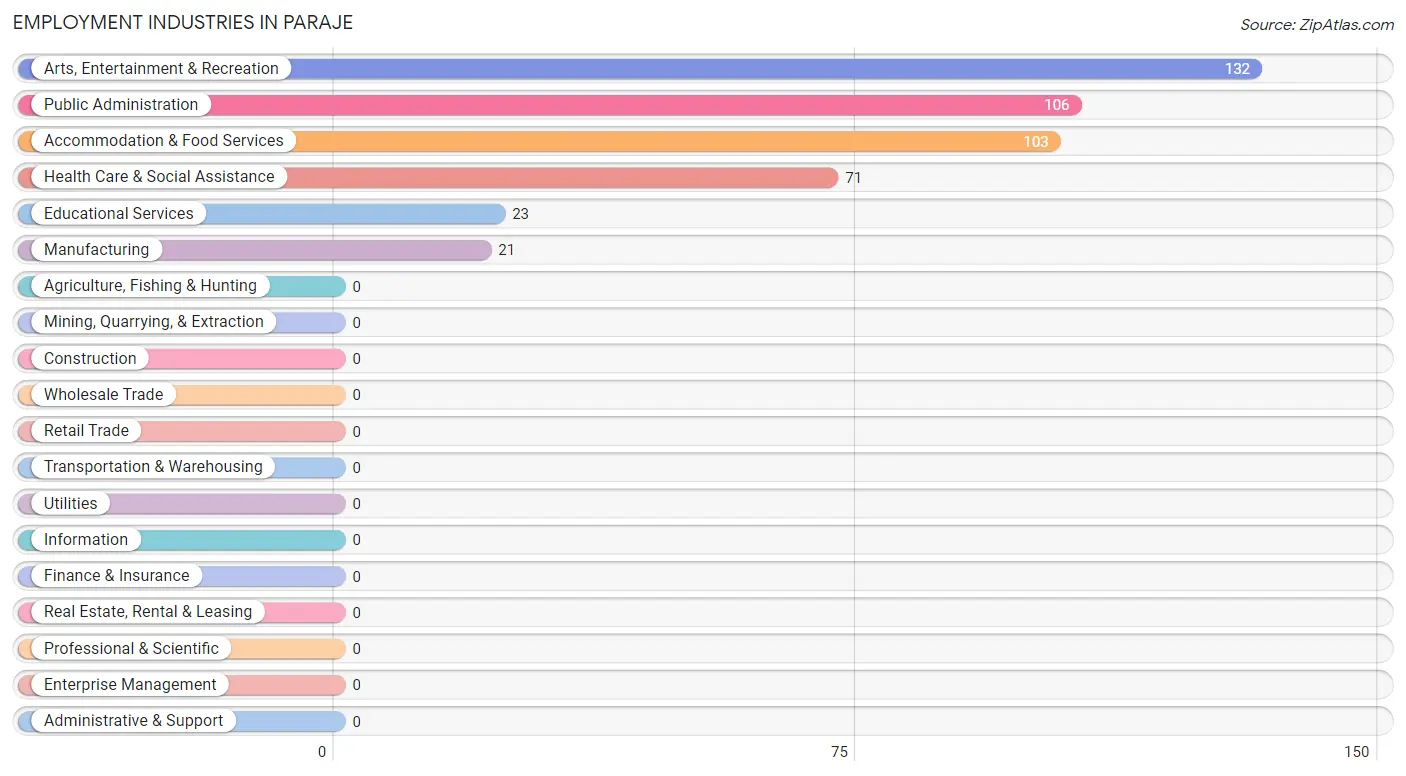
Employment Industries in Paraje
The major employment industries in Paraje include Arts, Entertainment & Recreation (132 | 28.9%), Public Administration (106 | 23.3%), Accommodation & Food Services (103 | 22.6%), Health Care & Social Assistance (71 | 15.6%), and Educational Services (23 | 5.0%).
Employment Industries by Sex in Paraje
The Paraje industries that see more men than women are Educational Services (100.0%), Arts, Entertainment & Recreation (100.0%), and Accommodation & Food Services (51.5%), whereas the industries that tend to have a higher number of women are Manufacturing (100.0%), Public Administration (60.4%), and Health Care & Social Assistance (53.5%).
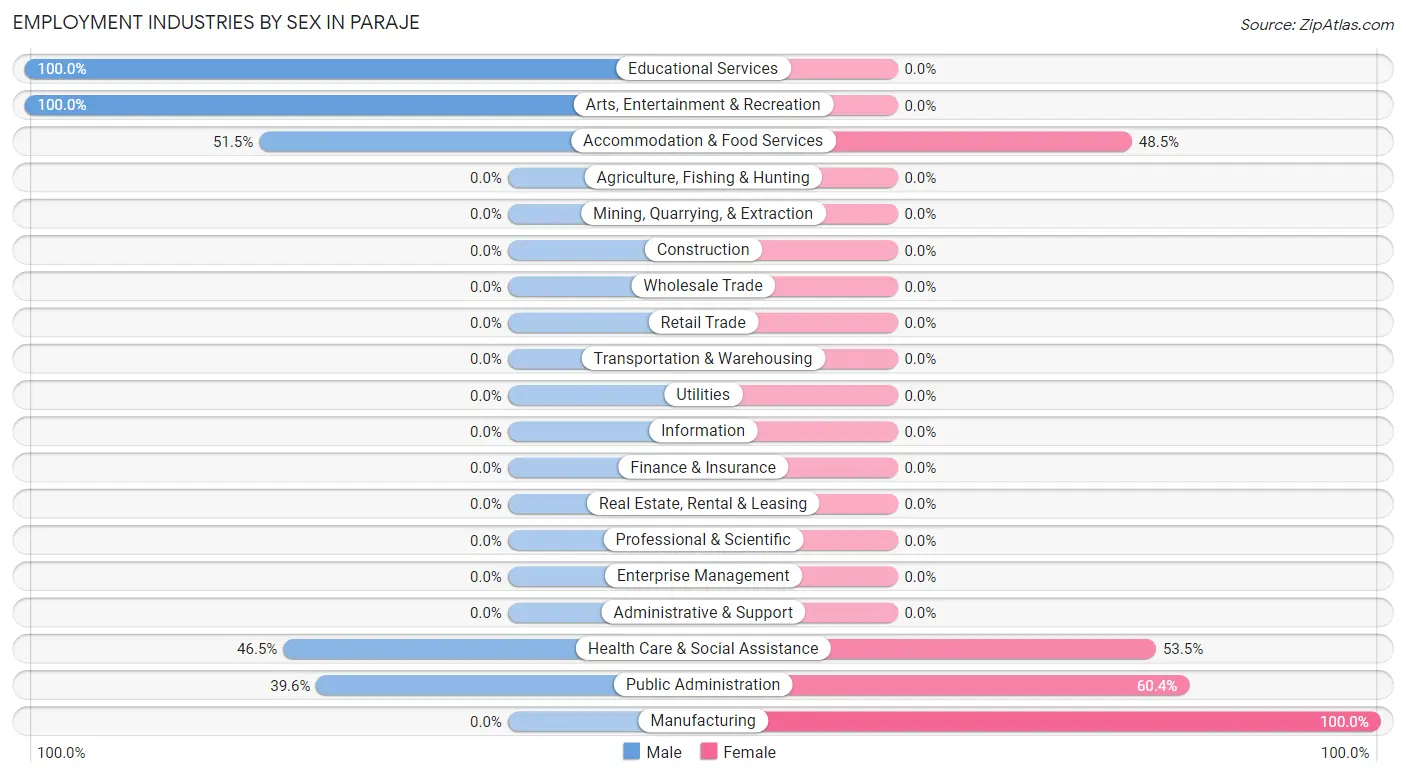
| Industry | Male | Female |
| Agriculture, Fishing & Hunting | 0 (0.0%) | 0 (0.0%) |
| Mining, Quarrying, & Extraction | 0 (0.0%) | 0 (0.0%) |
| Construction | 0 (0.0%) | 0 (0.0%) |
| Manufacturing | 0 (0.0%) | 21 (100.0%) |
| Wholesale Trade | 0 (0.0%) | 0 (0.0%) |
| Retail Trade | 0 (0.0%) | 0 (0.0%) |
| Transportation & Warehousing | 0 (0.0%) | 0 (0.0%) |
| Utilities | 0 (0.0%) | 0 (0.0%) |
| Information | 0 (0.0%) | 0 (0.0%) |
| Finance & Insurance | 0 (0.0%) | 0 (0.0%) |
| Real Estate, Rental & Leasing | 0 (0.0%) | 0 (0.0%) |
| Professional & Scientific | 0 (0.0%) | 0 (0.0%) |
| Enterprise Management | 0 (0.0%) | 0 (0.0%) |
| Administrative & Support | 0 (0.0%) | 0 (0.0%) |
| Educational Services | 23 (100.0%) | 0 (0.0%) |
| Health Care & Social Assistance | 33 (46.5%) | 38 (53.5%) |
| Arts, Entertainment & Recreation | 132 (100.0%) | 0 (0.0%) |
| Accommodation & Food Services | 53 (51.5%) | 50 (48.5%) |
| Public Administration | 42 (39.6%) | 64 (60.4%) |
| Total | 283 (62.1%) | 173 (37.9%) |
Education in Paraje
School Enrollment in Paraje
The most common levels of schooling among the 390 students in Paraje are high school (118 | 30.3%), college / undergraduate (89 | 22.8%), and elementary school (78 | 20.0%).
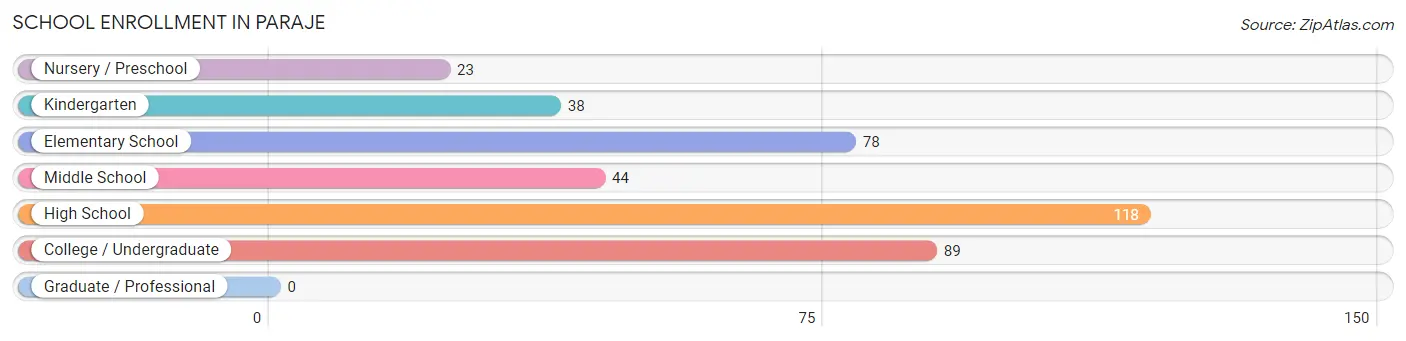
| School Level | # Students | % Students |
| Nursery / Preschool | 23 | 5.9% |
| Kindergarten | 38 | 9.7% |
| Elementary School | 78 | 20.0% |
| Middle School | 44 | 11.3% |
| High School | 118 | 30.3% |
| College / Undergraduate | 89 | 22.8% |
| Graduate / Professional | 0 | 0.0% |
| Total | 390 | 100.0% |
School Enrollment by Age by Funding Source in Paraje
Out of a total of 390 students who are enrolled in schools in Paraje, 3 (0.8%) attend a private institution, while the remaining 387 (99.2%) are enrolled in public schools. The age group of 18 to 19 year olds has the highest likelihood of being enrolled in private schools, with 3 (3.6% in the age bracket) enrolled. Conversely, the age group of 5 to 9 year old has the lowest likelihood of being enrolled in a private school, with 139 (100.0% in the age bracket) attending a public institution.
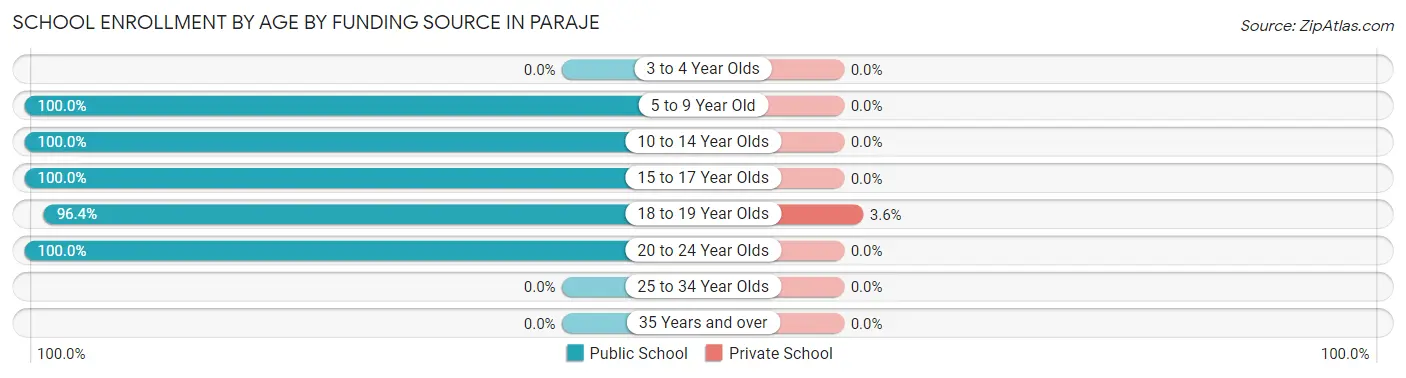
| Age Bracket | Public School | Private School |
| 3 to 4 Year Olds | 0 (0.0%) | 0 (0.0%) |
| 5 to 9 Year Old | 139 (100.0%) | 0 (0.0%) |
| 10 to 14 Year Olds | 44 (100.0%) | 0 (0.0%) |
| 15 to 17 Year Olds | 65 (100.0%) | 0 (0.0%) |
| 18 to 19 Year Olds | 81 (96.4%) | 3 (3.6%) |
| 20 to 24 Year Olds | 58 (100.0%) | 0 (0.0%) |
| 25 to 34 Year Olds | 0 (0.0%) | 0 (0.0%) |
| 35 Years and over | 0 (0.0%) | 0 (0.0%) |
| Total | 387 (99.2%) | 3 (0.8%) |
Educational Attainment by Field of Study in Paraje
Arts & humanities (59 | 46.5%), business (44 | 34.6%), and education (24 | 18.9%) are the most common fields of study among 127 individuals in Paraje who have obtained a bachelor's degree or higher.
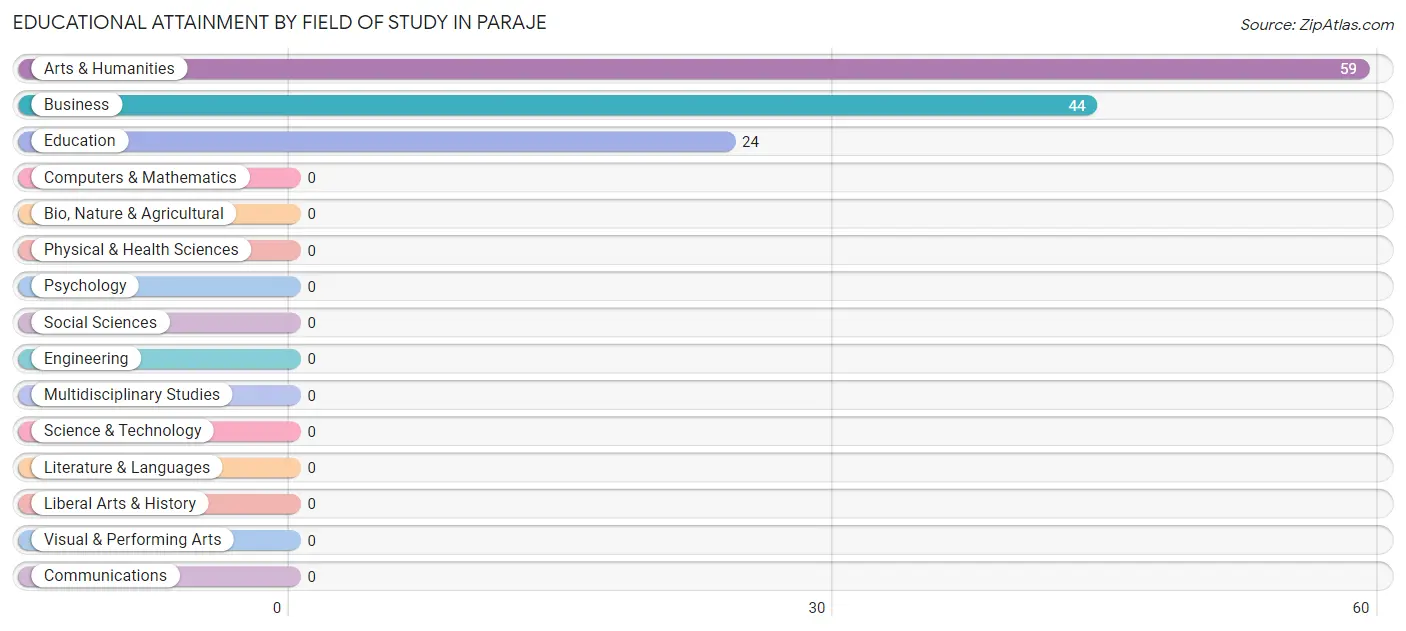
| Field of Study | # Graduates | % Graduates |
| Computers & Mathematics | 0 | 0.0% |
| Bio, Nature & Agricultural | 0 | 0.0% |
| Physical & Health Sciences | 0 | 0.0% |
| Psychology | 0 | 0.0% |
| Social Sciences | 0 | 0.0% |
| Engineering | 0 | 0.0% |
| Multidisciplinary Studies | 0 | 0.0% |
| Science & Technology | 0 | 0.0% |
| Business | 44 | 34.6% |
| Education | 24 | 18.9% |
| Literature & Languages | 0 | 0.0% |
| Liberal Arts & History | 0 | 0.0% |
| Visual & Performing Arts | 0 | 0.0% |
| Communications | 0 | 0.0% |
| Arts & Humanities | 59 | 46.5% |
| Total | 127 | 100.0% |
Transportation & Commute in Paraje
Vehicle Availability by Sex in Paraje
The most prevalent vehicle ownership categories in Paraje are males with 2 vehicles (229, accounting for 82.4%) and females with 2 vehicles (126, making up 132.4%).
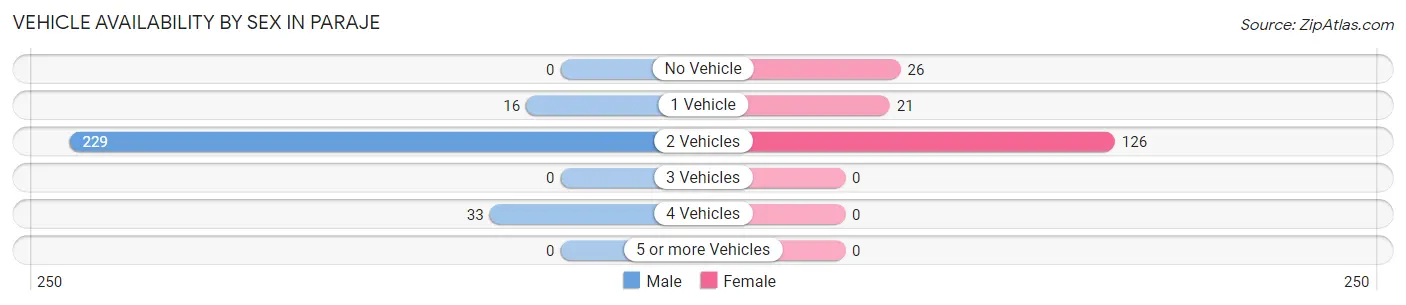
| Vehicles Available | Male | Female |
| No Vehicle | 0 (0.0%) | 26 (15.0%) |
| 1 Vehicle | 16 (5.8%) | 21 (12.1%) |
| 2 Vehicles | 229 (82.4%) | 126 (72.8%) |
| 3 Vehicles | 0 (0.0%) | 0 (0.0%) |
| 4 Vehicles | 33 (11.9%) | 0 (0.0%) |
| 5 or more Vehicles | 0 (0.0%) | 0 (0.0%) |
| Total | 278 (100.0%) | 173 (100.0%) |
Commute Time in Paraje
The most frequently occuring commute durations in Paraje are 10 to 14 minutes (204 commuters, 48.6%), 40 to 44 minutes (82 commuters, 19.5%), and 5 to 9 minutes (71 commuters, 16.9%).
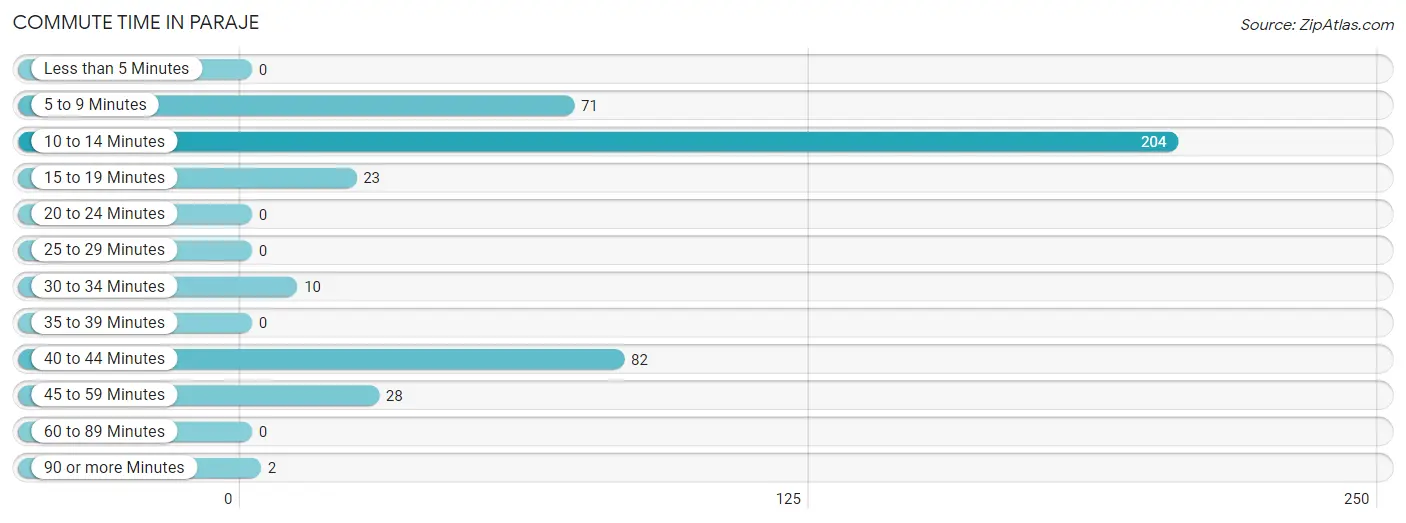
| Commute Time | # Commuters | % Commuters |
| Less than 5 Minutes | 0 | 0.0% |
| 5 to 9 Minutes | 71 | 16.9% |
| 10 to 14 Minutes | 204 | 48.6% |
| 15 to 19 Minutes | 23 | 5.5% |
| 20 to 24 Minutes | 0 | 0.0% |
| 25 to 29 Minutes | 0 | 0.0% |
| 30 to 34 Minutes | 10 | 2.4% |
| 35 to 39 Minutes | 0 | 0.0% |
| 40 to 44 Minutes | 82 | 19.5% |
| 45 to 59 Minutes | 28 | 6.7% |
| 60 to 89 Minutes | 0 | 0.0% |
| 90 or more Minutes | 2 | 0.5% |
Commute Time by Sex in Paraje
The most common commute times in Paraje are 10 to 14 minutes (140 commuters, 56.7%) for males and 5 to 9 minutes (71 commuters, 41.0%) for females.
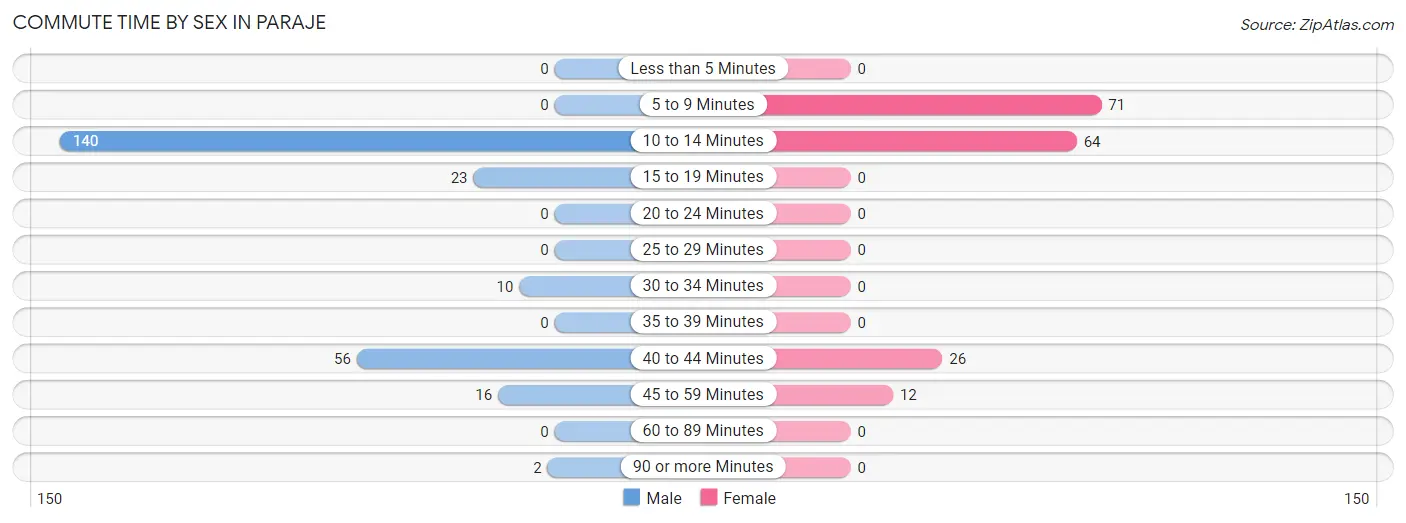
| Commute Time | Male | Female |
| Less than 5 Minutes | 0 (0.0%) | 0 (0.0%) |
| 5 to 9 Minutes | 0 (0.0%) | 71 (41.0%) |
| 10 to 14 Minutes | 140 (56.7%) | 64 (37.0%) |
| 15 to 19 Minutes | 23 (9.3%) | 0 (0.0%) |
| 20 to 24 Minutes | 0 (0.0%) | 0 (0.0%) |
| 25 to 29 Minutes | 0 (0.0%) | 0 (0.0%) |
| 30 to 34 Minutes | 10 (4.1%) | 0 (0.0%) |
| 35 to 39 Minutes | 0 (0.0%) | 0 (0.0%) |
| 40 to 44 Minutes | 56 (22.7%) | 26 (15.0%) |
| 45 to 59 Minutes | 16 (6.5%) | 12 (6.9%) |
| 60 to 89 Minutes | 0 (0.0%) | 0 (0.0%) |
| 90 or more Minutes | 2 (0.8%) | 0 (0.0%) |
Time of Departure to Work by Sex in Paraje
The most frequent times of departure to work in Paraje are 4:00 PM to 11:59 PM (170, 68.8%) for males and 4:00 PM to 11:59 PM (50, 28.9%) for females.
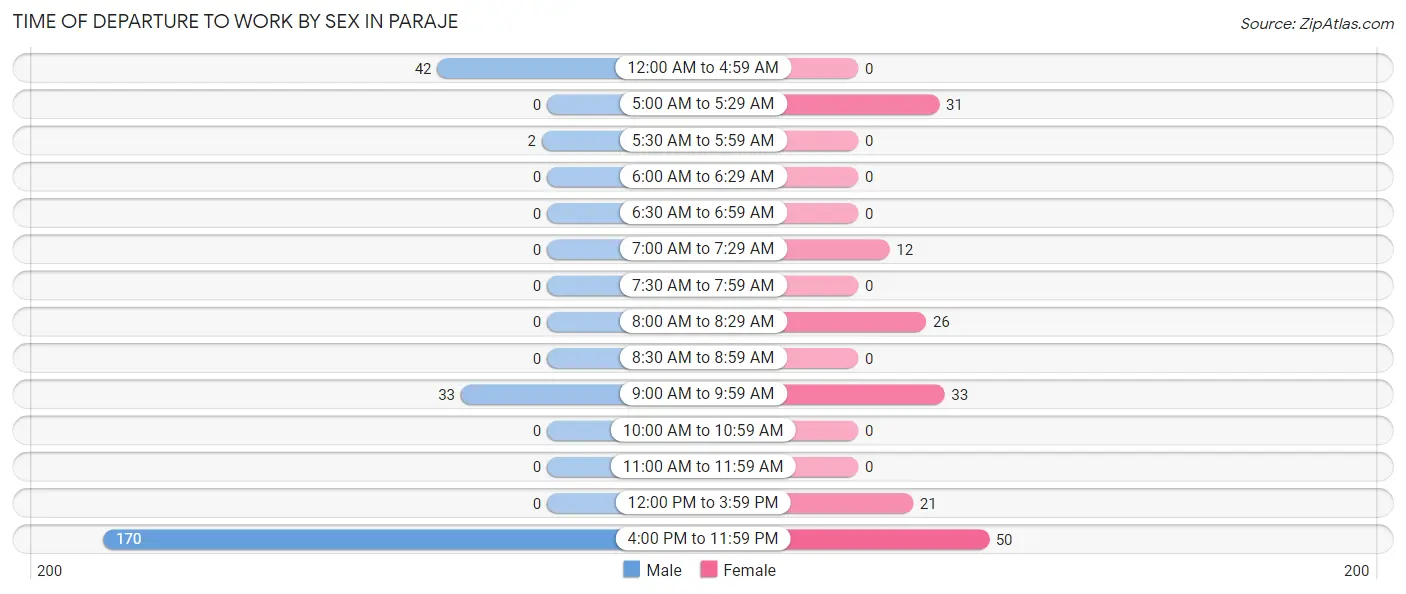
| Time of Departure | Male | Female |
| 12:00 AM to 4:59 AM | 42 (17.0%) | 0 (0.0%) |
| 5:00 AM to 5:29 AM | 0 (0.0%) | 31 (17.9%) |
| 5:30 AM to 5:59 AM | 2 (0.8%) | 0 (0.0%) |
| 6:00 AM to 6:29 AM | 0 (0.0%) | 0 (0.0%) |
| 6:30 AM to 6:59 AM | 0 (0.0%) | 0 (0.0%) |
| 7:00 AM to 7:29 AM | 0 (0.0%) | 12 (6.9%) |
| 7:30 AM to 7:59 AM | 0 (0.0%) | 0 (0.0%) |
| 8:00 AM to 8:29 AM | 0 (0.0%) | 26 (15.0%) |
| 8:30 AM to 8:59 AM | 0 (0.0%) | 0 (0.0%) |
| 9:00 AM to 9:59 AM | 33 (13.4%) | 33 (19.1%) |
| 10:00 AM to 10:59 AM | 0 (0.0%) | 0 (0.0%) |
| 11:00 AM to 11:59 AM | 0 (0.0%) | 0 (0.0%) |
| 12:00 PM to 3:59 PM | 0 (0.0%) | 21 (12.1%) |
| 4:00 PM to 11:59 PM | 170 (68.8%) | 50 (28.9%) |
| Total | 247 (100.0%) | 173 (100.0%) |
Housing Occupancy in Paraje
Occupancy by Ownership in Paraje
Of the total 288 dwellings in Paraje, owner-occupied units account for 150 (52.1%), while renter-occupied units make up 138 (47.9%).
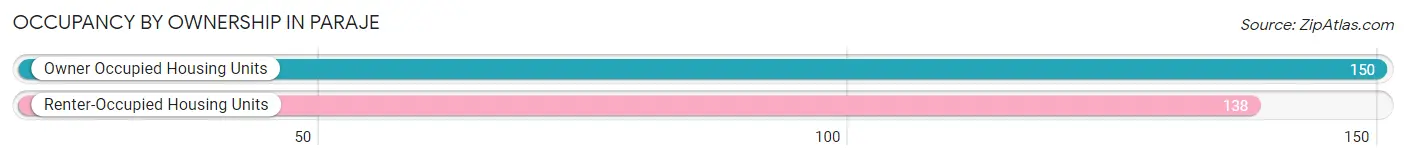
| Occupancy | # Housing Units | % Housing Units |
| Owner Occupied Housing Units | 150 | 52.1% |
| Renter-Occupied Housing Units | 138 | 47.9% |
| Total Occupied Housing Units | 288 | 100.0% |
Occupancy by Household Size in Paraje
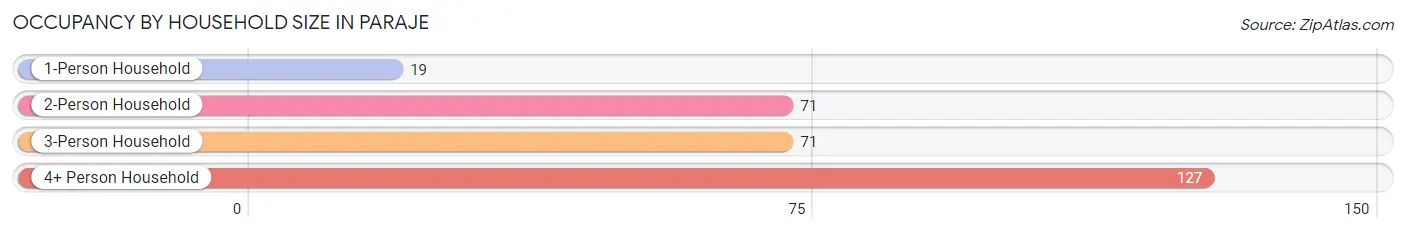
| Household Size | # Housing Units | % Housing Units |
| 1-Person Household | 19 | 6.6% |
| 2-Person Household | 71 | 24.6% |
| 3-Person Household | 71 | 24.6% |
| 4+ Person Household | 127 | 44.1% |
| Total Housing Units | 288 | 100.0% |
Occupancy by Ownership by Household Size in Paraje
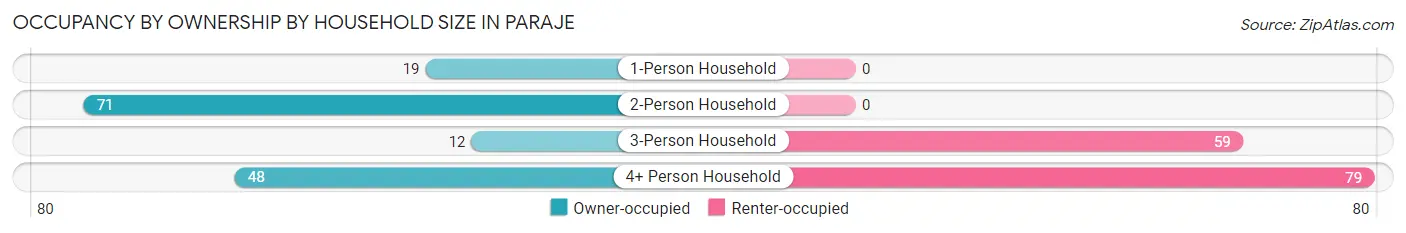
| Household Size | Owner-occupied | Renter-occupied |
| 1-Person Household | 19 (100.0%) | 0 (0.0%) |
| 2-Person Household | 71 (100.0%) | 0 (0.0%) |
| 3-Person Household | 12 (16.9%) | 59 (83.1%) |
| 4+ Person Household | 48 (37.8%) | 79 (62.2%) |
| Total Housing Units | 150 (52.1%) | 138 (47.9%) |
Occupancy by Educational Attainment in Paraje
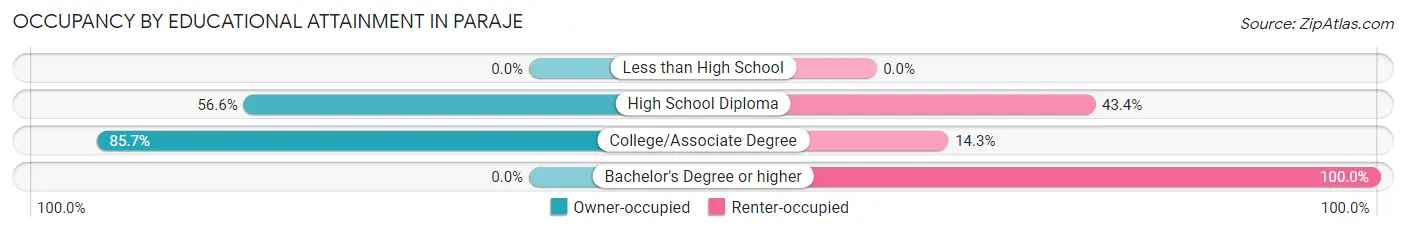
| Household Size | Owner-occupied | Renter-occupied |
| Less than High School | 0 (0.0%) | 0 (0.0%) |
| High School Diploma | 90 (56.6%) | 69 (43.4%) |
| College/Associate Degree | 60 (85.7%) | 10 (14.3%) |
| Bachelor's Degree or higher | 0 (0.0%) | 59 (100.0%) |
Occupancy by Age of Householder in Paraje
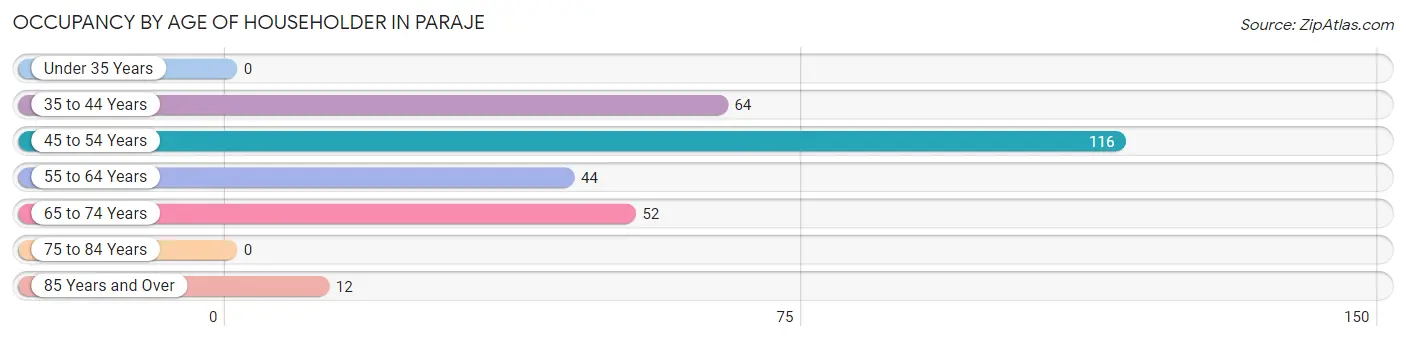
| Age Bracket | # Households | % Households |
| Under 35 Years | 0 | 0.0% |
| 35 to 44 Years | 64 | 22.2% |
| 45 to 54 Years | 116 | 40.3% |
| 55 to 64 Years | 44 | 15.3% |
| 65 to 74 Years | 52 | 18.1% |
| 75 to 84 Years | 0 | 0.0% |
| 85 Years and Over | 12 | 4.2% |
| Total | 288 | 100.0% |
Housing Finances in Paraje
Median Income by Occupancy in Paraje
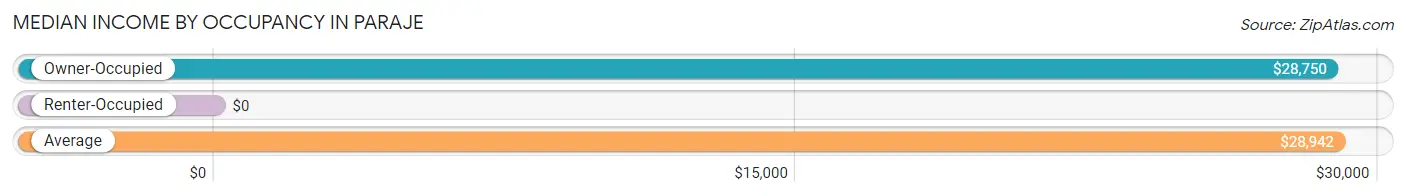
| Occupancy Type | # Households | Median Income |
| Owner-Occupied | 150 (52.1%) | $28,750 |
| Renter-Occupied | 138 (47.9%) | $0 |
| Average | 288 (100.0%) | $28,942 |
Occupancy by Householder Income Bracket in Paraje
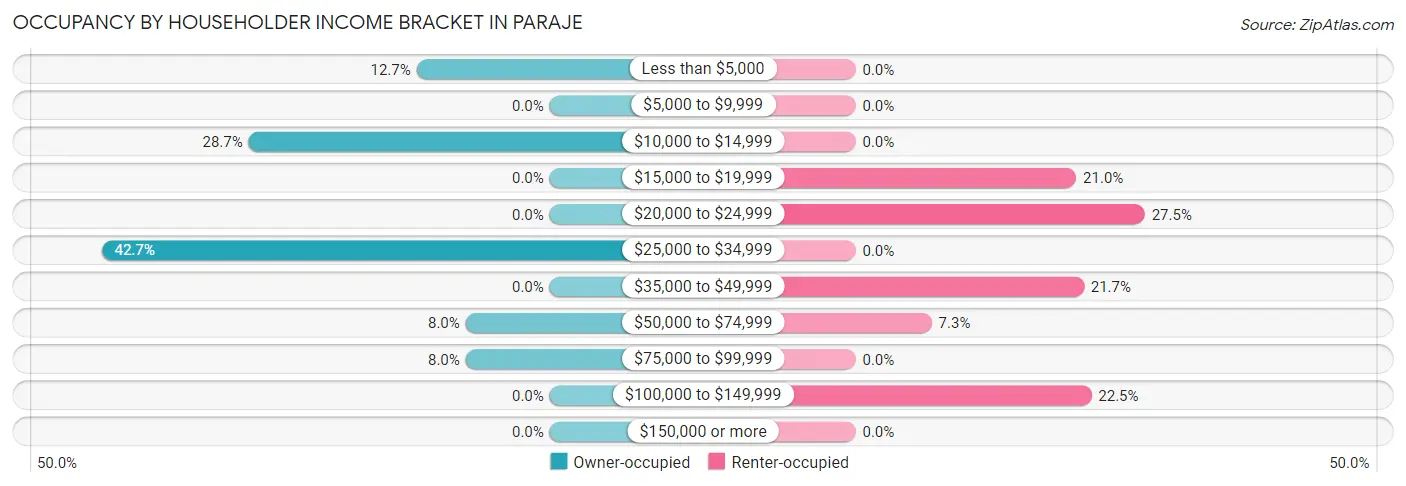
| Income Bracket | Owner-occupied | Renter-occupied |
| Less than $5,000 | 19 (12.7%) | 0 (0.0%) |
| $5,000 to $9,999 | 0 (0.0%) | 0 (0.0%) |
| $10,000 to $14,999 | 43 (28.7%) | 0 (0.0%) |
| $15,000 to $19,999 | 0 (0.0%) | 29 (21.0%) |
| $20,000 to $24,999 | 0 (0.0%) | 38 (27.5%) |
| $25,000 to $34,999 | 64 (42.7%) | 0 (0.0%) |
| $35,000 to $49,999 | 0 (0.0%) | 30 (21.7%) |
| $50,000 to $74,999 | 12 (8.0%) | 10 (7.2%) |
| $75,000 to $99,999 | 12 (8.0%) | 0 (0.0%) |
| $100,000 to $149,999 | 0 (0.0%) | 31 (22.5%) |
| $150,000 or more | 0 (0.0%) | 0 (0.0%) |
| Total | 150 (100.0%) | 138 (100.0%) |
Monthly Housing Cost Tiers in Paraje
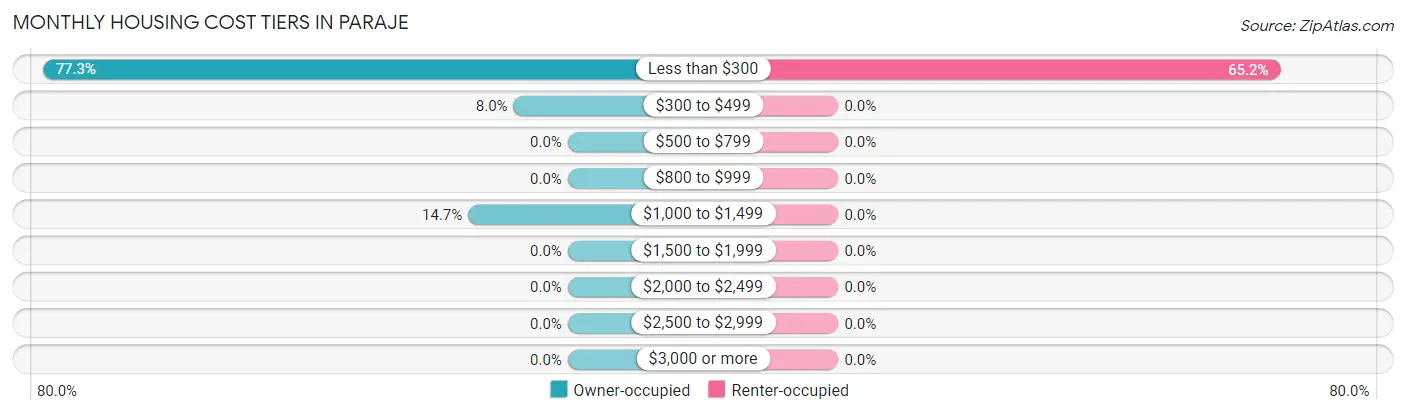
| Monthly Cost | Owner-occupied | Renter-occupied |
| Less than $300 | 116 (77.3%) | 90 (65.2%) |
| $300 to $499 | 12 (8.0%) | 0 (0.0%) |
| $500 to $799 | 0 (0.0%) | 0 (0.0%) |
| $800 to $999 | 0 (0.0%) | 0 (0.0%) |
| $1,000 to $1,499 | 22 (14.7%) | 0 (0.0%) |
| $1,500 to $1,999 | 0 (0.0%) | 0 (0.0%) |
| $2,000 to $2,499 | 0 (0.0%) | 0 (0.0%) |
| $2,500 to $2,999 | 0 (0.0%) | 0 (0.0%) |
| $3,000 or more | 0 (0.0%) | 0 (0.0%) |
| Total | 150 (100.0%) | 138 (100.0%) |
Physical Housing Characteristics in Paraje
Housing Structures in Paraje
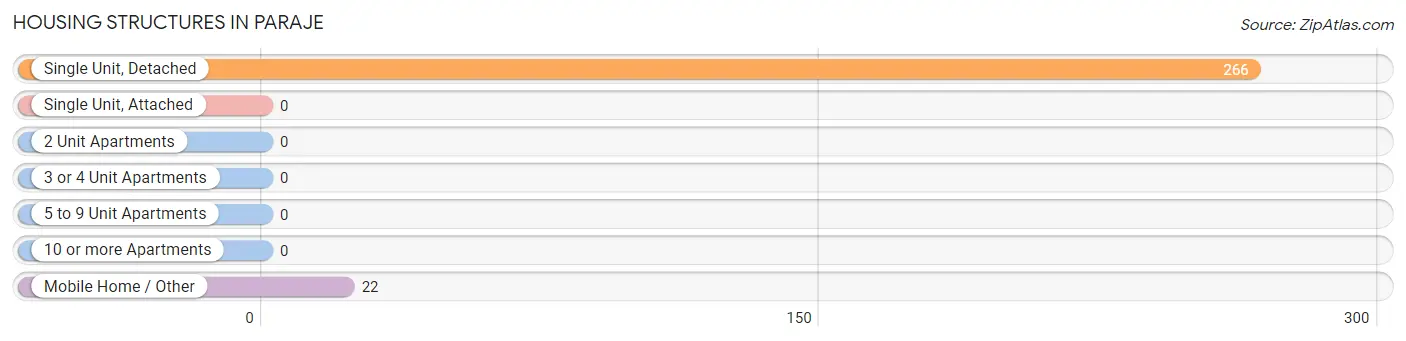
| Structure Type | # Housing Units | % Housing Units |
| Single Unit, Detached | 266 | 92.4% |
| Single Unit, Attached | 0 | 0.0% |
| 2 Unit Apartments | 0 | 0.0% |
| 3 or 4 Unit Apartments | 0 | 0.0% |
| 5 to 9 Unit Apartments | 0 | 0.0% |
| 10 or more Apartments | 0 | 0.0% |
| Mobile Home / Other | 22 | 7.6% |
| Total | 288 | 100.0% |
Housing Structures by Occupancy in Paraje
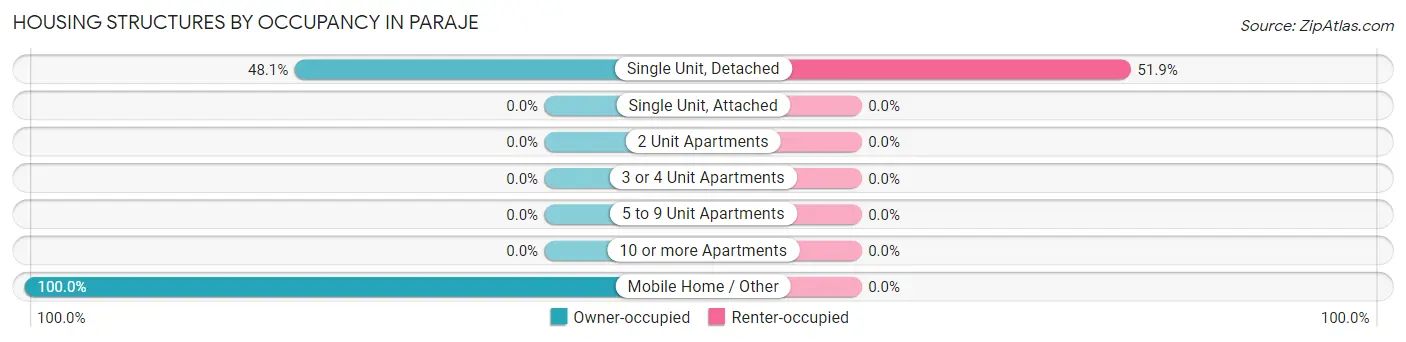
| Structure Type | Owner-occupied | Renter-occupied |
| Single Unit, Detached | 128 (48.1%) | 138 (51.9%) |
| Single Unit, Attached | 0 (0.0%) | 0 (0.0%) |
| 2 Unit Apartments | 0 (0.0%) | 0 (0.0%) |
| 3 or 4 Unit Apartments | 0 (0.0%) | 0 (0.0%) |
| 5 to 9 Unit Apartments | 0 (0.0%) | 0 (0.0%) |
| 10 or more Apartments | 0 (0.0%) | 0 (0.0%) |
| Mobile Home / Other | 22 (100.0%) | 0 (0.0%) |
| Total | 150 (52.1%) | 138 (47.9%) |
Housing Structures by Number of Rooms in Paraje
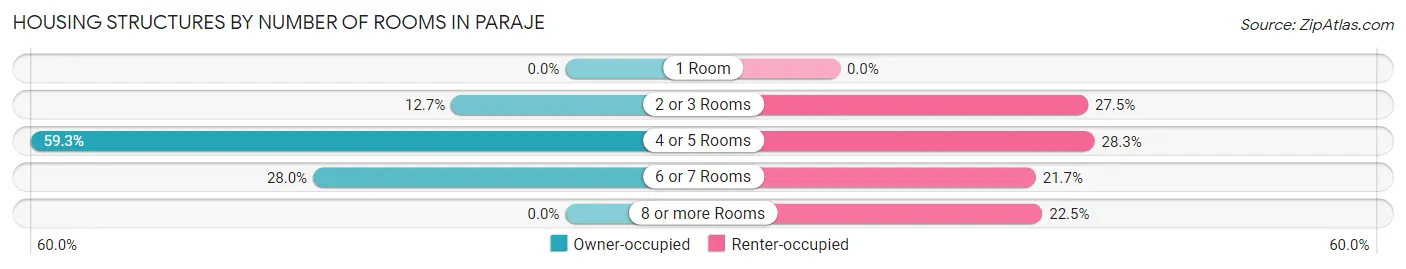
| Number of Rooms | Owner-occupied | Renter-occupied |
| 1 Room | 0 (0.0%) | 0 (0.0%) |
| 2 or 3 Rooms | 19 (12.7%) | 38 (27.5%) |
| 4 or 5 Rooms | 89 (59.3%) | 39 (28.3%) |
| 6 or 7 Rooms | 42 (28.0%) | 30 (21.7%) |
| 8 or more Rooms | 0 (0.0%) | 31 (22.5%) |
| Total | 150 (100.0%) | 138 (100.0%) |
Housing Structure by Heating Type in Paraje
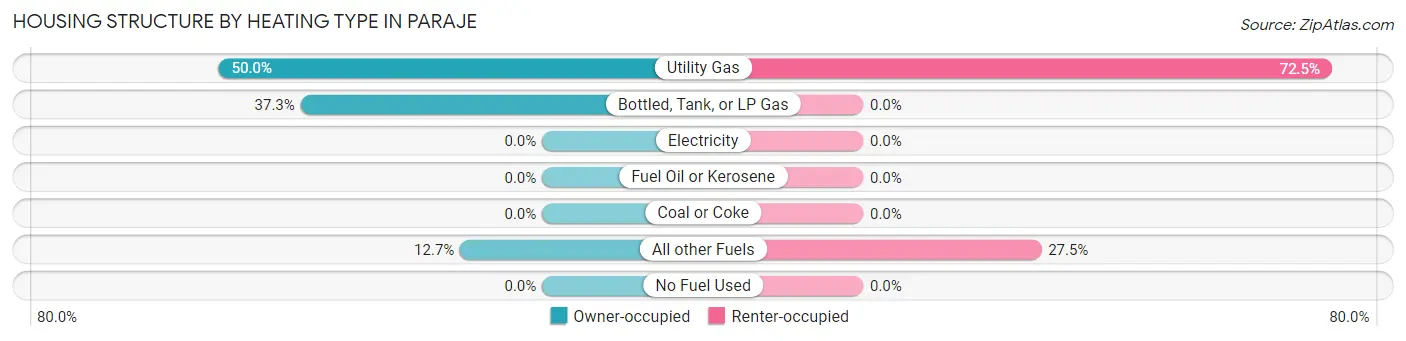
| Heating Type | Owner-occupied | Renter-occupied |
| Utility Gas | 75 (50.0%) | 100 (72.5%) |
| Bottled, Tank, or LP Gas | 56 (37.3%) | 0 (0.0%) |
| Electricity | 0 (0.0%) | 0 (0.0%) |
| Fuel Oil or Kerosene | 0 (0.0%) | 0 (0.0%) |
| Coal or Coke | 0 (0.0%) | 0 (0.0%) |
| All other Fuels | 19 (12.7%) | 38 (27.5%) |
| No Fuel Used | 0 (0.0%) | 0 (0.0%) |
| Total | 150 (100.0%) | 138 (100.0%) |
Household Vehicle Usage in Paraje
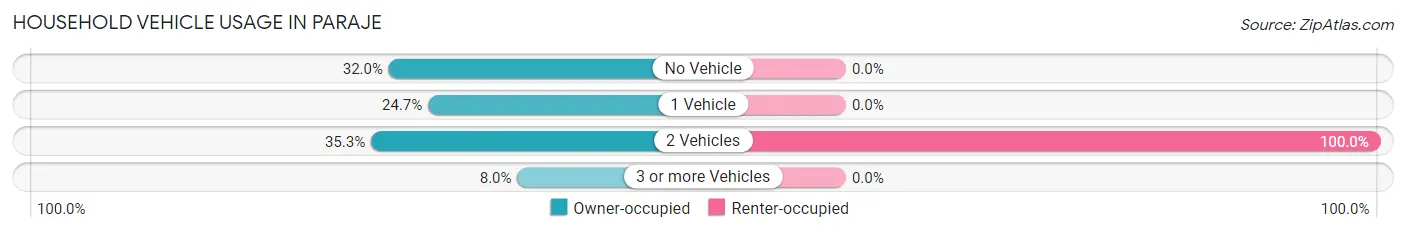
| Vehicles per Household | Owner-occupied | Renter-occupied |
| No Vehicle | 48 (32.0%) | 0 (0.0%) |
| 1 Vehicle | 37 (24.7%) | 0 (0.0%) |
| 2 Vehicles | 53 (35.3%) | 138 (100.0%) |
| 3 or more Vehicles | 12 (8.0%) | 0 (0.0%) |
| Total | 150 (100.0%) | 138 (100.0%) |
Real Estate & Mortgages in Paraje
Real Estate and Mortgage Overview in Paraje
| Characteristic | Without Mortgage | With Mortgage |
| Housing Units | 128 | 22 |
| Median Property Value | - | - |
| Median Household Income | - | - |
| Monthly Housing Costs | $145 | $0 |
| Real Estate Taxes | - | - |
Property Value by Mortgage Status in Paraje
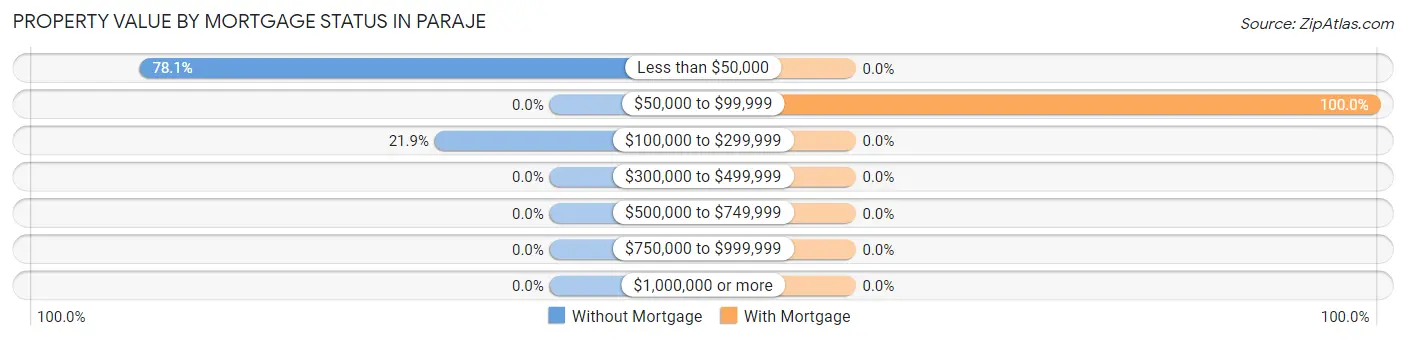
| Property Value | Without Mortgage | With Mortgage |
| Less than $50,000 | 100 (78.1%) | 0 (0.0%) |
| $50,000 to $99,999 | 0 (0.0%) | 22 (100.0%) |
| $100,000 to $299,999 | 28 (21.9%) | 0 (0.0%) |
| $300,000 to $499,999 | 0 (0.0%) | 0 (0.0%) |
| $500,000 to $749,999 | 0 (0.0%) | 0 (0.0%) |
| $750,000 to $999,999 | 0 (0.0%) | 0 (0.0%) |
| $1,000,000 or more | 0 (0.0%) | 0 (0.0%) |
| Total | 128 (100.0%) | 22 (100.0%) |
Household Income by Mortgage Status in Paraje
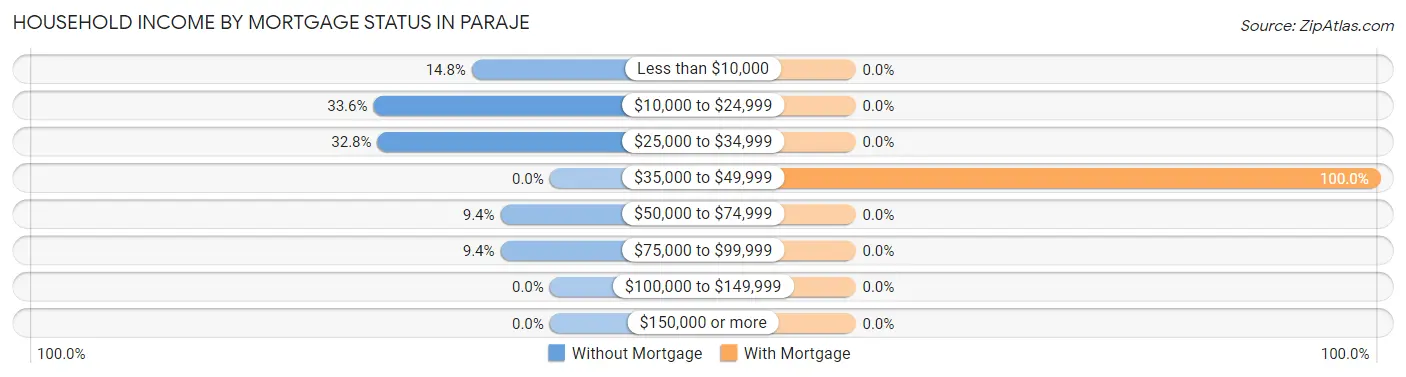
| Household Income | Without Mortgage | With Mortgage |
| Less than $10,000 | 19 (14.8%) | 0 (0.0%) |
| $10,000 to $24,999 | 43 (33.6%) | 0 (0.0%) |
| $25,000 to $34,999 | 42 (32.8%) | 0 (0.0%) |
| $35,000 to $49,999 | 0 (0.0%) | 22 (100.0%) |
| $50,000 to $74,999 | 12 (9.4%) | 0 (0.0%) |
| $75,000 to $99,999 | 12 (9.4%) | 0 (0.0%) |
| $100,000 to $149,999 | 0 (0.0%) | 0 (0.0%) |
| $150,000 or more | 0 (0.0%) | 0 (0.0%) |
| Total | 128 (100.0%) | 22 (100.0%) |
Property Value to Household Income Ratio in Paraje
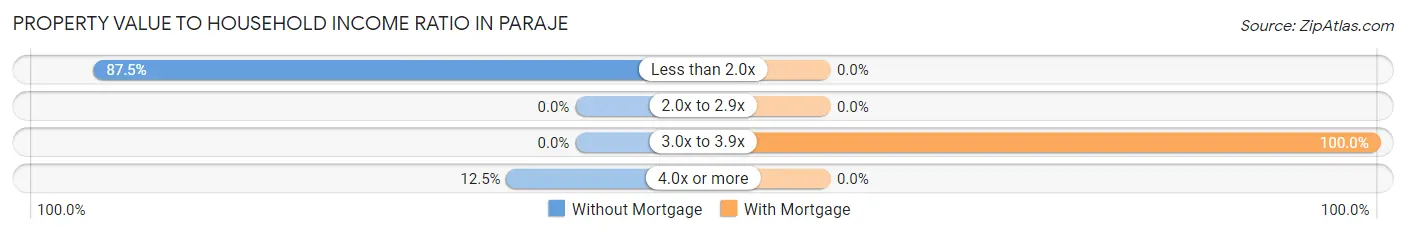
| Value-to-Income Ratio | Without Mortgage | With Mortgage |
| Less than 2.0x | 112 (87.5%) | 0 (0.0%) |
| 2.0x to 2.9x | 0 (0.0%) | 0 (0.0%) |
| 3.0x to 3.9x | 0 (0.0%) | 22 (100.0%) |
| 4.0x or more | 16 (12.5%) | 0 (0.0%) |
| Total | 128 (100.0%) | 22 (100.0%) |
Real Estate Taxes by Mortgage Status in Paraje
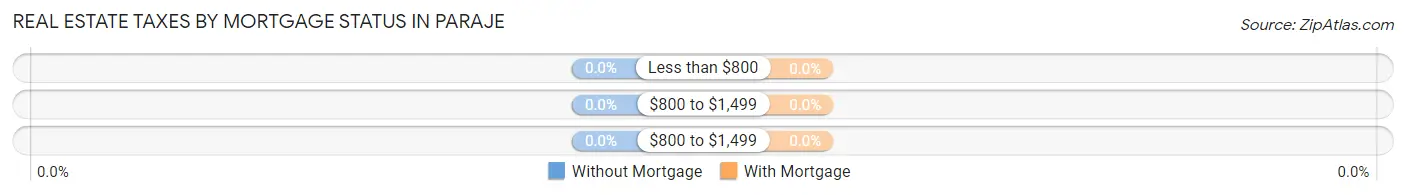
| Property Taxes | Without Mortgage | With Mortgage |
| Less than $800 | 0 (0.0%) | 0 (0.0%) |
| $800 to $1,499 | 0 (0.0%) | 0 (0.0%) |
| $800 to $1,499 | 0 (0.0%) | 0 (0.0%) |
| Total | 128 (100.0%) | 22 (100.0%) |
Health & Disability in Paraje
Health Insurance Coverage by Age in Paraje
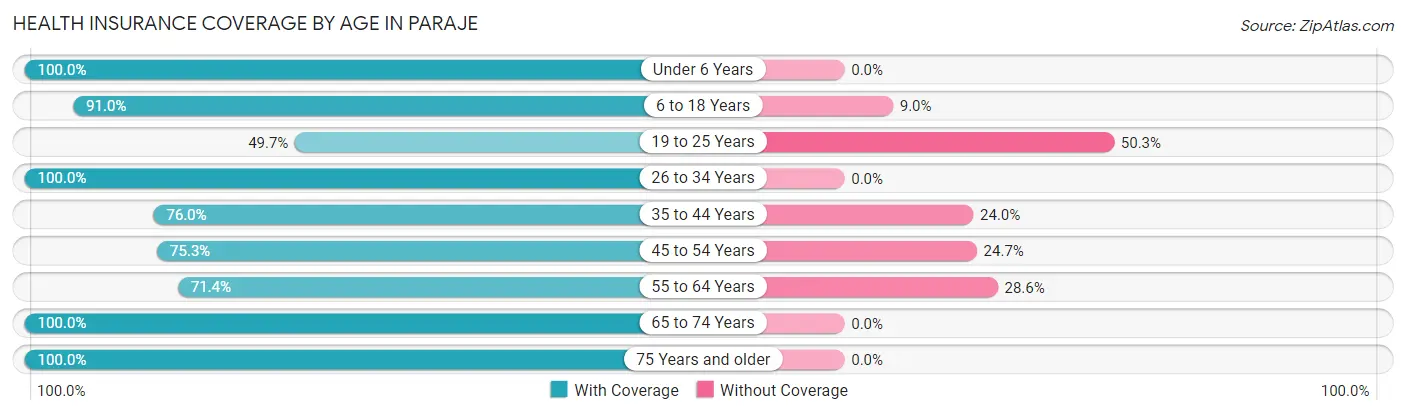
| Age Bracket | With Coverage | Without Coverage |
| Under 6 Years | 64 (100.0%) | 0 (0.0%) |
| 6 to 18 Years | 332 (91.0%) | 33 (9.0%) |
| 19 to 25 Years | 91 (49.7%) | 92 (50.3%) |
| 26 to 34 Years | 144 (100.0%) | 0 (0.0%) |
| 35 to 44 Years | 136 (76.0%) | 43 (24.0%) |
| 45 to 54 Years | 116 (75.3%) | 38 (24.7%) |
| 55 to 64 Years | 55 (71.4%) | 22 (28.6%) |
| 65 to 74 Years | 119 (100.0%) | 0 (0.0%) |
| 75 Years and older | 23 (100.0%) | 0 (0.0%) |
| Total | 1,080 (82.6%) | 228 (17.4%) |
Health Insurance Coverage by Citizenship Status in Paraje
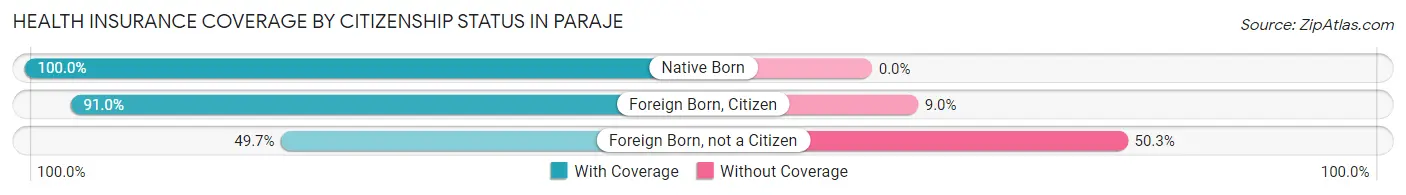
| Citizenship Status | With Coverage | Without Coverage |
| Native Born | 64 (100.0%) | 0 (0.0%) |
| Foreign Born, Citizen | 332 (91.0%) | 33 (9.0%) |
| Foreign Born, not a Citizen | 91 (49.7%) | 92 (50.3%) |
Health Insurance Coverage by Household Income in Paraje
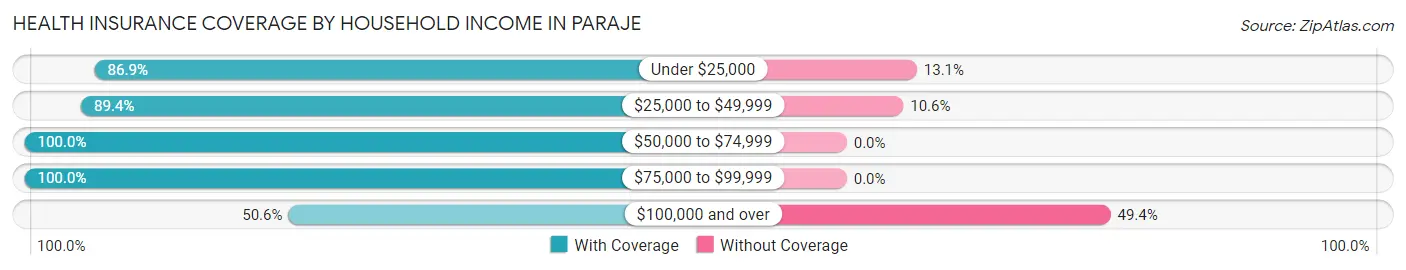
| Household Income | With Coverage | Without Coverage |
| Under $25,000 | 397 (86.9%) | 60 (13.1%) |
| $25,000 to $49,999 | 363 (89.4%) | 43 (10.6%) |
| $50,000 to $74,999 | 128 (100.0%) | 0 (0.0%) |
| $75,000 to $99,999 | 56 (100.0%) | 0 (0.0%) |
| $100,000 and over | 128 (50.6%) | 125 (49.4%) |
Public vs Private Health Insurance Coverage by Age in Paraje
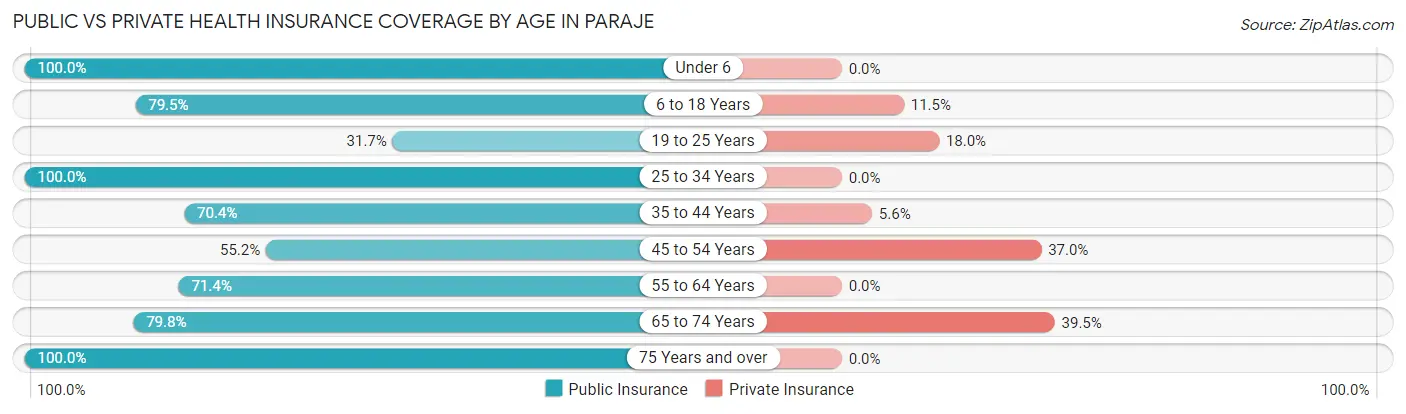
| Age Bracket | Public Insurance | Private Insurance |
| Under 6 | 64 (100.0%) | 0 (0.0%) |
| 6 to 18 Years | 290 (79.4%) | 42 (11.5%) |
| 19 to 25 Years | 58 (31.7%) | 33 (18.0%) |
| 25 to 34 Years | 144 (100.0%) | 0 (0.0%) |
| 35 to 44 Years | 126 (70.4%) | 10 (5.6%) |
| 45 to 54 Years | 85 (55.2%) | 57 (37.0%) |
| 55 to 64 Years | 55 (71.4%) | 0 (0.0%) |
| 65 to 74 Years | 95 (79.8%) | 47 (39.5%) |
| 75 Years and over | 23 (100.0%) | 0 (0.0%) |
| Total | 940 (71.9%) | 189 (14.4%) |
Disability Status by Sex by Age in Paraje
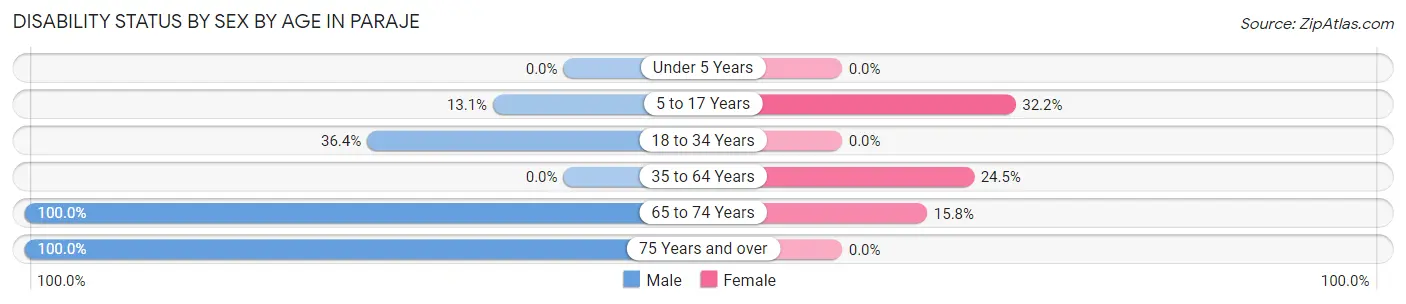
| Age Bracket | Male | Female |
| Under 5 Years | 0 (0.0%) | 0 (0.0%) |
| 5 to 17 Years | 20 (13.1%) | 38 (32.2%) |
| 18 to 34 Years | 86 (36.4%) | 0 (0.0%) |
| 35 to 64 Years | 0 (0.0%) | 59 (24.5%) |
| 65 to 74 Years | 43 (100.0%) | 12 (15.8%) |
| 75 Years and over | 11 (100.0%) | 0 (0.0%) |
Disability Class by Sex by Age in Paraje
Disability Class: Hearing Difficulty
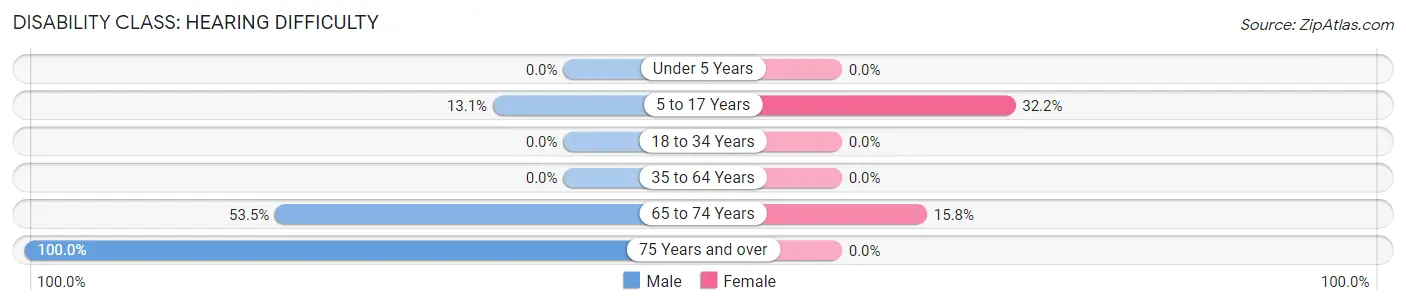
| Age Bracket | Male | Female |
| Under 5 Years | 0 (0.0%) | 0 (0.0%) |
| 5 to 17 Years | 20 (13.1%) | 38 (32.2%) |
| 18 to 34 Years | 0 (0.0%) | 0 (0.0%) |
| 35 to 64 Years | 0 (0.0%) | 0 (0.0%) |
| 65 to 74 Years | 23 (53.5%) | 12 (15.8%) |
| 75 Years and over | 11 (100.0%) | 0 (0.0%) |
Disability Class: Vision Difficulty
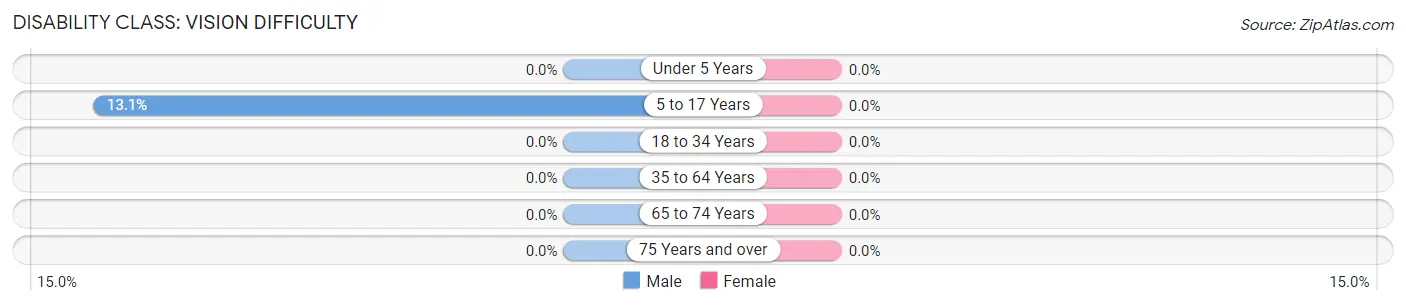
| Age Bracket | Male | Female |
| Under 5 Years | 0 (0.0%) | 0 (0.0%) |
| 5 to 17 Years | 20 (13.1%) | 0 (0.0%) |
| 18 to 34 Years | 0 (0.0%) | 0 (0.0%) |
| 35 to 64 Years | 0 (0.0%) | 0 (0.0%) |
| 65 to 74 Years | 0 (0.0%) | 0 (0.0%) |
| 75 Years and over | 0 (0.0%) | 0 (0.0%) |
Disability Class: Cognitive Difficulty
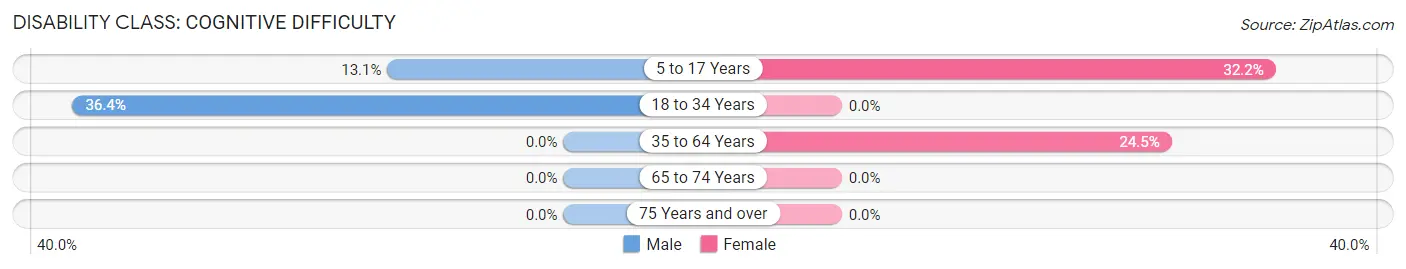
| Age Bracket | Male | Female |
| 5 to 17 Years | 20 (13.1%) | 38 (32.2%) |
| 18 to 34 Years | 86 (36.4%) | 0 (0.0%) |
| 35 to 64 Years | 0 (0.0%) | 59 (24.5%) |
| 65 to 74 Years | 0 (0.0%) | 0 (0.0%) |
| 75 Years and over | 0 (0.0%) | 0 (0.0%) |
Disability Class: Ambulatory Difficulty
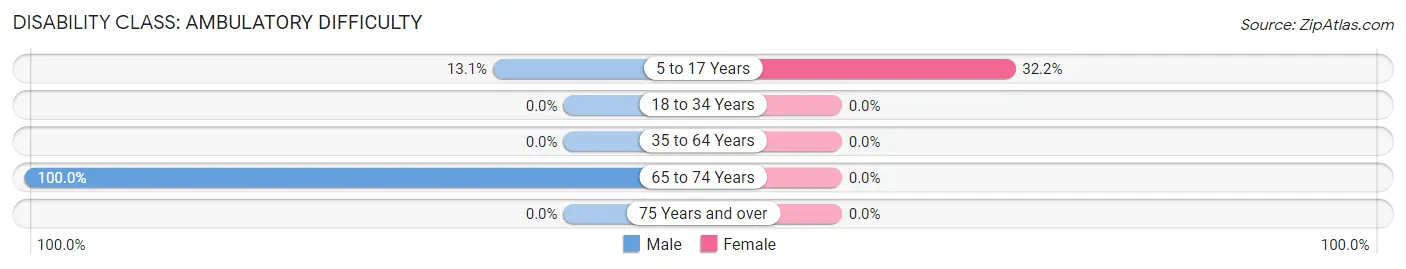
| Age Bracket | Male | Female |
| 5 to 17 Years | 20 (13.1%) | 38 (32.2%) |
| 18 to 34 Years | 0 (0.0%) | 0 (0.0%) |
| 35 to 64 Years | 0 (0.0%) | 0 (0.0%) |
| 65 to 74 Years | 43 (100.0%) | 0 (0.0%) |
| 75 Years and over | 0 (0.0%) | 0 (0.0%) |
Disability Class: Self-Care Difficulty
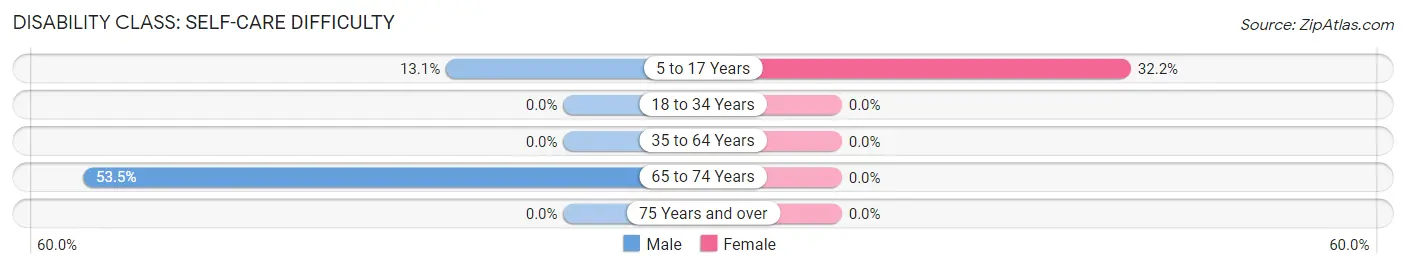
| Age Bracket | Male | Female |
| 5 to 17 Years | 20 (13.1%) | 38 (32.2%) |
| 18 to 34 Years | 0 (0.0%) | 0 (0.0%) |
| 35 to 64 Years | 0 (0.0%) | 0 (0.0%) |
| 65 to 74 Years | 23 (53.5%) | 0 (0.0%) |
| 75 Years and over | 0 (0.0%) | 0 (0.0%) |
Technology Access in Paraje
Computing Device Access in Paraje
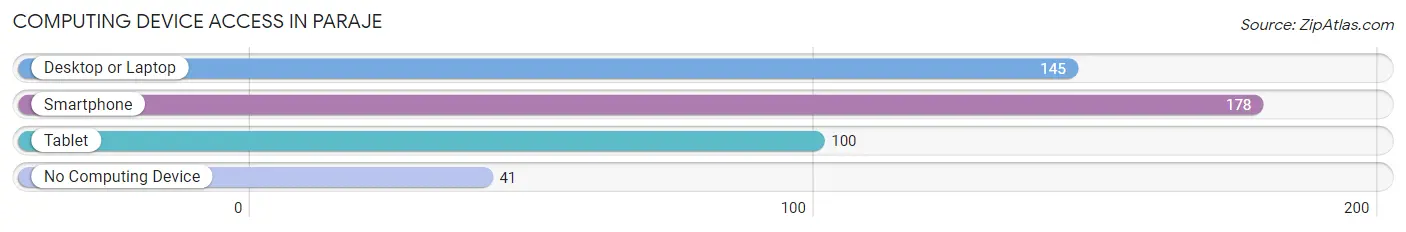
| Device Type | # Households | % Households |
| Desktop or Laptop | 145 | 50.3% |
| Smartphone | 178 | 61.8% |
| Tablet | 100 | 34.7% |
| No Computing Device | 41 | 14.2% |
| Total | 288 | 100.0% |
Internet Access in Paraje
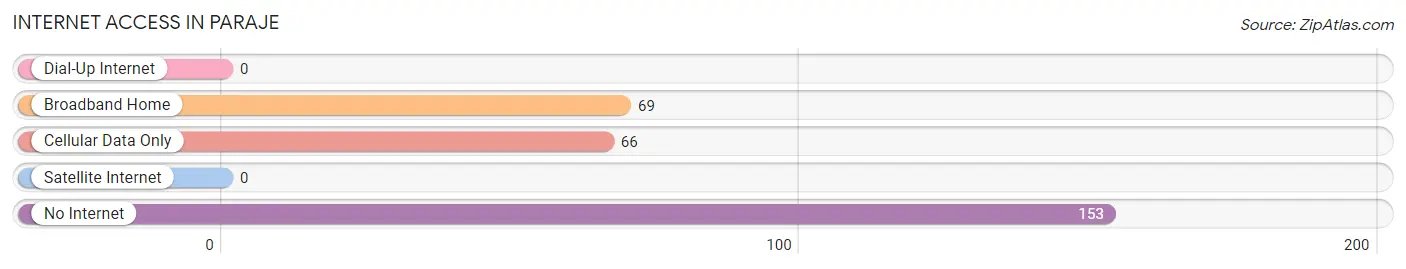
| Internet Type | # Households | % Households |
| Dial-Up Internet | 0 | 0.0% |
| Broadband Home | 69 | 24.0% |
| Cellular Data Only | 66 | 22.9% |
| Satellite Internet | 0 | 0.0% |
| No Internet | 153 | 53.1% |
| Total | 288 | 100.0% |
Paraje Summary
Paraje is a small unincorporated community located in the state of New Mexico, United States. It is situated in the northern part of the state, in the county of San Miguel. The population of Paraje was estimated to be around 1,000 people in the year 2000.
History
Paraje was first established in the late 1800s as a small farming community. The area was originally inhabited by the Pueblo Indians, who had been living in the area for centuries. The first settlers to the area were Spanish settlers, who were attracted to the area due to its fertile soil and abundant water sources. The settlers began to cultivate the land and build homes, and the community of Paraje was born.
In the early 1900s, the population of Paraje began to grow as more settlers moved to the area. The town was officially incorporated in 1912, and the first mayor was elected in 1914. The town continued to grow and develop over the years, and by the year 2000, the population had grown to around 1,000 people.
Geography
Paraje is located in the northern part of New Mexico, in the county of San Miguel. The town is situated in the foothills of the Sangre de Cristo Mountains, and is surrounded by rolling hills and valleys. The town is located at an elevation of 6,000 feet, and the climate is semi-arid. The average annual temperature is around 50 degrees Fahrenheit, and the average annual precipitation is around 10 inches.
Economy
The economy of Paraje is largely based on agriculture. The town is home to several farms, which produce a variety of crops, including corn, wheat, and alfalfa. The town also has a few small businesses, including a grocery store, a hardware store, and a few restaurants.
Demographics
As of the year 2000, the population of Paraje was estimated to be around 1,000 people. The majority of the population is of Hispanic or Latino descent, and the median household income is around $30,000. The town is served by the San Miguel County School District, and the town has one elementary school and one high school.
Common Questions
What is Per Capita Income in Paraje?
Per Capita income in Paraje is $11,828.
What is the Median Family Income in Paraje?
Median Family Income in Paraje is $29,856.
What is the Median Household income in Paraje?
Median Household Income in Paraje is $28,942.
What is Income or Wage Gap in Paraje?
Income or Wage Gap in Paraje is 42.6%.
Women in Paraje earn 57.4 cents for every dollar earned by a man.
What is Inequality or Gini Index in Paraje?
Inequality or Gini Index in Paraje is 0.42.
What is the Total Population of Paraje?
Total Population of Paraje is 1,362.
What is the Total Male Population of Paraje?
Total Male Population of Paraje is 686.
What is the Total Female Population of Paraje?
Total Female Population of Paraje is 676.
What is the Ratio of Males per 100 Females in Paraje?
There are 101.48 Males per 100 Females in Paraje.
What is the Ratio of Females per 100 Males in Paraje?
There are 98.54 Females per 100 Males in Paraje.
What is the Median Population Age in Paraje?
Median Population Age in Paraje is 27.8 Years.
What is the Average Family Size in Paraje
Average Family Size in Paraje is 4.8 People.
What is the Average Household Size in Paraje
Average Household Size in Paraje is 4.5 People.
How Large is the Labor Force in Paraje?
There are 456 People in the Labor Forcein in Paraje.
What is the Percentage of People in the Labor Force in Paraje?
40.8% of People are in the Labor Force in Paraje.