Santa Ana Pueblo, NM Map & Demographics
Santa Ana Pueblo Map
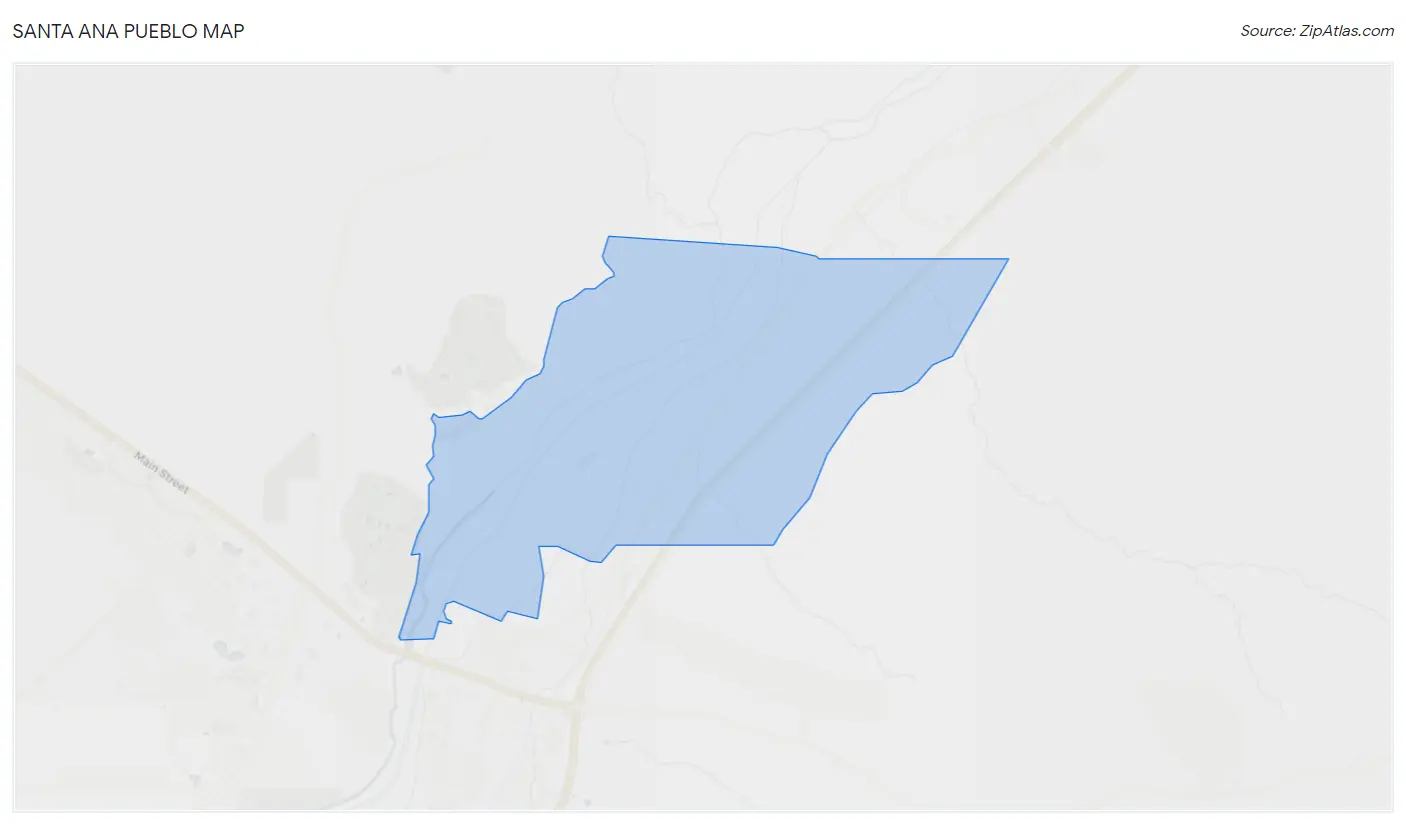
Santa Ana Pueblo Overview
$19,162
PER CAPITA INCOME
$59,886
AVG FAMILY INCOME
$59,318
AVG HOUSEHOLD INCOME
4.4%
WAGE / INCOME GAP [ % ]
95.6¢/ $1
WAGE / INCOME GAP [ $ ]
0.37
INEQUALITY / GINI INDEX
1,006
TOTAL POPULATION
551
MALE POPULATION
455
FEMALE POPULATION
121.10
MALES / 100 FEMALES
82.58
FEMALES / 100 MALES
32.7
MEDIAN AGE
5.3
AVG FAMILY SIZE
4.6
AVG HOUSEHOLD SIZE
502
LABOR FORCE [ PEOPLE ]
66.1%
PERCENT IN LABOR FORCE
4.8%
UNEMPLOYMENT RATE
Santa Ana Pueblo Area Codes
Income in Santa Ana Pueblo
Income Overview in Santa Ana Pueblo
Per Capita Income in Santa Ana Pueblo is $19,162, while median incomes of families and households are $59,886 and $59,318 respectively.
| Characteristic | Number | Measure |
| Per Capita Income | 1,006 | $19,162 |
| Median Family Income | 179 | $59,886 |
| Mean Family Income | 179 | $77,275 |
| Median Household Income | 218 | $59,318 |
| Mean Household Income | 218 | $72,501 |
| Income Deficit | 179 | $0 |
| Wage / Income Gap (%) | 1,006 | 4.44% |
| Wage / Income Gap ($) | 1,006 | 95.56¢ per $1 |
| Gini / Inequality Index | 1,006 | 0.37 |
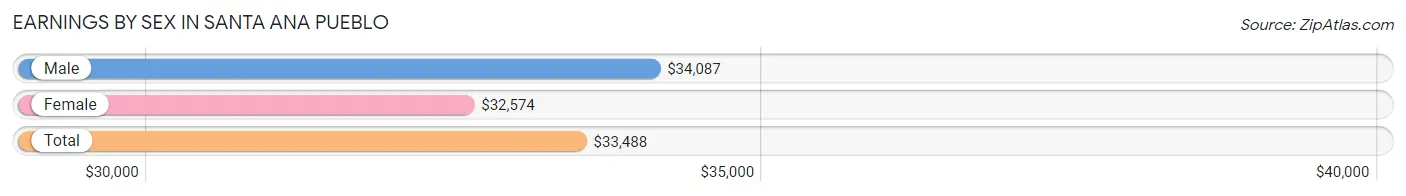
Earnings by Sex in Santa Ana Pueblo
Average Earnings in Santa Ana Pueblo are $33,488, $34,087 for men and $32,574 for women, a difference of 4.4%.
| Sex | Number | Average Earnings |
| Male | 295 (57.8%) | $34,087 |
| Female | 215 (42.2%) | $32,574 |
| Total | 510 (100.0%) | $33,488 |
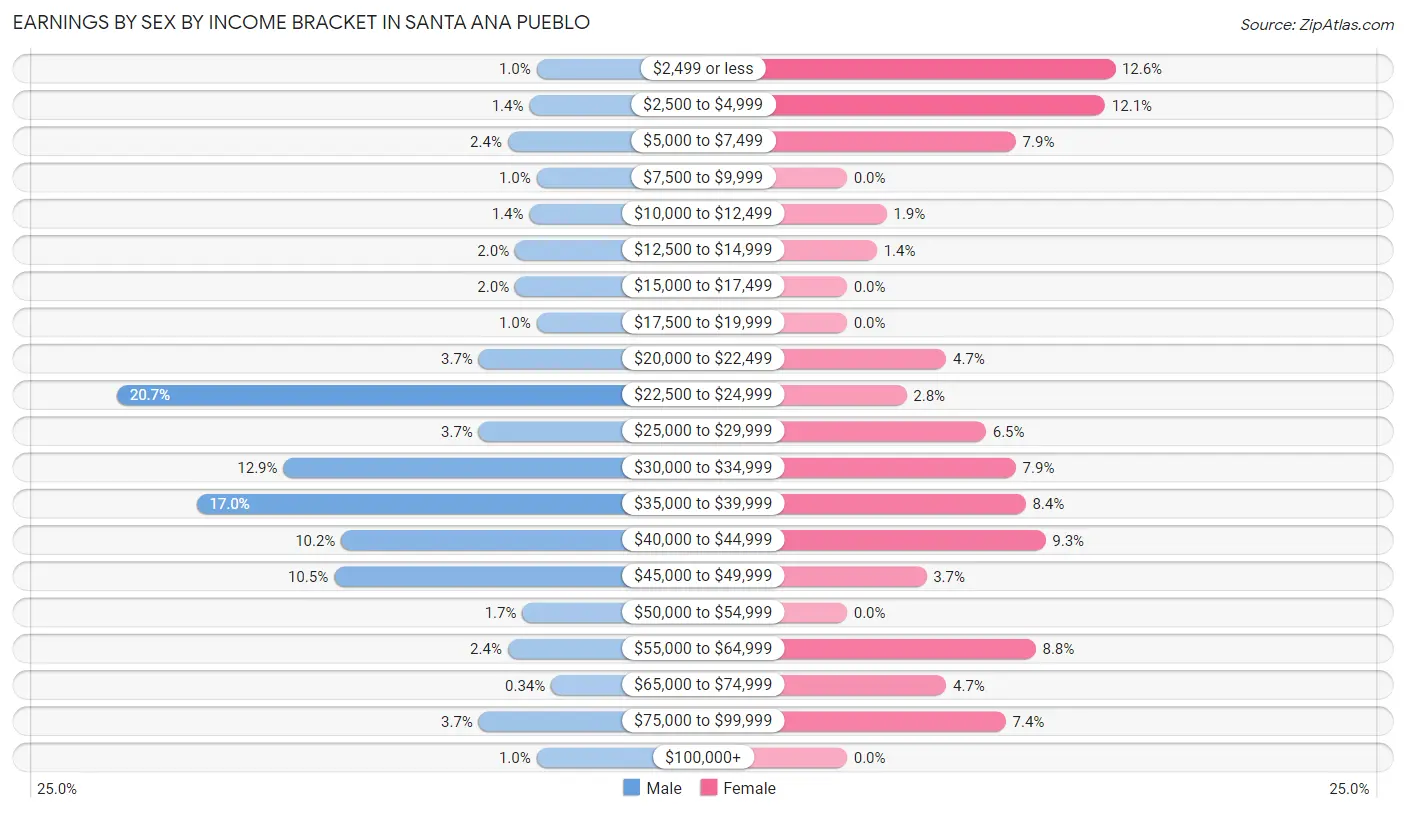
Earnings by Sex by Income Bracket in Santa Ana Pueblo
The most common earnings brackets in Santa Ana Pueblo are $22,500 to $24,999 for men (61 | 20.7%) and $2,499 or less for women (27 | 12.6%).
| Income | Male | Female |
| $2,499 or less | 3 (1.0%) | 27 (12.6%) |
| $2,500 to $4,999 | 4 (1.4%) | 26 (12.1%) |
| $5,000 to $7,499 | 7 (2.4%) | 17 (7.9%) |
| $7,500 to $9,999 | 3 (1.0%) | 0 (0.0%) |
| $10,000 to $12,499 | 4 (1.4%) | 4 (1.9%) |
| $12,500 to $14,999 | 6 (2.0%) | 3 (1.4%) |
| $15,000 to $17,499 | 6 (2.0%) | 0 (0.0%) |
| $17,500 to $19,999 | 3 (1.0%) | 0 (0.0%) |
| $20,000 to $22,499 | 11 (3.7%) | 10 (4.6%) |
| $22,500 to $24,999 | 61 (20.7%) | 6 (2.8%) |
| $25,000 to $29,999 | 11 (3.7%) | 14 (6.5%) |
| $30,000 to $34,999 | 38 (12.9%) | 17 (7.9%) |
| $35,000 to $39,999 | 50 (17.0%) | 18 (8.4%) |
| $40,000 to $44,999 | 30 (10.2%) | 20 (9.3%) |
| $45,000 to $49,999 | 31 (10.5%) | 8 (3.7%) |
| $50,000 to $54,999 | 5 (1.7%) | 0 (0.0%) |
| $55,000 to $64,999 | 7 (2.4%) | 19 (8.8%) |
| $65,000 to $74,999 | 1 (0.3%) | 10 (4.6%) |
| $75,000 to $99,999 | 11 (3.7%) | 16 (7.4%) |
| $100,000+ | 3 (1.0%) | 0 (0.0%) |
| Total | 295 (100.0%) | 215 (100.0%) |
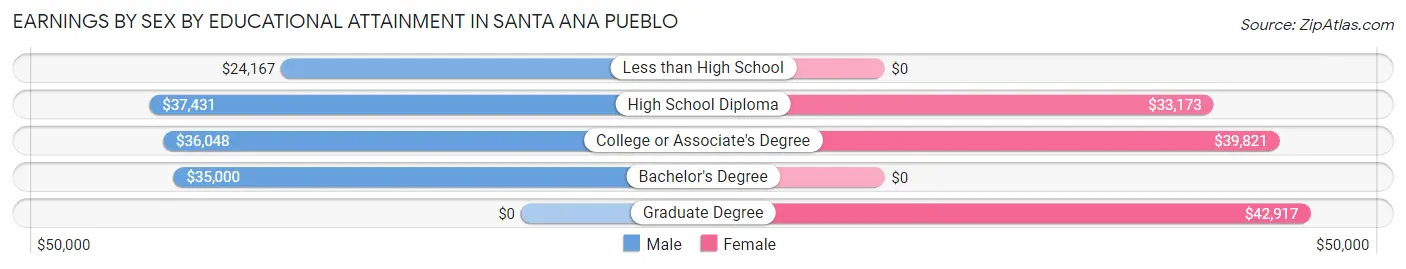
Earnings by Sex by Educational Attainment in Santa Ana Pueblo
Average earnings in Santa Ana Pueblo are $35,791 for men and $36,944 for women, a difference of 3.1%. Men with an educational attainment of high school diploma enjoy the highest average annual earnings of $37,431, while those with less than high school education earn the least with $24,167. Women with an educational attainment of graduate degree earn the most with the average annual earnings of $42,917, while those with high school diploma education have the smallest earnings of $33,173.
| Educational Attainment | Male Income | Female Income |
| Less than High School | $24,167 | $0 |
| High School Diploma | $37,431 | $33,173 |
| College or Associate's Degree | $36,048 | $39,821 |
| Bachelor's Degree | $35,000 | $0 |
| Graduate Degree | - | - |
| Total | $35,791 | $36,944 |
Family Income in Santa Ana Pueblo
Family Income Brackets in Santa Ana Pueblo
According to the Santa Ana Pueblo family income data, there are 42 families falling into the $100,000 to $149,999 income range, which is the most common income bracket and makes up 23.5% of all families.
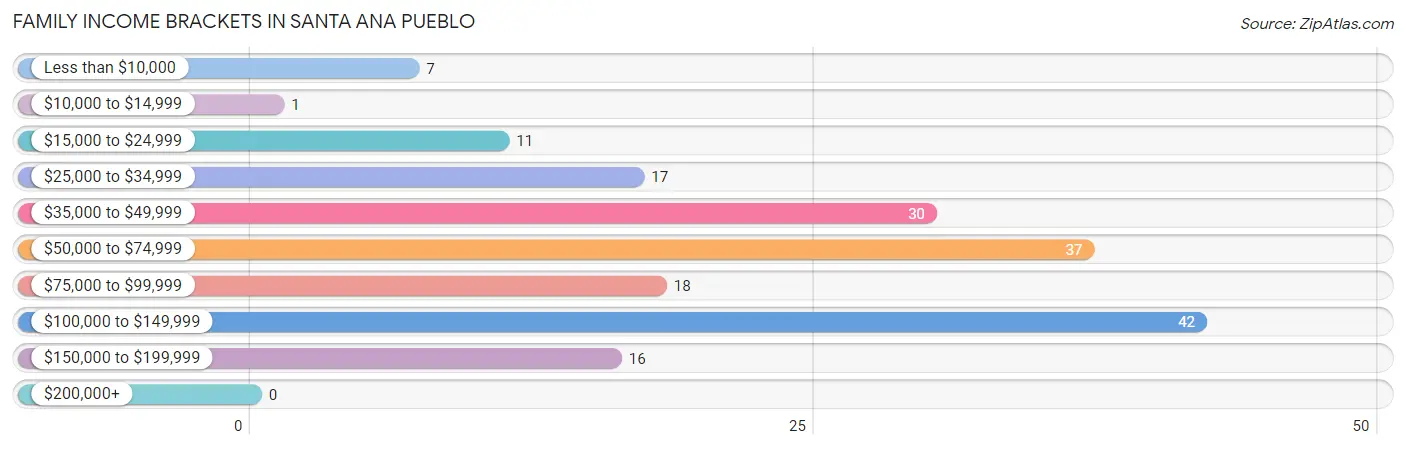
| Income Bracket | # Families | % Families |
| Less than $10,000 | 7 | 3.9% |
| $10,000 to $14,999 | 1 | 0.6% |
| $15,000 to $24,999 | 11 | 6.1% |
| $25,000 to $34,999 | 17 | 9.5% |
| $35,000 to $49,999 | 30 | 16.8% |
| $50,000 to $74,999 | 37 | 20.7% |
| $75,000 to $99,999 | 18 | 10.1% |
| $100,000 to $149,999 | 42 | 23.5% |
| $150,000 to $199,999 | 16 | 8.9% |
| $200,000+ | 0 | 0.0% |
Family Income by Famaliy Size in Santa Ana Pueblo
4-person families (36 | 20.1%) account for the highest median family income in Santa Ana Pueblo with $137,778 per family, while 4-person families (36 | 20.1%) have the highest median income of $34,444 per family member.
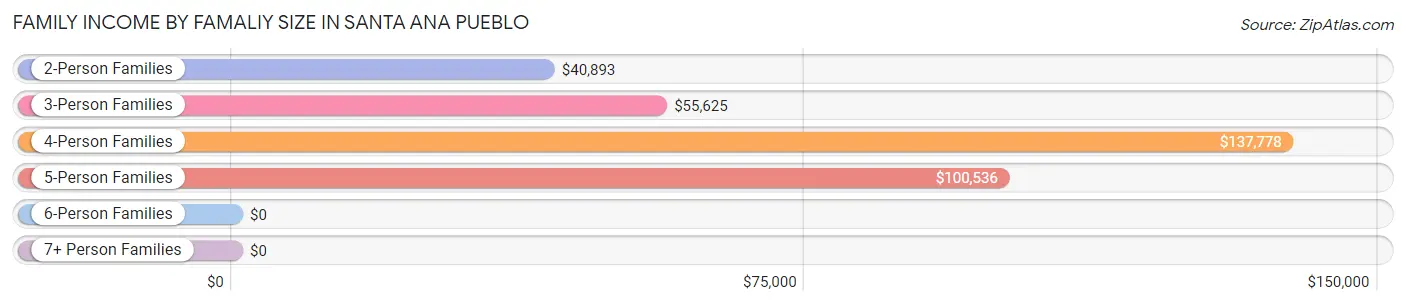
| Income Bracket | # Families | Median Income |
| 2-Person Families | 49 (27.4%) | $40,893 |
| 3-Person Families | 41 (22.9%) | $55,625 |
| 4-Person Families | 36 (20.1%) | $137,778 |
| 5-Person Families | 33 (18.4%) | $100,536 |
| 6-Person Families | 14 (7.8%) | $0 |
| 7+ Person Families | 6 (3.4%) | $0 |
| Total | 179 (100.0%) | $59,886 |
Family Income by Number of Earners in Santa Ana Pueblo
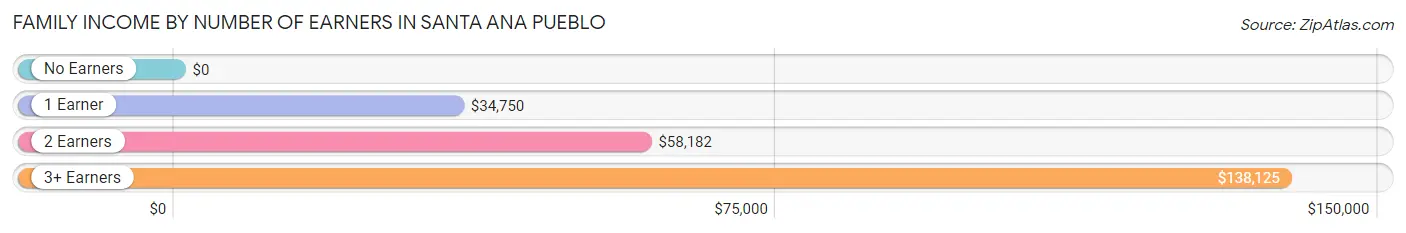
| Number of Earners | # Families | Median Income |
| No Earners | 17 (9.5%) | $0 |
| 1 Earner | 43 (24.0%) | $34,750 |
| 2 Earners | 60 (33.5%) | $58,182 |
| 3+ Earners | 59 (33.0%) | $138,125 |
| Total | 179 (100.0%) | $59,886 |
Household Income in Santa Ana Pueblo
Household Income Brackets in Santa Ana Pueblo
With 45 households falling in the category, the $100,000 to $149,999 income range is the most frequent in Santa Ana Pueblo, accounting for 20.6% of all households.
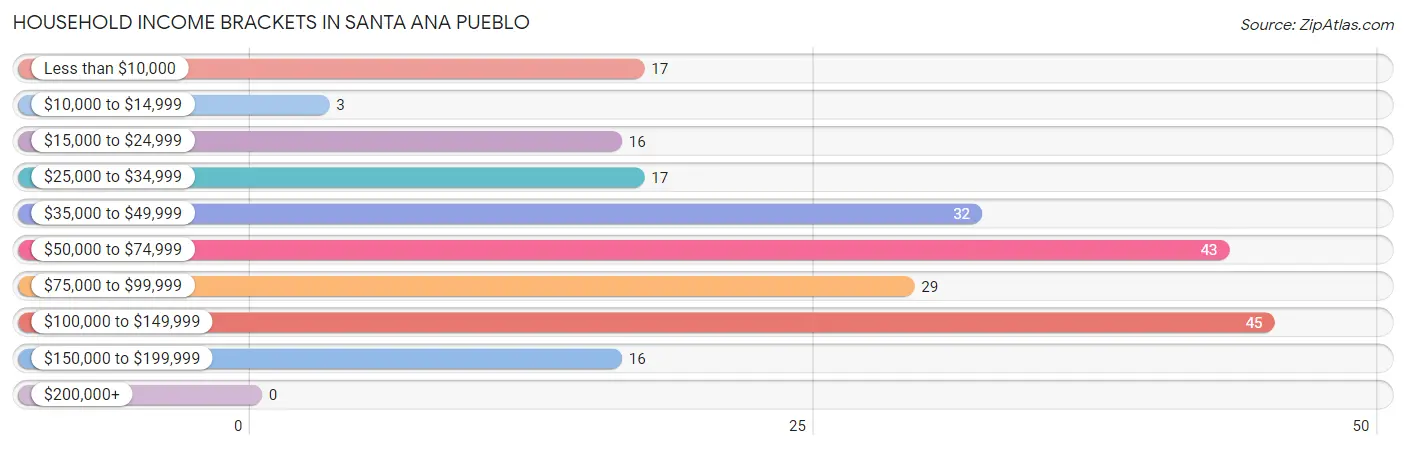
| Income Bracket | # Households | % Households |
| Less than $10,000 | 17 | 7.8% |
| $10,000 to $14,999 | 3 | 1.4% |
| $15,000 to $24,999 | 16 | 7.3% |
| $25,000 to $34,999 | 17 | 7.8% |
| $35,000 to $49,999 | 32 | 14.7% |
| $50,000 to $74,999 | 43 | 19.7% |
| $75,000 to $99,999 | 29 | 13.3% |
| $100,000 to $149,999 | 45 | 20.6% |
| $150,000 to $199,999 | 16 | 7.3% |
| $200,000+ | 0 | 0.0% |
Household Income by Householder Age in Santa Ana Pueblo
The median household income in Santa Ana Pueblo is $59,318, with the highest median household income of $79,821 found in the 45 to 64 years age bracket for the primary householder. A total of 95 households (43.6%) fall into this category.
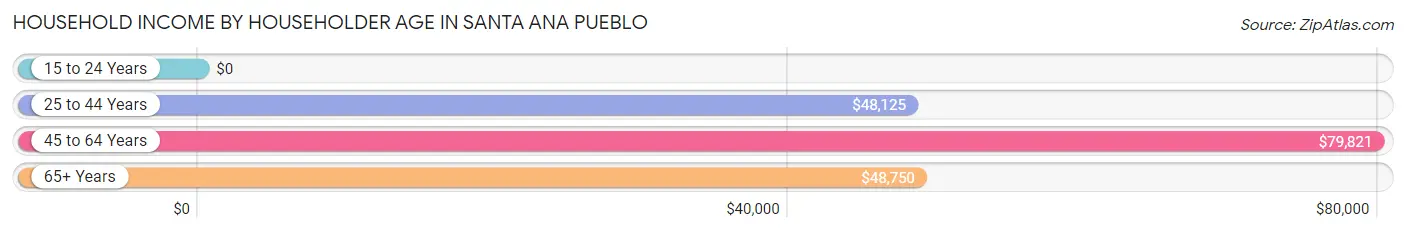
| Income Bracket | # Households | Median Income |
| 15 to 24 Years | 0 (0.0%) | $0 |
| 25 to 44 Years | 48 (22.0%) | $48,125 |
| 45 to 64 Years | 95 (43.6%) | $79,821 |
| 65+ Years | 75 (34.4%) | $48,750 |
| Total | 218 (100.0%) | $59,318 |
Poverty in Santa Ana Pueblo
Income Below Poverty by Sex and Age in Santa Ana Pueblo
With 5.4% poverty level for males and 10.3% for females among the residents of Santa Ana Pueblo, 55 to 64 year old males and 55 to 64 year old females are the most vulnerable to poverty, with 8 males (16.7%) and 11 females (24.4%) in their respective age groups living below the poverty level.
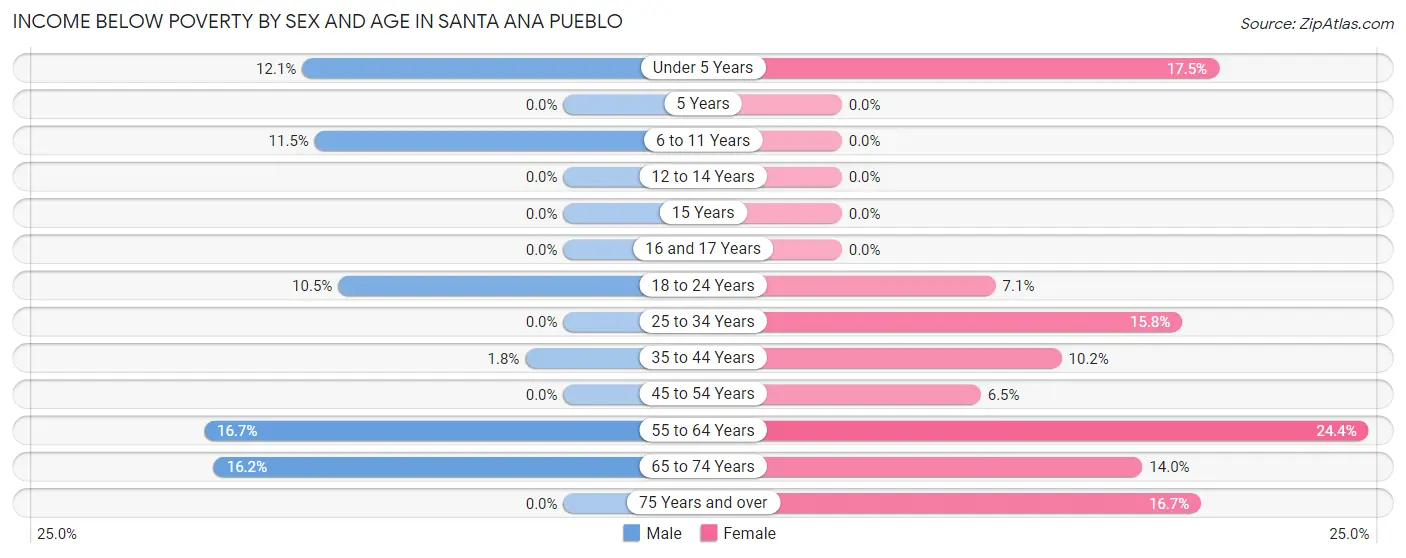
| Age Bracket | Male | Female |
| Under 5 Years | 4 (12.1%) | 7 (17.5%) |
| 5 Years | 0 (0.0%) | 0 (0.0%) |
| 6 to 11 Years | 3 (11.5%) | 0 (0.0%) |
| 12 to 14 Years | 0 (0.0%) | 0 (0.0%) |
| 15 Years | 0 (0.0%) | 0 (0.0%) |
| 16 and 17 Years | 0 (0.0%) | 0 (0.0%) |
| 18 to 24 Years | 7 (10.4%) | 4 (7.1%) |
| 25 to 34 Years | 0 (0.0%) | 6 (15.8%) |
| 35 to 44 Years | 2 (1.8%) | 5 (10.2%) |
| 45 to 54 Years | 0 (0.0%) | 4 (6.5%) |
| 55 to 64 Years | 8 (16.7%) | 11 (24.4%) |
| 65 to 74 Years | 6 (16.2%) | 6 (14.0%) |
| 75 Years and over | 0 (0.0%) | 4 (16.7%) |
| Total | 30 (5.4%) | 47 (10.3%) |
Income Above Poverty by Sex and Age in Santa Ana Pueblo
According to the poverty statistics in Santa Ana Pueblo, males aged 5 years and females aged 6 to 11 years are the age groups that are most secure financially, with 100.0% of males and 100.0% of females in these age groups living above the poverty line.
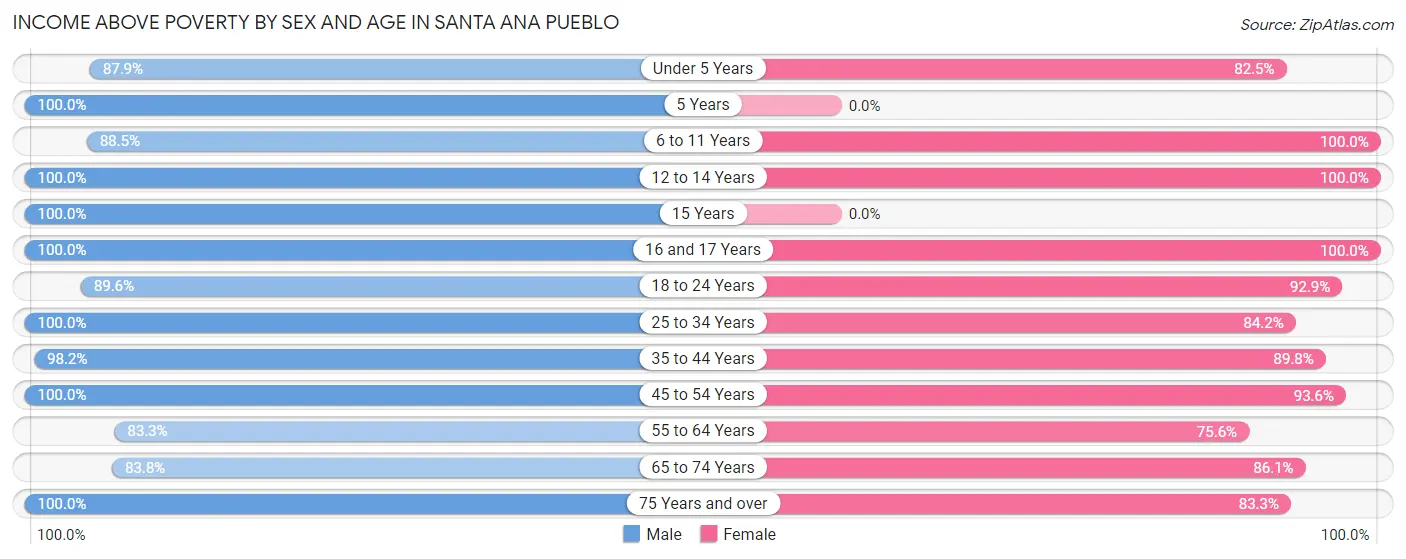
| Age Bracket | Male | Female |
| Under 5 Years | 29 (87.9%) | 33 (82.5%) |
| 5 Years | 7 (100.0%) | 0 (0.0%) |
| 6 to 11 Years | 23 (88.5%) | 53 (100.0%) |
| 12 to 14 Years | 44 (100.0%) | 25 (100.0%) |
| 15 Years | 18 (100.0%) | 0 (0.0%) |
| 16 and 17 Years | 15 (100.0%) | 20 (100.0%) |
| 18 to 24 Years | 60 (89.5%) | 52 (92.9%) |
| 25 to 34 Years | 105 (100.0%) | 32 (84.2%) |
| 35 to 44 Years | 111 (98.2%) | 44 (89.8%) |
| 45 to 54 Years | 27 (100.0%) | 58 (93.5%) |
| 55 to 64 Years | 40 (83.3%) | 34 (75.6%) |
| 65 to 74 Years | 31 (83.8%) | 37 (86.1%) |
| 75 Years and over | 11 (100.0%) | 20 (83.3%) |
| Total | 521 (94.6%) | 408 (89.7%) |
Income Below Poverty Among Married-Couple Families in Santa Ana Pueblo
The poverty statistics for married-couple families in Santa Ana Pueblo show that 10.8% or 8 of the total 74 families live below the poverty line. Families with no children have the highest poverty rate of 27.6%, comprising of 8 families. On the other hand, families with 1 or 2 children have the lowest poverty rate of 0.0%, which includes 0 families.
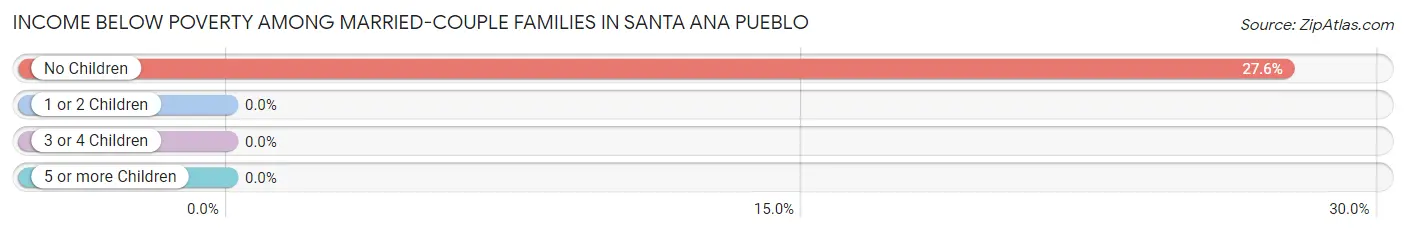
| Children | Above Poverty | Below Poverty |
| No Children | 21 (72.4%) | 8 (27.6%) |
| 1 or 2 Children | 29 (100.0%) | 0 (0.0%) |
| 3 or 4 Children | 16 (100.0%) | 0 (0.0%) |
| 5 or more Children | 0 (0.0%) | 0 (0.0%) |
| Total | 66 (89.2%) | 8 (10.8%) |
Income Below Poverty Among Single-Parent Households in Santa Ana Pueblo
According to the poverty data in Santa Ana Pueblo, 2.9% or 1 single-father households and 12.9% or 9 single-mother households are living below the poverty line. Among single-father households, those with no children have the highest poverty rate, with 1 households (3.0%) experiencing poverty. Likewise, among single-mother households, those with 3 or 4 children have the highest poverty rate, with 3 households (30.0%) falling below the poverty line.
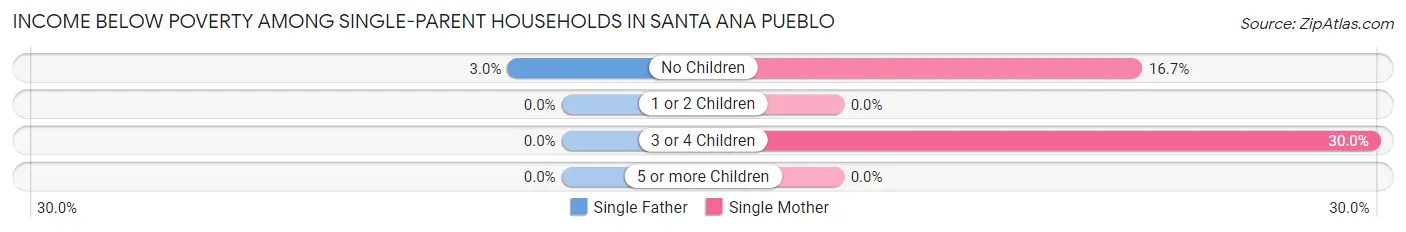
| Children | Single Father | Single Mother |
| No Children | 1 (3.0%) | 6 (16.7%) |
| 1 or 2 Children | 0 (0.0%) | 0 (0.0%) |
| 3 or 4 Children | 0 (0.0%) | 3 (30.0%) |
| 5 or more Children | 0 (0.0%) | 0 (0.0%) |
| Total | 1 (2.9%) | 9 (12.9%) |
Income Below Poverty Among Married-Couple vs Single-Parent Households in Santa Ana Pueblo
The poverty data for Santa Ana Pueblo shows that 8 of the married-couple family households (10.8%) and 10 of the single-parent households (9.5%) are living below the poverty level. Within the married-couple family households, those with no children have the highest poverty rate, with 8 households (27.6%) falling below the poverty line. Among the single-parent households, those with 3 or 4 children have the highest poverty rate, with 3 household (30.0%) living below poverty.
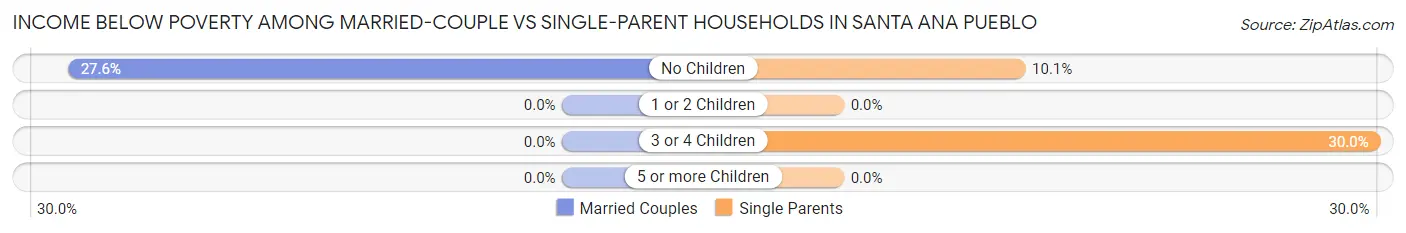
| Children | Married-Couple Families | Single-Parent Households |
| No Children | 8 (27.6%) | 7 (10.1%) |
| 1 or 2 Children | 0 (0.0%) | 0 (0.0%) |
| 3 or 4 Children | 0 (0.0%) | 3 (30.0%) |
| 5 or more Children | 0 (0.0%) | 0 (0.0%) |
| Total | 8 (10.8%) | 10 (9.5%) |
Race in Santa Ana Pueblo
The most populous races in Santa Ana Pueblo are Native / Alaskan (950 | 94.4%), Hispanic or Latino (49 | 4.9%), and Two or more Races (33 | 3.3%).
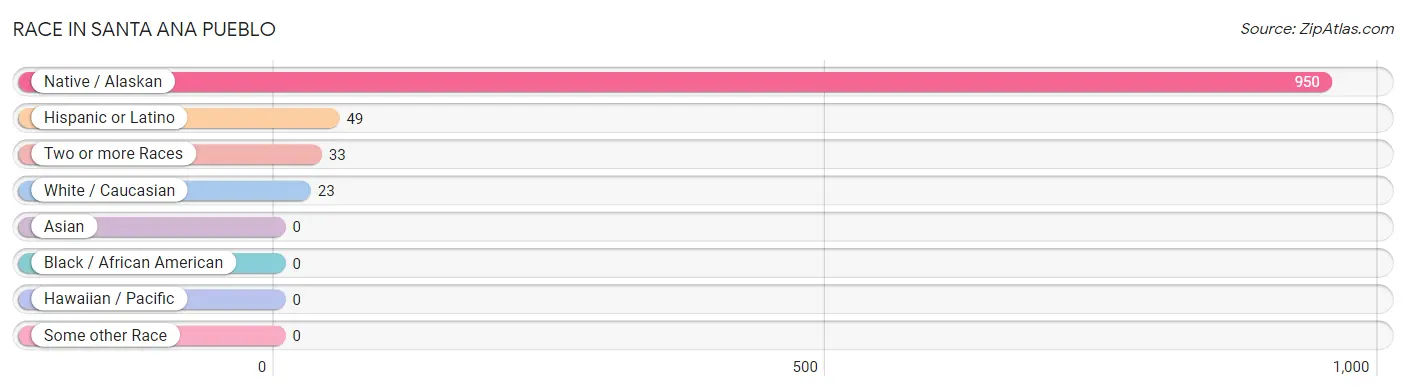
| Race | # Population | % Population |
| Asian | 0 | 0.0% |
| Black / African American | 0 | 0.0% |
| Hawaiian / Pacific | 0 | 0.0% |
| Hispanic or Latino | 49 | 4.9% |
| Native / Alaskan | 950 | 94.4% |
| White / Caucasian | 23 | 2.3% |
| Two or more Races | 33 | 3.3% |
| Some other Race | 0 | 0.0% |
| Total | 1,006 | 100.0% |
Ancestry in Santa Ana Pueblo
The most populous ancestries reported in Santa Ana Pueblo are Pueblo (812 | 80.7%), Spanish (26 | 2.6%), Navajo (23 | 2.3%), Mexican (21 | 2.1%), and American (4 | 0.4%), together accounting for 88.1% of all Santa Ana Pueblo residents.
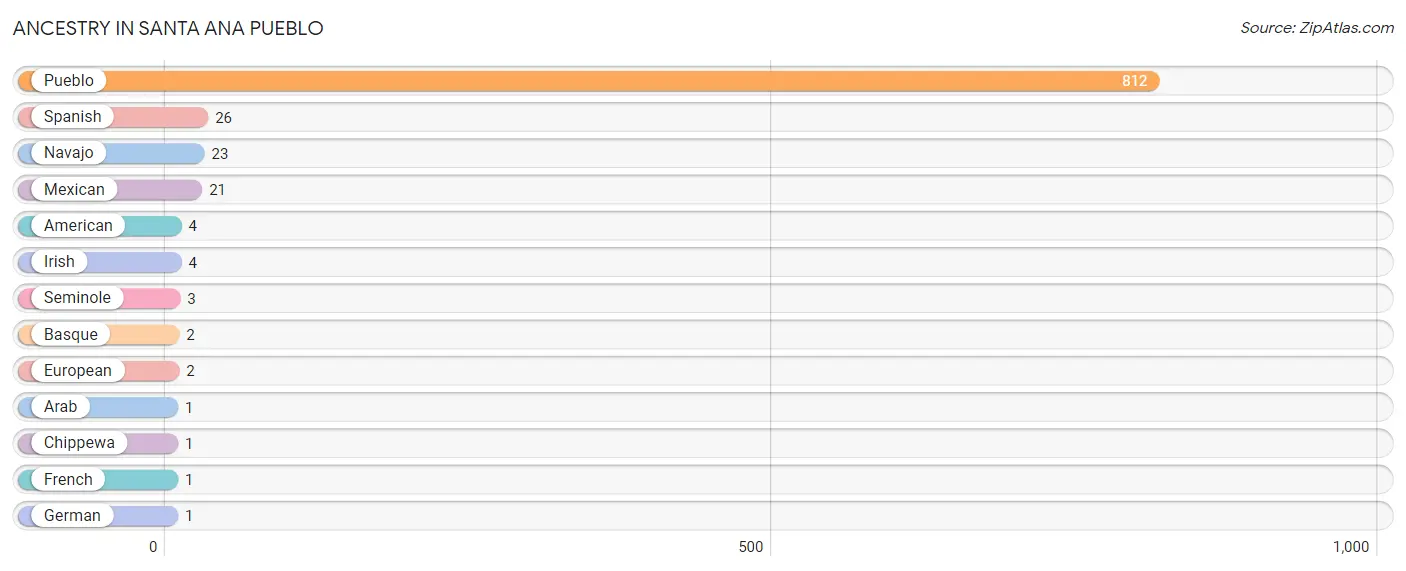
| Ancestry | # Population | % Population |
| American | 4 | 0.4% |
| Arab | 1 | 0.1% |
| Basque | 2 | 0.2% |
| Chippewa | 1 | 0.1% |
| European | 2 | 0.2% |
| French | 1 | 0.1% |
| German | 1 | 0.1% |
| Irish | 4 | 0.4% |
| Mexican | 21 | 2.1% |
| Navajo | 23 | 2.3% |
| Pueblo | 812 | 80.7% |
| Seminole | 3 | 0.3% |
| Spanish | 26 | 2.6% | View All 13 Rows |
Immigrants in Santa Ana Pueblo
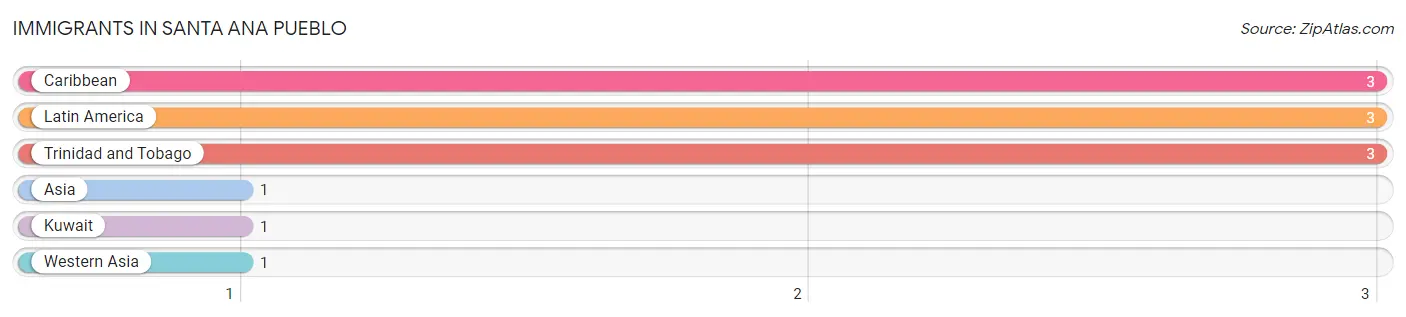
The most numerous immigrant groups reported in Santa Ana Pueblo came from Caribbean (3 | 0.3%), Latin America (3 | 0.3%), Trinidad and Tobago (3 | 0.3%), Asia (1 | 0.1%), and Kuwait (1 | 0.1%), together accounting for 1.1% of all Santa Ana Pueblo residents.
| Immigration Origin | # Population | % Population |
| Asia | 1 | 0.1% |
| Caribbean | 3 | 0.3% |
| Kuwait | 1 | 0.1% |
| Latin America | 3 | 0.3% |
| Trinidad and Tobago | 3 | 0.3% |
| Western Asia | 1 | 0.1% | View All 6 Rows |
Sex and Age in Santa Ana Pueblo
Sex and Age in Santa Ana Pueblo
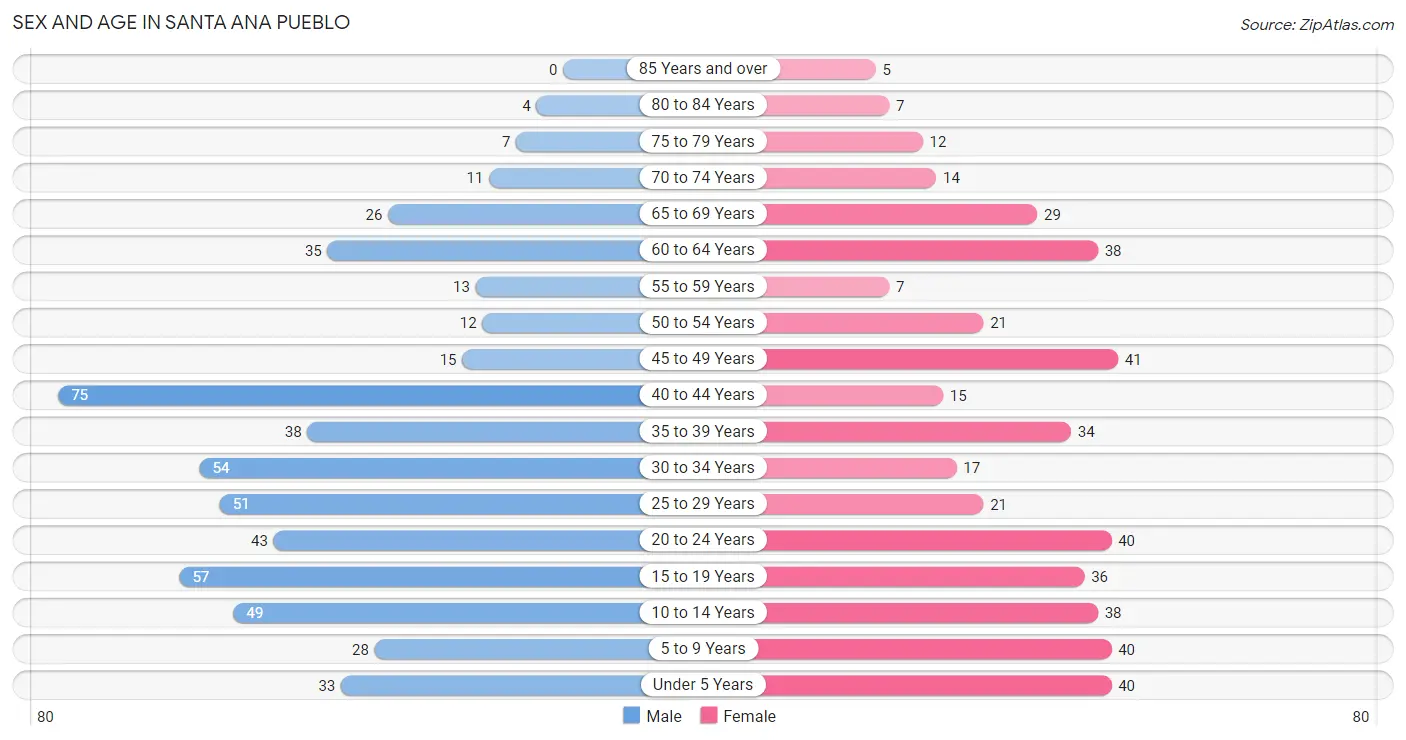
The most populous age groups in Santa Ana Pueblo are 40 to 44 Years (75 | 13.6%) for men and 45 to 49 Years (41 | 9.0%) for women.
| Age Bracket | Male | Female |
| Under 5 Years | 33 (6.0%) | 40 (8.8%) |
| 5 to 9 Years | 28 (5.1%) | 40 (8.8%) |
| 10 to 14 Years | 49 (8.9%) | 38 (8.4%) |
| 15 to 19 Years | 57 (10.3%) | 36 (7.9%) |
| 20 to 24 Years | 43 (7.8%) | 40 (8.8%) |
| 25 to 29 Years | 51 (9.3%) | 21 (4.6%) |
| 30 to 34 Years | 54 (9.8%) | 17 (3.7%) |
| 35 to 39 Years | 38 (6.9%) | 34 (7.5%) |
| 40 to 44 Years | 75 (13.6%) | 15 (3.3%) |
| 45 to 49 Years | 15 (2.7%) | 41 (9.0%) |
| 50 to 54 Years | 12 (2.2%) | 21 (4.6%) |
| 55 to 59 Years | 13 (2.4%) | 7 (1.5%) |
| 60 to 64 Years | 35 (6.4%) | 38 (8.4%) |
| 65 to 69 Years | 26 (4.7%) | 29 (6.4%) |
| 70 to 74 Years | 11 (2.0%) | 14 (3.1%) |
| 75 to 79 Years | 7 (1.3%) | 12 (2.6%) |
| 80 to 84 Years | 4 (0.7%) | 7 (1.5%) |
| 85 Years and over | 0 (0.0%) | 5 (1.1%) |
| Total | 551 (100.0%) | 455 (100.0%) |
Families and Households in Santa Ana Pueblo
Median Family Size in Santa Ana Pueblo
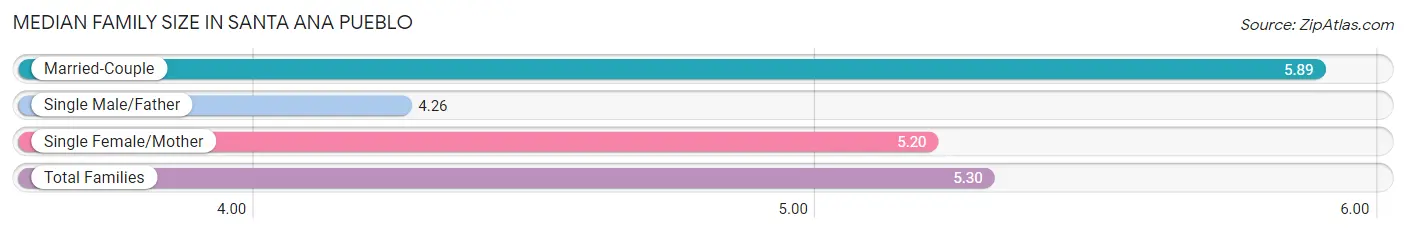
The median family size in Santa Ana Pueblo is 5.30 persons per family, with married-couple families (74 | 41.3%) accounting for the largest median family size of 5.89 persons per family. On the other hand, single male/father families (35 | 19.6%) represent the smallest median family size with 4.26 persons per family.
| Family Type | # Families | Family Size |
| Married-Couple | 74 (41.3%) | 5.89 |
| Single Male/Father | 35 (19.6%) | 4.26 |
| Single Female/Mother | 70 (39.1%) | 5.20 |
| Total Families | 179 (100.0%) | 5.30 |
Median Household Size in Santa Ana Pueblo
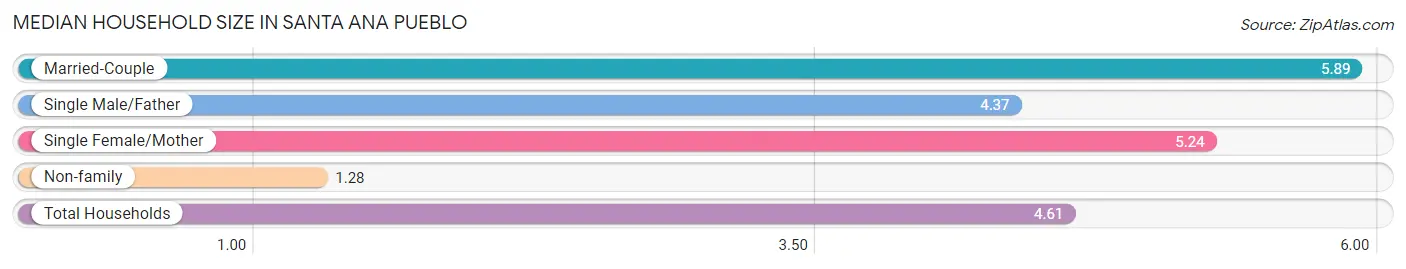
The median household size in Santa Ana Pueblo is 4.61 persons per household, with married-couple households (74 | 33.9%) accounting for the largest median household size of 5.89 persons per household. non-family households (39 | 17.9%) represent the smallest median household size with 1.28 persons per household.
| Household Type | # Households | Household Size |
| Married-Couple | 74 (33.9%) | 5.89 |
| Single Male/Father | 35 (16.1%) | 4.37 |
| Single Female/Mother | 70 (32.1%) | 5.24 |
| Non-family | 39 (17.9%) | 1.28 |
| Total Households | 218 (100.0%) | 4.61 |
Household Size by Marriage Status in Santa Ana Pueblo
Out of a total of 218 households in Santa Ana Pueblo, 179 (82.1%) are family households, while 39 (17.9%) are nonfamily households. The most numerous type of family households are 3-person households, comprising 46, and the most common type of nonfamily households are 1-person households, comprising 34.
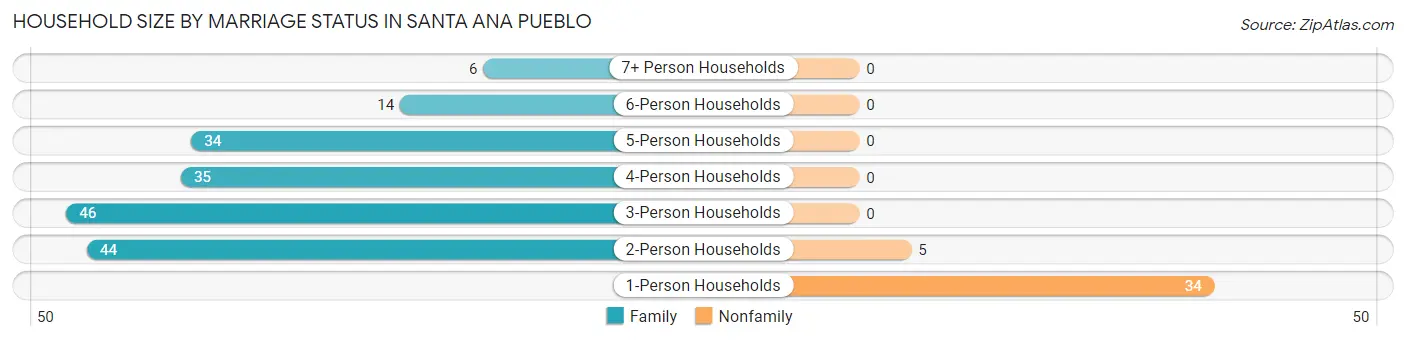
| Household Size | Family Households | Nonfamily Households |
| 1-Person Households | - | 34 (15.6%) |
| 2-Person Households | 44 (20.2%) | 5 (2.3%) |
| 3-Person Households | 46 (21.1%) | 0 (0.0%) |
| 4-Person Households | 35 (16.1%) | 0 (0.0%) |
| 5-Person Households | 34 (15.6%) | 0 (0.0%) |
| 6-Person Households | 14 (6.4%) | 0 (0.0%) |
| 7+ Person Households | 6 (2.8%) | 0 (0.0%) |
| Total | 179 (82.1%) | 39 (17.9%) |
Female Fertility in Santa Ana Pueblo
Fertility by Age in Santa Ana Pueblo
Average fertility rate in Santa Ana Pueblo is 142.0 births per 1,000 women. Women in the age bracket of 15 to 19 years have the highest fertility rate with 250.0 births per 1,000 women. Women in the age bracket of 20 to 34 years acount for 55.2% of all women with births.
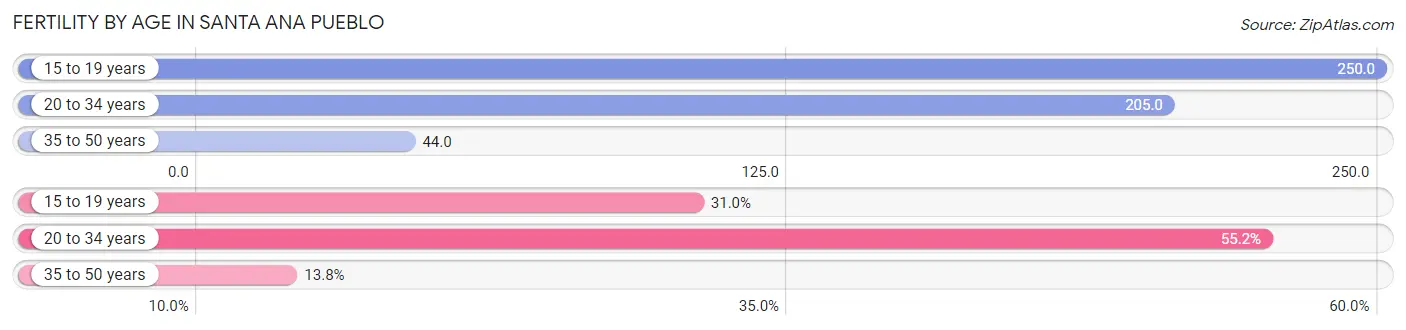
| Age Bracket | Women with Births | Births / 1,000 Women |
| 15 to 19 years | 9 (31.0%) | 250.0 |
| 20 to 34 years | 16 (55.2%) | 205.0 |
| 35 to 50 years | 4 (13.8%) | 44.0 |
| Total | 29 (100.0%) | 142.0 |
Fertility by Age by Marriage Status in Santa Ana Pueblo
13.8% of women with births (29) in Santa Ana Pueblo are married. The highest percentage of unmarried women with births falls into 15 to 19 years age bracket with 100.0% of them unmarried at the time of birth, while the lowest percentage of unmarried women with births belong to 35 to 50 years age bracket with 0.0% of them unmarried.
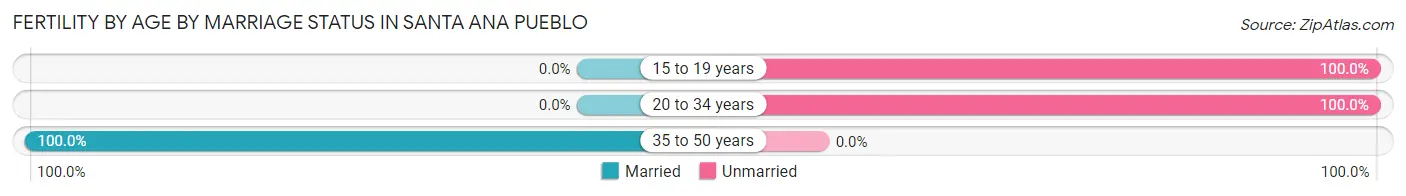
| Age Bracket | Married | Unmarried |
| 15 to 19 years | 0 (0.0%) | 9 (100.0%) |
| 20 to 34 years | 0 (0.0%) | 16 (100.0%) |
| 35 to 50 years | 4 (100.0%) | 0 (0.0%) |
| Total | 4 (13.8%) | 25 (86.2%) |
Fertility by Education in Santa Ana Pueblo
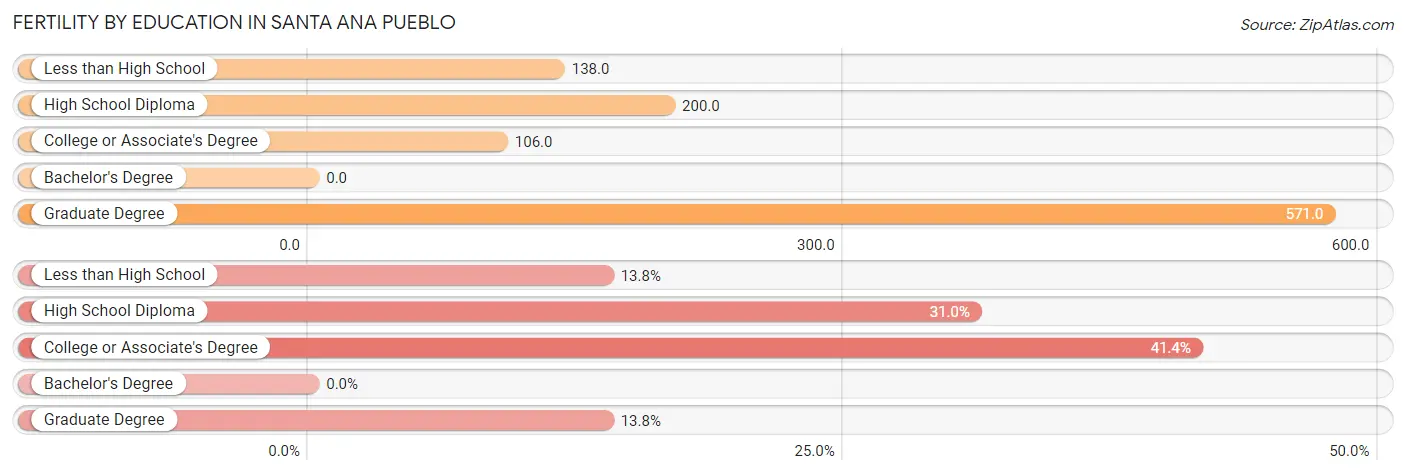
| Educational Attainment | Women with Births | Births / 1,000 Women |
| Less than High School | 4 (13.8%) | 138.0 |
| High School Diploma | 9 (31.0%) | 200.0 |
| College or Associate's Degree | 12 (41.4%) | 106.0 |
| Bachelor's Degree | 0 (0.0%) | 0.0 |
| Graduate Degree | 4 (13.8%) | 571.0 |
| Total | 29 (100.0%) | 142.0 |
Fertility by Education by Marriage Status in Santa Ana Pueblo
86.2% of women with births in Santa Ana Pueblo are unmarried. Women with the educational attainment of graduate degree are most likely to be married with 100.0% of them married at childbirth, while women with the educational attainment of less than high school are least likely to be married with 100.0% of them unmarried at childbirth.
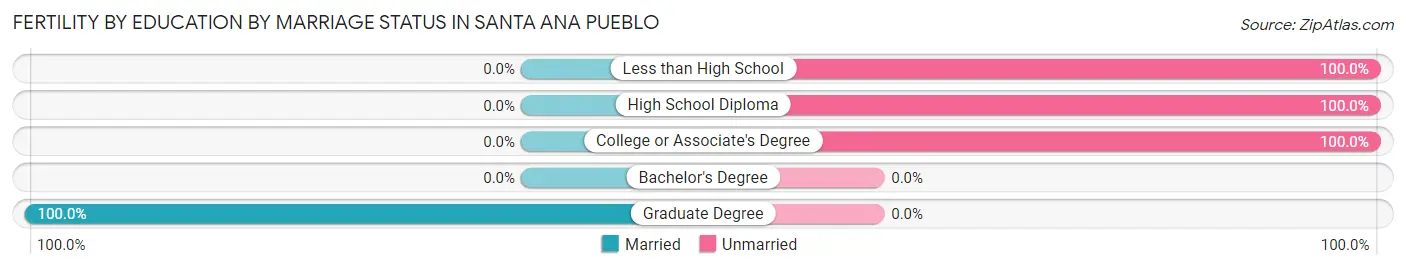
| Educational Attainment | Married | Unmarried |
| Less than High School | 0 (0.0%) | 4 (100.0%) |
| High School Diploma | 0 (0.0%) | 9 (100.0%) |
| College or Associate's Degree | 0 (0.0%) | 12 (100.0%) |
| Bachelor's Degree | 0 (0.0%) | 0 (0.0%) |
| Graduate Degree | 4 (100.0%) | 0 (0.0%) |
| Total | 4 (13.8%) | 25 (86.2%) |
Employment Characteristics in Santa Ana Pueblo
Employment by Class of Employer in Santa Ana Pueblo
Among the 476 employed individuals in Santa Ana Pueblo, private company employees (218 | 45.8%), local government employees (95 | 20.0%), and federal government employees (81 | 17.0%) make up the most common classes of employment.
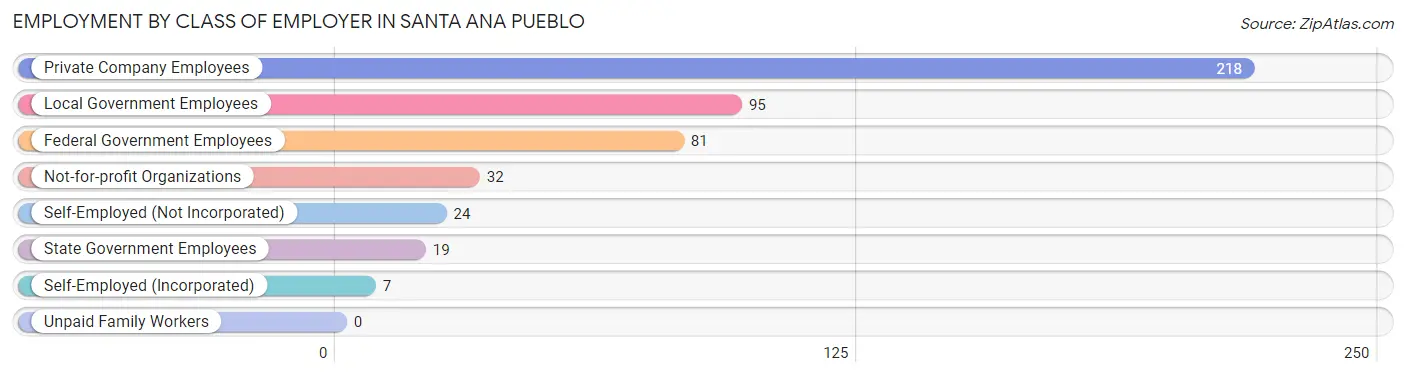
| Employer Class | # Employees | % Employees |
| Private Company Employees | 218 | 45.8% |
| Self-Employed (Incorporated) | 7 | 1.5% |
| Self-Employed (Not Incorporated) | 24 | 5.0% |
| Not-for-profit Organizations | 32 | 6.7% |
| Local Government Employees | 95 | 20.0% |
| State Government Employees | 19 | 4.0% |
| Federal Government Employees | 81 | 17.0% |
| Unpaid Family Workers | 0 | 0.0% |
| Total | 476 | 100.0% |
Employment Status by Age in Santa Ana Pueblo
According to the labor force statistics for Santa Ana Pueblo, out of the total population over 16 years of age (760), 66.1% or 502 individuals are in the labor force, with 4.8% or 24 of them unemployed. The age group with the highest labor force participation rate is 55 to 59 years, with 100.0% or 20 individuals in the labor force. Within the labor force, the 16 to 19 years age range has the highest percentage of unemployed individuals, with 11.1% or 3 of them being unemployed.
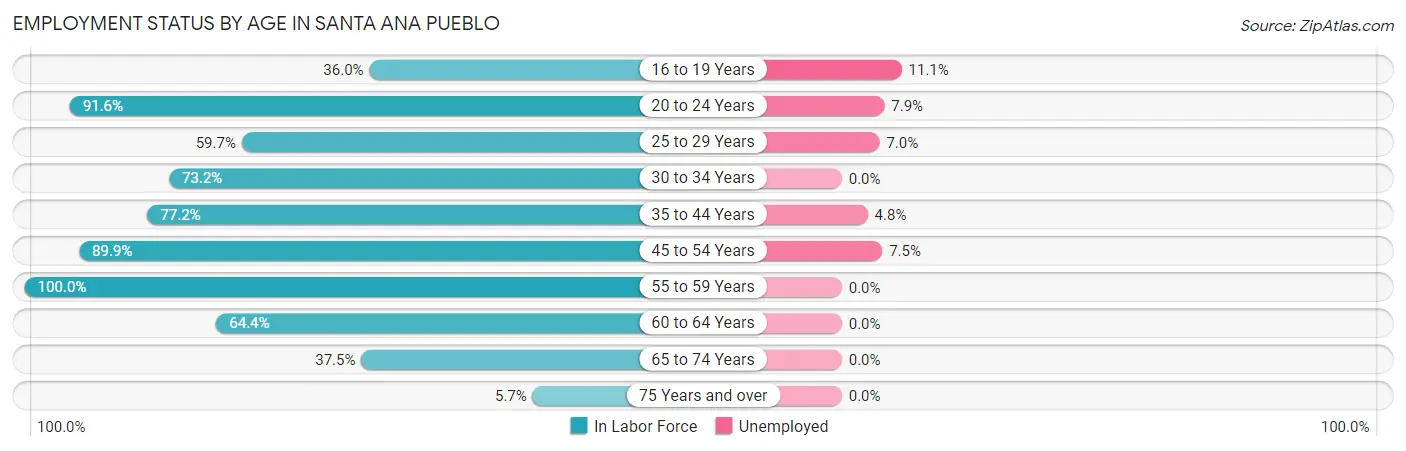
| Age Bracket | In Labor Force | Unemployed |
| 16 to 19 Years | 27 (36.0%) | 3 (11.1%) |
| 20 to 24 Years | 76 (91.6%) | 6 (7.9%) |
| 25 to 29 Years | 43 (59.7%) | 3 (7.0%) |
| 30 to 34 Years | 52 (73.2%) | 0 (0.0%) |
| 35 to 44 Years | 125 (77.2%) | 6 (4.8%) |
| 45 to 54 Years | 80 (89.9%) | 6 (7.5%) |
| 55 to 59 Years | 20 (100.0%) | 0 (0.0%) |
| 60 to 64 Years | 47 (64.4%) | 0 (0.0%) |
| 65 to 74 Years | 30 (37.5%) | 0 (0.0%) |
| 75 Years and over | 2 (5.7%) | 0 (0.0%) |
| Total | 502 (66.1%) | 24 (4.8%) |
Employment Status by Educational Attainment in Santa Ana Pueblo
According to labor force statistics for Santa Ana Pueblo, 75.4% of individuals (367) out of the total population between 25 and 64 years of age (487) are in the labor force, with 4.1% or 15 of them being unemployed. The group with the highest labor force participation rate are those with the educational attainment of bachelor's degree or higher, with 83.7% or 36 individuals in the labor force. Within the labor force, individuals with high school diploma education have the highest percentage of unemployment, with 6.5% or 7 of them being unemployed.
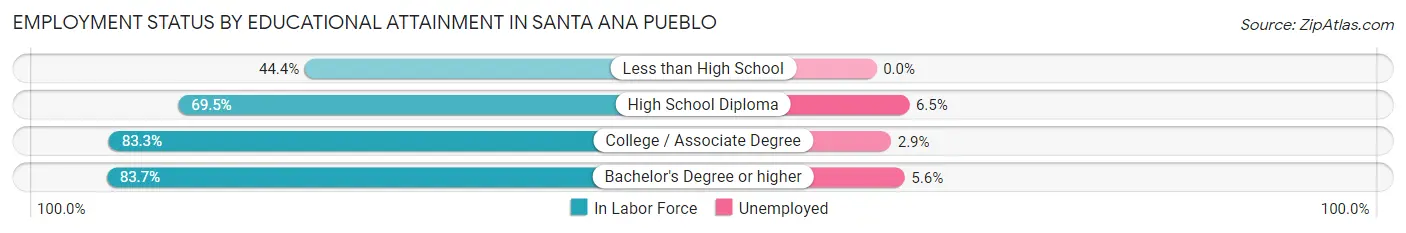
| Educational Attainment | In Labor Force | Unemployed |
| Less than High School | 20 (44.4%) | 0 (0.0%) |
| High School Diploma | 107 (69.5%) | 10 (6.5%) |
| College / Associate Degree | 204 (83.3%) | 7 (2.9%) |
| Bachelor's Degree or higher | 36 (83.7%) | 2 (5.6%) |
| Total | 367 (75.4%) | 20 (4.1%) |
Employment Occupations by Sex in Santa Ana Pueblo
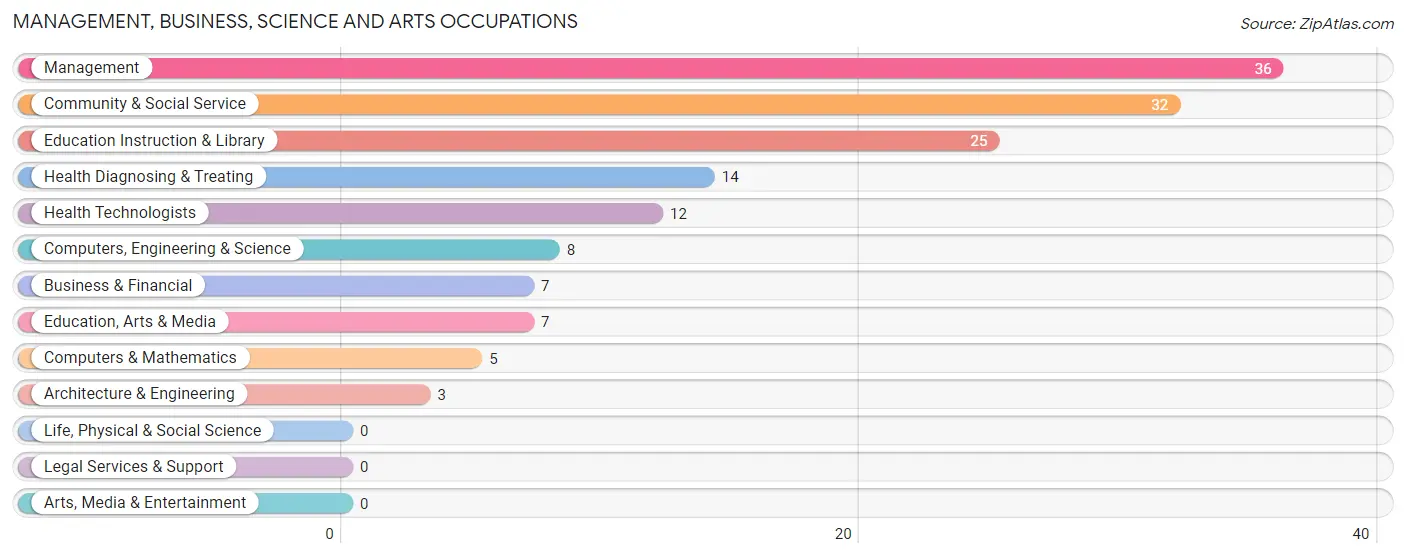
Management, Business, Science and Arts Occupations
The most common Management, Business, Science and Arts occupations in Santa Ana Pueblo are Management (36 | 7.5%), Community & Social Service (32 | 6.7%), Education Instruction & Library (25 | 5.2%), Health Diagnosing & Treating (14 | 2.9%), and Health Technologists (12 | 2.5%).
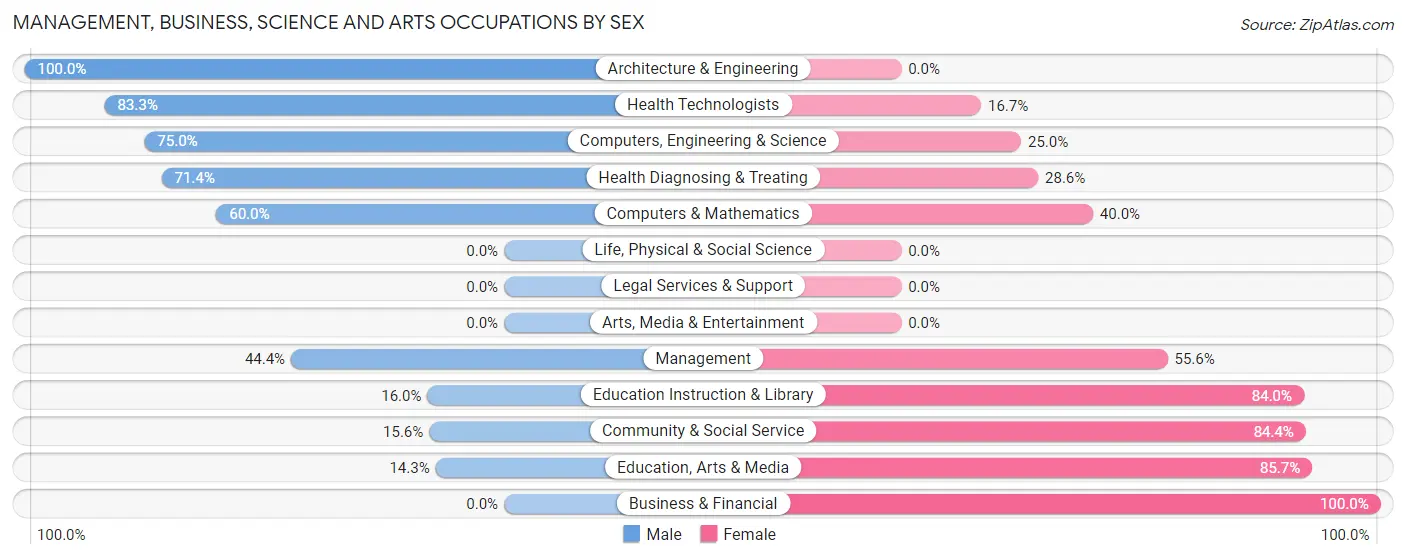
Management, Business, Science and Arts Occupations by Sex
Within the Management, Business, Science and Arts occupations in Santa Ana Pueblo, the most male-oriented occupations are Architecture & Engineering (100.0%), Health Technologists (83.3%), and Computers, Engineering & Science (75.0%), while the most female-oriented occupations are Business & Financial (100.0%), Education, Arts & Media (85.7%), and Community & Social Service (84.4%).
| Occupation | Male | Female |
| Management | 16 (44.4%) | 20 (55.6%) |
| Business & Financial | 0 (0.0%) | 7 (100.0%) |
| Computers, Engineering & Science | 6 (75.0%) | 2 (25.0%) |
| Computers & Mathematics | 3 (60.0%) | 2 (40.0%) |
| Architecture & Engineering | 3 (100.0%) | 0 (0.0%) |
| Life, Physical & Social Science | 0 (0.0%) | 0 (0.0%) |
| Community & Social Service | 5 (15.6%) | 27 (84.4%) |
| Education, Arts & Media | 1 (14.3%) | 6 (85.7%) |
| Legal Services & Support | 0 (0.0%) | 0 (0.0%) |
| Education Instruction & Library | 4 (16.0%) | 21 (84.0%) |
| Arts, Media & Entertainment | 0 (0.0%) | 0 (0.0%) |
| Health Diagnosing & Treating | 10 (71.4%) | 4 (28.6%) |
| Health Technologists | 10 (83.3%) | 2 (16.7%) |
| Total (Category) | 37 (38.1%) | 60 (61.9%) |
| Total (Overall) | 276 (57.7%) | 202 (42.3%) |
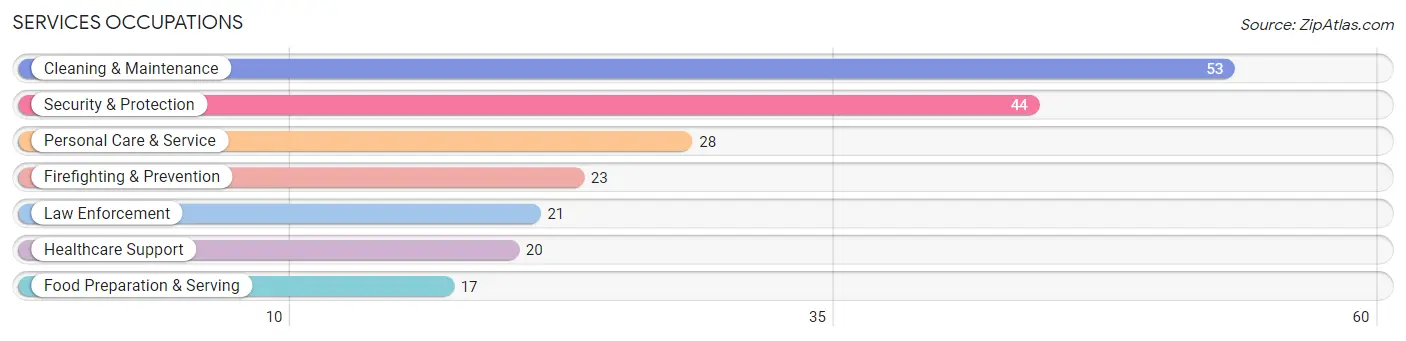
Services Occupations
The most common Services occupations in Santa Ana Pueblo are Cleaning & Maintenance (53 | 11.1%), Security & Protection (44 | 9.2%), Personal Care & Service (28 | 5.9%), Firefighting & Prevention (23 | 4.8%), and Law Enforcement (21 | 4.4%).
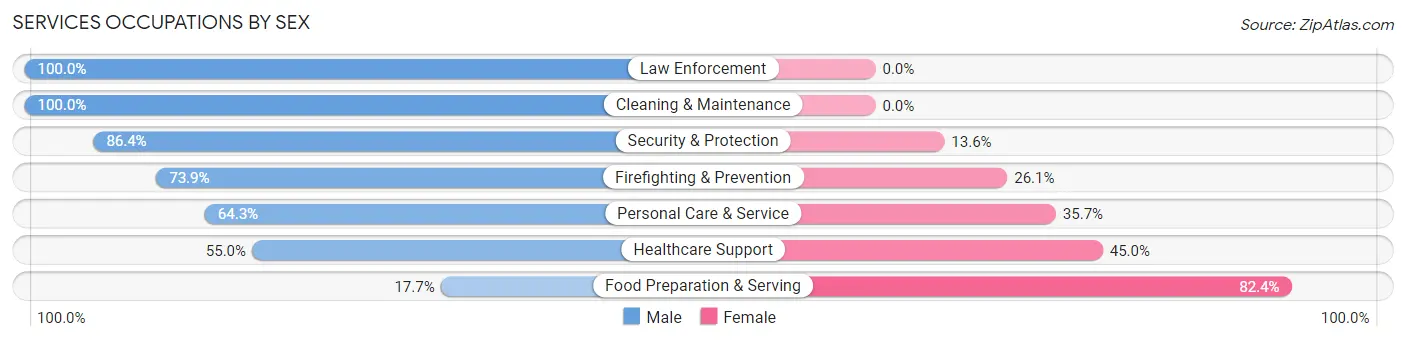
Services Occupations by Sex
Within the Services occupations in Santa Ana Pueblo, the most male-oriented occupations are Law Enforcement (100.0%), Cleaning & Maintenance (100.0%), and Security & Protection (86.4%), while the most female-oriented occupations are Food Preparation & Serving (82.4%), Healthcare Support (45.0%), and Personal Care & Service (35.7%).
| Occupation | Male | Female |
| Healthcare Support | 11 (55.0%) | 9 (45.0%) |
| Security & Protection | 38 (86.4%) | 6 (13.6%) |
| Firefighting & Prevention | 17 (73.9%) | 6 (26.1%) |
| Law Enforcement | 21 (100.0%) | 0 (0.0%) |
| Food Preparation & Serving | 3 (17.6%) | 14 (82.4%) |
| Cleaning & Maintenance | 53 (100.0%) | 0 (0.0%) |
| Personal Care & Service | 18 (64.3%) | 10 (35.7%) |
| Total (Category) | 123 (75.9%) | 39 (24.1%) |
| Total (Overall) | 276 (57.7%) | 202 (42.3%) |
Sales and Office Occupations
The most common Sales and Office occupations in Santa Ana Pueblo are Office & Administration (103 | 21.5%), and Sales & Related (38 | 8.0%).

Sales and Office Occupations by Sex
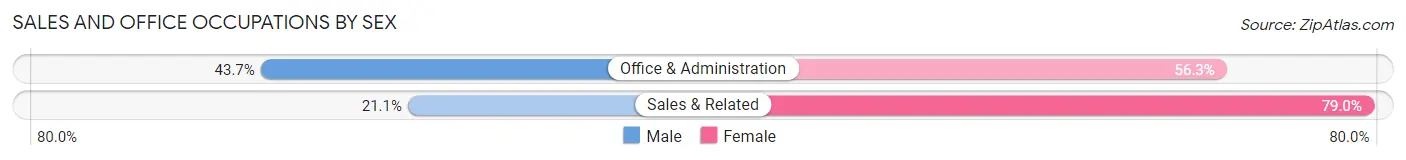
| Occupation | Male | Female |
| Sales & Related | 8 (21.0%) | 30 (78.9%) |
| Office & Administration | 45 (43.7%) | 58 (56.3%) |
| Total (Category) | 53 (37.6%) | 88 (62.4%) |
| Total (Overall) | 276 (57.7%) | 202 (42.3%) |
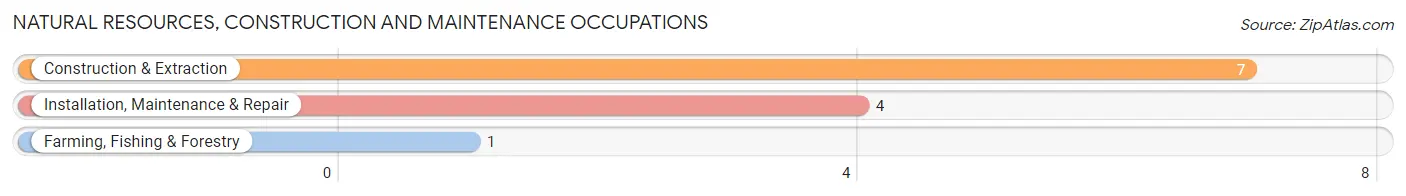
Natural Resources, Construction and Maintenance Occupations
The most common Natural Resources, Construction and Maintenance occupations in Santa Ana Pueblo are Construction & Extraction (7 | 1.5%), Installation, Maintenance & Repair (4 | 0.8%), and Farming, Fishing & Forestry (1 | 0.2%).
Natural Resources, Construction and Maintenance Occupations by Sex
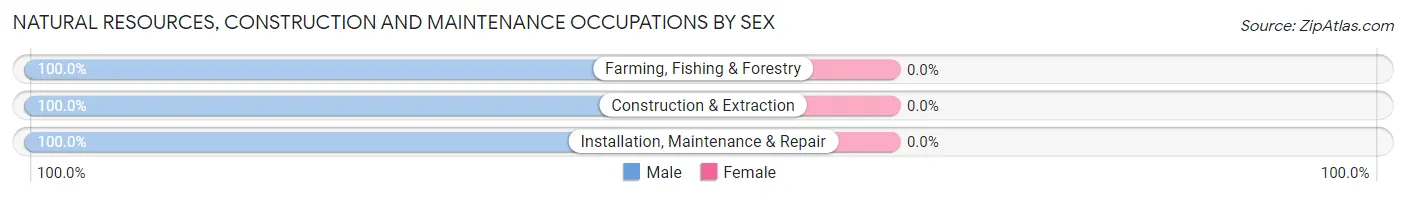
| Occupation | Male | Female |
| Farming, Fishing & Forestry | 1 (100.0%) | 0 (0.0%) |
| Construction & Extraction | 7 (100.0%) | 0 (0.0%) |
| Installation, Maintenance & Repair | 4 (100.0%) | 0 (0.0%) |
| Total (Category) | 12 (100.0%) | 0 (0.0%) |
| Total (Overall) | 276 (57.7%) | 202 (42.3%) |
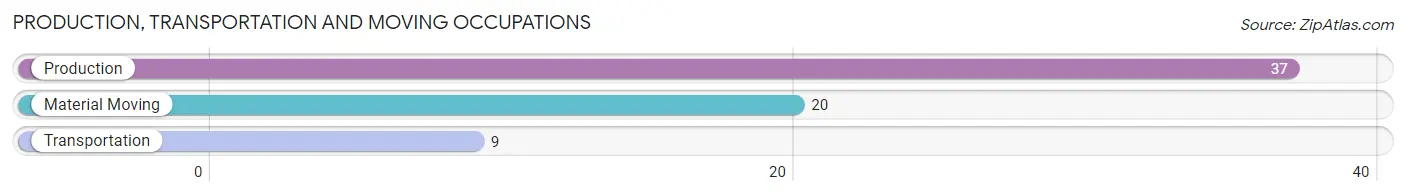
Production, Transportation and Moving Occupations
The most common Production, Transportation and Moving occupations in Santa Ana Pueblo are Production (37 | 7.7%), Material Moving (20 | 4.2%), and Transportation (9 | 1.9%).
Production, Transportation and Moving Occupations by Sex
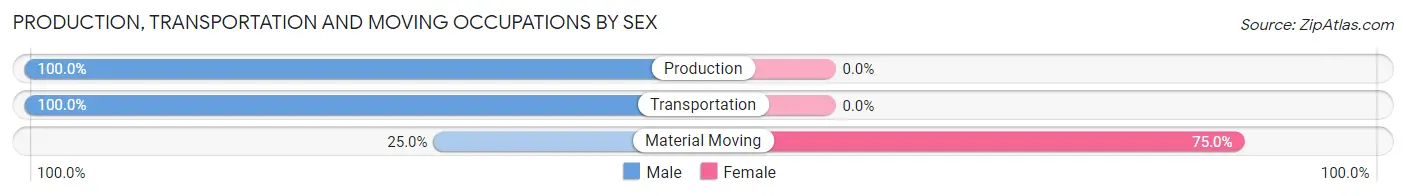
| Occupation | Male | Female |
| Production | 37 (100.0%) | 0 (0.0%) |
| Transportation | 9 (100.0%) | 0 (0.0%) |
| Material Moving | 5 (25.0%) | 15 (75.0%) |
| Total (Category) | 51 (77.3%) | 15 (22.7%) |
| Total (Overall) | 276 (57.7%) | 202 (42.3%) |
Employment Industries by Sex in Santa Ana Pueblo
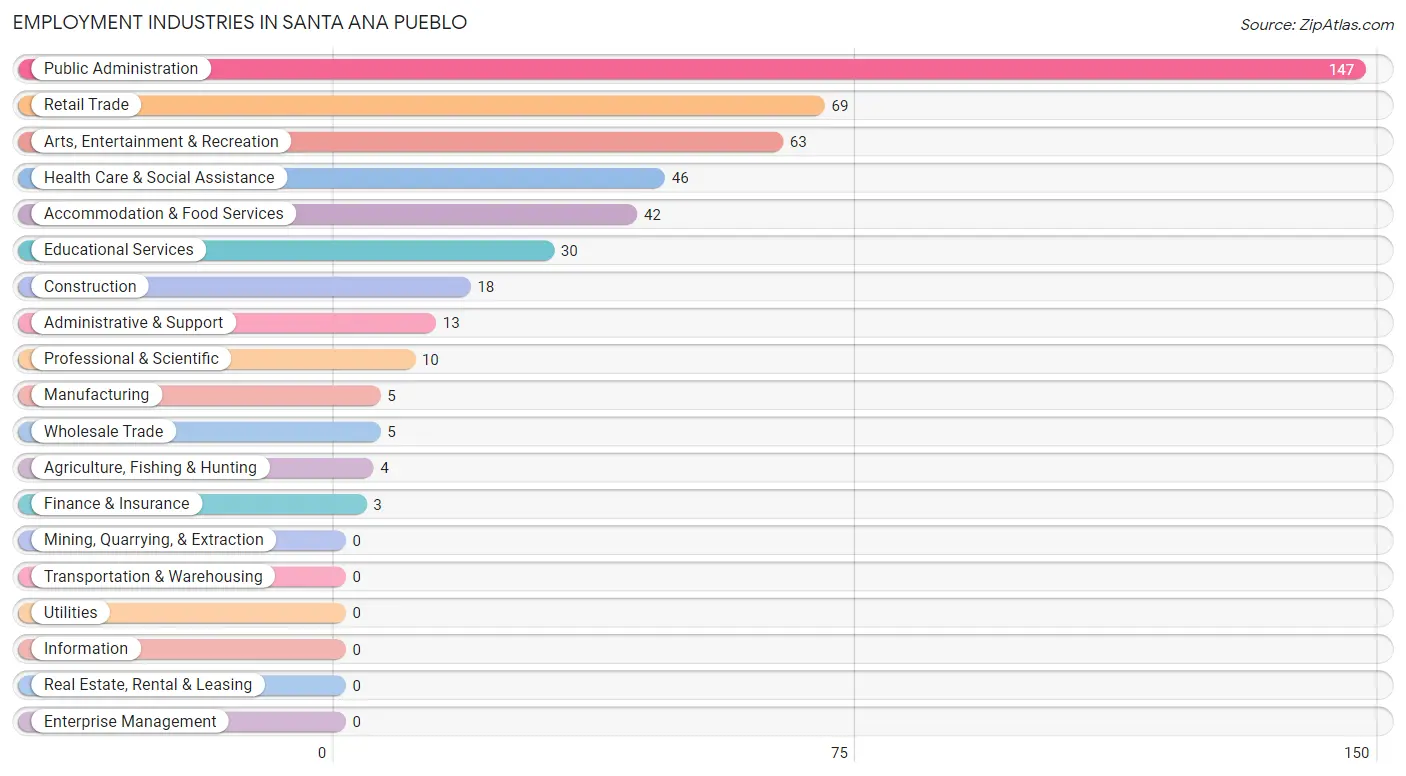
Employment Industries in Santa Ana Pueblo
The major employment industries in Santa Ana Pueblo include Public Administration (147 | 30.7%), Retail Trade (69 | 14.4%), Arts, Entertainment & Recreation (63 | 13.2%), Health Care & Social Assistance (46 | 9.6%), and Accommodation & Food Services (42 | 8.8%).
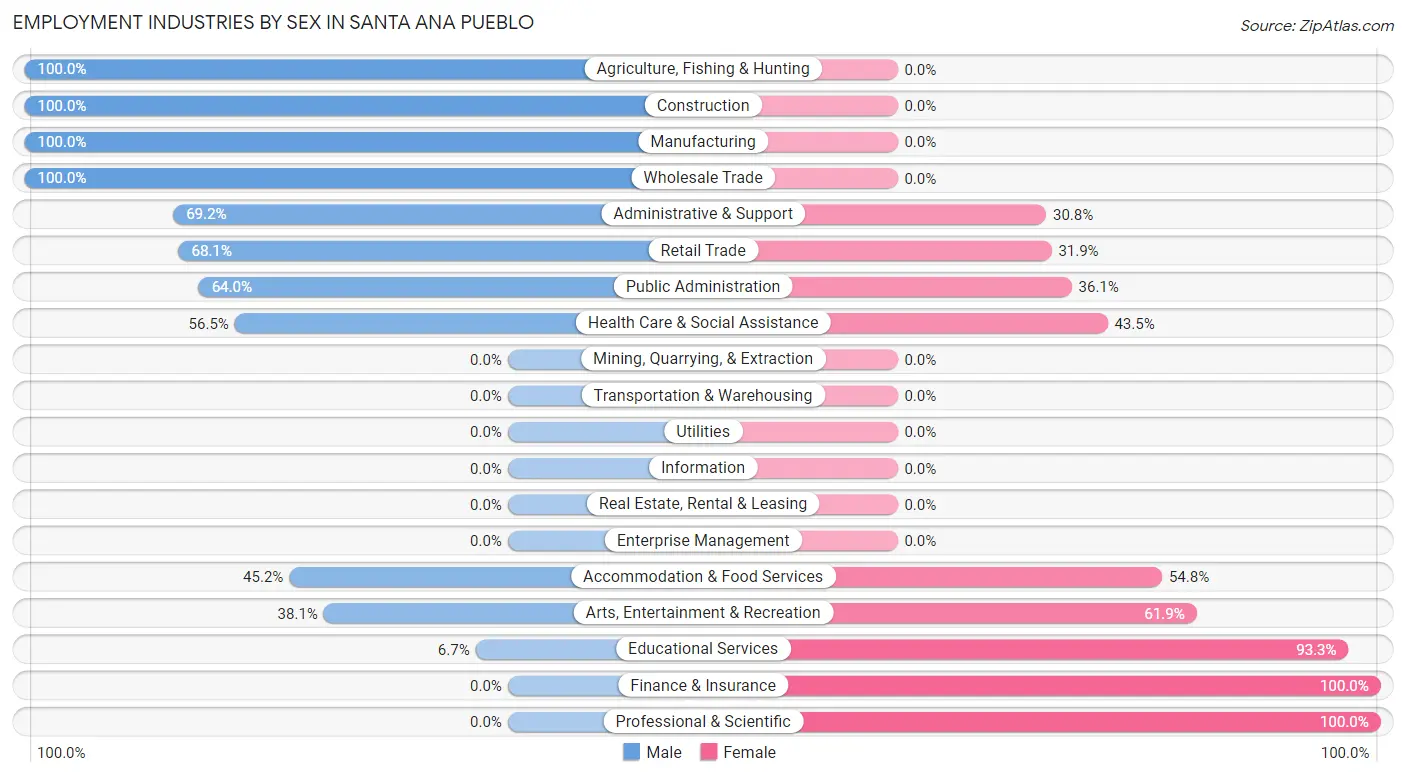
Employment Industries by Sex in Santa Ana Pueblo
The Santa Ana Pueblo industries that see more men than women are Agriculture, Fishing & Hunting (100.0%), Construction (100.0%), and Manufacturing (100.0%), whereas the industries that tend to have a higher number of women are Finance & Insurance (100.0%), Professional & Scientific (100.0%), and Educational Services (93.3%).
| Industry | Male | Female |
| Agriculture, Fishing & Hunting | 4 (100.0%) | 0 (0.0%) |
| Mining, Quarrying, & Extraction | 0 (0.0%) | 0 (0.0%) |
| Construction | 18 (100.0%) | 0 (0.0%) |
| Manufacturing | 5 (100.0%) | 0 (0.0%) |
| Wholesale Trade | 5 (100.0%) | 0 (0.0%) |
| Retail Trade | 47 (68.1%) | 22 (31.9%) |
| Transportation & Warehousing | 0 (0.0%) | 0 (0.0%) |
| Utilities | 0 (0.0%) | 0 (0.0%) |
| Information | 0 (0.0%) | 0 (0.0%) |
| Finance & Insurance | 0 (0.0%) | 3 (100.0%) |
| Real Estate, Rental & Leasing | 0 (0.0%) | 0 (0.0%) |
| Professional & Scientific | 0 (0.0%) | 10 (100.0%) |
| Enterprise Management | 0 (0.0%) | 0 (0.0%) |
| Administrative & Support | 9 (69.2%) | 4 (30.8%) |
| Educational Services | 2 (6.7%) | 28 (93.3%) |
| Health Care & Social Assistance | 26 (56.5%) | 20 (43.5%) |
| Arts, Entertainment & Recreation | 24 (38.1%) | 39 (61.9%) |
| Accommodation & Food Services | 19 (45.2%) | 23 (54.8%) |
| Public Administration | 94 (63.9%) | 53 (36.0%) |
| Total | 276 (57.7%) | 202 (42.3%) |
Education in Santa Ana Pueblo
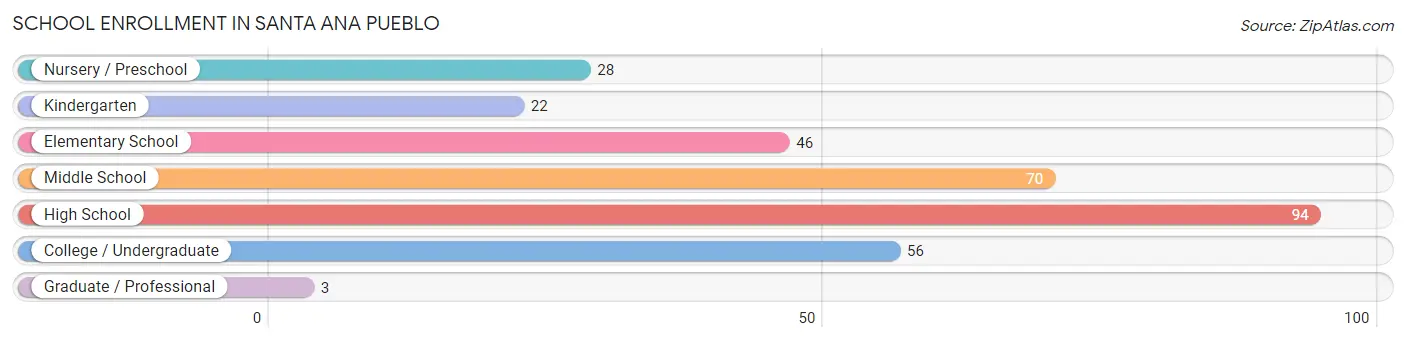
School Enrollment in Santa Ana Pueblo
The most common levels of schooling among the 319 students in Santa Ana Pueblo are high school (94 | 29.5%), middle school (70 | 21.9%), and college / undergraduate (56 | 17.5%).
| School Level | # Students | % Students |
| Nursery / Preschool | 28 | 8.8% |
| Kindergarten | 22 | 6.9% |
| Elementary School | 46 | 14.4% |
| Middle School | 70 | 21.9% |
| High School | 94 | 29.5% |
| College / Undergraduate | 56 | 17.5% |
| Graduate / Professional | 3 | 0.9% |
| Total | 319 | 100.0% |
School Enrollment by Age by Funding Source in Santa Ana Pueblo
Out of a total of 319 students who are enrolled in schools in Santa Ana Pueblo, 8 (2.5%) attend a private institution, while the remaining 311 (97.5%) are enrolled in public schools. The age group of 15 to 17 year olds has the highest likelihood of being enrolled in private schools, with 6 (11.3% in the age bracket) enrolled. Conversely, the age group of 3 to 4 year olds has the lowest likelihood of being enrolled in a private school, with 28 (100.0% in the age bracket) attending a public institution.
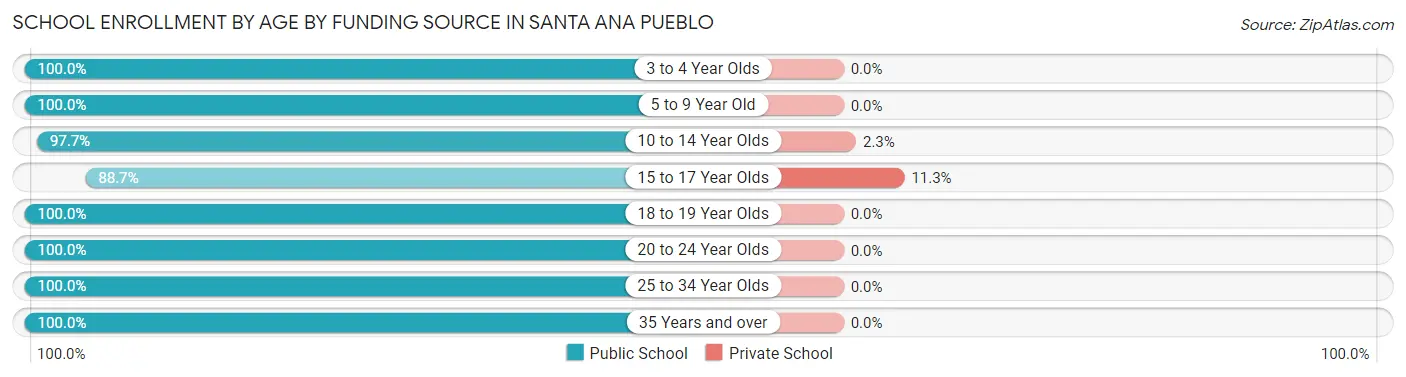
| Age Bracket | Public School | Private School |
| 3 to 4 Year Olds | 28 (100.0%) | 0 (0.0%) |
| 5 to 9 Year Old | 68 (100.0%) | 0 (0.0%) |
| 10 to 14 Year Olds | 85 (97.7%) | 2 (2.3%) |
| 15 to 17 Year Olds | 47 (88.7%) | 6 (11.3%) |
| 18 to 19 Year Olds | 37 (100.0%) | 0 (0.0%) |
| 20 to 24 Year Olds | 22 (100.0%) | 0 (0.0%) |
| 25 to 34 Year Olds | 8 (100.0%) | 0 (0.0%) |
| 35 Years and over | 16 (100.0%) | 0 (0.0%) |
| Total | 311 (97.5%) | 8 (2.5%) |
Educational Attainment by Field of Study in Santa Ana Pueblo
Science & technology (11 | 17.7%), business (11 | 17.7%), education (10 | 16.1%), visual & performing arts (8 | 12.9%), and social sciences (6 | 9.7%) are the most common fields of study among 62 individuals in Santa Ana Pueblo who have obtained a bachelor's degree or higher.
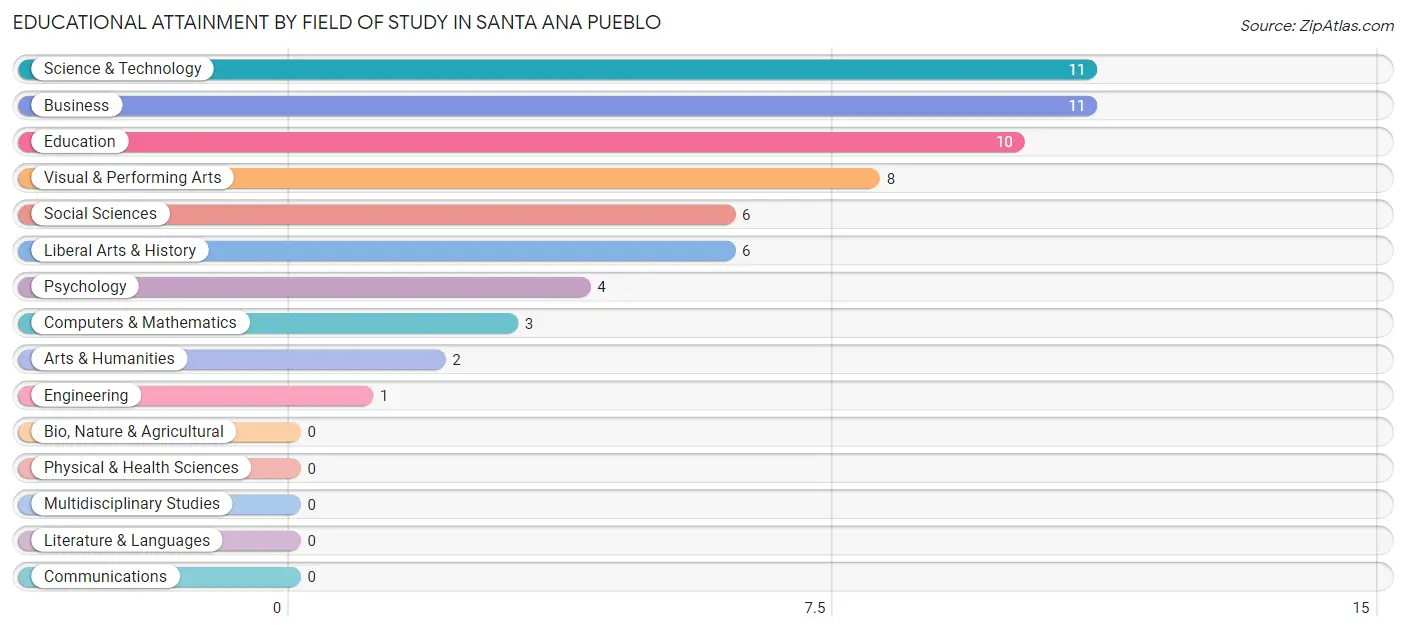
| Field of Study | # Graduates | % Graduates |
| Computers & Mathematics | 3 | 4.8% |
| Bio, Nature & Agricultural | 0 | 0.0% |
| Physical & Health Sciences | 0 | 0.0% |
| Psychology | 4 | 6.5% |
| Social Sciences | 6 | 9.7% |
| Engineering | 1 | 1.6% |
| Multidisciplinary Studies | 0 | 0.0% |
| Science & Technology | 11 | 17.7% |
| Business | 11 | 17.7% |
| Education | 10 | 16.1% |
| Literature & Languages | 0 | 0.0% |
| Liberal Arts & History | 6 | 9.7% |
| Visual & Performing Arts | 8 | 12.9% |
| Communications | 0 | 0.0% |
| Arts & Humanities | 2 | 3.2% |
| Total | 62 | 100.0% |
Transportation & Commute in Santa Ana Pueblo
Vehicle Availability by Sex in Santa Ana Pueblo
The most prevalent vehicle ownership categories in Santa Ana Pueblo are males with 3 vehicles (124, accounting for 44.9%) and females with 3 vehicles (65, making up 62.0%).
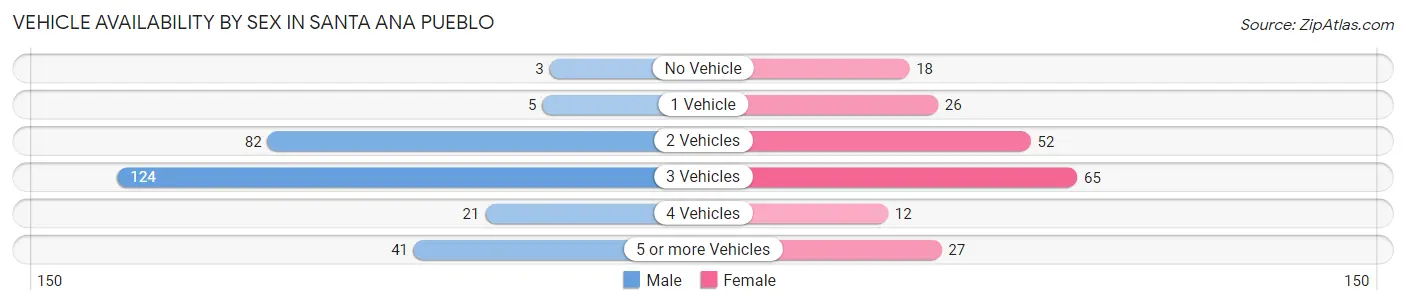
| Vehicles Available | Male | Female |
| No Vehicle | 3 (1.1%) | 18 (9.0%) |
| 1 Vehicle | 5 (1.8%) | 26 (13.0%) |
| 2 Vehicles | 82 (29.7%) | 52 (26.0%) |
| 3 Vehicles | 124 (44.9%) | 65 (32.5%) |
| 4 Vehicles | 21 (7.6%) | 12 (6.0%) |
| 5 or more Vehicles | 41 (14.9%) | 27 (13.5%) |
| Total | 276 (100.0%) | 200 (100.0%) |
Commute Time in Santa Ana Pueblo
The most frequently occuring commute durations in Santa Ana Pueblo are 10 to 14 minutes (104 commuters, 23.3%), 15 to 19 minutes (88 commuters, 19.7%), and 5 to 9 minutes (71 commuters, 15.9%).
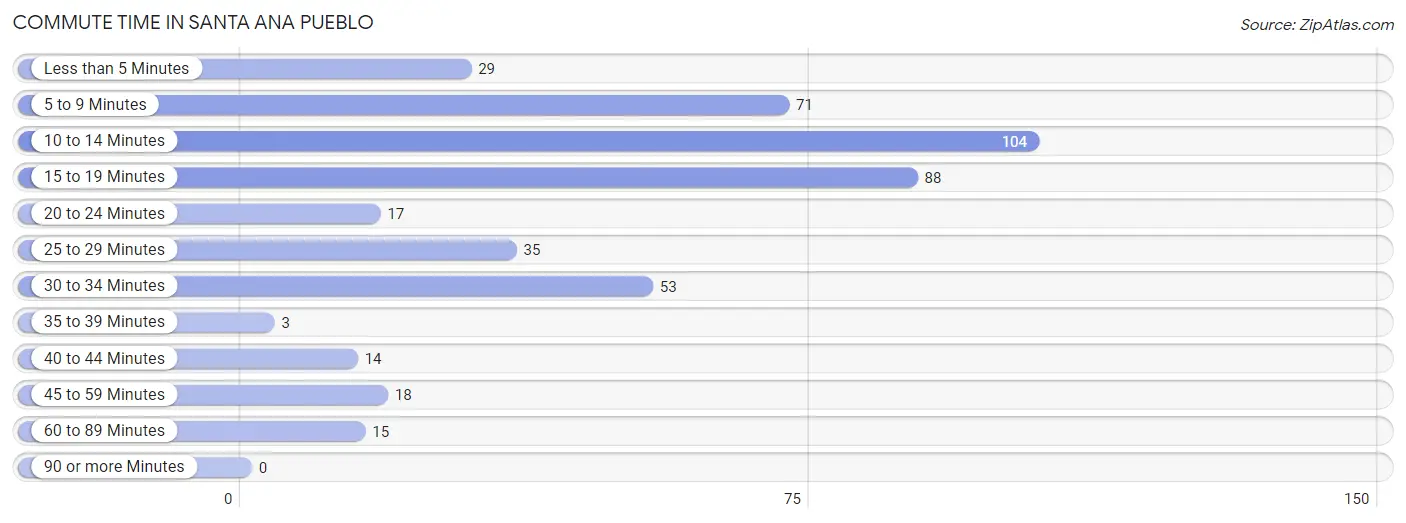
| Commute Time | # Commuters | % Commuters |
| Less than 5 Minutes | 29 | 6.5% |
| 5 to 9 Minutes | 71 | 15.9% |
| 10 to 14 Minutes | 104 | 23.3% |
| 15 to 19 Minutes | 88 | 19.7% |
| 20 to 24 Minutes | 17 | 3.8% |
| 25 to 29 Minutes | 35 | 7.8% |
| 30 to 34 Minutes | 53 | 11.9% |
| 35 to 39 Minutes | 3 | 0.7% |
| 40 to 44 Minutes | 14 | 3.1% |
| 45 to 59 Minutes | 18 | 4.0% |
| 60 to 89 Minutes | 15 | 3.4% |
| 90 or more Minutes | 0 | 0.0% |
Commute Time by Sex in Santa Ana Pueblo
The most common commute times in Santa Ana Pueblo are 5 to 9 minutes (67 commuters, 24.9%) for males and 10 to 14 minutes (49 commuters, 27.5%) for females.
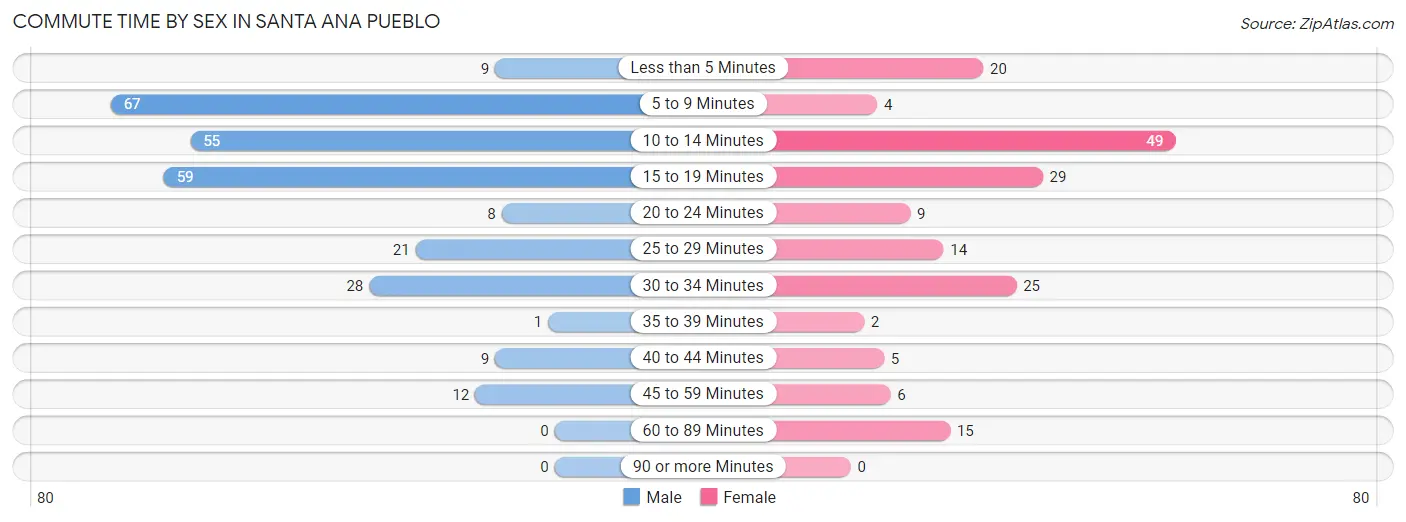
| Commute Time | Male | Female |
| Less than 5 Minutes | 9 (3.4%) | 20 (11.2%) |
| 5 to 9 Minutes | 67 (24.9%) | 4 (2.2%) |
| 10 to 14 Minutes | 55 (20.4%) | 49 (27.5%) |
| 15 to 19 Minutes | 59 (21.9%) | 29 (16.3%) |
| 20 to 24 Minutes | 8 (3.0%) | 9 (5.1%) |
| 25 to 29 Minutes | 21 (7.8%) | 14 (7.9%) |
| 30 to 34 Minutes | 28 (10.4%) | 25 (14.0%) |
| 35 to 39 Minutes | 1 (0.4%) | 2 (1.1%) |
| 40 to 44 Minutes | 9 (3.4%) | 5 (2.8%) |
| 45 to 59 Minutes | 12 (4.5%) | 6 (3.4%) |
| 60 to 89 Minutes | 0 (0.0%) | 15 (8.4%) |
| 90 or more Minutes | 0 (0.0%) | 0 (0.0%) |
Time of Departure to Work by Sex in Santa Ana Pueblo
The most frequent times of departure to work in Santa Ana Pueblo are 5:30 AM to 5:59 AM (73, 27.1%) for males and 7:00 AM to 7:29 AM (35, 19.7%) for females.
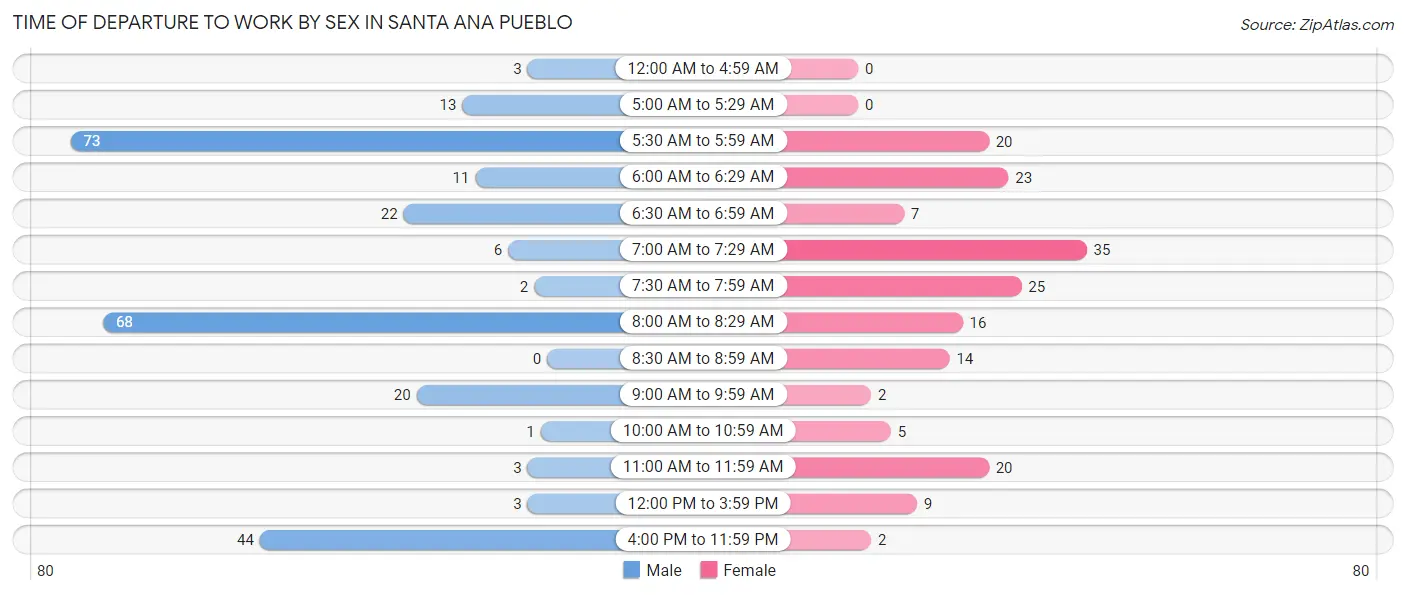
| Time of Departure | Male | Female |
| 12:00 AM to 4:59 AM | 3 (1.1%) | 0 (0.0%) |
| 5:00 AM to 5:29 AM | 13 (4.8%) | 0 (0.0%) |
| 5:30 AM to 5:59 AM | 73 (27.1%) | 20 (11.2%) |
| 6:00 AM to 6:29 AM | 11 (4.1%) | 23 (12.9%) |
| 6:30 AM to 6:59 AM | 22 (8.2%) | 7 (3.9%) |
| 7:00 AM to 7:29 AM | 6 (2.2%) | 35 (19.7%) |
| 7:30 AM to 7:59 AM | 2 (0.7%) | 25 (14.0%) |
| 8:00 AM to 8:29 AM | 68 (25.3%) | 16 (9.0%) |
| 8:30 AM to 8:59 AM | 0 (0.0%) | 14 (7.9%) |
| 9:00 AM to 9:59 AM | 20 (7.4%) | 2 (1.1%) |
| 10:00 AM to 10:59 AM | 1 (0.4%) | 5 (2.8%) |
| 11:00 AM to 11:59 AM | 3 (1.1%) | 20 (11.2%) |
| 12:00 PM to 3:59 PM | 3 (1.1%) | 9 (5.1%) |
| 4:00 PM to 11:59 PM | 44 (16.4%) | 2 (1.1%) |
| Total | 269 (100.0%) | 178 (100.0%) |
Housing Occupancy in Santa Ana Pueblo
Occupancy by Ownership in Santa Ana Pueblo
Of the total 218 dwellings in Santa Ana Pueblo, owner-occupied units account for 182 (83.5%), while renter-occupied units make up 36 (16.5%).
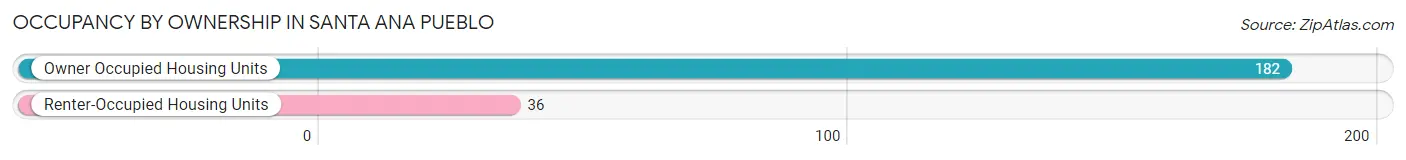
| Occupancy | # Housing Units | % Housing Units |
| Owner Occupied Housing Units | 182 | 83.5% |
| Renter-Occupied Housing Units | 36 | 16.5% |
| Total Occupied Housing Units | 218 | 100.0% |
Occupancy by Household Size in Santa Ana Pueblo
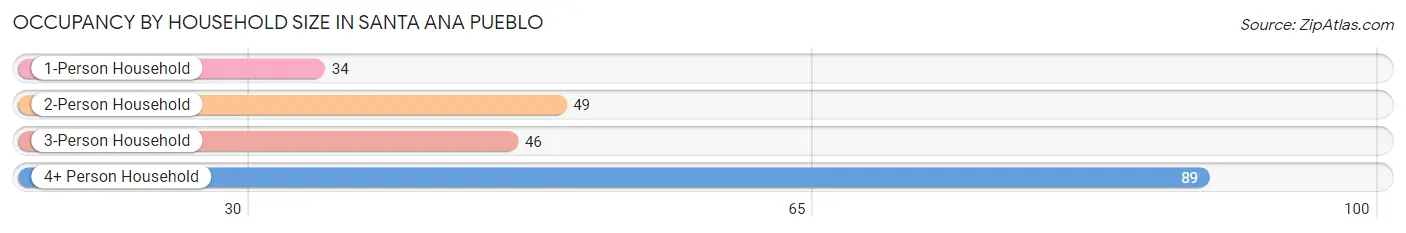
| Household Size | # Housing Units | % Housing Units |
| 1-Person Household | 34 | 15.6% |
| 2-Person Household | 49 | 22.5% |
| 3-Person Household | 46 | 21.1% |
| 4+ Person Household | 89 | 40.8% |
| Total Housing Units | 218 | 100.0% |
Occupancy by Ownership by Household Size in Santa Ana Pueblo
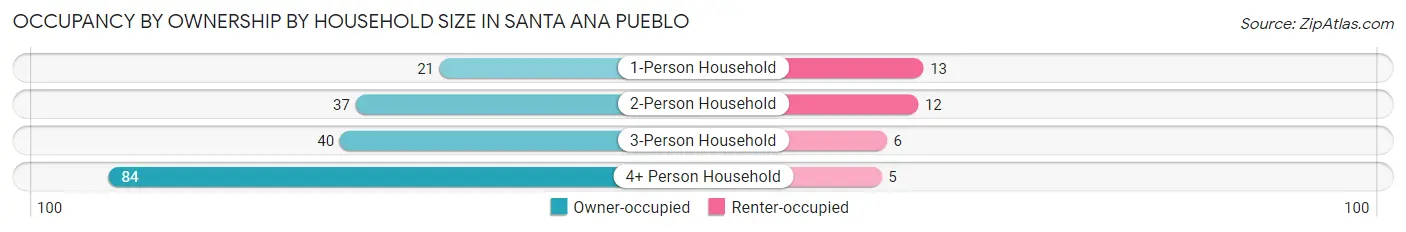
| Household Size | Owner-occupied | Renter-occupied |
| 1-Person Household | 21 (61.8%) | 13 (38.2%) |
| 2-Person Household | 37 (75.5%) | 12 (24.5%) |
| 3-Person Household | 40 (87.0%) | 6 (13.0%) |
| 4+ Person Household | 84 (94.4%) | 5 (5.6%) |
| Total Housing Units | 182 (83.5%) | 36 (16.5%) |
Occupancy by Educational Attainment in Santa Ana Pueblo
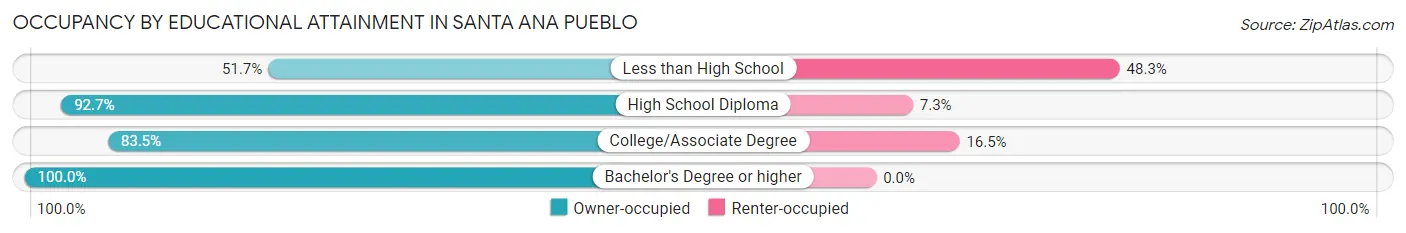
| Household Size | Owner-occupied | Renter-occupied |
| Less than High School | 15 (51.7%) | 14 (48.3%) |
| High School Diploma | 51 (92.7%) | 4 (7.3%) |
| College/Associate Degree | 91 (83.5%) | 18 (16.5%) |
| Bachelor's Degree or higher | 25 (100.0%) | 0 (0.0%) |
Occupancy by Age of Householder in Santa Ana Pueblo
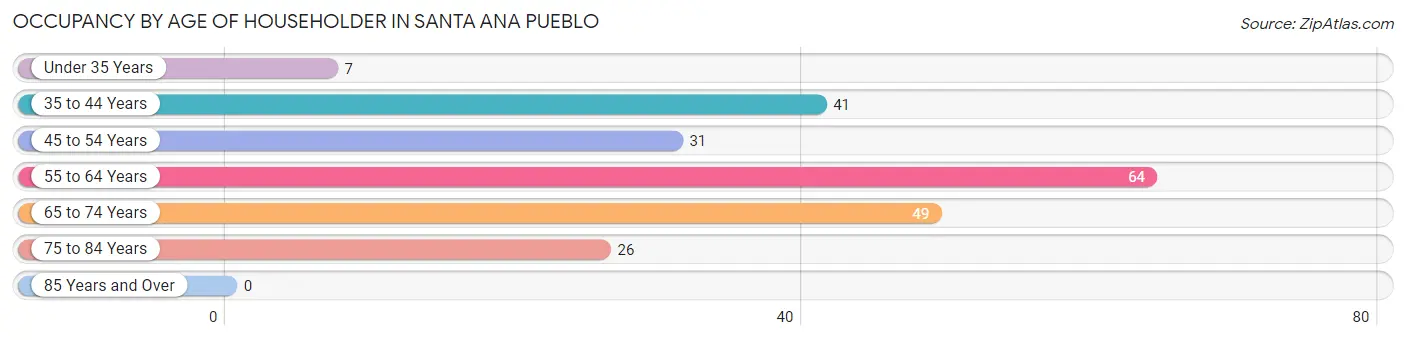
| Age Bracket | # Households | % Households |
| Under 35 Years | 7 | 3.2% |
| 35 to 44 Years | 41 | 18.8% |
| 45 to 54 Years | 31 | 14.2% |
| 55 to 64 Years | 64 | 29.4% |
| 65 to 74 Years | 49 | 22.5% |
| 75 to 84 Years | 26 | 11.9% |
| 85 Years and Over | 0 | 0.0% |
| Total | 218 | 100.0% |
Housing Finances in Santa Ana Pueblo
Median Income by Occupancy in Santa Ana Pueblo
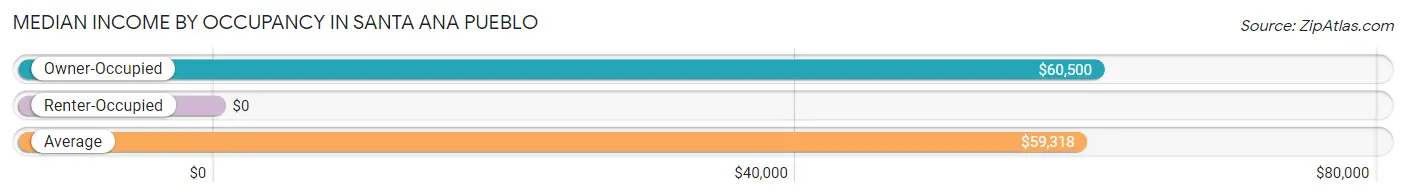
| Occupancy Type | # Households | Median Income |
| Owner-Occupied | 182 (83.5%) | $60,500 |
| Renter-Occupied | 36 (16.5%) | $0 |
| Average | 218 (100.0%) | $59,318 |
Occupancy by Householder Income Bracket in Santa Ana Pueblo
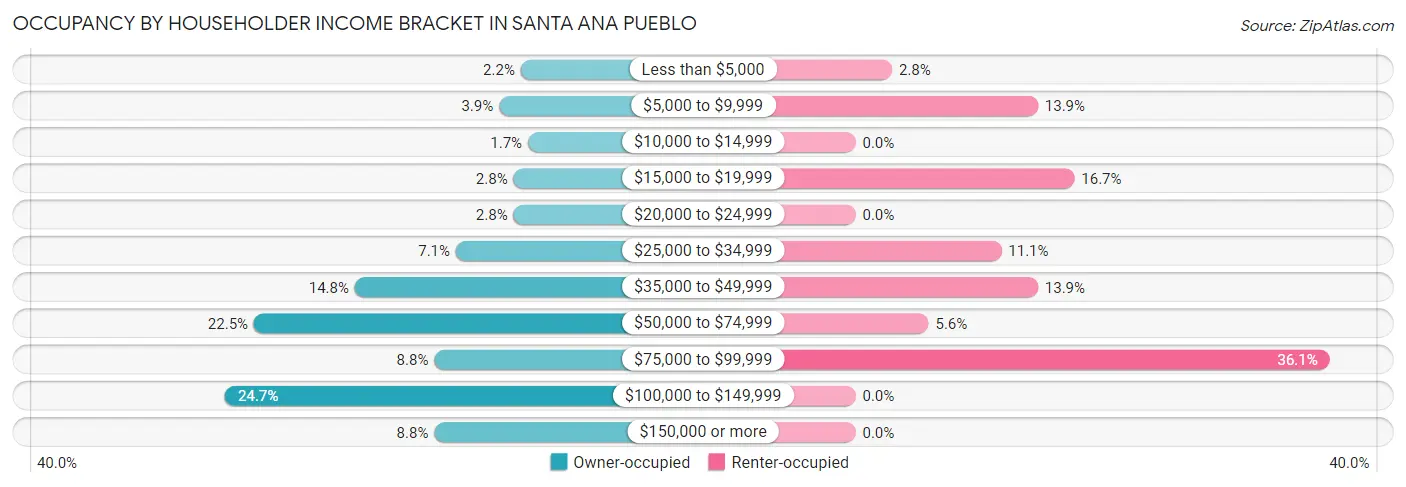
| Income Bracket | Owner-occupied | Renter-occupied |
| Less than $5,000 | 4 (2.2%) | 1 (2.8%) |
| $5,000 to $9,999 | 7 (3.8%) | 5 (13.9%) |
| $10,000 to $14,999 | 3 (1.7%) | 0 (0.0%) |
| $15,000 to $19,999 | 5 (2.8%) | 6 (16.7%) |
| $20,000 to $24,999 | 5 (2.8%) | 0 (0.0%) |
| $25,000 to $34,999 | 13 (7.1%) | 4 (11.1%) |
| $35,000 to $49,999 | 27 (14.8%) | 5 (13.9%) |
| $50,000 to $74,999 | 41 (22.5%) | 2 (5.6%) |
| $75,000 to $99,999 | 16 (8.8%) | 13 (36.1%) |
| $100,000 to $149,999 | 45 (24.7%) | 0 (0.0%) |
| $150,000 or more | 16 (8.8%) | 0 (0.0%) |
| Total | 182 (100.0%) | 36 (100.0%) |
Monthly Housing Cost Tiers in Santa Ana Pueblo
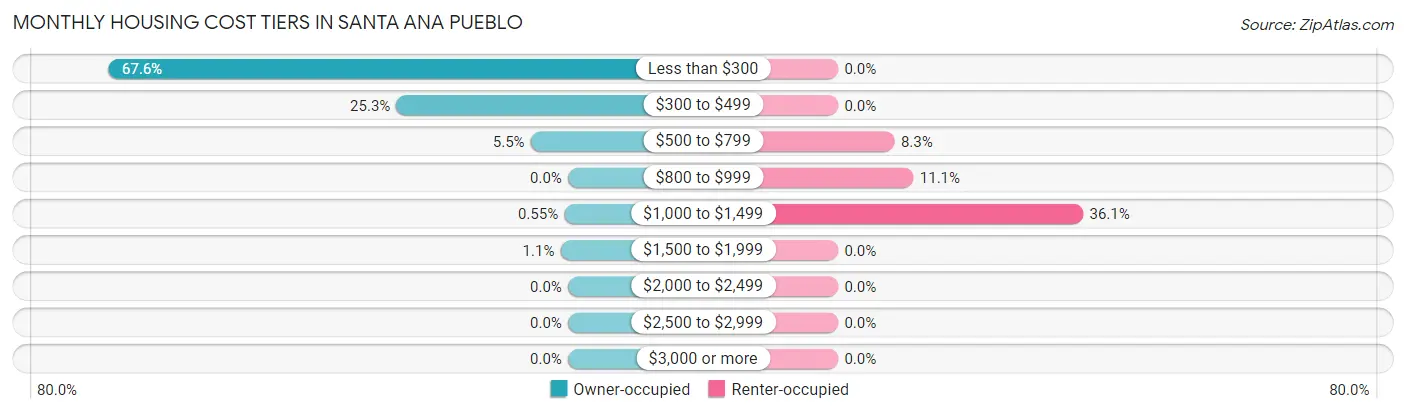
| Monthly Cost | Owner-occupied | Renter-occupied |
| Less than $300 | 123 (67.6%) | 0 (0.0%) |
| $300 to $499 | 46 (25.3%) | 0 (0.0%) |
| $500 to $799 | 10 (5.5%) | 3 (8.3%) |
| $800 to $999 | 0 (0.0%) | 4 (11.1%) |
| $1,000 to $1,499 | 1 (0.5%) | 13 (36.1%) |
| $1,500 to $1,999 | 2 (1.1%) | 0 (0.0%) |
| $2,000 to $2,499 | 0 (0.0%) | 0 (0.0%) |
| $2,500 to $2,999 | 0 (0.0%) | 0 (0.0%) |
| $3,000 or more | 0 (0.0%) | 0 (0.0%) |
| Total | 182 (100.0%) | 36 (100.0%) |
Physical Housing Characteristics in Santa Ana Pueblo
Housing Structures in Santa Ana Pueblo
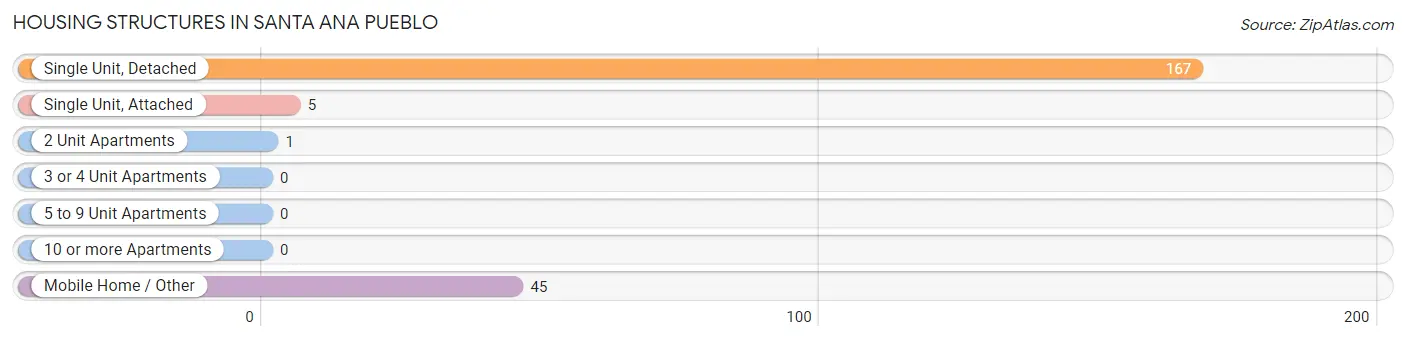
| Structure Type | # Housing Units | % Housing Units |
| Single Unit, Detached | 167 | 76.6% |
| Single Unit, Attached | 5 | 2.3% |
| 2 Unit Apartments | 1 | 0.5% |
| 3 or 4 Unit Apartments | 0 | 0.0% |
| 5 to 9 Unit Apartments | 0 | 0.0% |
| 10 or more Apartments | 0 | 0.0% |
| Mobile Home / Other | 45 | 20.6% |
| Total | 218 | 100.0% |
Housing Structures by Occupancy in Santa Ana Pueblo
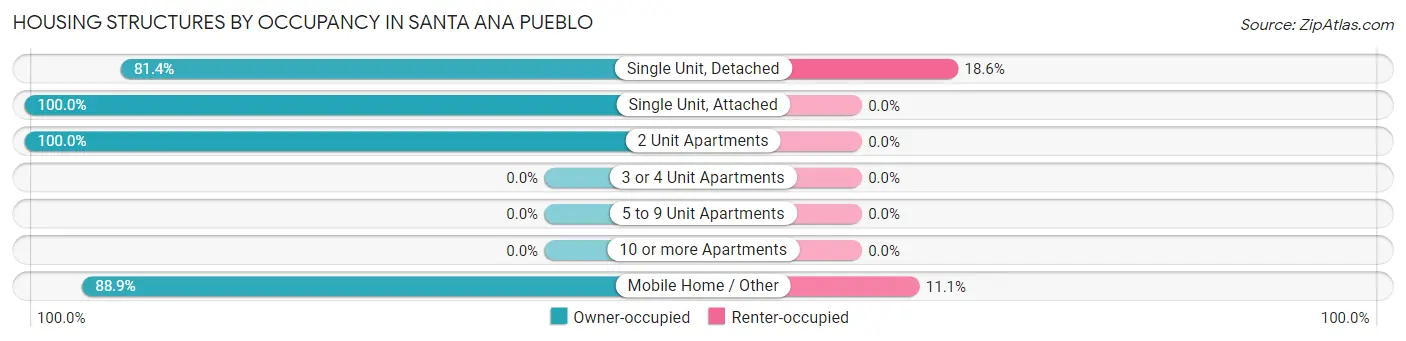
| Structure Type | Owner-occupied | Renter-occupied |
| Single Unit, Detached | 136 (81.4%) | 31 (18.6%) |
| Single Unit, Attached | 5 (100.0%) | 0 (0.0%) |
| 2 Unit Apartments | 1 (100.0%) | 0 (0.0%) |
| 3 or 4 Unit Apartments | 0 (0.0%) | 0 (0.0%) |
| 5 to 9 Unit Apartments | 0 (0.0%) | 0 (0.0%) |
| 10 or more Apartments | 0 (0.0%) | 0 (0.0%) |
| Mobile Home / Other | 40 (88.9%) | 5 (11.1%) |
| Total | 182 (83.5%) | 36 (16.5%) |
Housing Structures by Number of Rooms in Santa Ana Pueblo
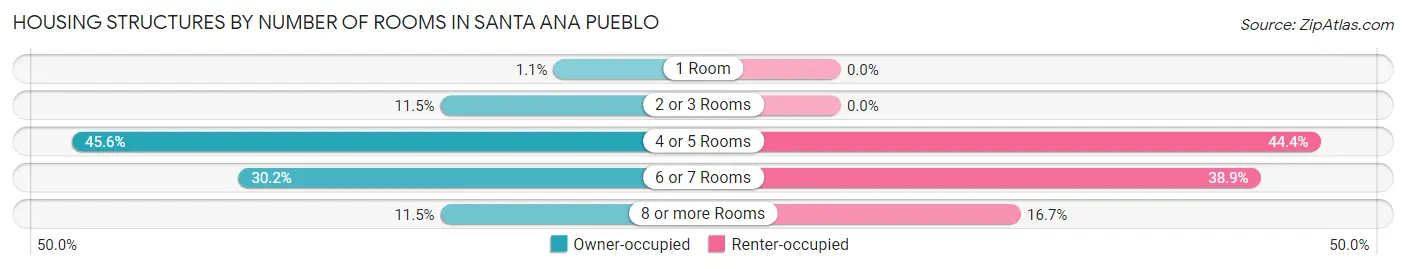
| Number of Rooms | Owner-occupied | Renter-occupied |
| 1 Room | 2 (1.1%) | 0 (0.0%) |
| 2 or 3 Rooms | 21 (11.5%) | 0 (0.0%) |
| 4 or 5 Rooms | 83 (45.6%) | 16 (44.4%) |
| 6 or 7 Rooms | 55 (30.2%) | 14 (38.9%) |
| 8 or more Rooms | 21 (11.5%) | 6 (16.7%) |
| Total | 182 (100.0%) | 36 (100.0%) |
Housing Structure by Heating Type in Santa Ana Pueblo
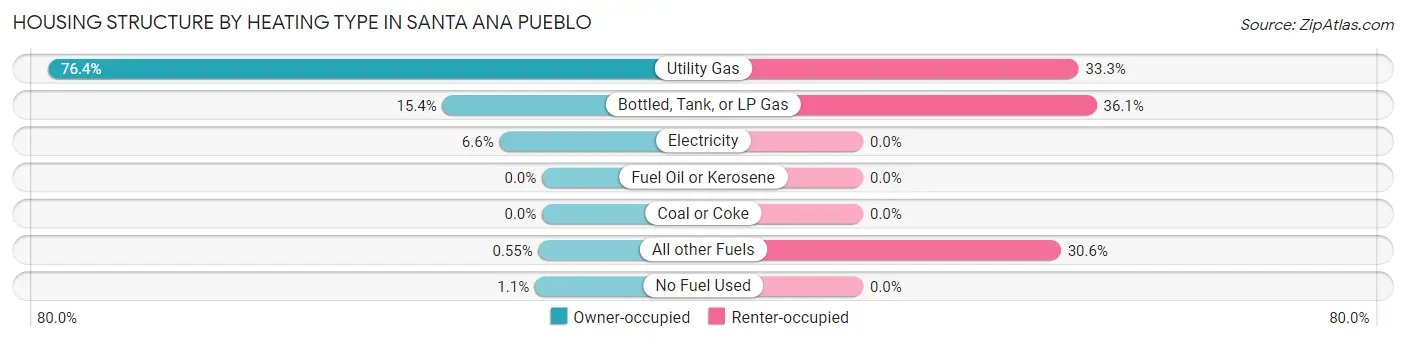
| Heating Type | Owner-occupied | Renter-occupied |
| Utility Gas | 139 (76.4%) | 12 (33.3%) |
| Bottled, Tank, or LP Gas | 28 (15.4%) | 13 (36.1%) |
| Electricity | 12 (6.6%) | 0 (0.0%) |
| Fuel Oil or Kerosene | 0 (0.0%) | 0 (0.0%) |
| Coal or Coke | 0 (0.0%) | 0 (0.0%) |
| All other Fuels | 1 (0.5%) | 11 (30.6%) |
| No Fuel Used | 2 (1.1%) | 0 (0.0%) |
| Total | 182 (100.0%) | 36 (100.0%) |
Household Vehicle Usage in Santa Ana Pueblo
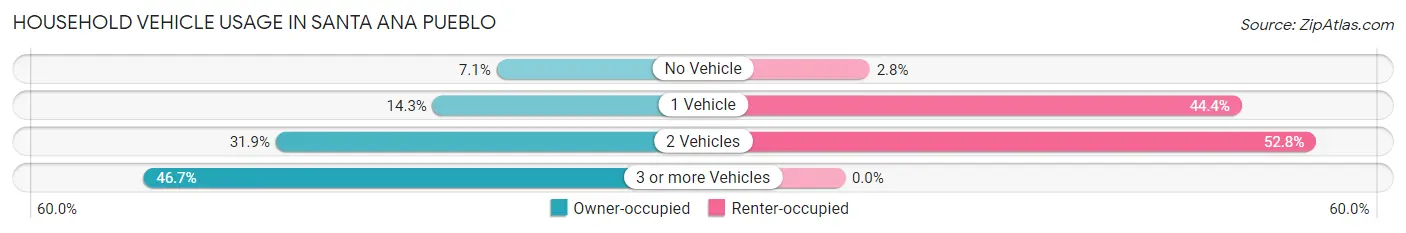
| Vehicles per Household | Owner-occupied | Renter-occupied |
| No Vehicle | 13 (7.1%) | 1 (2.8%) |
| 1 Vehicle | 26 (14.3%) | 16 (44.4%) |
| 2 Vehicles | 58 (31.9%) | 19 (52.8%) |
| 3 or more Vehicles | 85 (46.7%) | 0 (0.0%) |
| Total | 182 (100.0%) | 36 (100.0%) |
Real Estate & Mortgages in Santa Ana Pueblo
Real Estate and Mortgage Overview in Santa Ana Pueblo
| Characteristic | Without Mortgage | With Mortgage |
| Housing Units | 155 | 27 |
| Median Property Value | $127,900 | $202,100 |
| Median Household Income | $59,205 | $2 |
| Monthly Housing Costs | $229 | $0 |
| Real Estate Taxes | $339 | $22 |
Property Value by Mortgage Status in Santa Ana Pueblo
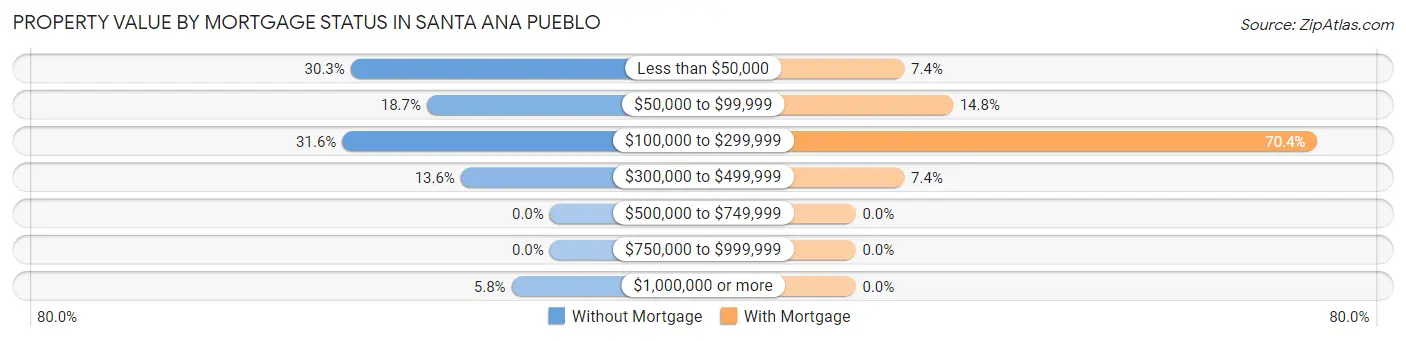
| Property Value | Without Mortgage | With Mortgage |
| Less than $50,000 | 47 (30.3%) | 2 (7.4%) |
| $50,000 to $99,999 | 29 (18.7%) | 4 (14.8%) |
| $100,000 to $299,999 | 49 (31.6%) | 19 (70.4%) |
| $300,000 to $499,999 | 21 (13.6%) | 2 (7.4%) |
| $500,000 to $749,999 | 0 (0.0%) | 0 (0.0%) |
| $750,000 to $999,999 | 0 (0.0%) | 0 (0.0%) |
| $1,000,000 or more | 9 (5.8%) | 0 (0.0%) |
| Total | 155 (100.0%) | 27 (100.0%) |
Household Income by Mortgage Status in Santa Ana Pueblo
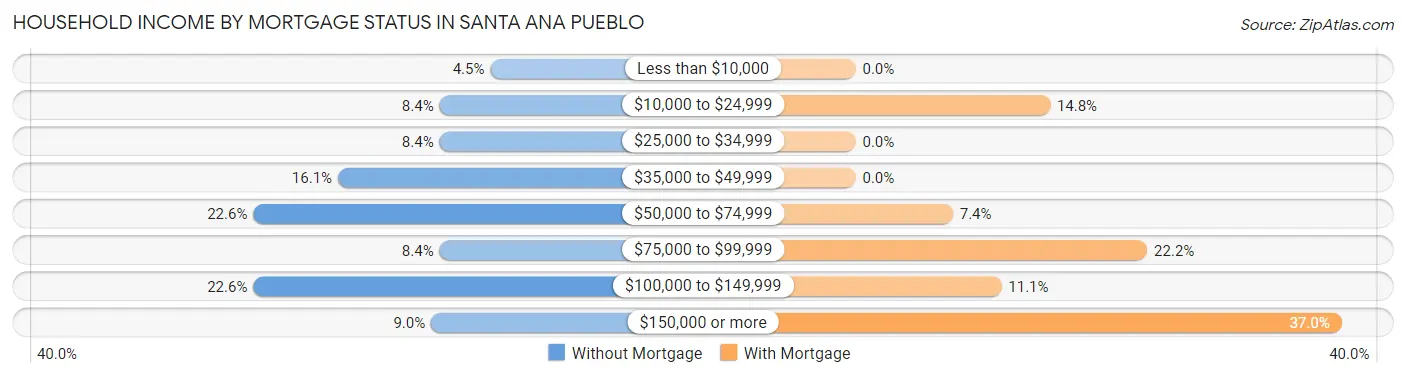
| Household Income | Without Mortgage | With Mortgage |
| Less than $10,000 | 7 (4.5%) | 0 (0.0%) |
| $10,000 to $24,999 | 13 (8.4%) | 4 (14.8%) |
| $25,000 to $34,999 | 13 (8.4%) | 0 (0.0%) |
| $35,000 to $49,999 | 25 (16.1%) | 0 (0.0%) |
| $50,000 to $74,999 | 35 (22.6%) | 2 (7.4%) |
| $75,000 to $99,999 | 13 (8.4%) | 6 (22.2%) |
| $100,000 to $149,999 | 35 (22.6%) | 3 (11.1%) |
| $150,000 or more | 14 (9.0%) | 10 (37.0%) |
| Total | 155 (100.0%) | 27 (100.0%) |
Property Value to Household Income Ratio in Santa Ana Pueblo
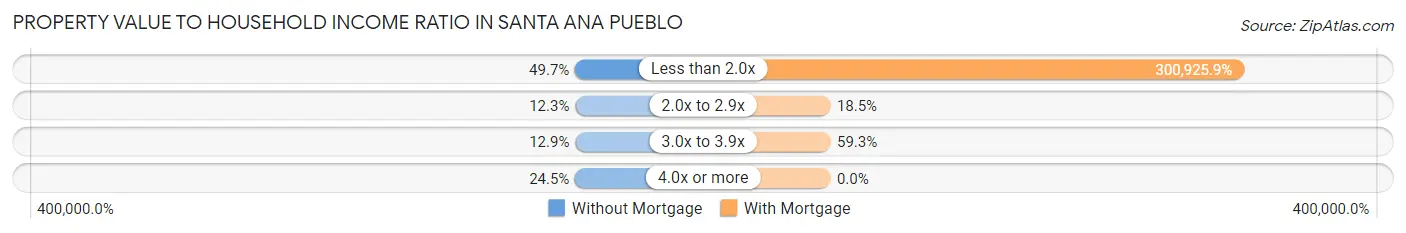
| Value-to-Income Ratio | Without Mortgage | With Mortgage |
| Less than 2.0x | 77 (49.7%) | 81,250 (300,925.9%) |
| 2.0x to 2.9x | 19 (12.3%) | 5 (18.5%) |
| 3.0x to 3.9x | 20 (12.9%) | 16 (59.3%) |
| 4.0x or more | 38 (24.5%) | 0 (0.0%) |
| Total | 155 (100.0%) | 27 (100.0%) |
Real Estate Taxes by Mortgage Status in Santa Ana Pueblo
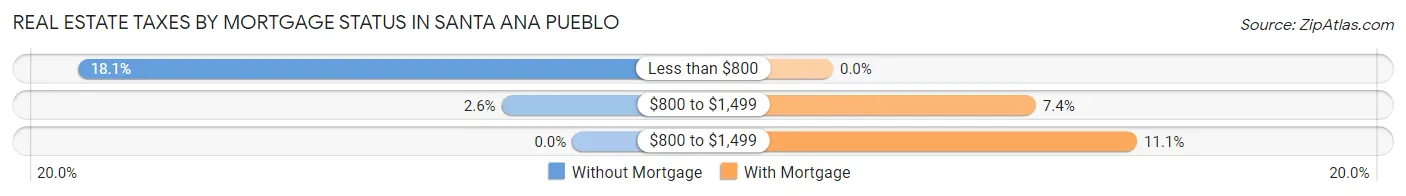
| Property Taxes | Without Mortgage | With Mortgage |
| Less than $800 | 28 (18.1%) | 0 (0.0%) |
| $800 to $1,499 | 4 (2.6%) | 2 (7.4%) |
| $800 to $1,499 | 0 (0.0%) | 3 (11.1%) |
| Total | 155 (100.0%) | 27 (100.0%) |
Health & Disability in Santa Ana Pueblo
Health Insurance Coverage by Age in Santa Ana Pueblo
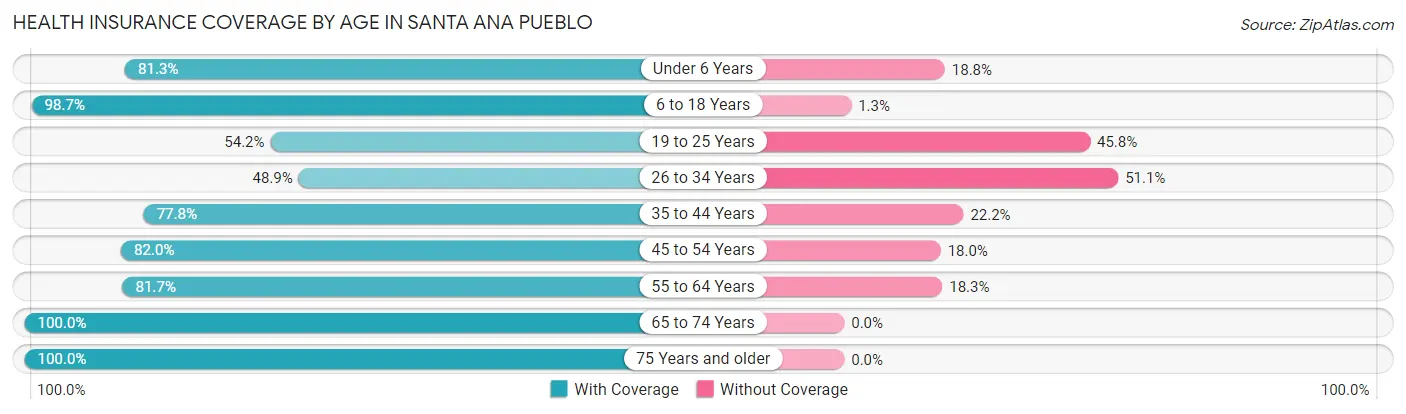
| Age Bracket | With Coverage | Without Coverage |
| Under 6 Years | 65 (81.2%) | 15 (18.8%) |
| 6 to 18 Years | 229 (98.7%) | 3 (1.3%) |
| 19 to 25 Years | 52 (54.2%) | 44 (45.8%) |
| 26 to 34 Years | 68 (48.9%) | 71 (51.1%) |
| 35 to 44 Years | 126 (77.8%) | 36 (22.2%) |
| 45 to 54 Years | 73 (82.0%) | 16 (18.0%) |
| 55 to 64 Years | 76 (81.7%) | 17 (18.3%) |
| 65 to 74 Years | 80 (100.0%) | 0 (0.0%) |
| 75 Years and older | 35 (100.0%) | 0 (0.0%) |
| Total | 804 (79.9%) | 202 (20.1%) |
Health Insurance Coverage by Citizenship Status in Santa Ana Pueblo
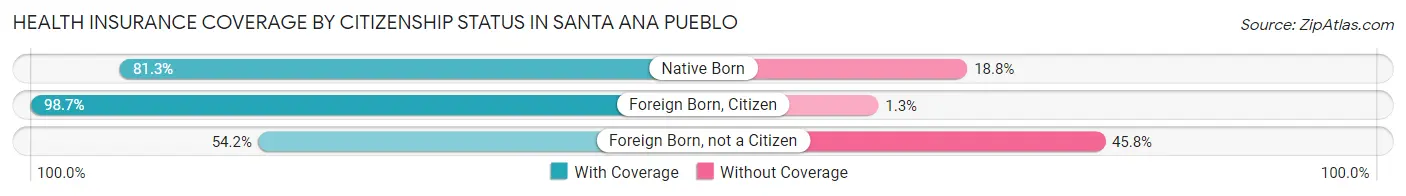
| Citizenship Status | With Coverage | Without Coverage |
| Native Born | 65 (81.2%) | 15 (18.8%) |
| Foreign Born, Citizen | 229 (98.7%) | 3 (1.3%) |
| Foreign Born, not a Citizen | 52 (54.2%) | 44 (45.8%) |
Health Insurance Coverage by Household Income in Santa Ana Pueblo
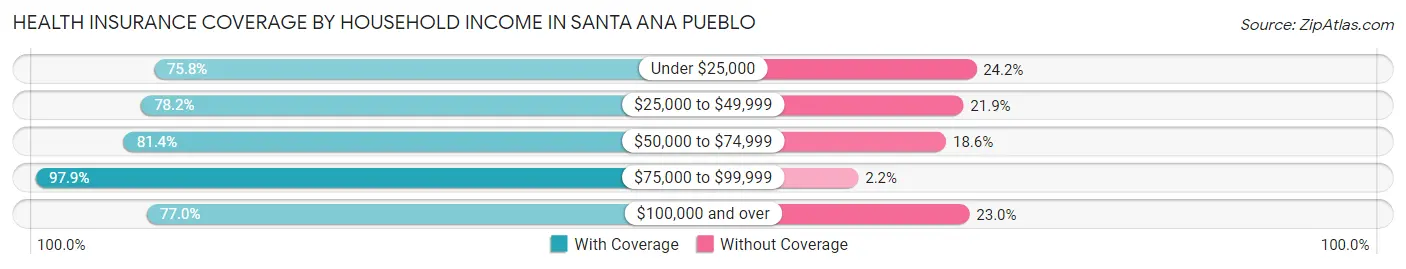
| Household Income | With Coverage | Without Coverage |
| Under $25,000 | 50 (75.8%) | 16 (24.2%) |
| $25,000 to $49,999 | 211 (78.1%) | 59 (21.8%) |
| $50,000 to $74,999 | 140 (81.4%) | 32 (18.6%) |
| $75,000 to $99,999 | 91 (97.9%) | 2 (2.1%) |
| $100,000 and over | 312 (77.0%) | 93 (23.0%) |
Public vs Private Health Insurance Coverage by Age in Santa Ana Pueblo
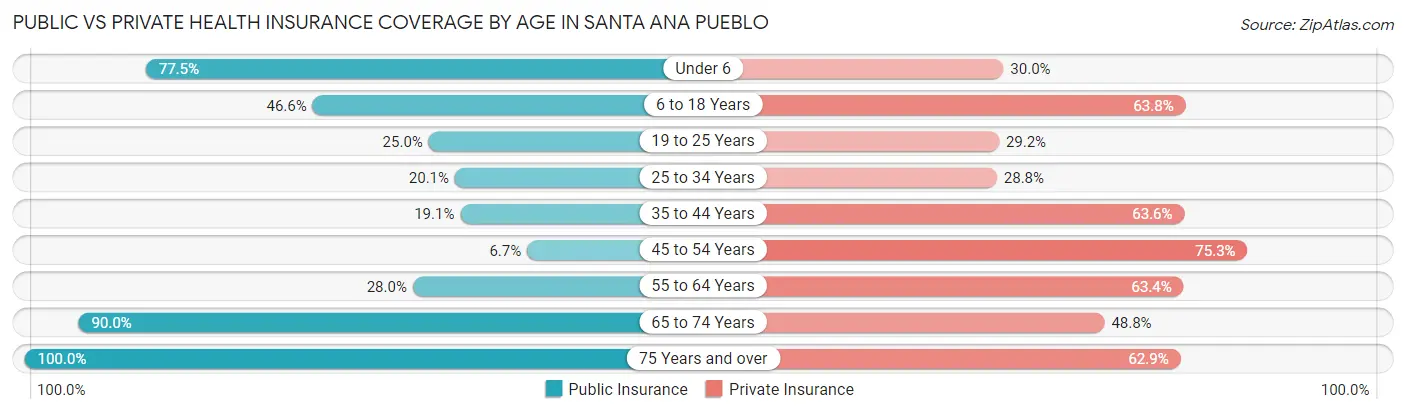
| Age Bracket | Public Insurance | Private Insurance |
| Under 6 | 62 (77.5%) | 24 (30.0%) |
| 6 to 18 Years | 108 (46.6%) | 148 (63.8%) |
| 19 to 25 Years | 24 (25.0%) | 28 (29.2%) |
| 25 to 34 Years | 28 (20.1%) | 40 (28.8%) |
| 35 to 44 Years | 31 (19.1%) | 103 (63.6%) |
| 45 to 54 Years | 6 (6.7%) | 67 (75.3%) |
| 55 to 64 Years | 26 (28.0%) | 59 (63.4%) |
| 65 to 74 Years | 72 (90.0%) | 39 (48.7%) |
| 75 Years and over | 35 (100.0%) | 22 (62.9%) |
| Total | 392 (39.0%) | 530 (52.7%) |
Disability Status by Sex by Age in Santa Ana Pueblo
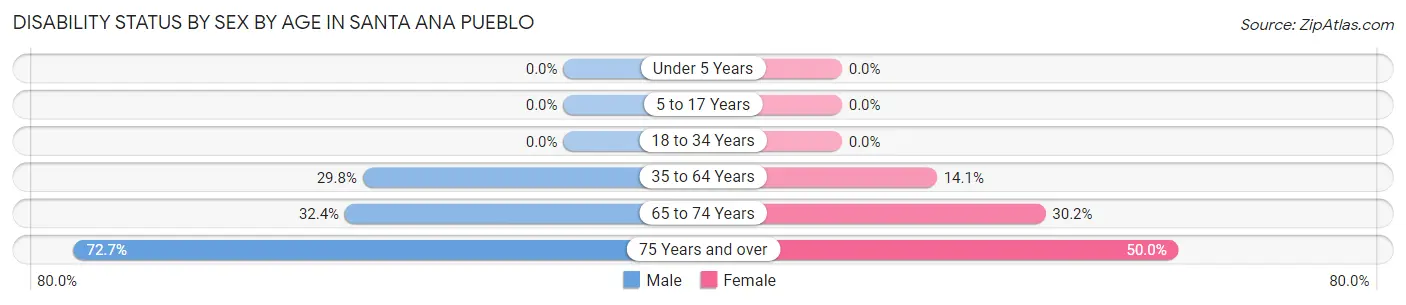
| Age Bracket | Male | Female |
| Under 5 Years | 0 (0.0%) | 0 (0.0%) |
| 5 to 17 Years | 0 (0.0%) | 0 (0.0%) |
| 18 to 34 Years | 0 (0.0%) | 0 (0.0%) |
| 35 to 64 Years | 56 (29.8%) | 22 (14.1%) |
| 65 to 74 Years | 12 (32.4%) | 13 (30.2%) |
| 75 Years and over | 8 (72.7%) | 12 (50.0%) |
Disability Class by Sex by Age in Santa Ana Pueblo
Disability Class: Hearing Difficulty
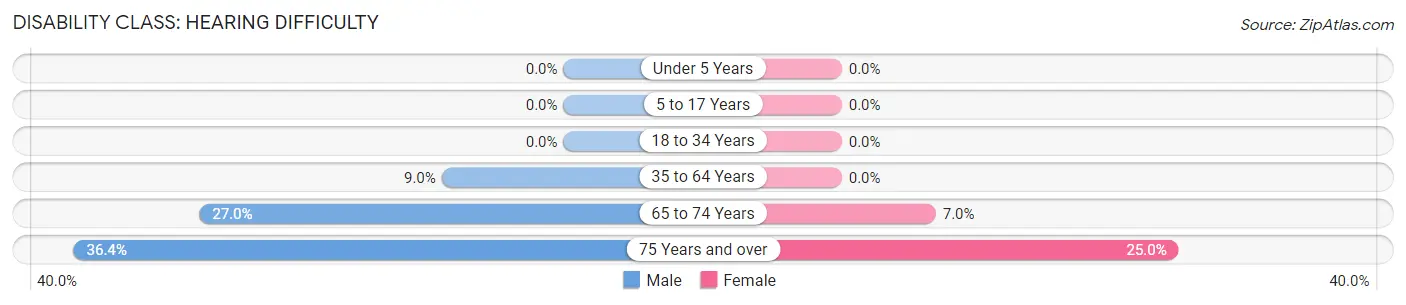
| Age Bracket | Male | Female |
| Under 5 Years | 0 (0.0%) | 0 (0.0%) |
| 5 to 17 Years | 0 (0.0%) | 0 (0.0%) |
| 18 to 34 Years | 0 (0.0%) | 0 (0.0%) |
| 35 to 64 Years | 17 (9.0%) | 0 (0.0%) |
| 65 to 74 Years | 10 (27.0%) | 3 (7.0%) |
| 75 Years and over | 4 (36.4%) | 6 (25.0%) |
Disability Class: Vision Difficulty
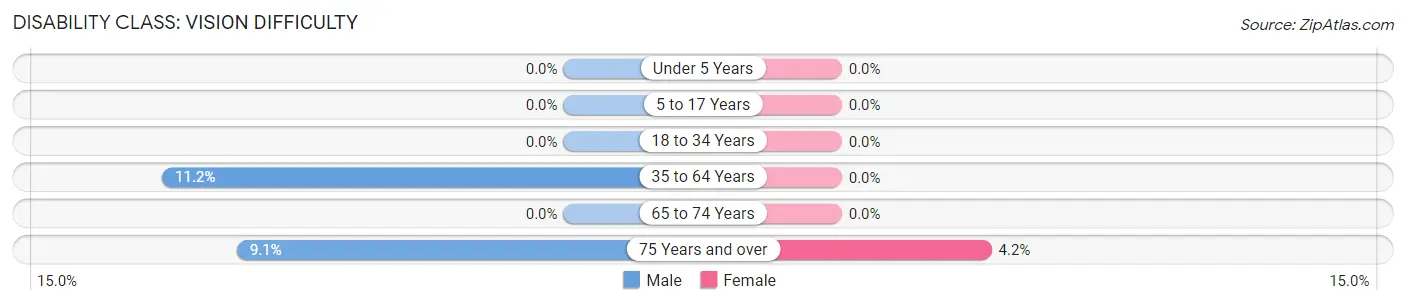
| Age Bracket | Male | Female |
| Under 5 Years | 0 (0.0%) | 0 (0.0%) |
| 5 to 17 Years | 0 (0.0%) | 0 (0.0%) |
| 18 to 34 Years | 0 (0.0%) | 0 (0.0%) |
| 35 to 64 Years | 21 (11.2%) | 0 (0.0%) |
| 65 to 74 Years | 0 (0.0%) | 0 (0.0%) |
| 75 Years and over | 1 (9.1%) | 1 (4.2%) |
Disability Class: Cognitive Difficulty
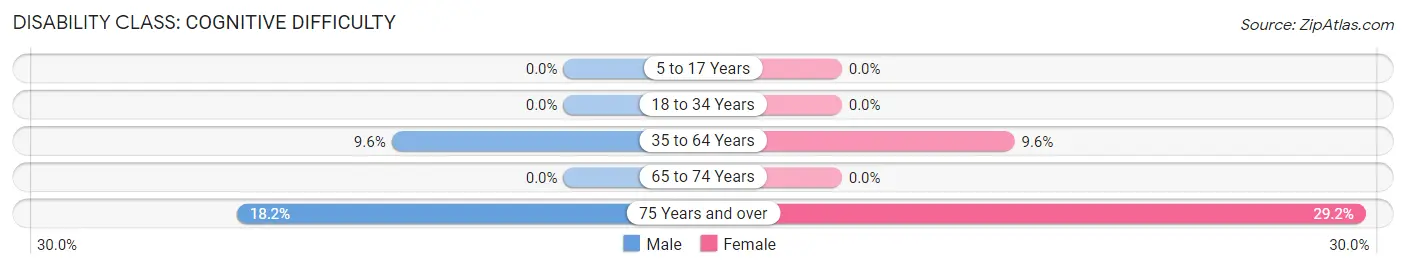
| Age Bracket | Male | Female |
| 5 to 17 Years | 0 (0.0%) | 0 (0.0%) |
| 18 to 34 Years | 0 (0.0%) | 0 (0.0%) |
| 35 to 64 Years | 18 (9.6%) | 15 (9.6%) |
| 65 to 74 Years | 0 (0.0%) | 0 (0.0%) |
| 75 Years and over | 2 (18.2%) | 7 (29.2%) |
Disability Class: Ambulatory Difficulty
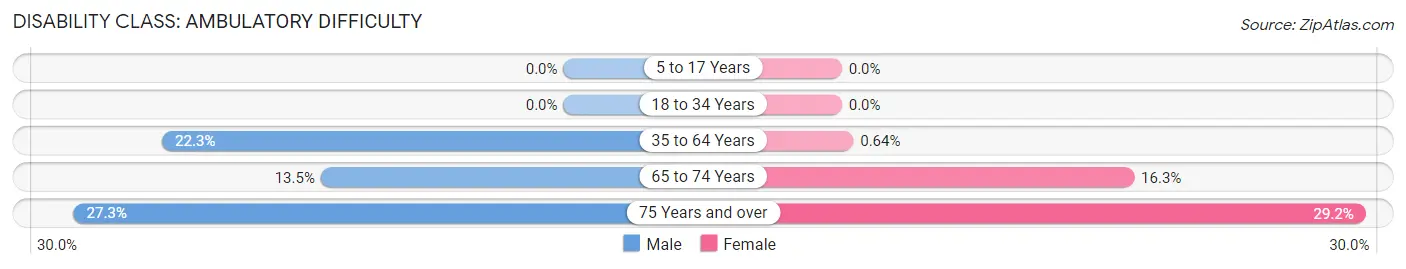
| Age Bracket | Male | Female |
| 5 to 17 Years | 0 (0.0%) | 0 (0.0%) |
| 18 to 34 Years | 0 (0.0%) | 0 (0.0%) |
| 35 to 64 Years | 42 (22.3%) | 1 (0.6%) |
| 65 to 74 Years | 5 (13.5%) | 7 (16.3%) |
| 75 Years and over | 3 (27.3%) | 7 (29.2%) |
Disability Class: Self-Care Difficulty
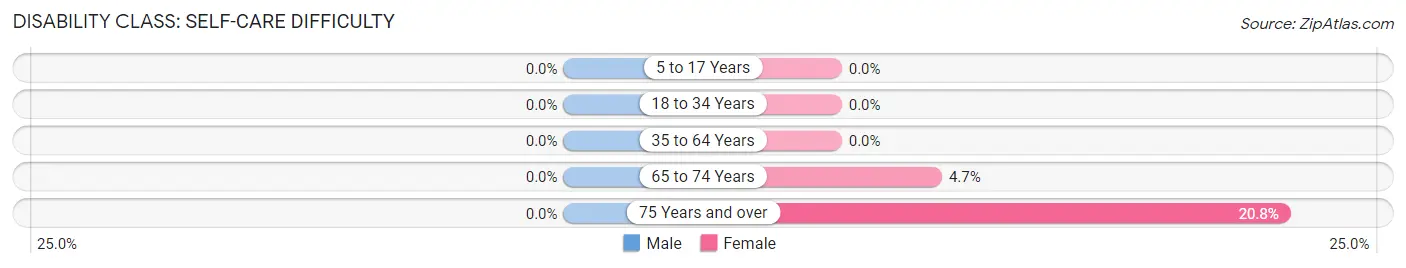
| Age Bracket | Male | Female |
| 5 to 17 Years | 0 (0.0%) | 0 (0.0%) |
| 18 to 34 Years | 0 (0.0%) | 0 (0.0%) |
| 35 to 64 Years | 0 (0.0%) | 0 (0.0%) |
| 65 to 74 Years | 0 (0.0%) | 2 (4.6%) |
| 75 Years and over | 0 (0.0%) | 5 (20.8%) |
Technology Access in Santa Ana Pueblo
Computing Device Access in Santa Ana Pueblo
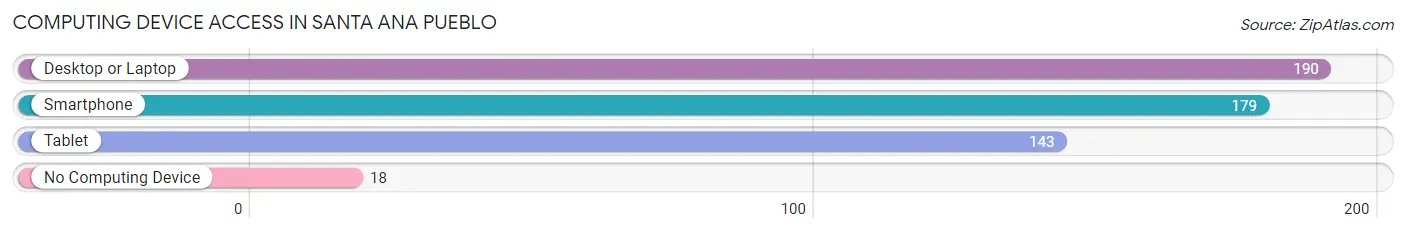
| Device Type | # Households | % Households |
| Desktop or Laptop | 190 | 87.2% |
| Smartphone | 179 | 82.1% |
| Tablet | 143 | 65.6% |
| No Computing Device | 18 | 8.3% |
| Total | 218 | 100.0% |
Internet Access in Santa Ana Pueblo
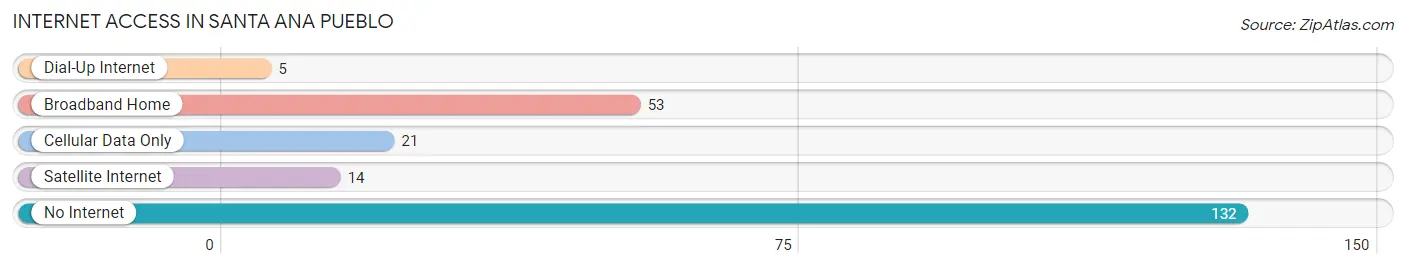
| Internet Type | # Households | % Households |
| Dial-Up Internet | 5 | 2.3% |
| Broadband Home | 53 | 24.3% |
| Cellular Data Only | 21 | 9.6% |
| Satellite Internet | 14 | 6.4% |
| No Internet | 132 | 60.6% |
| Total | 218 | 100.0% |
Santa Ana Pueblo Summary
Introduction
Santa Ana Pueblo is a small Native American community located in Sandoval County, New Mexico. It is one of the 19 Pueblos of New Mexico, and is home to the Tewa people, who have lived in the area for centuries. The Pueblo is located about 25 miles north of Albuquerque, and is home to about 500 people. Santa Ana Pueblo is known for its traditional culture and its commitment to preserving its heritage.
History
The Tewa people have lived in the area of Santa Ana Pueblo for centuries. The Pueblo was first established in the late 1500s, when the Tewa people moved to the area from the Rio Grande Valley. The Pueblo was originally known as Tamaya, which means “place of the sun” in the Tewa language. The Pueblo was later renamed Santa Ana in honor of Saint Anne, the patron saint of the Tewa people.
The Pueblo was originally a farming community, and the Tewa people grew corn, beans, squash, and other crops. They also hunted and gathered wild plants for food. In the late 1800s, the Pueblo began to diversify its economy by opening a trading post and a general store. The Pueblo also began to produce pottery and jewelry, which were sold to tourists.
In the early 1900s, the Pueblo was threatened by the construction of the Santa Fe Railroad. The Pueblo was able to negotiate with the railroad company to ensure that the tracks would not pass through the Pueblo’s land. In the 1920s, the Pueblo was able to purchase additional land to expand its boundaries.
In the 1950s, the Pueblo began to develop its tourism industry. The Pueblo opened a hotel and a golf course, and began to attract visitors from around the world. The Pueblo also opened a casino in the 1990s, which has become a major source of income for the Pueblo.
Geography
Santa Ana Pueblo is located in Sandoval County, New Mexico. The Pueblo is situated on the banks of the Rio Grande River, about 25 miles north of Albuquerque. The Pueblo is surrounded by the Jemez Mountains to the west and the Sangre de Cristo Mountains to the east. The Pueblo is located at an elevation of 5,400 feet, and has a semi-arid climate with hot summers and cold winters.
The Pueblo covers an area of about 4,000 acres, and is home to about 500 people. The Pueblo is divided into two sections: the main village and the outlying areas. The main village is located on the banks of the Rio Grande, and is home to the Pueblo’s government buildings, businesses, and homes. The outlying areas are located in the surrounding hills and valleys, and are home to the Pueblo’s farms and ranches.
Economy
The economy of Santa Ana Pueblo is based primarily on tourism and gaming. The Pueblo’s casino, which opened in the 1990s, is a major source of income for the Pueblo. The Pueblo also operates a hotel, a golf course, and a number of restaurants and shops. The Pueblo also produces pottery and jewelry, which are sold to tourists.
In addition to tourism and gaming, the Pueblo also has a small agricultural sector. The Pueblo’s farms and ranches produce corn, beans, squash, and other crops. The Pueblo also has a small manufacturing sector, which produces furniture and other wood products.
Demographics
As of the 2010 census, the population of Santa Ana Pueblo was 498. The population is primarily Native American, with 97.2% of the population identifying as Tewa. The median age of the population is 37.3, and the median household income is $30,000.
Conclusion
Santa Ana Pueblo is a small Native American community located in Sandoval County, New Mexico. The Pueblo is home to the Tewa people, who have lived in the area for centuries. The Pueblo is known for its traditional culture and its commitment to preserving its heritage. The economy of Santa Ana Pueblo is based primarily on tourism and gaming, and the Pueblo also has a small agricultural and manufacturing sector. The population of Santa Ana Pueblo is primarily Native American, and the median age of the population is 37.3.
Common Questions
What is Per Capita Income in Santa Ana Pueblo?
Per Capita income in Santa Ana Pueblo is $19,162.
What is the Median Family Income in Santa Ana Pueblo?
Median Family Income in Santa Ana Pueblo is $59,886.
What is the Median Household income in Santa Ana Pueblo?
Median Household Income in Santa Ana Pueblo is $59,318.
What is Income or Wage Gap in Santa Ana Pueblo?
Income or Wage Gap in Santa Ana Pueblo is 4.4%.
Women in Santa Ana Pueblo earn 95.6 cents for every dollar earned by a man.
What is Inequality or Gini Index in Santa Ana Pueblo?
Inequality or Gini Index in Santa Ana Pueblo is 0.37.
What is the Total Population of Santa Ana Pueblo?
Total Population of Santa Ana Pueblo is 1,006.
What is the Total Male Population of Santa Ana Pueblo?
Total Male Population of Santa Ana Pueblo is 551.
What is the Total Female Population of Santa Ana Pueblo?
Total Female Population of Santa Ana Pueblo is 455.
What is the Ratio of Males per 100 Females in Santa Ana Pueblo?
There are 121.10 Males per 100 Females in Santa Ana Pueblo.
What is the Ratio of Females per 100 Males in Santa Ana Pueblo?
There are 82.58 Females per 100 Males in Santa Ana Pueblo.
What is the Median Population Age in Santa Ana Pueblo?
Median Population Age in Santa Ana Pueblo is 32.7 Years.
What is the Average Family Size in Santa Ana Pueblo
Average Family Size in Santa Ana Pueblo is 5.3 People.
What is the Average Household Size in Santa Ana Pueblo
Average Household Size in Santa Ana Pueblo is 4.6 People.
How Large is the Labor Force in Santa Ana Pueblo?
There are 502 People in the Labor Forcein in Santa Ana Pueblo.
What is the Percentage of People in the Labor Force in Santa Ana Pueblo?
66.1% of People are in the Labor Force in Santa Ana Pueblo.
What is the Unemployment Rate in Santa Ana Pueblo?
Unemployment Rate in Santa Ana Pueblo is 4.8%.