Casa Colorada, NM Map & Demographics
Casa Colorada Map
Casa Colorada Overview
$44,763
PER CAPITA INCOME
$110,167
AVG HOUSEHOLD INCOME
32.7%
WAGE / INCOME GAP [ % ]
67.3¢/ $1
WAGE / INCOME GAP [ $ ]
0.28
INEQUALITY / GINI INDEX
259
TOTAL POPULATION
184
MALE POPULATION
75
FEMALE POPULATION
245.33
MALES / 100 FEMALES
40.76
FEMALES / 100 MALES
46.8
MEDIAN AGE
2.6
AVG FAMILY SIZE
2.0
AVG HOUSEHOLD SIZE
143
LABOR FORCE [ PEOPLE ]
62.2%
PERCENT IN LABOR FORCE
7.0%
UNEMPLOYMENT RATE
Income in Casa Colorada
Income Overview in Casa Colorada
| Characteristic | Number | Measure |
| Per Capita Income | 259 | $44,763 |
| Median Family Income | 73 | $0 |
| Mean Family Income | 73 | $80,840 |
| Median Household Income | 128 | $110,167 |
| Mean Household Income | 128 | $86,316 |
| Income Deficit | 73 | $0 |
| Wage / Income Gap (%) | 259 | 32.75% |
| Wage / Income Gap ($) | 259 | 67.25¢ per $1 |
| Gini / Inequality Index | 259 | 0.28 |
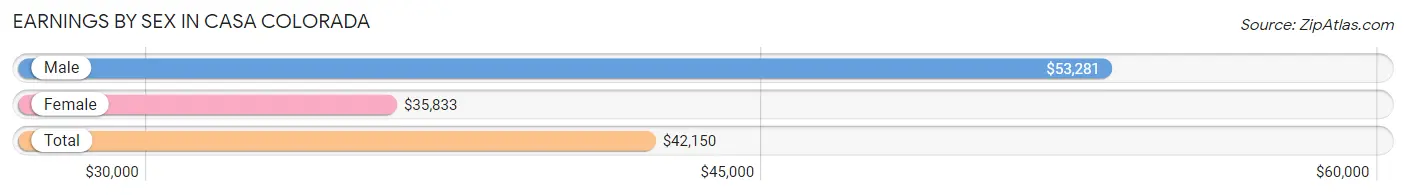
Earnings by Sex in Casa Colorada
Average Earnings in Casa Colorada are $42,150, $53,281 for men and $35,833 for women, a difference of 32.8%.
| Sex | Number | Average Earnings |
| Male | 111 (67.3%) | $53,281 |
| Female | 54 (32.7%) | $35,833 |
| Total | 165 (100.0%) | $42,150 |
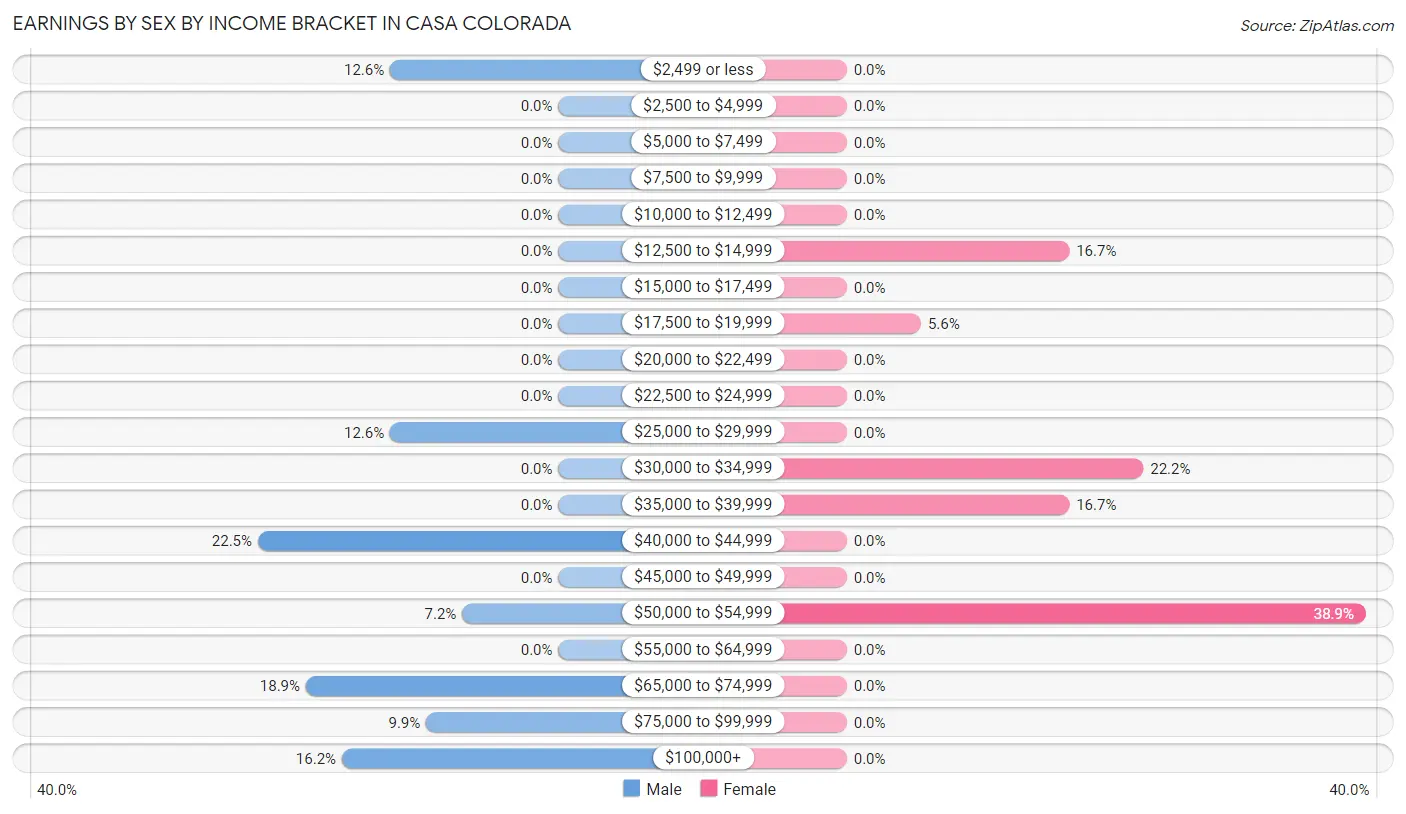
Earnings by Sex by Income Bracket in Casa Colorada
The most common earnings brackets in Casa Colorada are $40,000 to $44,999 for men (25 | 22.5%) and $50,000 to $54,999 for women (21 | 38.9%).
| Income | Male | Female |
| $2,499 or less | 14 (12.6%) | 0 (0.0%) |
| $2,500 to $4,999 | 0 (0.0%) | 0 (0.0%) |
| $5,000 to $7,499 | 0 (0.0%) | 0 (0.0%) |
| $7,500 to $9,999 | 0 (0.0%) | 0 (0.0%) |
| $10,000 to $12,499 | 0 (0.0%) | 0 (0.0%) |
| $12,500 to $14,999 | 0 (0.0%) | 9 (16.7%) |
| $15,000 to $17,499 | 0 (0.0%) | 0 (0.0%) |
| $17,500 to $19,999 | 0 (0.0%) | 3 (5.6%) |
| $20,000 to $22,499 | 0 (0.0%) | 0 (0.0%) |
| $22,500 to $24,999 | 0 (0.0%) | 0 (0.0%) |
| $25,000 to $29,999 | 14 (12.6%) | 0 (0.0%) |
| $30,000 to $34,999 | 0 (0.0%) | 12 (22.2%) |
| $35,000 to $39,999 | 0 (0.0%) | 9 (16.7%) |
| $40,000 to $44,999 | 25 (22.5%) | 0 (0.0%) |
| $45,000 to $49,999 | 0 (0.0%) | 0 (0.0%) |
| $50,000 to $54,999 | 8 (7.2%) | 21 (38.9%) |
| $55,000 to $64,999 | 0 (0.0%) | 0 (0.0%) |
| $65,000 to $74,999 | 21 (18.9%) | 0 (0.0%) |
| $75,000 to $99,999 | 11 (9.9%) | 0 (0.0%) |
| $100,000+ | 18 (16.2%) | 0 (0.0%) |
| Total | 111 (100.0%) | 54 (100.0%) |
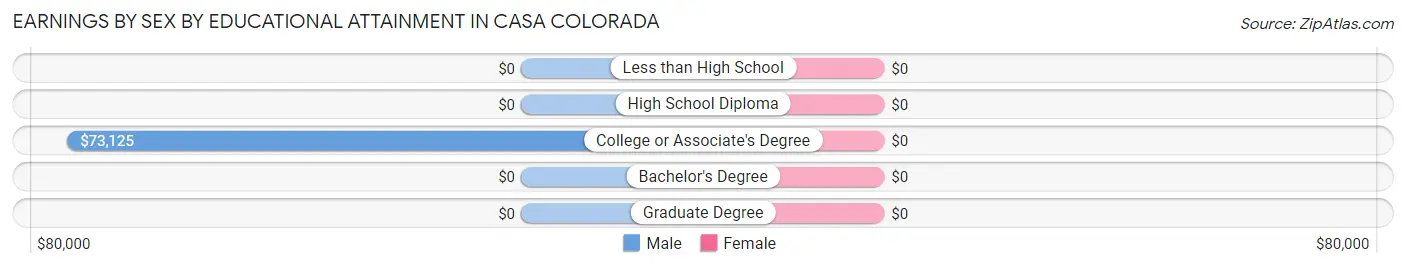
Earnings by Sex by Educational Attainment in Casa Colorada
| Educational Attainment | Male Income | Female Income |
| Less than High School | - | - |
| High School Diploma | - | - |
| College or Associate's Degree | $73,125 | $0 |
| Bachelor's Degree | - | - |
| Graduate Degree | - | - |
| Total | $53,281 | $37,083 |
Family Income in Casa Colorada
Family Income Brackets in Casa Colorada
According to the Casa Colorada family income data, there are 38 families falling into the $100,000 to $149,999 income range, which is the most common income bracket and makes up 52.0% of all families.
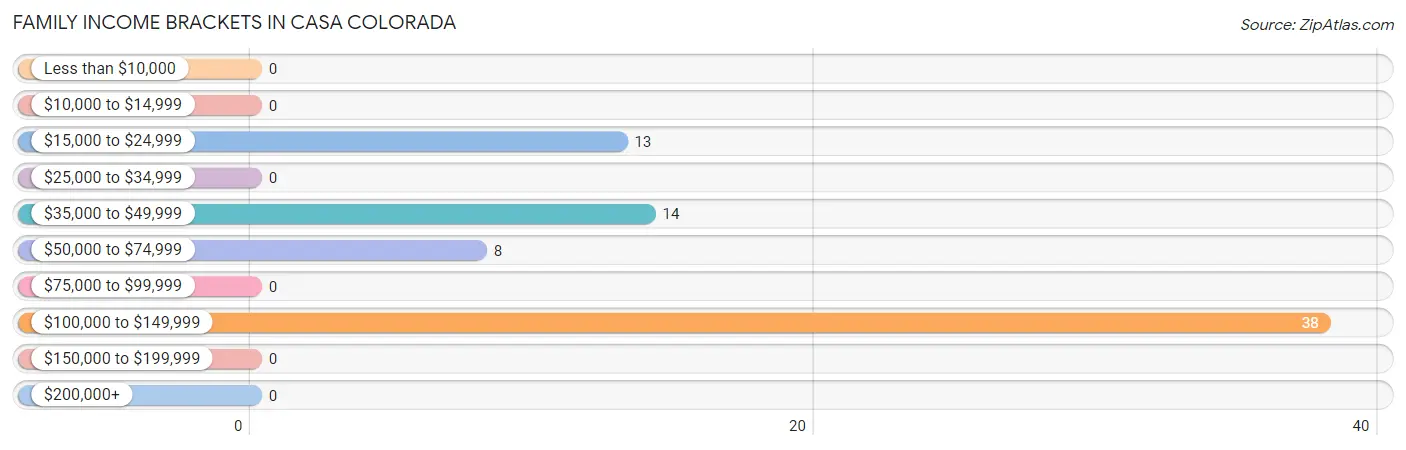
| Income Bracket | # Families | % Families |
| Less than $10,000 | 0 | 0.0% |
| $10,000 to $14,999 | 0 | 0.0% |
| $15,000 to $24,999 | 13 | 17.8% |
| $25,000 to $34,999 | 0 | 0.0% |
| $35,000 to $49,999 | 14 | 19.2% |
| $50,000 to $74,999 | 8 | 11.0% |
| $75,000 to $99,999 | 0 | 0.0% |
| $100,000 to $149,999 | 38 | 52.1% |
| $150,000 to $199,999 | 0 | 0.0% |
| $200,000+ | 0 | 0.0% |
Family Income by Famaliy Size in Casa Colorada
2-person families (51 | 69.9%) account for the highest median family income in Casa Colorada with $112,083 per family, while 2-person families (51 | 69.9%) have the highest median income of $56,042 per family member.
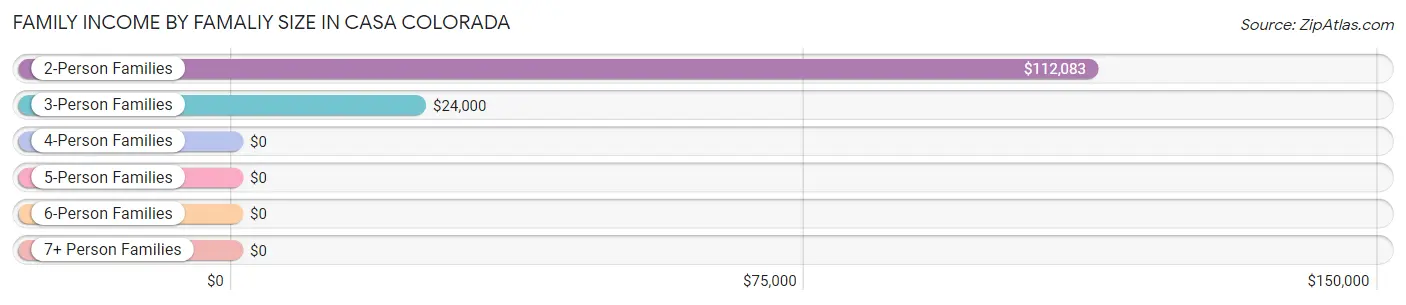
| Income Bracket | # Families | Median Income |
| 2-Person Families | 51 (69.9%) | $112,083 |
| 3-Person Families | 22 (30.1%) | $24,000 |
| 4-Person Families | 0 (0.0%) | $0 |
| 5-Person Families | 0 (0.0%) | $0 |
| 6-Person Families | 0 (0.0%) | $0 |
| 7+ Person Families | 0 (0.0%) | $0 |
| Total | 73 (100.0%) | $0 |
Family Income by Number of Earners in Casa Colorada
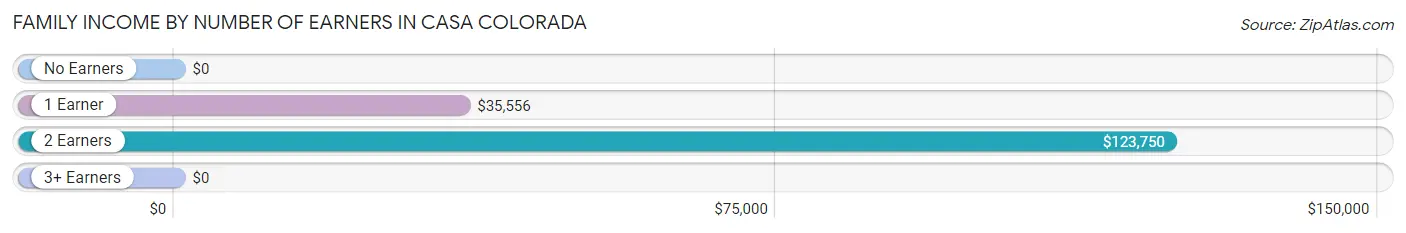
| Number of Earners | # Families | Median Income |
| No Earners | 13 (17.8%) | $0 |
| 1 Earner | 30 (41.1%) | $35,556 |
| 2 Earners | 30 (41.1%) | $123,750 |
| 3+ Earners | 0 (0.0%) | $0 |
| Total | 73 (100.0%) | $0 |
Household Income in Casa Colorada
Household Income Brackets in Casa Colorada
With 65 households falling in the category, the $100,000 to $149,999 income range is the most frequent in Casa Colorada, accounting for 50.8% of all households.
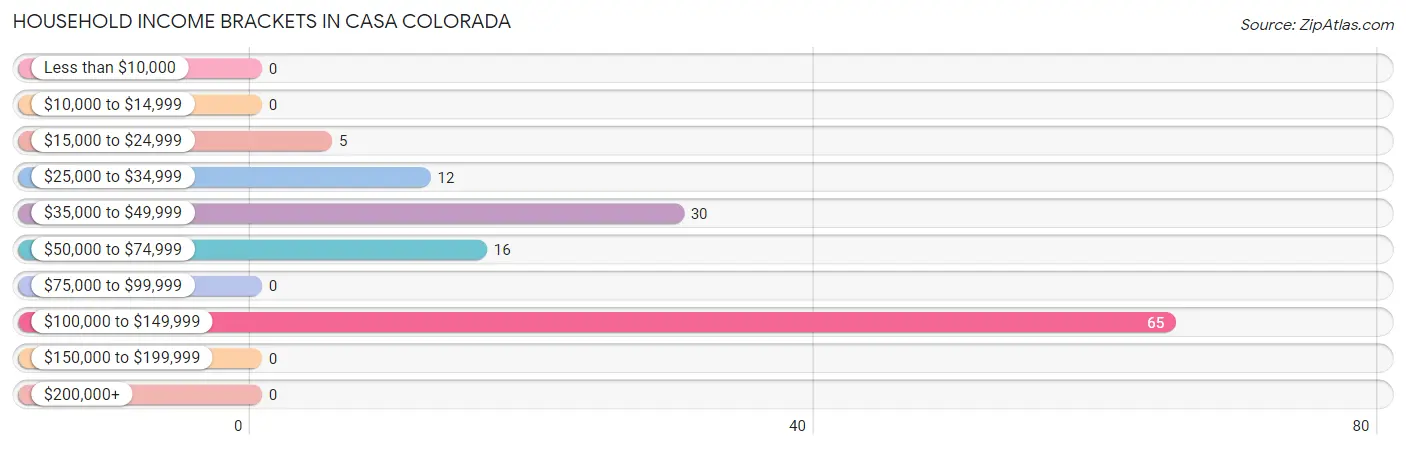
| Income Bracket | # Households | % Households |
| Less than $10,000 | 0 | 0.0% |
| $10,000 to $14,999 | 0 | 0.0% |
| $15,000 to $24,999 | 5 | 3.9% |
| $25,000 to $34,999 | 12 | 9.4% |
| $35,000 to $49,999 | 30 | 23.4% |
| $50,000 to $74,999 | 16 | 12.5% |
| $75,000 to $99,999 | 0 | 0.0% |
| $100,000 to $149,999 | 65 | 50.8% |
| $150,000 to $199,999 | 0 | 0.0% |
| $200,000+ | 0 | 0.0% |
Household Income by Householder Age in Casa Colorada
The median household income in Casa Colorada is $110,167, with the highest median household income of $110,167 found in the 45 to 64 years age bracket for the primary householder. A total of 94 households (73.4%) fall into this category.
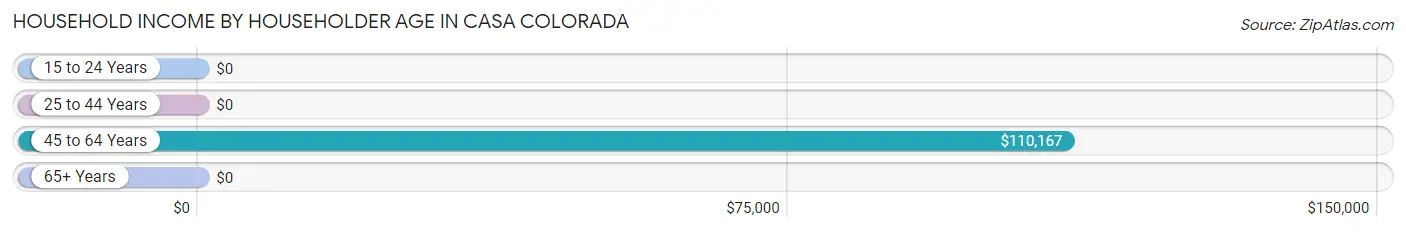
| Income Bracket | # Households | Median Income |
| 15 to 24 Years | 0 (0.0%) | $0 |
| 25 to 44 Years | 21 (16.4%) | $0 |
| 45 to 64 Years | 94 (73.4%) | $110,167 |
| 65+ Years | 13 (10.2%) | $0 |
| Total | 128 (100.0%) | $110,167 |
Poverty in Casa Colorada
Income Below Poverty by Sex and Age in Casa Colorada
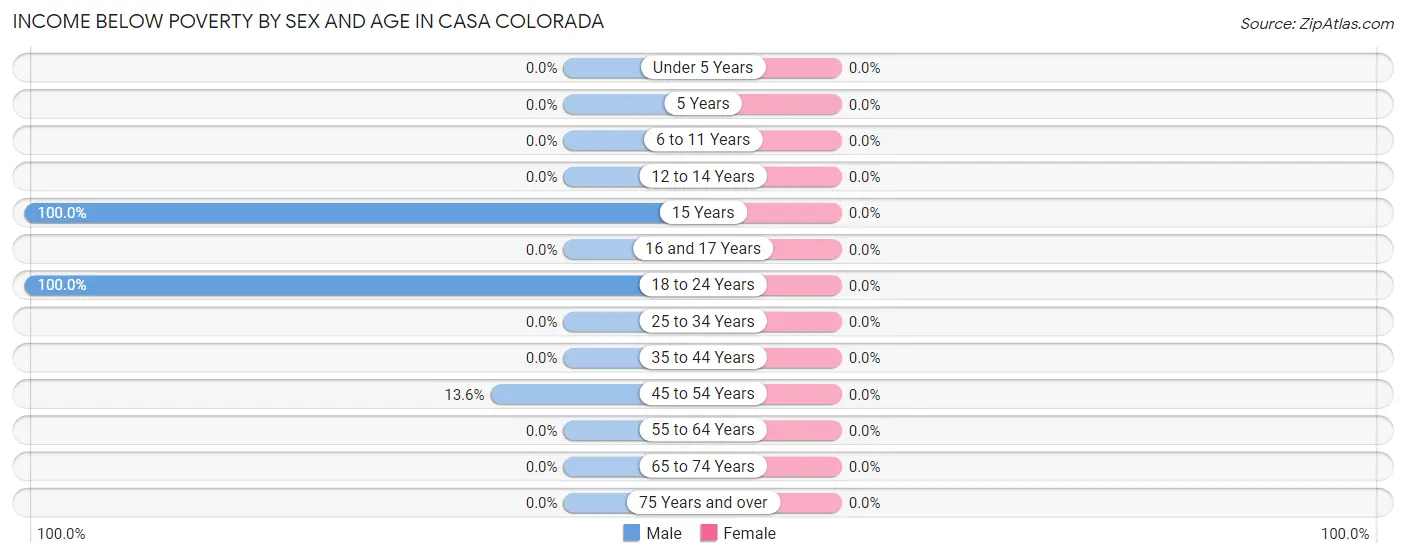
| Age Bracket | Male | Female |
| Under 5 Years | 0 (0.0%) | 0 (0.0%) |
| 5 Years | 0 (0.0%) | 0 (0.0%) |
| 6 to 11 Years | 0 (0.0%) | 0 (0.0%) |
| 12 to 14 Years | 0 (0.0%) | 0 (0.0%) |
| 15 Years | 5 (100.0%) | 0 (0.0%) |
| 16 and 17 Years | 0 (0.0%) | 0 (0.0%) |
| 18 to 24 Years | 10 (100.0%) | 0 (0.0%) |
| 25 to 34 Years | 0 (0.0%) | 0 (0.0%) |
| 35 to 44 Years | 0 (0.0%) | 0 (0.0%) |
| 45 to 54 Years | 8 (13.6%) | 0 (0.0%) |
| 55 to 64 Years | 0 (0.0%) | 0 (0.0%) |
| 65 to 74 Years | 0 (0.0%) | 0 (0.0%) |
| 75 Years and over | 0 (0.0%) | 0 (0.0%) |
| Total | 23 (12.5%) | 0 (0.0%) |
Income Above Poverty by Sex and Age in Casa Colorada
According to the poverty statistics in Casa Colorada, males aged 12 to 14 years and females aged 18 to 24 years are the age groups that are most secure financially, with 100.0% of males and 100.0% of females in these age groups living above the poverty line.
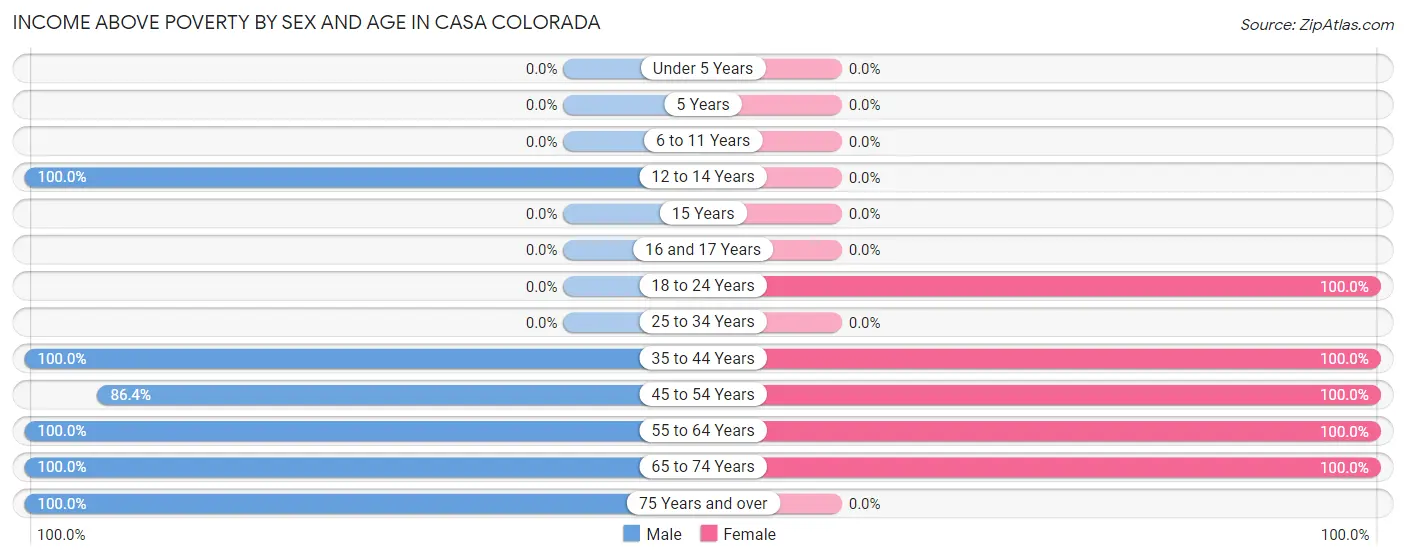
| Age Bracket | Male | Female |
| Under 5 Years | 0 (0.0%) | 0 (0.0%) |
| 5 Years | 0 (0.0%) | 0 (0.0%) |
| 6 to 11 Years | 0 (0.0%) | 0 (0.0%) |
| 12 to 14 Years | 24 (100.0%) | 0 (0.0%) |
| 15 Years | 0 (0.0%) | 0 (0.0%) |
| 16 and 17 Years | 0 (0.0%) | 0 (0.0%) |
| 18 to 24 Years | 0 (0.0%) | 9 (100.0%) |
| 25 to 34 Years | 0 (0.0%) | 0 (0.0%) |
| 35 to 44 Years | 21 (100.0%) | 21 (100.0%) |
| 45 to 54 Years | 51 (86.4%) | 21 (100.0%) |
| 55 to 64 Years | 46 (100.0%) | 15 (100.0%) |
| 65 to 74 Years | 14 (100.0%) | 9 (100.0%) |
| 75 Years and over | 5 (100.0%) | 0 (0.0%) |
| Total | 161 (87.5%) | 75 (100.0%) |
Income Below Poverty Among Married-Couple Families in Casa Colorada
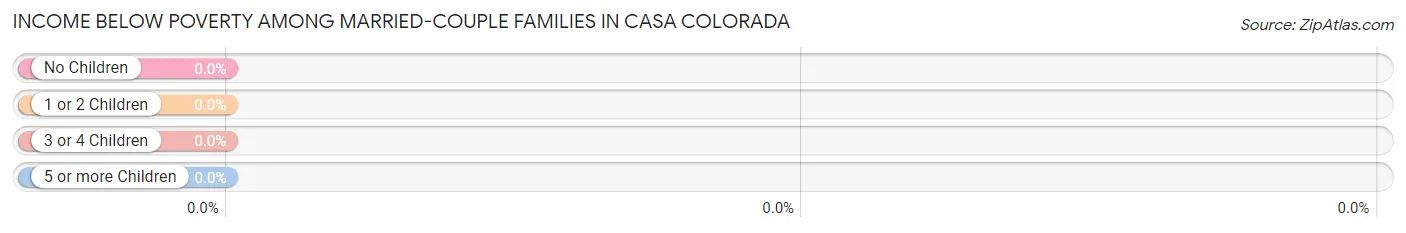
| Children | Above Poverty | Below Poverty |
| No Children | 39 (100.0%) | 0 (0.0%) |
| 1 or 2 Children | 0 (0.0%) | 0 (0.0%) |
| 3 or 4 Children | 0 (0.0%) | 0 (0.0%) |
| 5 or more Children | 0 (0.0%) | 0 (0.0%) |
| Total | 39 (100.0%) | 0 (0.0%) |
Income Below Poverty Among Single-Parent Households in Casa Colorada
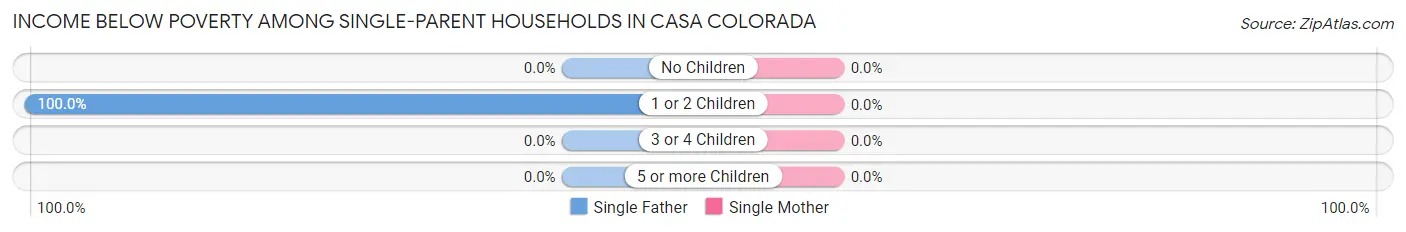
| Children | Single Father | Single Mother |
| No Children | 0 (0.0%) | 0 (0.0%) |
| 1 or 2 Children | 8 (100.0%) | 0 (0.0%) |
| 3 or 4 Children | 0 (0.0%) | 0 (0.0%) |
| 5 or more Children | 0 (0.0%) | 0 (0.0%) |
| Total | 8 (32.0%) | 0 (0.0%) |
Income Below Poverty Among Married-Couple vs Single-Parent Households in Casa Colorada
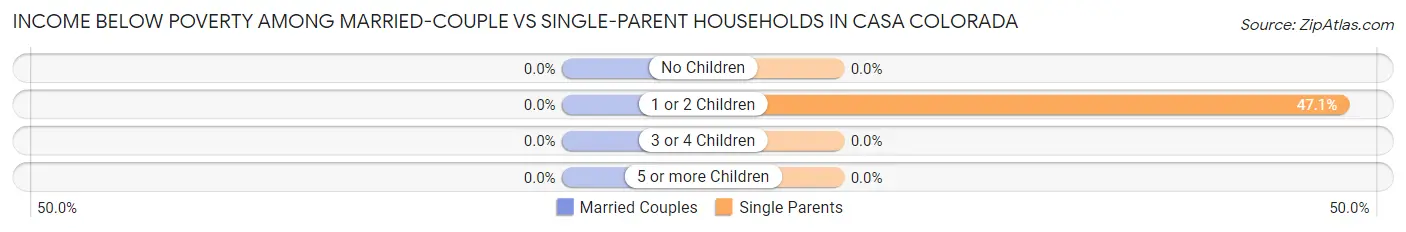
| Children | Married-Couple Families | Single-Parent Households |
| No Children | 0 (0.0%) | 0 (0.0%) |
| 1 or 2 Children | 0 (0.0%) | 8 (47.1%) |
| 3 or 4 Children | 0 (0.0%) | 0 (0.0%) |
| 5 or more Children | 0 (0.0%) | 0 (0.0%) |
| Total | 0 (0.0%) | 8 (23.5%) |
Race in Casa Colorada
The most populous races in Casa Colorada are White / Caucasian (198 | 76.4%), Hispanic or Latino (137 | 52.9%), and Some other Race (40 | 15.4%).
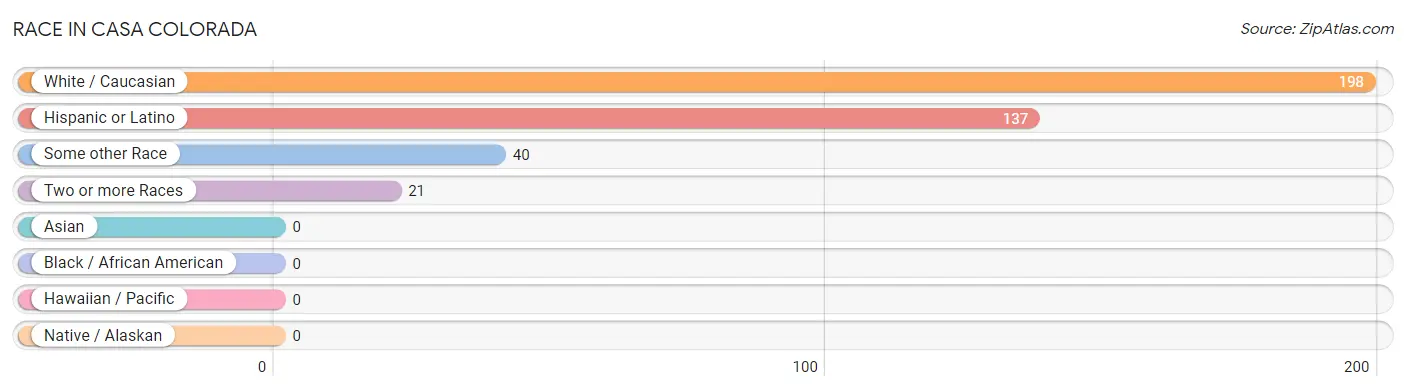
| Race | # Population | % Population |
| Asian | 0 | 0.0% |
| Black / African American | 0 | 0.0% |
| Hawaiian / Pacific | 0 | 0.0% |
| Hispanic or Latino | 137 | 52.9% |
| Native / Alaskan | 0 | 0.0% |
| White / Caucasian | 198 | 76.4% |
| Two or more Races | 21 | 8.1% |
| Some other Race | 40 | 15.4% |
| Total | 259 | 100.0% |
Ancestry in Casa Colorada
The most populous ancestries reported in Casa Colorada are German (65 | 25.1%), English (44 | 17.0%), French (39 | 15.1%), American (31 | 12.0%), and Spanish (30 | 11.6%), together accounting for 80.7% of all Casa Colorada residents.
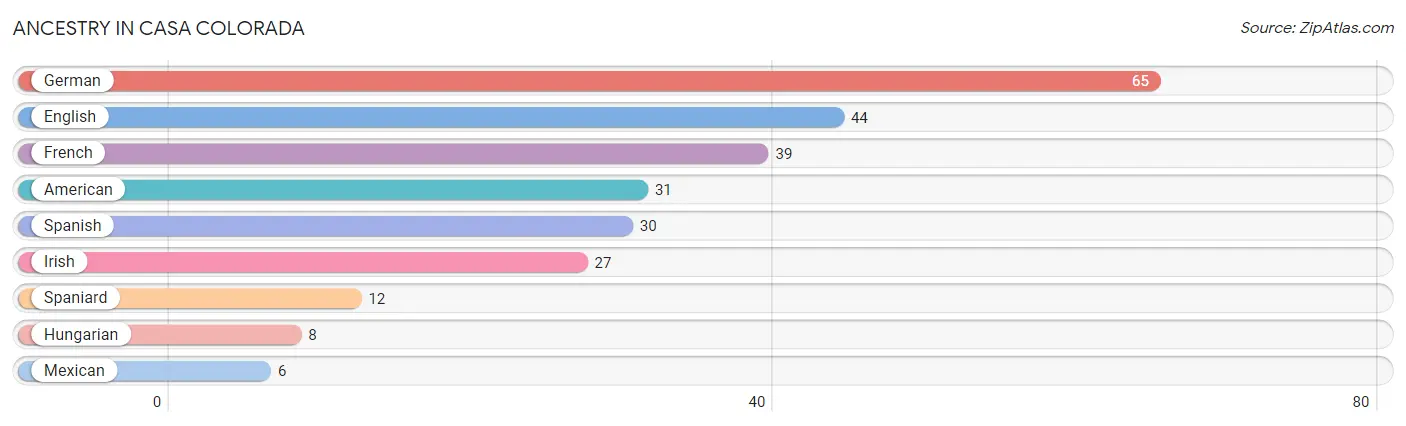
| Ancestry | # Population | % Population |
| American | 31 | 12.0% |
| English | 44 | 17.0% |
| French | 39 | 15.1% |
| German | 65 | 25.1% |
| Hungarian | 8 | 3.1% |
| Irish | 27 | 10.4% |
| Mexican | 6 | 2.3% |
| Spaniard | 12 | 4.6% |
| Spanish | 30 | 11.6% | View All 9 Rows |
Immigrants in Casa Colorada

| Immigration Origin | # Population | % Population | View All 0 Rows |
Sex and Age in Casa Colorada
Sex and Age in Casa Colorada
The most populous age groups in Casa Colorada are 45 to 49 Years (45 | 24.5%) for men and 35 to 39 Years (21 | 28.0%) for women.

| Age Bracket | Male | Female |
| Under 5 Years | 0 (0.0%) | 0 (0.0%) |
| 5 to 9 Years | 0 (0.0%) | 0 (0.0%) |
| 10 to 14 Years | 24 (13.0%) | 0 (0.0%) |
| 15 to 19 Years | 5 (2.7%) | 9 (12.0%) |
| 20 to 24 Years | 10 (5.4%) | 0 (0.0%) |
| 25 to 29 Years | 0 (0.0%) | 0 (0.0%) |
| 30 to 34 Years | 0 (0.0%) | 0 (0.0%) |
| 35 to 39 Years | 21 (11.4%) | 21 (28.0%) |
| 40 to 44 Years | 0 (0.0%) | 0 (0.0%) |
| 45 to 49 Years | 45 (24.5%) | 21 (28.0%) |
| 50 to 54 Years | 14 (7.6%) | 0 (0.0%) |
| 55 to 59 Years | 18 (9.8%) | 5 (6.7%) |
| 60 to 64 Years | 28 (15.2%) | 10 (13.3%) |
| 65 to 69 Years | 0 (0.0%) | 9 (12.0%) |
| 70 to 74 Years | 14 (7.6%) | 0 (0.0%) |
| 75 to 79 Years | 0 (0.0%) | 0 (0.0%) |
| 80 to 84 Years | 0 (0.0%) | 0 (0.0%) |
| 85 Years and over | 5 (2.7%) | 0 (0.0%) |
| Total | 184 (100.0%) | 75 (100.0%) |
Families and Households in Casa Colorada
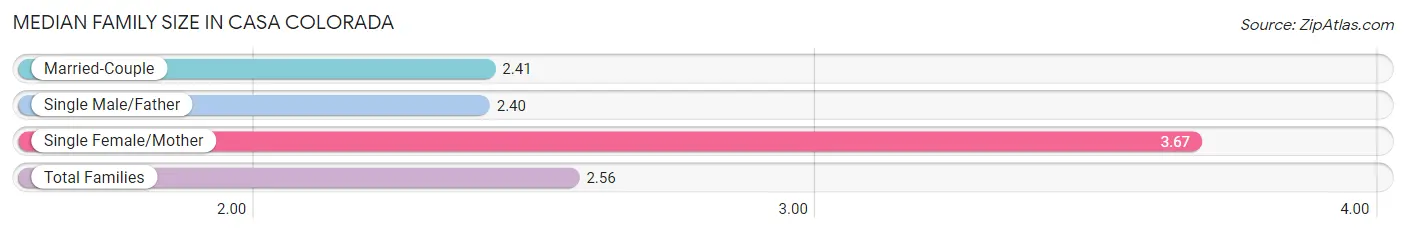
Median Family Size in Casa Colorada
The median family size in Casa Colorada is 2.56 persons per family, with single female/mother families (9 | 12.3%) accounting for the largest median family size of 3.67 persons per family. On the other hand, single male/father families (25 | 34.3%) represent the smallest median family size with 2.40 persons per family.
| Family Type | # Families | Family Size |
| Married-Couple | 39 (53.4%) | 2.41 |
| Single Male/Father | 25 (34.3%) | 2.40 |
| Single Female/Mother | 9 (12.3%) | 3.67 |
| Total Families | 73 (100.0%) | 2.56 |
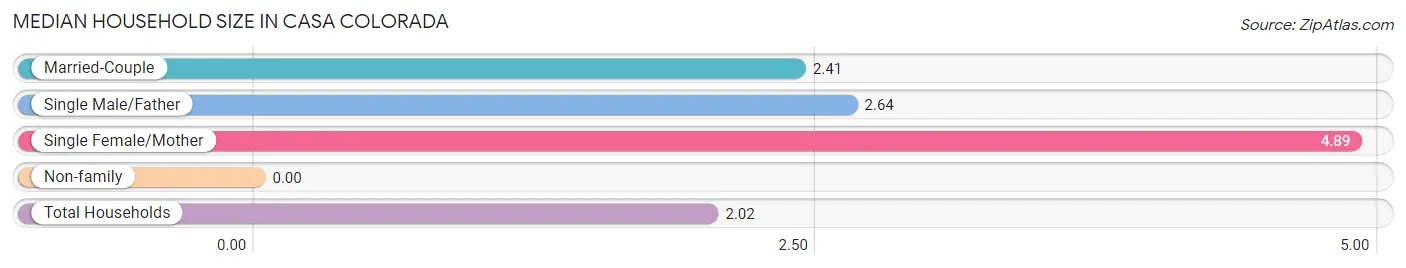
Median Household Size in Casa Colorada
| Household Type | # Households | Household Size |
| Married-Couple | 39 (30.5%) | 2.41 |
| Single Male/Father | 25 (19.5%) | 2.64 |
| Single Female/Mother | 9 (7.0%) | 4.89 |
| Non-family | 55 (43.0%) | - |
| Total Households | 128 (100.0%) | 2.02 |
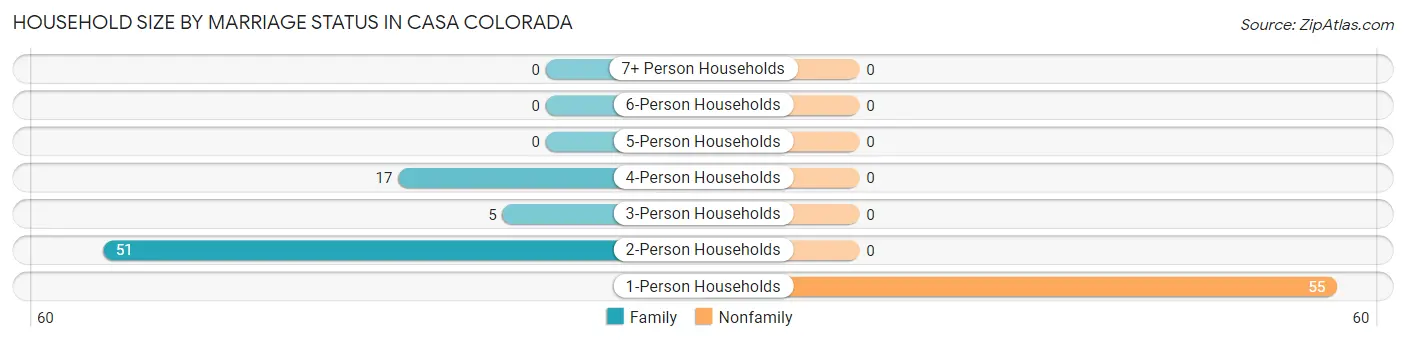
Household Size by Marriage Status in Casa Colorada
Out of a total of 128 households in Casa Colorada, 73 (57.0%) are family households, while 55 (43.0%) are nonfamily households. The most numerous type of family households are 2-person households, comprising 51, and the most common type of nonfamily households are 1-person households, comprising 55.
| Household Size | Family Households | Nonfamily Households |
| 1-Person Households | - | 55 (43.0%) |
| 2-Person Households | 51 (39.8%) | 0 (0.0%) |
| 3-Person Households | 5 (3.9%) | 0 (0.0%) |
| 4-Person Households | 17 (13.3%) | 0 (0.0%) |
| 5-Person Households | 0 (0.0%) | 0 (0.0%) |
| 6-Person Households | 0 (0.0%) | 0 (0.0%) |
| 7+ Person Households | 0 (0.0%) | 0 (0.0%) |
| Total | 73 (57.0%) | 55 (43.0%) |
Female Fertility in Casa Colorada
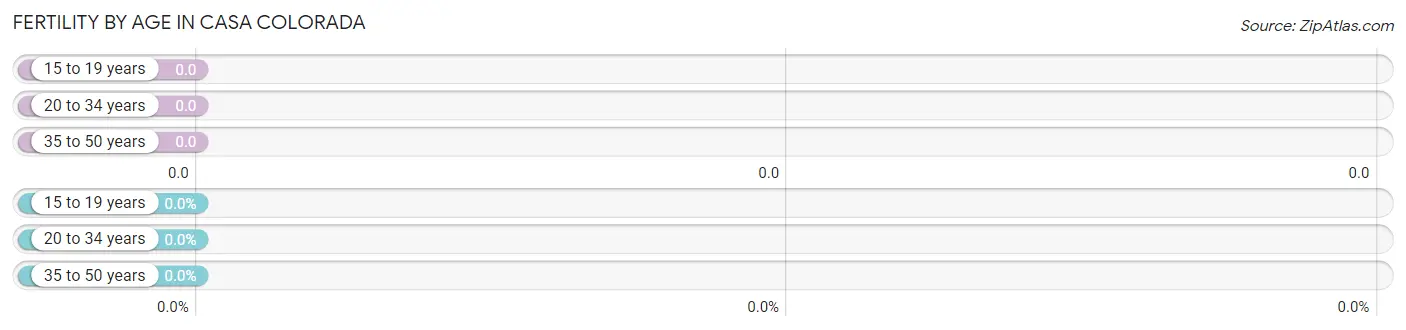
Fertility by Age in Casa Colorada
| Age Bracket | Women with Births | Births / 1,000 Women |
| 15 to 19 years | 0 (0.0%) | 0.0 |
| 20 to 34 years | 0 (0.0%) | 0.0 |
| 35 to 50 years | 0 (0.0%) | 0.0 |
| Total | 0 (0.0%) | 0.0 |
Fertility by Age by Marriage Status in Casa Colorada
| Age Bracket | Married | Unmarried |
| 15 to 19 years | 0 (0.0%) | 0 (0.0%) |
| 20 to 34 years | 0 (0.0%) | 0 (0.0%) |
| 35 to 50 years | 0 (0.0%) | 0 (0.0%) |
| Total | 0 (0.0%) | 0 (0.0%) |
Fertility by Education in Casa Colorada
| Educational Attainment | Women with Births | Births / 1,000 Women |
| Less than High School | 0 (0.0%) | 0.0 |
| High School Diploma | 0 (0.0%) | 0.0 |
| College or Associate's Degree | 0 (0.0%) | 0.0 |
| Bachelor's Degree | 0 (0.0%) | 0.0 |
| Graduate Degree | 0 (0.0%) | 0.0 |
| Total | 0 (0.0%) | 0.0 |
Fertility by Education by Marriage Status in Casa Colorada
| Educational Attainment | Married | Unmarried |
| Less than High School | 0 (0.0%) | 0 (0.0%) |
| High School Diploma | 0 (0.0%) | 0 (0.0%) |
| College or Associate's Degree | 0 (0.0%) | 0 (0.0%) |
| Bachelor's Degree | 0 (0.0%) | 0 (0.0%) |
| Graduate Degree | 0 (0.0%) | 0 (0.0%) |
| Total | 0 (0.0%) | 0 (0.0%) |
Employment Characteristics in Casa Colorada
Employment by Class of Employer in Casa Colorada
Among the 133 employed individuals in Casa Colorada, private company employees (76 | 57.1%), state government employees (28 | 21.0%), and local government employees (20 | 15.0%) make up the most common classes of employment.
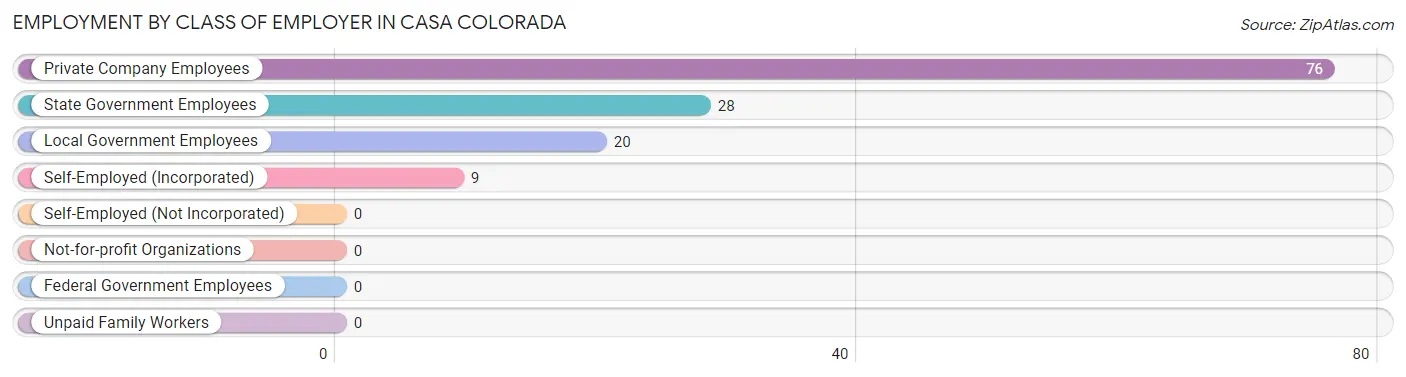
| Employer Class | # Employees | % Employees |
| Private Company Employees | 76 | 57.1% |
| Self-Employed (Incorporated) | 9 | 6.8% |
| Self-Employed (Not Incorporated) | 0 | 0.0% |
| Not-for-profit Organizations | 0 | 0.0% |
| Local Government Employees | 20 | 15.0% |
| State Government Employees | 28 | 21.0% |
| Federal Government Employees | 0 | 0.0% |
| Unpaid Family Workers | 0 | 0.0% |
| Total | 133 | 100.0% |
Employment Status by Age in Casa Colorada
According to the labor force statistics for Casa Colorada, out of the total population over 16 years of age (230), 62.2% or 143 individuals are in the labor force, with 7.0% or 10 of them unemployed. The age group with the highest labor force participation rate is 16 to 19 years, with 100.0% or 9 individuals in the labor force. Within the labor force, the 35 to 44 years age range has the highest percentage of unemployed individuals, with 23.8% or 10 of them being unemployed.
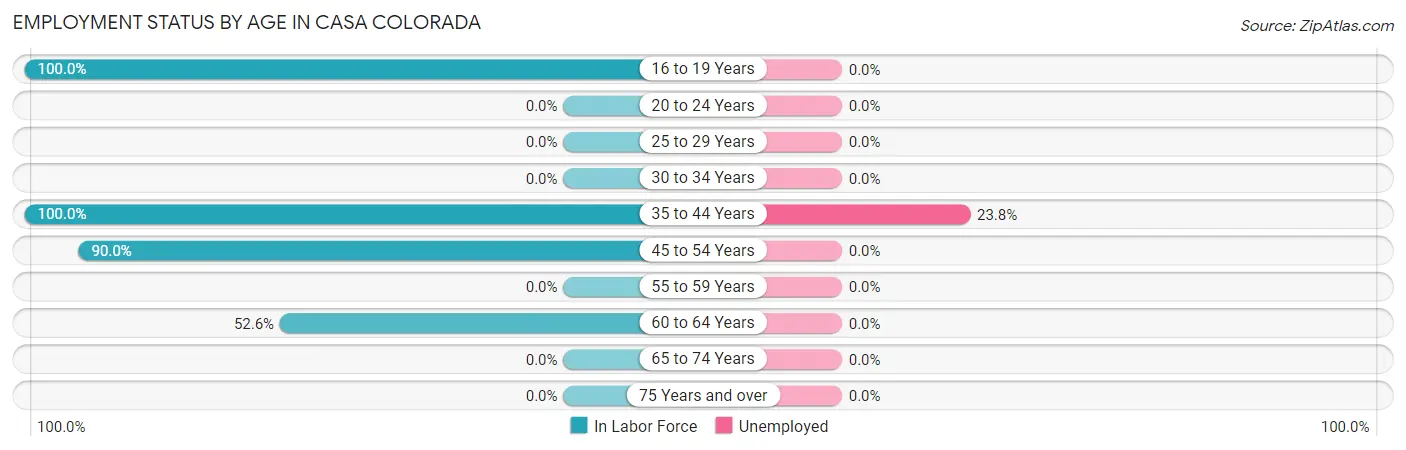
| Age Bracket | In Labor Force | Unemployed |
| 16 to 19 Years | 9 (100.0%) | 0 (0.0%) |
| 20 to 24 Years | 0 (0.0%) | 0 (0.0%) |
| 25 to 29 Years | 0 (0.0%) | 0 (0.0%) |
| 30 to 34 Years | 0 (0.0%) | 0 (0.0%) |
| 35 to 44 Years | 42 (100.0%) | 10 (23.8%) |
| 45 to 54 Years | 72 (90.0%) | 0 (0.0%) |
| 55 to 59 Years | 0 (0.0%) | 0 (0.0%) |
| 60 to 64 Years | 20 (52.6%) | 0 (0.0%) |
| 65 to 74 Years | 0 (0.0%) | 0 (0.0%) |
| 75 Years and over | 0 (0.0%) | 0 (0.0%) |
| Total | 143 (62.2%) | 10 (7.0%) |
Employment Status by Educational Attainment in Casa Colorada
According to labor force statistics for Casa Colorada, 73.2% of individuals (134) out of the total population between 25 and 64 years of age (183) are in the labor force, with 7.5% or 10 of them being unemployed. The group with the highest labor force participation rate are those with the educational attainment of college / associate degree, with 90.1% or 64 individuals in the labor force. Within the labor force, individuals with less than high school education have the highest percentage of unemployment, with 100.0% or 10 of them being unemployed.
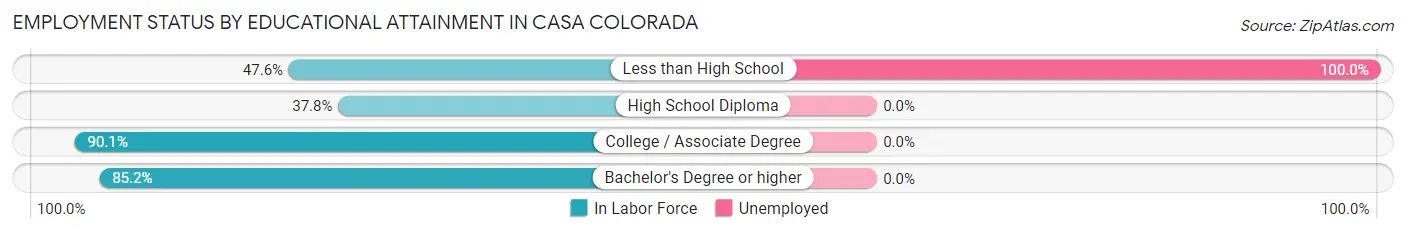
| Educational Attainment | In Labor Force | Unemployed |
| Less than High School | 10 (47.6%) | 21 (100.0%) |
| High School Diploma | 14 (37.8%) | 0 (0.0%) |
| College / Associate Degree | 64 (90.1%) | 0 (0.0%) |
| Bachelor's Degree or higher | 46 (85.2%) | 0 (0.0%) |
| Total | 134 (73.2%) | 14 (7.5%) |
Employment Occupations by Sex in Casa Colorada
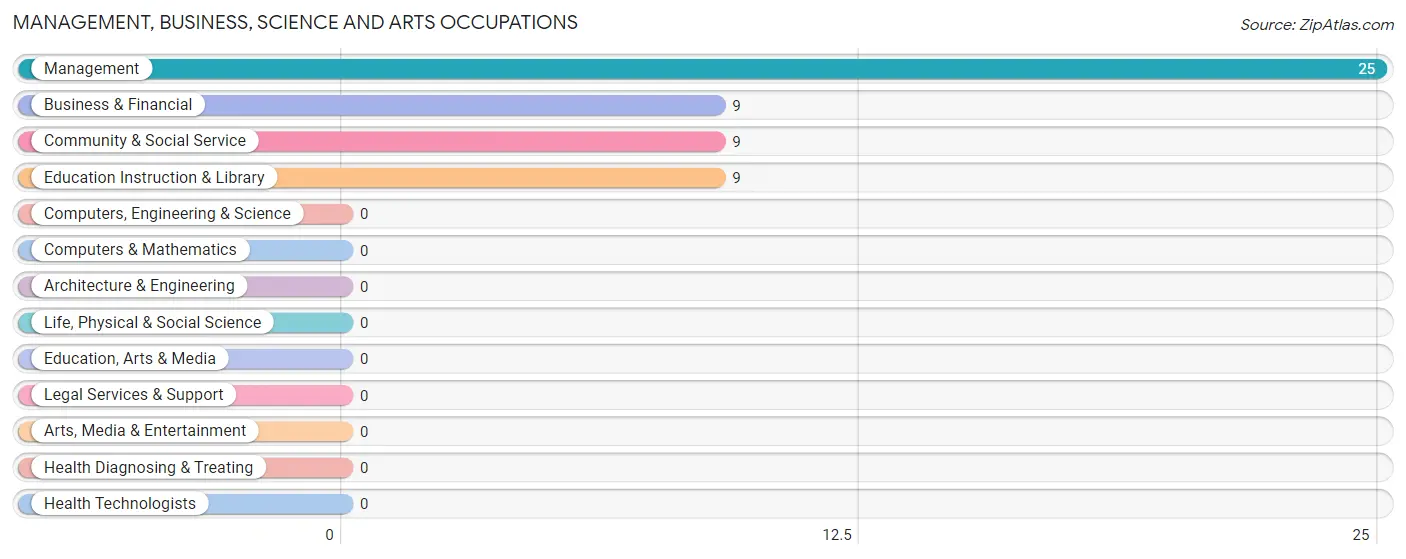
Management, Business, Science and Arts Occupations
The most common Management, Business, Science and Arts occupations in Casa Colorada are Management (25 | 18.8%), Business & Financial (9 | 6.8%), Community & Social Service (9 | 6.8%), and Education Instruction & Library (9 | 6.8%).
Management, Business, Science and Arts Occupations by Sex
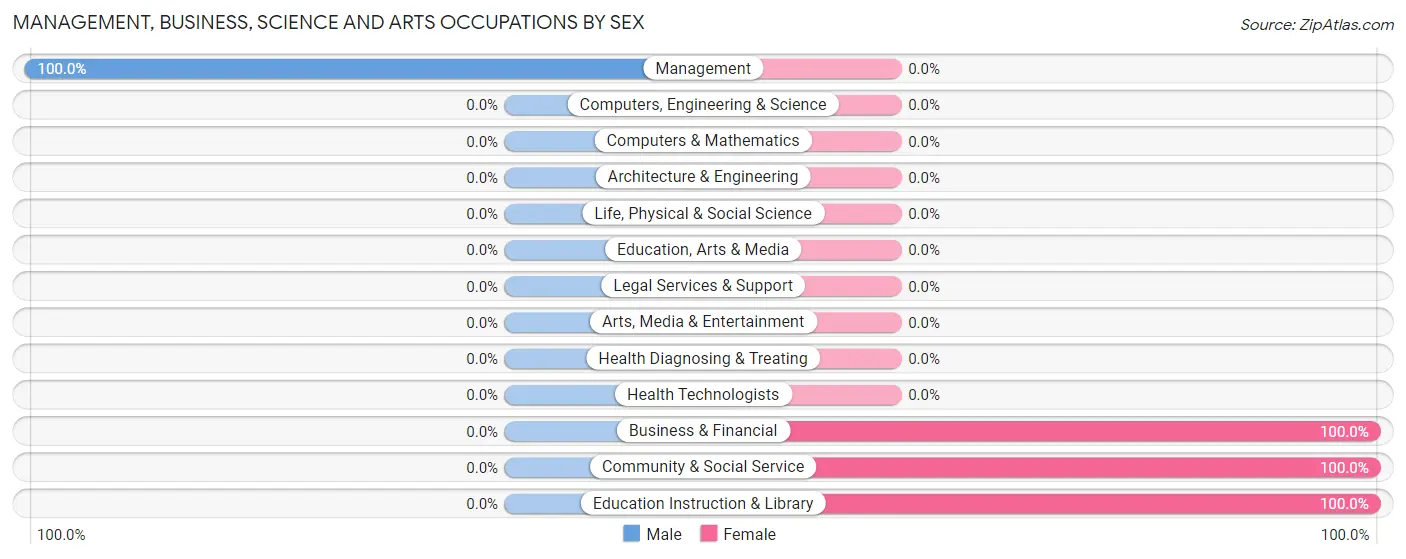
| Occupation | Male | Female |
| Management | 25 (100.0%) | 0 (0.0%) |
| Business & Financial | 0 (0.0%) | 9 (100.0%) |
| Computers, Engineering & Science | 0 (0.0%) | 0 (0.0%) |
| Computers & Mathematics | 0 (0.0%) | 0 (0.0%) |
| Architecture & Engineering | 0 (0.0%) | 0 (0.0%) |
| Life, Physical & Social Science | 0 (0.0%) | 0 (0.0%) |
| Community & Social Service | 0 (0.0%) | 9 (100.0%) |
| Education, Arts & Media | 0 (0.0%) | 0 (0.0%) |
| Legal Services & Support | 0 (0.0%) | 0 (0.0%) |
| Education Instruction & Library | 0 (0.0%) | 9 (100.0%) |
| Arts, Media & Entertainment | 0 (0.0%) | 0 (0.0%) |
| Health Diagnosing & Treating | 0 (0.0%) | 0 (0.0%) |
| Health Technologists | 0 (0.0%) | 0 (0.0%) |
| Total (Category) | 25 (58.1%) | 18 (41.9%) |
| Total (Overall) | 79 (59.4%) | 54 (40.6%) |
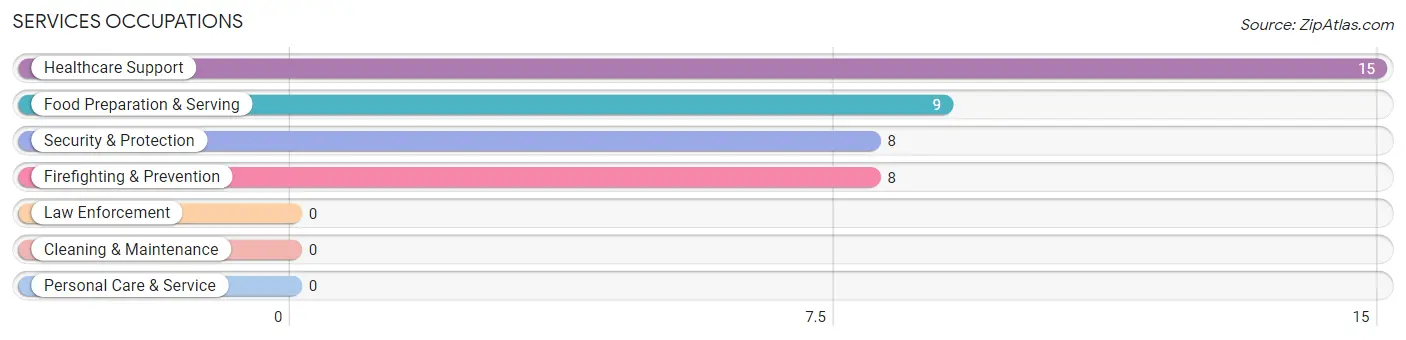
Services Occupations
The most common Services occupations in Casa Colorada are Healthcare Support (15 | 11.3%), Food Preparation & Serving (9 | 6.8%), Security & Protection (8 | 6.0%), and Firefighting & Prevention (8 | 6.0%).
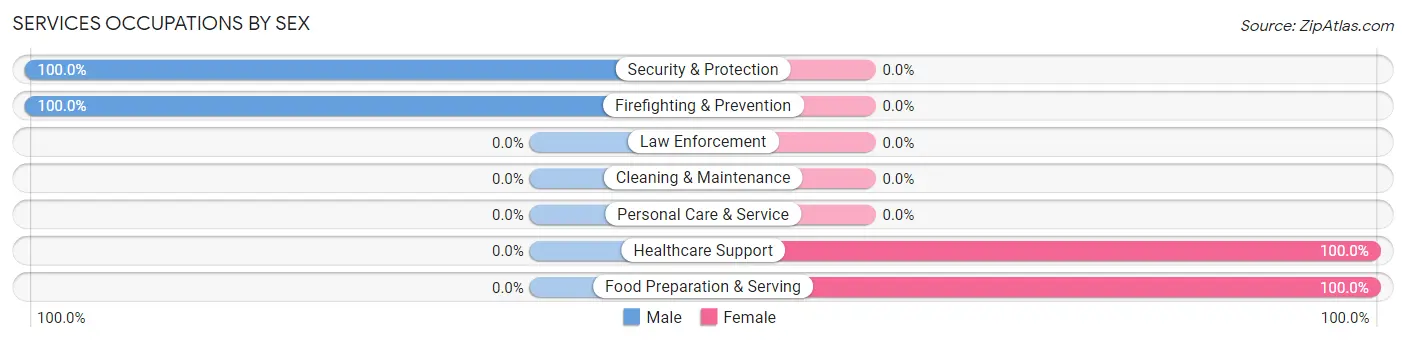
Services Occupations by Sex
Within the Services occupations in Casa Colorada, the most male-oriented occupations are Security & Protection (100.0%), and Firefighting & Prevention (100.0%), while the most female-oriented occupations are Healthcare Support (100.0%), and Food Preparation & Serving (100.0%).
| Occupation | Male | Female |
| Healthcare Support | 0 (0.0%) | 15 (100.0%) |
| Security & Protection | 8 (100.0%) | 0 (0.0%) |
| Firefighting & Prevention | 8 (100.0%) | 0 (0.0%) |
| Law Enforcement | 0 (0.0%) | 0 (0.0%) |
| Food Preparation & Serving | 0 (0.0%) | 9 (100.0%) |
| Cleaning & Maintenance | 0 (0.0%) | 0 (0.0%) |
| Personal Care & Service | 0 (0.0%) | 0 (0.0%) |
| Total (Category) | 8 (25.0%) | 24 (75.0%) |
| Total (Overall) | 79 (59.4%) | 54 (40.6%) |
Sales and Office Occupations
The most common Sales and Office occupations in Casa Colorada are , and Office & Administration (25 | 18.8%).

Sales and Office Occupations by Sex

| Occupation | Male | Female |
| Sales & Related | 0 (0.0%) | 0 (0.0%) |
| Office & Administration | 25 (100.0%) | 0 (0.0%) |
| Total (Category) | 25 (100.0%) | 0 (0.0%) |
| Total (Overall) | 79 (59.4%) | 54 (40.6%) |
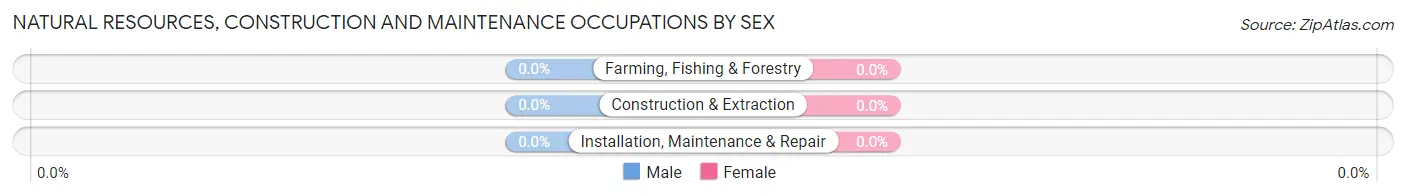
Natural Resources, Construction and Maintenance Occupations

Natural Resources, Construction and Maintenance Occupations by Sex
| Occupation | Male | Female |
| Farming, Fishing & Forestry | 0 (0.0%) | 0 (0.0%) |
| Construction & Extraction | 0 (0.0%) | 0 (0.0%) |
| Installation, Maintenance & Repair | 0 (0.0%) | 0 (0.0%) |
| Total (Category) | 0 (0.0%) | 0 (0.0%) |
| Total (Overall) | 79 (59.4%) | 54 (40.6%) |
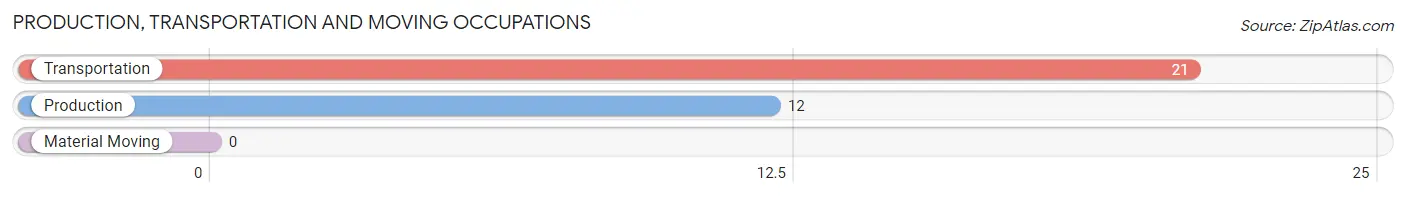
Production, Transportation and Moving Occupations
The most common Production, Transportation and Moving occupations in Casa Colorada are Transportation (21 | 15.8%), and Production (12 | 9.0%).
Production, Transportation and Moving Occupations by Sex
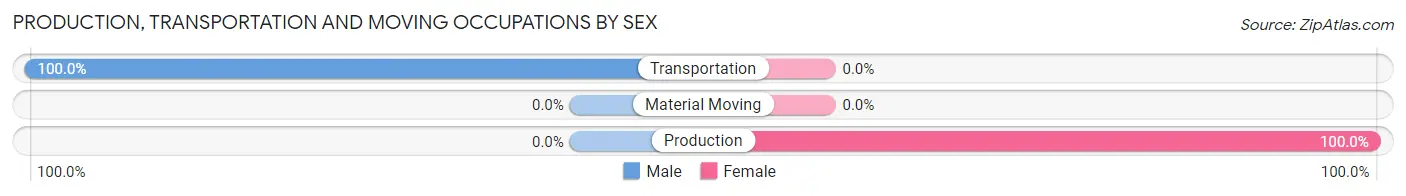
| Occupation | Male | Female |
| Production | 0 (0.0%) | 12 (100.0%) |
| Transportation | 21 (100.0%) | 0 (0.0%) |
| Material Moving | 0 (0.0%) | 0 (0.0%) |
| Total (Category) | 21 (63.6%) | 12 (36.4%) |
| Total (Overall) | 79 (59.4%) | 54 (40.6%) |
Employment Industries by Sex in Casa Colorada
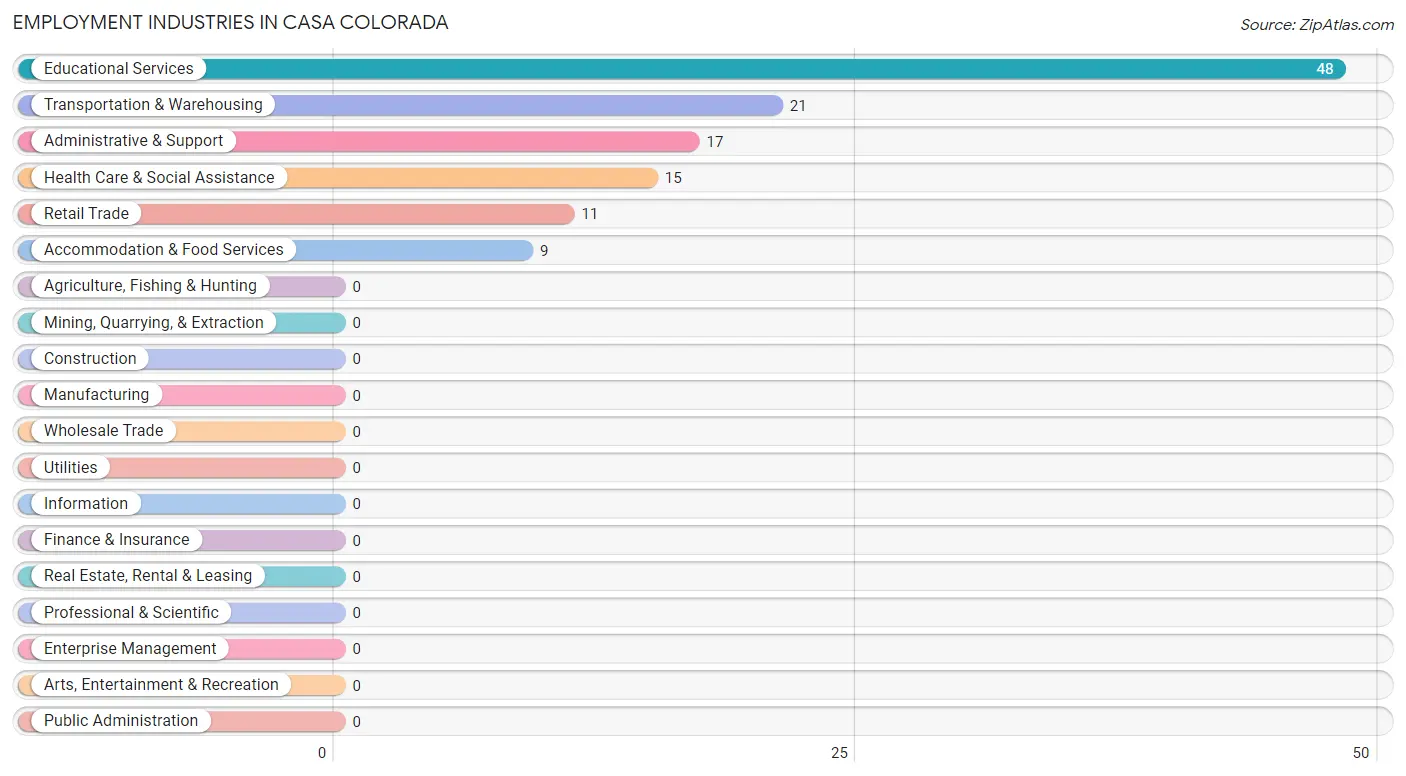
Employment Industries in Casa Colorada
The major employment industries in Casa Colorada include Educational Services (48 | 36.1%), Transportation & Warehousing (21 | 15.8%), Administrative & Support (17 | 12.8%), Health Care & Social Assistance (15 | 11.3%), and Retail Trade (11 | 8.3%).
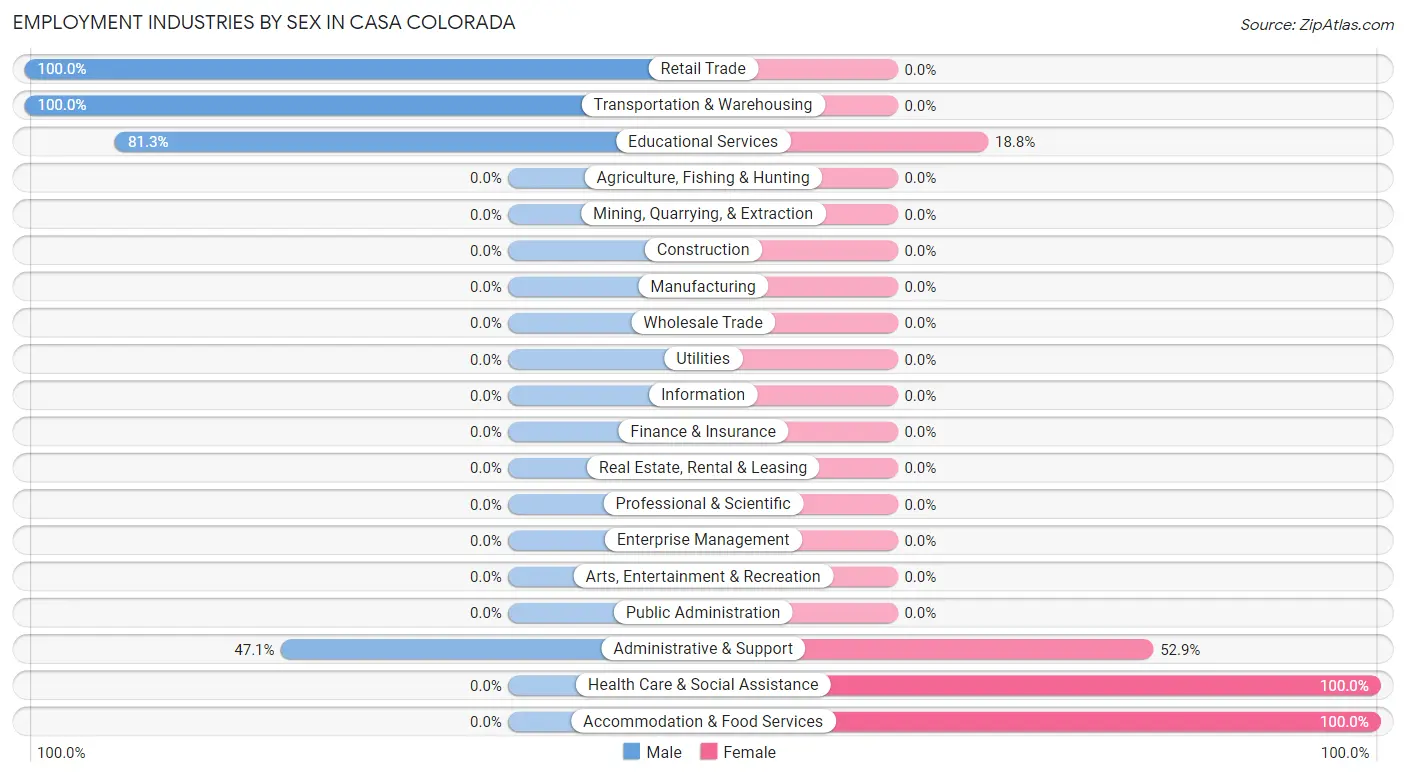
Employment Industries by Sex in Casa Colorada
The Casa Colorada industries that see more men than women are Retail Trade (100.0%), Transportation & Warehousing (100.0%), and Educational Services (81.2%), whereas the industries that tend to have a higher number of women are Health Care & Social Assistance (100.0%), Accommodation & Food Services (100.0%), and Administrative & Support (52.9%).
| Industry | Male | Female |
| Agriculture, Fishing & Hunting | 0 (0.0%) | 0 (0.0%) |
| Mining, Quarrying, & Extraction | 0 (0.0%) | 0 (0.0%) |
| Construction | 0 (0.0%) | 0 (0.0%) |
| Manufacturing | 0 (0.0%) | 0 (0.0%) |
| Wholesale Trade | 0 (0.0%) | 0 (0.0%) |
| Retail Trade | 11 (100.0%) | 0 (0.0%) |
| Transportation & Warehousing | 21 (100.0%) | 0 (0.0%) |
| Utilities | 0 (0.0%) | 0 (0.0%) |
| Information | 0 (0.0%) | 0 (0.0%) |
| Finance & Insurance | 0 (0.0%) | 0 (0.0%) |
| Real Estate, Rental & Leasing | 0 (0.0%) | 0 (0.0%) |
| Professional & Scientific | 0 (0.0%) | 0 (0.0%) |
| Enterprise Management | 0 (0.0%) | 0 (0.0%) |
| Administrative & Support | 8 (47.1%) | 9 (52.9%) |
| Educational Services | 39 (81.2%) | 9 (18.8%) |
| Health Care & Social Assistance | 0 (0.0%) | 15 (100.0%) |
| Arts, Entertainment & Recreation | 0 (0.0%) | 0 (0.0%) |
| Accommodation & Food Services | 0 (0.0%) | 9 (100.0%) |
| Public Administration | 0 (0.0%) | 0 (0.0%) |
| Total | 79 (59.4%) | 54 (40.6%) |
Education in Casa Colorada
School Enrollment in Casa Colorada
The most common levels of schooling among the 70 students in Casa Colorada are high school (26 | 37.1%), college / undergraduate (24 | 34.3%), and middle school (12 | 17.1%).
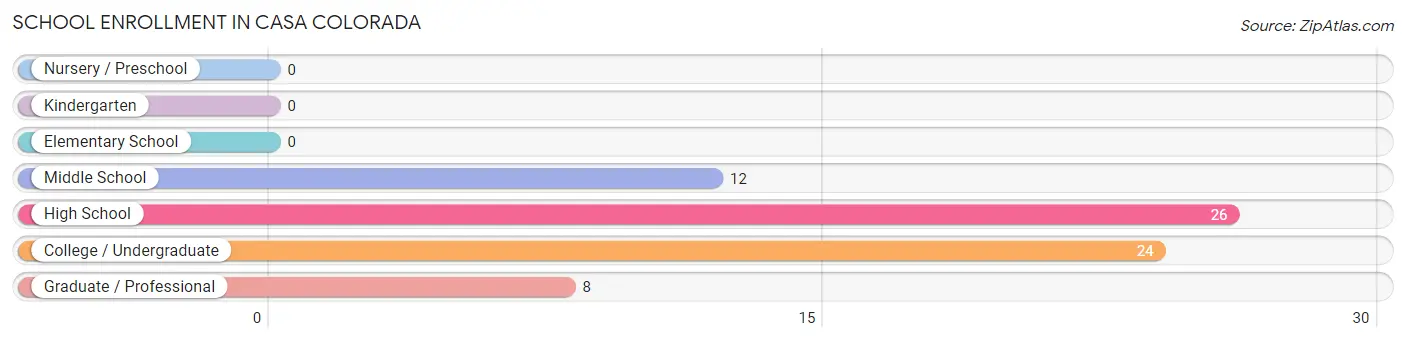
| School Level | # Students | % Students |
| Nursery / Preschool | 0 | 0.0% |
| Kindergarten | 0 | 0.0% |
| Elementary School | 0 | 0.0% |
| Middle School | 12 | 17.1% |
| High School | 26 | 37.1% |
| College / Undergraduate | 24 | 34.3% |
| Graduate / Professional | 8 | 11.4% |
| Total | 70 | 100.0% |
School Enrollment by Age by Funding Source in Casa Colorada
Out of a total of 70 students who are enrolled in schools in Casa Colorada, 14 (20.0%) attend a private institution, while the remaining 56 (80.0%) are enrolled in public schools. The age group of 35 years and over has the highest likelihood of being enrolled in private schools, with 14 (63.6% in the age bracket) enrolled. Conversely, the age group of 10 to 14 year olds has the lowest likelihood of being enrolled in a private school, with 24 (100.0% in the age bracket) attending a public institution.
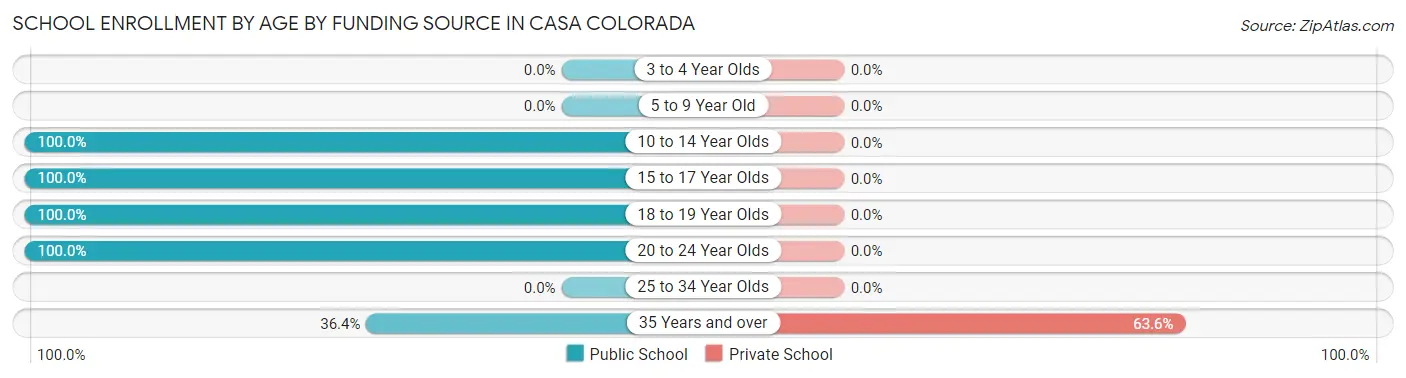
| Age Bracket | Public School | Private School |
| 3 to 4 Year Olds | 0 (0.0%) | 0 (0.0%) |
| 5 to 9 Year Old | 0 (0.0%) | 0 (0.0%) |
| 10 to 14 Year Olds | 24 (100.0%) | 0 (0.0%) |
| 15 to 17 Year Olds | 5 (100.0%) | 0 (0.0%) |
| 18 to 19 Year Olds | 9 (100.0%) | 0 (0.0%) |
| 20 to 24 Year Olds | 10 (100.0%) | 0 (0.0%) |
| 25 to 34 Year Olds | 0 (0.0%) | 0 (0.0%) |
| 35 Years and over | 8 (36.4%) | 14 (63.6%) |
| Total | 56 (80.0%) | 14 (20.0%) |
Educational Attainment by Field of Study in Casa Colorada
Business (25 | 30.1%), education (18 | 21.7%), science & technology (12 | 14.5%), arts & humanities (12 | 14.5%), and social sciences (8 | 9.6%) are the most common fields of study among 83 individuals in Casa Colorada who have obtained a bachelor's degree or higher.
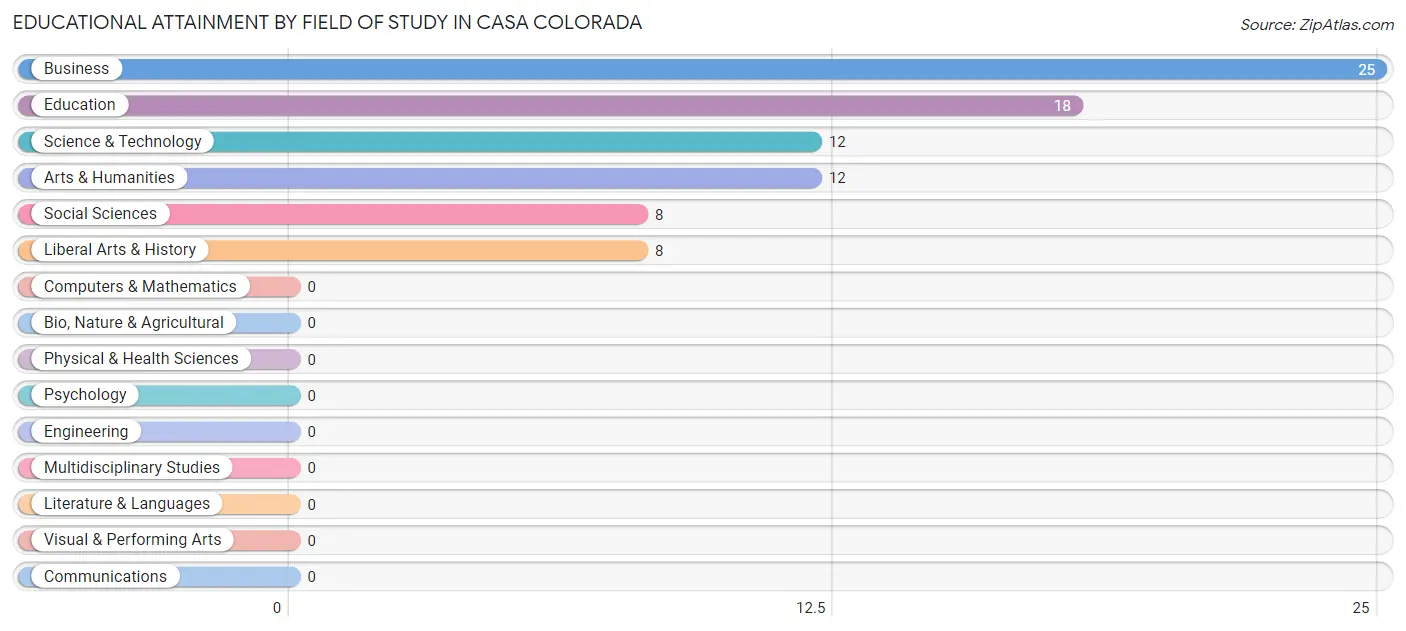
| Field of Study | # Graduates | % Graduates |
| Computers & Mathematics | 0 | 0.0% |
| Bio, Nature & Agricultural | 0 | 0.0% |
| Physical & Health Sciences | 0 | 0.0% |
| Psychology | 0 | 0.0% |
| Social Sciences | 8 | 9.6% |
| Engineering | 0 | 0.0% |
| Multidisciplinary Studies | 0 | 0.0% |
| Science & Technology | 12 | 14.5% |
| Business | 25 | 30.1% |
| Education | 18 | 21.7% |
| Literature & Languages | 0 | 0.0% |
| Liberal Arts & History | 8 | 9.6% |
| Visual & Performing Arts | 0 | 0.0% |
| Communications | 0 | 0.0% |
| Arts & Humanities | 12 | 14.5% |
| Total | 83 | 100.0% |
Transportation & Commute in Casa Colorada
Vehicle Availability by Sex in Casa Colorada
The most prevalent vehicle ownership categories in Casa Colorada are males with 2 vehicles (31, accounting for 39.2%) and females with 2 vehicles (30, making up 57.4%).
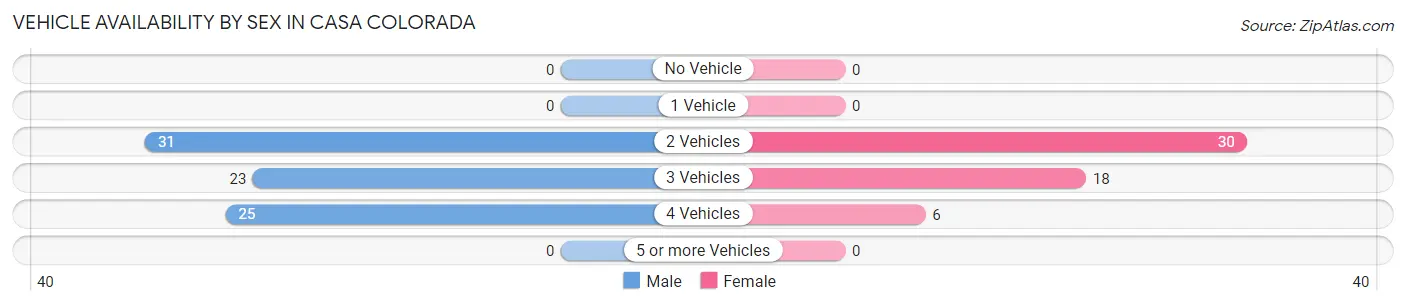
| Vehicles Available | Male | Female |
| No Vehicle | 0 (0.0%) | 0 (0.0%) |
| 1 Vehicle | 0 (0.0%) | 0 (0.0%) |
| 2 Vehicles | 31 (39.2%) | 30 (55.6%) |
| 3 Vehicles | 23 (29.1%) | 18 (33.3%) |
| 4 Vehicles | 25 (31.7%) | 6 (11.1%) |
| 5 or more Vehicles | 0 (0.0%) | 0 (0.0%) |
| Total | 79 (100.0%) | 54 (100.0%) |
Commute Time in Casa Colorada
The most frequently occuring commute durations in Casa Colorada are 45 to 59 minutes (80 commuters, 60.2%), 20 to 24 minutes (35 commuters, 26.3%), and 30 to 34 minutes (9 commuters, 6.8%).

| Commute Time | # Commuters | % Commuters |
| Less than 5 Minutes | 0 | 0.0% |
| 5 to 9 Minutes | 0 | 0.0% |
| 10 to 14 Minutes | 0 | 0.0% |
| 15 to 19 Minutes | 6 | 4.5% |
| 20 to 24 Minutes | 35 | 26.3% |
| 25 to 29 Minutes | 0 | 0.0% |
| 30 to 34 Minutes | 9 | 6.8% |
| 35 to 39 Minutes | 0 | 0.0% |
| 40 to 44 Minutes | 3 | 2.3% |
| 45 to 59 Minutes | 80 | 60.2% |
| 60 to 89 Minutes | 0 | 0.0% |
| 90 or more Minutes | 0 | 0.0% |
Commute Time by Sex in Casa Colorada
The most common commute times in Casa Colorada are 45 to 59 minutes (56 commuters, 70.9%) for males and 45 to 59 minutes (24 commuters, 44.4%) for females.
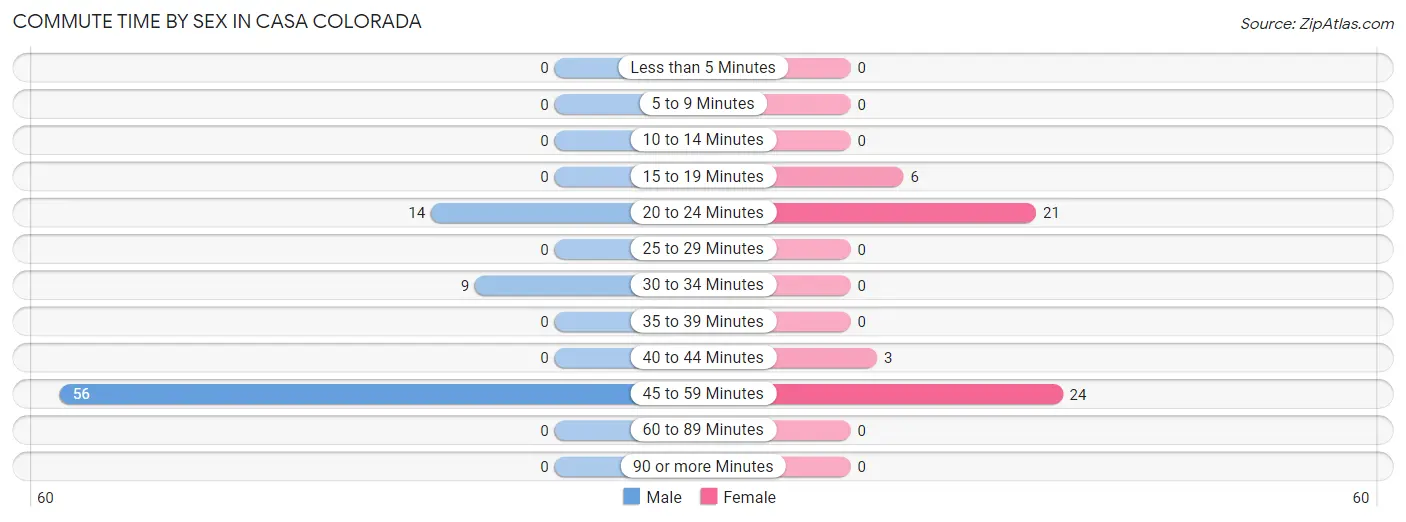
| Commute Time | Male | Female |
| Less than 5 Minutes | 0 (0.0%) | 0 (0.0%) |
| 5 to 9 Minutes | 0 (0.0%) | 0 (0.0%) |
| 10 to 14 Minutes | 0 (0.0%) | 0 (0.0%) |
| 15 to 19 Minutes | 0 (0.0%) | 6 (11.1%) |
| 20 to 24 Minutes | 14 (17.7%) | 21 (38.9%) |
| 25 to 29 Minutes | 0 (0.0%) | 0 (0.0%) |
| 30 to 34 Minutes | 9 (11.4%) | 0 (0.0%) |
| 35 to 39 Minutes | 0 (0.0%) | 0 (0.0%) |
| 40 to 44 Minutes | 0 (0.0%) | 3 (5.6%) |
| 45 to 59 Minutes | 56 (70.9%) | 24 (44.4%) |
| 60 to 89 Minutes | 0 (0.0%) | 0 (0.0%) |
| 90 or more Minutes | 0 (0.0%) | 0 (0.0%) |
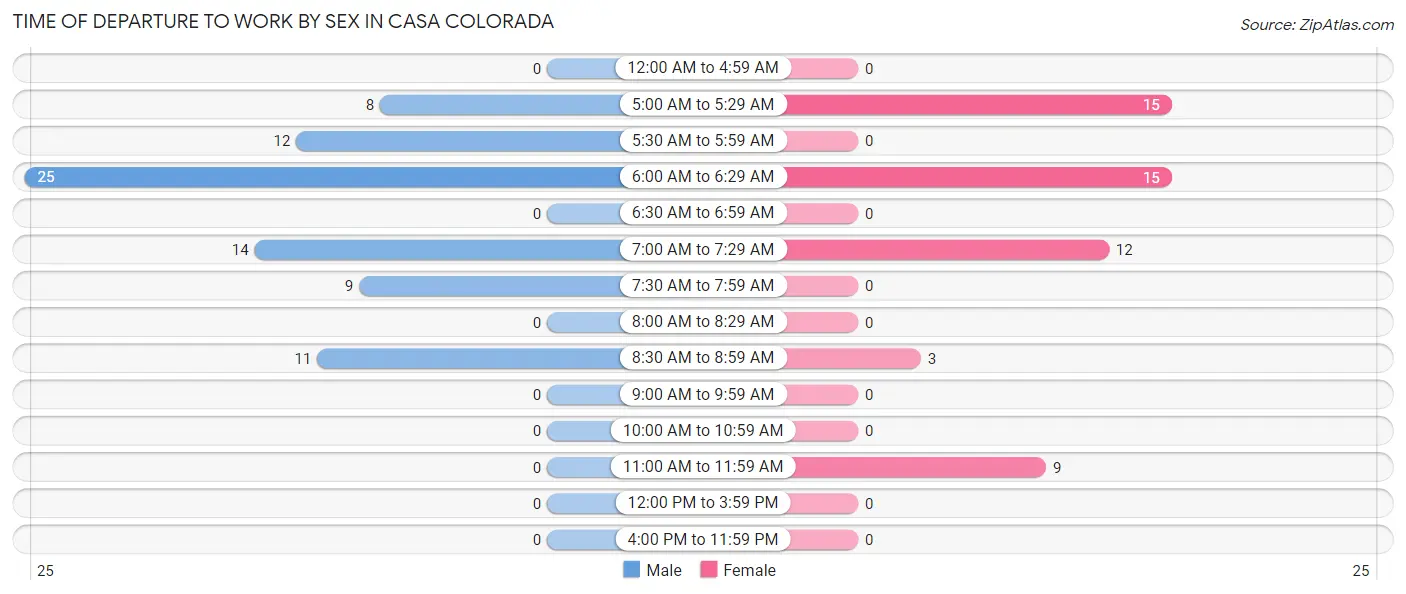
Time of Departure to Work by Sex in Casa Colorada
The most frequent times of departure to work in Casa Colorada are 6:00 AM to 6:29 AM (25, 31.7%) for males and 5:00 AM to 5:29 AM (15, 27.8%) for females.
| Time of Departure | Male | Female |
| 12:00 AM to 4:59 AM | 0 (0.0%) | 0 (0.0%) |
| 5:00 AM to 5:29 AM | 8 (10.1%) | 15 (27.8%) |
| 5:30 AM to 5:59 AM | 12 (15.2%) | 0 (0.0%) |
| 6:00 AM to 6:29 AM | 25 (31.7%) | 15 (27.8%) |
| 6:30 AM to 6:59 AM | 0 (0.0%) | 0 (0.0%) |
| 7:00 AM to 7:29 AM | 14 (17.7%) | 12 (22.2%) |
| 7:30 AM to 7:59 AM | 9 (11.4%) | 0 (0.0%) |
| 8:00 AM to 8:29 AM | 0 (0.0%) | 0 (0.0%) |
| 8:30 AM to 8:59 AM | 11 (13.9%) | 3 (5.6%) |
| 9:00 AM to 9:59 AM | 0 (0.0%) | 0 (0.0%) |
| 10:00 AM to 10:59 AM | 0 (0.0%) | 0 (0.0%) |
| 11:00 AM to 11:59 AM | 0 (0.0%) | 9 (16.7%) |
| 12:00 PM to 3:59 PM | 0 (0.0%) | 0 (0.0%) |
| 4:00 PM to 11:59 PM | 0 (0.0%) | 0 (0.0%) |
| Total | 79 (100.0%) | 54 (100.0%) |
Housing Occupancy in Casa Colorada
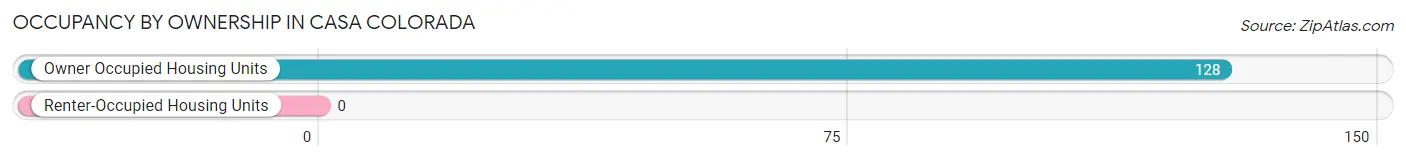
Occupancy by Ownership in Casa Colorada
Of the total 128 dwellings in Casa Colorada, owner-occupied units account for 128 (100.0%), while renter-occupied units make up 0 (0.0%).
| Occupancy | # Housing Units | % Housing Units |
| Owner Occupied Housing Units | 128 | 100.0% |
| Renter-Occupied Housing Units | 0 | 0.0% |
| Total Occupied Housing Units | 128 | 100.0% |
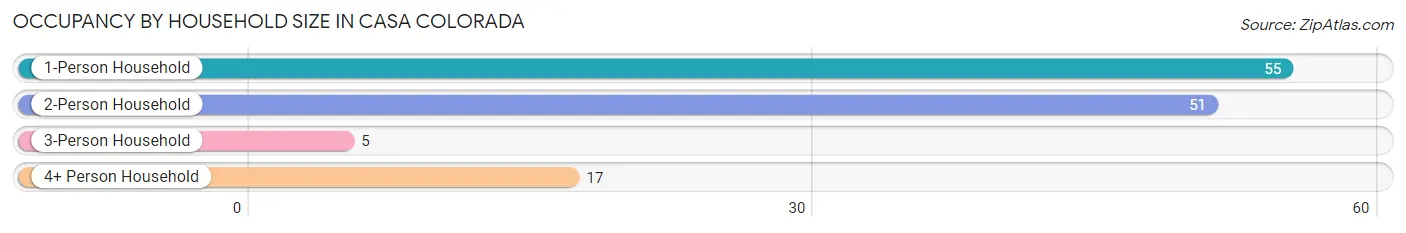
Occupancy by Household Size in Casa Colorada
| Household Size | # Housing Units | % Housing Units |
| 1-Person Household | 55 | 43.0% |
| 2-Person Household | 51 | 39.8% |
| 3-Person Household | 5 | 3.9% |
| 4+ Person Household | 17 | 13.3% |
| Total Housing Units | 128 | 100.0% |
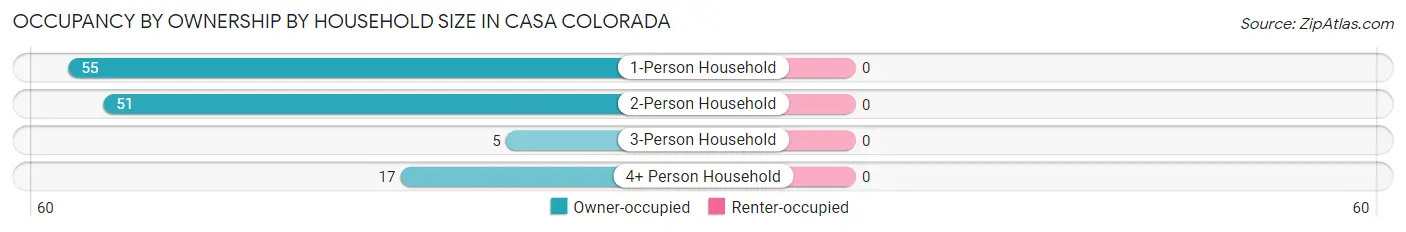
Occupancy by Ownership by Household Size in Casa Colorada
| Household Size | Owner-occupied | Renter-occupied |
| 1-Person Household | 55 (100.0%) | 0 (0.0%) |
| 2-Person Household | 51 (100.0%) | 0 (0.0%) |
| 3-Person Household | 5 (100.0%) | 0 (0.0%) |
| 4+ Person Household | 17 (100.0%) | 0 (0.0%) |
| Total Housing Units | 128 (100.0%) | 0 (0.0%) |
Occupancy by Educational Attainment in Casa Colorada
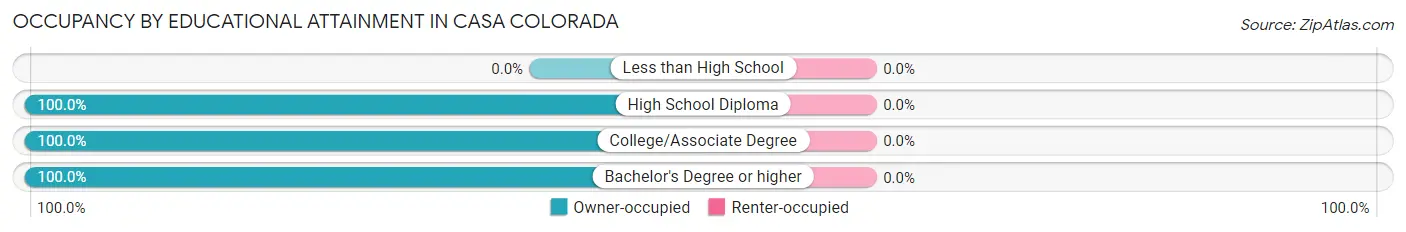
| Household Size | Owner-occupied | Renter-occupied |
| Less than High School | 0 (0.0%) | 0 (0.0%) |
| High School Diploma | 28 (100.0%) | 0 (0.0%) |
| College/Associate Degree | 44 (100.0%) | 0 (0.0%) |
| Bachelor's Degree or higher | 56 (100.0%) | 0 (0.0%) |
Occupancy by Age of Householder in Casa Colorada
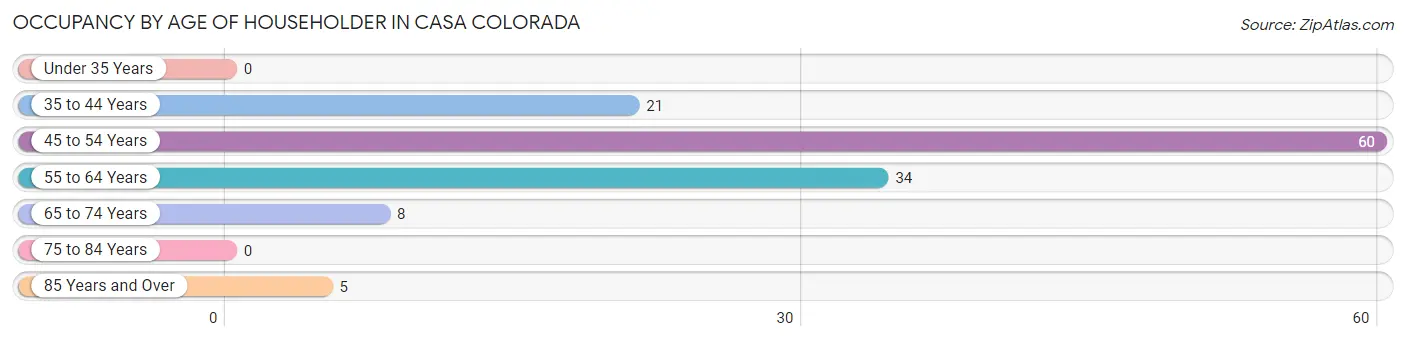
| Age Bracket | # Households | % Households |
| Under 35 Years | 0 | 0.0% |
| 35 to 44 Years | 21 | 16.4% |
| 45 to 54 Years | 60 | 46.9% |
| 55 to 64 Years | 34 | 26.6% |
| 65 to 74 Years | 8 | 6.2% |
| 75 to 84 Years | 0 | 0.0% |
| 85 Years and Over | 5 | 3.9% |
| Total | 128 | 100.0% |
Housing Finances in Casa Colorada
Median Income by Occupancy in Casa Colorada
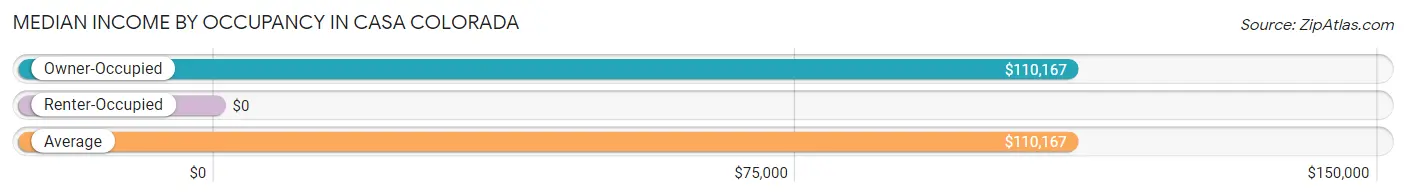
| Occupancy Type | # Households | Median Income |
| Owner-Occupied | 128 (100.0%) | $110,167 |
| Renter-Occupied | 0 (0.0%) | $0 |
| Average | 128 (100.0%) | $110,167 |
Occupancy by Householder Income Bracket in Casa Colorada
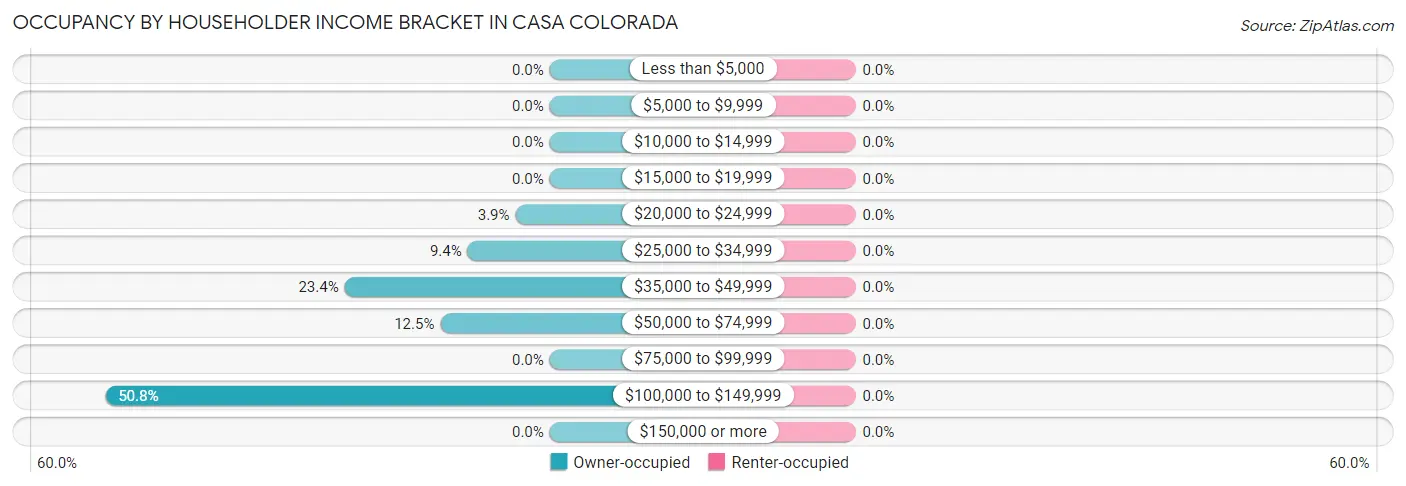
| Income Bracket | Owner-occupied | Renter-occupied |
| Less than $5,000 | 0 (0.0%) | 0 (0.0%) |
| $5,000 to $9,999 | 0 (0.0%) | 0 (0.0%) |
| $10,000 to $14,999 | 0 (0.0%) | 0 (0.0%) |
| $15,000 to $19,999 | 0 (0.0%) | 0 (0.0%) |
| $20,000 to $24,999 | 5 (3.9%) | 0 (0.0%) |
| $25,000 to $34,999 | 12 (9.4%) | 0 (0.0%) |
| $35,000 to $49,999 | 30 (23.4%) | 0 (0.0%) |
| $50,000 to $74,999 | 16 (12.5%) | 0 (0.0%) |
| $75,000 to $99,999 | 0 (0.0%) | 0 (0.0%) |
| $100,000 to $149,999 | 65 (50.8%) | 0 (0.0%) |
| $150,000 or more | 0 (0.0%) | 0 (0.0%) |
| Total | 128 (100.0%) | 0 (0.0%) |
Monthly Housing Cost Tiers in Casa Colorada
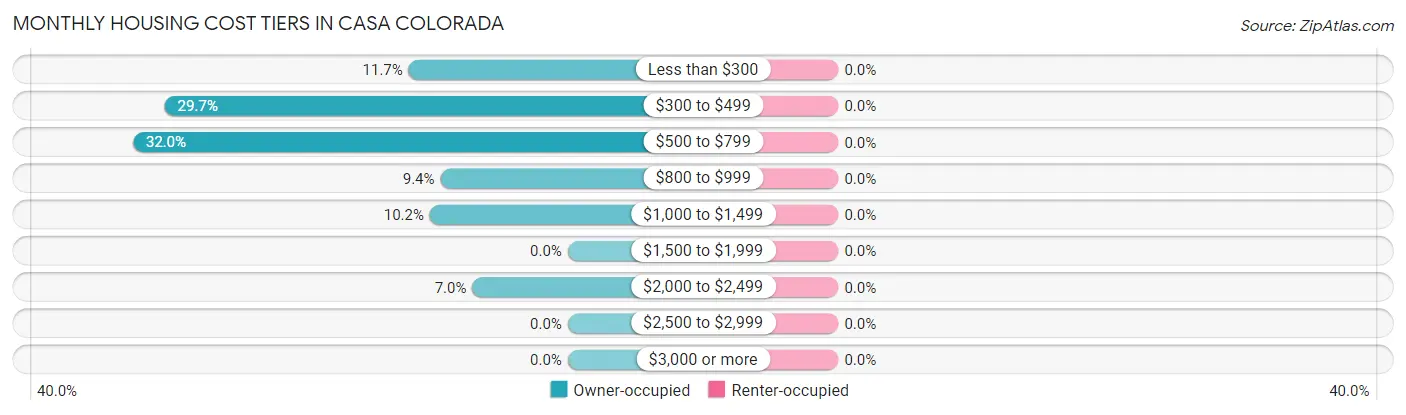
| Monthly Cost | Owner-occupied | Renter-occupied |
| Less than $300 | 15 (11.7%) | 0 (0.0%) |
| $300 to $499 | 38 (29.7%) | 0 (0.0%) |
| $500 to $799 | 41 (32.0%) | 0 (0.0%) |
| $800 to $999 | 12 (9.4%) | 0 (0.0%) |
| $1,000 to $1,499 | 13 (10.2%) | 0 (0.0%) |
| $1,500 to $1,999 | 0 (0.0%) | 0 (0.0%) |
| $2,000 to $2,499 | 9 (7.0%) | 0 (0.0%) |
| $2,500 to $2,999 | 0 (0.0%) | 0 (0.0%) |
| $3,000 or more | 0 (0.0%) | 0 (0.0%) |
| Total | 128 (100.0%) | 0 (0.0%) |
Physical Housing Characteristics in Casa Colorada
Housing Structures in Casa Colorada
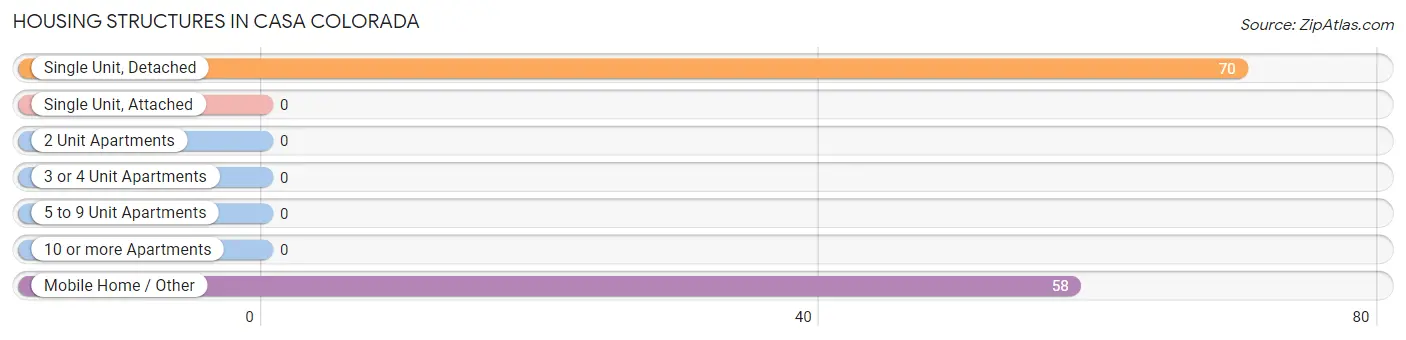
| Structure Type | # Housing Units | % Housing Units |
| Single Unit, Detached | 70 | 54.7% |
| Single Unit, Attached | 0 | 0.0% |
| 2 Unit Apartments | 0 | 0.0% |
| 3 or 4 Unit Apartments | 0 | 0.0% |
| 5 to 9 Unit Apartments | 0 | 0.0% |
| 10 or more Apartments | 0 | 0.0% |
| Mobile Home / Other | 58 | 45.3% |
| Total | 128 | 100.0% |
Housing Structures by Occupancy in Casa Colorada
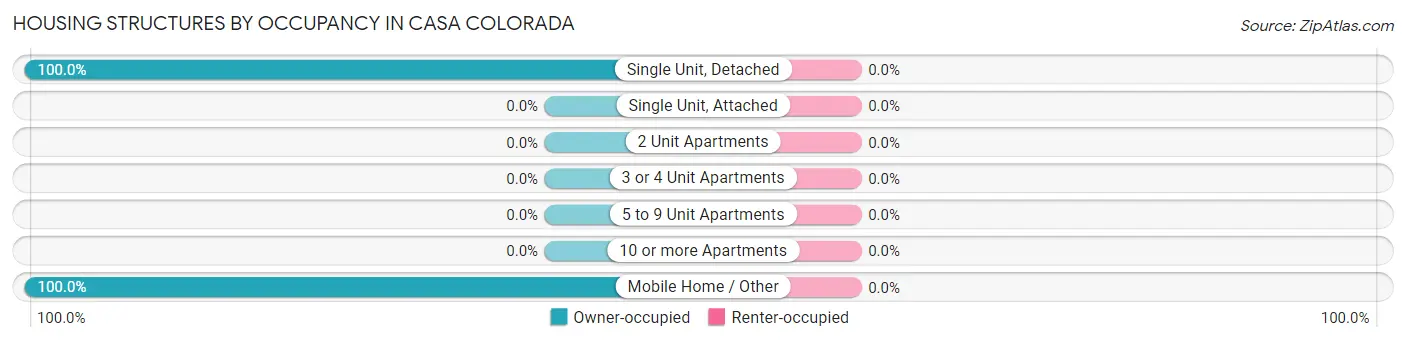
| Structure Type | Owner-occupied | Renter-occupied |
| Single Unit, Detached | 70 (100.0%) | 0 (0.0%) |
| Single Unit, Attached | 0 (0.0%) | 0 (0.0%) |
| 2 Unit Apartments | 0 (0.0%) | 0 (0.0%) |
| 3 or 4 Unit Apartments | 0 (0.0%) | 0 (0.0%) |
| 5 to 9 Unit Apartments | 0 (0.0%) | 0 (0.0%) |
| 10 or more Apartments | 0 (0.0%) | 0 (0.0%) |
| Mobile Home / Other | 58 (100.0%) | 0 (0.0%) |
| Total | 128 (100.0%) | 0 (0.0%) |
Housing Structures by Number of Rooms in Casa Colorada
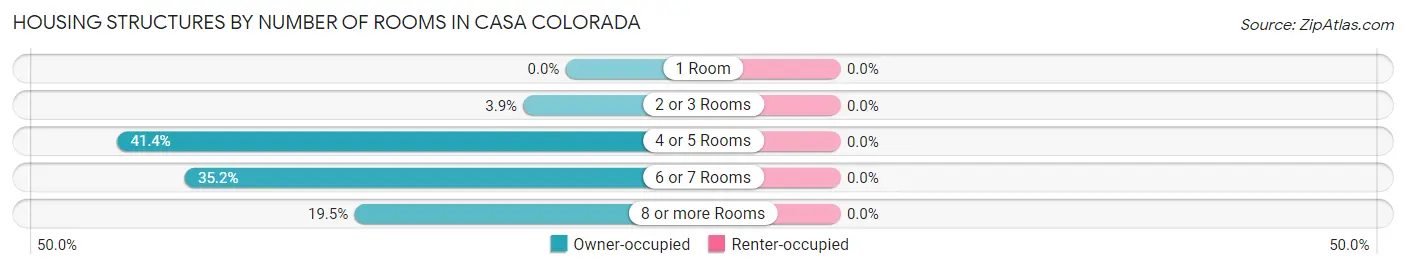
| Number of Rooms | Owner-occupied | Renter-occupied |
| 1 Room | 0 (0.0%) | 0 (0.0%) |
| 2 or 3 Rooms | 5 (3.9%) | 0 (0.0%) |
| 4 or 5 Rooms | 53 (41.4%) | 0 (0.0%) |
| 6 or 7 Rooms | 45 (35.2%) | 0 (0.0%) |
| 8 or more Rooms | 25 (19.5%) | 0 (0.0%) |
| Total | 128 (100.0%) | 0 (0.0%) |
Housing Structure by Heating Type in Casa Colorada
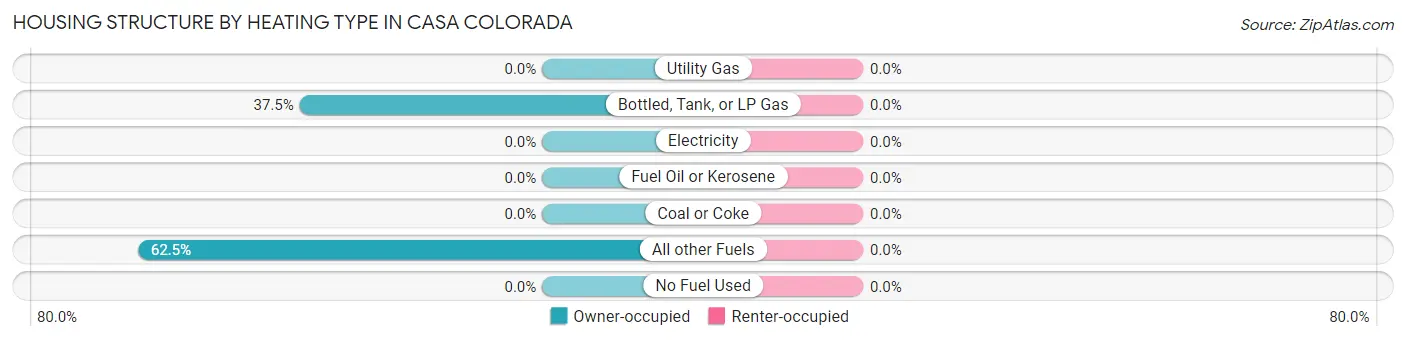
| Heating Type | Owner-occupied | Renter-occupied |
| Utility Gas | 0 (0.0%) | 0 (0.0%) |
| Bottled, Tank, or LP Gas | 48 (37.5%) | 0 (0.0%) |
| Electricity | 0 (0.0%) | 0 (0.0%) |
| Fuel Oil or Kerosene | 0 (0.0%) | 0 (0.0%) |
| Coal or Coke | 0 (0.0%) | 0 (0.0%) |
| All other Fuels | 80 (62.5%) | 0 (0.0%) |
| No Fuel Used | 0 (0.0%) | 0 (0.0%) |
| Total | 128 (100.0%) | 0 (0.0%) |
Household Vehicle Usage in Casa Colorada
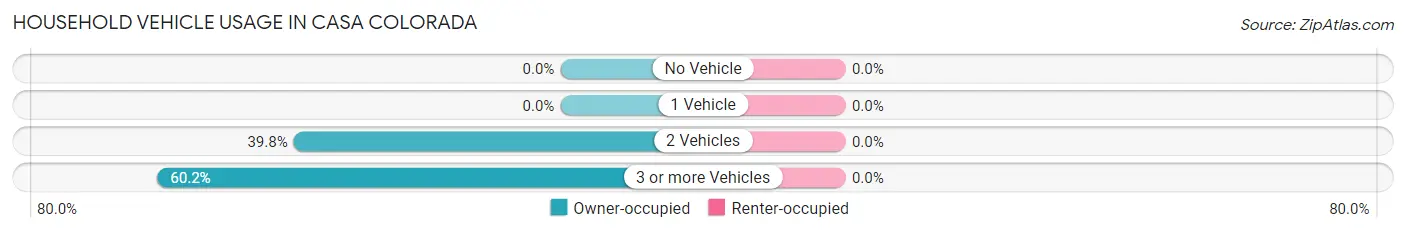
| Vehicles per Household | Owner-occupied | Renter-occupied |
| No Vehicle | 0 (0.0%) | 0 (0.0%) |
| 1 Vehicle | 0 (0.0%) | 0 (0.0%) |
| 2 Vehicles | 51 (39.8%) | 0 (0.0%) |
| 3 or more Vehicles | 77 (60.2%) | 0 (0.0%) |
| Total | 128 (100.0%) | 0 (0.0%) |
Real Estate & Mortgages in Casa Colorada
Real Estate and Mortgage Overview in Casa Colorada
| Characteristic | Without Mortgage | With Mortgage |
| Housing Units | 82 | 46 |
| Median Property Value | $206,700 | $157,500 |
| Median Household Income | - | - |
| Monthly Housing Costs | $360 | $0 |
| Real Estate Taxes | $1,224 | $12 |
Property Value by Mortgage Status in Casa Colorada
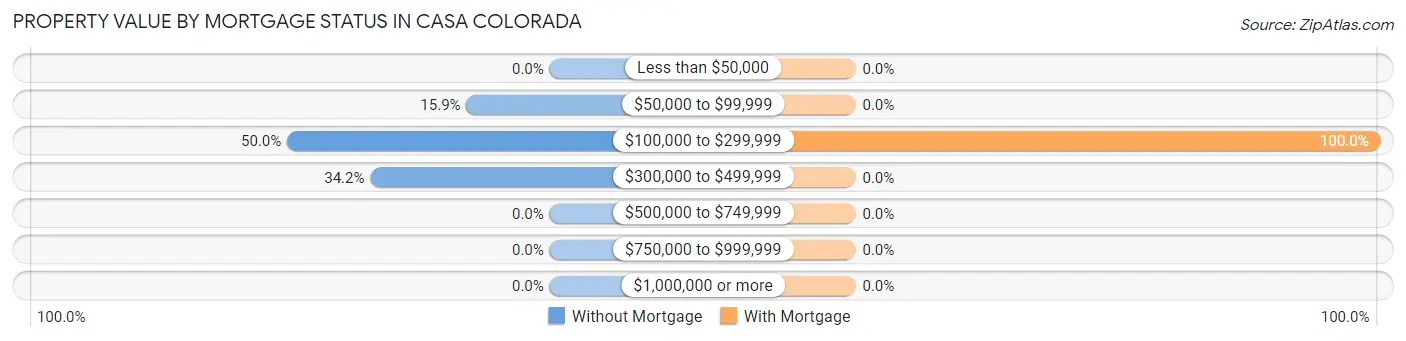
| Property Value | Without Mortgage | With Mortgage |
| Less than $50,000 | 0 (0.0%) | 0 (0.0%) |
| $50,000 to $99,999 | 13 (15.9%) | 0 (0.0%) |
| $100,000 to $299,999 | 41 (50.0%) | 46 (100.0%) |
| $300,000 to $499,999 | 28 (34.2%) | 0 (0.0%) |
| $500,000 to $749,999 | 0 (0.0%) | 0 (0.0%) |
| $750,000 to $999,999 | 0 (0.0%) | 0 (0.0%) |
| $1,000,000 or more | 0 (0.0%) | 0 (0.0%) |
| Total | 82 (100.0%) | 46 (100.0%) |
Household Income by Mortgage Status in Casa Colorada
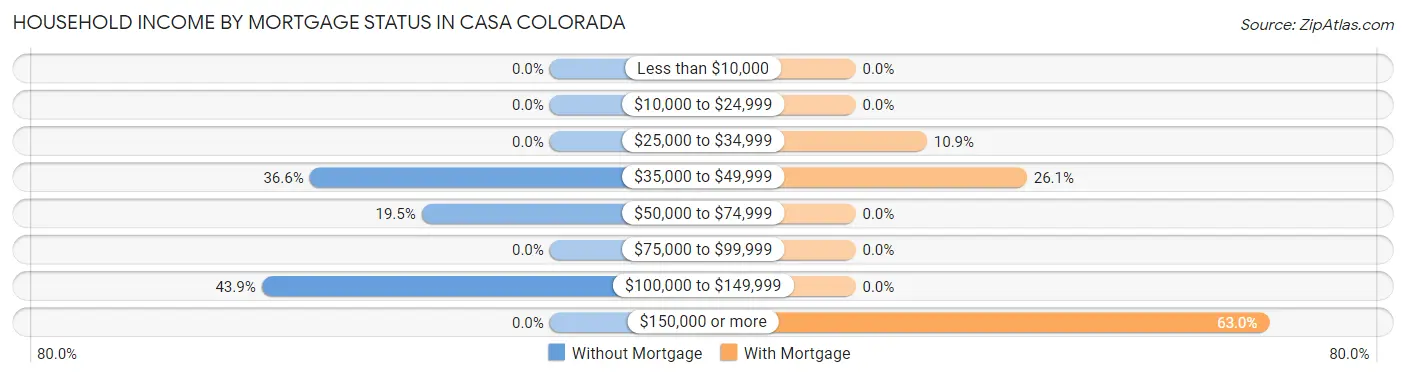
| Household Income | Without Mortgage | With Mortgage |
| Less than $10,000 | 0 (0.0%) | 0 (0.0%) |
| $10,000 to $24,999 | 0 (0.0%) | 0 (0.0%) |
| $25,000 to $34,999 | 0 (0.0%) | 5 (10.9%) |
| $35,000 to $49,999 | 30 (36.6%) | 12 (26.1%) |
| $50,000 to $74,999 | 16 (19.5%) | 0 (0.0%) |
| $75,000 to $99,999 | 0 (0.0%) | 0 (0.0%) |
| $100,000 to $149,999 | 36 (43.9%) | 0 (0.0%) |
| $150,000 or more | 0 (0.0%) | 29 (63.0%) |
| Total | 82 (100.0%) | 46 (100.0%) |
Property Value to Household Income Ratio in Casa Colorada
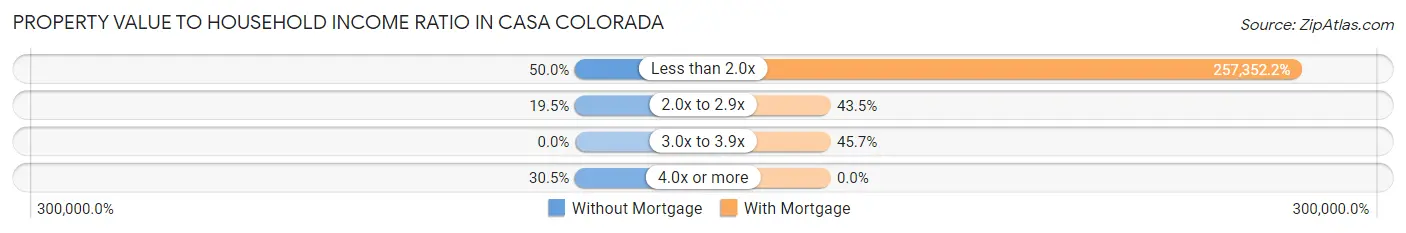
| Value-to-Income Ratio | Without Mortgage | With Mortgage |
| Less than 2.0x | 41 (50.0%) | 118,382 (257,352.2%) |
| 2.0x to 2.9x | 16 (19.5%) | 20 (43.5%) |
| 3.0x to 3.9x | 0 (0.0%) | 21 (45.7%) |
| 4.0x or more | 25 (30.5%) | 0 (0.0%) |
| Total | 82 (100.0%) | 46 (100.0%) |
Real Estate Taxes by Mortgage Status in Casa Colorada
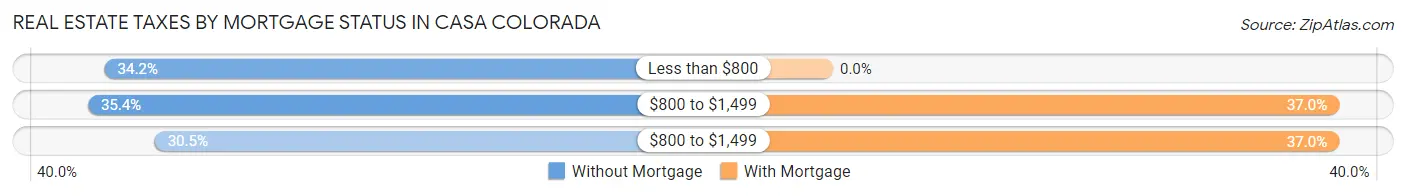
| Property Taxes | Without Mortgage | With Mortgage |
| Less than $800 | 28 (34.2%) | 0 (0.0%) |
| $800 to $1,499 | 29 (35.4%) | 17 (37.0%) |
| $800 to $1,499 | 25 (30.5%) | 17 (37.0%) |
| Total | 82 (100.0%) | 46 (100.0%) |
Health & Disability in Casa Colorada
Health Insurance Coverage by Age in Casa Colorada
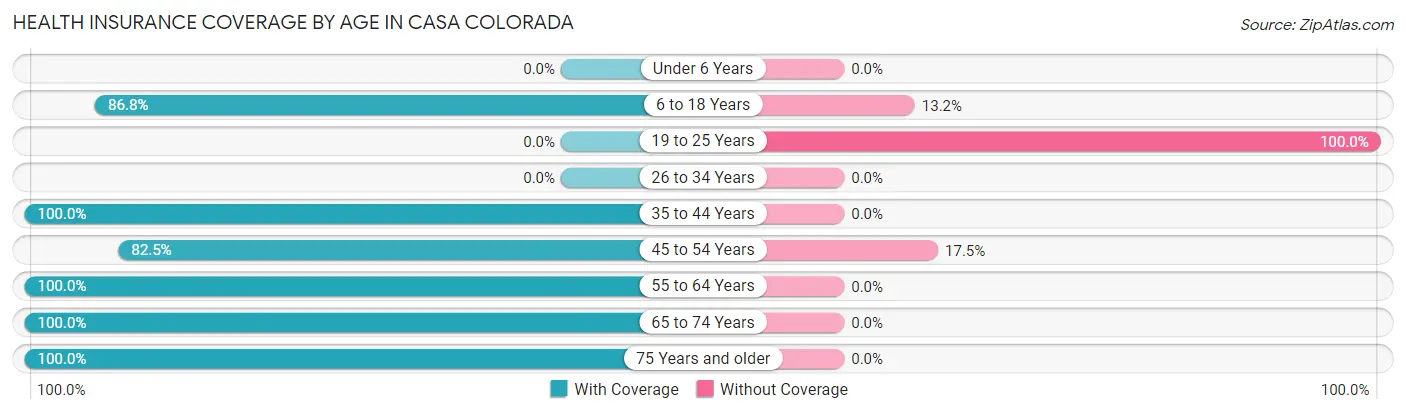
| Age Bracket | With Coverage | Without Coverage |
| Under 6 Years | 0 (0.0%) | 0 (0.0%) |
| 6 to 18 Years | 33 (86.8%) | 5 (13.2%) |
| 19 to 25 Years | 0 (0.0%) | 10 (100.0%) |
| 26 to 34 Years | 0 (0.0%) | 0 (0.0%) |
| 35 to 44 Years | 42 (100.0%) | 0 (0.0%) |
| 45 to 54 Years | 66 (82.5%) | 14 (17.5%) |
| 55 to 64 Years | 61 (100.0%) | 0 (0.0%) |
| 65 to 74 Years | 23 (100.0%) | 0 (0.0%) |
| 75 Years and older | 5 (100.0%) | 0 (0.0%) |
| Total | 230 (88.8%) | 29 (11.2%) |
Health Insurance Coverage by Citizenship Status in Casa Colorada

| Citizenship Status | With Coverage | Without Coverage |
| Native Born | 0 (0.0%) | 0 (0.0%) |
| Foreign Born, Citizen | 33 (86.8%) | 5 (13.2%) |
| Foreign Born, not a Citizen | 0 (0.0%) | 10 (100.0%) |
Health Insurance Coverage by Household Income in Casa Colorada
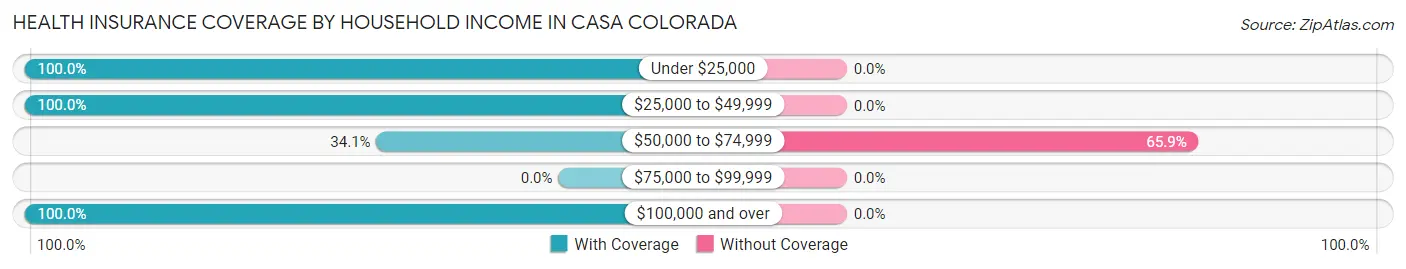
| Household Income | With Coverage | Without Coverage |
| Under $25,000 | 21 (100.0%) | 0 (0.0%) |
| $25,000 to $49,999 | 53 (100.0%) | 0 (0.0%) |
| $50,000 to $74,999 | 15 (34.1%) | 29 (65.9%) |
| $75,000 to $99,999 | 0 (0.0%) | 0 (0.0%) |
| $100,000 and over | 141 (100.0%) | 0 (0.0%) |
Public vs Private Health Insurance Coverage by Age in Casa Colorada
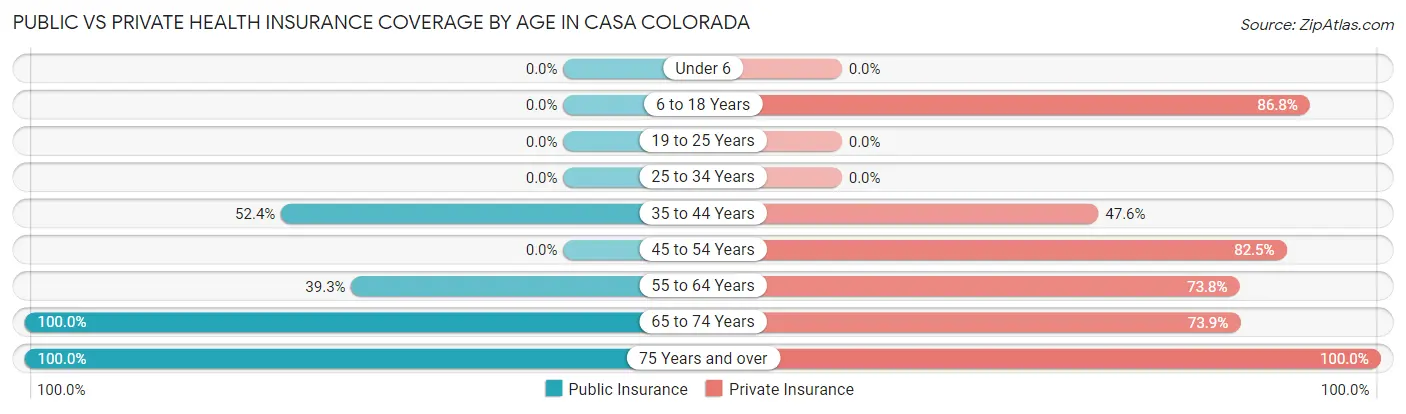
| Age Bracket | Public Insurance | Private Insurance |
| Under 6 | 0 (0.0%) | 0 (0.0%) |
| 6 to 18 Years | 0 (0.0%) | 33 (86.8%) |
| 19 to 25 Years | 0 (0.0%) | 0 (0.0%) |
| 25 to 34 Years | 0 (0.0%) | 0 (0.0%) |
| 35 to 44 Years | 22 (52.4%) | 20 (47.6%) |
| 45 to 54 Years | 0 (0.0%) | 66 (82.5%) |
| 55 to 64 Years | 24 (39.3%) | 45 (73.8%) |
| 65 to 74 Years | 23 (100.0%) | 17 (73.9%) |
| 75 Years and over | 5 (100.0%) | 5 (100.0%) |
| Total | 74 (28.6%) | 186 (71.8%) |
Disability Status by Sex by Age in Casa Colorada
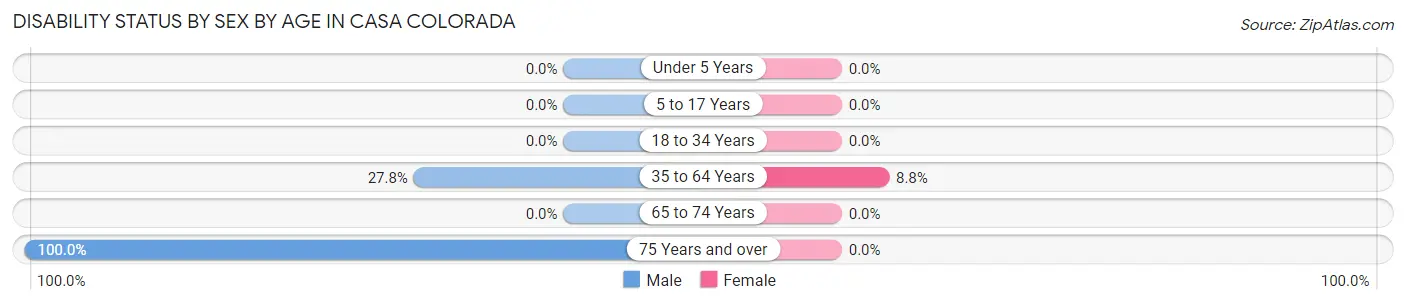
| Age Bracket | Male | Female |
| Under 5 Years | 0 (0.0%) | 0 (0.0%) |
| 5 to 17 Years | 0 (0.0%) | 0 (0.0%) |
| 18 to 34 Years | 0 (0.0%) | 0 (0.0%) |
| 35 to 64 Years | 35 (27.8%) | 5 (8.8%) |
| 65 to 74 Years | 0 (0.0%) | 0 (0.0%) |
| 75 Years and over | 5 (100.0%) | 0 (0.0%) |
Disability Class by Sex by Age in Casa Colorada
Disability Class: Hearing Difficulty
| Age Bracket | Male | Female |
| Under 5 Years | 0 (0.0%) | 0 (0.0%) |
| 5 to 17 Years | 0 (0.0%) | 0 (0.0%) |
| 18 to 34 Years | 0 (0.0%) | 0 (0.0%) |
| 35 to 64 Years | 0 (0.0%) | 0 (0.0%) |
| 65 to 74 Years | 0 (0.0%) | 0 (0.0%) |
| 75 Years and over | 0 (0.0%) | 0 (0.0%) |
Disability Class: Vision Difficulty
| Age Bracket | Male | Female |
| Under 5 Years | 0 (0.0%) | 0 (0.0%) |
| 5 to 17 Years | 0 (0.0%) | 0 (0.0%) |
| 18 to 34 Years | 0 (0.0%) | 0 (0.0%) |
| 35 to 64 Years | 0 (0.0%) | 0 (0.0%) |
| 65 to 74 Years | 0 (0.0%) | 0 (0.0%) |
| 75 Years and over | 0 (0.0%) | 0 (0.0%) |
Disability Class: Cognitive Difficulty
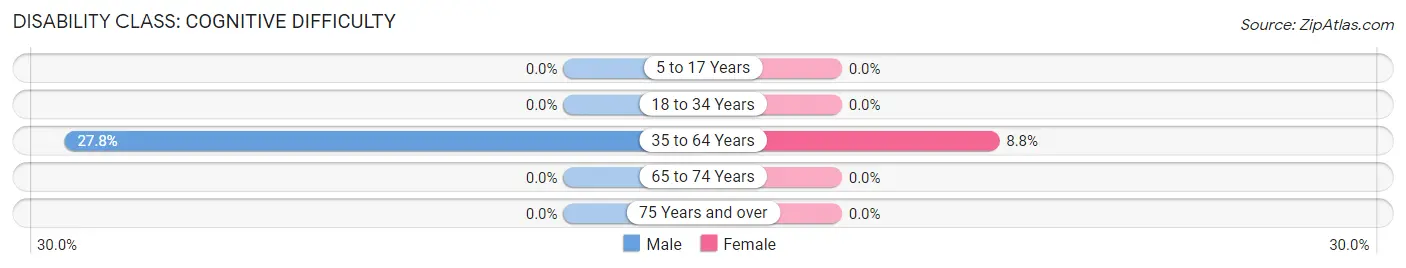
| Age Bracket | Male | Female |
| 5 to 17 Years | 0 (0.0%) | 0 (0.0%) |
| 18 to 34 Years | 0 (0.0%) | 0 (0.0%) |
| 35 to 64 Years | 35 (27.8%) | 5 (8.8%) |
| 65 to 74 Years | 0 (0.0%) | 0 (0.0%) |
| 75 Years and over | 0 (0.0%) | 0 (0.0%) |
Disability Class: Ambulatory Difficulty
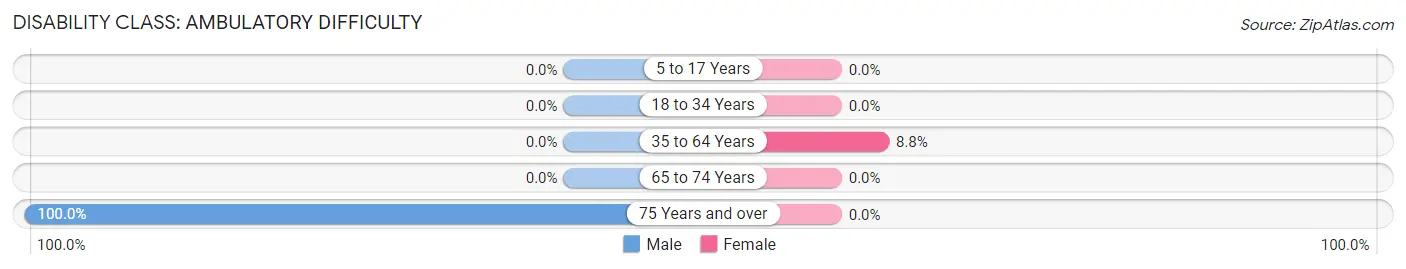
| Age Bracket | Male | Female |
| 5 to 17 Years | 0 (0.0%) | 0 (0.0%) |
| 18 to 34 Years | 0 (0.0%) | 0 (0.0%) |
| 35 to 64 Years | 0 (0.0%) | 5 (8.8%) |
| 65 to 74 Years | 0 (0.0%) | 0 (0.0%) |
| 75 Years and over | 5 (100.0%) | 0 (0.0%) |
Disability Class: Self-Care Difficulty
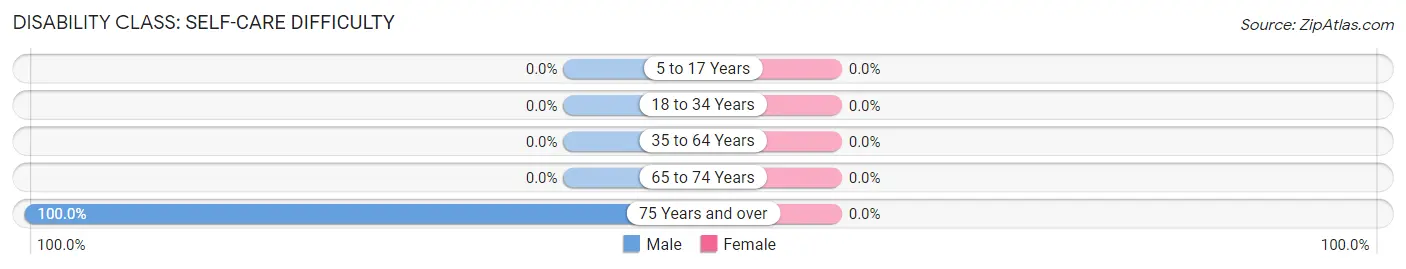
| Age Bracket | Male | Female |
| 5 to 17 Years | 0 (0.0%) | 0 (0.0%) |
| 18 to 34 Years | 0 (0.0%) | 0 (0.0%) |
| 35 to 64 Years | 0 (0.0%) | 0 (0.0%) |
| 65 to 74 Years | 0 (0.0%) | 0 (0.0%) |
| 75 Years and over | 5 (100.0%) | 0 (0.0%) |
Technology Access in Casa Colorada
Computing Device Access in Casa Colorada
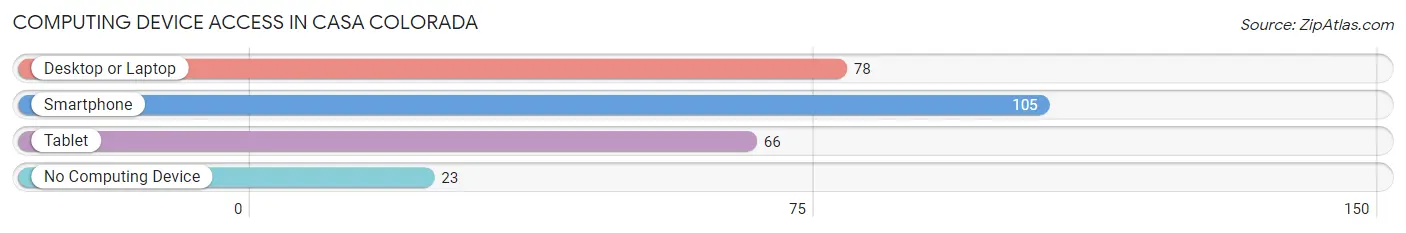
| Device Type | # Households | % Households |
| Desktop or Laptop | 78 | 60.9% |
| Smartphone | 105 | 82.0% |
| Tablet | 66 | 51.6% |
| No Computing Device | 23 | 18.0% |
| Total | 128 | 100.0% |
Internet Access in Casa Colorada
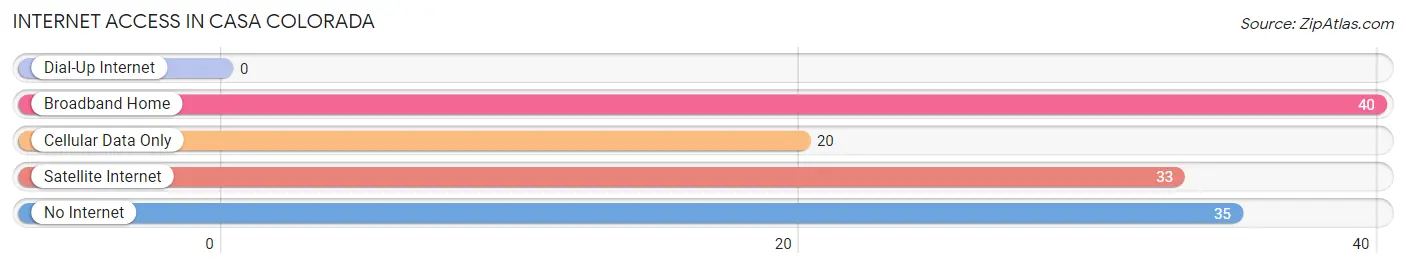
| Internet Type | # Households | % Households |
| Dial-Up Internet | 0 | 0.0% |
| Broadband Home | 40 | 31.2% |
| Cellular Data Only | 20 | 15.6% |
| Satellite Internet | 33 | 25.8% |
| No Internet | 35 | 27.3% |
| Total | 128 | 100.0% |
Casa Colorada Summary
Casa Colorada is a small unincorporated community located in the state of New Mexico. It is situated in the northern part of the state, in the county of San Miguel. The community is located in the foothills of the Sangre de Cristo Mountains, and is surrounded by the Manzano Mountains to the east and the Sandia Mountains to the west. The community is located approximately 25 miles south of Albuquerque, and is part of the Albuquerque metropolitan area.
History
Casa Colorada was originally settled by the Pueblo Indians in the late 1500s. The Pueblo Indians were a Native American tribe that lived in the area for centuries before the arrival of the Spanish. The Spanish arrived in the area in the late 1600s and established a mission in the area. The mission was named San Miguel de Casa Colorada, and it was the first mission established in the area. The mission was abandoned in the early 1700s, but the name of the area remained.
In the late 1800s, the area was settled by Anglo-American settlers. The settlers established a small farming community, and the area became known as Casa Colorada. The community was named after the red-colored adobe houses that were built by the settlers. The community grew slowly over the years, and by the early 1900s, it had become a small but thriving community.
Geography
Casa Colorada is located in the northern part of New Mexico, in the county of San Miguel. The community is situated in the foothills of the Sangre de Cristo Mountains, and is surrounded by the Manzano Mountains to the east and the Sandia Mountains to the west. The area is characterized by rolling hills and mesas, and is home to a variety of wildlife, including deer, elk, and antelope. The climate in the area is semi-arid, with hot summers and cold winters.
Economy
The economy of Casa Colorada is largely based on agriculture. The area is home to a variety of crops, including alfalfa, corn, wheat, and beans. The area is also home to a number of small businesses, including restaurants, grocery stores, and gas stations. The community is also home to a number of small manufacturing companies, which produce a variety of products, including furniture, clothing, and electronics.
Demographics
As of the 2010 census, the population of Casa Colorada was 1,845. The population is largely Hispanic, with a small percentage of Native American and Anglo-American residents. The median household income in the area is $35,000, and the median home value is $150,000. The area is served by a number of public schools, including Casa Colorada Elementary School and Casa Colorada High School.
Common Questions
What is Per Capita Income in Casa Colorada?
Per Capita income in Casa Colorada is $44,763.
What is the Median Household income in Casa Colorada?
Median Household Income in Casa Colorada is $110,167.
What is Income or Wage Gap in Casa Colorada?
Income or Wage Gap in Casa Colorada is 32.7%.
Women in Casa Colorada earn 67.3 cents for every dollar earned by a man.
What is Inequality or Gini Index in Casa Colorada?
Inequality or Gini Index in Casa Colorada is 0.28.
What is the Total Population of Casa Colorada?
Total Population of Casa Colorada is 259.
What is the Total Male Population of Casa Colorada?
Total Male Population of Casa Colorada is 184.
What is the Total Female Population of Casa Colorada?
Total Female Population of Casa Colorada is 75.
What is the Ratio of Males per 100 Females in Casa Colorada?
There are 245.33 Males per 100 Females in Casa Colorada.
What is the Ratio of Females per 100 Males in Casa Colorada?
There are 40.76 Females per 100 Males in Casa Colorada.
What is the Median Population Age in Casa Colorada?
Median Population Age in Casa Colorada is 46.8 Years.
What is the Average Family Size in Casa Colorada
Average Family Size in Casa Colorada is 2.6 People.
What is the Average Household Size in Casa Colorada
Average Household Size in Casa Colorada is 2.0 People.
How Large is the Labor Force in Casa Colorada?
There are 143 People in the Labor Forcein in Casa Colorada.
What is the Percentage of People in the Labor Force in Casa Colorada?
62.2% of People are in the Labor Force in Casa Colorada.
What is the Unemployment Rate in Casa Colorada?
Unemployment Rate in Casa Colorada is 7.0%.