El Cerro, NM Map & Demographics
El Cerro Map
El Cerro Overview
$36,482
PER CAPITA INCOME
$108,235
AVG FAMILY INCOME
$108,200
AVG HOUSEHOLD INCOME
60.3%
WAGE / INCOME GAP [ % ]
39.7¢/ $1
WAGE / INCOME GAP [ $ ]
0.44
INEQUALITY / GINI INDEX
3,244
TOTAL POPULATION
1,498
MALE POPULATION
1,746
FEMALE POPULATION
85.80
MALES / 100 FEMALES
116.56
FEMALES / 100 MALES
40.9
MEDIAN AGE
4.1
AVG FAMILY SIZE
3.6
AVG HOUSEHOLD SIZE
1,346
LABOR FORCE [ PEOPLE ]
52.6%
PERCENT IN LABOR FORCE
3.0%
UNEMPLOYMENT RATE
Income in El Cerro
Income Overview in El Cerro
Per Capita Income in El Cerro is $36,482, while median incomes of families and households are $108,235 and $108,200 respectively.
| Characteristic | Number | Measure |
| Per Capita Income | 3,244 | $36,482 |
| Median Family Income | 704 | $108,235 |
| Mean Family Income | 704 | $124,145 |
| Median Household Income | 894 | $108,200 |
| Mean Household Income | 894 | $117,839 |
| Income Deficit | 704 | $0 |
| Wage / Income Gap (%) | 3,244 | 60.31% |
| Wage / Income Gap ($) | 3,244 | 39.69¢ per $1 |
| Gini / Inequality Index | 3,244 | 0.44 |
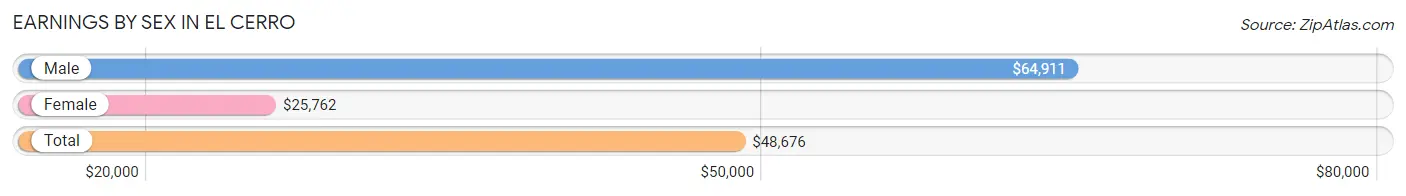
Earnings by Sex in El Cerro
Average Earnings in El Cerro are $48,676, $64,911 for men and $25,762 for women, a difference of 60.3%.
| Sex | Number | Average Earnings |
| Male | 843 (57.2%) | $64,911 |
| Female | 631 (42.8%) | $25,762 |
| Total | 1,474 (100.0%) | $48,676 |
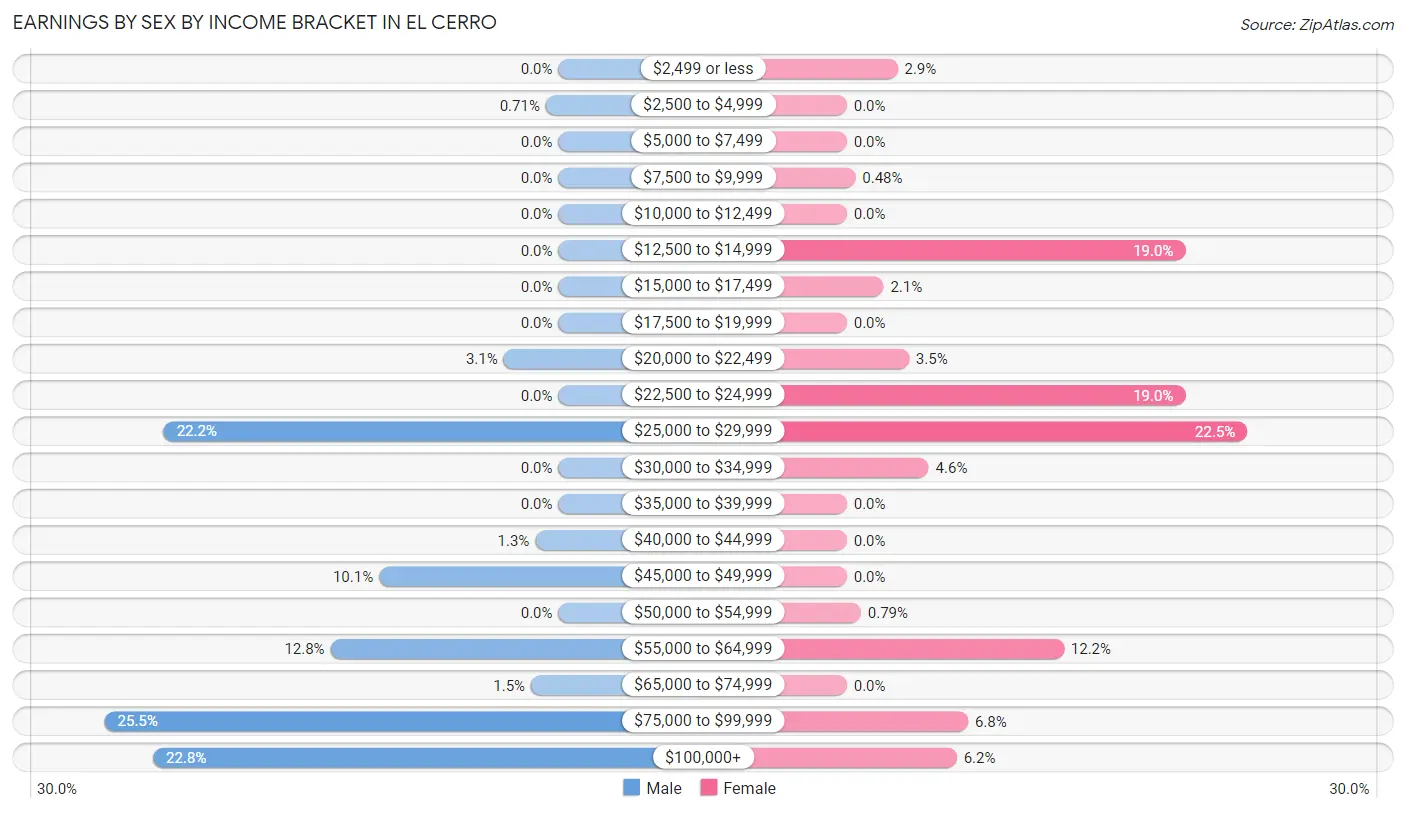
Earnings by Sex by Income Bracket in El Cerro
The most common earnings brackets in El Cerro are $75,000 to $99,999 for men (215 | 25.5%) and $25,000 to $29,999 for women (142 | 22.5%).
| Income | Male | Female |
| $2,499 or less | 0 (0.0%) | 18 (2.9%) |
| $2,500 to $4,999 | 6 (0.7%) | 0 (0.0%) |
| $5,000 to $7,499 | 0 (0.0%) | 0 (0.0%) |
| $7,500 to $9,999 | 0 (0.0%) | 3 (0.5%) |
| $10,000 to $12,499 | 0 (0.0%) | 0 (0.0%) |
| $12,500 to $14,999 | 0 (0.0%) | 120 (19.0%) |
| $15,000 to $17,499 | 0 (0.0%) | 13 (2.1%) |
| $17,500 to $19,999 | 0 (0.0%) | 0 (0.0%) |
| $20,000 to $22,499 | 26 (3.1%) | 22 (3.5%) |
| $22,500 to $24,999 | 0 (0.0%) | 120 (19.0%) |
| $25,000 to $29,999 | 187 (22.2%) | 142 (22.5%) |
| $30,000 to $34,999 | 0 (0.0%) | 29 (4.6%) |
| $35,000 to $39,999 | 0 (0.0%) | 0 (0.0%) |
| $40,000 to $44,999 | 11 (1.3%) | 0 (0.0%) |
| $45,000 to $49,999 | 85 (10.1%) | 0 (0.0%) |
| $50,000 to $54,999 | 0 (0.0%) | 5 (0.8%) |
| $55,000 to $64,999 | 108 (12.8%) | 77 (12.2%) |
| $65,000 to $74,999 | 13 (1.5%) | 0 (0.0%) |
| $75,000 to $99,999 | 215 (25.5%) | 43 (6.8%) |
| $100,000+ | 192 (22.8%) | 39 (6.2%) |
| Total | 843 (100.0%) | 631 (100.0%) |
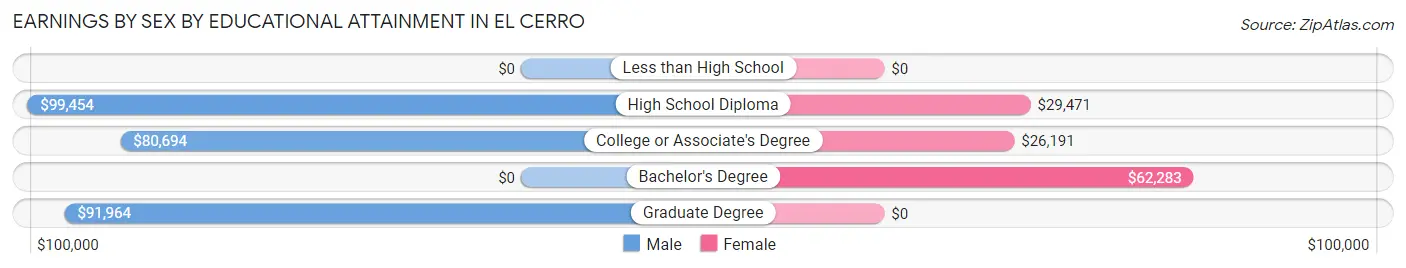
Earnings by Sex by Educational Attainment in El Cerro
| Educational Attainment | Male Income | Female Income |
| Less than High School | - | - |
| High School Diploma | $99,454 | $29,471 |
| College or Associate's Degree | $80,694 | $26,191 |
| Bachelor's Degree | - | - |
| Graduate Degree | $91,964 | $0 |
| Total | $82,063 | $0 |
Family Income in El Cerro
Family Income Brackets in El Cerro
According to the El Cerro family income data, there are 198 families falling into the $100,000 to $149,999 income range, which is the most common income bracket and makes up 28.1% of all families.
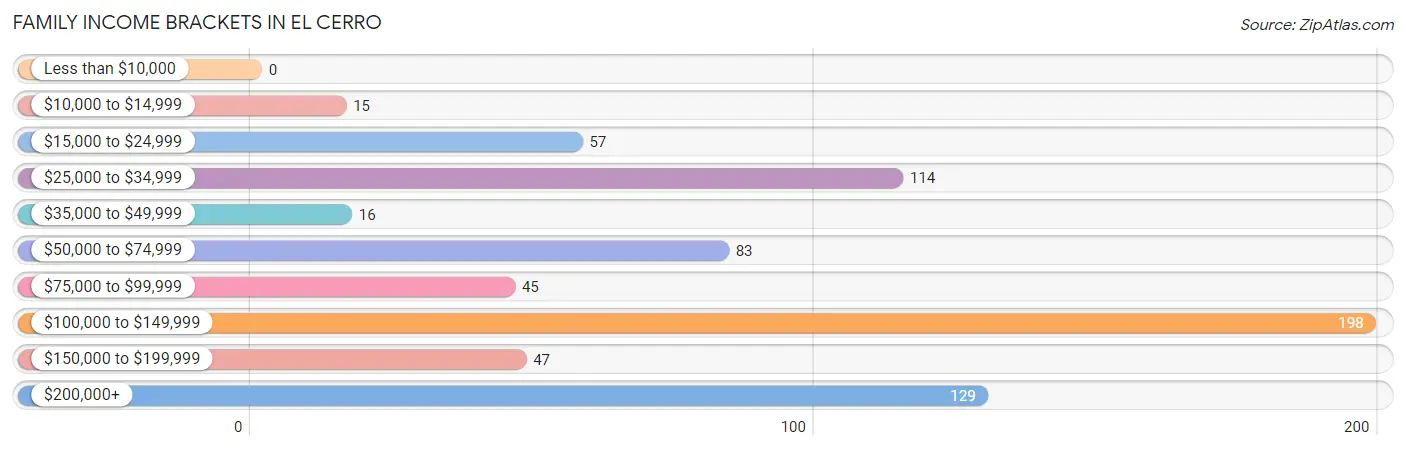
| Income Bracket | # Families | % Families |
| Less than $10,000 | 0 | 0.0% |
| $10,000 to $14,999 | 15 | 2.1% |
| $15,000 to $24,999 | 57 | 8.1% |
| $25,000 to $34,999 | 114 | 16.2% |
| $35,000 to $49,999 | 16 | 2.3% |
| $50,000 to $74,999 | 83 | 11.8% |
| $75,000 to $99,999 | 45 | 6.4% |
| $100,000 to $149,999 | 198 | 28.1% |
| $150,000 to $199,999 | 47 | 6.7% |
| $200,000+ | 129 | 18.3% |
Family Income by Famaliy Size in El Cerro
2-person families (412 | 58.5%) account for the highest median family income in El Cerro with $81,591 per family, while 2-person families (412 | 58.5%) have the highest median income of $40,796 per family member.
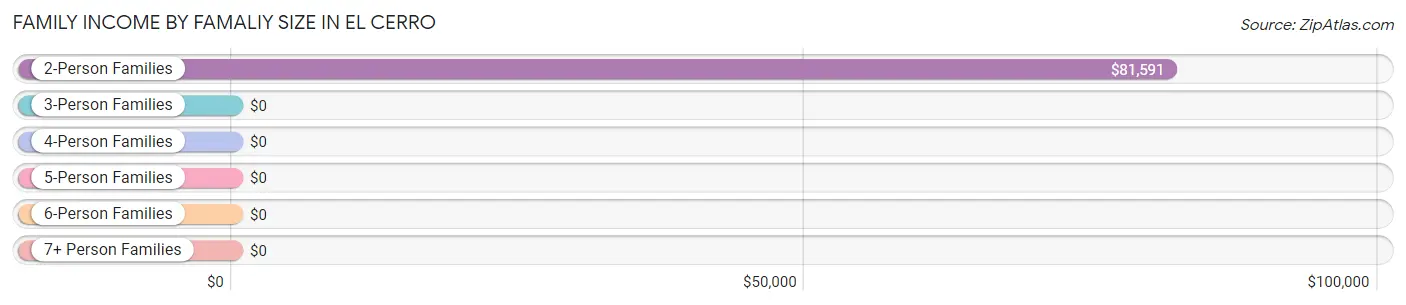
| Income Bracket | # Families | Median Income |
| 2-Person Families | 412 (58.5%) | $81,591 |
| 3-Person Families | 18 (2.6%) | $0 |
| 4-Person Families | 142 (20.2%) | $0 |
| 5-Person Families | 0 (0.0%) | $0 |
| 6-Person Families | 46 (6.5%) | $0 |
| 7+ Person Families | 86 (12.2%) | $0 |
| Total | 704 (100.0%) | $108,235 |
Family Income by Number of Earners in El Cerro
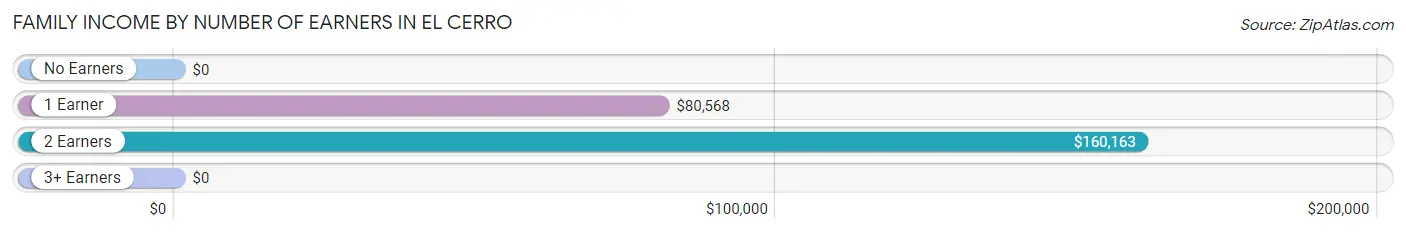
| Number of Earners | # Families | Median Income |
| No Earners | 166 (23.6%) | $0 |
| 1 Earner | 303 (43.0%) | $80,568 |
| 2 Earners | 149 (21.2%) | $160,163 |
| 3+ Earners | 86 (12.2%) | $0 |
| Total | 704 (100.0%) | $108,235 |
Household Income in El Cerro
Household Income Brackets in El Cerro
With 334 households falling in the category, the $100,000 to $149,999 income range is the most frequent in El Cerro, accounting for 37.4% of all households. In contrast, only 34 households (3.8%) fall into the less than $10,000 income bracket, making it the least populous group.
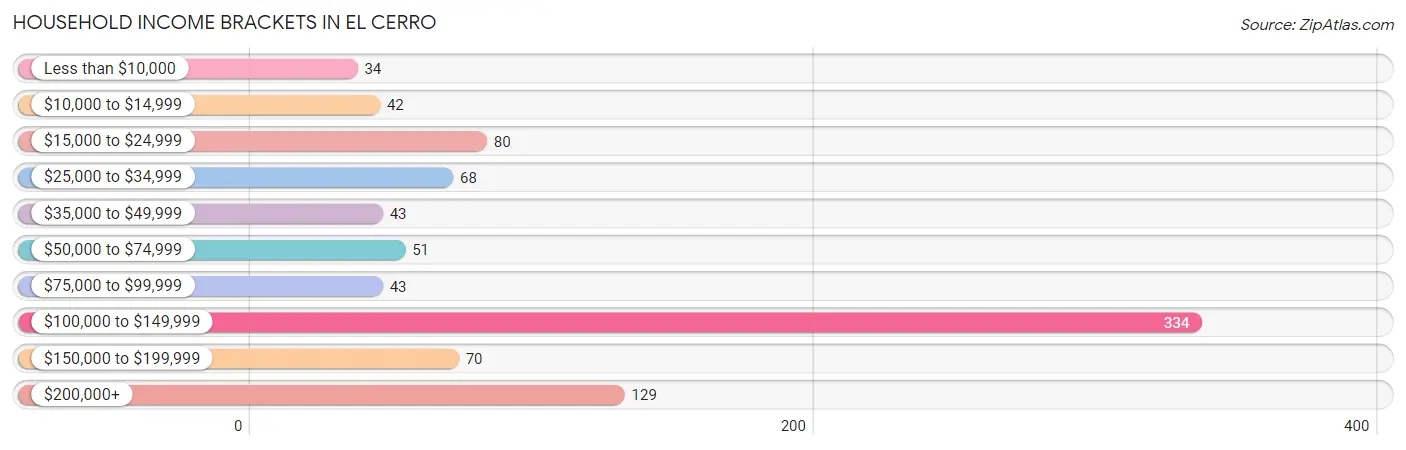
| Income Bracket | # Households | % Households |
| Less than $10,000 | 34 | 3.8% |
| $10,000 to $14,999 | 42 | 4.7% |
| $15,000 to $24,999 | 80 | 8.9% |
| $25,000 to $34,999 | 68 | 7.6% |
| $35,000 to $49,999 | 43 | 4.8% |
| $50,000 to $74,999 | 51 | 5.7% |
| $75,000 to $99,999 | 43 | 4.8% |
| $100,000 to $149,999 | 334 | 37.4% |
| $150,000 to $199,999 | 70 | 7.8% |
| $200,000+ | 129 | 14.4% |
Household Income by Householder Age in El Cerro
The median household income in El Cerro is $108,200, with the highest median household income of $126,375 found in the 45 to 64 years age bracket for the primary householder. A total of 433 households (48.4%) fall into this category.
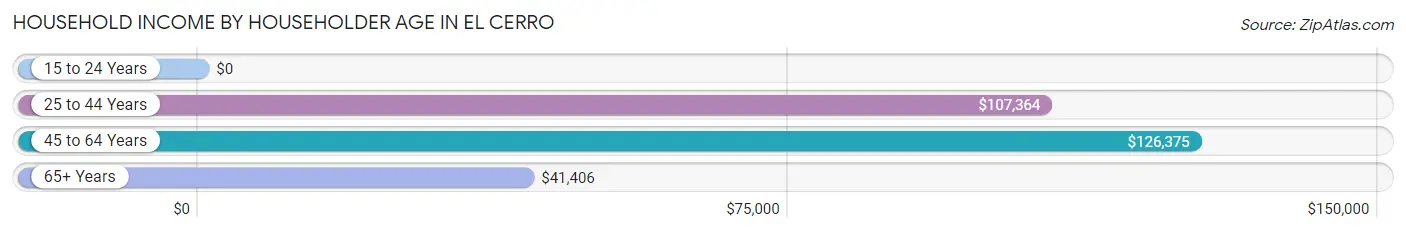
| Income Bracket | # Households | Median Income |
| 15 to 24 Years | 0 (0.0%) | $0 |
| 25 to 44 Years | 202 (22.6%) | $107,364 |
| 45 to 64 Years | 433 (48.4%) | $126,375 |
| 65+ Years | 259 (29.0%) | $41,406 |
| Total | 894 (100.0%) | $108,200 |
Poverty in El Cerro
Income Below Poverty by Sex and Age in El Cerro
With 6.3% poverty level for males and 10.8% for females among the residents of El Cerro, 65 to 74 year old males and 15 year old females are the most vulnerable to poverty, with 79 males (50.3%) and 48 females (100.0%) in their respective age groups living below the poverty level.
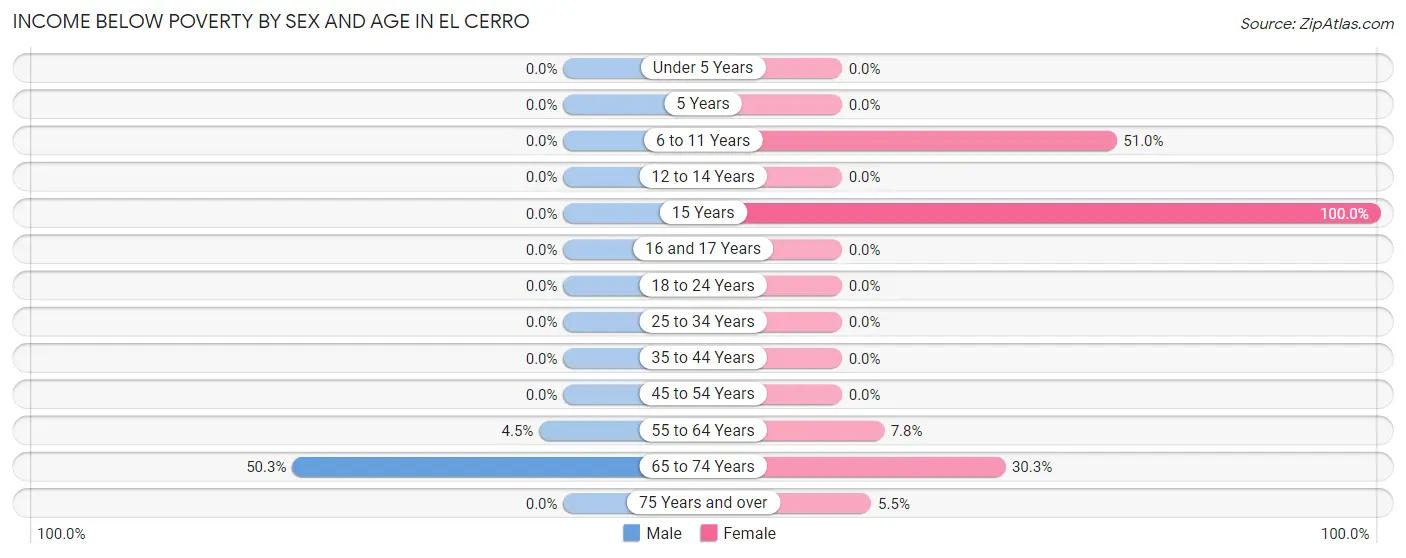
| Age Bracket | Male | Female |
| Under 5 Years | 0 (0.0%) | 0 (0.0%) |
| 5 Years | 0 (0.0%) | 0 (0.0%) |
| 6 to 11 Years | 0 (0.0%) | 53 (51.0%) |
| 12 to 14 Years | 0 (0.0%) | 0 (0.0%) |
| 15 Years | 0 (0.0%) | 48 (100.0%) |
| 16 and 17 Years | 0 (0.0%) | 0 (0.0%) |
| 18 to 24 Years | 0 (0.0%) | 0 (0.0%) |
| 25 to 34 Years | 0 (0.0%) | 0 (0.0%) |
| 35 to 44 Years | 0 (0.0%) | 0 (0.0%) |
| 45 to 54 Years | 0 (0.0%) | 0 (0.0%) |
| 55 to 64 Years | 15 (4.5%) | 13 (7.8%) |
| 65 to 74 Years | 79 (50.3%) | 53 (30.3%) |
| 75 Years and over | 0 (0.0%) | 21 (5.4%) |
| Total | 94 (6.3%) | 188 (10.8%) |
Income Above Poverty by Sex and Age in El Cerro
According to the poverty statistics in El Cerro, males aged under 5 years and females aged under 5 years are the age groups that are most secure financially, with 100.0% of males and 100.0% of females in these age groups living above the poverty line.
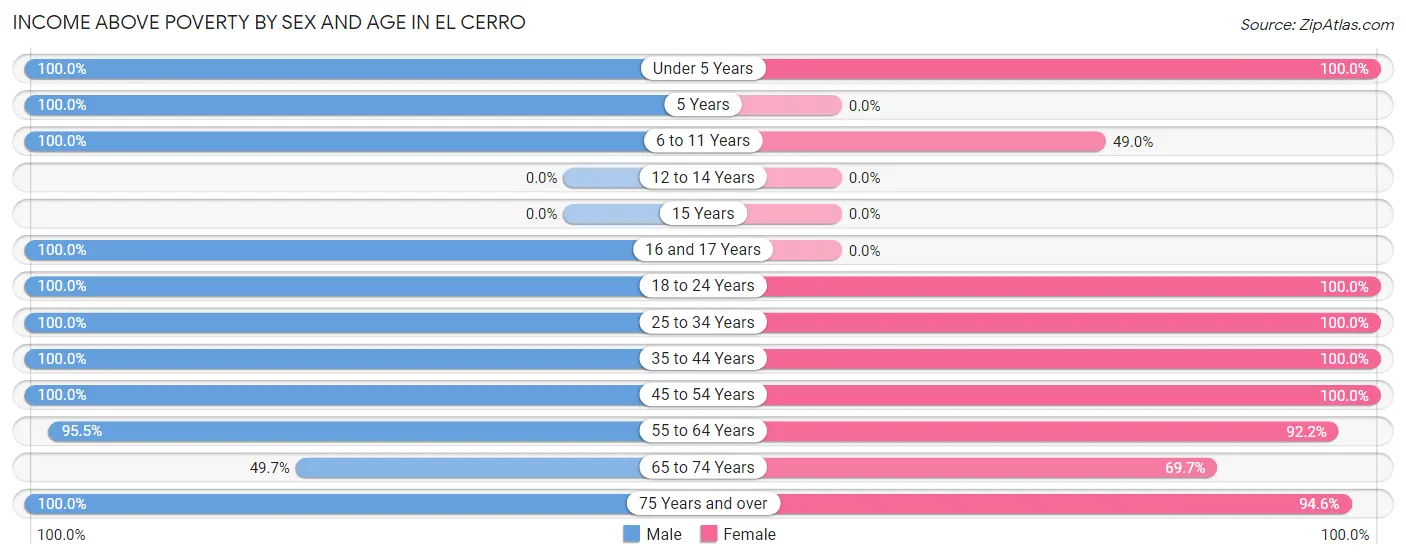
| Age Bracket | Male | Female |
| Under 5 Years | 204 (100.0%) | 291 (100.0%) |
| 5 Years | 5 (100.0%) | 0 (0.0%) |
| 6 to 11 Years | 33 (100.0%) | 51 (49.0%) |
| 12 to 14 Years | 0 (0.0%) | 0 (0.0%) |
| 15 Years | 0 (0.0%) | 0 (0.0%) |
| 16 and 17 Years | 83 (100.0%) | 0 (0.0%) |
| 18 to 24 Years | 153 (100.0%) | 240 (100.0%) |
| 25 to 34 Years | 181 (100.0%) | 151 (100.0%) |
| 35 to 44 Years | 94 (100.0%) | 98 (100.0%) |
| 45 to 54 Years | 124 (100.0%) | 87 (100.0%) |
| 55 to 64 Years | 319 (95.5%) | 154 (92.2%) |
| 65 to 74 Years | 78 (49.7%) | 122 (69.7%) |
| 75 Years and over | 130 (100.0%) | 364 (94.6%) |
| Total | 1,404 (93.7%) | 1,558 (89.2%) |
Income Below Poverty Among Married-Couple Families in El Cerro
The poverty statistics for married-couple families in El Cerro show that 10.5% or 54 of the total 514 families live below the poverty line. Families with 1 or 2 children have the highest poverty rate of 82.0%, comprising of 41 families. On the other hand, families with 3 or 4 children have the lowest poverty rate of 0.0%, which includes 0 families.
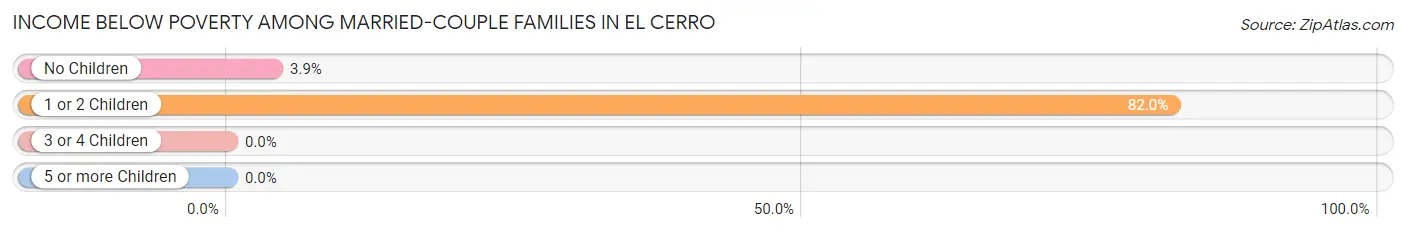
| Children | Above Poverty | Below Poverty |
| No Children | 319 (96.1%) | 13 (3.9%) |
| 1 or 2 Children | 9 (18.0%) | 41 (82.0%) |
| 3 or 4 Children | 132 (100.0%) | 0 (0.0%) |
| 5 or more Children | 0 (0.0%) | 0 (0.0%) |
| Total | 460 (89.5%) | 54 (10.5%) |
Income Below Poverty Among Single-Parent Households in El Cerro
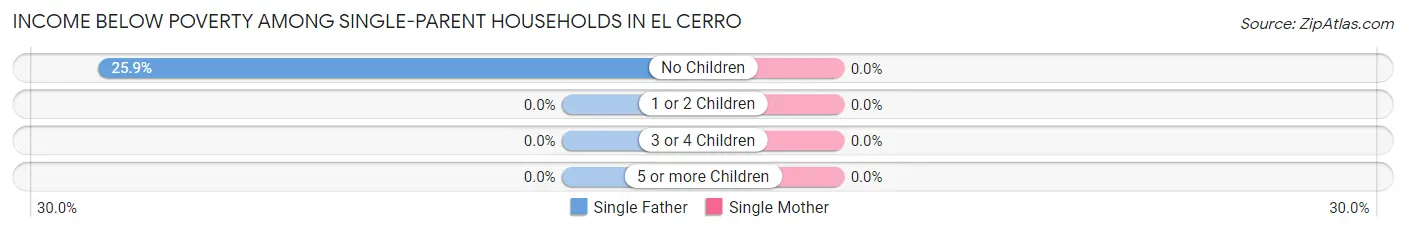
| Children | Single Father | Single Mother |
| No Children | 15 (25.9%) | 0 (0.0%) |
| 1 or 2 Children | 0 (0.0%) | 0 (0.0%) |
| 3 or 4 Children | 0 (0.0%) | 0 (0.0%) |
| 5 or more Children | 0 (0.0%) | 0 (0.0%) |
| Total | 15 (12.8%) | 0 (0.0%) |
Income Below Poverty Among Married-Couple vs Single-Parent Households in El Cerro
The poverty data for El Cerro shows that 54 of the married-couple family households (10.5%) and 15 of the single-parent households (7.9%) are living below the poverty level. Within the married-couple family households, those with 1 or 2 children have the highest poverty rate, with 41 households (82.0%) falling below the poverty line. Among the single-parent households, those with no children have the highest poverty rate, with 15 household (23.8%) living below poverty.
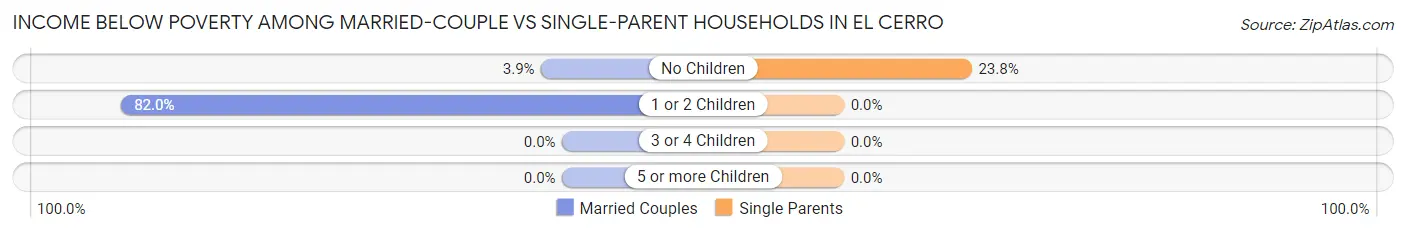
| Children | Married-Couple Families | Single-Parent Households |
| No Children | 13 (3.9%) | 15 (23.8%) |
| 1 or 2 Children | 41 (82.0%) | 0 (0.0%) |
| 3 or 4 Children | 0 (0.0%) | 0 (0.0%) |
| 5 or more Children | 0 (0.0%) | 0 (0.0%) |
| Total | 54 (10.5%) | 15 (7.9%) |
Race in El Cerro
The most populous races in El Cerro are Hispanic or Latino (2,518 | 77.6%), White / Caucasian (1,898 | 58.5%), and Some other Race (706 | 21.8%).
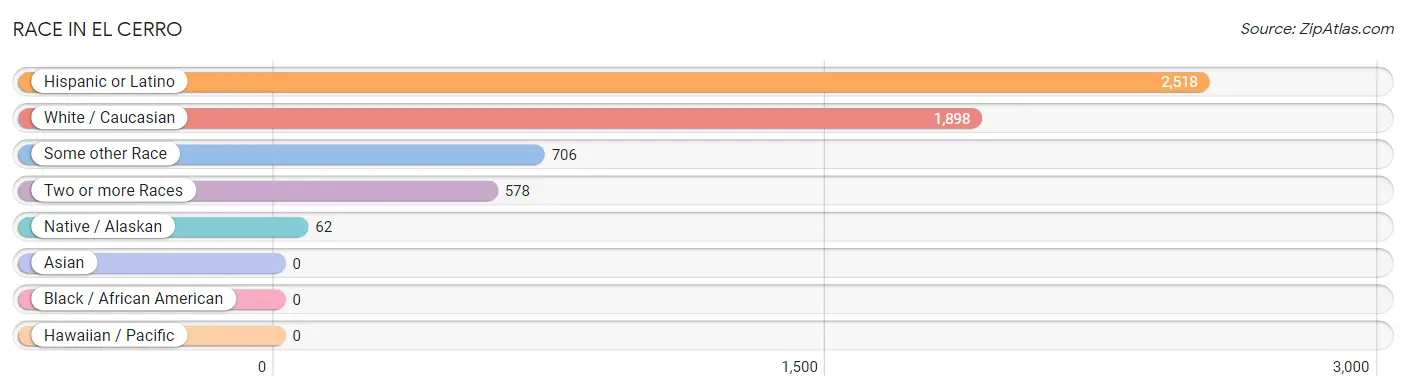
| Race | # Population | % Population |
| Asian | 0 | 0.0% |
| Black / African American | 0 | 0.0% |
| Hawaiian / Pacific | 0 | 0.0% |
| Hispanic or Latino | 2,518 | 77.6% |
| Native / Alaskan | 62 | 1.9% |
| White / Caucasian | 1,898 | 58.5% |
| Two or more Races | 578 | 17.8% |
| Some other Race | 706 | 21.8% |
| Total | 3,244 | 100.0% |
Ancestry in El Cerro
The most populous ancestries reported in El Cerro are Mexican (866 | 26.7%), Spaniard (347 | 10.7%), American (212 | 6.5%), German (153 | 4.7%), and Irish (148 | 4.6%), together accounting for 53.2% of all El Cerro residents.
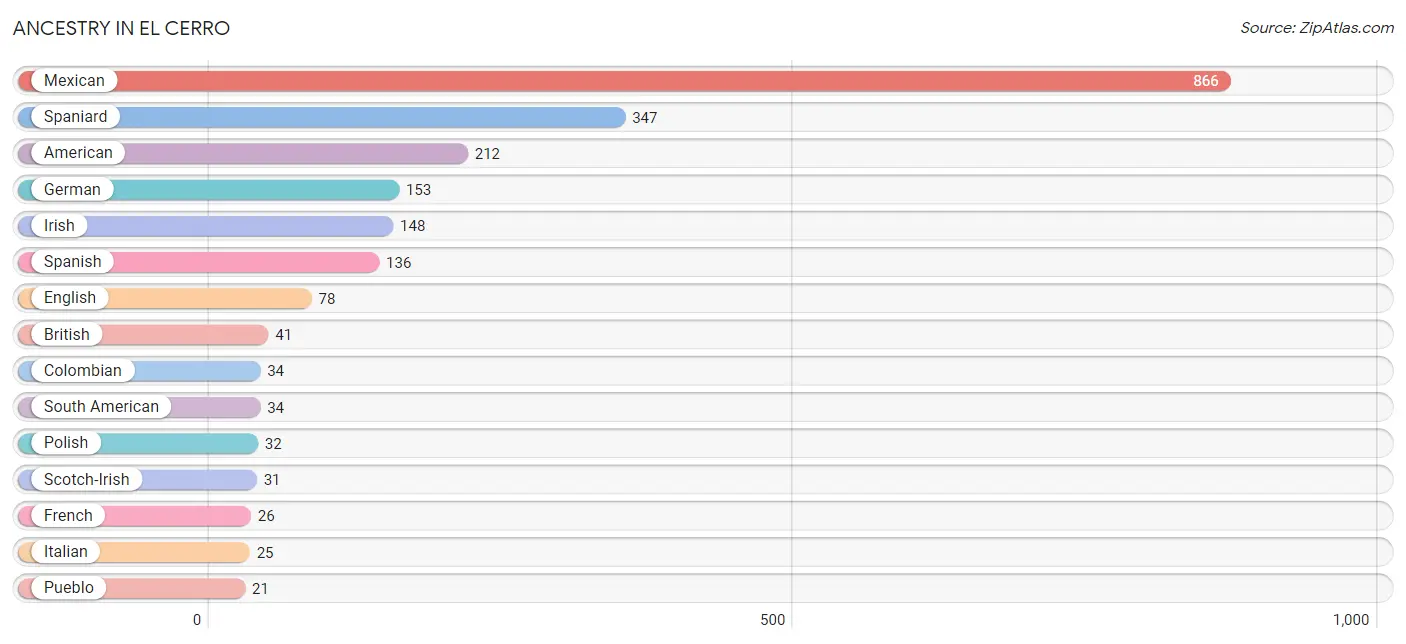
| Ancestry | # Population | % Population |
| American | 212 | 6.5% |
| Belgian | 11 | 0.3% |
| British | 41 | 1.3% |
| Colombian | 34 | 1.1% |
| Danish | 6 | 0.2% |
| Dutch | 10 | 0.3% |
| English | 78 | 2.4% |
| French | 26 | 0.8% |
| German | 153 | 4.7% |
| Irish | 148 | 4.6% |
| Italian | 25 | 0.8% |
| Mexican | 866 | 26.7% |
| Mexican American Indian | 1 | 0.0% |
| Norwegian | 3 | 0.1% |
| Polish | 32 | 1.0% |
| Pueblo | 21 | 0.6% |
| Russian | 7 | 0.2% |
| Scotch-Irish | 31 | 1.0% |
| Scottish | 9 | 0.3% |
| Slavic | 10 | 0.3% |
| South American | 34 | 1.1% |
| Spaniard | 347 | 10.7% |
| Spanish | 136 | 4.2% |
| Spanish American | 12 | 0.4% |
| Swiss | 6 | 0.2% |
| Yugoslavian | 8 | 0.3% | View All 26 Rows |
Immigrants in El Cerro
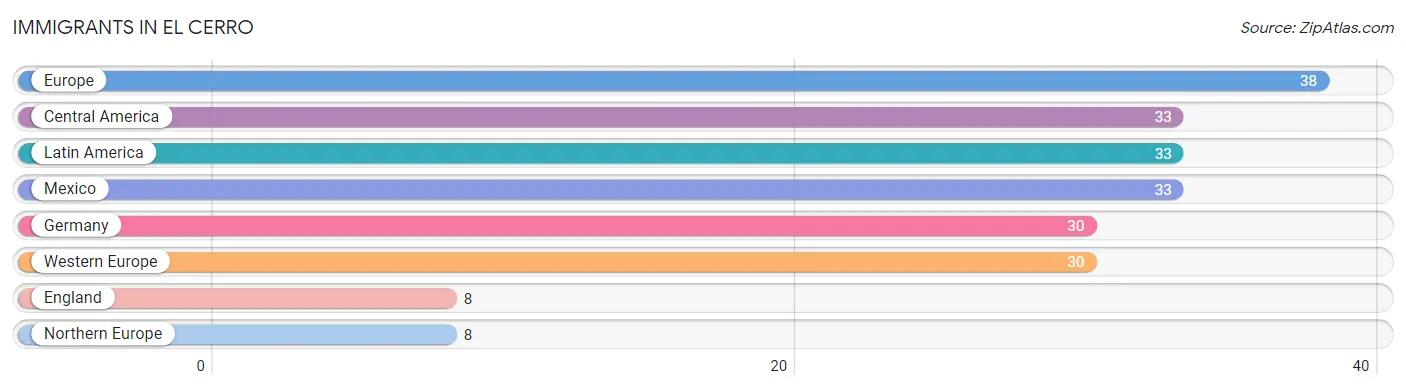
The most numerous immigrant groups reported in El Cerro came from Europe (38 | 1.2%), Central America (33 | 1.0%), Latin America (33 | 1.0%), Mexico (33 | 1.0%), and Germany (30 | 0.9%), together accounting for 5.2% of all El Cerro residents.
| Immigration Origin | # Population | % Population |
| Central America | 33 | 1.0% |
| England | 8 | 0.3% |
| Europe | 38 | 1.2% |
| Germany | 30 | 0.9% |
| Latin America | 33 | 1.0% |
| Mexico | 33 | 1.0% |
| Northern Europe | 8 | 0.3% |
| Western Europe | 30 | 0.9% | View All 8 Rows |
Sex and Age in El Cerro
Sex and Age in El Cerro
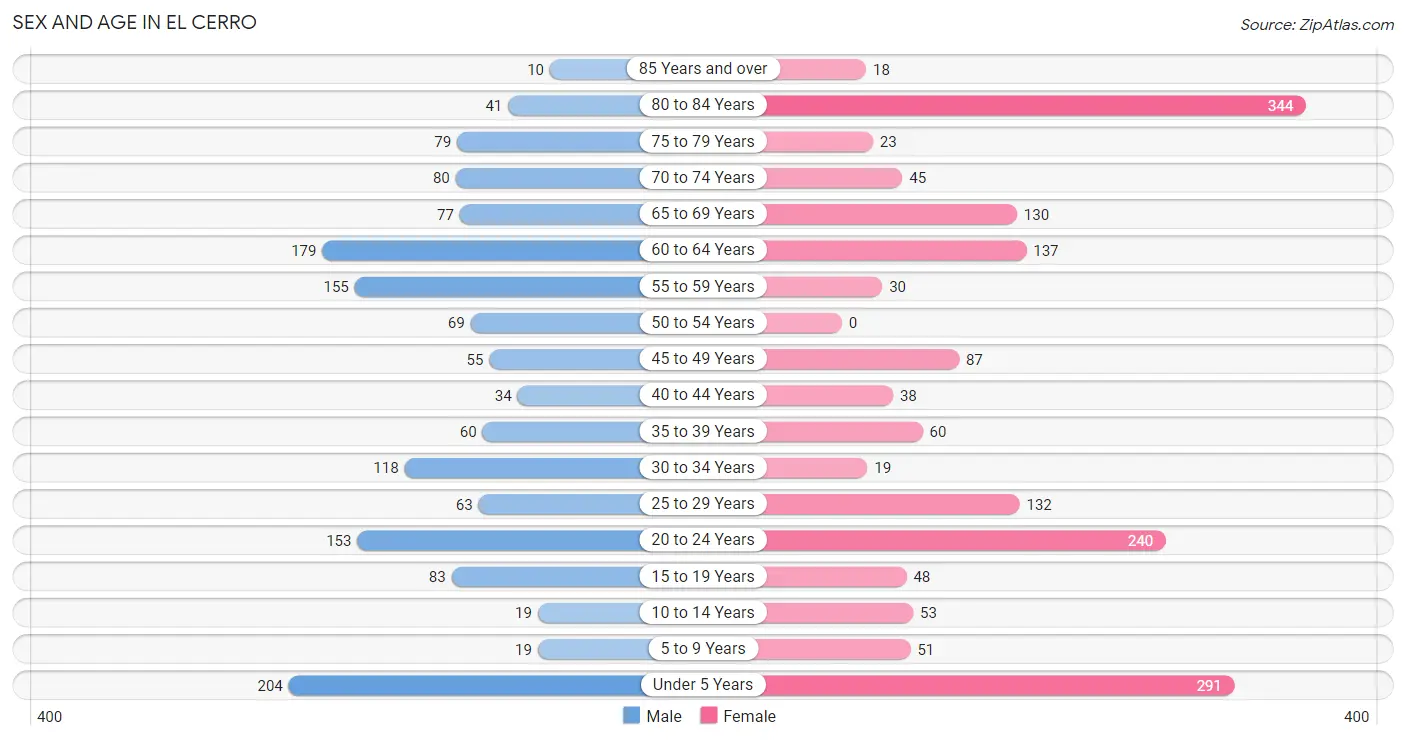
The most populous age groups in El Cerro are Under 5 Years (204 | 13.6%) for men and 80 to 84 Years (344 | 19.7%) for women.
| Age Bracket | Male | Female |
| Under 5 Years | 204 (13.6%) | 291 (16.7%) |
| 5 to 9 Years | 19 (1.3%) | 51 (2.9%) |
| 10 to 14 Years | 19 (1.3%) | 53 (3.0%) |
| 15 to 19 Years | 83 (5.5%) | 48 (2.8%) |
| 20 to 24 Years | 153 (10.2%) | 240 (13.8%) |
| 25 to 29 Years | 63 (4.2%) | 132 (7.6%) |
| 30 to 34 Years | 118 (7.9%) | 19 (1.1%) |
| 35 to 39 Years | 60 (4.0%) | 60 (3.4%) |
| 40 to 44 Years | 34 (2.3%) | 38 (2.2%) |
| 45 to 49 Years | 55 (3.7%) | 87 (5.0%) |
| 50 to 54 Years | 69 (4.6%) | 0 (0.0%) |
| 55 to 59 Years | 155 (10.3%) | 30 (1.7%) |
| 60 to 64 Years | 179 (11.9%) | 137 (7.9%) |
| 65 to 69 Years | 77 (5.1%) | 130 (7.4%) |
| 70 to 74 Years | 80 (5.3%) | 45 (2.6%) |
| 75 to 79 Years | 79 (5.3%) | 23 (1.3%) |
| 80 to 84 Years | 41 (2.7%) | 344 (19.7%) |
| 85 Years and over | 10 (0.7%) | 18 (1.0%) |
| Total | 1,498 (100.0%) | 1,746 (100.0%) |
Families and Households in El Cerro
Median Family Size in El Cerro
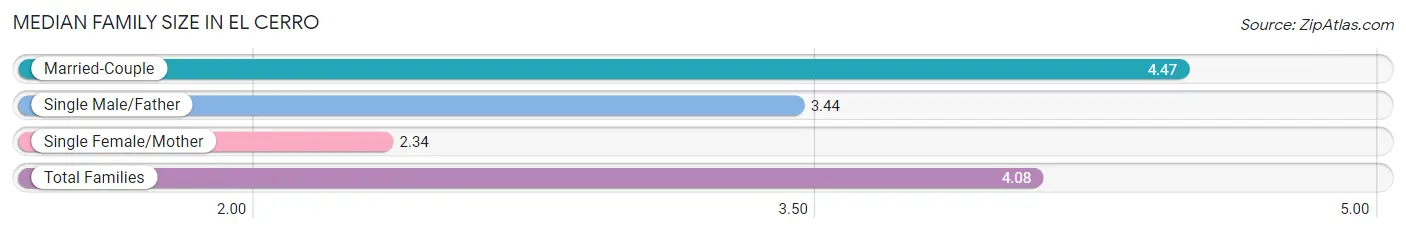
The median family size in El Cerro is 4.08 persons per family, with married-couple families (514 | 73.0%) accounting for the largest median family size of 4.47 persons per family. On the other hand, single female/mother families (73 | 10.4%) represent the smallest median family size with 2.34 persons per family.
| Family Type | # Families | Family Size |
| Married-Couple | 514 (73.0%) | 4.47 |
| Single Male/Father | 117 (16.6%) | 3.44 |
| Single Female/Mother | 73 (10.4%) | 2.34 |
| Total Families | 704 (100.0%) | 4.08 |
Median Household Size in El Cerro
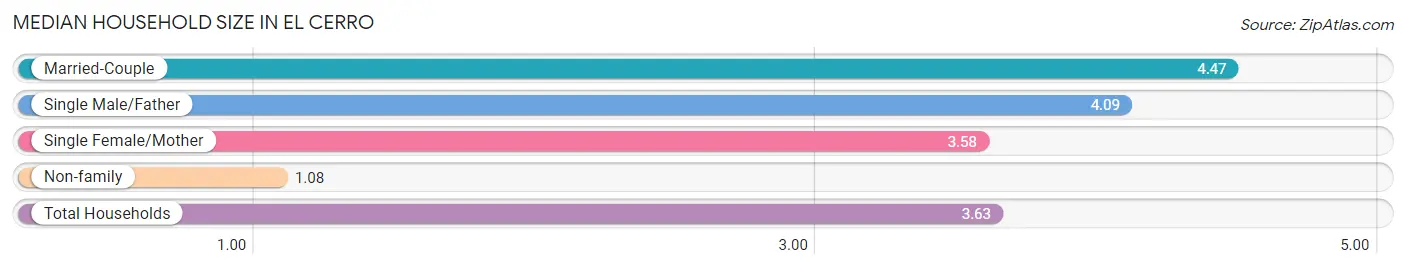
The median household size in El Cerro is 3.63 persons per household, with married-couple households (514 | 57.5%) accounting for the largest median household size of 4.47 persons per household. non-family households (190 | 21.2%) represent the smallest median household size with 1.08 persons per household.
| Household Type | # Households | Household Size |
| Married-Couple | 514 (57.5%) | 4.47 |
| Single Male/Father | 117 (13.1%) | 4.09 |
| Single Female/Mother | 73 (8.2%) | 3.58 |
| Non-family | 190 (21.2%) | 1.08 |
| Total Households | 894 (100.0%) | 3.63 |
Household Size by Marriage Status in El Cerro
Out of a total of 894 households in El Cerro, 704 (78.7%) are family households, while 190 (21.2%) are nonfamily households. The most numerous type of family households are 2-person households, comprising 342, and the most common type of nonfamily households are 1-person households, comprising 180.
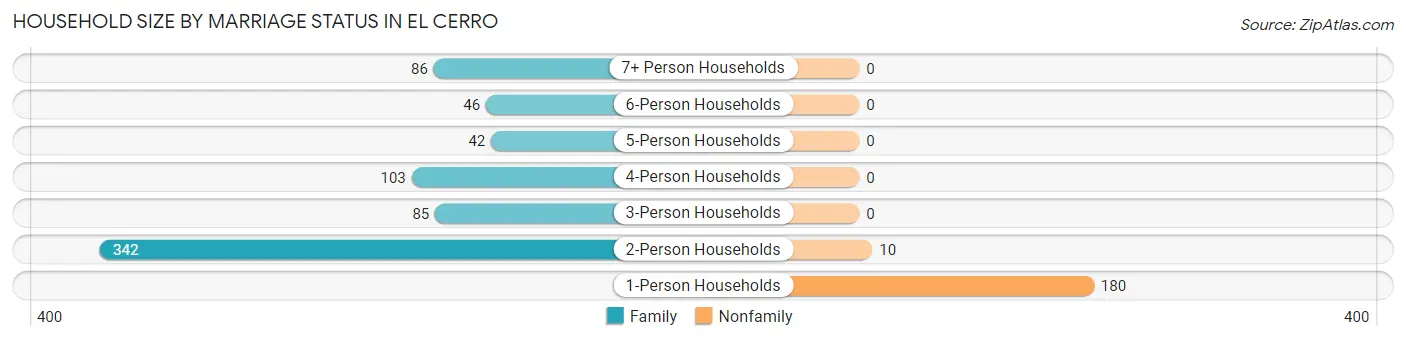
| Household Size | Family Households | Nonfamily Households |
| 1-Person Households | - | 180 (20.1%) |
| 2-Person Households | 342 (38.3%) | 10 (1.1%) |
| 3-Person Households | 85 (9.5%) | 0 (0.0%) |
| 4-Person Households | 103 (11.5%) | 0 (0.0%) |
| 5-Person Households | 42 (4.7%) | 0 (0.0%) |
| 6-Person Households | 46 (5.1%) | 0 (0.0%) |
| 7+ Person Households | 86 (9.6%) | 0 (0.0%) |
| Total | 704 (78.7%) | 190 (21.2%) |
Female Fertility in El Cerro
Fertility by Age in El Cerro
Average fertility rate in El Cerro is 197.0 births per 1,000 women. Women in the age bracket of 35 to 50 years have the highest fertility rate with 249.0 births per 1,000 women. Women in the age bracket of 20 to 34 years acount for 62.6% of all women with births.
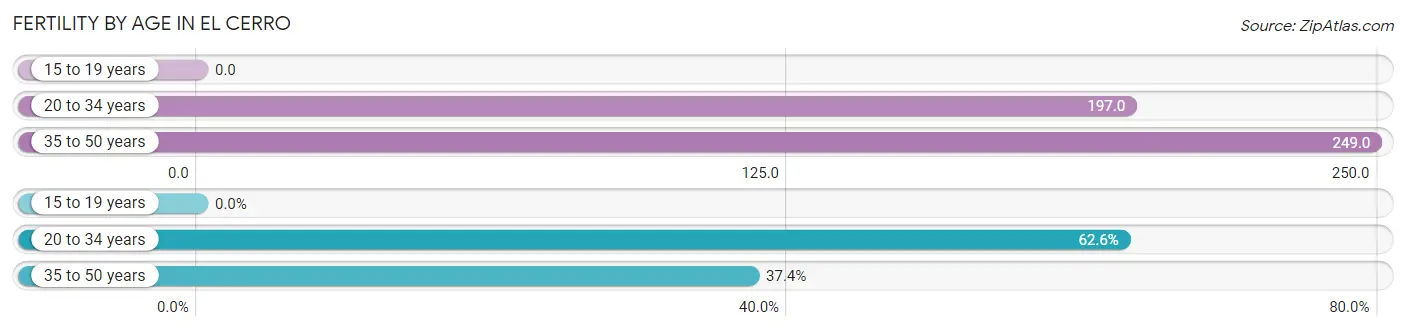
| Age Bracket | Women with Births | Births / 1,000 Women |
| 15 to 19 years | 0 (0.0%) | 0.0 |
| 20 to 34 years | 77 (62.6%) | 197.0 |
| 35 to 50 years | 46 (37.4%) | 249.0 |
| Total | 123 (100.0%) | 197.0 |
Fertility by Age by Marriage Status in El Cerro
37.4% of women with births (123) in El Cerro are married. The highest percentage of unmarried women with births falls into 20 to 34 years age bracket with 100.0% of them unmarried at the time of birth, while the lowest percentage of unmarried women with births belong to 35 to 50 years age bracket with 0.0% of them unmarried.
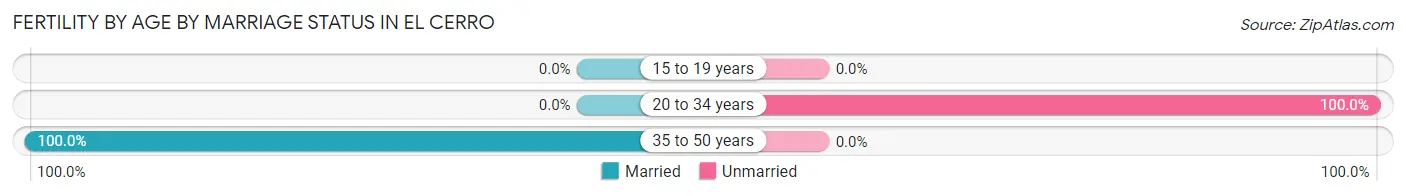
| Age Bracket | Married | Unmarried |
| 15 to 19 years | 0 (0.0%) | 0 (0.0%) |
| 20 to 34 years | 0 (0.0%) | 77 (100.0%) |
| 35 to 50 years | 46 (100.0%) | 0 (0.0%) |
| Total | 46 (37.4%) | 77 (62.6%) |
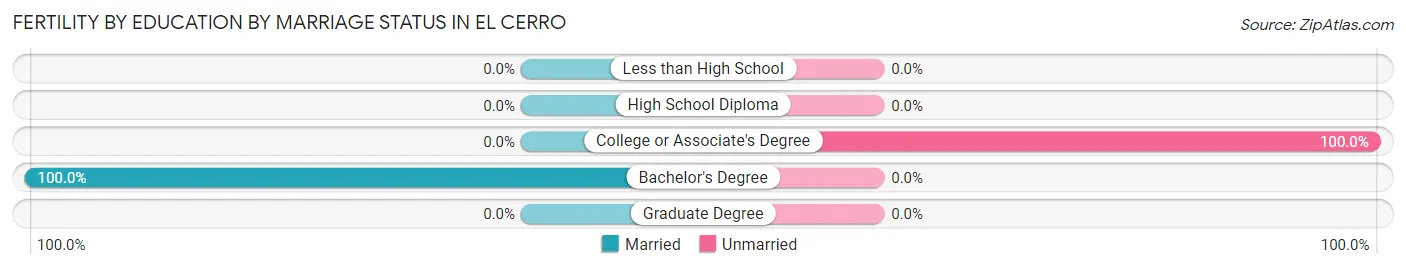
Fertility by Education in El Cerro
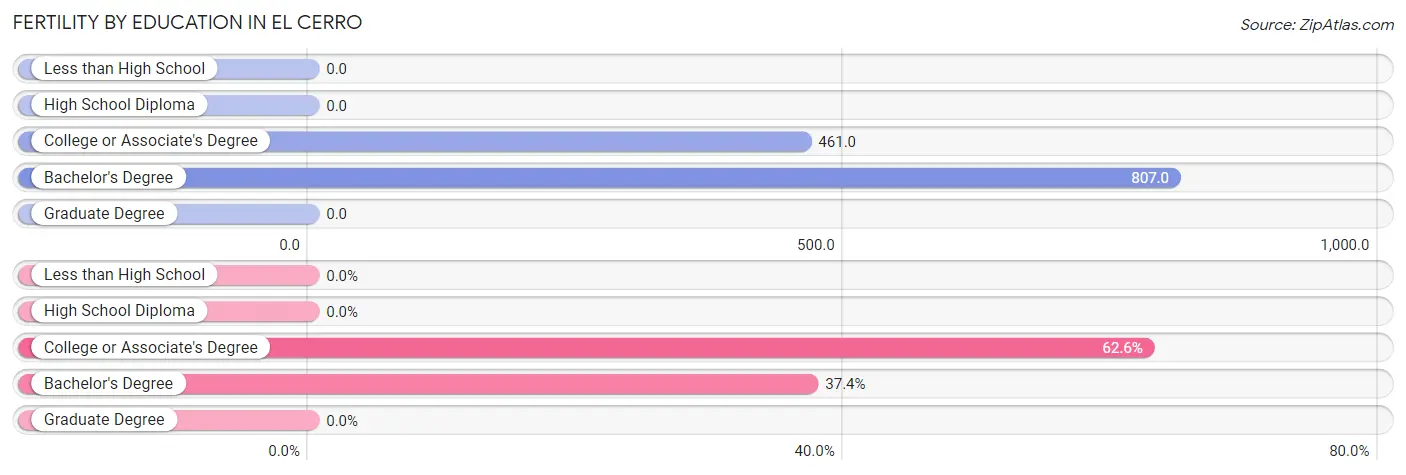
| Educational Attainment | Women with Births | Births / 1,000 Women |
| Less than High School | 0 (0.0%) | 0.0 |
| High School Diploma | 0 (0.0%) | 0.0 |
| College or Associate's Degree | 77 (62.6%) | 461.0 |
| Bachelor's Degree | 46 (37.4%) | 807.0 |
| Graduate Degree | 0 (0.0%) | 0.0 |
| Total | 123 (100.0%) | 197.0 |
Fertility by Education by Marriage Status in El Cerro
62.6% of women with births in El Cerro are unmarried. Women with the educational attainment of bachelor's degree are most likely to be married with 100.0% of them married at childbirth, while women with the educational attainment of college or associate's degree are least likely to be married with 100.0% of them unmarried at childbirth.
| Educational Attainment | Married | Unmarried |
| Less than High School | 0 (0.0%) | 0 (0.0%) |
| High School Diploma | 0 (0.0%) | 0 (0.0%) |
| College or Associate's Degree | 0 (0.0%) | 77 (100.0%) |
| Bachelor's Degree | 46 (100.0%) | 0 (0.0%) |
| Graduate Degree | 0 (0.0%) | 0 (0.0%) |
| Total | 46 (37.4%) | 77 (62.6%) |
Employment Characteristics in El Cerro
Employment by Class of Employer in El Cerro
Among the 1,259 employed individuals in El Cerro, private company employees (571 | 45.4%), state government employees (354 | 28.1%), and self-employed (incorporated) (105 | 8.3%) make up the most common classes of employment.
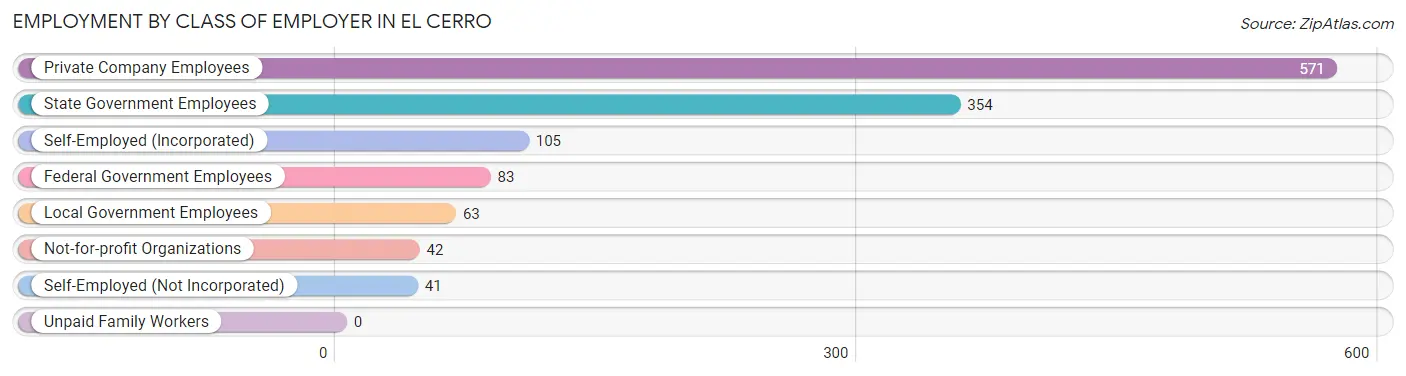
| Employer Class | # Employees | % Employees |
| Private Company Employees | 571 | 45.4% |
| Self-Employed (Incorporated) | 105 | 8.3% |
| Self-Employed (Not Incorporated) | 41 | 3.3% |
| Not-for-profit Organizations | 42 | 3.3% |
| Local Government Employees | 63 | 5.0% |
| State Government Employees | 354 | 28.1% |
| Federal Government Employees | 83 | 6.6% |
| Unpaid Family Workers | 0 | 0.0% |
| Total | 1,259 | 100.0% |
Employment Status by Age in El Cerro
According to the labor force statistics for El Cerro, out of the total population over 16 years of age (2,559), 52.6% or 1,346 individuals are in the labor force, with 3.0% or 40 of them unemployed. The age group with the highest labor force participation rate is 30 to 34 years, with 100.0% or 137 individuals in the labor force. Within the labor force, the 55 to 59 years age range has the highest percentage of unemployed individuals, with 15.4% or 26 of them being unemployed.
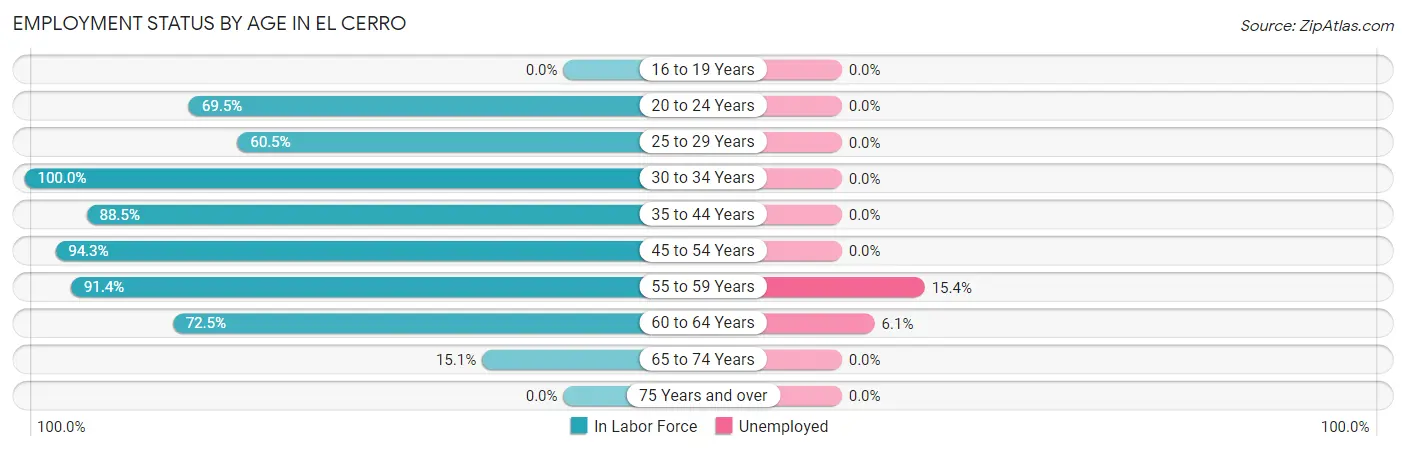
| Age Bracket | In Labor Force | Unemployed |
| 16 to 19 Years | 0 (0.0%) | 0 (0.0%) |
| 20 to 24 Years | 273 (69.5%) | 0 (0.0%) |
| 25 to 29 Years | 118 (60.5%) | 0 (0.0%) |
| 30 to 34 Years | 137 (100.0%) | 0 (0.0%) |
| 35 to 44 Years | 170 (88.5%) | 0 (0.0%) |
| 45 to 54 Years | 199 (94.3%) | 0 (0.0%) |
| 55 to 59 Years | 169 (91.4%) | 26 (15.4%) |
| 60 to 64 Years | 229 (72.5%) | 14 (6.1%) |
| 65 to 74 Years | 50 (15.1%) | 0 (0.0%) |
| 75 Years and over | 0 (0.0%) | 0 (0.0%) |
| Total | 1,346 (52.6%) | 40 (3.0%) |
Employment Status by Educational Attainment in El Cerro
According to labor force statistics for El Cerro, 82.7% of individuals (1,022) out of the total population between 25 and 64 years of age (1,236) are in the labor force, with 3.9% or 40 of them being unemployed. The group with the highest labor force participation rate are those with the educational attainment of high school diploma, with 91.8% or 402 individuals in the labor force. Within the labor force, individuals with less than high school education have the highest percentage of unemployment, with 15.6% or 14 of them being unemployed.
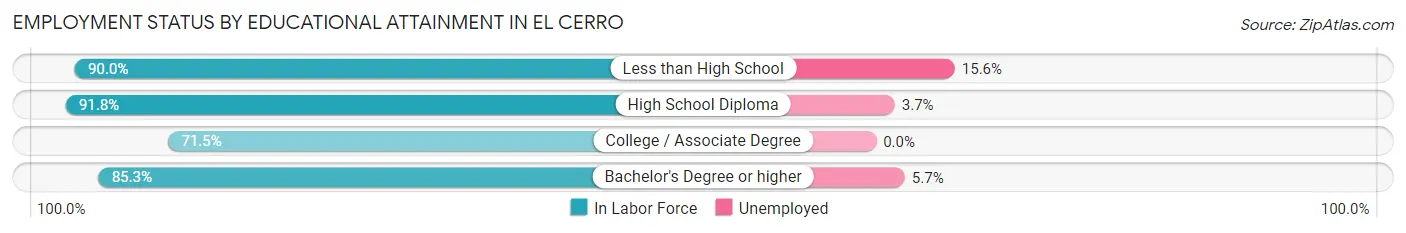
| Educational Attainment | In Labor Force | Unemployed |
| Less than High School | 90 (90.0%) | 16 (15.6%) |
| High School Diploma | 402 (91.8%) | 16 (3.7%) |
| College / Associate Degree | 338 (71.5%) | 0 (0.0%) |
| Bachelor's Degree or higher | 192 (85.3%) | 13 (5.7%) |
| Total | 1,022 (82.7%) | 48 (3.9%) |
Employment Occupations by Sex in El Cerro
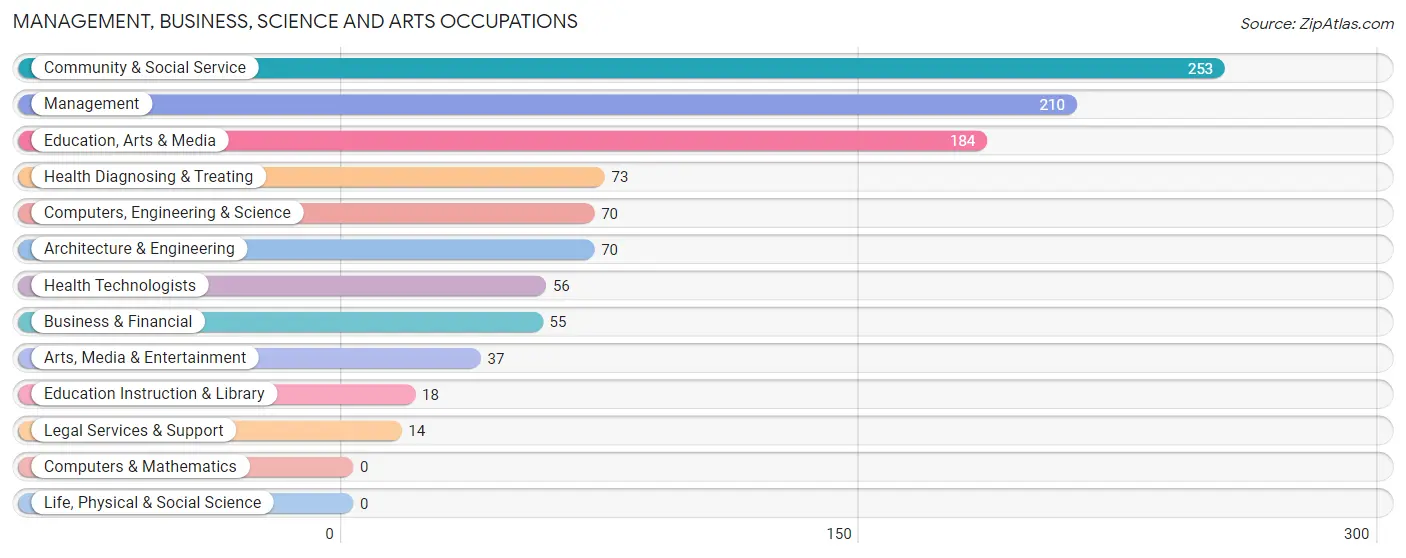
Management, Business, Science and Arts Occupations
The most common Management, Business, Science and Arts occupations in El Cerro are Community & Social Service (253 | 19.4%), Management (210 | 16.1%), Education, Arts & Media (184 | 14.1%), Health Diagnosing & Treating (73 | 5.6%), and Computers, Engineering & Science (70 | 5.4%).
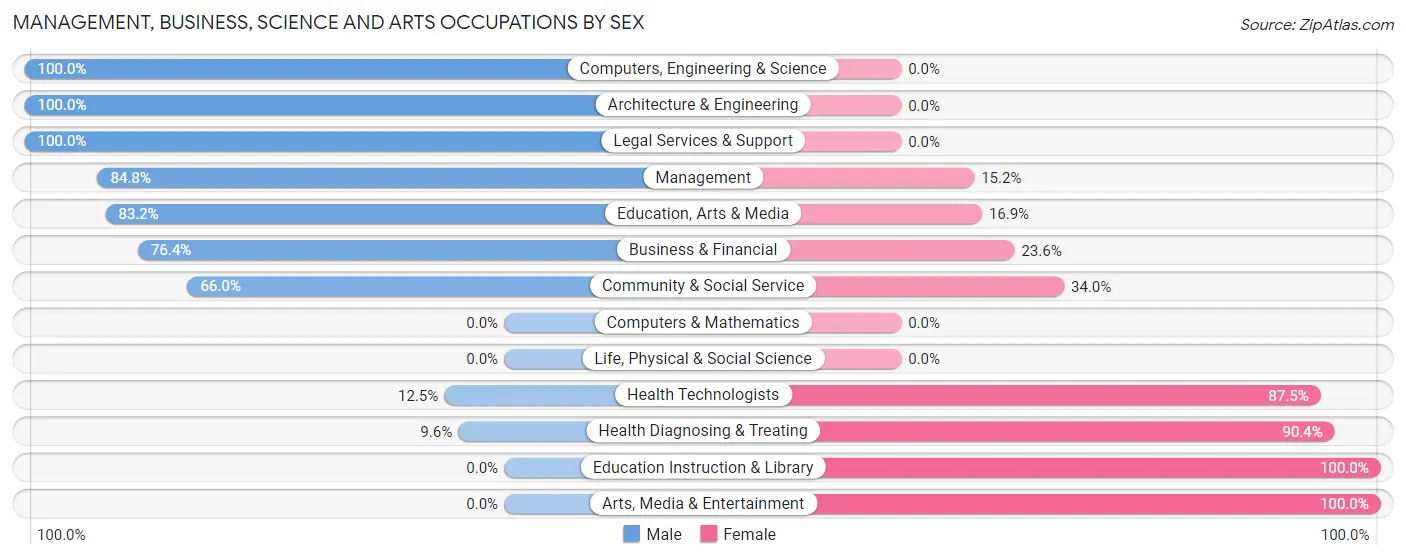
Management, Business, Science and Arts Occupations by Sex
Within the Management, Business, Science and Arts occupations in El Cerro, the most male-oriented occupations are Computers, Engineering & Science (100.0%), Architecture & Engineering (100.0%), and Legal Services & Support (100.0%), while the most female-oriented occupations are Education Instruction & Library (100.0%), Arts, Media & Entertainment (100.0%), and Health Diagnosing & Treating (90.4%).
| Occupation | Male | Female |
| Management | 178 (84.8%) | 32 (15.2%) |
| Business & Financial | 42 (76.4%) | 13 (23.6%) |
| Computers, Engineering & Science | 70 (100.0%) | 0 (0.0%) |
| Computers & Mathematics | 0 (0.0%) | 0 (0.0%) |
| Architecture & Engineering | 70 (100.0%) | 0 (0.0%) |
| Life, Physical & Social Science | 0 (0.0%) | 0 (0.0%) |
| Community & Social Service | 167 (66.0%) | 86 (34.0%) |
| Education, Arts & Media | 153 (83.2%) | 31 (16.9%) |
| Legal Services & Support | 14 (100.0%) | 0 (0.0%) |
| Education Instruction & Library | 0 (0.0%) | 18 (100.0%) |
| Arts, Media & Entertainment | 0 (0.0%) | 37 (100.0%) |
| Health Diagnosing & Treating | 7 (9.6%) | 66 (90.4%) |
| Health Technologists | 7 (12.5%) | 49 (87.5%) |
| Total (Category) | 464 (70.2%) | 197 (29.8%) |
| Total (Overall) | 829 (63.5%) | 476 (36.5%) |
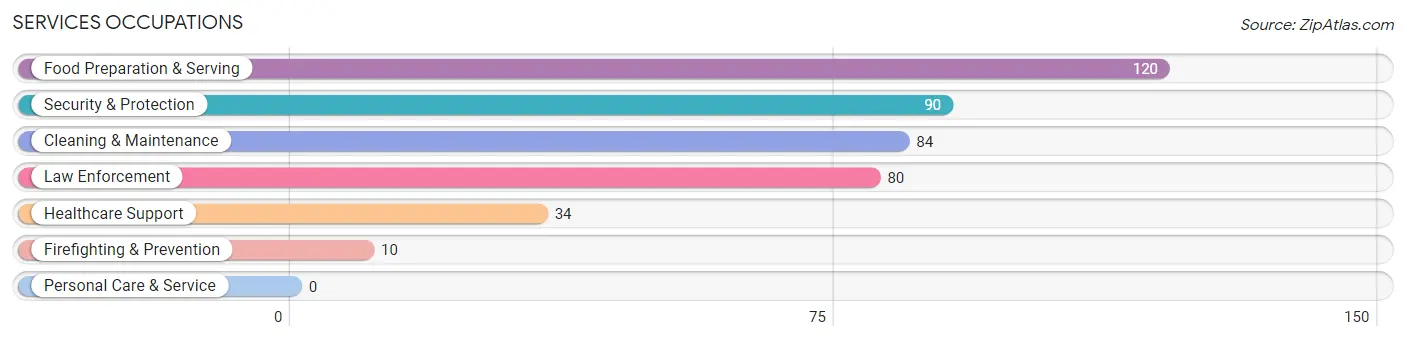
Services Occupations
The most common Services occupations in El Cerro are Food Preparation & Serving (120 | 9.2%), Security & Protection (90 | 6.9%), Cleaning & Maintenance (84 | 6.4%), Law Enforcement (80 | 6.1%), and Healthcare Support (34 | 2.6%).
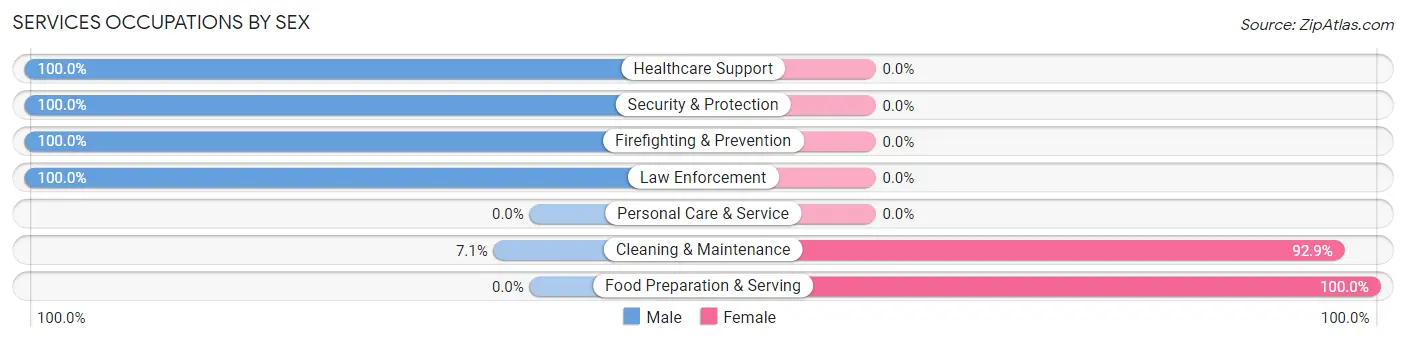
Services Occupations by Sex
Within the Services occupations in El Cerro, the most male-oriented occupations are Healthcare Support (100.0%), Security & Protection (100.0%), and Firefighting & Prevention (100.0%), while the most female-oriented occupations are Food Preparation & Serving (100.0%), and Cleaning & Maintenance (92.9%).
| Occupation | Male | Female |
| Healthcare Support | 34 (100.0%) | 0 (0.0%) |
| Security & Protection | 90 (100.0%) | 0 (0.0%) |
| Firefighting & Prevention | 10 (100.0%) | 0 (0.0%) |
| Law Enforcement | 80 (100.0%) | 0 (0.0%) |
| Food Preparation & Serving | 0 (0.0%) | 120 (100.0%) |
| Cleaning & Maintenance | 6 (7.1%) | 78 (92.9%) |
| Personal Care & Service | 0 (0.0%) | 0 (0.0%) |
| Total (Category) | 130 (39.6%) | 198 (60.4%) |
| Total (Overall) | 829 (63.5%) | 476 (36.5%) |
Sales and Office Occupations
The most common Sales and Office occupations in El Cerro are Office & Administration (66 | 5.1%), and Sales & Related (14 | 1.1%).
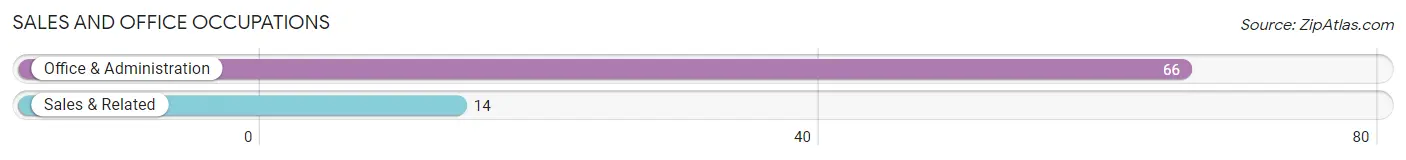
Sales and Office Occupations by Sex
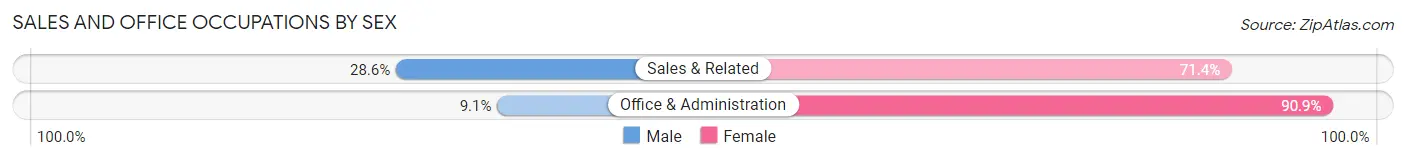
| Occupation | Male | Female |
| Sales & Related | 4 (28.6%) | 10 (71.4%) |
| Office & Administration | 6 (9.1%) | 60 (90.9%) |
| Total (Category) | 10 (12.5%) | 70 (87.5%) |
| Total (Overall) | 829 (63.5%) | 476 (36.5%) |
Natural Resources, Construction and Maintenance Occupations
The most common Natural Resources, Construction and Maintenance occupations in El Cerro are Installation, Maintenance & Repair (62 | 4.8%), and Construction & Extraction (28 | 2.1%).
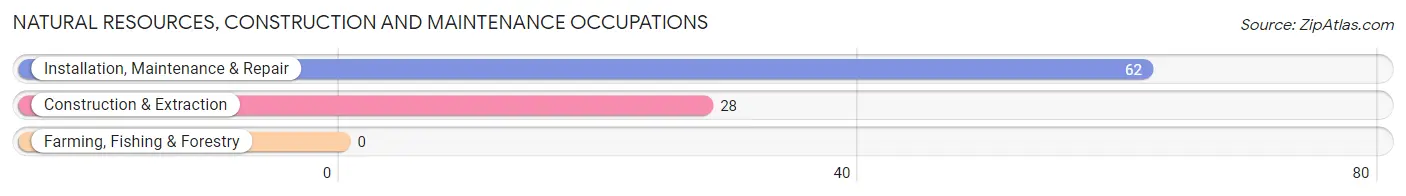
Natural Resources, Construction and Maintenance Occupations by Sex
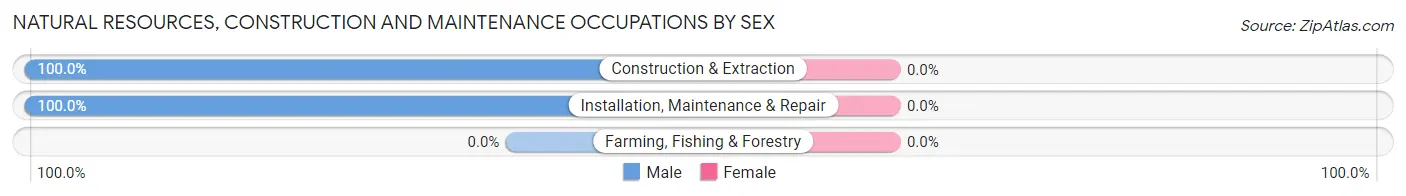
| Occupation | Male | Female |
| Farming, Fishing & Forestry | 0 (0.0%) | 0 (0.0%) |
| Construction & Extraction | 28 (100.0%) | 0 (0.0%) |
| Installation, Maintenance & Repair | 62 (100.0%) | 0 (0.0%) |
| Total (Category) | 90 (100.0%) | 0 (0.0%) |
| Total (Overall) | 829 (63.5%) | 476 (36.5%) |
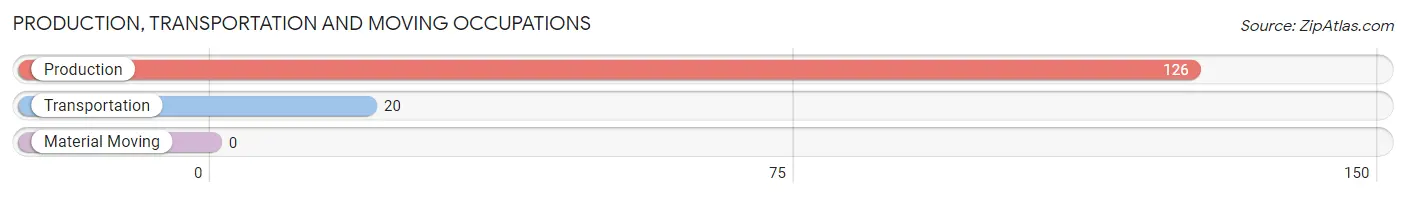
Production, Transportation and Moving Occupations
The most common Production, Transportation and Moving occupations in El Cerro are Production (126 | 9.7%), and Transportation (20 | 1.5%).
Production, Transportation and Moving Occupations by Sex
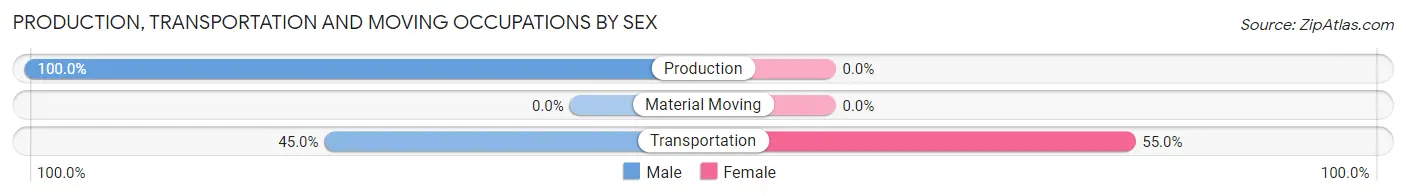
| Occupation | Male | Female |
| Production | 126 (100.0%) | 0 (0.0%) |
| Transportation | 9 (45.0%) | 11 (55.0%) |
| Material Moving | 0 (0.0%) | 0 (0.0%) |
| Total (Category) | 135 (92.5%) | 11 (7.5%) |
| Total (Overall) | 829 (63.5%) | 476 (36.5%) |
Employment Industries by Sex in El Cerro
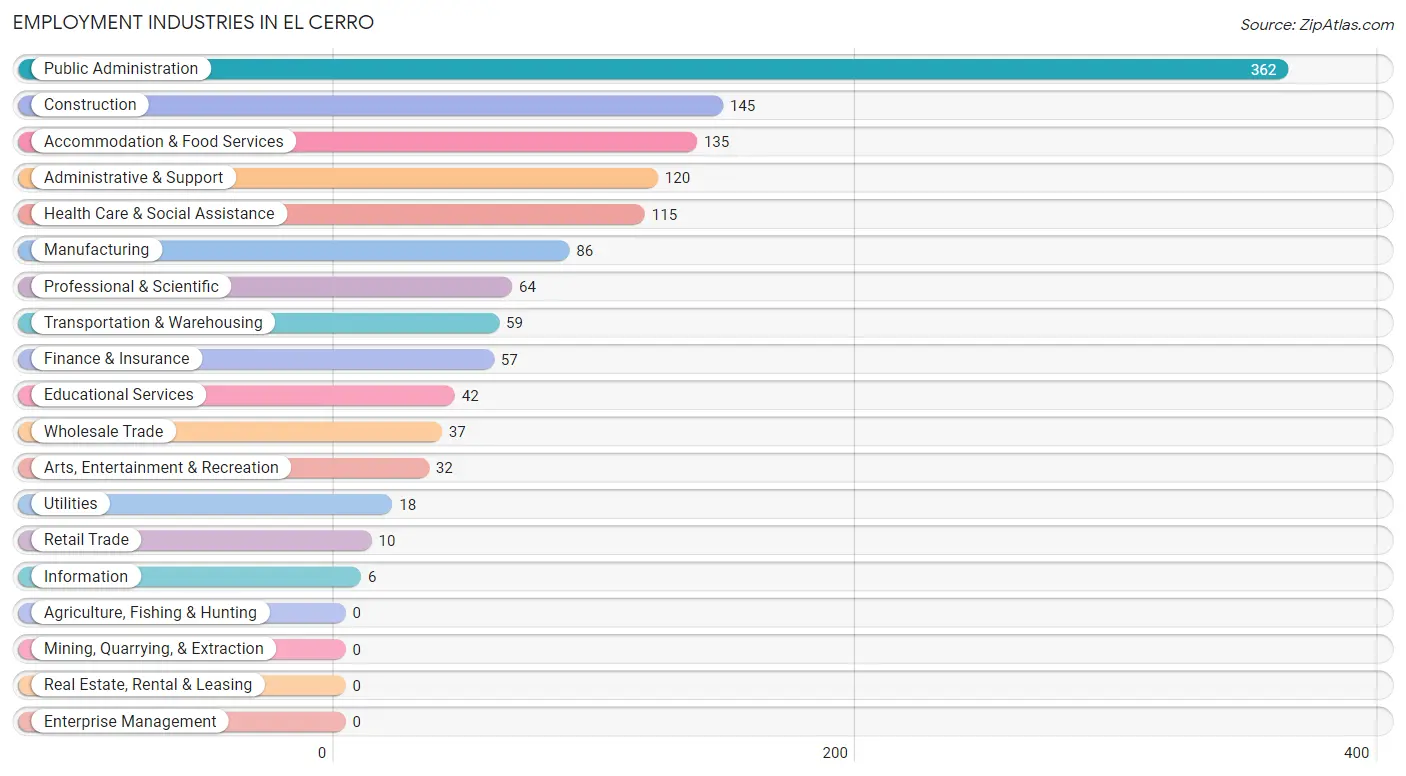
Employment Industries in El Cerro
The major employment industries in El Cerro include Public Administration (362 | 27.7%), Construction (145 | 11.1%), Accommodation & Food Services (135 | 10.3%), Administrative & Support (120 | 9.2%), and Health Care & Social Assistance (115 | 8.8%).
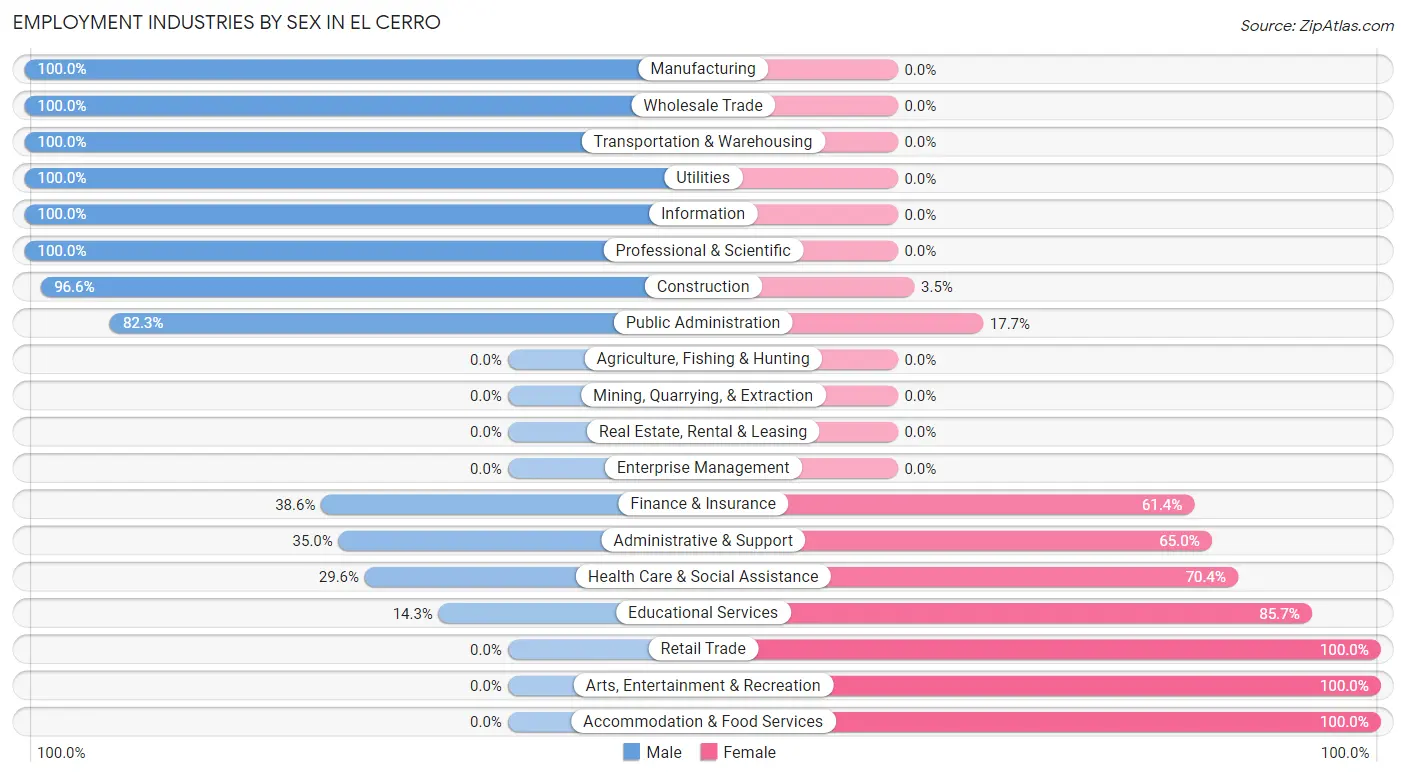
Employment Industries by Sex in El Cerro
The El Cerro industries that see more men than women are Manufacturing (100.0%), Wholesale Trade (100.0%), and Transportation & Warehousing (100.0%), whereas the industries that tend to have a higher number of women are Retail Trade (100.0%), Arts, Entertainment & Recreation (100.0%), and Accommodation & Food Services (100.0%).
| Industry | Male | Female |
| Agriculture, Fishing & Hunting | 0 (0.0%) | 0 (0.0%) |
| Mining, Quarrying, & Extraction | 0 (0.0%) | 0 (0.0%) |
| Construction | 140 (96.6%) | 5 (3.5%) |
| Manufacturing | 86 (100.0%) | 0 (0.0%) |
| Wholesale Trade | 37 (100.0%) | 0 (0.0%) |
| Retail Trade | 0 (0.0%) | 10 (100.0%) |
| Transportation & Warehousing | 59 (100.0%) | 0 (0.0%) |
| Utilities | 18 (100.0%) | 0 (0.0%) |
| Information | 6 (100.0%) | 0 (0.0%) |
| Finance & Insurance | 22 (38.6%) | 35 (61.4%) |
| Real Estate, Rental & Leasing | 0 (0.0%) | 0 (0.0%) |
| Professional & Scientific | 64 (100.0%) | 0 (0.0%) |
| Enterprise Management | 0 (0.0%) | 0 (0.0%) |
| Administrative & Support | 42 (35.0%) | 78 (65.0%) |
| Educational Services | 6 (14.3%) | 36 (85.7%) |
| Health Care & Social Assistance | 34 (29.6%) | 81 (70.4%) |
| Arts, Entertainment & Recreation | 0 (0.0%) | 32 (100.0%) |
| Accommodation & Food Services | 0 (0.0%) | 135 (100.0%) |
| Public Administration | 298 (82.3%) | 64 (17.7%) |
| Total | 829 (63.5%) | 476 (36.5%) |
Education in El Cerro
School Enrollment in El Cerro
The most common levels of schooling among the 410 students in El Cerro are elementary school (137 | 33.4%), high school (131 | 32.0%), and nursery / preschool (105 | 25.6%).
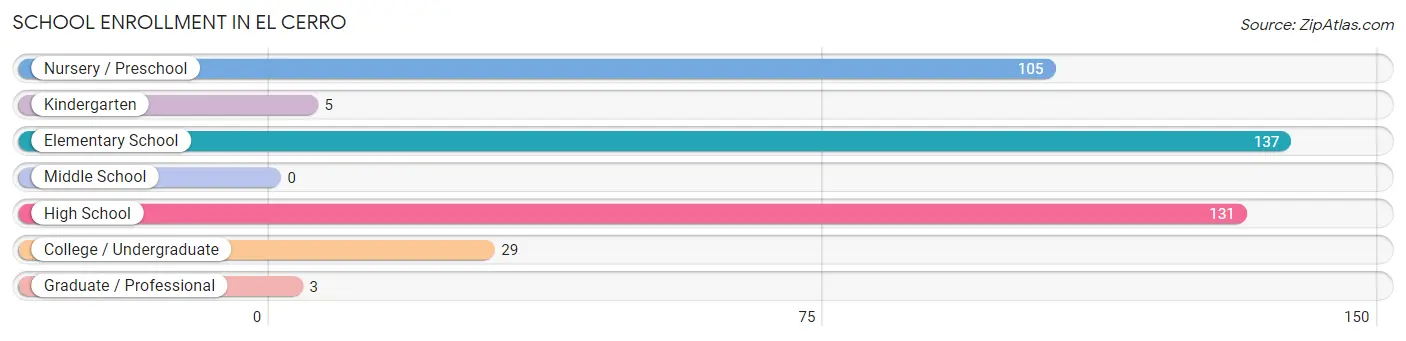
| School Level | # Students | % Students |
| Nursery / Preschool | 105 | 25.6% |
| Kindergarten | 5 | 1.2% |
| Elementary School | 137 | 33.4% |
| Middle School | 0 | 0.0% |
| High School | 131 | 32.0% |
| College / Undergraduate | 29 | 7.1% |
| Graduate / Professional | 3 | 0.7% |
| Total | 410 | 100.0% |
School Enrollment by Age by Funding Source in El Cerro
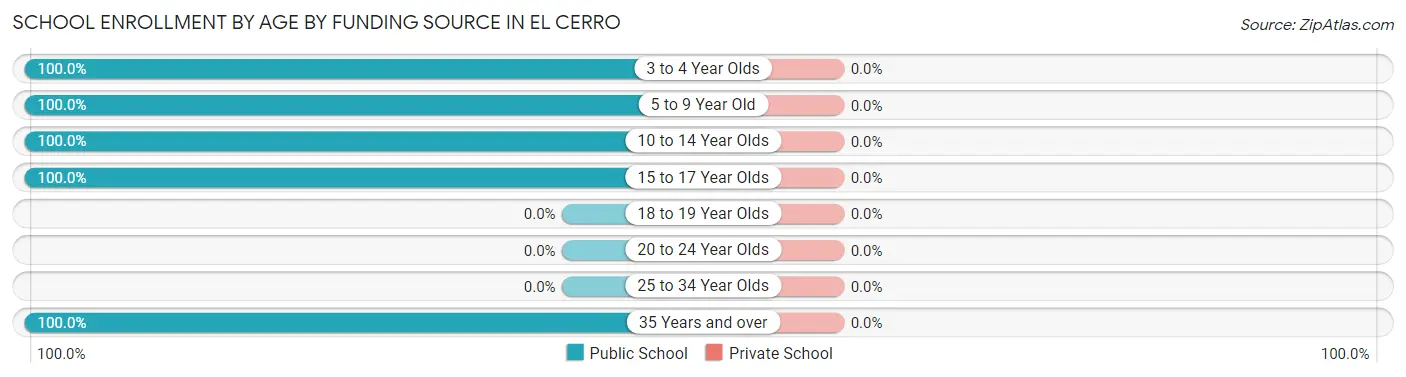
| Age Bracket | Public School | Private School |
| 3 to 4 Year Olds | 105 (100.0%) | 0 (0.0%) |
| 5 to 9 Year Old | 70 (100.0%) | 0 (0.0%) |
| 10 to 14 Year Olds | 72 (100.0%) | 0 (0.0%) |
| 15 to 17 Year Olds | 131 (100.0%) | 0 (0.0%) |
| 18 to 19 Year Olds | 0 (0.0%) | 0 (0.0%) |
| 20 to 24 Year Olds | 0 (0.0%) | 0 (0.0%) |
| 25 to 34 Year Olds | 0 (0.0%) | 0 (0.0%) |
| 35 Years and over | 32 (100.0%) | 0 (0.0%) |
| Total | 410 (100.0%) | 0 (0.0%) |
Educational Attainment by Field of Study in El Cerro
Science & technology (120 | 28.2%), education (77 | 18.1%), physical & health sciences (35 | 8.2%), engineering (32 | 7.5%), and social sciences (28 | 6.6%) are the most common fields of study among 426 individuals in El Cerro who have obtained a bachelor's degree or higher.
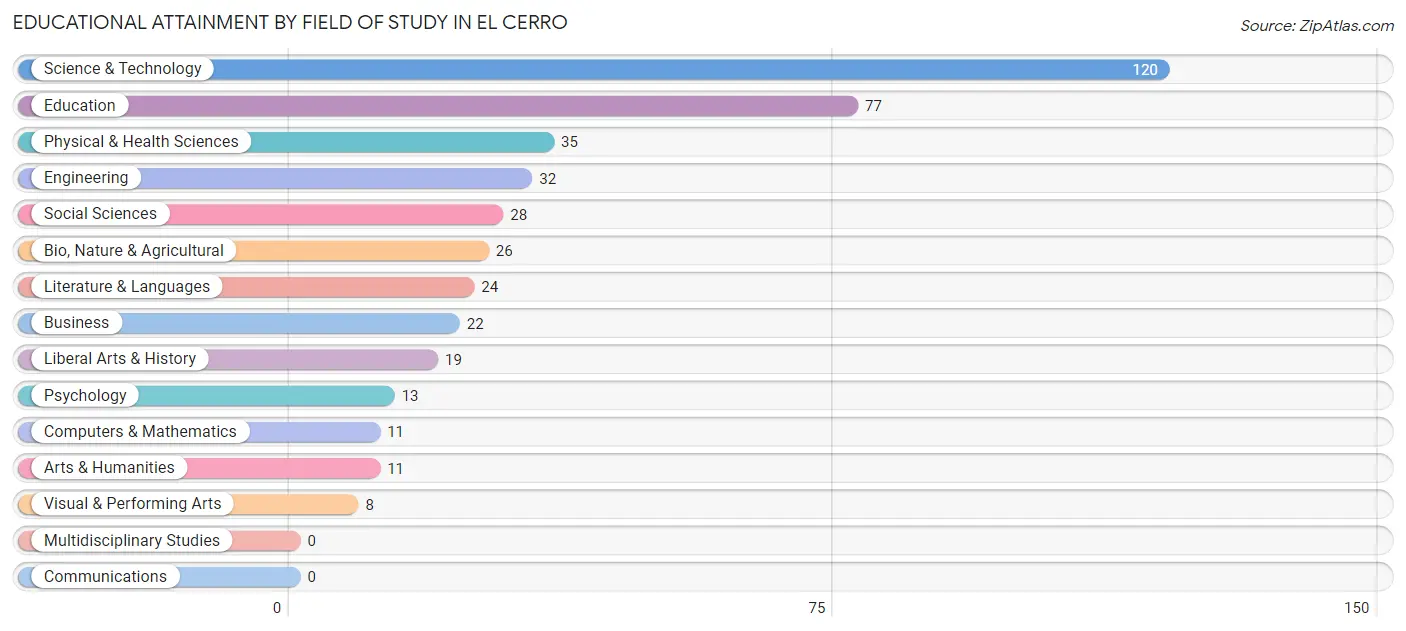
| Field of Study | # Graduates | % Graduates |
| Computers & Mathematics | 11 | 2.6% |
| Bio, Nature & Agricultural | 26 | 6.1% |
| Physical & Health Sciences | 35 | 8.2% |
| Psychology | 13 | 3.0% |
| Social Sciences | 28 | 6.6% |
| Engineering | 32 | 7.5% |
| Multidisciplinary Studies | 0 | 0.0% |
| Science & Technology | 120 | 28.2% |
| Business | 22 | 5.2% |
| Education | 77 | 18.1% |
| Literature & Languages | 24 | 5.6% |
| Liberal Arts & History | 19 | 4.5% |
| Visual & Performing Arts | 8 | 1.9% |
| Communications | 0 | 0.0% |
| Arts & Humanities | 11 | 2.6% |
| Total | 426 | 100.0% |
Transportation & Commute in El Cerro
Vehicle Availability by Sex in El Cerro
The most prevalent vehicle ownership categories in El Cerro are males with 5 or more vehicles (307, accounting for 37.0%) and females with 5 or more vehicles (246, making up 71.4%).
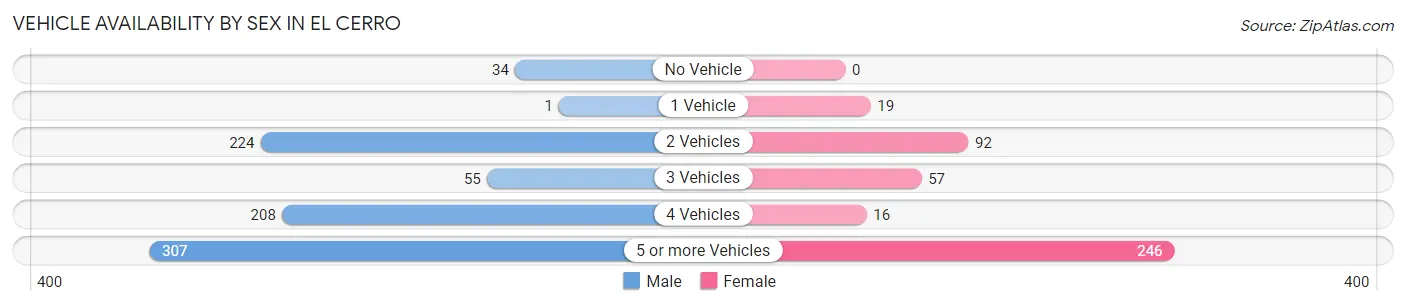
| Vehicles Available | Male | Female |
| No Vehicle | 34 (4.1%) | 0 (0.0%) |
| 1 Vehicle | 1 (0.1%) | 19 (4.4%) |
| 2 Vehicles | 224 (27.0%) | 92 (21.4%) |
| 3 Vehicles | 55 (6.6%) | 57 (13.3%) |
| 4 Vehicles | 208 (25.1%) | 16 (3.7%) |
| 5 or more Vehicles | 307 (37.0%) | 246 (57.2%) |
| Total | 829 (100.0%) | 430 (100.0%) |
Commute Time in El Cerro
The most frequently occuring commute durations in El Cerro are 15 to 19 minutes (323 commuters, 26.3%), 20 to 24 minutes (248 commuters, 20.2%), and 10 to 14 minutes (201 commuters, 16.3%).
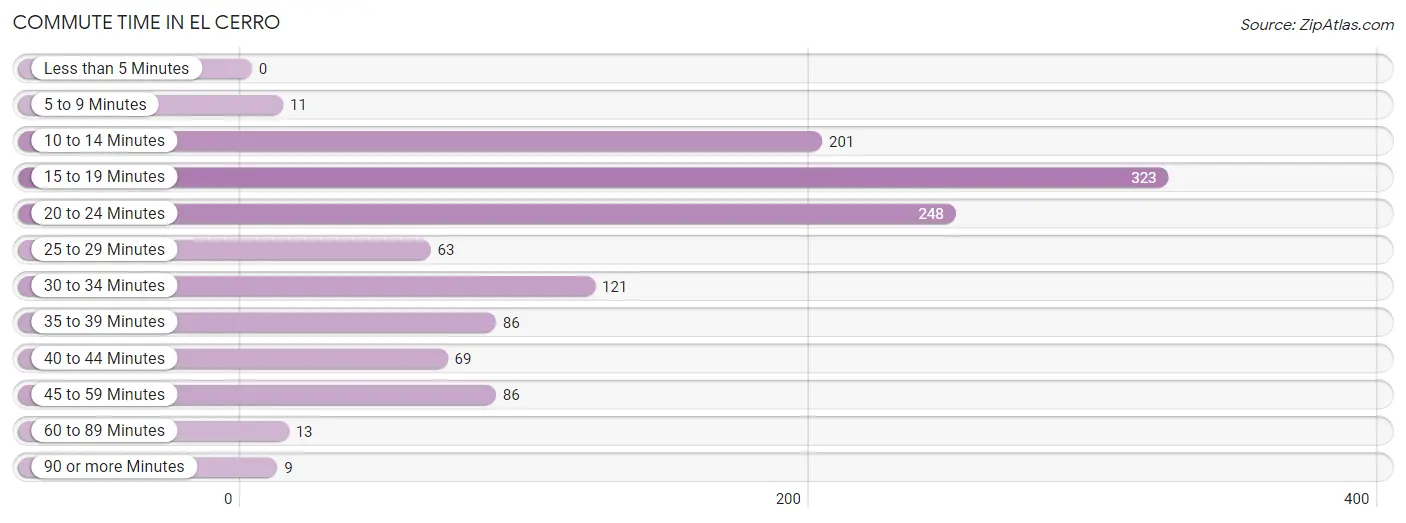
| Commute Time | # Commuters | % Commuters |
| Less than 5 Minutes | 0 | 0.0% |
| 5 to 9 Minutes | 11 | 0.9% |
| 10 to 14 Minutes | 201 | 16.3% |
| 15 to 19 Minutes | 323 | 26.3% |
| 20 to 24 Minutes | 248 | 20.2% |
| 25 to 29 Minutes | 63 | 5.1% |
| 30 to 34 Minutes | 121 | 9.8% |
| 35 to 39 Minutes | 86 | 7.0% |
| 40 to 44 Minutes | 69 | 5.6% |
| 45 to 59 Minutes | 86 | 7.0% |
| 60 to 89 Minutes | 13 | 1.1% |
| 90 or more Minutes | 9 | 0.7% |
Commute Time by Sex in El Cerro
The most common commute times in El Cerro are 15 to 19 minutes (308 commuters, 37.2%) for males and 10 to 14 minutes (180 commuters, 44.8%) for females.
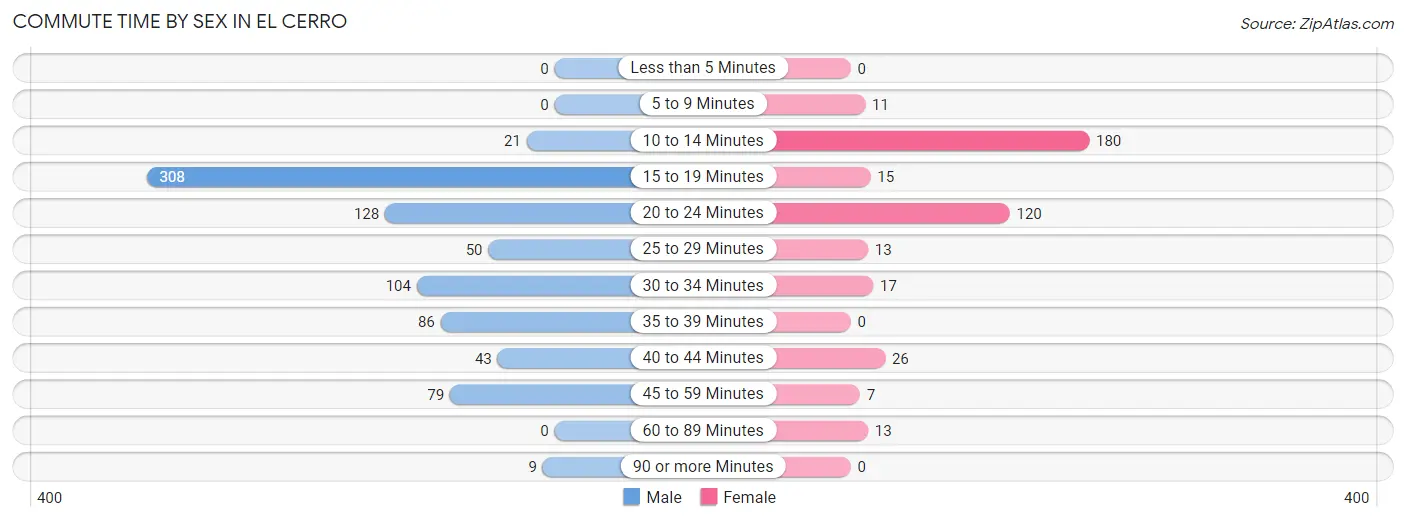
| Commute Time | Male | Female |
| Less than 5 Minutes | 0 (0.0%) | 0 (0.0%) |
| 5 to 9 Minutes | 0 (0.0%) | 11 (2.7%) |
| 10 to 14 Minutes | 21 (2.5%) | 180 (44.8%) |
| 15 to 19 Minutes | 308 (37.2%) | 15 (3.7%) |
| 20 to 24 Minutes | 128 (15.5%) | 120 (29.8%) |
| 25 to 29 Minutes | 50 (6.0%) | 13 (3.2%) |
| 30 to 34 Minutes | 104 (12.6%) | 17 (4.2%) |
| 35 to 39 Minutes | 86 (10.4%) | 0 (0.0%) |
| 40 to 44 Minutes | 43 (5.2%) | 26 (6.5%) |
| 45 to 59 Minutes | 79 (9.5%) | 7 (1.7%) |
| 60 to 89 Minutes | 0 (0.0%) | 13 (3.2%) |
| 90 or more Minutes | 9 (1.1%) | 0 (0.0%) |
Time of Departure to Work by Sex in El Cerro
The most frequent times of departure to work in El Cerro are 6:00 AM to 6:29 AM (186, 22.5%) for males and 7:30 AM to 7:59 AM (175, 43.5%) for females.
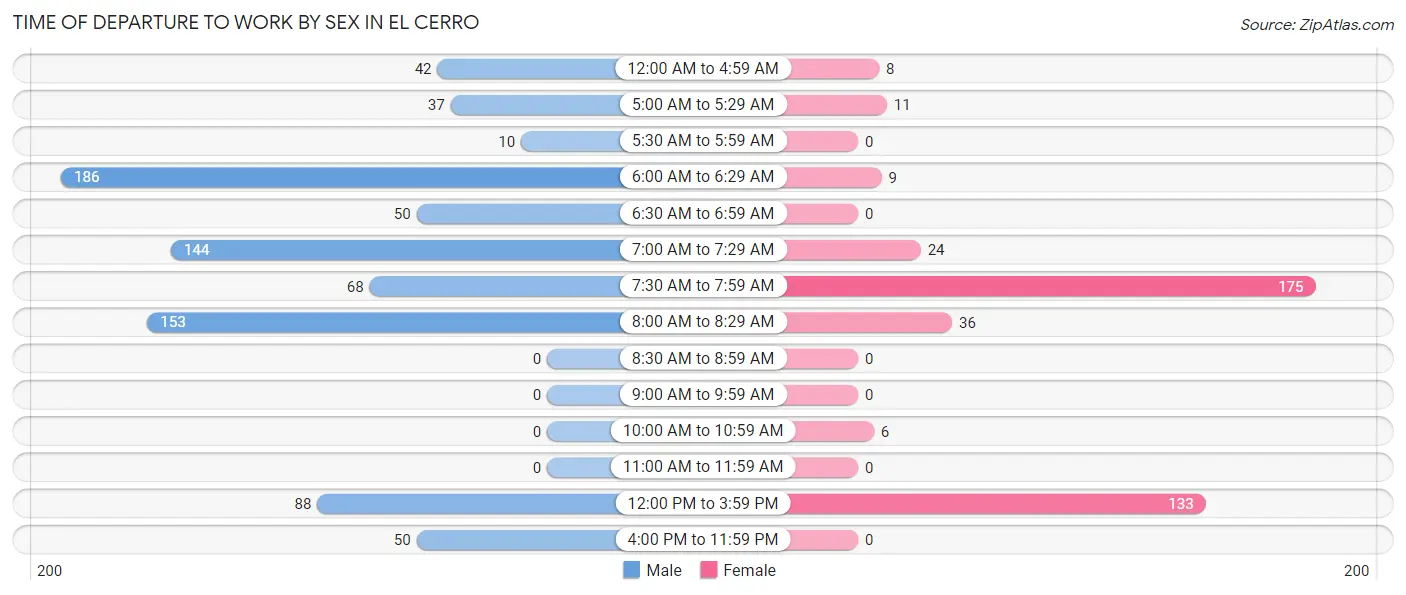
| Time of Departure | Male | Female |
| 12:00 AM to 4:59 AM | 42 (5.1%) | 8 (2.0%) |
| 5:00 AM to 5:29 AM | 37 (4.5%) | 11 (2.7%) |
| 5:30 AM to 5:59 AM | 10 (1.2%) | 0 (0.0%) |
| 6:00 AM to 6:29 AM | 186 (22.5%) | 9 (2.2%) |
| 6:30 AM to 6:59 AM | 50 (6.0%) | 0 (0.0%) |
| 7:00 AM to 7:29 AM | 144 (17.4%) | 24 (6.0%) |
| 7:30 AM to 7:59 AM | 68 (8.2%) | 175 (43.5%) |
| 8:00 AM to 8:29 AM | 153 (18.5%) | 36 (9.0%) |
| 8:30 AM to 8:59 AM | 0 (0.0%) | 0 (0.0%) |
| 9:00 AM to 9:59 AM | 0 (0.0%) | 0 (0.0%) |
| 10:00 AM to 10:59 AM | 0 (0.0%) | 6 (1.5%) |
| 11:00 AM to 11:59 AM | 0 (0.0%) | 0 (0.0%) |
| 12:00 PM to 3:59 PM | 88 (10.6%) | 133 (33.1%) |
| 4:00 PM to 11:59 PM | 50 (6.0%) | 0 (0.0%) |
| Total | 828 (100.0%) | 402 (100.0%) |
Housing Occupancy in El Cerro
Occupancy by Ownership in El Cerro
Of the total 894 dwellings in El Cerro, owner-occupied units account for 743 (83.1%), while renter-occupied units make up 151 (16.9%).
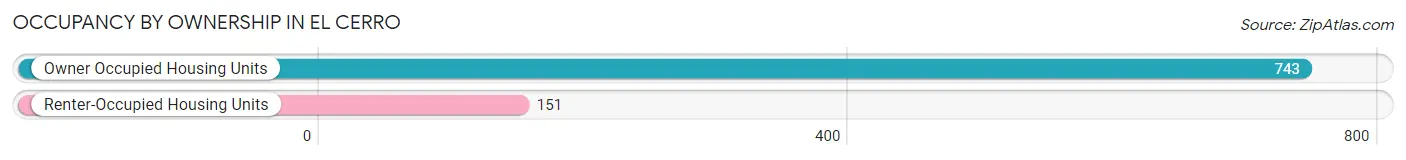
| Occupancy | # Housing Units | % Housing Units |
| Owner Occupied Housing Units | 743 | 83.1% |
| Renter-Occupied Housing Units | 151 | 16.9% |
| Total Occupied Housing Units | 894 | 100.0% |
Occupancy by Household Size in El Cerro
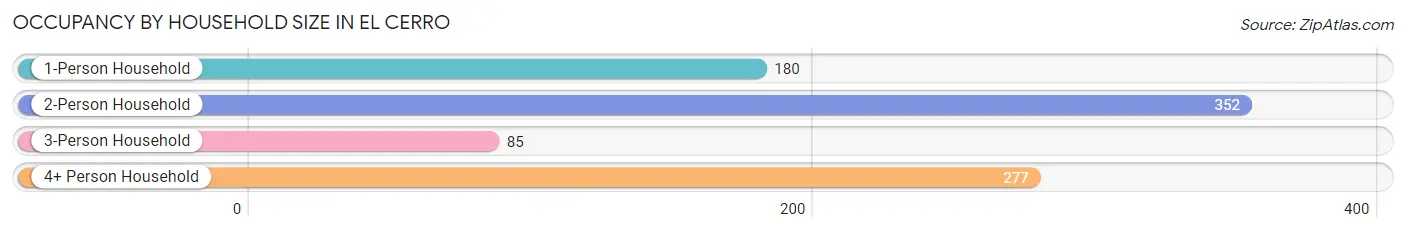
| Household Size | # Housing Units | % Housing Units |
| 1-Person Household | 180 | 20.1% |
| 2-Person Household | 352 | 39.4% |
| 3-Person Household | 85 | 9.5% |
| 4+ Person Household | 277 | 31.0% |
| Total Housing Units | 894 | 100.0% |
Occupancy by Ownership by Household Size in El Cerro
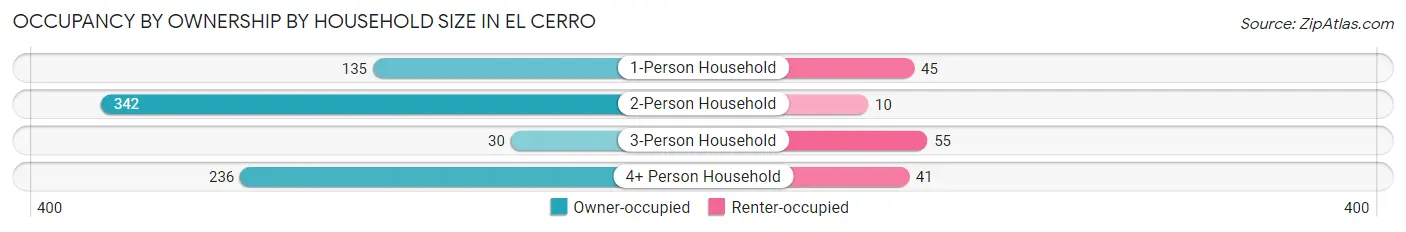
| Household Size | Owner-occupied | Renter-occupied |
| 1-Person Household | 135 (75.0%) | 45 (25.0%) |
| 2-Person Household | 342 (97.2%) | 10 (2.8%) |
| 3-Person Household | 30 (35.3%) | 55 (64.7%) |
| 4+ Person Household | 236 (85.2%) | 41 (14.8%) |
| Total Housing Units | 743 (83.1%) | 151 (16.9%) |
Occupancy by Educational Attainment in El Cerro
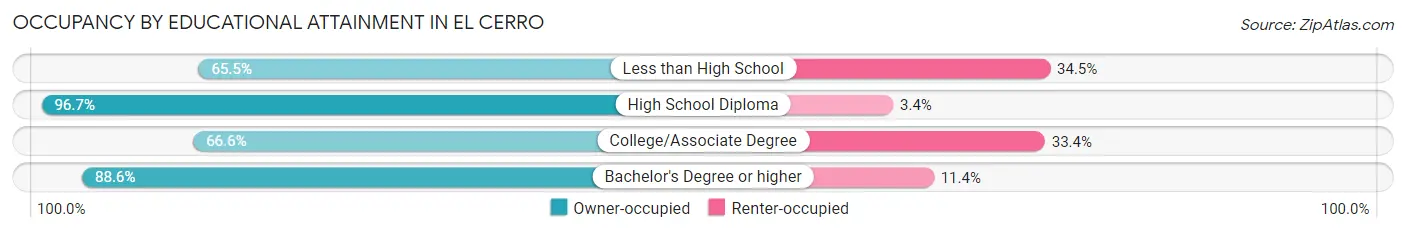
| Household Size | Owner-occupied | Renter-occupied |
| Less than High School | 19 (65.5%) | 10 (34.5%) |
| High School Diploma | 346 (96.7%) | 12 (3.4%) |
| College/Associate Degree | 215 (66.6%) | 108 (33.4%) |
| Bachelor's Degree or higher | 163 (88.6%) | 21 (11.4%) |
Occupancy by Age of Householder in El Cerro
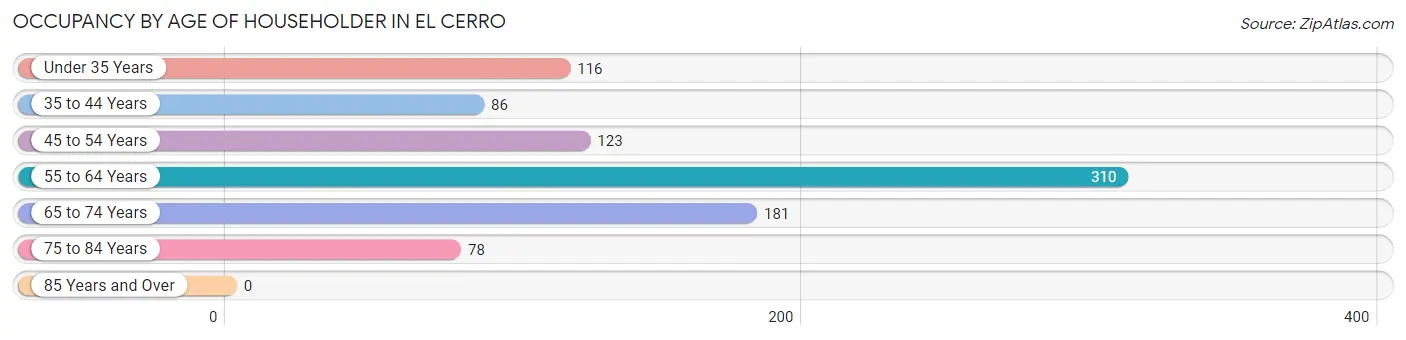
| Age Bracket | # Households | % Households |
| Under 35 Years | 116 | 13.0% |
| 35 to 44 Years | 86 | 9.6% |
| 45 to 54 Years | 123 | 13.8% |
| 55 to 64 Years | 310 | 34.7% |
| 65 to 74 Years | 181 | 20.3% |
| 75 to 84 Years | 78 | 8.7% |
| 85 Years and Over | 0 | 0.0% |
| Total | 894 | 100.0% |
Housing Finances in El Cerro
Median Income by Occupancy in El Cerro
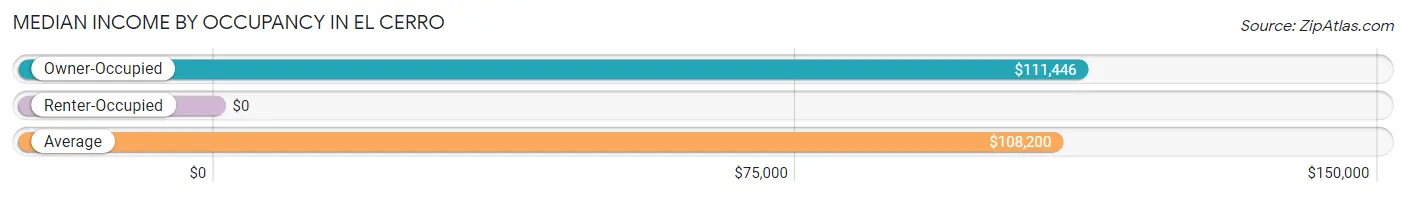
| Occupancy Type | # Households | Median Income |
| Owner-Occupied | 743 (83.1%) | $111,446 |
| Renter-Occupied | 151 (16.9%) | $0 |
| Average | 894 (100.0%) | $108,200 |
Occupancy by Householder Income Bracket in El Cerro

| Income Bracket | Owner-occupied | Renter-occupied |
| Less than $5,000 | 13 (1.8%) | 0 (0.0%) |
| $5,000 to $9,999 | 21 (2.8%) | 0 (0.0%) |
| $10,000 to $14,999 | 30 (4.0%) | 12 (8.0%) |
| $15,000 to $19,999 | 13 (1.8%) | 41 (27.2%) |
| $20,000 to $24,999 | 14 (1.9%) | 12 (8.0%) |
| $25,000 to $34,999 | 68 (9.1%) | 0 (0.0%) |
| $35,000 to $49,999 | 22 (3.0%) | 21 (13.9%) |
| $50,000 to $74,999 | 51 (6.9%) | 0 (0.0%) |
| $75,000 to $99,999 | 43 (5.8%) | 0 (0.0%) |
| $100,000 to $149,999 | 269 (36.2%) | 65 (43.0%) |
| $150,000 or more | 199 (26.8%) | 0 (0.0%) |
| Total | 743 (100.0%) | 151 (100.0%) |
Monthly Housing Cost Tiers in El Cerro
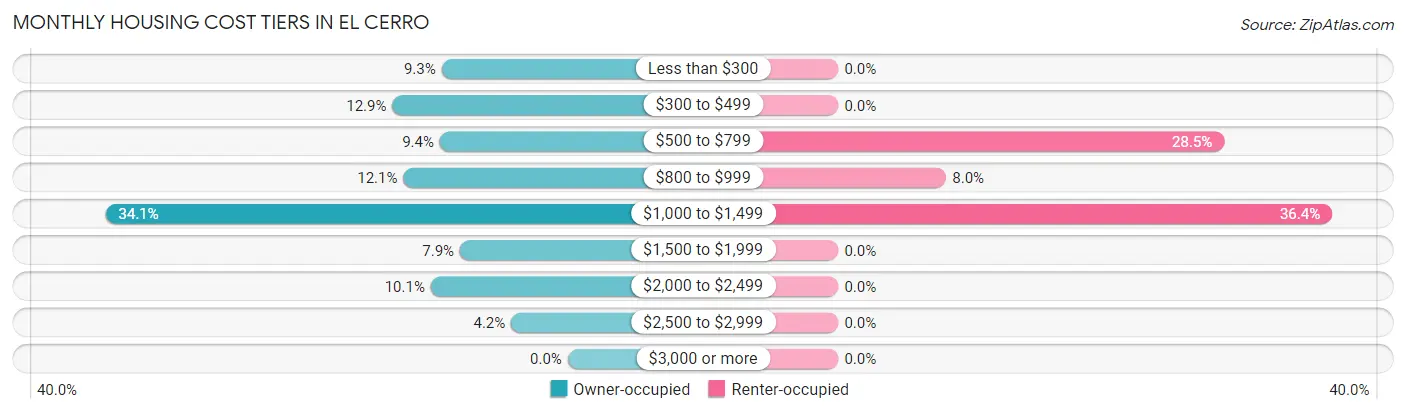
| Monthly Cost | Owner-occupied | Renter-occupied |
| Less than $300 | 69 (9.3%) | 0 (0.0%) |
| $300 to $499 | 96 (12.9%) | 0 (0.0%) |
| $500 to $799 | 70 (9.4%) | 43 (28.5%) |
| $800 to $999 | 90 (12.1%) | 12 (8.0%) |
| $1,000 to $1,499 | 253 (34.1%) | 55 (36.4%) |
| $1,500 to $1,999 | 59 (7.9%) | 0 (0.0%) |
| $2,000 to $2,499 | 75 (10.1%) | 0 (0.0%) |
| $2,500 to $2,999 | 31 (4.2%) | 0 (0.0%) |
| $3,000 or more | 0 (0.0%) | 0 (0.0%) |
| Total | 743 (100.0%) | 151 (100.0%) |
Physical Housing Characteristics in El Cerro
Housing Structures in El Cerro
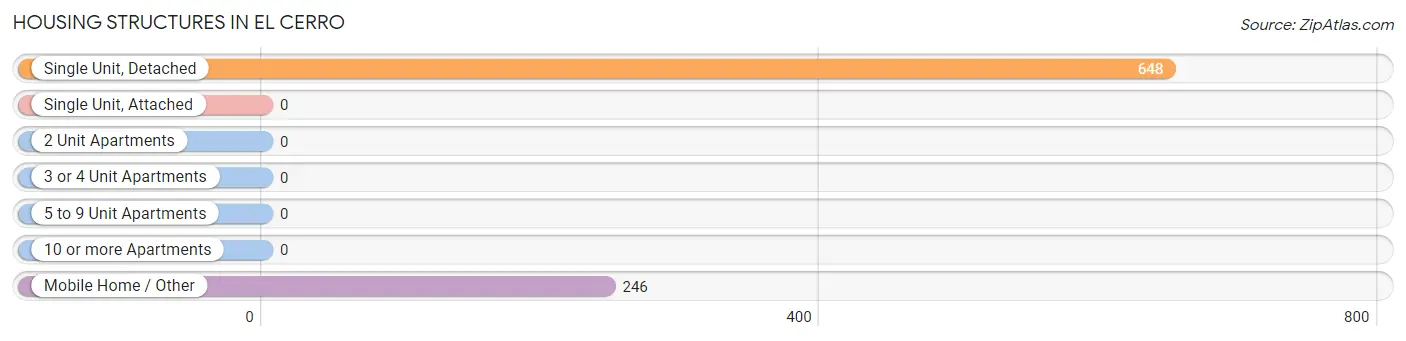
| Structure Type | # Housing Units | % Housing Units |
| Single Unit, Detached | 648 | 72.5% |
| Single Unit, Attached | 0 | 0.0% |
| 2 Unit Apartments | 0 | 0.0% |
| 3 or 4 Unit Apartments | 0 | 0.0% |
| 5 to 9 Unit Apartments | 0 | 0.0% |
| 10 or more Apartments | 0 | 0.0% |
| Mobile Home / Other | 246 | 27.5% |
| Total | 894 | 100.0% |
Housing Structures by Occupancy in El Cerro
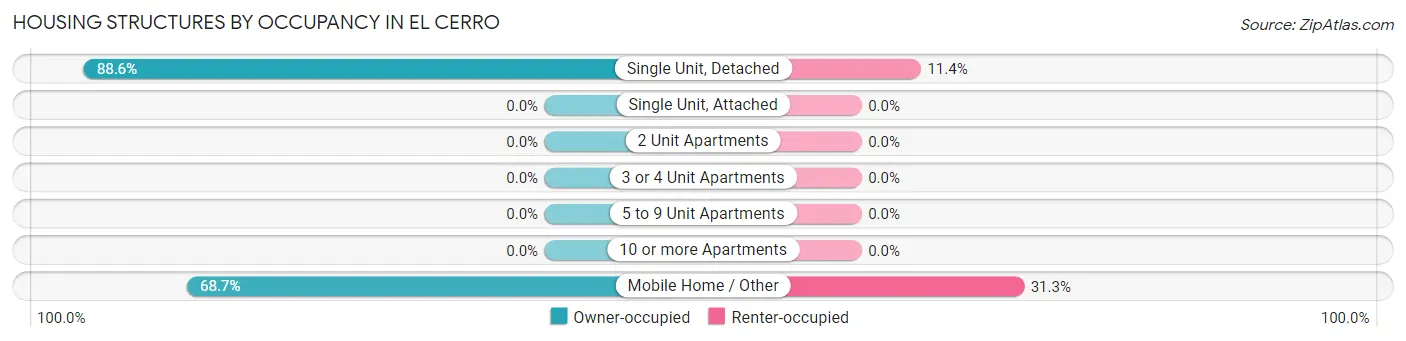
| Structure Type | Owner-occupied | Renter-occupied |
| Single Unit, Detached | 574 (88.6%) | 74 (11.4%) |
| Single Unit, Attached | 0 (0.0%) | 0 (0.0%) |
| 2 Unit Apartments | 0 (0.0%) | 0 (0.0%) |
| 3 or 4 Unit Apartments | 0 (0.0%) | 0 (0.0%) |
| 5 to 9 Unit Apartments | 0 (0.0%) | 0 (0.0%) |
| 10 or more Apartments | 0 (0.0%) | 0 (0.0%) |
| Mobile Home / Other | 169 (68.7%) | 77 (31.3%) |
| Total | 743 (83.1%) | 151 (16.9%) |
Housing Structures by Number of Rooms in El Cerro
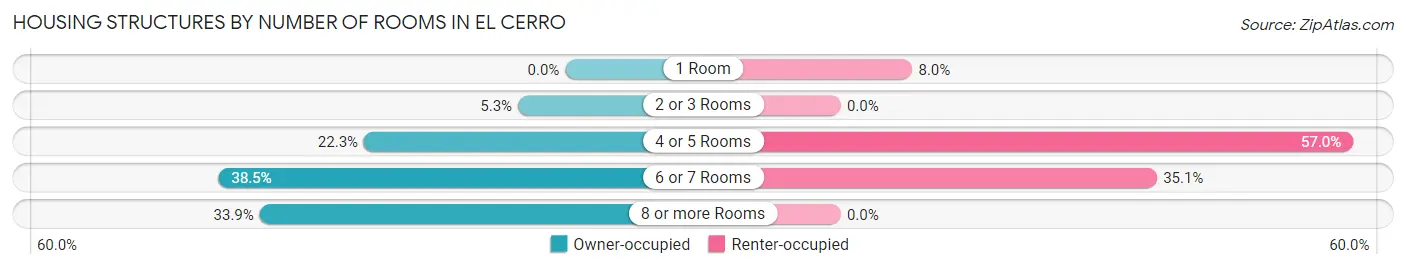
| Number of Rooms | Owner-occupied | Renter-occupied |
| 1 Room | 0 (0.0%) | 12 (8.0%) |
| 2 or 3 Rooms | 39 (5.2%) | 0 (0.0%) |
| 4 or 5 Rooms | 166 (22.3%) | 86 (57.0%) |
| 6 or 7 Rooms | 286 (38.5%) | 53 (35.1%) |
| 8 or more Rooms | 252 (33.9%) | 0 (0.0%) |
| Total | 743 (100.0%) | 151 (100.0%) |
Housing Structure by Heating Type in El Cerro
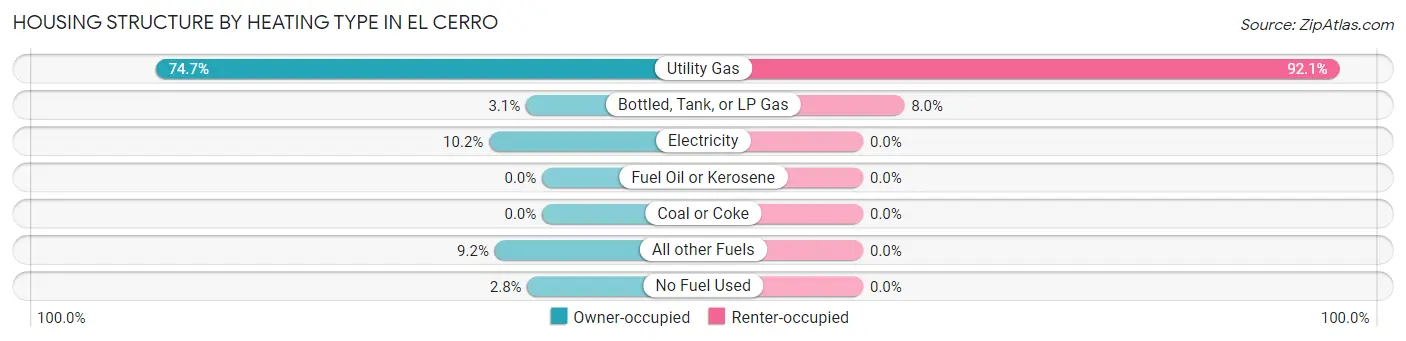
| Heating Type | Owner-occupied | Renter-occupied |
| Utility Gas | 555 (74.7%) | 139 (92.0%) |
| Bottled, Tank, or LP Gas | 23 (3.1%) | 12 (8.0%) |
| Electricity | 76 (10.2%) | 0 (0.0%) |
| Fuel Oil or Kerosene | 0 (0.0%) | 0 (0.0%) |
| Coal or Coke | 0 (0.0%) | 0 (0.0%) |
| All other Fuels | 68 (9.1%) | 0 (0.0%) |
| No Fuel Used | 21 (2.8%) | 0 (0.0%) |
| Total | 743 (100.0%) | 151 (100.0%) |
Household Vehicle Usage in El Cerro
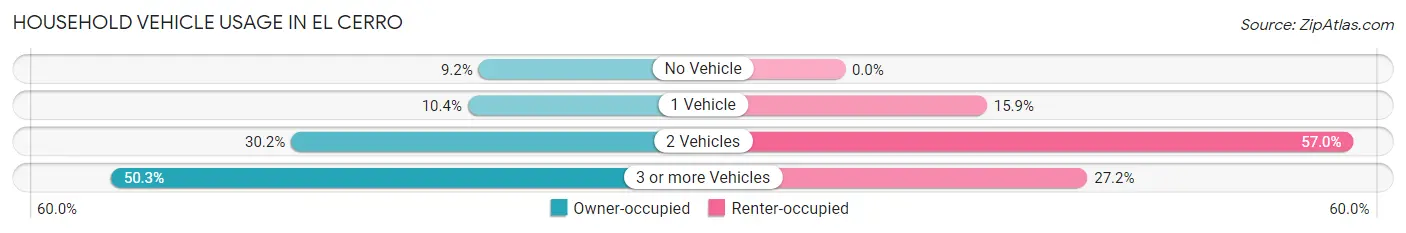
| Vehicles per Household | Owner-occupied | Renter-occupied |
| No Vehicle | 68 (9.1%) | 0 (0.0%) |
| 1 Vehicle | 77 (10.4%) | 24 (15.9%) |
| 2 Vehicles | 224 (30.1%) | 86 (57.0%) |
| 3 or more Vehicles | 374 (50.3%) | 41 (27.2%) |
| Total | 743 (100.0%) | 151 (100.0%) |
Real Estate & Mortgages in El Cerro
Real Estate and Mortgage Overview in El Cerro
| Characteristic | Without Mortgage | With Mortgage |
| Housing Units | 241 | 502 |
| Median Property Value | $237,500 | $230,900 |
| Median Household Income | $67,639 | $149 |
| Monthly Housing Costs | $391 | $0 |
| Real Estate Taxes | $1,727 | $21 |
Property Value by Mortgage Status in El Cerro
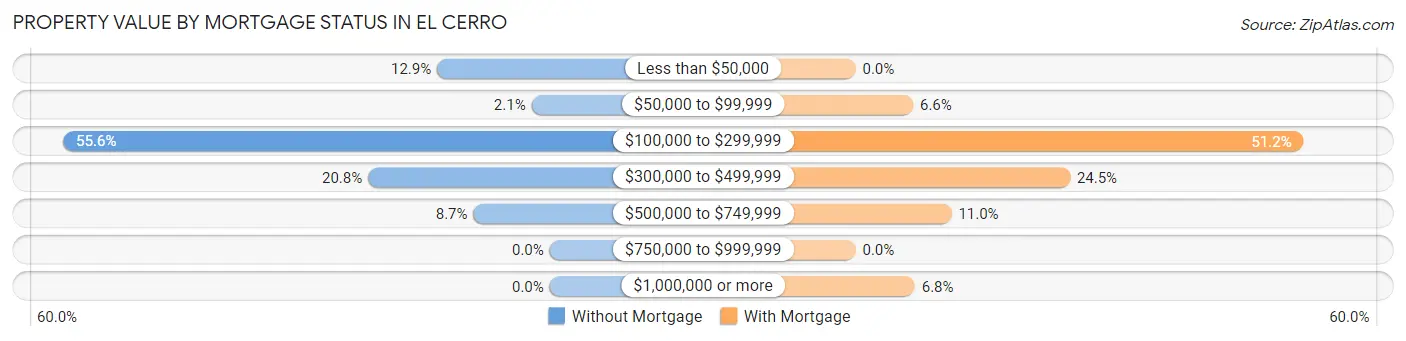
| Property Value | Without Mortgage | With Mortgage |
| Less than $50,000 | 31 (12.9%) | 0 (0.0%) |
| $50,000 to $99,999 | 5 (2.1%) | 33 (6.6%) |
| $100,000 to $299,999 | 134 (55.6%) | 257 (51.2%) |
| $300,000 to $499,999 | 50 (20.7%) | 123 (24.5%) |
| $500,000 to $749,999 | 21 (8.7%) | 55 (11.0%) |
| $750,000 to $999,999 | 0 (0.0%) | 0 (0.0%) |
| $1,000,000 or more | 0 (0.0%) | 34 (6.8%) |
| Total | 241 (100.0%) | 502 (100.0%) |
Household Income by Mortgage Status in El Cerro
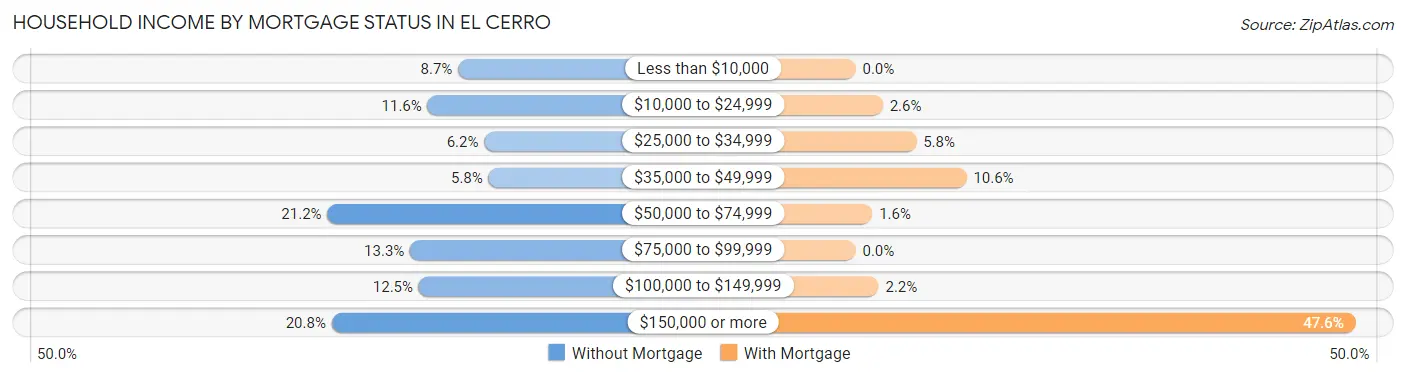
| Household Income | Without Mortgage | With Mortgage |
| Less than $10,000 | 21 (8.7%) | 0 (0.0%) |
| $10,000 to $24,999 | 28 (11.6%) | 13 (2.6%) |
| $25,000 to $34,999 | 15 (6.2%) | 29 (5.8%) |
| $35,000 to $49,999 | 14 (5.8%) | 53 (10.6%) |
| $50,000 to $74,999 | 51 (21.2%) | 8 (1.6%) |
| $75,000 to $99,999 | 32 (13.3%) | 0 (0.0%) |
| $100,000 to $149,999 | 30 (12.4%) | 11 (2.2%) |
| $150,000 or more | 50 (20.7%) | 239 (47.6%) |
| Total | 241 (100.0%) | 502 (100.0%) |
Property Value to Household Income Ratio in El Cerro
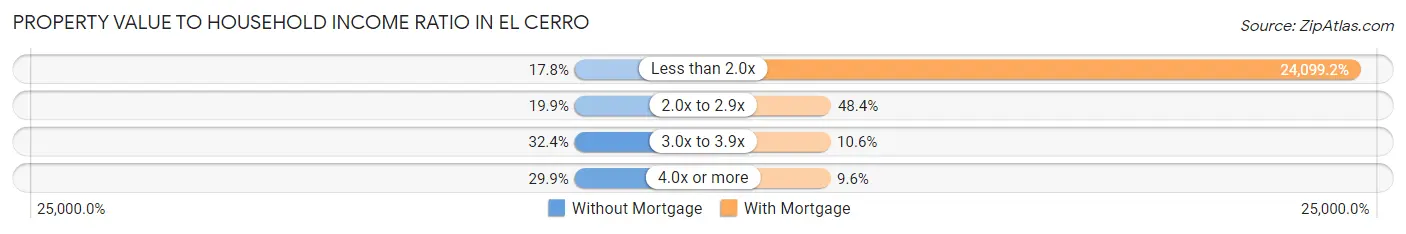
| Value-to-Income Ratio | Without Mortgage | With Mortgage |
| Less than 2.0x | 43 (17.8%) | 120,978 (24,099.2%) |
| 2.0x to 2.9x | 48 (19.9%) | 243 (48.4%) |
| 3.0x to 3.9x | 78 (32.4%) | 53 (10.6%) |
| 4.0x or more | 72 (29.9%) | 48 (9.6%) |
| Total | 241 (100.0%) | 502 (100.0%) |
Real Estate Taxes by Mortgage Status in El Cerro
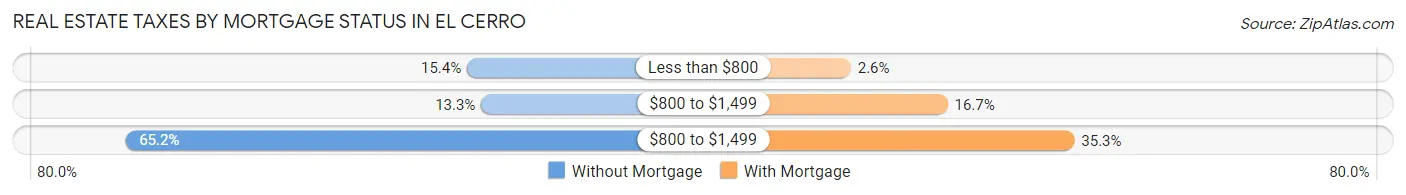
| Property Taxes | Without Mortgage | With Mortgage |
| Less than $800 | 37 (15.3%) | 13 (2.6%) |
| $800 to $1,499 | 32 (13.3%) | 84 (16.7%) |
| $800 to $1,499 | 157 (65.1%) | 177 (35.3%) |
| Total | 241 (100.0%) | 502 (100.0%) |
Health & Disability in El Cerro
Health Insurance Coverage by Age in El Cerro
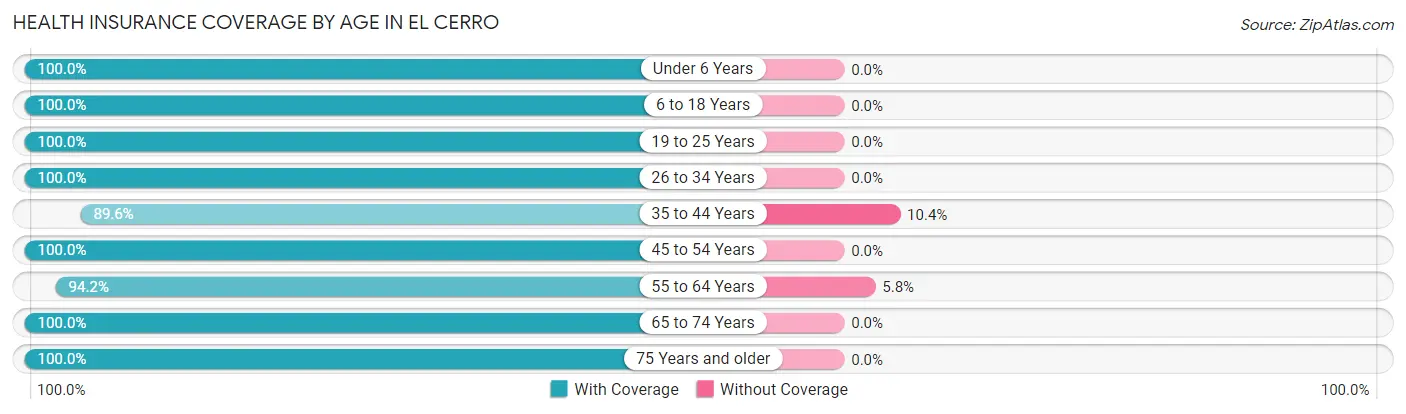
| Age Bracket | With Coverage | Without Coverage |
| Under 6 Years | 500 (100.0%) | 0 (0.0%) |
| 6 to 18 Years | 268 (100.0%) | 0 (0.0%) |
| 19 to 25 Years | 448 (100.0%) | 0 (0.0%) |
| 26 to 34 Years | 277 (100.0%) | 0 (0.0%) |
| 35 to 44 Years | 172 (89.6%) | 20 (10.4%) |
| 45 to 54 Years | 211 (100.0%) | 0 (0.0%) |
| 55 to 64 Years | 472 (94.2%) | 29 (5.8%) |
| 65 to 74 Years | 332 (100.0%) | 0 (0.0%) |
| 75 Years and older | 515 (100.0%) | 0 (0.0%) |
| Total | 3,195 (98.5%) | 49 (1.5%) |
Health Insurance Coverage by Citizenship Status in El Cerro
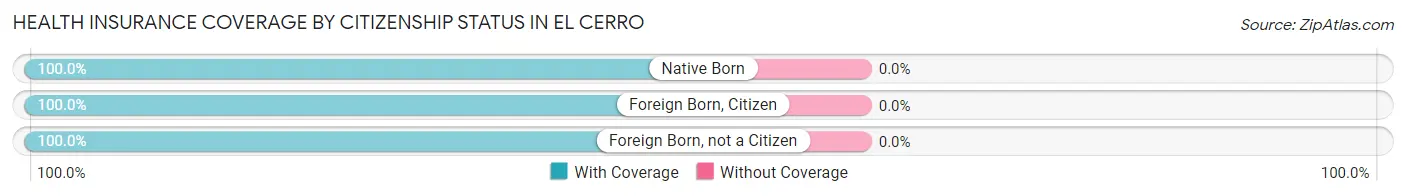
| Citizenship Status | With Coverage | Without Coverage |
| Native Born | 500 (100.0%) | 0 (0.0%) |
| Foreign Born, Citizen | 268 (100.0%) | 0 (0.0%) |
| Foreign Born, not a Citizen | 448 (100.0%) | 0 (0.0%) |
Health Insurance Coverage by Household Income in El Cerro
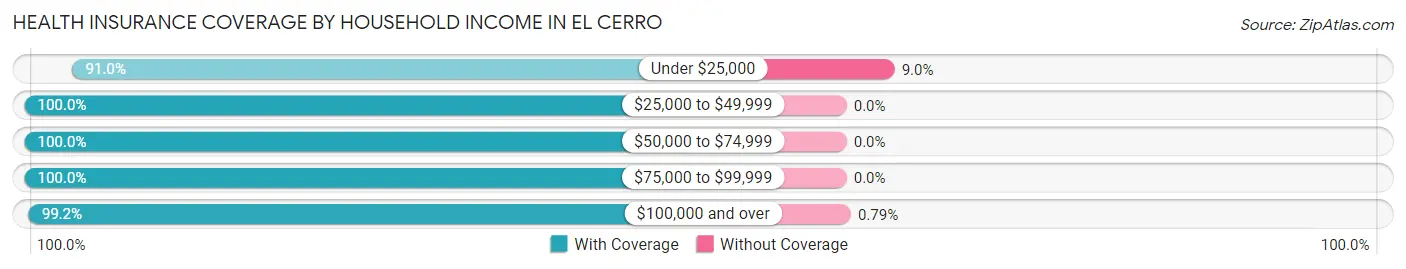
| Household Income | With Coverage | Without Coverage |
| Under $25,000 | 294 (91.0%) | 29 (9.0%) |
| $25,000 to $49,999 | 189 (100.0%) | 0 (0.0%) |
| $50,000 to $74,999 | 117 (100.0%) | 0 (0.0%) |
| $75,000 to $99,999 | 97 (100.0%) | 0 (0.0%) |
| $100,000 and over | 2,498 (99.2%) | 20 (0.8%) |
Public vs Private Health Insurance Coverage by Age in El Cerro
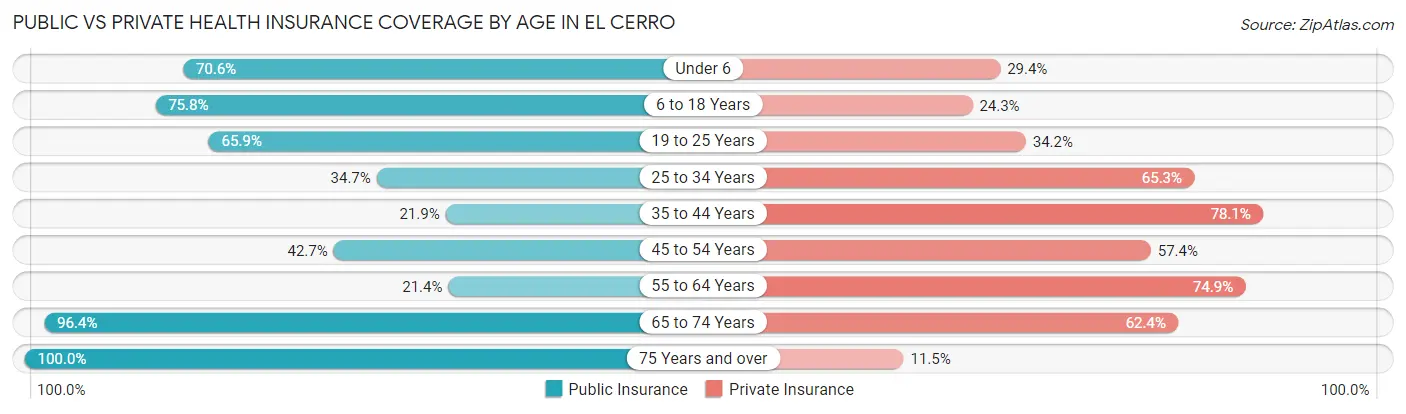
| Age Bracket | Public Insurance | Private Insurance |
| Under 6 | 353 (70.6%) | 147 (29.4%) |
| 6 to 18 Years | 203 (75.7%) | 65 (24.2%) |
| 19 to 25 Years | 295 (65.8%) | 153 (34.2%) |
| 25 to 34 Years | 96 (34.7%) | 181 (65.3%) |
| 35 to 44 Years | 42 (21.9%) | 150 (78.1%) |
| 45 to 54 Years | 90 (42.6%) | 121 (57.4%) |
| 55 to 64 Years | 107 (21.4%) | 375 (74.9%) |
| 65 to 74 Years | 320 (96.4%) | 207 (62.4%) |
| 75 Years and over | 515 (100.0%) | 59 (11.5%) |
| Total | 2,021 (62.3%) | 1,458 (44.9%) |
Disability Status by Sex by Age in El Cerro
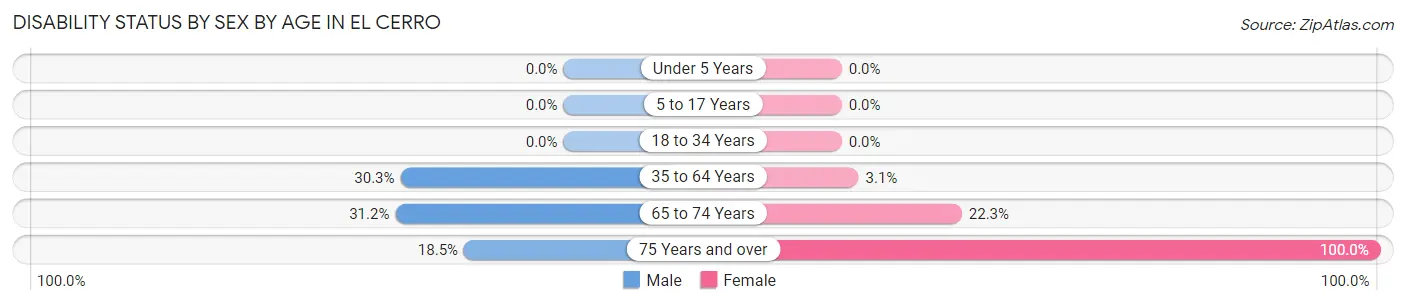
| Age Bracket | Male | Female |
| Under 5 Years | 0 (0.0%) | 0 (0.0%) |
| 5 to 17 Years | 0 (0.0%) | 0 (0.0%) |
| 18 to 34 Years | 0 (0.0%) | 0 (0.0%) |
| 35 to 64 Years | 167 (30.2%) | 11 (3.1%) |
| 65 to 74 Years | 49 (31.2%) | 39 (22.3%) |
| 75 Years and over | 24 (18.5%) | 385 (100.0%) |
Disability Class by Sex by Age in El Cerro
Disability Class: Hearing Difficulty
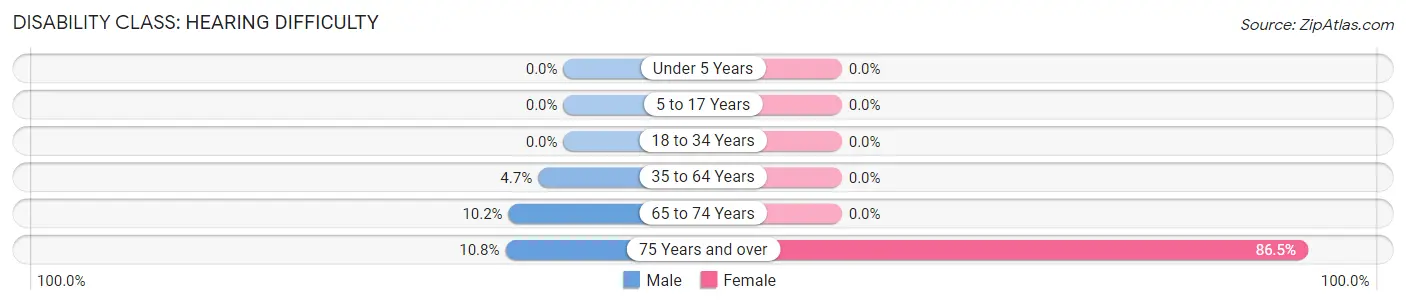
| Age Bracket | Male | Female |
| Under 5 Years | 0 (0.0%) | 0 (0.0%) |
| 5 to 17 Years | 0 (0.0%) | 0 (0.0%) |
| 18 to 34 Years | 0 (0.0%) | 0 (0.0%) |
| 35 to 64 Years | 26 (4.7%) | 0 (0.0%) |
| 65 to 74 Years | 16 (10.2%) | 0 (0.0%) |
| 75 Years and over | 14 (10.8%) | 333 (86.5%) |
Disability Class: Vision Difficulty
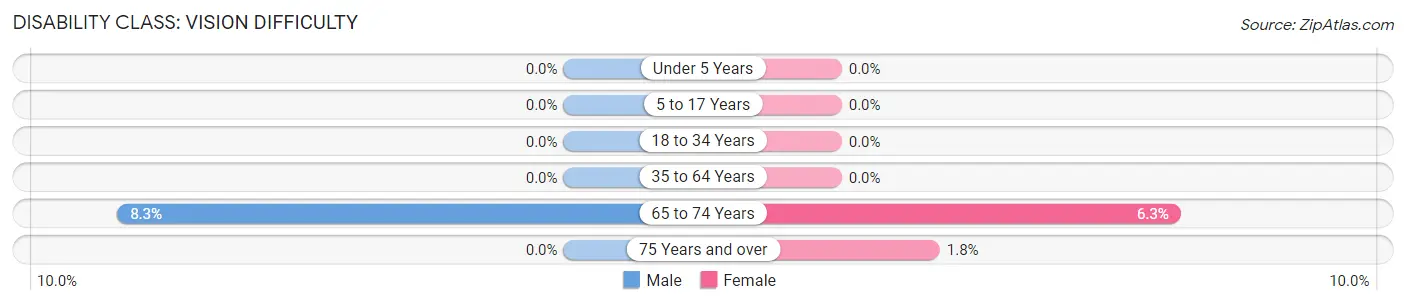
| Age Bracket | Male | Female |
| Under 5 Years | 0 (0.0%) | 0 (0.0%) |
| 5 to 17 Years | 0 (0.0%) | 0 (0.0%) |
| 18 to 34 Years | 0 (0.0%) | 0 (0.0%) |
| 35 to 64 Years | 0 (0.0%) | 0 (0.0%) |
| 65 to 74 Years | 13 (8.3%) | 11 (6.3%) |
| 75 Years and over | 0 (0.0%) | 7 (1.8%) |
Disability Class: Cognitive Difficulty
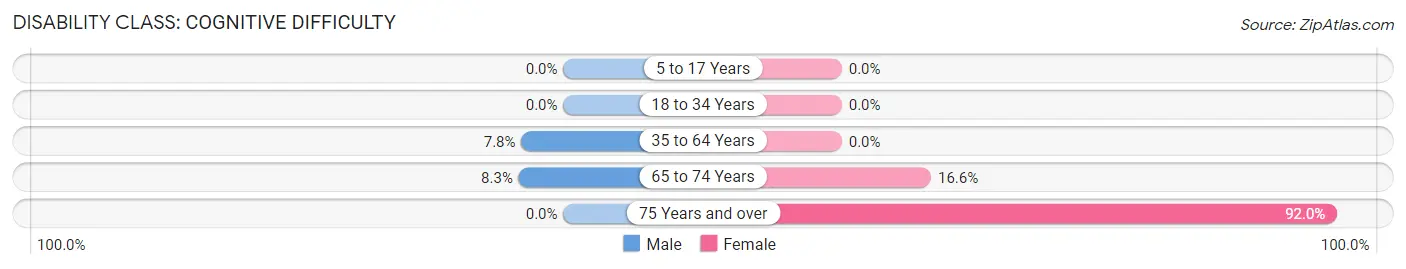
| Age Bracket | Male | Female |
| 5 to 17 Years | 0 (0.0%) | 0 (0.0%) |
| 18 to 34 Years | 0 (0.0%) | 0 (0.0%) |
| 35 to 64 Years | 43 (7.8%) | 0 (0.0%) |
| 65 to 74 Years | 13 (8.3%) | 29 (16.6%) |
| 75 Years and over | 0 (0.0%) | 354 (91.9%) |
Disability Class: Ambulatory Difficulty
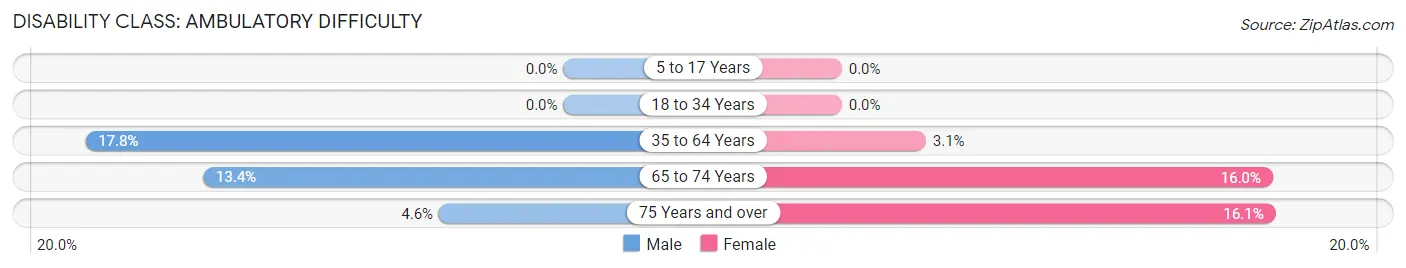
| Age Bracket | Male | Female |
| 5 to 17 Years | 0 (0.0%) | 0 (0.0%) |
| 18 to 34 Years | 0 (0.0%) | 0 (0.0%) |
| 35 to 64 Years | 98 (17.7%) | 11 (3.1%) |
| 65 to 74 Years | 21 (13.4%) | 28 (16.0%) |
| 75 Years and over | 6 (4.6%) | 62 (16.1%) |
Disability Class: Self-Care Difficulty
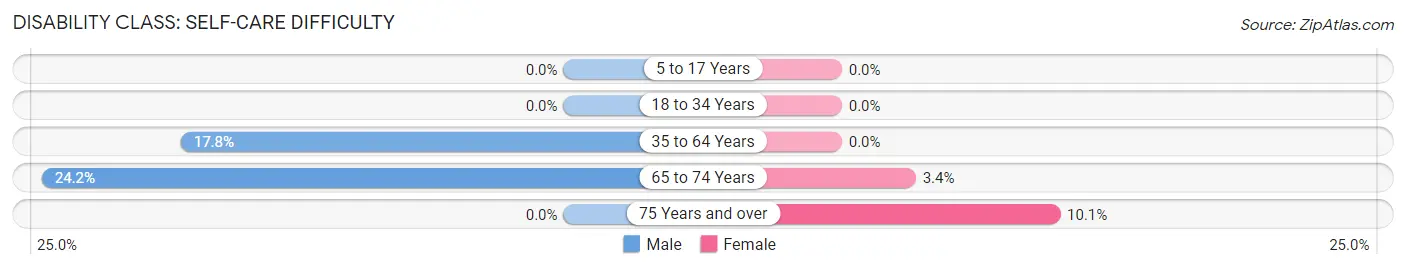
| Age Bracket | Male | Female |
| 5 to 17 Years | 0 (0.0%) | 0 (0.0%) |
| 18 to 34 Years | 0 (0.0%) | 0 (0.0%) |
| 35 to 64 Years | 98 (17.7%) | 0 (0.0%) |
| 65 to 74 Years | 38 (24.2%) | 6 (3.4%) |
| 75 Years and over | 0 (0.0%) | 39 (10.1%) |
Technology Access in El Cerro
Computing Device Access in El Cerro
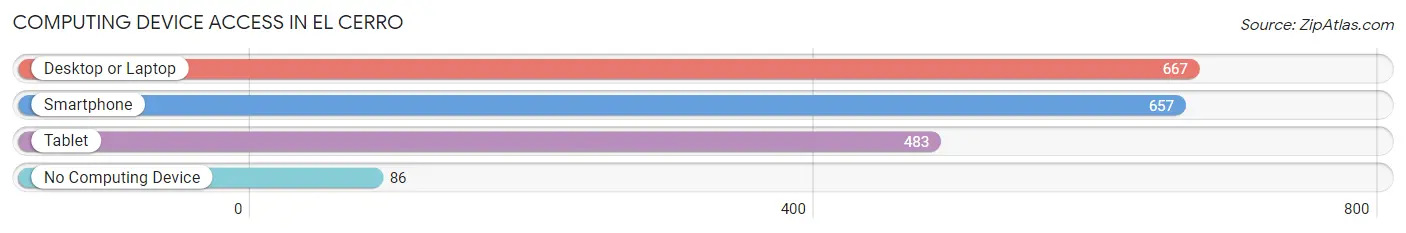
| Device Type | # Households | % Households |
| Desktop or Laptop | 667 | 74.6% |
| Smartphone | 657 | 73.5% |
| Tablet | 483 | 54.0% |
| No Computing Device | 86 | 9.6% |
| Total | 894 | 100.0% |
Internet Access in El Cerro
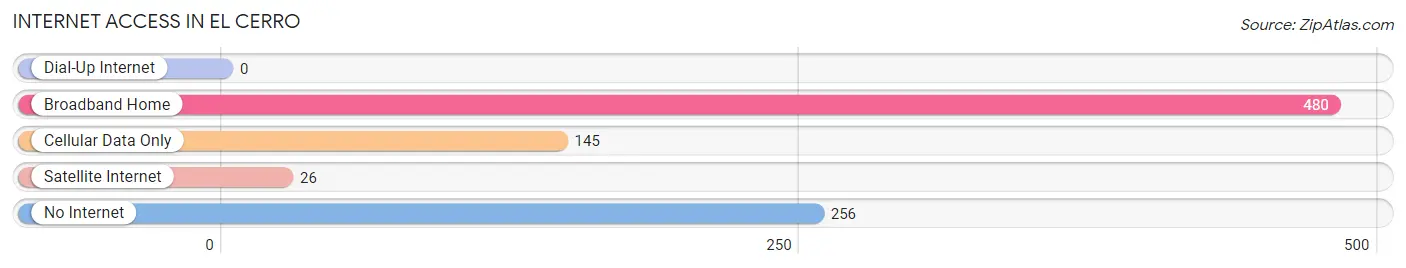
| Internet Type | # Households | % Households |
| Dial-Up Internet | 0 | 0.0% |
| Broadband Home | 480 | 53.7% |
| Cellular Data Only | 145 | 16.2% |
| Satellite Internet | 26 | 2.9% |
| No Internet | 256 | 28.6% |
| Total | 894 | 100.0% |
El Cerro Summary
Cerro, New Mexico is a small unincorporated community located in the northern part of the state, in Taos County. It is situated at the base of the Sangre de Cristo Mountains, and is surrounded by the Carson National Forest. The town is home to a population of approximately 1,000 people, and is known for its rich cultural heritage and stunning natural beauty.
History
The area that is now Cerro, New Mexico has been inhabited for thousands of years. The first known inhabitants were the Taos Indians, who lived in the area for centuries before the arrival of the Spanish in the 16th century. The Spanish established a mission in the area in 1617, and the town of Cerro was founded in 1750. The town was originally called San Antonio de Padua, but was later renamed Cerro, which means “hill” in Spanish.
The town was a center of trade and commerce for the region, and was home to a number of businesses, including a blacksmith, a general store, and a saloon. The town was also home to a number of ranches, and was a popular destination for travelers and traders.
In the late 19th century, the town began to decline as the railroad bypassed it and the population began to move away. The town was nearly abandoned by the early 20th century, but was revived in the 1950s when the nearby ski resort of Taos Ski Valley was established.
Geography
Cerro, New Mexico is located in the northern part of the state, in Taos County. It is situated at the base of the Sangre de Cristo Mountains, and is surrounded by the Carson National Forest. The town is located at an elevation of 7,000 feet, and has a total area of 0.6 square miles.
The climate in Cerro is semi-arid, with hot summers and cold winters. The average annual temperature is around 50 degrees Fahrenheit, and the average annual precipitation is around 12 inches.
Economy
The economy of Cerro, New Mexico is largely based on tourism. The town is home to a number of ski resorts, including Taos Ski Valley, which is one of the most popular ski resorts in the state. The town is also home to a number of restaurants, shops, and other businesses that cater to tourists.
In addition to tourism, the town is also home to a number of small businesses, including a general store, a gas station, and a post office. The town is also home to a number of ranches, and is a popular destination for hunters and fishermen.
Demographics
As of the 2010 census, the population of Cerro, New Mexico was 1,000. The racial makeup of the town was 94.2% White, 0.7% African American, 0.7% Native American, 0.7% Asian, 0.7% from other races, and 2.7% from two or more races. Hispanic or Latino of any race were 4.7% of the population.
The median household income in Cerro was $31,250, and the median family income was $37,500. The per capita income was $17,500. About 11.7% of families and 14.7% of the population were below the poverty line, including 18.3% of those under age 18 and none of those age 65 or over.
Common Questions
What is Per Capita Income in El Cerro?
Per Capita income in El Cerro is $36,482.
What is the Median Family Income in El Cerro?
Median Family Income in El Cerro is $108,235.
What is the Median Household income in El Cerro?
Median Household Income in El Cerro is $108,200.
What is Income or Wage Gap in El Cerro?
Income or Wage Gap in El Cerro is 60.3%.
Women in El Cerro earn 39.7 cents for every dollar earned by a man.
What is Inequality or Gini Index in El Cerro?
Inequality or Gini Index in El Cerro is 0.44.
What is the Total Population of El Cerro?
Total Population of El Cerro is 3,244.
What is the Total Male Population of El Cerro?
Total Male Population of El Cerro is 1,498.
What is the Total Female Population of El Cerro?
Total Female Population of El Cerro is 1,746.
What is the Ratio of Males per 100 Females in El Cerro?
There are 85.80 Males per 100 Females in El Cerro.
What is the Ratio of Females per 100 Males in El Cerro?
There are 116.56 Females per 100 Males in El Cerro.
What is the Median Population Age in El Cerro?
Median Population Age in El Cerro is 40.9 Years.
What is the Average Family Size in El Cerro
Average Family Size in El Cerro is 4.1 People.
What is the Average Household Size in El Cerro
Average Household Size in El Cerro is 3.6 People.
How Large is the Labor Force in El Cerro?
There are 1,346 People in the Labor Forcein in El Cerro.
What is the Percentage of People in the Labor Force in El Cerro?
52.6% of People are in the Labor Force in El Cerro.
What is the Unemployment Rate in El Cerro?
Unemployment Rate in El Cerro is 3.0%.