Holloman AFB, NM Map & Demographics
Holloman AFB Map
Holloman AFB Overview
$23,704
PER CAPITA INCOME
$52,750
AVG FAMILY INCOME
$48,263
AVG HOUSEHOLD INCOME
15.3%
WAGE / INCOME GAP [ % ]
84.7¢/ $1
WAGE / INCOME GAP [ $ ]
0.36
INEQUALITY / GINI INDEX
4,182
TOTAL POPULATION
2,668
MALE POPULATION
1,514
FEMALE POPULATION
176.22
MALES / 100 FEMALES
56.75
FEMALES / 100 MALES
22.0
MEDIAN AGE
3.5
AVG FAMILY SIZE
2.8
AVG HOUSEHOLD SIZE
2,522
LABOR FORCE [ PEOPLE ]
84.7%
PERCENT IN LABOR FORCE
6.0%
UNEMPLOYMENT RATE
Holloman AFB Area Codes
Income in Holloman AFB
Income Overview in Holloman AFB
Per Capita Income in Holloman AFB is $23,704, while median incomes of families and households are $52,750 and $48,263 respectively.
| Characteristic | Number | Measure |
| Per Capita Income | 4,182 | $23,704 |
| Median Family Income | 787 | $52,750 |
| Mean Family Income | 787 | $69,354 |
| Median Household Income | 1,129 | $48,263 |
| Mean Household Income | 1,129 | $61,360 |
| Income Deficit | 787 | $0 |
| Wage / Income Gap (%) | 4,182 | 15.34% |
| Wage / Income Gap ($) | 4,182 | 84.66¢ per $1 |
| Gini / Inequality Index | 4,182 | 0.36 |
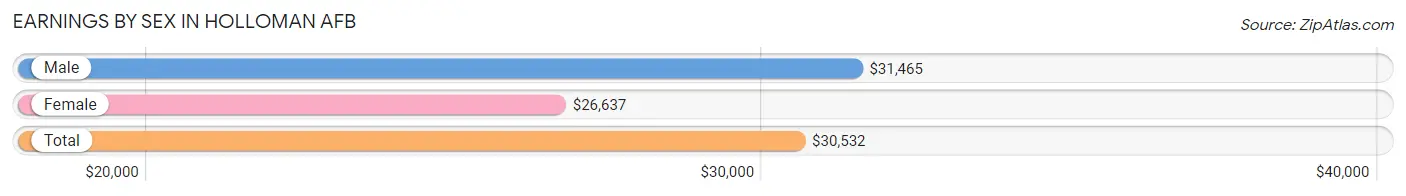
Earnings by Sex in Holloman AFB
Average Earnings in Holloman AFB are $30,532, $31,465 for men and $26,637 for women, a difference of 15.3%.
| Sex | Number | Average Earnings |
| Male | 1,977 (74.9%) | $31,465 |
| Female | 663 (25.1%) | $26,637 |
| Total | 2,640 (100.0%) | $30,532 |
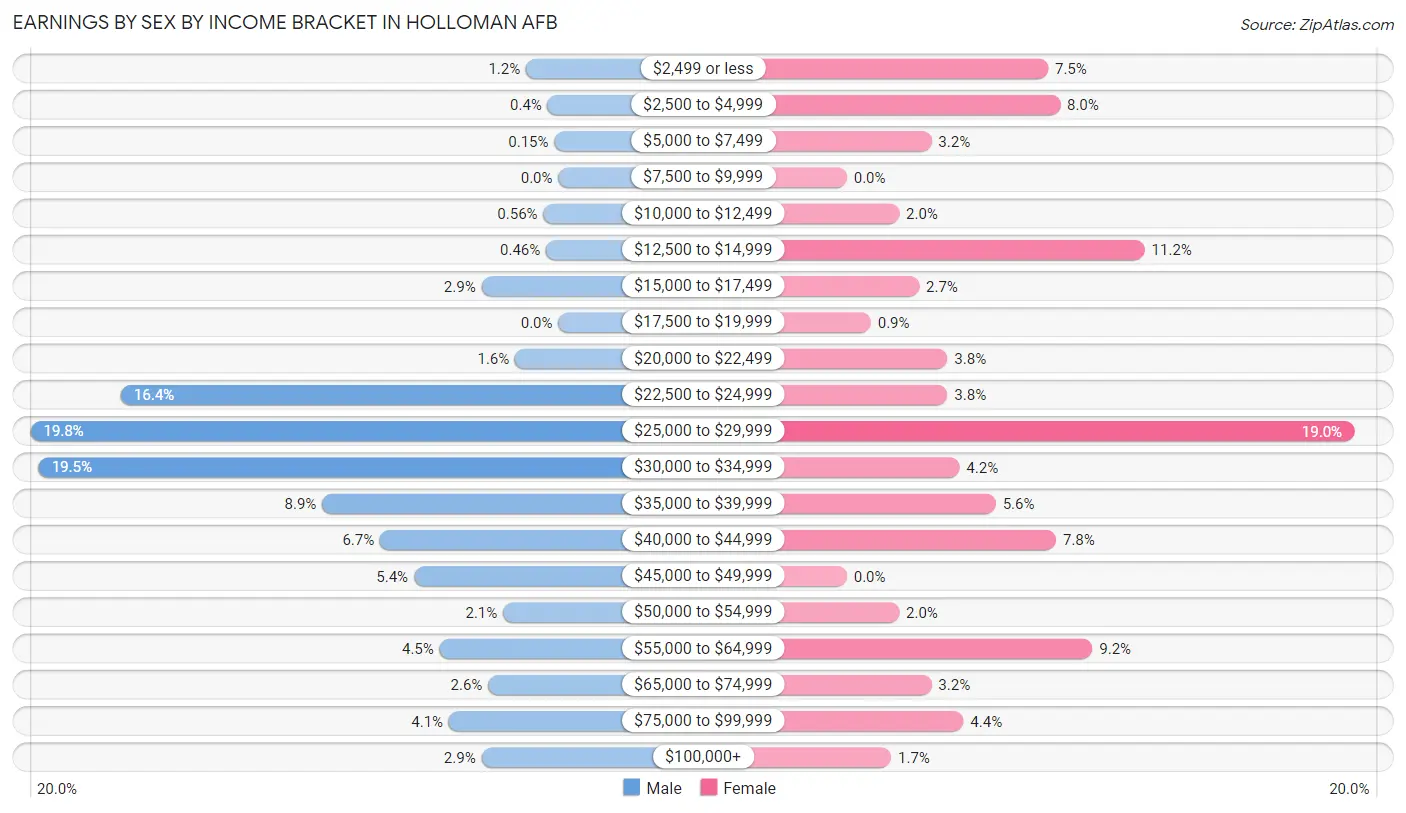
Earnings by Sex by Income Bracket in Holloman AFB
The most common earnings brackets in Holloman AFB are $25,000 to $29,999 for men (391 | 19.8%) and $25,000 to $29,999 for women (126 | 19.0%).
| Income | Male | Female |
| $2,499 or less | 24 (1.2%) | 50 (7.5%) |
| $2,500 to $4,999 | 8 (0.4%) | 53 (8.0%) |
| $5,000 to $7,499 | 3 (0.2%) | 21 (3.2%) |
| $7,500 to $9,999 | 0 (0.0%) | 0 (0.0%) |
| $10,000 to $12,499 | 11 (0.6%) | 13 (2.0%) |
| $12,500 to $14,999 | 9 (0.5%) | 74 (11.2%) |
| $15,000 to $17,499 | 57 (2.9%) | 18 (2.7%) |
| $17,500 to $19,999 | 0 (0.0%) | 6 (0.9%) |
| $20,000 to $22,499 | 32 (1.6%) | 25 (3.8%) |
| $22,500 to $24,999 | 324 (16.4%) | 25 (3.8%) |
| $25,000 to $29,999 | 391 (19.8%) | 126 (19.0%) |
| $30,000 to $34,999 | 385 (19.5%) | 28 (4.2%) |
| $35,000 to $39,999 | 175 (8.8%) | 37 (5.6%) |
| $40,000 to $44,999 | 132 (6.7%) | 52 (7.8%) |
| $45,000 to $49,999 | 107 (5.4%) | 0 (0.0%) |
| $50,000 to $54,999 | 41 (2.1%) | 13 (2.0%) |
| $55,000 to $64,999 | 88 (4.4%) | 61 (9.2%) |
| $65,000 to $74,999 | 52 (2.6%) | 21 (3.2%) |
| $75,000 to $99,999 | 81 (4.1%) | 29 (4.4%) |
| $100,000+ | 57 (2.9%) | 11 (1.7%) |
| Total | 1,977 (100.0%) | 663 (100.0%) |
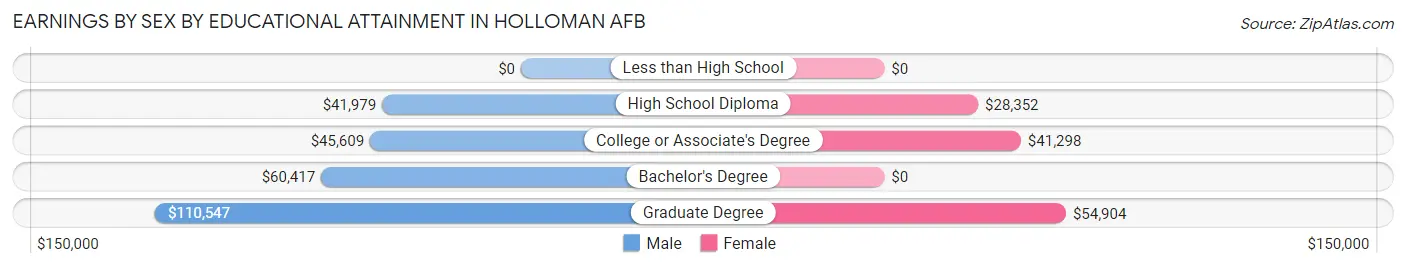
Earnings by Sex by Educational Attainment in Holloman AFB
Average earnings in Holloman AFB are $45,344 for men and $40,962 for women, a difference of 9.7%. Men with an educational attainment of graduate degree enjoy the highest average annual earnings of $110,547, while those with high school diploma education earn the least with $41,979. Women with an educational attainment of graduate degree earn the most with the average annual earnings of $54,904, while those with high school diploma education have the smallest earnings of $28,352.
| Educational Attainment | Male Income | Female Income |
| Less than High School | - | - |
| High School Diploma | $41,979 | $28,352 |
| College or Associate's Degree | $45,609 | $41,298 |
| Bachelor's Degree | $60,417 | $0 |
| Graduate Degree | $110,547 | $54,904 |
| Total | $45,344 | $40,962 |
Family Income in Holloman AFB
Family Income Brackets in Holloman AFB
According to the Holloman AFB family income data, there are 200 families falling into the $35,000 to $49,999 income range, which is the most common income bracket and makes up 25.4% of all families.
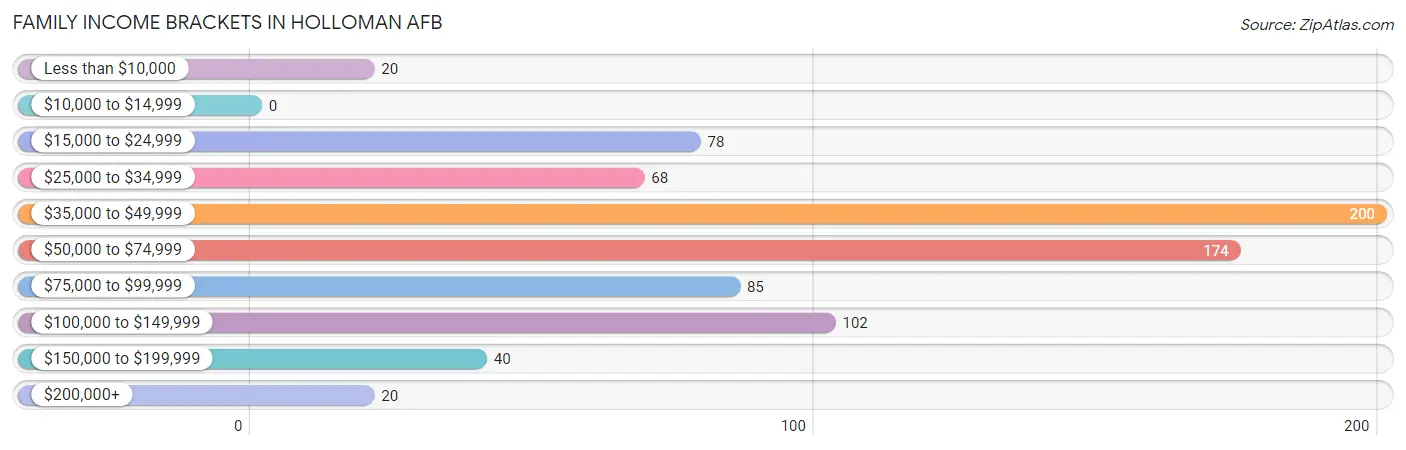
| Income Bracket | # Families | % Families |
| Less than $10,000 | 20 | 2.5% |
| $10,000 to $14,999 | 0 | 0.0% |
| $15,000 to $24,999 | 78 | 9.9% |
| $25,000 to $34,999 | 68 | 8.6% |
| $35,000 to $49,999 | 200 | 25.4% |
| $50,000 to $74,999 | 174 | 22.1% |
| $75,000 to $99,999 | 85 | 10.8% |
| $100,000 to $149,999 | 102 | 13.0% |
| $150,000 to $199,999 | 40 | 5.1% |
| $200,000+ | 20 | 2.5% |
Family Income by Famaliy Size in Holloman AFB
6-person families (26 | 3.3%) account for the highest median family income in Holloman AFB with $82,917 per family, while 3-person families (258 | 32.8%) have the highest median income of $19,306 per family member.
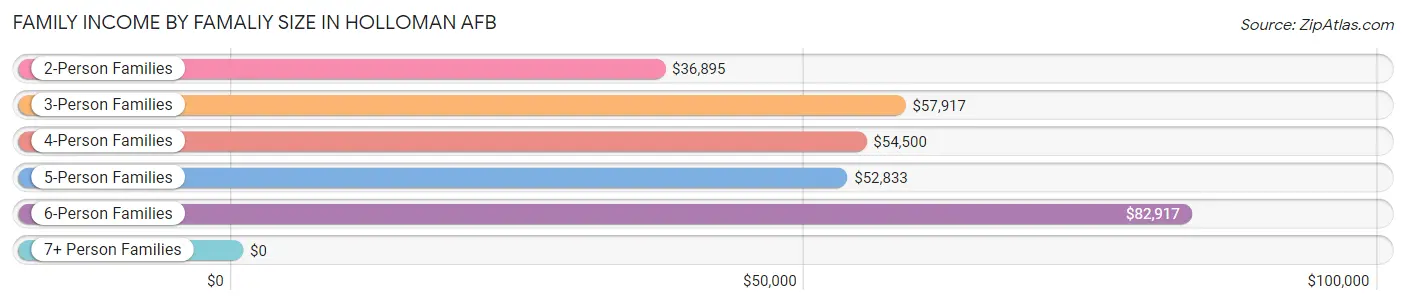
| Income Bracket | # Families | Median Income |
| 2-Person Families | 205 (26.1%) | $36,895 |
| 3-Person Families | 258 (32.8%) | $57,917 |
| 4-Person Families | 240 (30.5%) | $54,500 |
| 5-Person Families | 58 (7.4%) | $52,833 |
| 6-Person Families | 26 (3.3%) | $82,917 |
| 7+ Person Families | 0 (0.0%) | $0 |
| Total | 787 (100.0%) | $52,750 |
Family Income by Number of Earners in Holloman AFB
The median family income in Holloman AFB is $52,750, with families comprising 3+ earners (10) having the highest median family income of $142,500, while families with no earners (20) have the lowest median family income of $2,499, accounting for 1.3% and 2.5% of families, respectively.
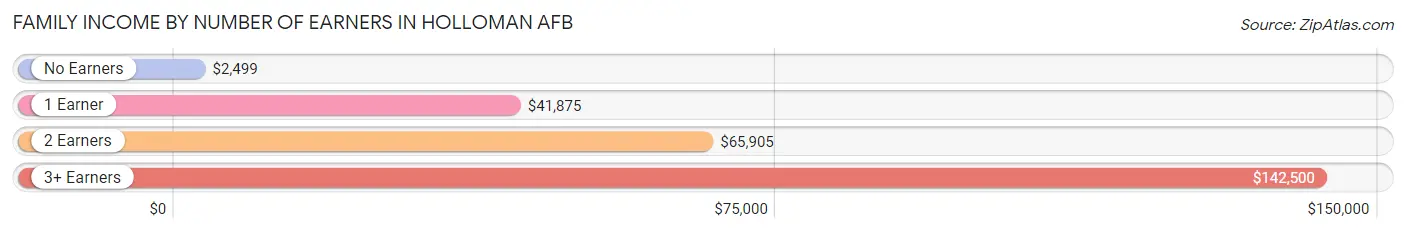
| Number of Earners | # Families | Median Income |
| No Earners | 20 (2.5%) | $2,499 |
| 1 Earner | 316 (40.2%) | $41,875 |
| 2 Earners | 441 (56.0%) | $65,905 |
| 3+ Earners | 10 (1.3%) | $142,500 |
| Total | 787 (100.0%) | $52,750 |
Household Income in Holloman AFB
Household Income Brackets in Holloman AFB
With 323 households falling in the category, the $35,000 to $49,999 income range is the most frequent in Holloman AFB, accounting for 28.6% of all households.
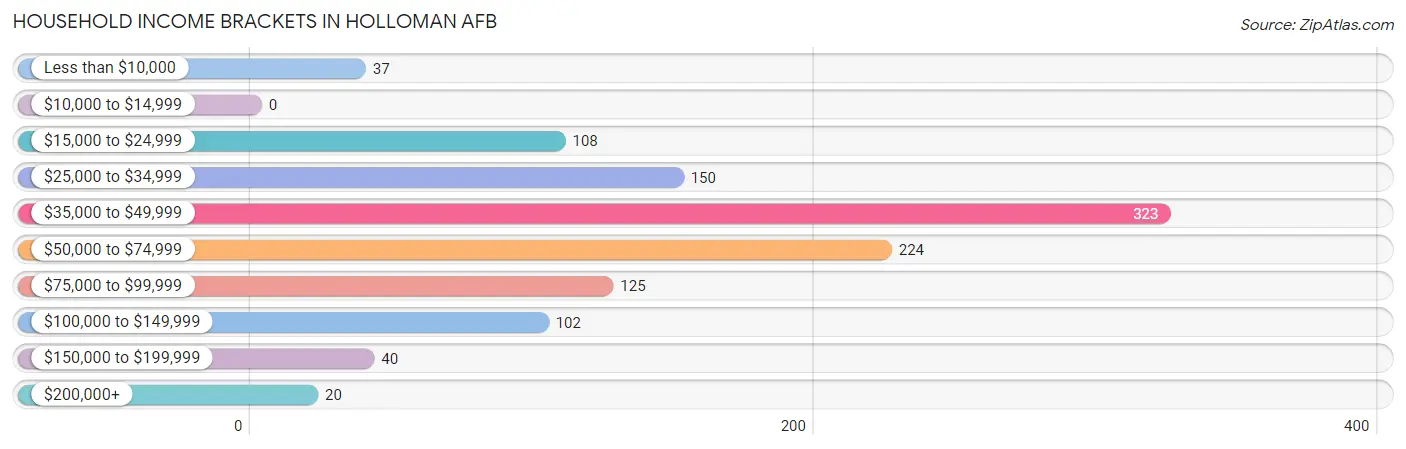
| Income Bracket | # Households | % Households |
| Less than $10,000 | 37 | 3.3% |
| $10,000 to $14,999 | 0 | 0.0% |
| $15,000 to $24,999 | 108 | 9.6% |
| $25,000 to $34,999 | 150 | 13.3% |
| $35,000 to $49,999 | 323 | 28.6% |
| $50,000 to $74,999 | 224 | 19.8% |
| $75,000 to $99,999 | 125 | 11.1% |
| $100,000 to $149,999 | 102 | 9.0% |
| $150,000 to $199,999 | 40 | 3.5% |
| $200,000+ | 20 | 1.8% |
Household Income by Householder Age in Holloman AFB
The median household income in Holloman AFB is $48,263, with the highest median household income of $55,231 found in the 25 to 44 years age bracket for the primary householder. A total of 831 households (73.6%) fall into this category. Meanwhile, the 45 to 64 years age bracket for the primary householder has the lowest median household income of $0, with 19 households (1.7%) in this group.
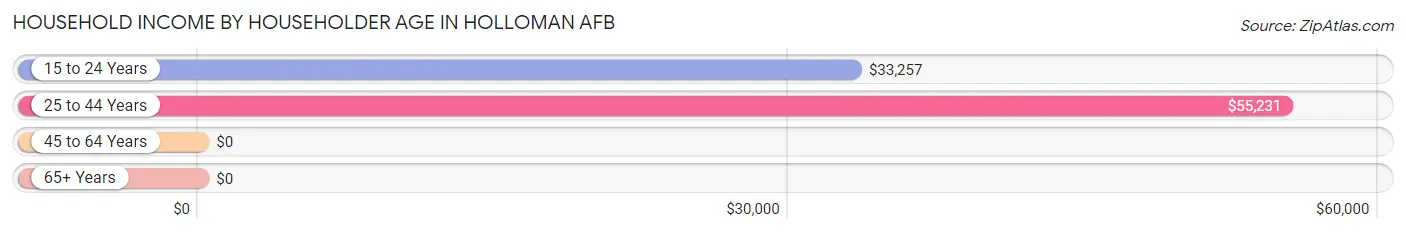
| Income Bracket | # Households | Median Income |
| 15 to 24 Years | 279 (24.7%) | $33,257 |
| 25 to 44 Years | 831 (73.6%) | $55,231 |
| 45 to 64 Years | 19 (1.7%) | $0 |
| 65+ Years | 0 (0.0%) | $0 |
| Total | 1,129 (100.0%) | $48,263 |
Poverty in Holloman AFB
Income Below Poverty by Sex and Age in Holloman AFB
With 6.0% poverty level for males and 15.3% for females among the residents of Holloman AFB, 6 to 11 year old males and 16 and 17 year old females are the most vulnerable to poverty, with 39 males (22.7%) and 7 females (100.0%) in their respective age groups living below the poverty level.
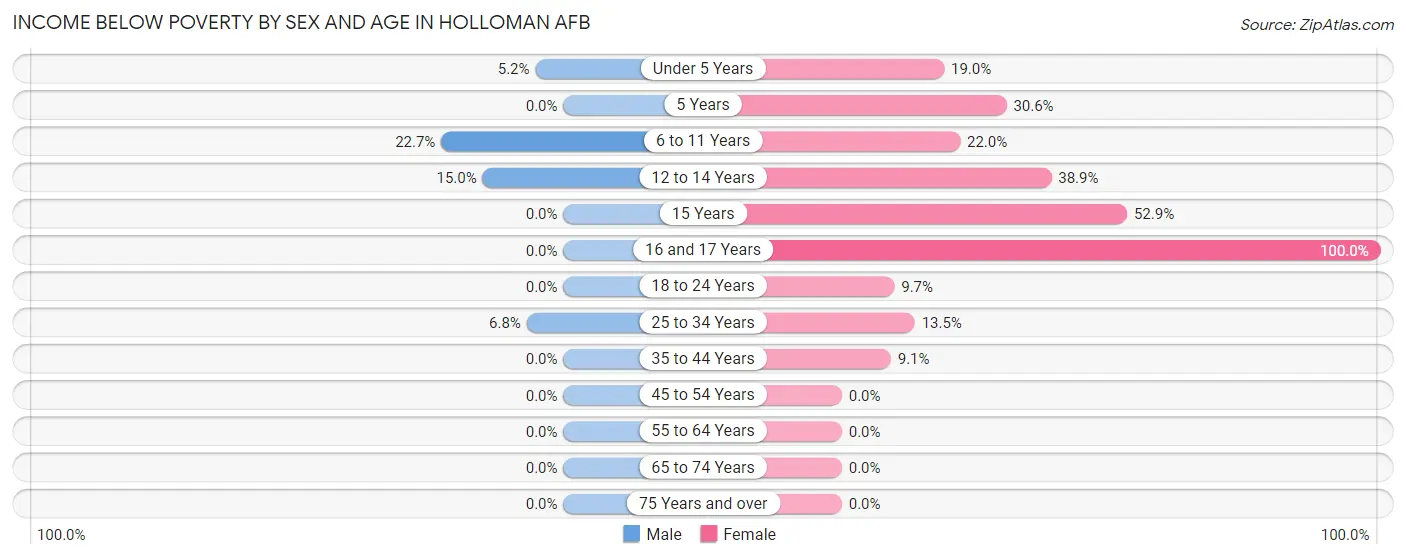
| Age Bracket | Male | Female |
| Under 5 Years | 18 (5.2%) | 56 (19.0%) |
| 5 Years | 0 (0.0%) | 11 (30.6%) |
| 6 to 11 Years | 39 (22.7%) | 36 (22.0%) |
| 12 to 14 Years | 6 (15.0%) | 7 (38.9%) |
| 15 Years | 0 (0.0%) | 9 (52.9%) |
| 16 and 17 Years | 0 (0.0%) | 7 (100.0%) |
| 18 to 24 Years | 0 (0.0%) | 26 (9.7%) |
| 25 to 34 Years | 38 (6.8%) | 56 (13.5%) |
| 35 to 44 Years | 0 (0.0%) | 13 (9.1%) |
| 45 to 54 Years | 0 (0.0%) | 0 (0.0%) |
| 55 to 64 Years | 0 (0.0%) | 0 (0.0%) |
| 65 to 74 Years | 0 (0.0%) | 0 (0.0%) |
| 75 Years and over | 0 (0.0%) | 0 (0.0%) |
| Total | 101 (6.0%) | 221 (15.3%) |
Income Above Poverty by Sex and Age in Holloman AFB
According to the poverty statistics in Holloman AFB, males aged 5 years and females aged 45 to 54 years are the age groups that are most secure financially, with 100.0% of males and 100.0% of females in these age groups living above the poverty line.
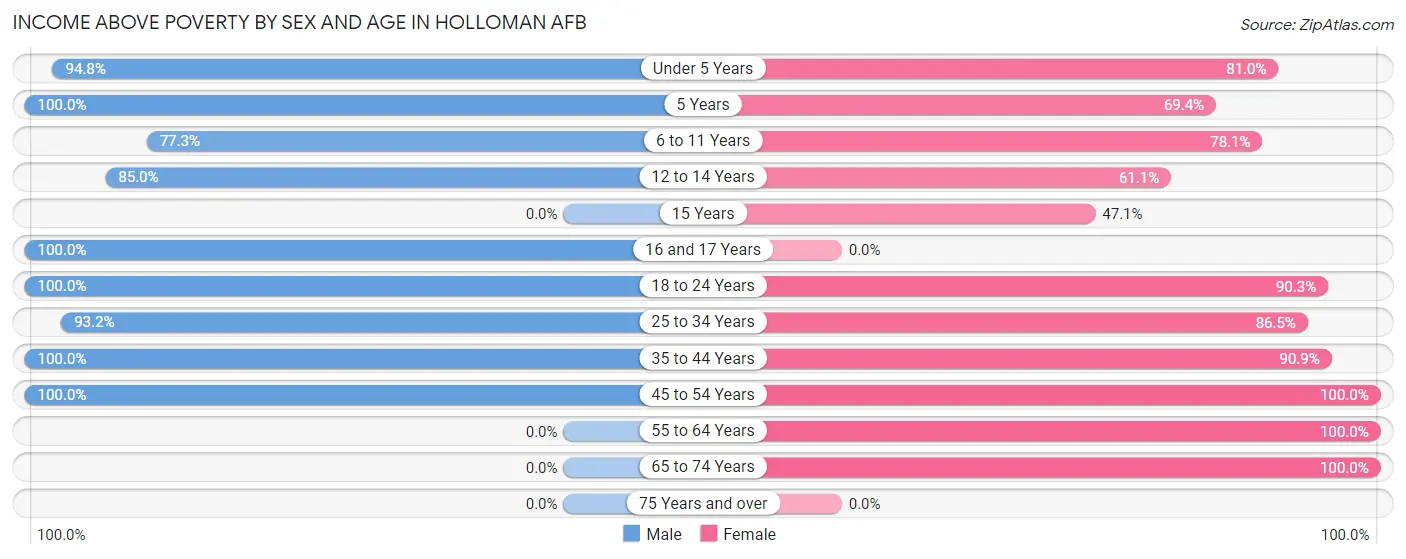
| Age Bracket | Male | Female |
| Under 5 Years | 329 (94.8%) | 239 (81.0%) |
| 5 Years | 96 (100.0%) | 25 (69.4%) |
| 6 to 11 Years | 133 (77.3%) | 128 (78.0%) |
| 12 to 14 Years | 34 (85.0%) | 11 (61.1%) |
| 15 Years | 0 (0.0%) | 8 (47.1%) |
| 16 and 17 Years | 26 (100.0%) | 0 (0.0%) |
| 18 to 24 Years | 261 (100.0%) | 241 (90.3%) |
| 25 to 34 Years | 520 (93.2%) | 358 (86.5%) |
| 35 to 44 Years | 184 (100.0%) | 130 (90.9%) |
| 45 to 54 Years | 10 (100.0%) | 40 (100.0%) |
| 55 to 64 Years | 0 (0.0%) | 24 (100.0%) |
| 65 to 74 Years | 0 (0.0%) | 15 (100.0%) |
| 75 Years and over | 0 (0.0%) | 0 (0.0%) |
| Total | 1,593 (94.0%) | 1,219 (84.7%) |
Income Below Poverty Among Married-Couple Families in Holloman AFB
The poverty statistics for married-couple families in Holloman AFB show that 4.1% or 29 of the total 708 families live below the poverty line. Families with 3 or 4 children have the highest poverty rate of 12.5%, comprising of 8 families. On the other hand, families with no children have the lowest poverty rate of 0.0%, which includes 0 families.
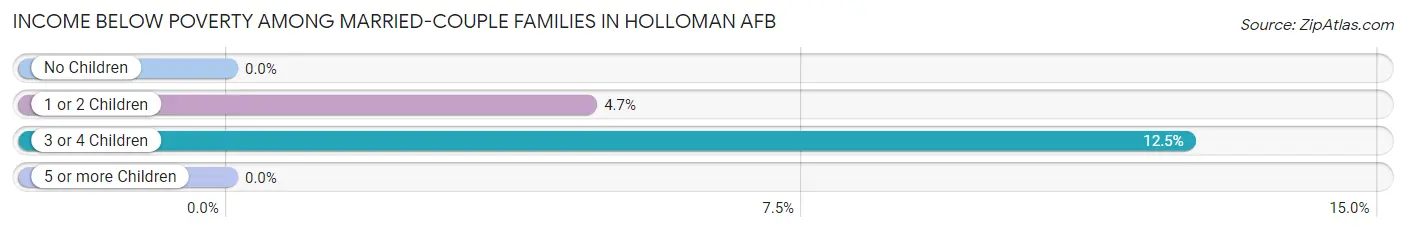
| Children | Above Poverty | Below Poverty |
| No Children | 196 (100.0%) | 0 (0.0%) |
| 1 or 2 Children | 427 (95.3%) | 21 (4.7%) |
| 3 or 4 Children | 56 (87.5%) | 8 (12.5%) |
| 5 or more Children | 0 (0.0%) | 0 (0.0%) |
| Total | 679 (95.9%) | 29 (4.1%) |
Income Below Poverty Among Single-Parent Households in Holloman AFB
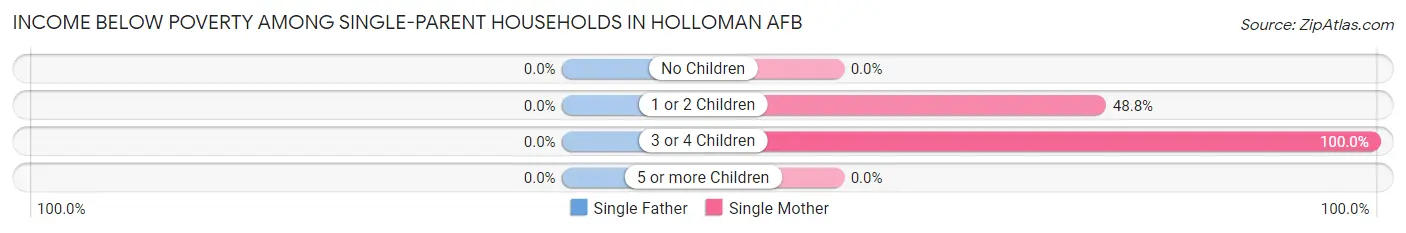
| Children | Single Father | Single Mother |
| No Children | 0 (0.0%) | 0 (0.0%) |
| 1 or 2 Children | 0 (0.0%) | 21 (48.8%) |
| 3 or 4 Children | 0 (0.0%) | 22 (100.0%) |
| 5 or more Children | 0 (0.0%) | 0 (0.0%) |
| Total | 0 (0.0%) | 43 (66.1%) |
Income Below Poverty Among Married-Couple vs Single-Parent Households in Holloman AFB
The poverty data for Holloman AFB shows that 29 of the married-couple family households (4.1%) and 43 of the single-parent households (54.4%) are living below the poverty level. Within the married-couple family households, those with 3 or 4 children have the highest poverty rate, with 8 households (12.5%) falling below the poverty line. Among the single-parent households, those with 3 or 4 children have the highest poverty rate, with 22 household (75.9%) living below poverty.
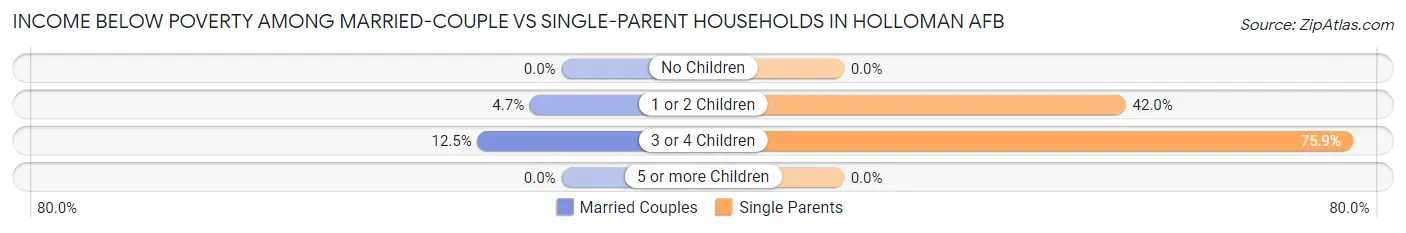
| Children | Married-Couple Families | Single-Parent Households |
| No Children | 0 (0.0%) | 0 (0.0%) |
| 1 or 2 Children | 21 (4.7%) | 21 (42.0%) |
| 3 or 4 Children | 8 (12.5%) | 22 (75.9%) |
| 5 or more Children | 0 (0.0%) | 0 (0.0%) |
| Total | 29 (4.1%) | 43 (54.4%) |
Race in Holloman AFB
The most populous races in Holloman AFB are White / Caucasian (2,885 | 69.0%), Hispanic or Latino (621 | 14.8%), and Two or more Races (555 | 13.3%).
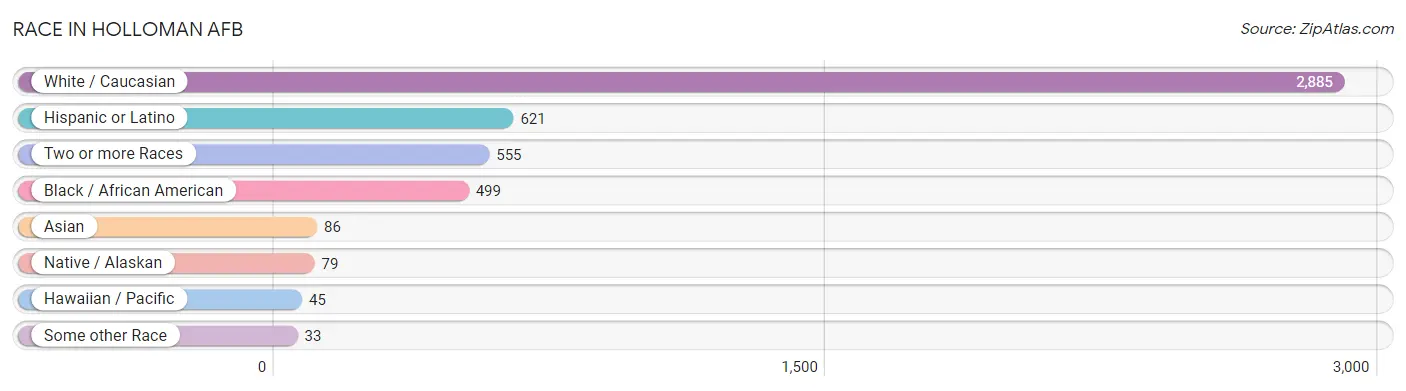
| Race | # Population | % Population |
| Asian | 86 | 2.1% |
| Black / African American | 499 | 11.9% |
| Hawaiian / Pacific | 45 | 1.1% |
| Hispanic or Latino | 621 | 14.8% |
| Native / Alaskan | 79 | 1.9% |
| White / Caucasian | 2,885 | 69.0% |
| Two or more Races | 555 | 13.3% |
| Some other Race | 33 | 0.8% |
| Total | 4,182 | 100.0% |
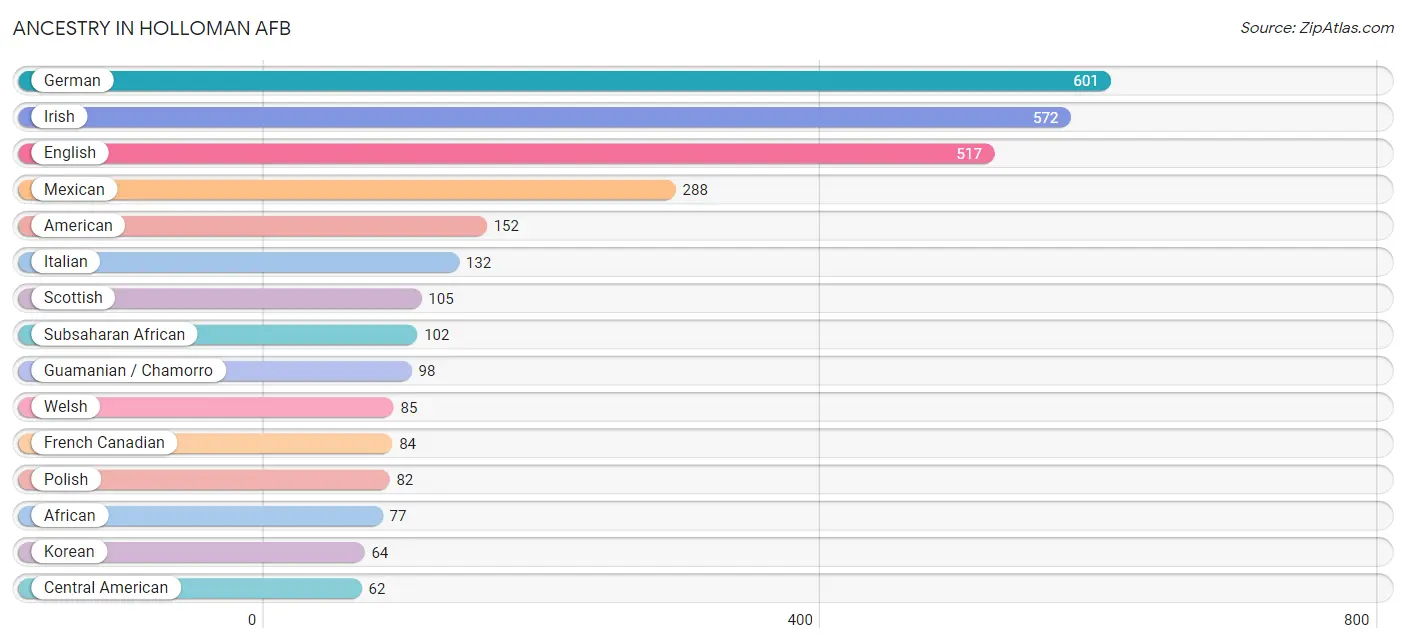
Ancestry in Holloman AFB
The most populous ancestries reported in Holloman AFB are German (601 | 14.4%), Irish (572 | 13.7%), English (517 | 12.4%), Mexican (288 | 6.9%), and American (152 | 3.6%), together accounting for 50.9% of all Holloman AFB residents.
| Ancestry | # Population | % Population |
| African | 77 | 1.8% |
| American | 152 | 3.6% |
| Arab | 16 | 0.4% |
| Austrian | 4 | 0.1% |
| Bhutanese | 53 | 1.3% |
| Brazilian | 16 | 0.4% |
| British | 26 | 0.6% |
| Burmese | 10 | 0.2% |
| Cajun | 39 | 0.9% |
| Central American | 62 | 1.5% |
| Cherokee | 10 | 0.2% |
| Colombian | 22 | 0.5% |
| Cuban | 40 | 1.0% |
| Dutch | 19 | 0.4% |
| English | 517 | 12.4% |
| European | 42 | 1.0% |
| French | 60 | 1.4% |
| French Canadian | 84 | 2.0% |
| German | 601 | 14.4% |
| Ghanaian | 25 | 0.6% |
| Guamanian / Chamorro | 98 | 2.3% |
| Irish | 572 | 13.7% |
| Italian | 132 | 3.2% |
| Japanese | 11 | 0.3% |
| Korean | 64 | 1.5% |
| Lebanese | 5 | 0.1% |
| Lithuanian | 5 | 0.1% |
| Mexican | 288 | 6.9% |
| Mexican American Indian | 10 | 0.2% |
| Navajo | 11 | 0.3% |
| Norwegian | 16 | 0.4% |
| Pakistani | 15 | 0.4% |
| Peruvian | 19 | 0.4% |
| Polish | 82 | 2.0% |
| Portuguese | 3 | 0.1% |
| Puerto Rican | 33 | 0.8% |
| Salvadoran | 62 | 1.5% |
| Samoan | 22 | 0.5% |
| Scandinavian | 16 | 0.4% |
| Scotch-Irish | 57 | 1.4% |
| Scottish | 105 | 2.5% |
| Sioux | 58 | 1.4% |
| South American | 41 | 1.0% |
| Spaniard | 21 | 0.5% |
| Spanish | 29 | 0.7% |
| Sri Lankan | 1 | 0.0% |
| Subsaharan African | 102 | 2.4% |
| Swedish | 39 | 0.9% |
| Swiss | 34 | 0.8% |
| Syrian | 11 | 0.3% |
| Welsh | 85 | 2.0% | View All 51 Rows |
Immigrants in Holloman AFB
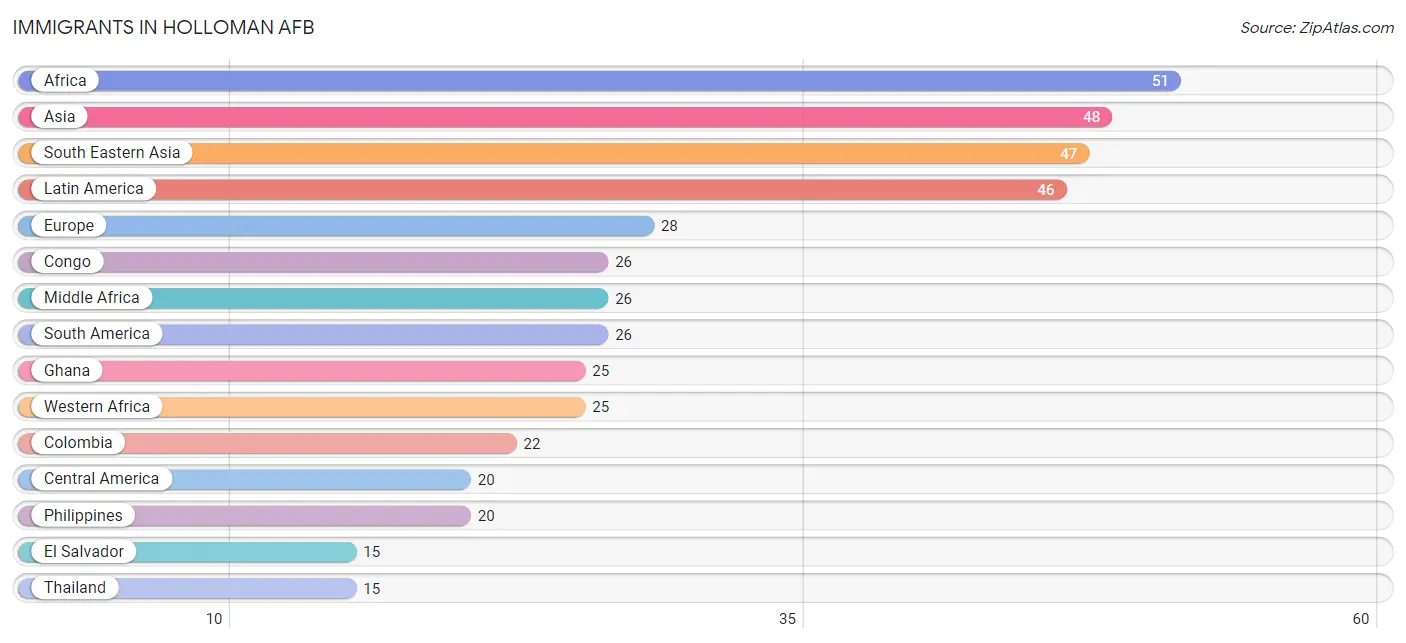
The most numerous immigrant groups reported in Holloman AFB came from Africa (51 | 1.2%), Asia (48 | 1.1%), South Eastern Asia (47 | 1.1%), Latin America (46 | 1.1%), and Europe (28 | 0.7%), together accounting for 5.3% of all Holloman AFB residents.
| Immigration Origin | # Population | % Population |
| Africa | 51 | 1.2% |
| Asia | 48 | 1.1% |
| Brazil | 4 | 0.1% |
| Central America | 20 | 0.5% |
| Colombia | 22 | 0.5% |
| Congo | 26 | 0.6% |
| Eastern Asia | 1 | 0.0% |
| El Salvador | 15 | 0.4% |
| Europe | 28 | 0.7% |
| Germany | 6 | 0.1% |
| Ghana | 25 | 0.6% |
| Italy | 10 | 0.2% |
| Korea | 1 | 0.0% |
| Latin America | 46 | 1.1% |
| Mexico | 5 | 0.1% |
| Middle Africa | 26 | 0.6% |
| Northern Europe | 12 | 0.3% |
| Oceania | 3 | 0.1% |
| Philippines | 20 | 0.5% |
| Singapore | 11 | 0.3% |
| South America | 26 | 0.6% |
| South Eastern Asia | 47 | 1.1% |
| Southern Europe | 10 | 0.2% |
| Thailand | 15 | 0.4% |
| Vietnam | 1 | 0.0% |
| Western Africa | 25 | 0.6% |
| Western Europe | 6 | 0.1% | View All 27 Rows |
Sex and Age in Holloman AFB
Sex and Age in Holloman AFB
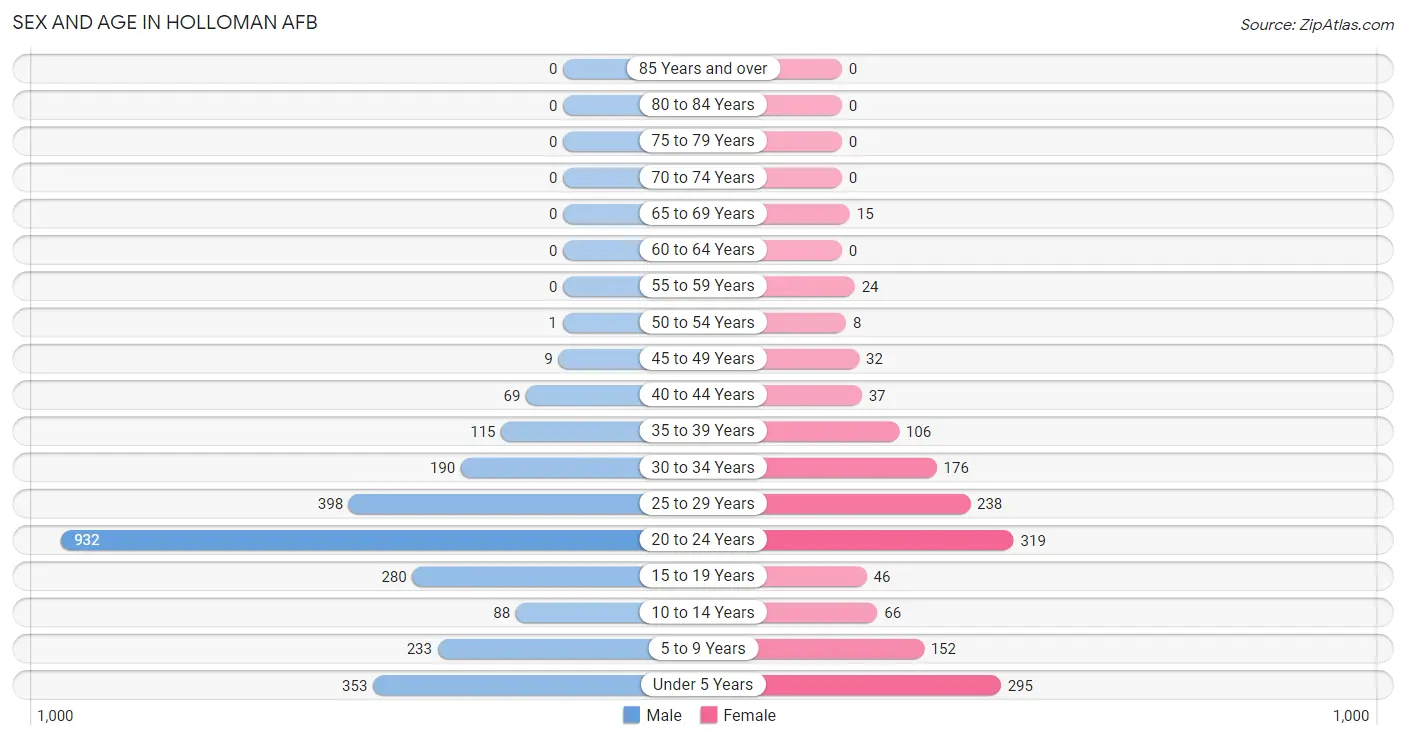
The most populous age groups in Holloman AFB are 20 to 24 Years (932 | 34.9%) for men and 20 to 24 Years (319 | 21.1%) for women.
| Age Bracket | Male | Female |
| Under 5 Years | 353 (13.2%) | 295 (19.5%) |
| 5 to 9 Years | 233 (8.7%) | 152 (10.0%) |
| 10 to 14 Years | 88 (3.3%) | 66 (4.4%) |
| 15 to 19 Years | 280 (10.5%) | 46 (3.0%) |
| 20 to 24 Years | 932 (34.9%) | 319 (21.1%) |
| 25 to 29 Years | 398 (14.9%) | 238 (15.7%) |
| 30 to 34 Years | 190 (7.1%) | 176 (11.6%) |
| 35 to 39 Years | 115 (4.3%) | 106 (7.0%) |
| 40 to 44 Years | 69 (2.6%) | 37 (2.4%) |
| 45 to 49 Years | 9 (0.3%) | 32 (2.1%) |
| 50 to 54 Years | 1 (0.0%) | 8 (0.5%) |
| 55 to 59 Years | 0 (0.0%) | 24 (1.6%) |
| 60 to 64 Years | 0 (0.0%) | 0 (0.0%) |
| 65 to 69 Years | 0 (0.0%) | 15 (1.0%) |
| 70 to 74 Years | 0 (0.0%) | 0 (0.0%) |
| 75 to 79 Years | 0 (0.0%) | 0 (0.0%) |
| 80 to 84 Years | 0 (0.0%) | 0 (0.0%) |
| 85 Years and over | 0 (0.0%) | 0 (0.0%) |
| Total | 2,668 (100.0%) | 1,514 (100.0%) |
Families and Households in Holloman AFB
Median Family Size in Holloman AFB
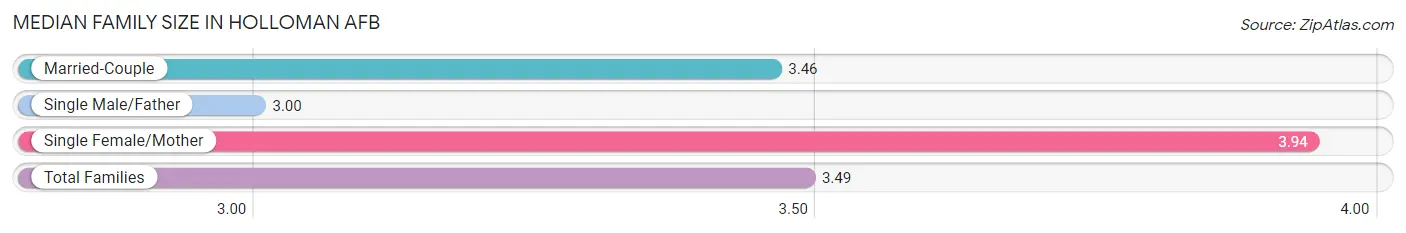
The median family size in Holloman AFB is 3.49 persons per family, with single female/mother families (65 | 8.3%) accounting for the largest median family size of 3.94 persons per family. On the other hand, single male/father families (14 | 1.8%) represent the smallest median family size with 3.00 persons per family.
| Family Type | # Families | Family Size |
| Married-Couple | 708 (90.0%) | 3.46 |
| Single Male/Father | 14 (1.8%) | 3.00 |
| Single Female/Mother | 65 (8.3%) | 3.94 |
| Total Families | 787 (100.0%) | 3.49 |
Median Household Size in Holloman AFB
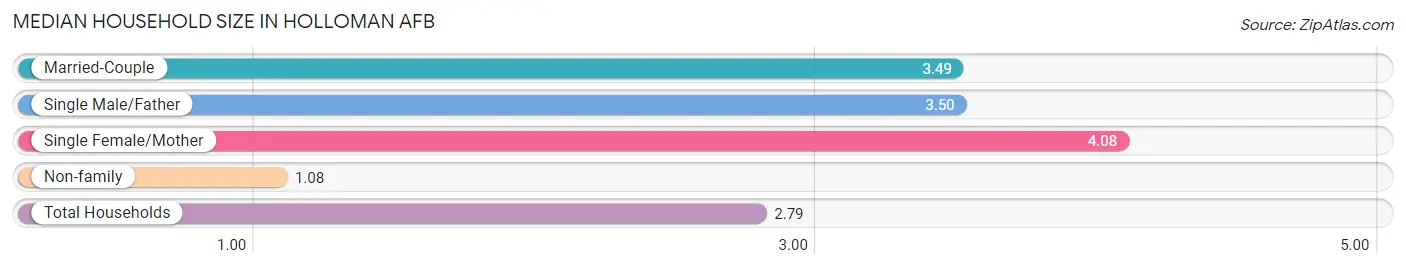
The median household size in Holloman AFB is 2.79 persons per household, with single female/mother households (65 | 5.8%) accounting for the largest median household size of 4.08 persons per household. non-family households (342 | 30.3%) represent the smallest median household size with 1.08 persons per household.
| Household Type | # Households | Household Size |
| Married-Couple | 708 (62.7%) | 3.49 |
| Single Male/Father | 14 (1.2%) | 3.50 |
| Single Female/Mother | 65 (5.8%) | 4.08 |
| Non-family | 342 (30.3%) | 1.08 |
| Total Households | 1,129 (100.0%) | 2.79 |
Household Size by Marriage Status in Holloman AFB
Out of a total of 1,129 households in Holloman AFB, 787 (69.7%) are family households, while 342 (30.3%) are nonfamily households. The most numerous type of family households are 3-person households, comprising 255, and the most common type of nonfamily households are 1-person households, comprising 337.
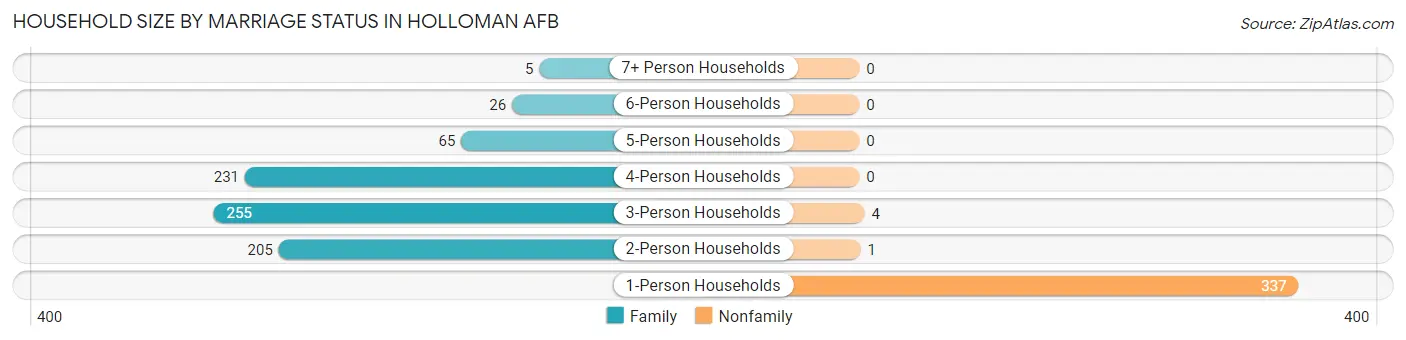
| Household Size | Family Households | Nonfamily Households |
| 1-Person Households | - | 337 (29.8%) |
| 2-Person Households | 205 (18.2%) | 1 (0.1%) |
| 3-Person Households | 255 (22.6%) | 4 (0.4%) |
| 4-Person Households | 231 (20.5%) | 0 (0.0%) |
| 5-Person Households | 65 (5.8%) | 0 (0.0%) |
| 6-Person Households | 26 (2.3%) | 0 (0.0%) |
| 7+ Person Households | 5 (0.4%) | 0 (0.0%) |
| Total | 787 (69.7%) | 342 (30.3%) |
Female Fertility in Holloman AFB
Fertility by Age in Holloman AFB
Average fertility rate in Holloman AFB is 117.0 births per 1,000 women. Women in the age bracket of 20 to 34 years have the highest fertility rate with 146.0 births per 1,000 women. Women in the age bracket of 20 to 34 years acount for 95.5% of all women with births.
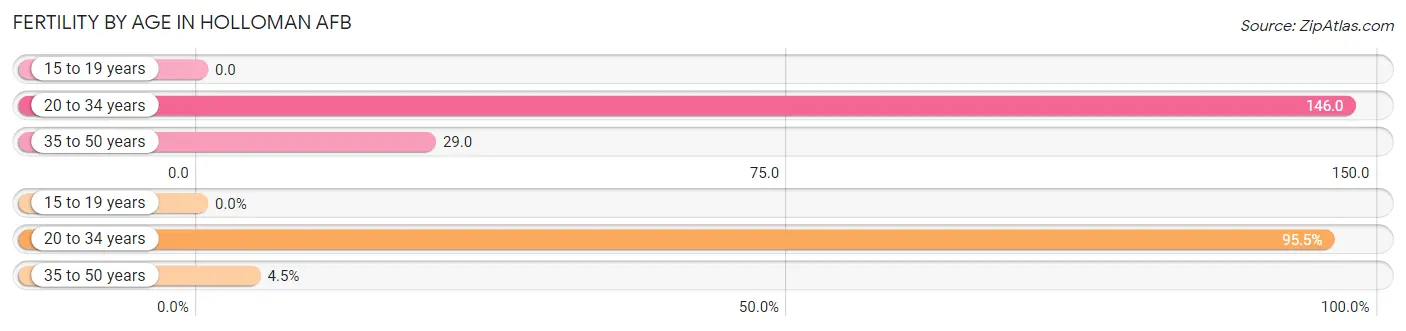
| Age Bracket | Women with Births | Births / 1,000 Women |
| 15 to 19 years | 0 (0.0%) | 0.0 |
| 20 to 34 years | 107 (95.5%) | 146.0 |
| 35 to 50 years | 5 (4.5%) | 29.0 |
| Total | 112 (100.0%) | 117.0 |
Fertility by Age by Marriage Status in Holloman AFB
97.3% of women with births (112) in Holloman AFB are married. The highest percentage of unmarried women with births falls into 20 to 34 years age bracket with 2.8% of them unmarried at the time of birth, while the lowest percentage of unmarried women with births belong to 35 to 50 years age bracket with 0.0% of them unmarried.
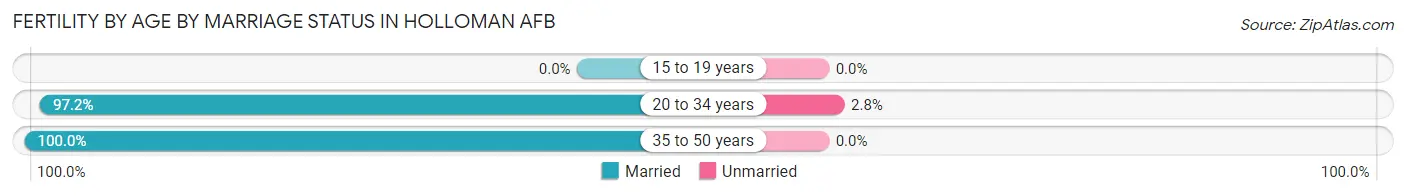
| Age Bracket | Married | Unmarried |
| 15 to 19 years | 0 (0.0%) | 0 (0.0%) |
| 20 to 34 years | 104 (97.2%) | 3 (2.8%) |
| 35 to 50 years | 5 (100.0%) | 0 (0.0%) |
| Total | 109 (97.3%) | 3 (2.7%) |
Fertility by Education in Holloman AFB
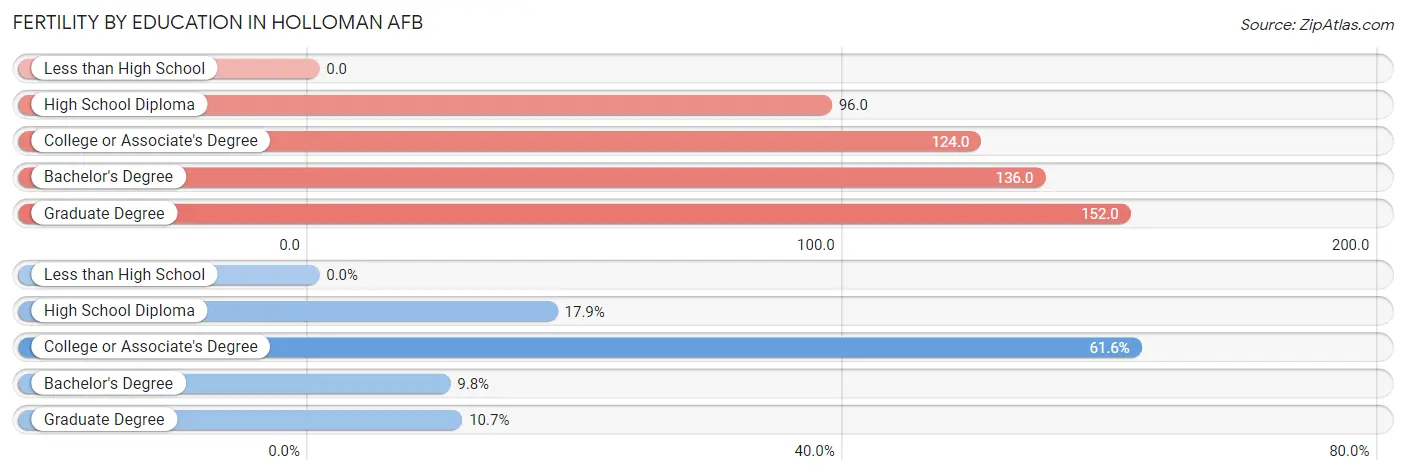
| Educational Attainment | Women with Births | Births / 1,000 Women |
| Less than High School | 0 (0.0%) | 0.0 |
| High School Diploma | 20 (17.9%) | 96.0 |
| College or Associate's Degree | 69 (61.6%) | 124.0 |
| Bachelor's Degree | 11 (9.8%) | 136.0 |
| Graduate Degree | 12 (10.7%) | 152.0 |
| Total | 112 (100.0%) | 117.0 |
Fertility by Education by Marriage Status in Holloman AFB
2.7% of women with births in Holloman AFB are unmarried. Women with the educational attainment of college or associate's degree are most likely to be married with 100.0% of them married at childbirth, while women with the educational attainment of high school diploma are least likely to be married with 15.0% of them unmarried at childbirth.
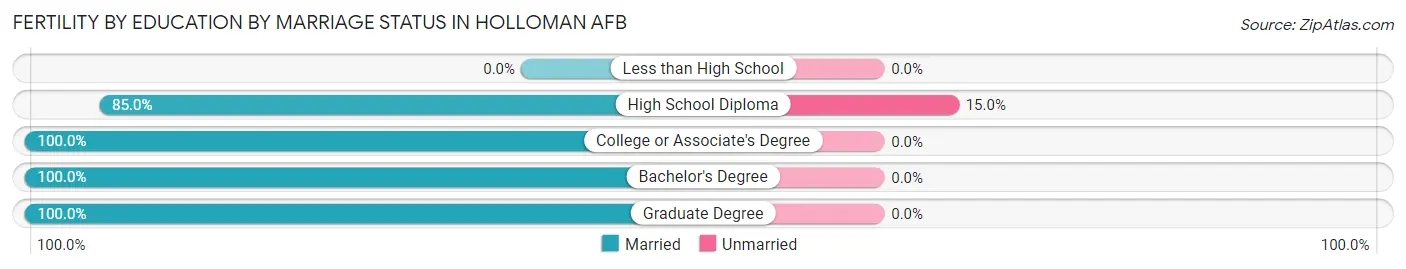
| Educational Attainment | Married | Unmarried |
| Less than High School | 0 (0.0%) | 0 (0.0%) |
| High School Diploma | 17 (85.0%) | 3 (15.0%) |
| College or Associate's Degree | 69 (100.0%) | 0 (0.0%) |
| Bachelor's Degree | 11 (100.0%) | 0 (0.0%) |
| Graduate Degree | 12 (100.0%) | 0 (0.0%) |
| Total | 109 (97.3%) | 3 (2.7%) |
Employment Characteristics in Holloman AFB
Employment by Class of Employer in Holloman AFB
Among the 2,479 employed individuals in Holloman AFB, federal government employees (2,227 | 89.8%), private company employees (162 | 6.5%), and not-for-profit organizations (40 | 1.6%) make up the most common classes of employment.
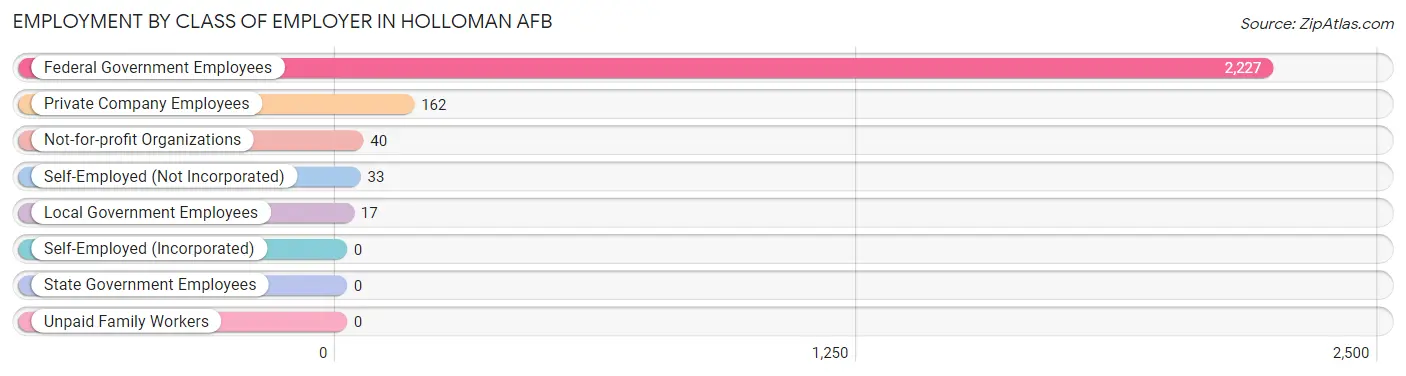
| Employer Class | # Employees | % Employees |
| Private Company Employees | 162 | 6.5% |
| Self-Employed (Incorporated) | 0 | 0.0% |
| Self-Employed (Not Incorporated) | 33 | 1.3% |
| Not-for-profit Organizations | 40 | 1.6% |
| Local Government Employees | 17 | 0.7% |
| State Government Employees | 0 | 0.0% |
| Federal Government Employees | 2,227 | 89.8% |
| Unpaid Family Workers | 0 | 0.0% |
| Total | 2,479 | 100.0% |
Employment Status by Age in Holloman AFB
According to the labor force statistics for Holloman AFB, out of the total population over 16 years of age (2,978), 84.7% or 2,522 individuals are in the labor force, with 6.0% or 151 of them unemployed. The age group with the highest labor force participation rate is 55 to 59 years, with 100.0% or 24 individuals in the labor force. Within the labor force, the 35 to 44 years age range has the highest percentage of unemployed individuals, with 14.2% or 39 of them being unemployed.
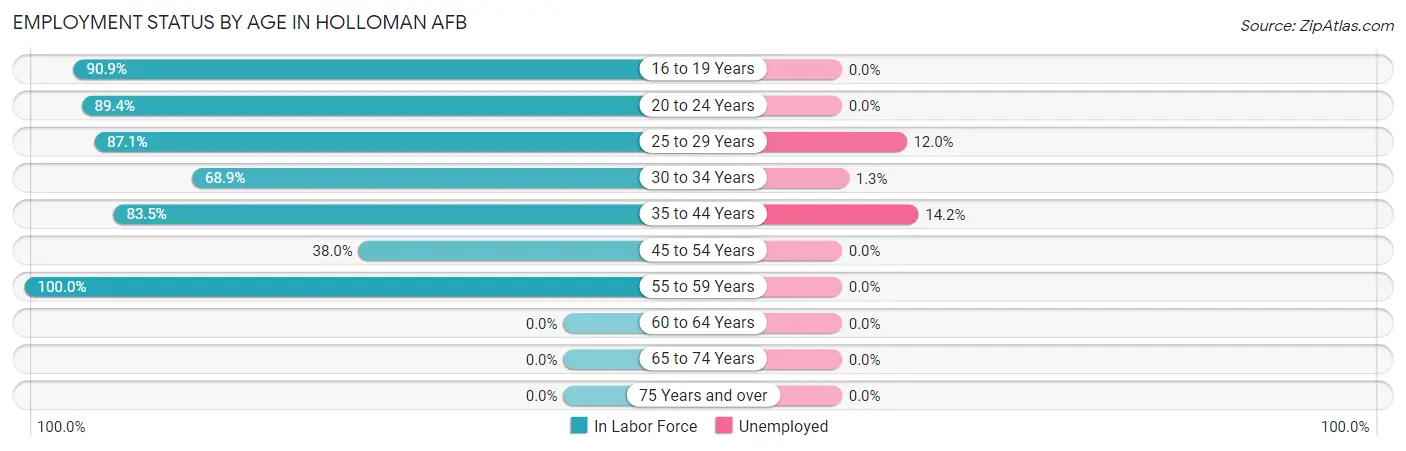
| Age Bracket | In Labor Force | Unemployed |
| 16 to 19 Years | 281 (90.9%) | 0 (0.0%) |
| 20 to 24 Years | 1,118 (89.4%) | 0 (0.0%) |
| 25 to 29 Years | 554 (87.1%) | 66 (12.0%) |
| 30 to 34 Years | 252 (68.9%) | 3 (1.3%) |
| 35 to 44 Years | 273 (83.5%) | 39 (14.2%) |
| 45 to 54 Years | 19 (38.0%) | 0 (0.0%) |
| 55 to 59 Years | 24 (100.0%) | 0 (0.0%) |
| 60 to 64 Years | 0 (0.0%) | 0 (0.0%) |
| 65 to 74 Years | 0 (0.0%) | 0 (0.0%) |
| 75 Years and over | 0 (0.0%) | 0 (0.0%) |
| Total | 2,522 (84.7%) | 151 (6.0%) |
Employment Status by Educational Attainment in Holloman AFB
According to labor force statistics for Holloman AFB, 80.0% of individuals (1,122) out of the total population between 25 and 64 years of age (1,403) are in the labor force, with 9.3% or 104 of them being unemployed. The group with the highest labor force participation rate are those with the educational attainment of less than high school, with 100.0% or 15 individuals in the labor force. Within the labor force, individuals with high school diploma education have the highest percentage of unemployment, with 22.5% or 37 of them being unemployed.
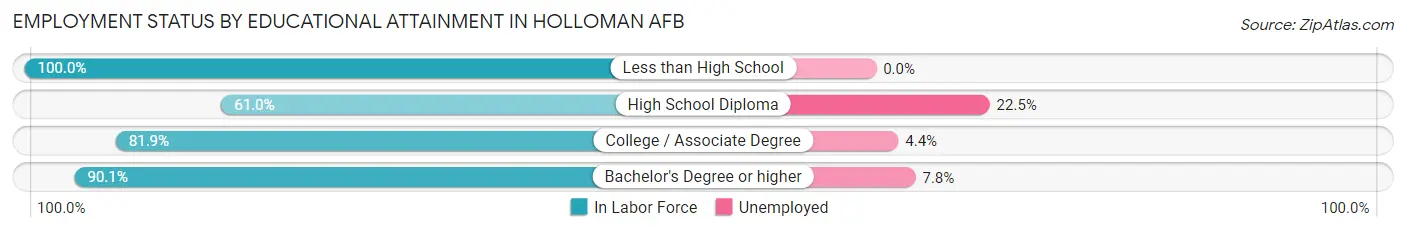
| Educational Attainment | In Labor Force | Unemployed |
| Less than High School | 15 (100.0%) | 0 (0.0%) |
| High School Diploma | 166 (61.0%) | 61 (22.5%) |
| College / Associate Degree | 641 (81.9%) | 34 (4.4%) |
| Bachelor's Degree or higher | 300 (90.1%) | 26 (7.8%) |
| Total | 1,122 (80.0%) | 130 (9.3%) |
Employment Occupations by Sex in Holloman AFB
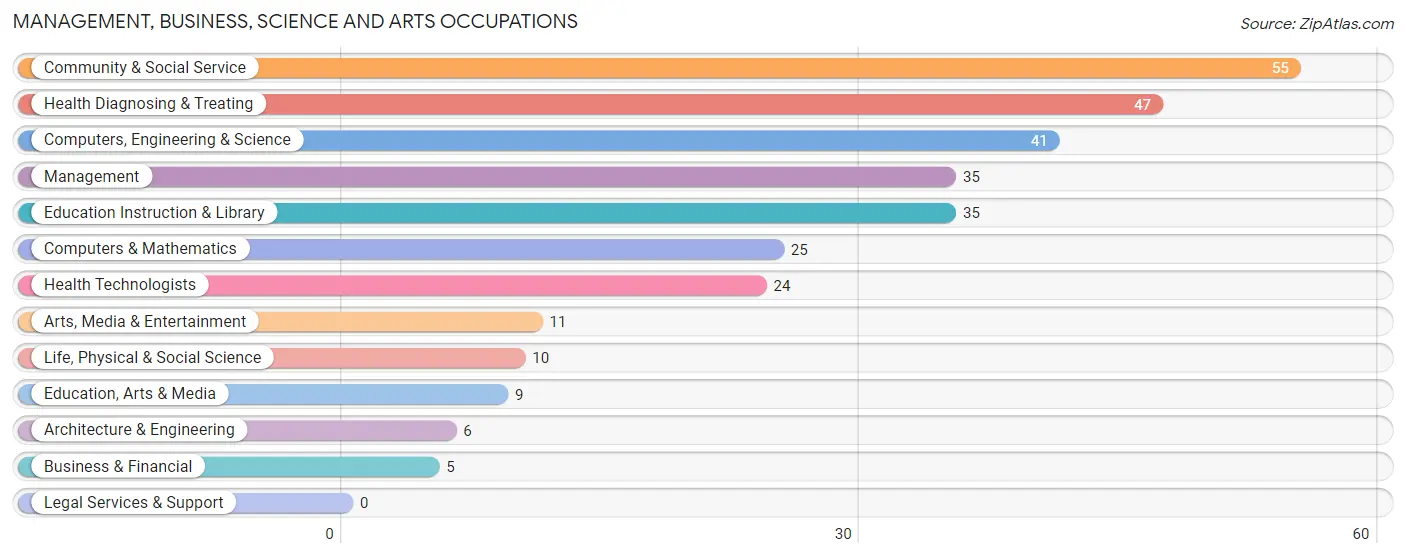
Management, Business, Science and Arts Occupations
The most common Management, Business, Science and Arts occupations in Holloman AFB are Community & Social Service (55 | 9.5%), Health Diagnosing & Treating (47 | 8.1%), Computers, Engineering & Science (41 | 7.0%), Management (35 | 6.0%), and Education Instruction & Library (35 | 6.0%).
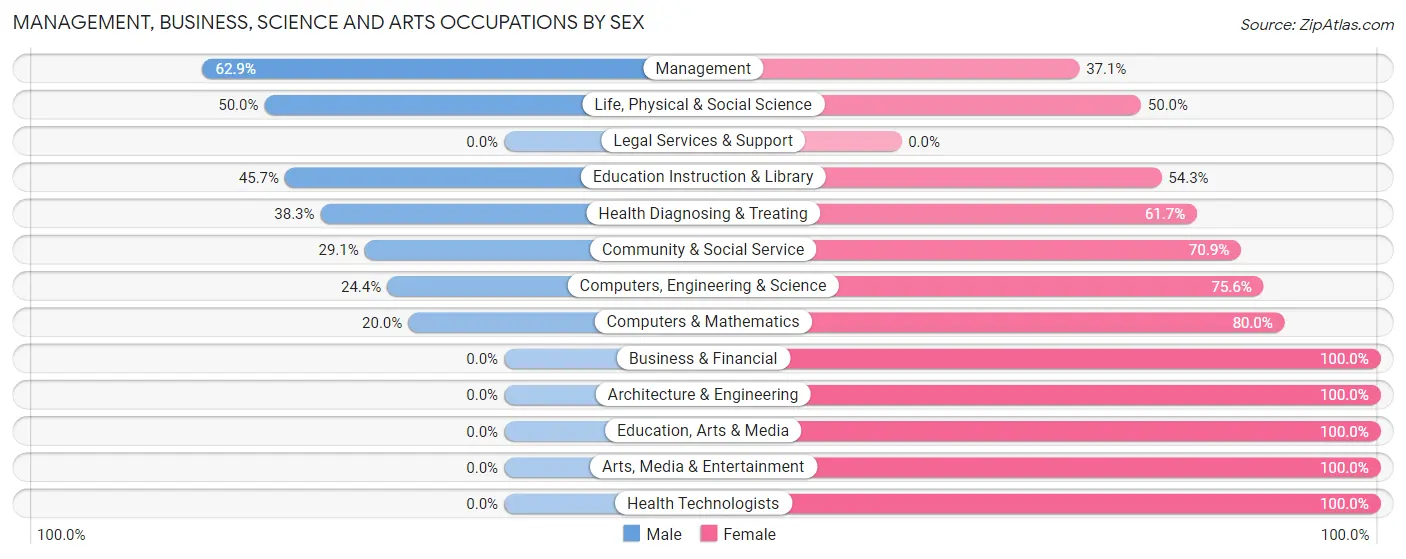
Management, Business, Science and Arts Occupations by Sex
Within the Management, Business, Science and Arts occupations in Holloman AFB, the most male-oriented occupations are Management (62.9%), Life, Physical & Social Science (50.0%), and Education Instruction & Library (45.7%), while the most female-oriented occupations are Business & Financial (100.0%), Architecture & Engineering (100.0%), and Education, Arts & Media (100.0%).
| Occupation | Male | Female |
| Management | 22 (62.9%) | 13 (37.1%) |
| Business & Financial | 0 (0.0%) | 5 (100.0%) |
| Computers, Engineering & Science | 10 (24.4%) | 31 (75.6%) |
| Computers & Mathematics | 5 (20.0%) | 20 (80.0%) |
| Architecture & Engineering | 0 (0.0%) | 6 (100.0%) |
| Life, Physical & Social Science | 5 (50.0%) | 5 (50.0%) |
| Community & Social Service | 16 (29.1%) | 39 (70.9%) |
| Education, Arts & Media | 0 (0.0%) | 9 (100.0%) |
| Legal Services & Support | 0 (0.0%) | 0 (0.0%) |
| Education Instruction & Library | 16 (45.7%) | 19 (54.3%) |
| Arts, Media & Entertainment | 0 (0.0%) | 11 (100.0%) |
| Health Diagnosing & Treating | 18 (38.3%) | 29 (61.7%) |
| Health Technologists | 0 (0.0%) | 24 (100.0%) |
| Total (Category) | 66 (36.1%) | 117 (63.9%) |
| Total (Overall) | 317 (54.5%) | 265 (45.5%) |
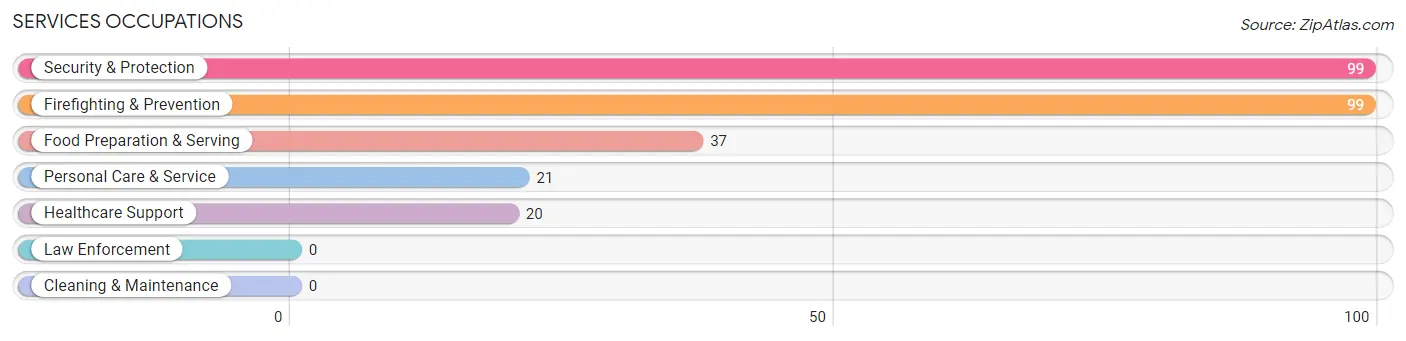
Services Occupations
The most common Services occupations in Holloman AFB are Security & Protection (99 | 17.0%), Firefighting & Prevention (99 | 17.0%), Food Preparation & Serving (37 | 6.4%), Personal Care & Service (21 | 3.6%), and Healthcare Support (20 | 3.4%).
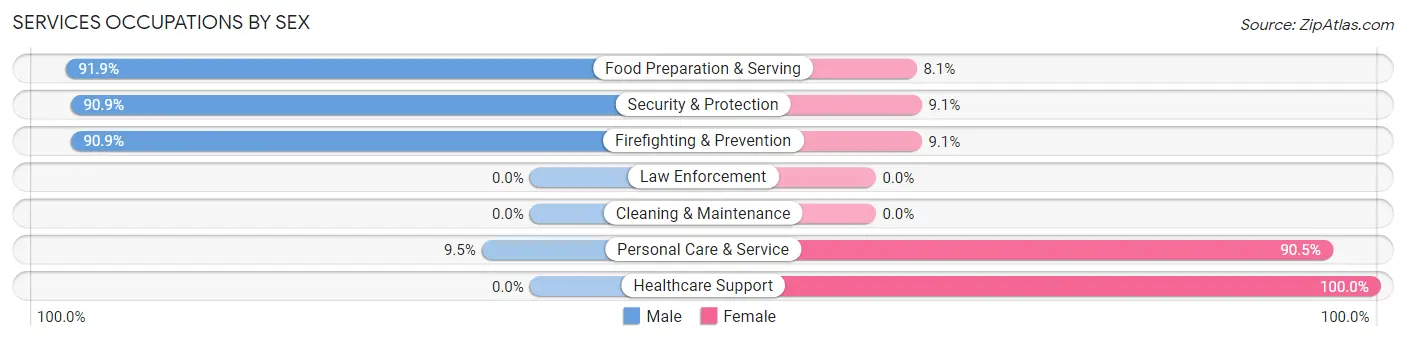
Services Occupations by Sex
Within the Services occupations in Holloman AFB, the most male-oriented occupations are Food Preparation & Serving (91.9%), Security & Protection (90.9%), and Firefighting & Prevention (90.9%), while the most female-oriented occupations are Healthcare Support (100.0%), Personal Care & Service (90.5%), and Security & Protection (9.1%).
| Occupation | Male | Female |
| Healthcare Support | 0 (0.0%) | 20 (100.0%) |
| Security & Protection | 90 (90.9%) | 9 (9.1%) |
| Firefighting & Prevention | 90 (90.9%) | 9 (9.1%) |
| Law Enforcement | 0 (0.0%) | 0 (0.0%) |
| Food Preparation & Serving | 34 (91.9%) | 3 (8.1%) |
| Cleaning & Maintenance | 0 (0.0%) | 0 (0.0%) |
| Personal Care & Service | 2 (9.5%) | 19 (90.5%) |
| Total (Category) | 126 (71.2%) | 51 (28.8%) |
| Total (Overall) | 317 (54.5%) | 265 (45.5%) |
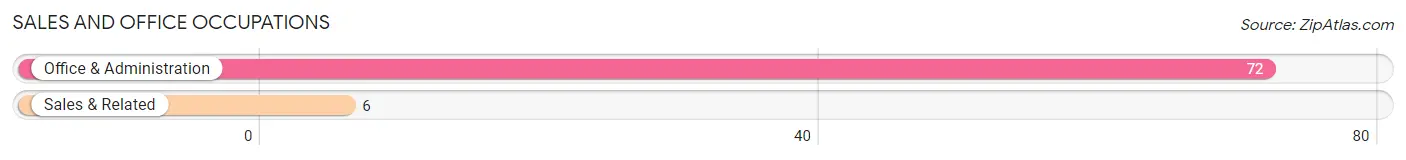
Sales and Office Occupations
The most common Sales and Office occupations in Holloman AFB are Office & Administration (72 | 12.4%), and Sales & Related (6 | 1.0%).
Sales and Office Occupations by Sex
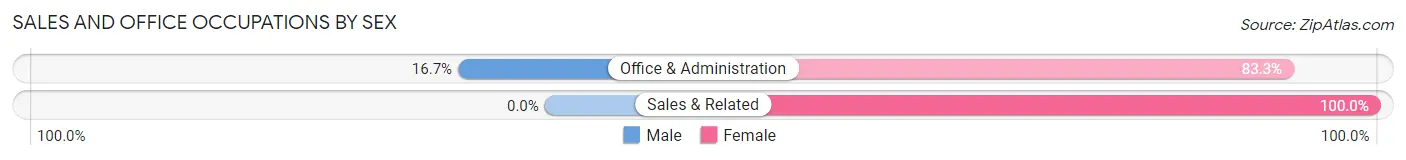
| Occupation | Male | Female |
| Sales & Related | 0 (0.0%) | 6 (100.0%) |
| Office & Administration | 12 (16.7%) | 60 (83.3%) |
| Total (Category) | 12 (15.4%) | 66 (84.6%) |
| Total (Overall) | 317 (54.5%) | 265 (45.5%) |
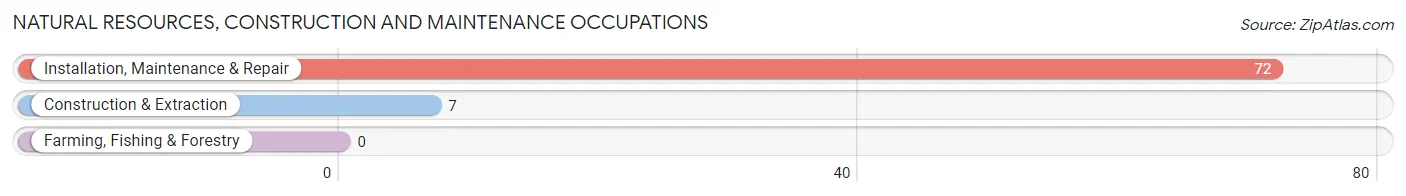
Natural Resources, Construction and Maintenance Occupations
The most common Natural Resources, Construction and Maintenance occupations in Holloman AFB are Installation, Maintenance & Repair (72 | 12.4%), and Construction & Extraction (7 | 1.2%).
Natural Resources, Construction and Maintenance Occupations by Sex
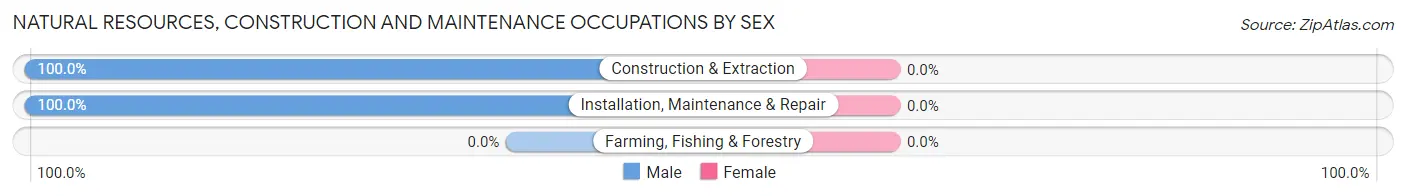
| Occupation | Male | Female |
| Farming, Fishing & Forestry | 0 (0.0%) | 0 (0.0%) |
| Construction & Extraction | 7 (100.0%) | 0 (0.0%) |
| Installation, Maintenance & Repair | 72 (100.0%) | 0 (0.0%) |
| Total (Category) | 79 (100.0%) | 0 (0.0%) |
| Total (Overall) | 317 (54.5%) | 265 (45.5%) |
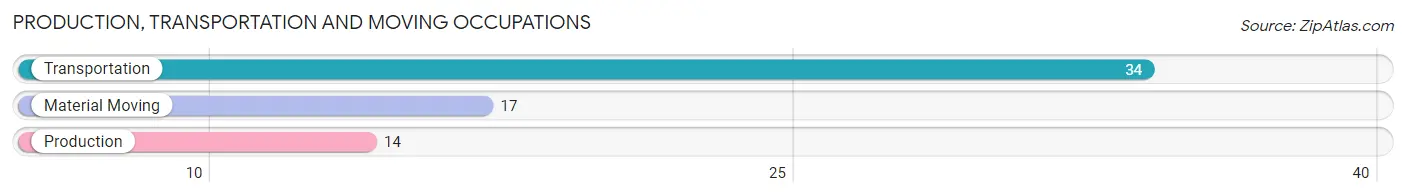
Production, Transportation and Moving Occupations
The most common Production, Transportation and Moving occupations in Holloman AFB are Transportation (34 | 5.8%), Material Moving (17 | 2.9%), and Production (14 | 2.4%).
Production, Transportation and Moving Occupations by Sex
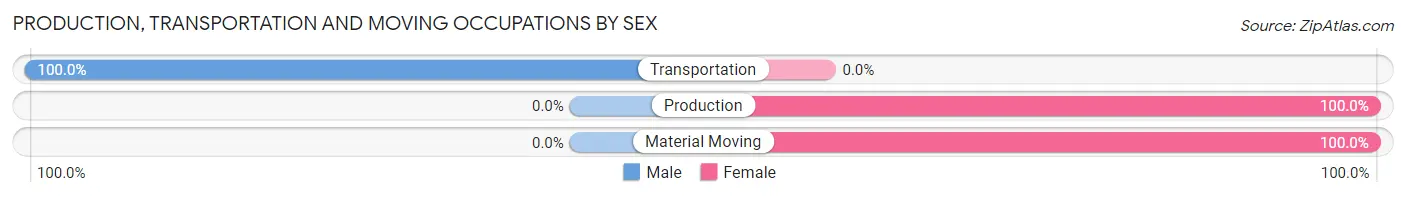
| Occupation | Male | Female |
| Production | 0 (0.0%) | 14 (100.0%) |
| Transportation | 34 (100.0%) | 0 (0.0%) |
| Material Moving | 0 (0.0%) | 17 (100.0%) |
| Total (Category) | 34 (52.3%) | 31 (47.7%) |
| Total (Overall) | 317 (54.5%) | 265 (45.5%) |
Employment Industries by Sex in Holloman AFB
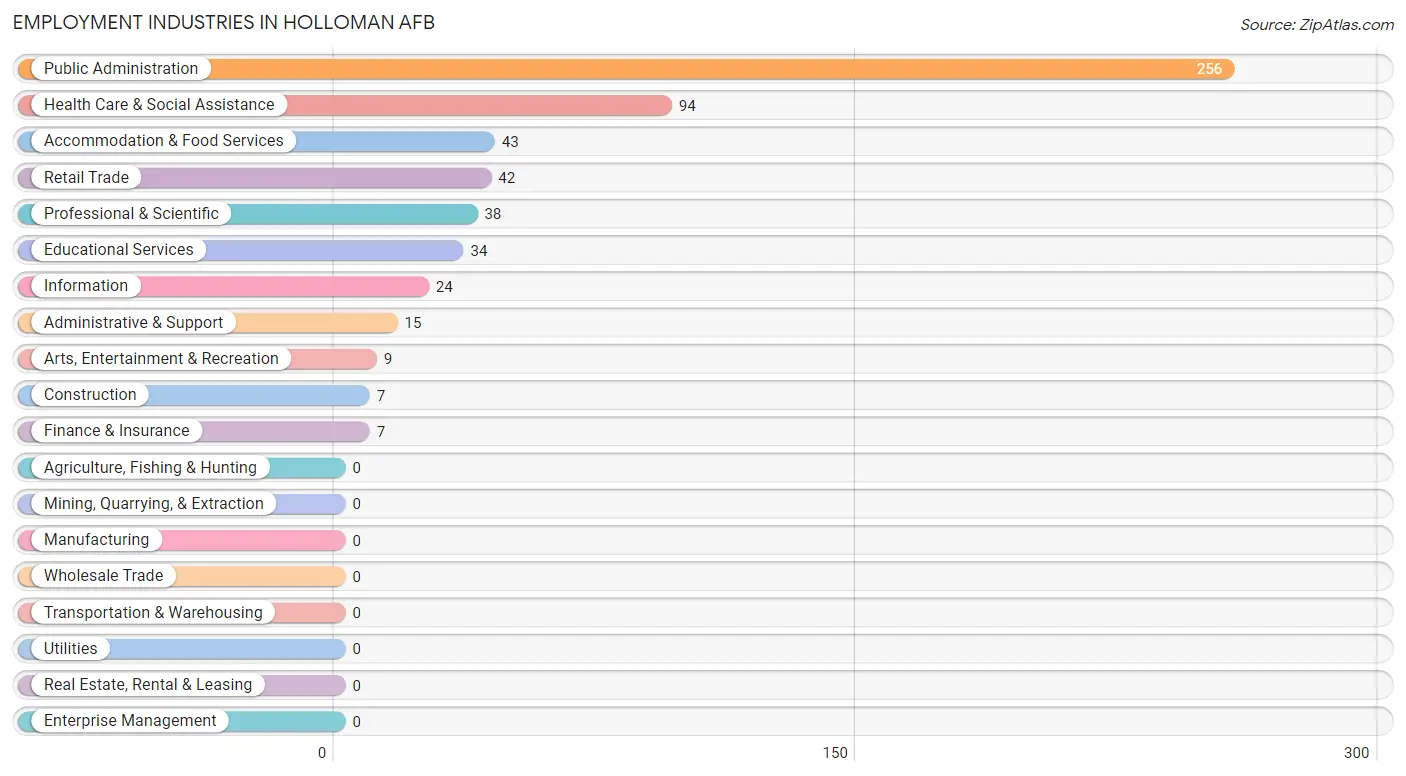
Employment Industries in Holloman AFB
The major employment industries in Holloman AFB include Public Administration (256 | 44.0%), Health Care & Social Assistance (94 | 16.2%), Accommodation & Food Services (43 | 7.4%), Retail Trade (42 | 7.2%), and Professional & Scientific (38 | 6.5%).
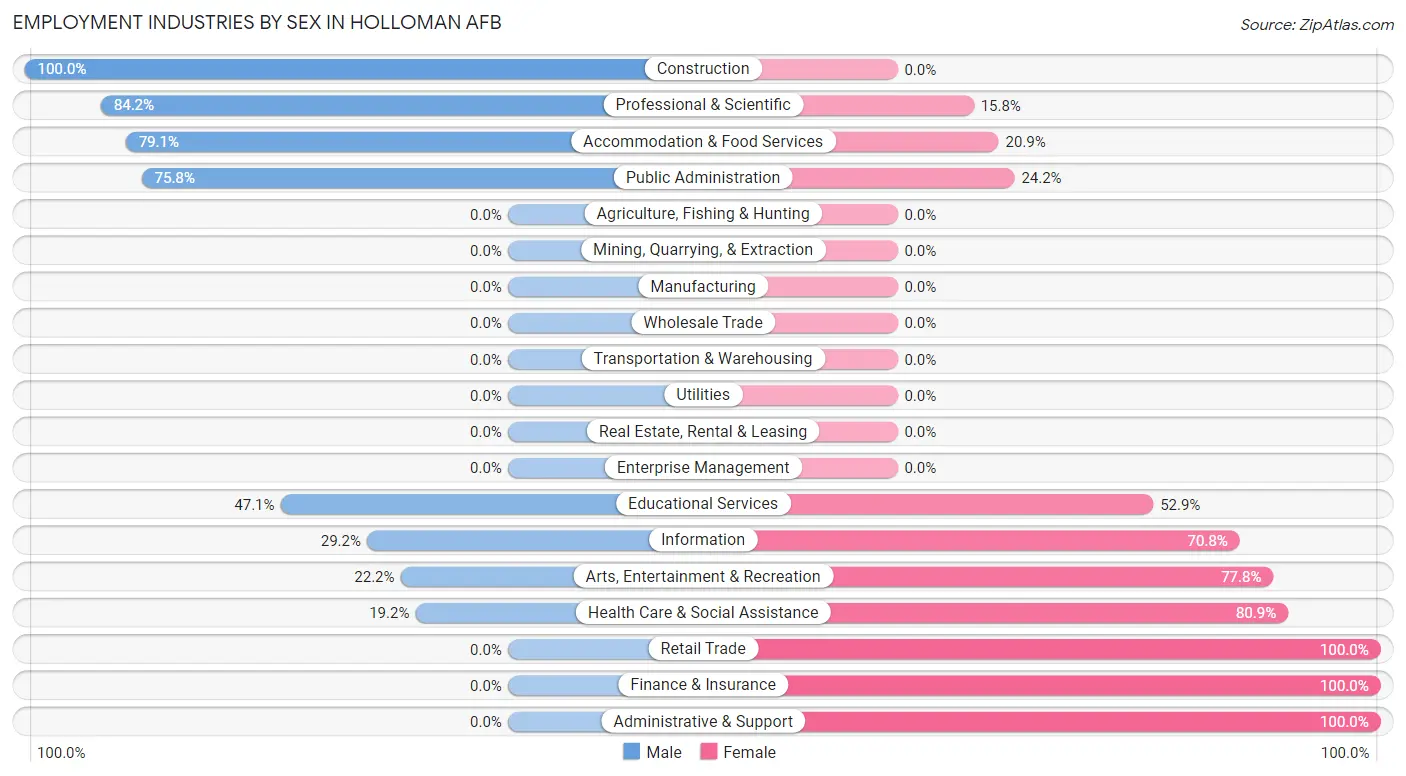
Employment Industries by Sex in Holloman AFB
The Holloman AFB industries that see more men than women are Construction (100.0%), Professional & Scientific (84.2%), and Accommodation & Food Services (79.1%), whereas the industries that tend to have a higher number of women are Retail Trade (100.0%), Finance & Insurance (100.0%), and Administrative & Support (100.0%).
| Industry | Male | Female |
| Agriculture, Fishing & Hunting | 0 (0.0%) | 0 (0.0%) |
| Mining, Quarrying, & Extraction | 0 (0.0%) | 0 (0.0%) |
| Construction | 7 (100.0%) | 0 (0.0%) |
| Manufacturing | 0 (0.0%) | 0 (0.0%) |
| Wholesale Trade | 0 (0.0%) | 0 (0.0%) |
| Retail Trade | 0 (0.0%) | 42 (100.0%) |
| Transportation & Warehousing | 0 (0.0%) | 0 (0.0%) |
| Utilities | 0 (0.0%) | 0 (0.0%) |
| Information | 7 (29.2%) | 17 (70.8%) |
| Finance & Insurance | 0 (0.0%) | 7 (100.0%) |
| Real Estate, Rental & Leasing | 0 (0.0%) | 0 (0.0%) |
| Professional & Scientific | 32 (84.2%) | 6 (15.8%) |
| Enterprise Management | 0 (0.0%) | 0 (0.0%) |
| Administrative & Support | 0 (0.0%) | 15 (100.0%) |
| Educational Services | 16 (47.1%) | 18 (52.9%) |
| Health Care & Social Assistance | 18 (19.2%) | 76 (80.8%) |
| Arts, Entertainment & Recreation | 2 (22.2%) | 7 (77.8%) |
| Accommodation & Food Services | 34 (79.1%) | 9 (20.9%) |
| Public Administration | 194 (75.8%) | 62 (24.2%) |
| Total | 317 (54.5%) | 265 (45.5%) |
Education in Holloman AFB
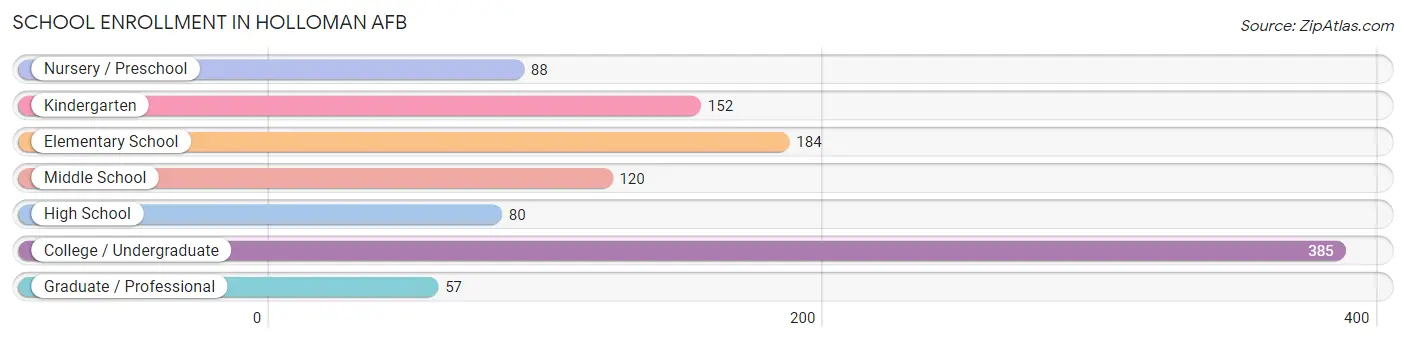
School Enrollment in Holloman AFB
The most common levels of schooling among the 1,066 students in Holloman AFB are college / undergraduate (385 | 36.1%), elementary school (184 | 17.3%), and kindergarten (152 | 14.3%).
| School Level | # Students | % Students |
| Nursery / Preschool | 88 | 8.3% |
| Kindergarten | 152 | 14.3% |
| Elementary School | 184 | 17.3% |
| Middle School | 120 | 11.3% |
| High School | 80 | 7.5% |
| College / Undergraduate | 385 | 36.1% |
| Graduate / Professional | 57 | 5.3% |
| Total | 1,066 | 100.0% |
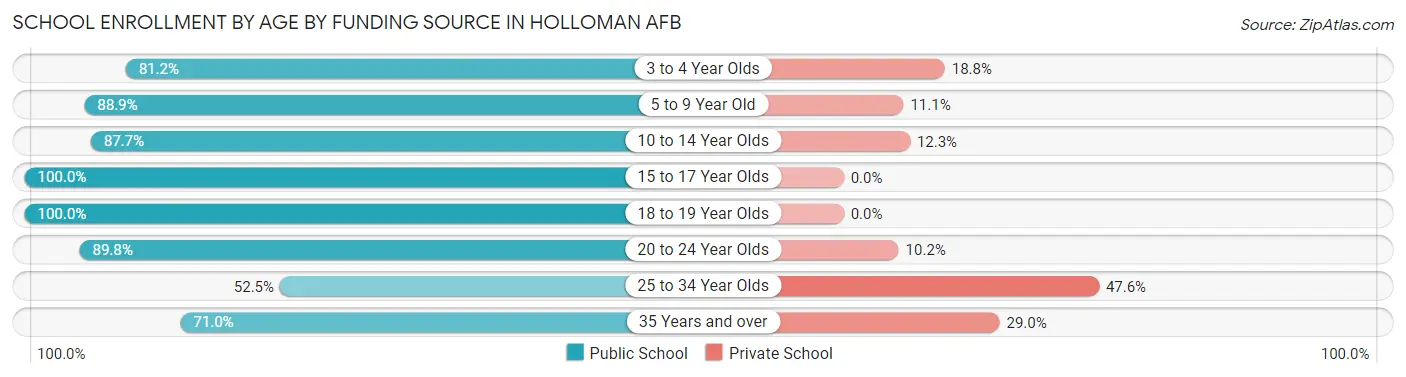
School Enrollment by Age by Funding Source in Holloman AFB
Out of a total of 1,066 students who are enrolled in schools in Holloman AFB, 201 (18.9%) attend a private institution, while the remaining 865 (81.1%) are enrolled in public schools. The age group of 25 to 34 year olds has the highest likelihood of being enrolled in private schools, with 97 (47.5% in the age bracket) enrolled. Conversely, the age group of 15 to 17 year olds has the lowest likelihood of being enrolled in a private school, with 50 (100.0% in the age bracket) attending a public institution.
| Age Bracket | Public School | Private School |
| 3 to 4 Year Olds | 56 (81.2%) | 13 (18.8%) |
| 5 to 9 Year Old | 303 (88.9%) | 38 (11.1%) |
| 10 to 14 Year Olds | 135 (87.7%) | 19 (12.3%) |
| 15 to 17 Year Olds | 50 (100.0%) | 0 (0.0%) |
| 18 to 19 Year Olds | 20 (100.0%) | 0 (0.0%) |
| 20 to 24 Year Olds | 149 (89.8%) | 17 (10.2%) |
| 25 to 34 Year Olds | 107 (52.4%) | 97 (47.5%) |
| 35 Years and over | 44 (71.0%) | 18 (29.0%) |
| Total | 865 (81.1%) | 201 (18.9%) |
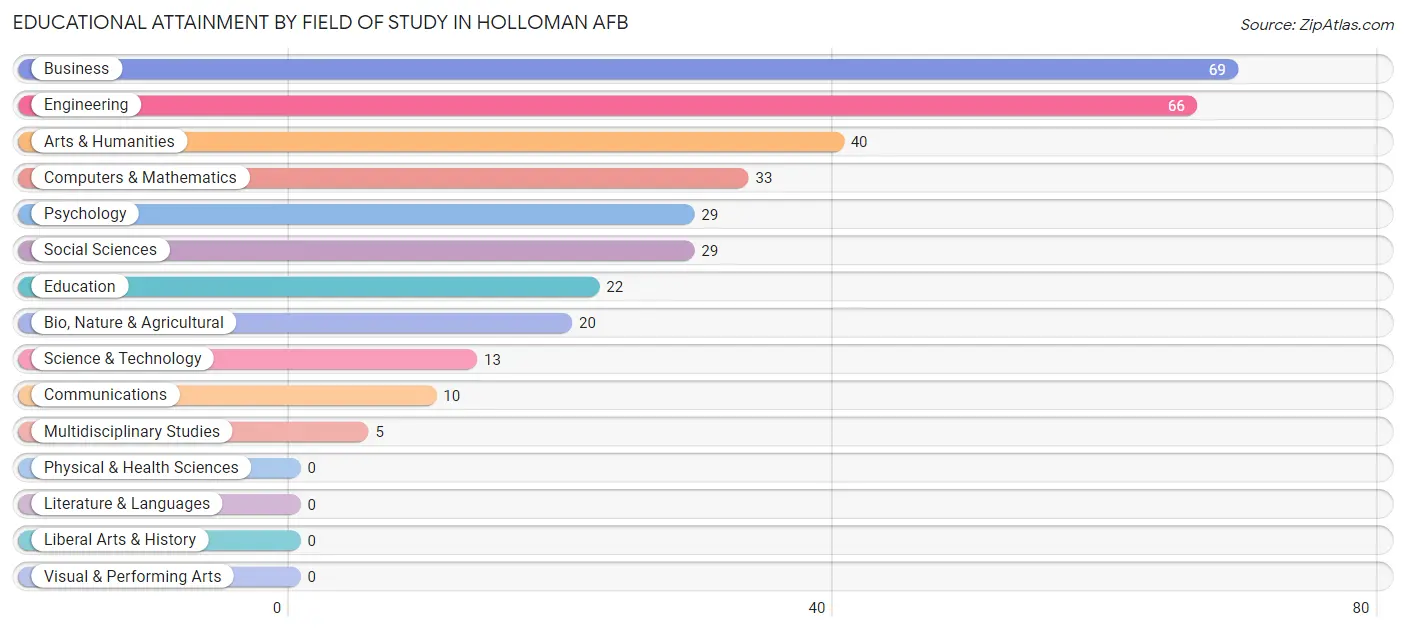
Educational Attainment by Field of Study in Holloman AFB
Business (69 | 20.5%), engineering (66 | 19.6%), arts & humanities (40 | 11.9%), computers & mathematics (33 | 9.8%), and psychology (29 | 8.6%) are the most common fields of study among 336 individuals in Holloman AFB who have obtained a bachelor's degree or higher.
| Field of Study | # Graduates | % Graduates |
| Computers & Mathematics | 33 | 9.8% |
| Bio, Nature & Agricultural | 20 | 5.9% |
| Physical & Health Sciences | 0 | 0.0% |
| Psychology | 29 | 8.6% |
| Social Sciences | 29 | 8.6% |
| Engineering | 66 | 19.6% |
| Multidisciplinary Studies | 5 | 1.5% |
| Science & Technology | 13 | 3.9% |
| Business | 69 | 20.5% |
| Education | 22 | 6.6% |
| Literature & Languages | 0 | 0.0% |
| Liberal Arts & History | 0 | 0.0% |
| Visual & Performing Arts | 0 | 0.0% |
| Communications | 10 | 3.0% |
| Arts & Humanities | 40 | 11.9% |
| Total | 336 | 100.0% |
Transportation & Commute in Holloman AFB
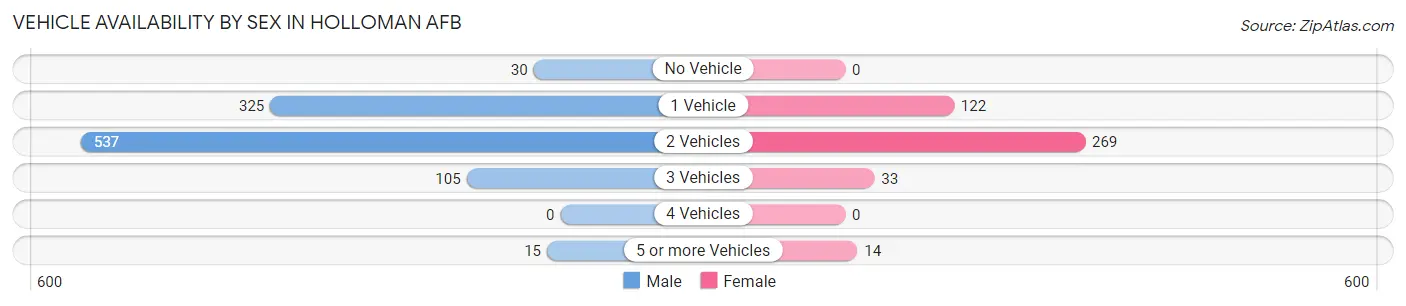
Vehicle Availability by Sex in Holloman AFB
The most prevalent vehicle ownership categories in Holloman AFB are males with 2 vehicles (537, accounting for 53.1%) and females with 2 vehicles (269, making up 122.6%).
| Vehicles Available | Male | Female |
| No Vehicle | 30 (3.0%) | 0 (0.0%) |
| 1 Vehicle | 325 (32.1%) | 122 (27.9%) |
| 2 Vehicles | 537 (53.1%) | 269 (61.4%) |
| 3 Vehicles | 105 (10.4%) | 33 (7.5%) |
| 4 Vehicles | 0 (0.0%) | 0 (0.0%) |
| 5 or more Vehicles | 15 (1.5%) | 14 (3.2%) |
| Total | 1,012 (100.0%) | 438 (100.0%) |
Commute Time in Holloman AFB
The most frequently occuring commute durations in Holloman AFB are 5 to 9 minutes (1,170 commuters, 48.4%), 10 to 14 minutes (624 commuters, 25.8%), and less than 5 minutes (359 commuters, 14.9%).
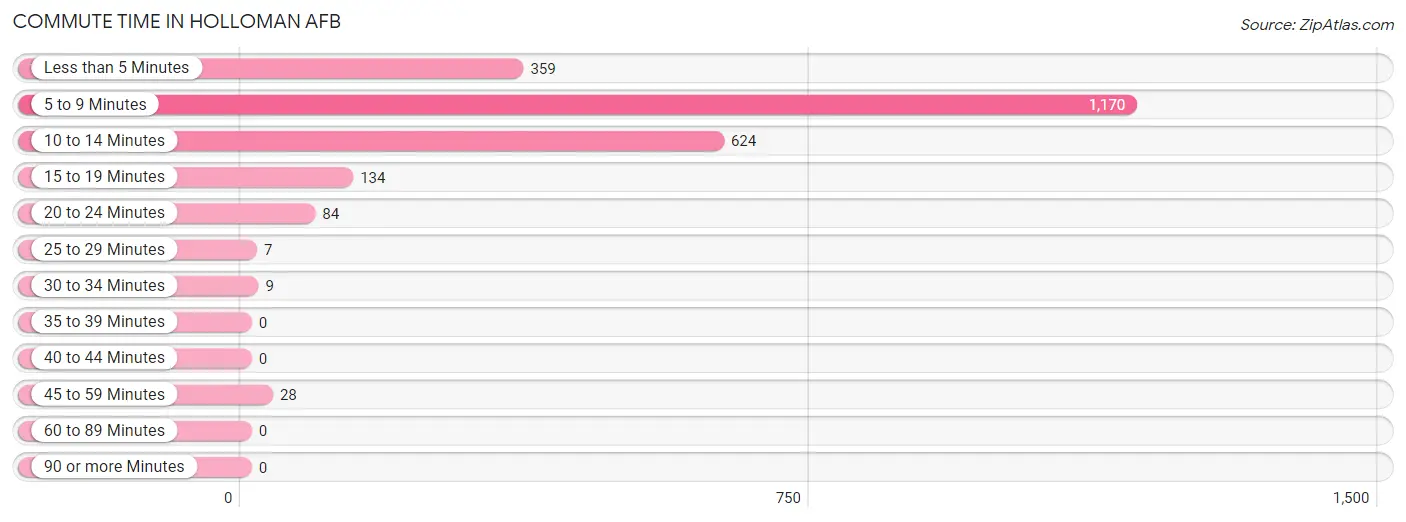
| Commute Time | # Commuters | % Commuters |
| Less than 5 Minutes | 359 | 14.9% |
| 5 to 9 Minutes | 1,170 | 48.4% |
| 10 to 14 Minutes | 624 | 25.8% |
| 15 to 19 Minutes | 134 | 5.6% |
| 20 to 24 Minutes | 84 | 3.5% |
| 25 to 29 Minutes | 7 | 0.3% |
| 30 to 34 Minutes | 9 | 0.4% |
| 35 to 39 Minutes | 0 | 0.0% |
| 40 to 44 Minutes | 0 | 0.0% |
| 45 to 59 Minutes | 28 | 1.2% |
| 60 to 89 Minutes | 0 | 0.0% |
| 90 or more Minutes | 0 | 0.0% |
Commute Time by Sex in Holloman AFB
The most common commute times in Holloman AFB are 5 to 9 minutes (1,067 commuters, 54.2%) for males and 10 to 14 minutes (124 commuters, 27.7%) for females.
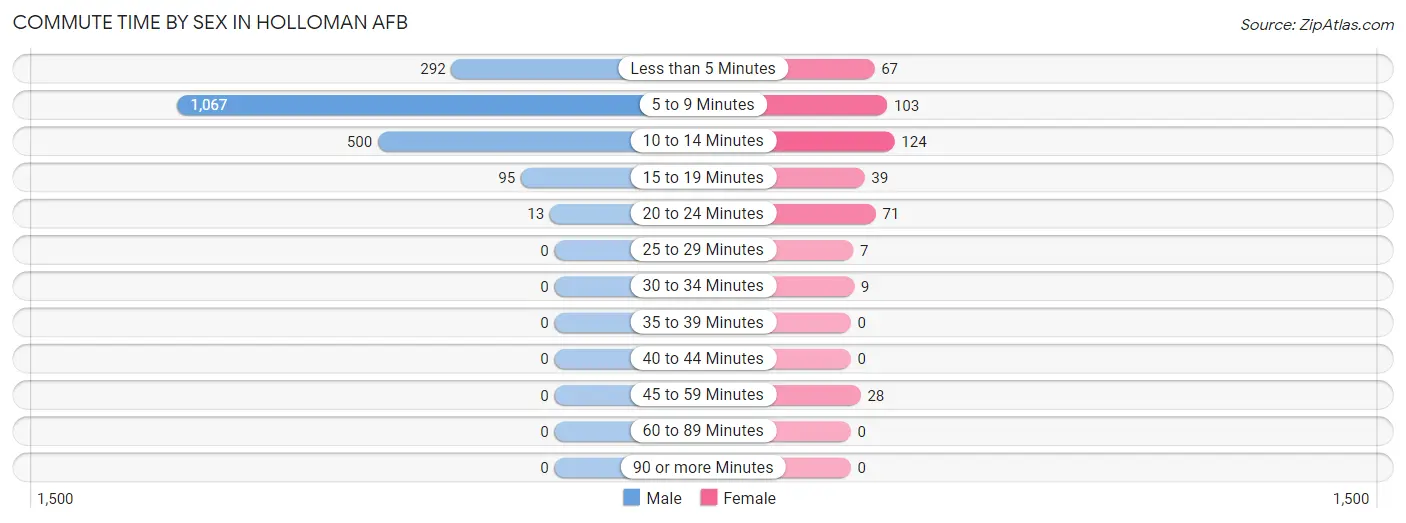
| Commute Time | Male | Female |
| Less than 5 Minutes | 292 (14.8%) | 67 (15.0%) |
| 5 to 9 Minutes | 1,067 (54.2%) | 103 (23.0%) |
| 10 to 14 Minutes | 500 (25.4%) | 124 (27.7%) |
| 15 to 19 Minutes | 95 (4.8%) | 39 (8.7%) |
| 20 to 24 Minutes | 13 (0.7%) | 71 (15.9%) |
| 25 to 29 Minutes | 0 (0.0%) | 7 (1.6%) |
| 30 to 34 Minutes | 0 (0.0%) | 9 (2.0%) |
| 35 to 39 Minutes | 0 (0.0%) | 0 (0.0%) |
| 40 to 44 Minutes | 0 (0.0%) | 0 (0.0%) |
| 45 to 59 Minutes | 0 (0.0%) | 28 (6.2%) |
| 60 to 89 Minutes | 0 (0.0%) | 0 (0.0%) |
| 90 or more Minutes | 0 (0.0%) | 0 (0.0%) |
Time of Departure to Work by Sex in Holloman AFB
The most frequent times of departure to work in Holloman AFB are 6:30 AM to 6:59 AM (795, 40.4%) for males and 6:30 AM to 6:59 AM (95, 21.2%) for females.
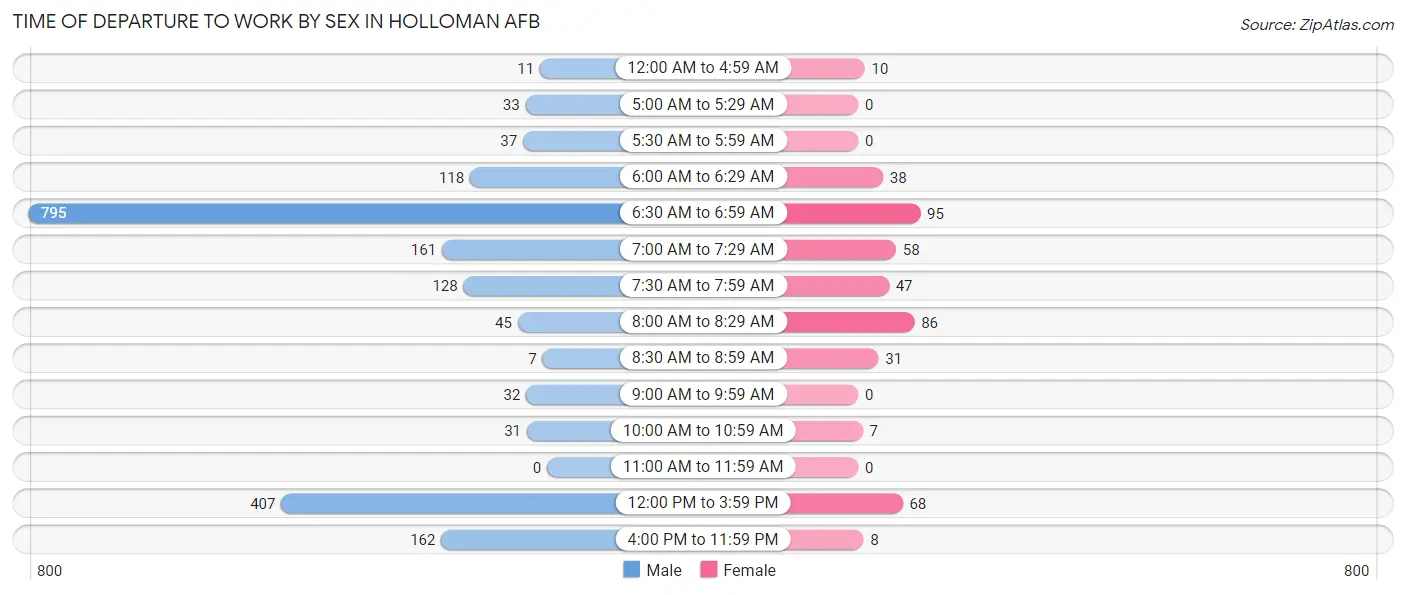
| Time of Departure | Male | Female |
| 12:00 AM to 4:59 AM | 11 (0.6%) | 10 (2.2%) |
| 5:00 AM to 5:29 AM | 33 (1.7%) | 0 (0.0%) |
| 5:30 AM to 5:59 AM | 37 (1.9%) | 0 (0.0%) |
| 6:00 AM to 6:29 AM | 118 (6.0%) | 38 (8.5%) |
| 6:30 AM to 6:59 AM | 795 (40.4%) | 95 (21.2%) |
| 7:00 AM to 7:29 AM | 161 (8.2%) | 58 (13.0%) |
| 7:30 AM to 7:59 AM | 128 (6.5%) | 47 (10.5%) |
| 8:00 AM to 8:29 AM | 45 (2.3%) | 86 (19.2%) |
| 8:30 AM to 8:59 AM | 7 (0.4%) | 31 (6.9%) |
| 9:00 AM to 9:59 AM | 32 (1.6%) | 0 (0.0%) |
| 10:00 AM to 10:59 AM | 31 (1.6%) | 7 (1.6%) |
| 11:00 AM to 11:59 AM | 0 (0.0%) | 0 (0.0%) |
| 12:00 PM to 3:59 PM | 407 (20.7%) | 68 (15.2%) |
| 4:00 PM to 11:59 PM | 162 (8.2%) | 8 (1.8%) |
| Total | 1,967 (100.0%) | 448 (100.0%) |
Housing Occupancy in Holloman AFB
Occupancy by Ownership in Holloman AFB
Of the total 1,129 dwellings in Holloman AFB, owner-occupied units account for 0 (0.0%), while renter-occupied units make up 1,129 (100.0%).
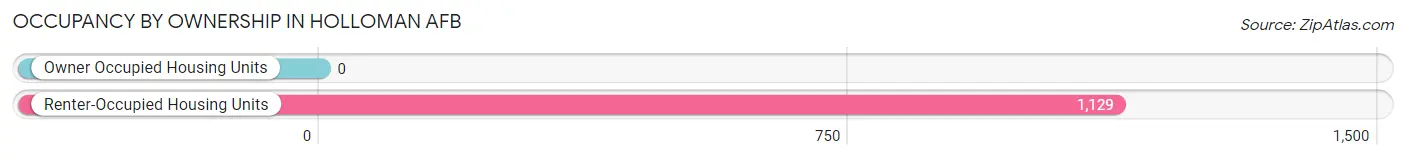
| Occupancy | # Housing Units | % Housing Units |
| Owner Occupied Housing Units | 0 | 0.0% |
| Renter-Occupied Housing Units | 1,129 | 100.0% |
| Total Occupied Housing Units | 1,129 | 100.0% |
Occupancy by Household Size in Holloman AFB
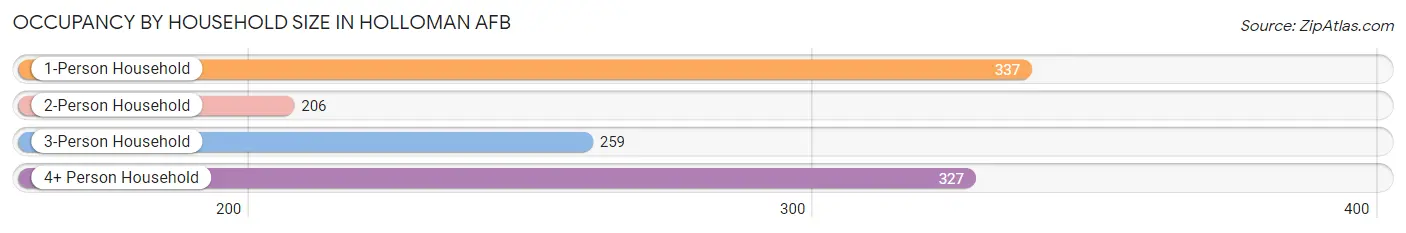
| Household Size | # Housing Units | % Housing Units |
| 1-Person Household | 337 | 29.8% |
| 2-Person Household | 206 | 18.2% |
| 3-Person Household | 259 | 22.9% |
| 4+ Person Household | 327 | 29.0% |
| Total Housing Units | 1,129 | 100.0% |
Occupancy by Ownership by Household Size in Holloman AFB
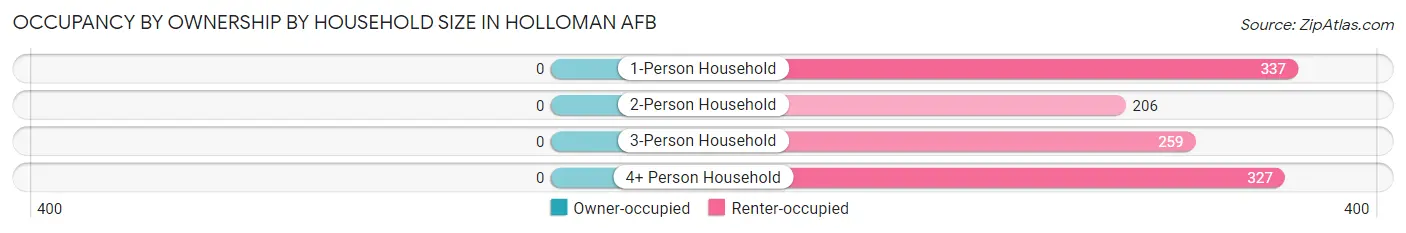
| Household Size | Owner-occupied | Renter-occupied |
| 1-Person Household | 0 (0.0%) | 337 (100.0%) |
| 2-Person Household | 0 (0.0%) | 206 (100.0%) |
| 3-Person Household | 0 (0.0%) | 259 (100.0%) |
| 4+ Person Household | 0 (0.0%) | 327 (100.0%) |
| Total Housing Units | 0 (0.0%) | 1,129 (100.0%) |
Occupancy by Educational Attainment in Holloman AFB
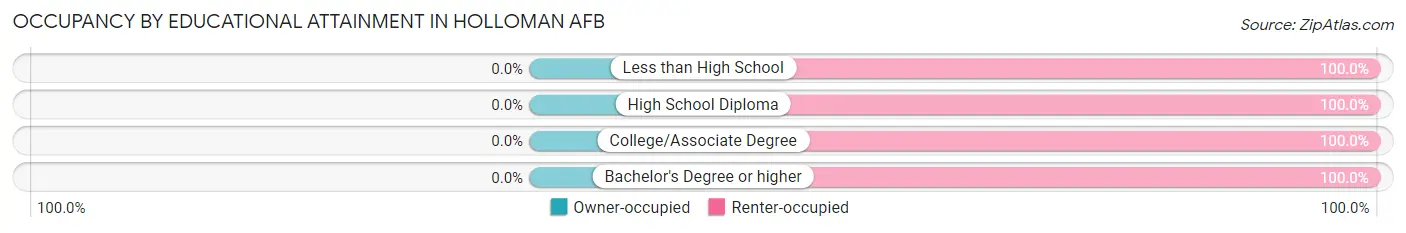
| Household Size | Owner-occupied | Renter-occupied |
| Less than High School | 0 (0.0%) | 6 (100.0%) |
| High School Diploma | 0 (0.0%) | 208 (100.0%) |
| College/Associate Degree | 0 (0.0%) | 707 (100.0%) |
| Bachelor's Degree or higher | 0 (0.0%) | 208 (100.0%) |
Occupancy by Age of Householder in Holloman AFB
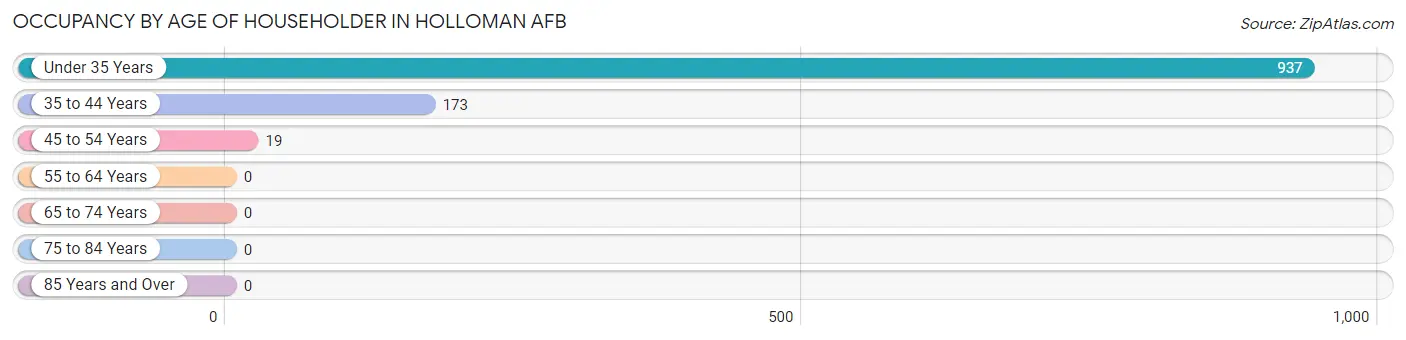
| Age Bracket | # Households | % Households |
| Under 35 Years | 937 | 83.0% |
| 35 to 44 Years | 173 | 15.3% |
| 45 to 54 Years | 19 | 1.7% |
| 55 to 64 Years | 0 | 0.0% |
| 65 to 74 Years | 0 | 0.0% |
| 75 to 84 Years | 0 | 0.0% |
| 85 Years and Over | 0 | 0.0% |
| Total | 1,129 | 100.0% |
Housing Finances in Holloman AFB
Median Income by Occupancy in Holloman AFB
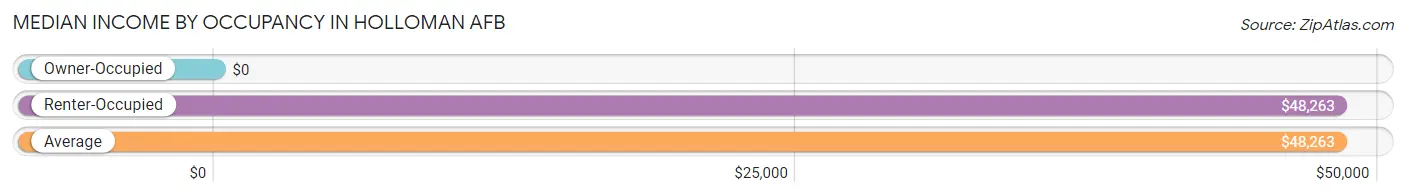
| Occupancy Type | # Households | Median Income |
| Owner-Occupied | 0 (0.0%) | $0 |
| Renter-Occupied | 1,129 (100.0%) | $48,263 |
| Average | 1,129 (100.0%) | $48,263 |
Occupancy by Householder Income Bracket in Holloman AFB
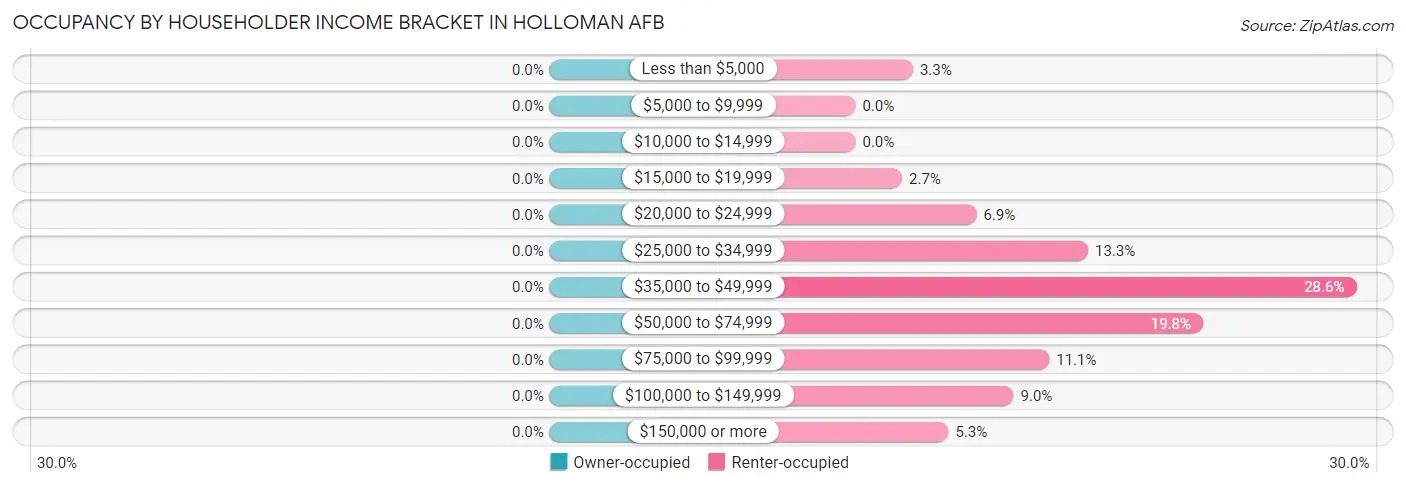
| Income Bracket | Owner-occupied | Renter-occupied |
| Less than $5,000 | 0 (0.0%) | 37 (3.3%) |
| $5,000 to $9,999 | 0 (0.0%) | 0 (0.0%) |
| $10,000 to $14,999 | 0 (0.0%) | 0 (0.0%) |
| $15,000 to $19,999 | 0 (0.0%) | 30 (2.7%) |
| $20,000 to $24,999 | 0 (0.0%) | 78 (6.9%) |
| $25,000 to $34,999 | 0 (0.0%) | 150 (13.3%) |
| $35,000 to $49,999 | 0 (0.0%) | 323 (28.6%) |
| $50,000 to $74,999 | 0 (0.0%) | 224 (19.8%) |
| $75,000 to $99,999 | 0 (0.0%) | 125 (11.1%) |
| $100,000 to $149,999 | 0 (0.0%) | 102 (9.0%) |
| $150,000 or more | 0 (0.0%) | 60 (5.3%) |
| Total | 0 (0.0%) | 1,129 (100.0%) |
Monthly Housing Cost Tiers in Holloman AFB
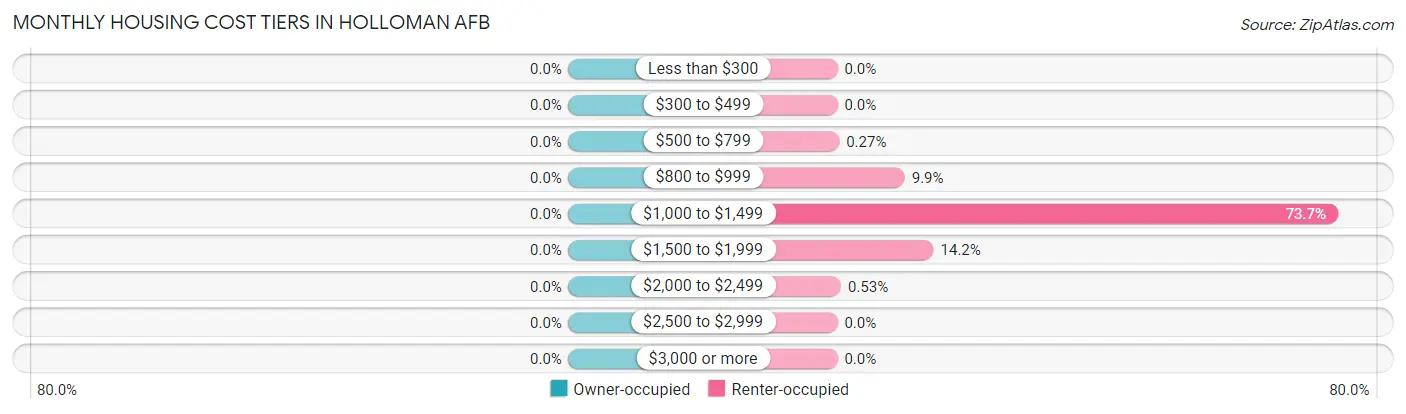
| Monthly Cost | Owner-occupied | Renter-occupied |
| Less than $300 | 0 (0.0%) | 0 (0.0%) |
| $300 to $499 | 0 (0.0%) | 0 (0.0%) |
| $500 to $799 | 0 (0.0%) | 3 (0.3%) |
| $800 to $999 | 0 (0.0%) | 112 (9.9%) |
| $1,000 to $1,499 | 0 (0.0%) | 832 (73.7%) |
| $1,500 to $1,999 | 0 (0.0%) | 160 (14.2%) |
| $2,000 to $2,499 | 0 (0.0%) | 6 (0.5%) |
| $2,500 to $2,999 | 0 (0.0%) | 0 (0.0%) |
| $3,000 or more | 0 (0.0%) | 0 (0.0%) |
| Total | 0 (0.0%) | 1,129 (100.0%) |
Physical Housing Characteristics in Holloman AFB
Housing Structures in Holloman AFB
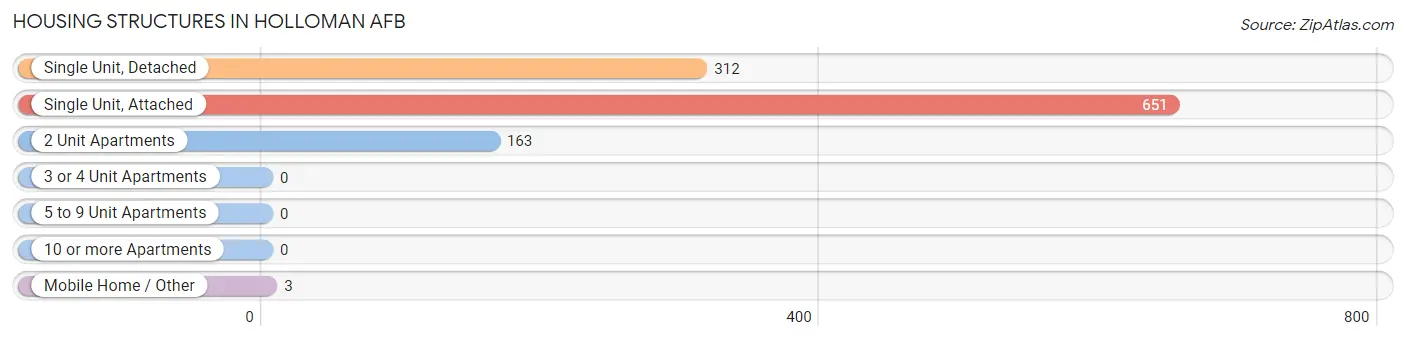
| Structure Type | # Housing Units | % Housing Units |
| Single Unit, Detached | 312 | 27.6% |
| Single Unit, Attached | 651 | 57.7% |
| 2 Unit Apartments | 163 | 14.4% |
| 3 or 4 Unit Apartments | 0 | 0.0% |
| 5 to 9 Unit Apartments | 0 | 0.0% |
| 10 or more Apartments | 0 | 0.0% |
| Mobile Home / Other | 3 | 0.3% |
| Total | 1,129 | 100.0% |
Housing Structures by Occupancy in Holloman AFB
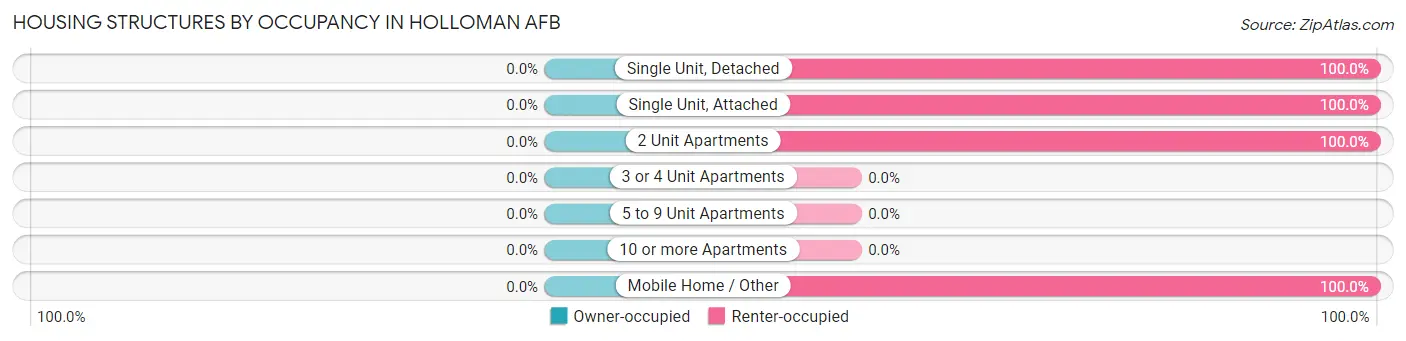
| Structure Type | Owner-occupied | Renter-occupied |
| Single Unit, Detached | 0 (0.0%) | 312 (100.0%) |
| Single Unit, Attached | 0 (0.0%) | 651 (100.0%) |
| 2 Unit Apartments | 0 (0.0%) | 163 (100.0%) |
| 3 or 4 Unit Apartments | 0 (0.0%) | 0 (0.0%) |
| 5 to 9 Unit Apartments | 0 (0.0%) | 0 (0.0%) |
| 10 or more Apartments | 0 (0.0%) | 0 (0.0%) |
| Mobile Home / Other | 0 (0.0%) | 3 (100.0%) |
| Total | 0 (0.0%) | 1,129 (100.0%) |
Housing Structures by Number of Rooms in Holloman AFB
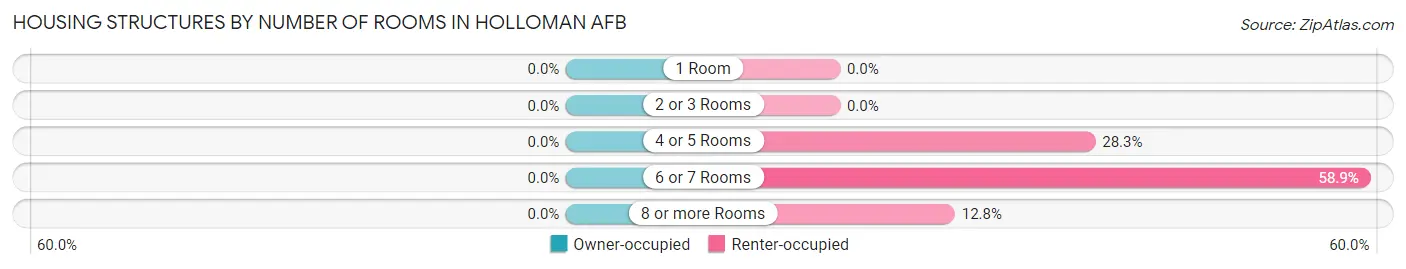
| Number of Rooms | Owner-occupied | Renter-occupied |
| 1 Room | 0 (0.0%) | 0 (0.0%) |
| 2 or 3 Rooms | 0 (0.0%) | 0 (0.0%) |
| 4 or 5 Rooms | 0 (0.0%) | 320 (28.3%) |
| 6 or 7 Rooms | 0 (0.0%) | 665 (58.9%) |
| 8 or more Rooms | 0 (0.0%) | 144 (12.8%) |
| Total | 0 (0.0%) | 1,129 (100.0%) |
Housing Structure by Heating Type in Holloman AFB
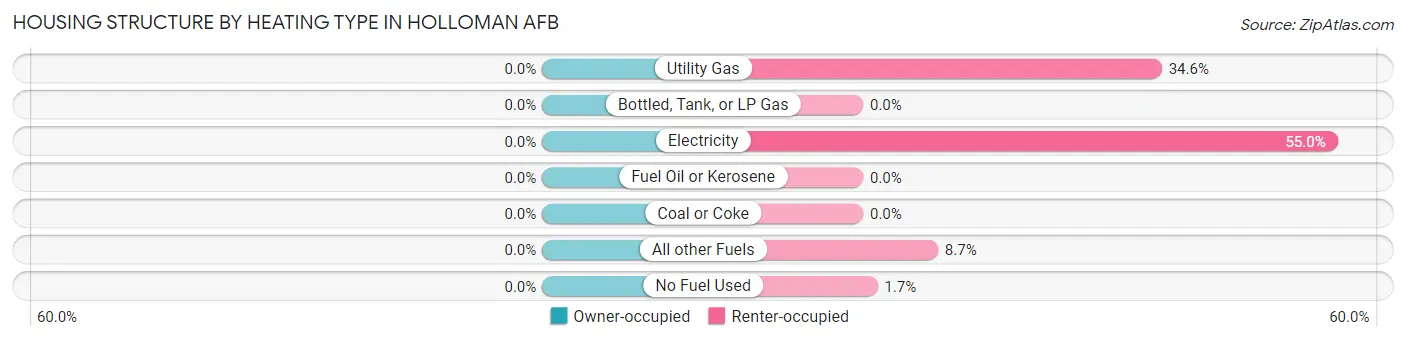
| Heating Type | Owner-occupied | Renter-occupied |
| Utility Gas | 0 (0.0%) | 391 (34.6%) |
| Bottled, Tank, or LP Gas | 0 (0.0%) | 0 (0.0%) |
| Electricity | 0 (0.0%) | 621 (55.0%) |
| Fuel Oil or Kerosene | 0 (0.0%) | 0 (0.0%) |
| Coal or Coke | 0 (0.0%) | 0 (0.0%) |
| All other Fuels | 0 (0.0%) | 98 (8.7%) |
| No Fuel Used | 0 (0.0%) | 19 (1.7%) |
| Total | 0 (0.0%) | 1,129 (100.0%) |
Household Vehicle Usage in Holloman AFB
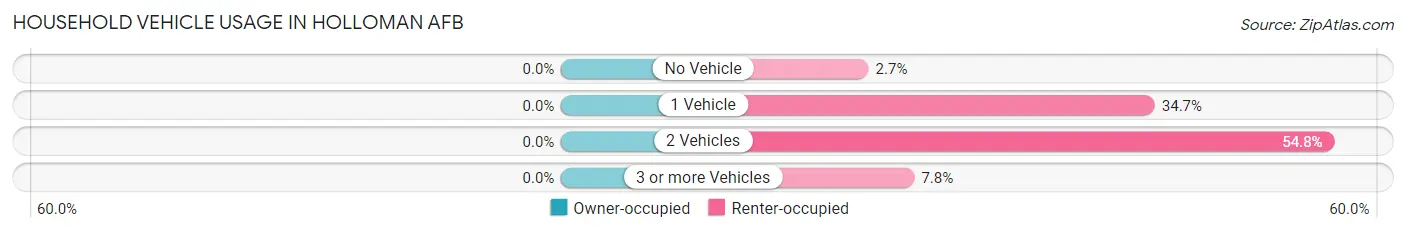
| Vehicles per Household | Owner-occupied | Renter-occupied |
| No Vehicle | 0 (0.0%) | 30 (2.7%) |
| 1 Vehicle | 0 (0.0%) | 392 (34.7%) |
| 2 Vehicles | 0 (0.0%) | 619 (54.8%) |
| 3 or more Vehicles | 0 (0.0%) | 88 (7.8%) |
| Total | 0 (0.0%) | 1,129 (100.0%) |
Real Estate & Mortgages in Holloman AFB
Real Estate and Mortgage Overview in Holloman AFB
| Characteristic | Without Mortgage | With Mortgage |
| Housing Units | 0 | 0 |
| Median Property Value | - | - |
| Median Household Income | - | - |
| Monthly Housing Costs | - | - |
| Real Estate Taxes | - | - |
Property Value by Mortgage Status in Holloman AFB
| Property Value | Without Mortgage | With Mortgage |
| Less than $50,000 | 0 (0.0%) | 0 (0.0%) |
| $50,000 to $99,999 | 0 (0.0%) | 0 (0.0%) |
| $100,000 to $299,999 | 0 (0.0%) | 0 (0.0%) |
| $300,000 to $499,999 | 0 (0.0%) | 0 (0.0%) |
| $500,000 to $749,999 | 0 (0.0%) | 0 (0.0%) |
| $750,000 to $999,999 | 0 (0.0%) | 0 (0.0%) |
| $1,000,000 or more | 0 (0.0%) | 0 (0.0%) |
| Total | 0 (0.0%) | 0 (0.0%) |
Household Income by Mortgage Status in Holloman AFB
| Household Income | Without Mortgage | With Mortgage |
| Less than $10,000 | 0 (0.0%) | 0 (0.0%) |
| $10,000 to $24,999 | 0 (0.0%) | 0 (0.0%) |
| $25,000 to $34,999 | 0 (0.0%) | 0 (0.0%) |
| $35,000 to $49,999 | 0 (0.0%) | 0 (0.0%) |
| $50,000 to $74,999 | 0 (0.0%) | 0 (0.0%) |
| $75,000 to $99,999 | 0 (0.0%) | 0 (0.0%) |
| $100,000 to $149,999 | 0 (0.0%) | 0 (0.0%) |
| $150,000 or more | 0 (0.0%) | 0 (0.0%) |
| Total | 0 (0.0%) | 0 (0.0%) |
Property Value to Household Income Ratio in Holloman AFB
| Value-to-Income Ratio | Without Mortgage | With Mortgage |
| Less than 2.0x | 0 (0.0%) | 0 (0.0%) |
| 2.0x to 2.9x | 0 (0.0%) | 0 (0.0%) |
| 3.0x to 3.9x | 0 (0.0%) | 0 (0.0%) |
| 4.0x or more | 0 (0.0%) | 0 (0.0%) |
| Total | 0 (0.0%) | 0 (0.0%) |
Real Estate Taxes by Mortgage Status in Holloman AFB
| Property Taxes | Without Mortgage | With Mortgage |
| Less than $800 | 0 (0.0%) | 0 (0.0%) |
| $800 to $1,499 | 0 (0.0%) | 0 (0.0%) |
| $800 to $1,499 | 0 (0.0%) | 0 (0.0%) |
| Total | 0 (0.0%) | 0 (0.0%) |
Health & Disability in Holloman AFB
Health Insurance Coverage by Age in Holloman AFB
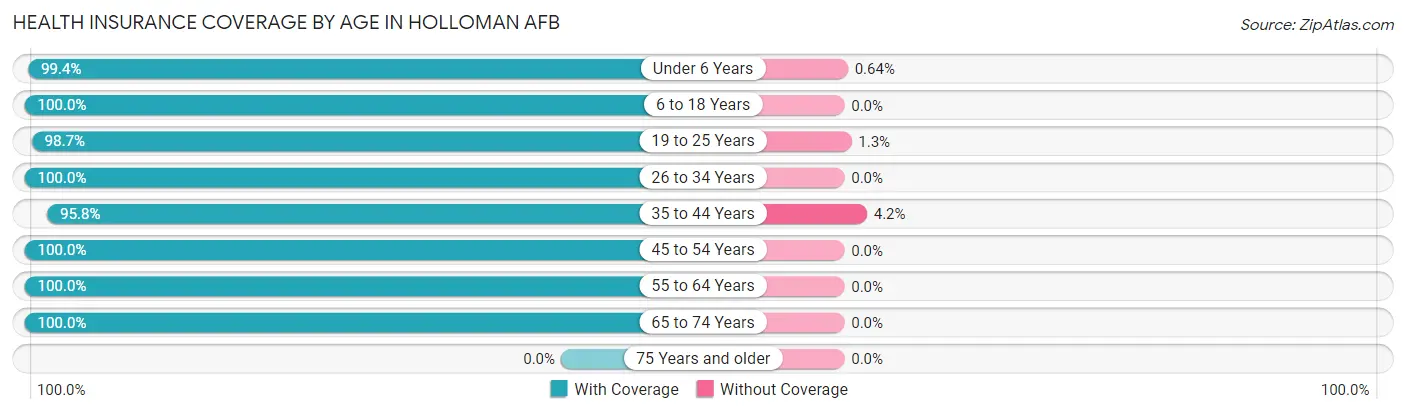
| Age Bracket | With Coverage | Without Coverage |
| Under 6 Years | 775 (99.4%) | 5 (0.6%) |
| 6 to 18 Years | 473 (100.0%) | 0 (0.0%) |
| 19 to 25 Years | 299 (98.7%) | 4 (1.3%) |
| 26 to 34 Years | 380 (100.0%) | 0 (0.0%) |
| 35 to 44 Years | 160 (95.8%) | 7 (4.2%) |
| 45 to 54 Years | 49 (100.0%) | 0 (0.0%) |
| 55 to 64 Years | 24 (100.0%) | 0 (0.0%) |
| 65 to 74 Years | 15 (100.0%) | 0 (0.0%) |
| 75 Years and older | 0 (0.0%) | 0 (0.0%) |
| Total | 2,175 (99.3%) | 16 (0.7%) |
Health Insurance Coverage by Citizenship Status in Holloman AFB
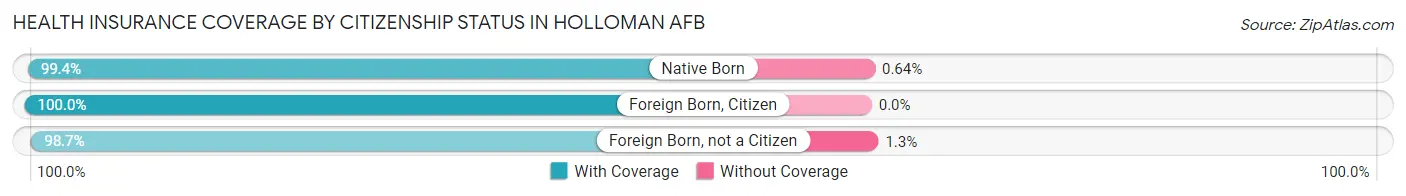
| Citizenship Status | With Coverage | Without Coverage |
| Native Born | 775 (99.4%) | 5 (0.6%) |
| Foreign Born, Citizen | 473 (100.0%) | 0 (0.0%) |
| Foreign Born, not a Citizen | 299 (98.7%) | 4 (1.3%) |
Health Insurance Coverage by Household Income in Holloman AFB
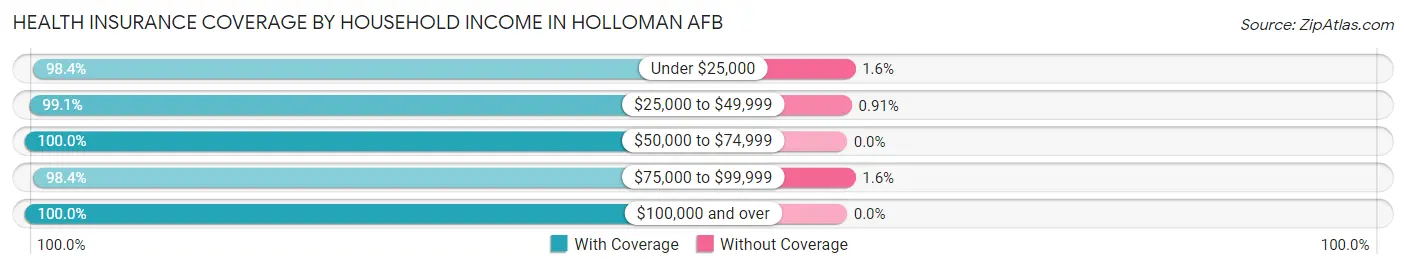
| Household Income | With Coverage | Without Coverage |
| Under $25,000 | 313 (98.4%) | 5 (1.6%) |
| $25,000 to $49,999 | 763 (99.1%) | 7 (0.9%) |
| $50,000 to $74,999 | 425 (100.0%) | 0 (0.0%) |
| $75,000 to $99,999 | 244 (98.4%) | 4 (1.6%) |
| $100,000 and over | 430 (100.0%) | 0 (0.0%) |
Public vs Private Health Insurance Coverage by Age in Holloman AFB
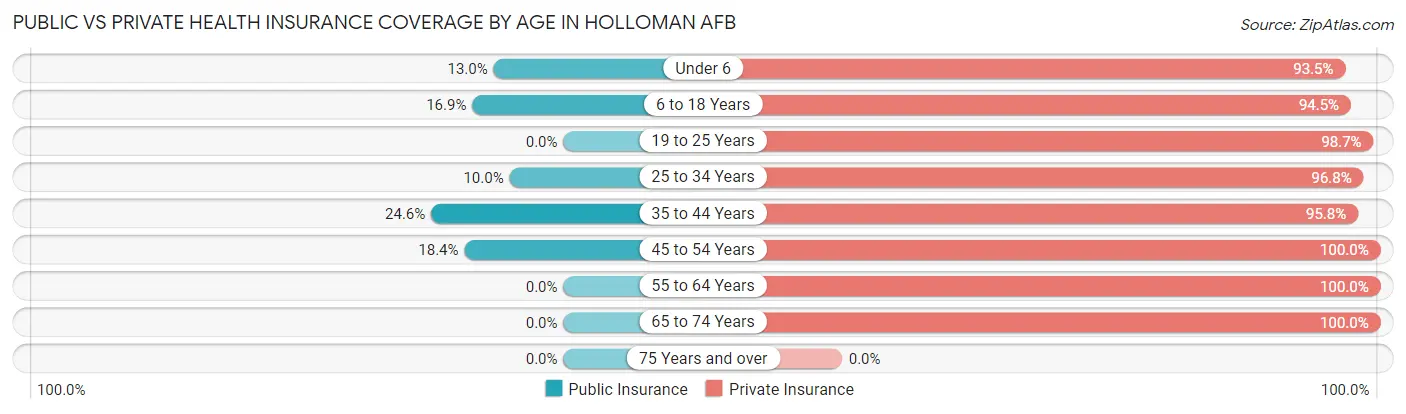
| Age Bracket | Public Insurance | Private Insurance |
| Under 6 | 101 (13.0%) | 729 (93.5%) |
| 6 to 18 Years | 80 (16.9%) | 447 (94.5%) |
| 19 to 25 Years | 0 (0.0%) | 299 (98.7%) |
| 25 to 34 Years | 38 (10.0%) | 368 (96.8%) |
| 35 to 44 Years | 41 (24.5%) | 160 (95.8%) |
| 45 to 54 Years | 9 (18.4%) | 49 (100.0%) |
| 55 to 64 Years | 0 (0.0%) | 24 (100.0%) |
| 65 to 74 Years | 0 (0.0%) | 15 (100.0%) |
| 75 Years and over | 0 (0.0%) | 0 (0.0%) |
| Total | 269 (12.3%) | 2,091 (95.4%) |
Disability Status by Sex by Age in Holloman AFB
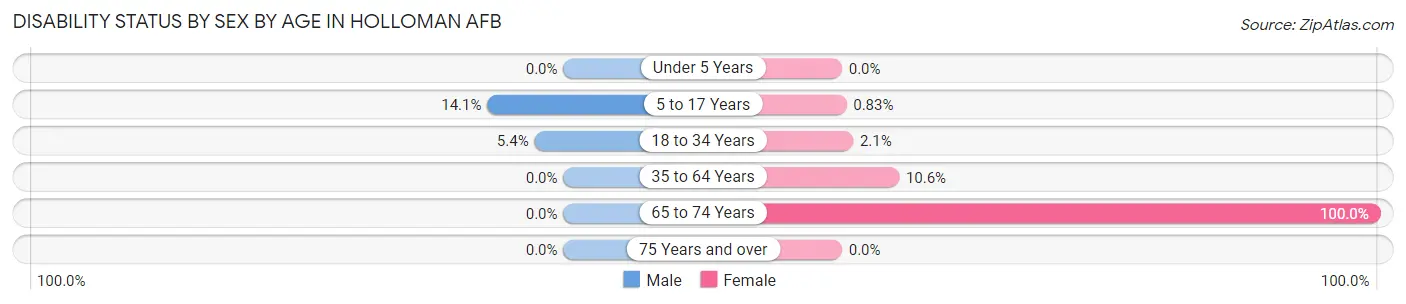
| Age Bracket | Male | Female |
| Under 5 Years | 0 (0.0%) | 0 (0.0%) |
| 5 to 17 Years | 49 (14.1%) | 2 (0.8%) |
| 18 to 34 Years | 9 (5.4%) | 11 (2.1%) |
| 35 to 64 Years | 0 (0.0%) | 19 (10.6%) |
| 65 to 74 Years | 0 (0.0%) | 15 (100.0%) |
| 75 Years and over | 0 (0.0%) | 0 (0.0%) |
Disability Class by Sex by Age in Holloman AFB
Disability Class: Hearing Difficulty
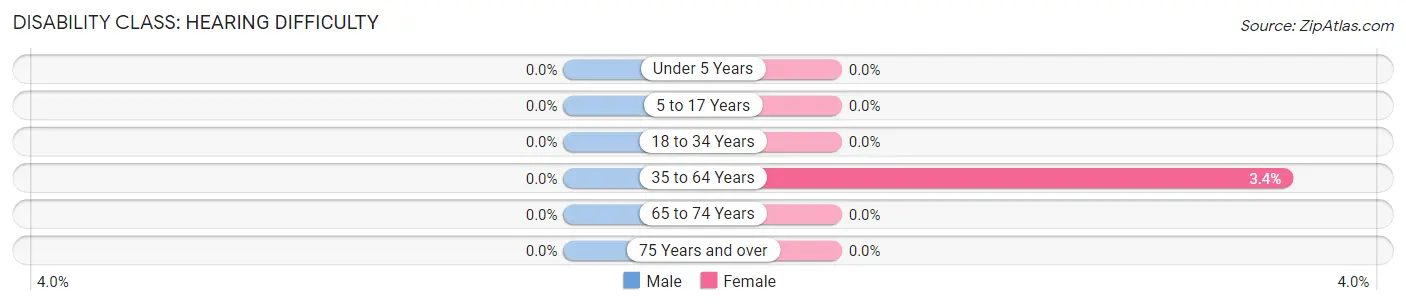
| Age Bracket | Male | Female |
| Under 5 Years | 0 (0.0%) | 0 (0.0%) |
| 5 to 17 Years | 0 (0.0%) | 0 (0.0%) |
| 18 to 34 Years | 0 (0.0%) | 0 (0.0%) |
| 35 to 64 Years | 0 (0.0%) | 6 (3.4%) |
| 65 to 74 Years | 0 (0.0%) | 0 (0.0%) |
| 75 Years and over | 0 (0.0%) | 0 (0.0%) |
Disability Class: Vision Difficulty
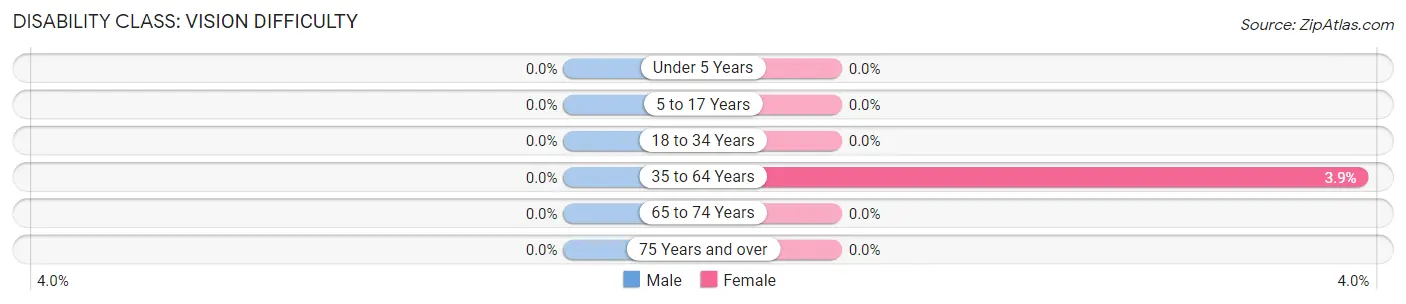
| Age Bracket | Male | Female |
| Under 5 Years | 0 (0.0%) | 0 (0.0%) |
| 5 to 17 Years | 0 (0.0%) | 0 (0.0%) |
| 18 to 34 Years | 0 (0.0%) | 0 (0.0%) |
| 35 to 64 Years | 0 (0.0%) | 7 (3.9%) |
| 65 to 74 Years | 0 (0.0%) | 0 (0.0%) |
| 75 Years and over | 0 (0.0%) | 0 (0.0%) |
Disability Class: Cognitive Difficulty
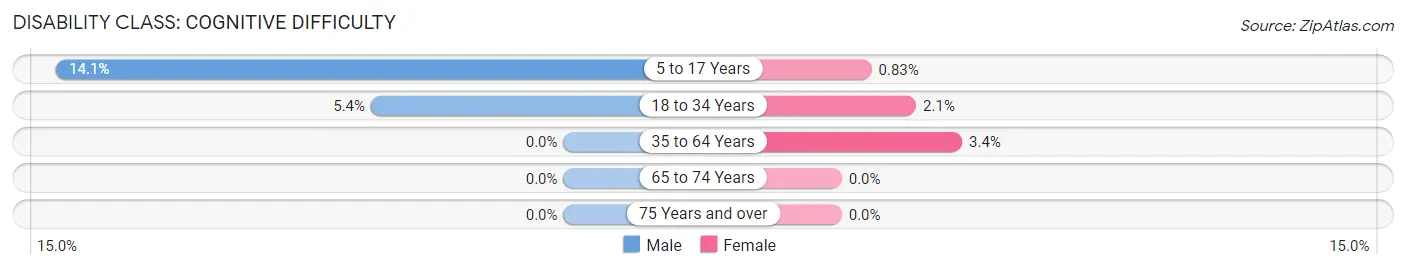
| Age Bracket | Male | Female |
| 5 to 17 Years | 49 (14.1%) | 2 (0.8%) |
| 18 to 34 Years | 9 (5.4%) | 11 (2.1%) |
| 35 to 64 Years | 0 (0.0%) | 6 (3.4%) |
| 65 to 74 Years | 0 (0.0%) | 0 (0.0%) |
| 75 Years and over | 0 (0.0%) | 0 (0.0%) |
Disability Class: Ambulatory Difficulty
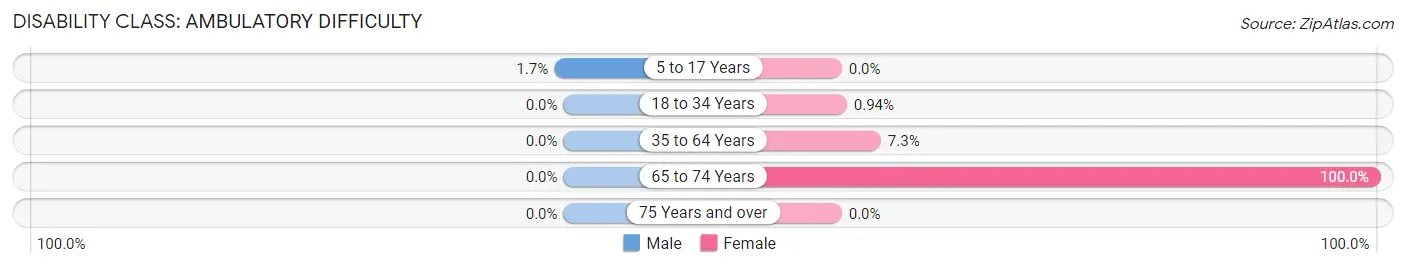
| Age Bracket | Male | Female |
| 5 to 17 Years | 6 (1.7%) | 0 (0.0%) |
| 18 to 34 Years | 0 (0.0%) | 5 (0.9%) |
| 35 to 64 Years | 0 (0.0%) | 13 (7.3%) |
| 65 to 74 Years | 0 (0.0%) | 15 (100.0%) |
| 75 Years and over | 0 (0.0%) | 0 (0.0%) |
Disability Class: Self-Care Difficulty
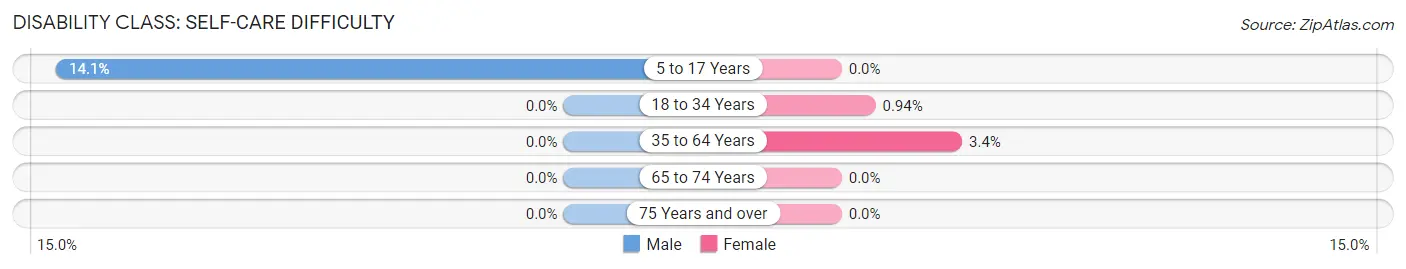
| Age Bracket | Male | Female |
| 5 to 17 Years | 49 (14.1%) | 0 (0.0%) |
| 18 to 34 Years | 0 (0.0%) | 5 (0.9%) |
| 35 to 64 Years | 0 (0.0%) | 6 (3.4%) |
| 65 to 74 Years | 0 (0.0%) | 0 (0.0%) |
| 75 Years and over | 0 (0.0%) | 0 (0.0%) |
Technology Access in Holloman AFB
Computing Device Access in Holloman AFB
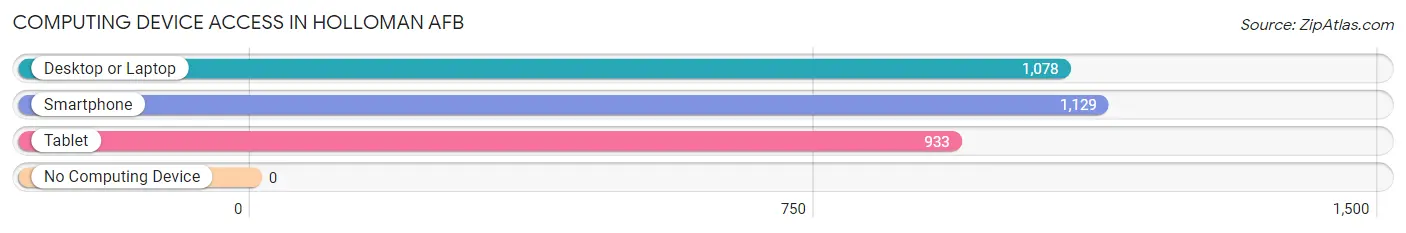
| Device Type | # Households | % Households |
| Desktop or Laptop | 1,078 | 95.5% |
| Smartphone | 1,129 | 100.0% |
| Tablet | 933 | 82.6% |
| No Computing Device | 0 | 0.0% |
| Total | 1,129 | 100.0% |
Internet Access in Holloman AFB
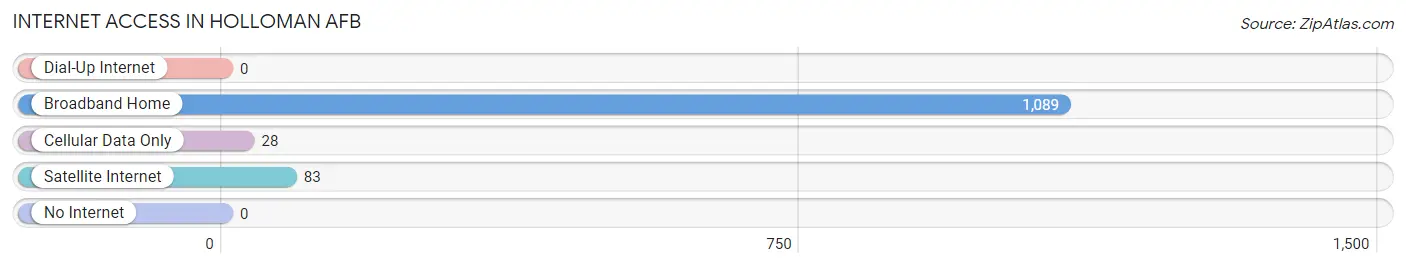
| Internet Type | # Households | % Households |
| Dial-Up Internet | 0 | 0.0% |
| Broadband Home | 1,089 | 96.5% |
| Cellular Data Only | 28 | 2.5% |
| Satellite Internet | 83 | 7.3% |
| No Internet | 0 | 0.0% |
| Total | 1,129 | 100.0% |
Holloman AFB Summary
Holloman Air Force Base (HAFB) is located in Alamogordo, New Mexico, and is home to the 49th Wing of the Air Combat Command. The base was established in 1942 and is named after Col. George V. Holloman, a pioneer in the development of guided missiles and rocket technology. HAFB is located in the Tularosa Basin of the Chihuahuan Desert, and is surrounded by the Sacramento Mountains to the east and the San Andres Mountains to the west. The base covers approximately 59,000 acres and is home to over 5,000 military personnel and their families.
History
Holloman Air Force Base was established in 1942 as Alamogordo Army Air Field. The base was initially used as a training facility for B-17 and B-24 bomber crews during World War II. In 1947, the base was renamed Holloman Air Force Base in honor of Col. George V. Holloman, a pioneer in the development of guided missiles and rocket technology.
In the 1950s, the base was used as a testing facility for the development of the first supersonic aircraft, the F-100 Super Sabre. In the 1960s, the base was used to test the F-4 Phantom II and the F-111 Aardvark. In the 1970s, the base was used to test the F-15 Eagle and the F-16 Fighting Falcon.
In the 1980s, the base was used to test the B-1B Lancer and the B-2 Spirit. In the 1990s, the base was used to test the F-22 Raptor and the F-35 Lightning II.
Geography
Holloman Air Force Base is located in the Tularosa Basin of the Chihuahuan Desert in Otero County, New Mexico. The base is surrounded by the Sacramento Mountains to the east and the San Andres Mountains to the west. The base covers approximately 59,000 acres and is home to over 5,000 military personnel and their families.
The climate in the area is semi-arid, with hot summers and mild winters. The average annual temperature is 64°F, with an average high of 90°F in the summer and an average low of 37°F in the winter. The average annual precipitation is 8.5 inches, with most of the precipitation occurring in the summer months.
Economy
Holloman Air Force Base is a major economic driver for the region. The base has an annual economic impact of over $1 billion, and provides over 10,000 jobs in the local area. The base is home to over 5,000 military personnel and their families, and is the largest employer in Otero County.
The base also serves as a major hub for the aerospace industry in the region. The base is home to the Air Force Research Laboratory, which is responsible for the development of new aerospace technologies. The base also serves as a testing facility for new aircraft and weapons systems.
Demographics
As of 2019, the population of Holloman Air Force Base was 5,845. The racial makeup of the base was 73.3% White, 11.2% Hispanic or Latino, 8.2% African American, 4.2% Asian, and 3.1% other. The median age of the population was 28.7 years.
The median household income of the base was $50,945, and the median family income was $60,945. The per capita income of the base was $25,945. The poverty rate of the base was 8.2%.
Conclusion
Holloman Air Force Base is a major economic driver for the region, providing over 10,000 jobs and an annual economic impact of over $1 billion. The base is home to over 5,000 military personnel and their families, and is the largest employer in Otero County. The base is also a major hub for the aerospace industry in the region, and serves as a testing facility for new aircraft and weapons systems. The population of the base is diverse, with a median age of 28.7 years and a median household income of $50,945.
Common Questions
What is Per Capita Income in Holloman AFB?
Per Capita income in Holloman AFB is $23,704.
What is the Median Family Income in Holloman AFB?
Median Family Income in Holloman AFB is $52,750.
What is the Median Household income in Holloman AFB?
Median Household Income in Holloman AFB is $48,263.
What is Income or Wage Gap in Holloman AFB?
Income or Wage Gap in Holloman AFB is 15.3%.
Women in Holloman AFB earn 84.7 cents for every dollar earned by a man.
What is Inequality or Gini Index in Holloman AFB?
Inequality or Gini Index in Holloman AFB is 0.36.
What is the Total Population of Holloman AFB?
Total Population of Holloman AFB is 4,182.
What is the Total Male Population of Holloman AFB?
Total Male Population of Holloman AFB is 2,668.
What is the Total Female Population of Holloman AFB?
Total Female Population of Holloman AFB is 1,514.
What is the Ratio of Males per 100 Females in Holloman AFB?
There are 176.22 Males per 100 Females in Holloman AFB.
What is the Ratio of Females per 100 Males in Holloman AFB?
There are 56.75 Females per 100 Males in Holloman AFB.
What is the Median Population Age in Holloman AFB?
Median Population Age in Holloman AFB is 22.0 Years.
What is the Average Family Size in Holloman AFB
Average Family Size in Holloman AFB is 3.5 People.
What is the Average Household Size in Holloman AFB
Average Household Size in Holloman AFB is 2.8 People.
How Large is the Labor Force in Holloman AFB?
There are 2,522 People in the Labor Forcein in Holloman AFB.
What is the Percentage of People in the Labor Force in Holloman AFB?
84.7% of People are in the Labor Force in Holloman AFB.
What is the Unemployment Rate in Holloman AFB?
Unemployment Rate in Holloman AFB is 6.0%.