Zip Codes with the Highest Percentage of Population Employed in Security & Protection in Farmington, NM
RELATED REPORTS & OPTIONS
Security & Protection
Farmington
Compare Zip Codes
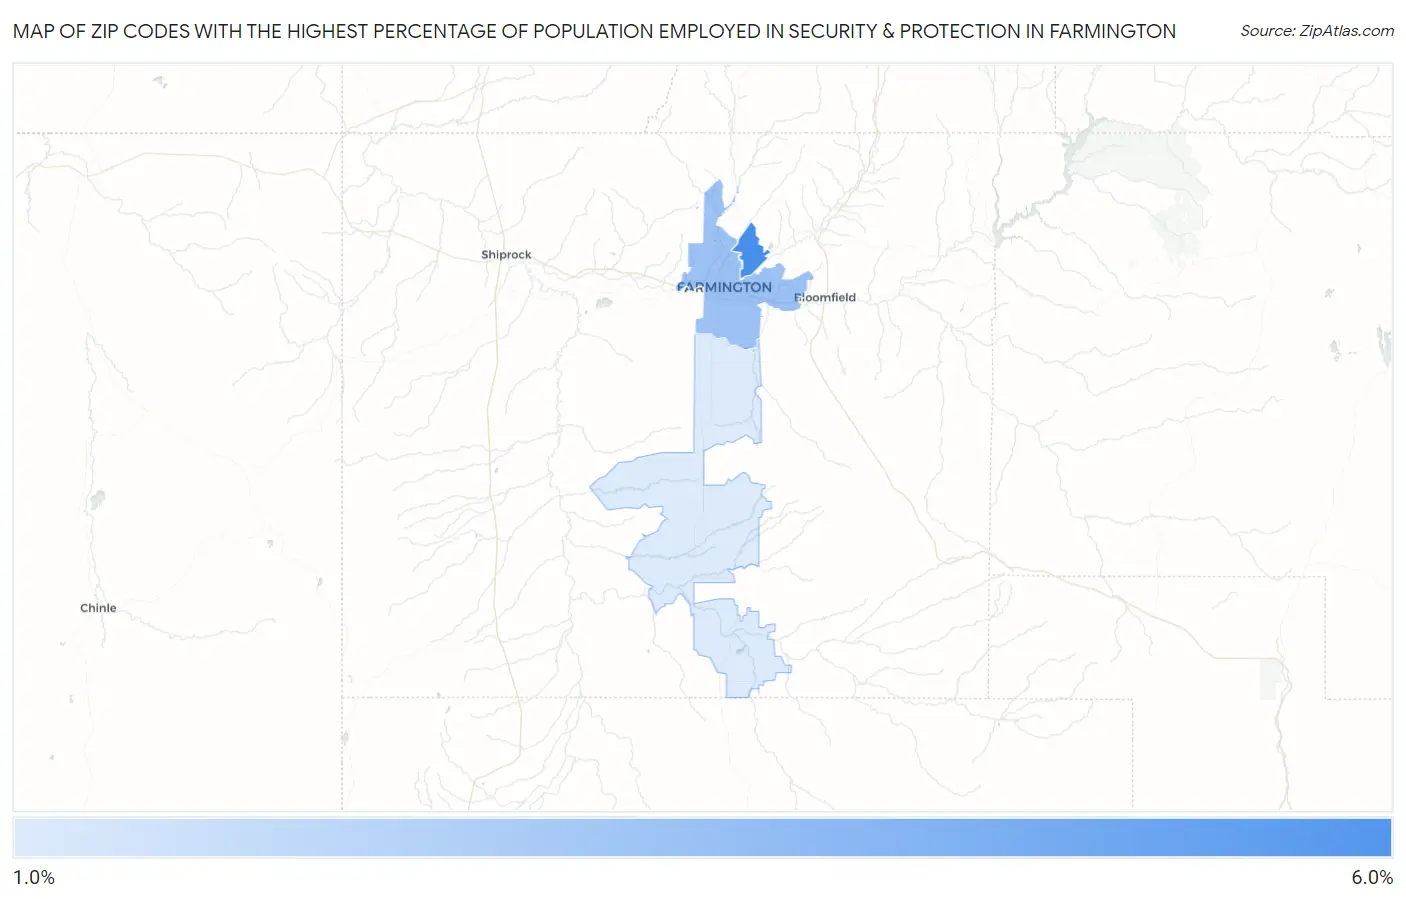
Map of Zip Codes with the Highest Percentage of Population Employed in Security & Protection in Farmington
1.4%
5.6%
Zip Codes with the Highest Percentage of Population Employed in Security & Protection in Farmington, NM
| Zip Code | % Employed | vs State | vs National | |
| 1. | 87402 | 5.6% | 2.8%(+2.84)#46 | 2.1%(+3.45)#2,370 |
| 2. | 87401 | 3.2% | 2.8%(+0.398)#93 | 2.1%(+1.01)#6,662 |
| 3. | 87499 | 1.4% | 2.8%(-1.38)#162 | 2.1%(-0.769)#17,103 |
1
Common Questions
What are the Top Zip Codes with the Highest Percentage of Population Employed in Security & Protection in Farmington, NM?
Top Zip Codes with the Highest Percentage of Population Employed in Security & Protection in Farmington, NM are:
What zip code has the Highest Percentage of Population Employed in Security & Protection in Farmington, NM?
87402 has the Highest Percentage of Population Employed in Security & Protection in Farmington, NM with 5.6%.
What is the Percentage of Population Employed in Security & Protection in Farmington, NM?
Percentage of Population Employed in Security & Protection in Farmington is 3.8%.
What is the Percentage of Population Employed in Security & Protection in New Mexico?
Percentage of Population Employed in Security & Protection in New Mexico is 2.8%.
What is the Percentage of Population Employed in Security & Protection in the United States?
Percentage of Population Employed in Security & Protection in the United States is 2.1%.