Black Rock, NM Map & Demographics
Black Rock Map
Black Rock Overview
$14,885
PER CAPITA INCOME
$37,115
AVG FAMILY INCOME
$45,714
AVG HOUSEHOLD INCOME
1.4%
WAGE / INCOME GAP [ % ]
98.6¢/ $1
WAGE / INCOME GAP [ $ ]
$11,220
FAMILY INCOME DEFICIT
0.44
INEQUALITY / GINI INDEX
1,259
TOTAL POPULATION
587
MALE POPULATION
672
FEMALE POPULATION
87.35
MALES / 100 FEMALES
114.48
FEMALES / 100 MALES
27.4
MEDIAN AGE
4.3
AVG FAMILY SIZE
4.2
AVG HOUSEHOLD SIZE
517
LABOR FORCE [ PEOPLE ]
57.8%
PERCENT IN LABOR FORCE
11.4%
UNEMPLOYMENT RATE
Income in Black Rock
Income Overview in Black Rock
Per Capita Income in Black Rock is $14,885, while median incomes of families and households are $37,115 and $45,714 respectively.
| Characteristic | Number | Measure |
| Per Capita Income | 1,259 | $14,885 |
| Median Family Income | 274 | $37,115 |
| Mean Family Income | 274 | $51,900 |
| Median Household Income | 296 | $45,714 |
| Mean Household Income | 296 | $54,057 |
| Income Deficit | 274 | $11,220 |
| Wage / Income Gap (%) | 1,259 | 1.39% |
| Wage / Income Gap ($) | 1,259 | 98.61¢ per $1 |
| Gini / Inequality Index | 1,259 | 0.44 |
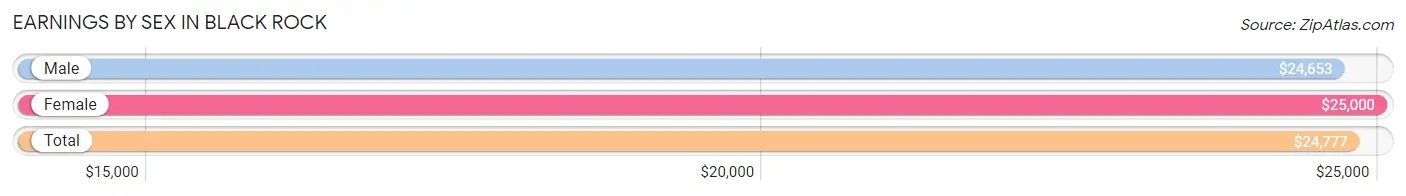
Earnings by Sex in Black Rock
Average Earnings in Black Rock are $24,777, $24,653 for men and $25,000 for women, a difference of 1.4%.
| Sex | Number | Average Earnings |
| Male | 228 (45.2%) | $24,653 |
| Female | 276 (54.8%) | $25,000 |
| Total | 504 (100.0%) | $24,777 |
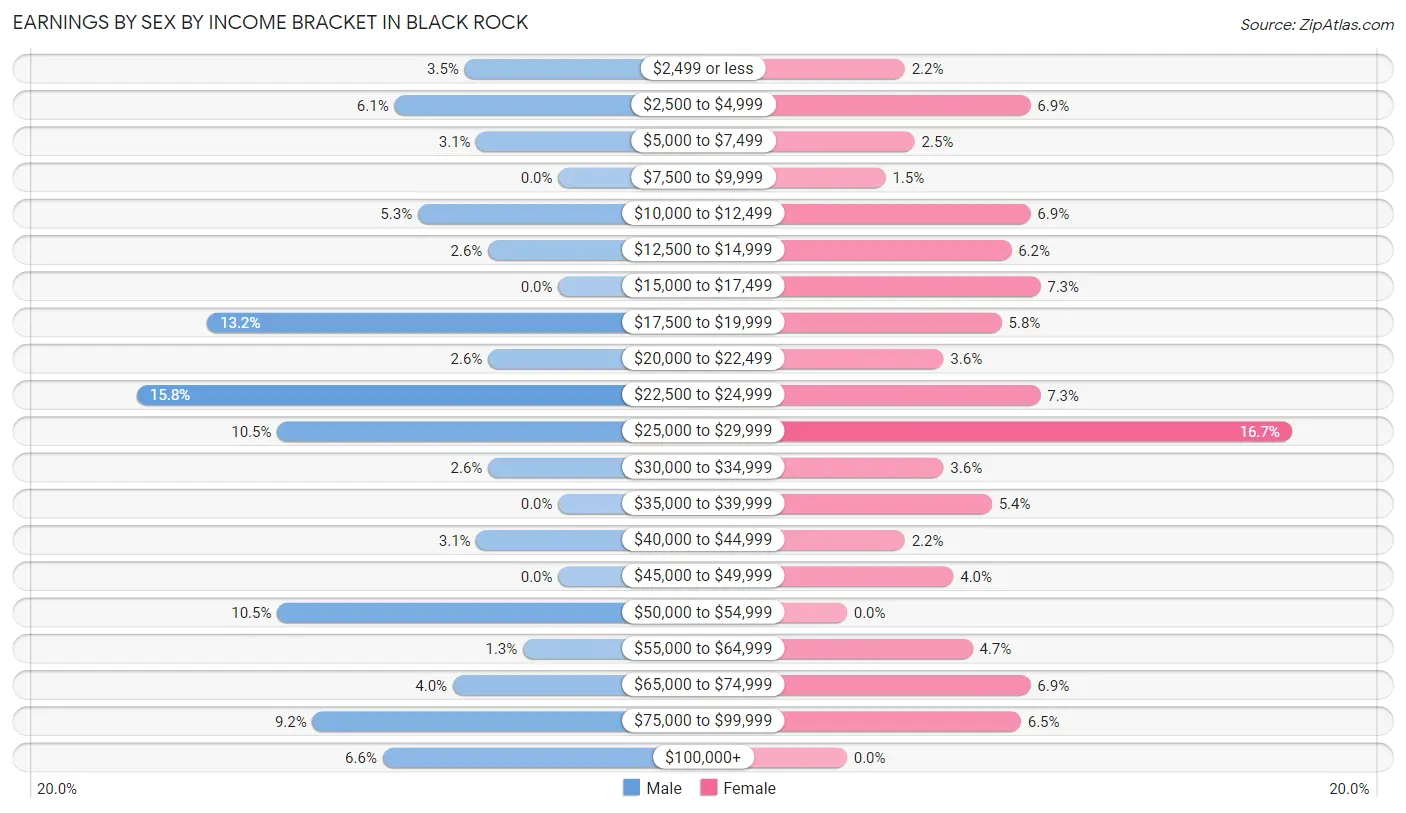
Earnings by Sex by Income Bracket in Black Rock
The most common earnings brackets in Black Rock are $22,500 to $24,999 for men (36 | 15.8%) and $25,000 to $29,999 for women (46 | 16.7%).
| Income | Male | Female |
| $2,499 or less | 8 (3.5%) | 6 (2.2%) |
| $2,500 to $4,999 | 14 (6.1%) | 19 (6.9%) |
| $5,000 to $7,499 | 7 (3.1%) | 7 (2.5%) |
| $7,500 to $9,999 | 0 (0.0%) | 4 (1.5%) |
| $10,000 to $12,499 | 12 (5.3%) | 19 (6.9%) |
| $12,500 to $14,999 | 6 (2.6%) | 17 (6.2%) |
| $15,000 to $17,499 | 0 (0.0%) | 20 (7.2%) |
| $17,500 to $19,999 | 30 (13.2%) | 16 (5.8%) |
| $20,000 to $22,499 | 6 (2.6%) | 10 (3.6%) |
| $22,500 to $24,999 | 36 (15.8%) | 20 (7.2%) |
| $25,000 to $29,999 | 24 (10.5%) | 46 (16.7%) |
| $30,000 to $34,999 | 6 (2.6%) | 10 (3.6%) |
| $35,000 to $39,999 | 0 (0.0%) | 15 (5.4%) |
| $40,000 to $44,999 | 7 (3.1%) | 6 (2.2%) |
| $45,000 to $49,999 | 0 (0.0%) | 11 (4.0%) |
| $50,000 to $54,999 | 24 (10.5%) | 0 (0.0%) |
| $55,000 to $64,999 | 3 (1.3%) | 13 (4.7%) |
| $65,000 to $74,999 | 9 (4.0%) | 19 (6.9%) |
| $75,000 to $99,999 | 21 (9.2%) | 18 (6.5%) |
| $100,000+ | 15 (6.6%) | 0 (0.0%) |
| Total | 228 (100.0%) | 276 (100.0%) |
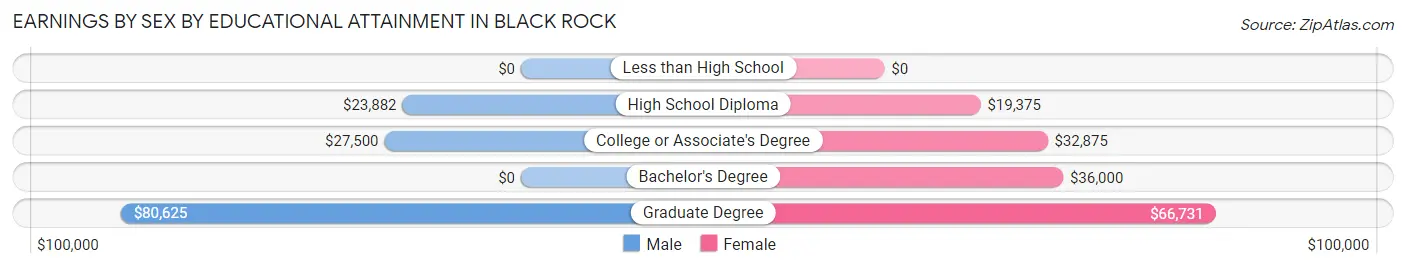
Earnings by Sex by Educational Attainment in Black Rock
Average earnings in Black Rock are $28,750 for men and $28,631 for women, a difference of 0.4%. Men with an educational attainment of graduate degree enjoy the highest average annual earnings of $80,625, while those with high school diploma education earn the least with $23,882. Women with an educational attainment of graduate degree earn the most with the average annual earnings of $66,731, while those with high school diploma education have the smallest earnings of $19,375.
| Educational Attainment | Male Income | Female Income |
| Less than High School | - | - |
| High School Diploma | $23,882 | $19,375 |
| College or Associate's Degree | $27,500 | $32,875 |
| Bachelor's Degree | - | - |
| Graduate Degree | $80,625 | $66,731 |
| Total | $28,750 | $28,631 |
Family Income in Black Rock
Family Income Brackets in Black Rock
According to the Black Rock family income data, there are 47 families falling into the less than $10,000 income range, which is the most common income bracket and makes up 17.2% of all families.
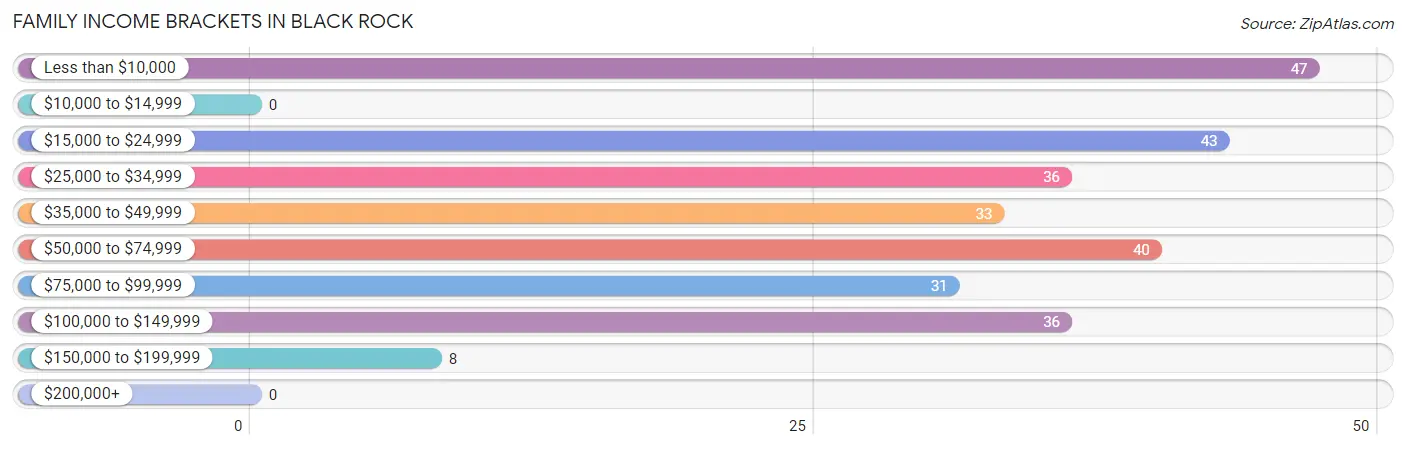
| Income Bracket | # Families | % Families |
| Less than $10,000 | 47 | 17.2% |
| $10,000 to $14,999 | 0 | 0.0% |
| $15,000 to $24,999 | 43 | 15.7% |
| $25,000 to $34,999 | 36 | 13.1% |
| $35,000 to $49,999 | 33 | 12.0% |
| $50,000 to $74,999 | 40 | 14.6% |
| $75,000 to $99,999 | 31 | 11.3% |
| $100,000 to $149,999 | 36 | 13.1% |
| $150,000 to $199,999 | 8 | 2.9% |
| $200,000+ | 0 | 0.0% |
Family Income by Famaliy Size in Black Rock
6-person families (16 | 5.8%) account for the highest median family income in Black Rock with $66,667 per family, while 3-person families (55 | 20.1%) have the highest median income of $15,298 per family member.
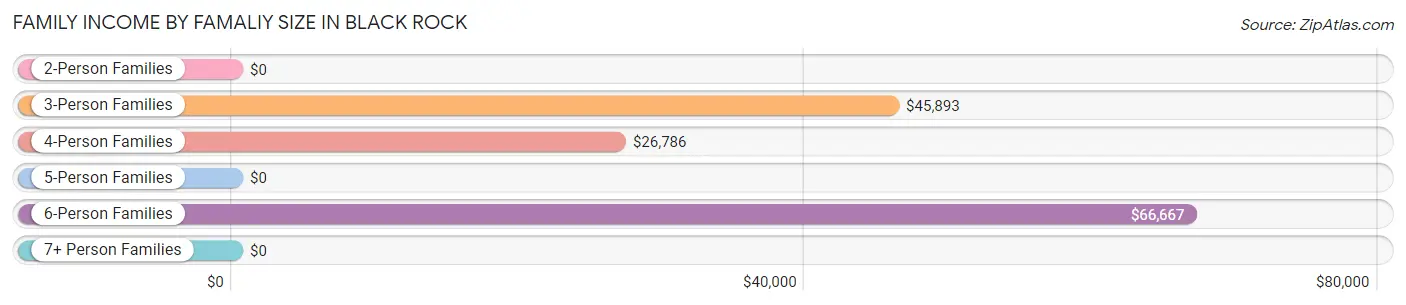
| Income Bracket | # Families | Median Income |
| 2-Person Families | 79 (28.8%) | $0 |
| 3-Person Families | 55 (20.1%) | $45,893 |
| 4-Person Families | 68 (24.8%) | $26,786 |
| 5-Person Families | 47 (17.2%) | $0 |
| 6-Person Families | 16 (5.8%) | $66,667 |
| 7+ Person Families | 9 (3.3%) | $0 |
| Total | 274 (100.0%) | $37,115 |
Family Income by Number of Earners in Black Rock
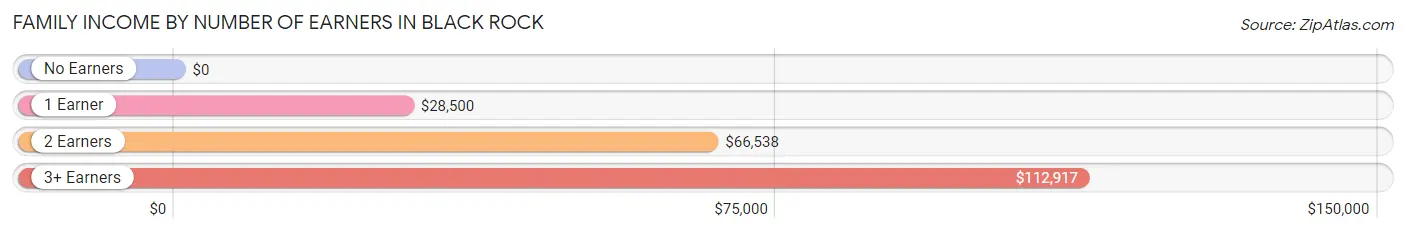
| Number of Earners | # Families | Median Income |
| No Earners | 46 (16.8%) | $0 |
| 1 Earner | 128 (46.7%) | $28,500 |
| 2 Earners | 72 (26.3%) | $66,538 |
| 3+ Earners | 28 (10.2%) | $112,917 |
| Total | 274 (100.0%) | $37,115 |
Household Income in Black Rock
Household Income Brackets in Black Rock
With 51 households falling in the category, the $75,000 to $99,999 income range is the most frequent in Black Rock, accounting for 17.2% of all households.
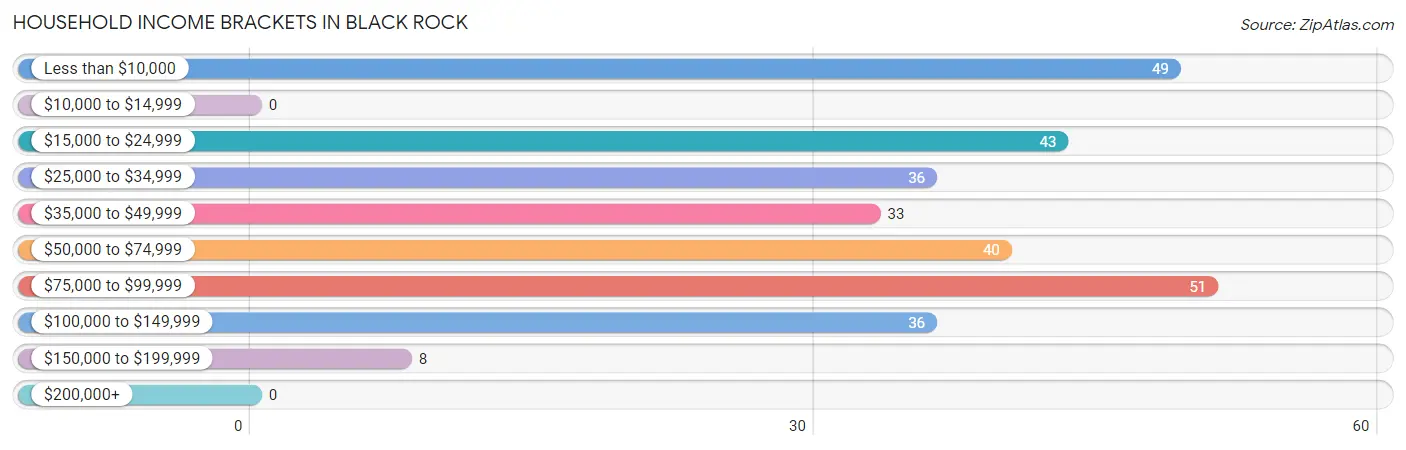
| Income Bracket | # Households | % Households |
| Less than $10,000 | 49 | 16.6% |
| $10,000 to $14,999 | 0 | 0.0% |
| $15,000 to $24,999 | 43 | 14.5% |
| $25,000 to $34,999 | 36 | 12.2% |
| $35,000 to $49,999 | 33 | 11.1% |
| $50,000 to $74,999 | 40 | 13.5% |
| $75,000 to $99,999 | 51 | 17.2% |
| $100,000 to $149,999 | 36 | 12.2% |
| $150,000 to $199,999 | 8 | 2.7% |
| $200,000+ | 0 | 0.0% |
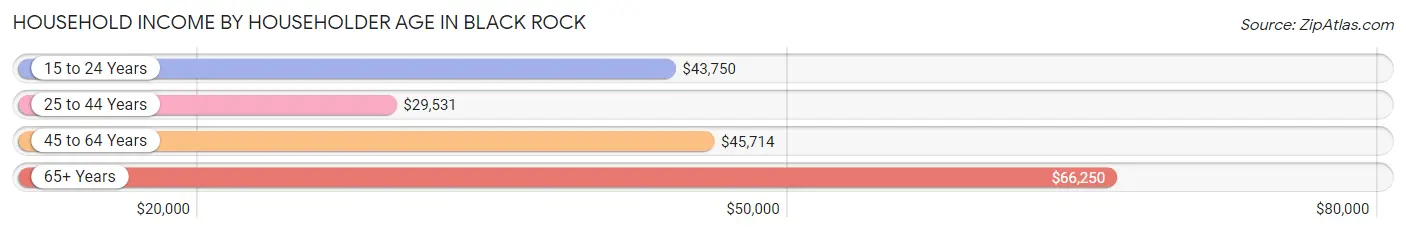
Household Income by Householder Age in Black Rock
The median household income in Black Rock is $45,714, with the highest median household income of $66,250 found in the 65+ years age bracket for the primary householder. A total of 38 households (12.8%) fall into this category. Meanwhile, the 25 to 44 years age bracket for the primary householder has the lowest median household income of $29,531, with 123 households (41.5%) in this group.
| Income Bracket | # Households | Median Income |
| 15 to 24 Years | 19 (6.4%) | $43,750 |
| 25 to 44 Years | 123 (41.5%) | $29,531 |
| 45 to 64 Years | 116 (39.2%) | $45,714 |
| 65+ Years | 38 (12.8%) | $66,250 |
| Total | 296 (100.0%) | $45,714 |
Poverty in Black Rock
Income Below Poverty by Sex and Age in Black Rock
With 37.0% poverty level for males and 39.3% for females among the residents of Black Rock, 16 and 17 year old males and 6 to 11 year old females are the most vulnerable to poverty, with 6 males (100.0%) and 57 females (55.9%) in their respective age groups living below the poverty level.
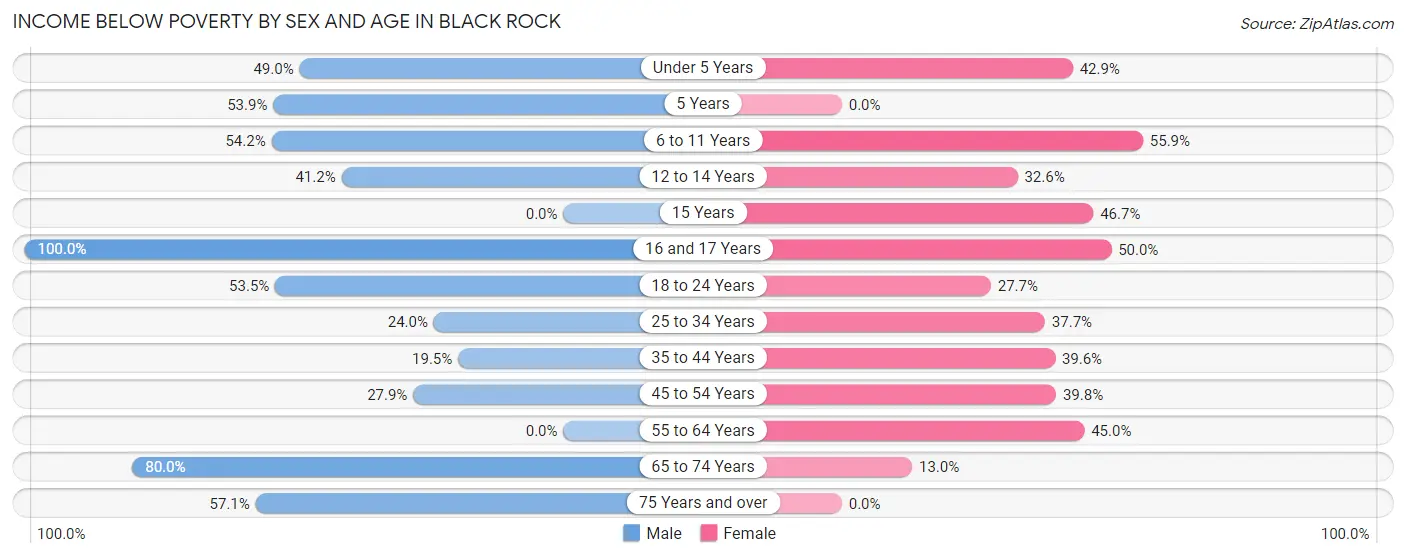
| Age Bracket | Male | Female |
| Under 5 Years | 24 (49.0%) | 9 (42.9%) |
| 5 Years | 7 (53.8%) | 0 (0.0%) |
| 6 to 11 Years | 39 (54.2%) | 57 (55.9%) |
| 12 to 14 Years | 14 (41.2%) | 15 (32.6%) |
| 15 Years | 0 (0.0%) | 7 (46.7%) |
| 16 and 17 Years | 6 (100.0%) | 14 (50.0%) |
| 18 to 24 Years | 46 (53.5%) | 26 (27.7%) |
| 25 to 34 Years | 25 (24.0%) | 46 (37.7%) |
| 35 to 44 Years | 17 (19.5%) | 36 (39.6%) |
| 45 to 54 Years | 17 (27.9%) | 33 (39.8%) |
| 55 to 64 Years | 0 (0.0%) | 18 (45.0%) |
| 65 to 74 Years | 12 (80.0%) | 3 (13.0%) |
| 75 Years and over | 8 (57.1%) | 0 (0.0%) |
| Total | 215 (37.0%) | 264 (39.3%) |
Income Above Poverty by Sex and Age in Black Rock
According to the poverty statistics in Black Rock, males aged 15 years and females aged 75 years and over are the age groups that are most secure financially, with 100.0% of males and 100.0% of females in these age groups living above the poverty line.
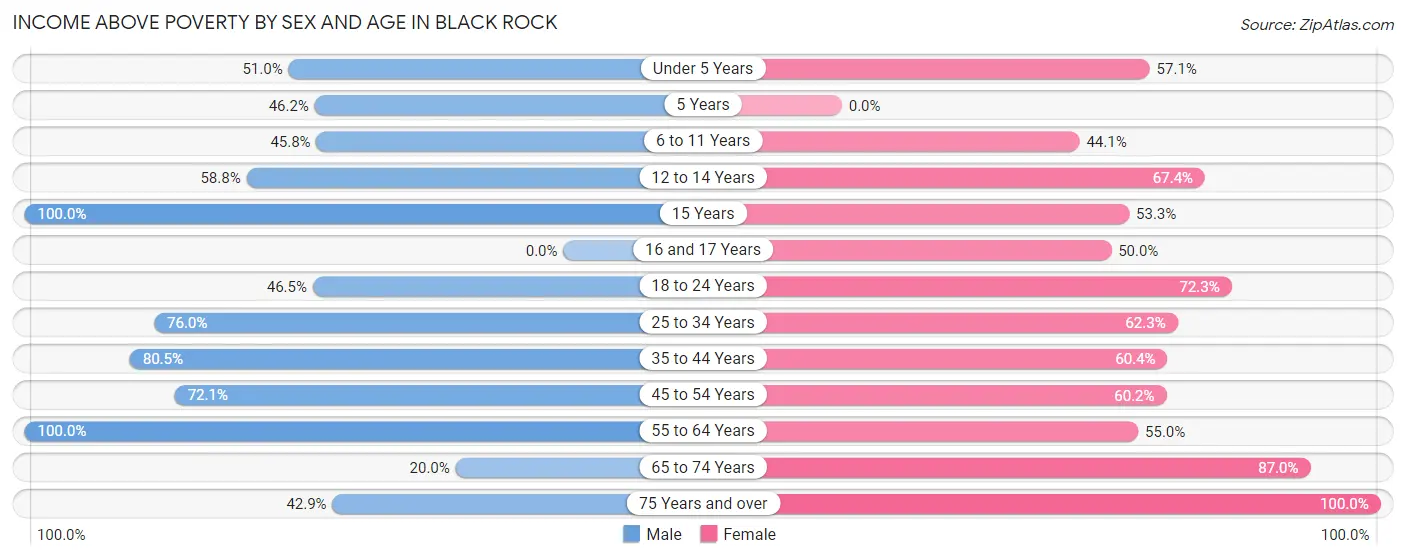
| Age Bracket | Male | Female |
| Under 5 Years | 25 (51.0%) | 12 (57.1%) |
| 5 Years | 6 (46.2%) | 0 (0.0%) |
| 6 to 11 Years | 33 (45.8%) | 45 (44.1%) |
| 12 to 14 Years | 20 (58.8%) | 31 (67.4%) |
| 15 Years | 6 (100.0%) | 8 (53.3%) |
| 16 and 17 Years | 0 (0.0%) | 14 (50.0%) |
| 18 to 24 Years | 40 (46.5%) | 68 (72.3%) |
| 25 to 34 Years | 79 (76.0%) | 76 (62.3%) |
| 35 to 44 Years | 70 (80.5%) | 55 (60.4%) |
| 45 to 54 Years | 44 (72.1%) | 50 (60.2%) |
| 55 to 64 Years | 34 (100.0%) | 22 (55.0%) |
| 65 to 74 Years | 3 (20.0%) | 20 (87.0%) |
| 75 Years and over | 6 (42.9%) | 7 (100.0%) |
| Total | 366 (63.0%) | 408 (60.7%) |
Income Below Poverty Among Married-Couple Families in Black Rock
The poverty statistics for married-couple families in Black Rock show that 24.0% or 25 of the total 104 families live below the poverty line. Families with 3 or 4 children have the highest poverty rate of 100.0%, comprising of 8 families. On the other hand, families with 1 or 2 children have the lowest poverty rate of 15.7%, which includes 11 families.
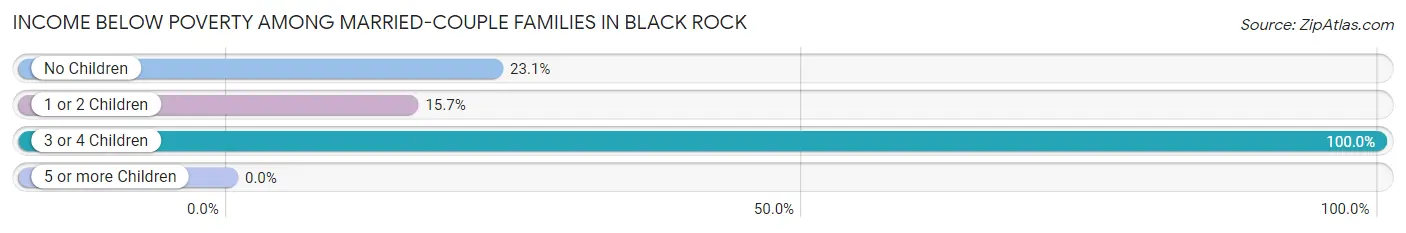
| Children | Above Poverty | Below Poverty |
| No Children | 20 (76.9%) | 6 (23.1%) |
| 1 or 2 Children | 59 (84.3%) | 11 (15.7%) |
| 3 or 4 Children | 0 (0.0%) | 8 (100.0%) |
| 5 or more Children | 0 (0.0%) | 0 (0.0%) |
| Total | 79 (76.0%) | 25 (24.0%) |
Income Below Poverty Among Single-Parent Households in Black Rock
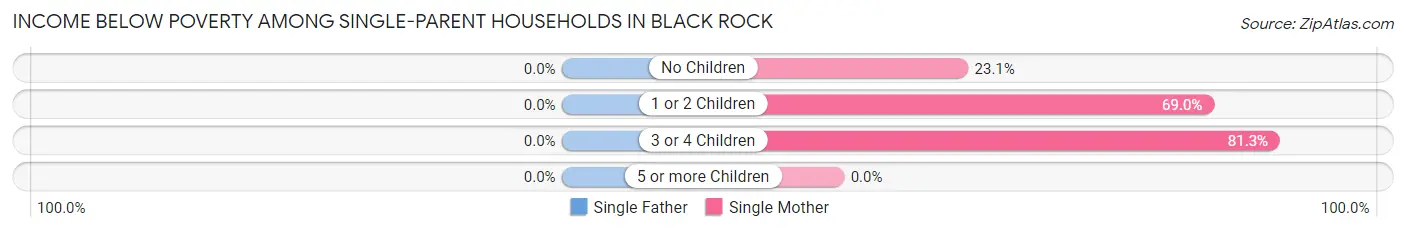
| Children | Single Father | Single Mother |
| No Children | 0 (0.0%) | 6 (23.1%) |
| 1 or 2 Children | 0 (0.0%) | 69 (69.0%) |
| 3 or 4 Children | 0 (0.0%) | 13 (81.2%) |
| 5 or more Children | 0 (0.0%) | 0 (0.0%) |
| Total | 0 (0.0%) | 88 (62.0%) |
Income Below Poverty Among Married-Couple vs Single-Parent Households in Black Rock
The poverty data for Black Rock shows that 25 of the married-couple family households (24.0%) and 88 of the single-parent households (51.8%) are living below the poverty level. Within the married-couple family households, those with 3 or 4 children have the highest poverty rate, with 8 households (100.0%) falling below the poverty line. Among the single-parent households, those with 3 or 4 children have the highest poverty rate, with 13 household (81.2%) living below poverty.
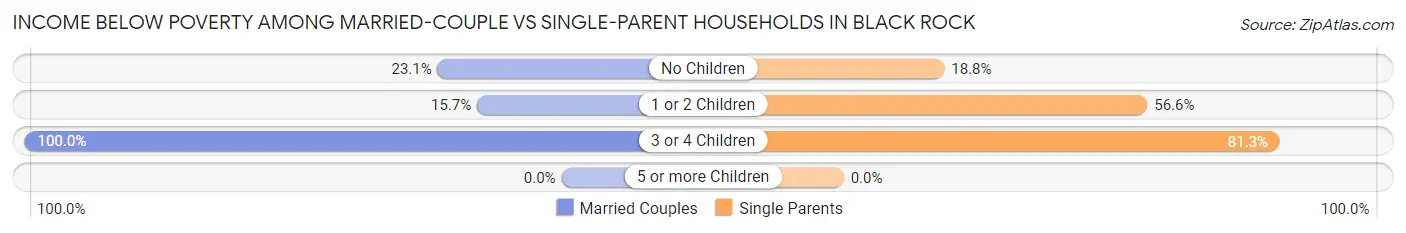
| Children | Married-Couple Families | Single-Parent Households |
| No Children | 6 (23.1%) | 6 (18.8%) |
| 1 or 2 Children | 11 (15.7%) | 69 (56.6%) |
| 3 or 4 Children | 8 (100.0%) | 13 (81.2%) |
| 5 or more Children | 0 (0.0%) | 0 (0.0%) |
| Total | 25 (24.0%) | 88 (51.8%) |
Race in Black Rock
The most populous races in Black Rock are Native / Alaskan (1,154 | 91.7%), Hispanic or Latino (66 | 5.2%), and White / Caucasian (48 | 3.8%).
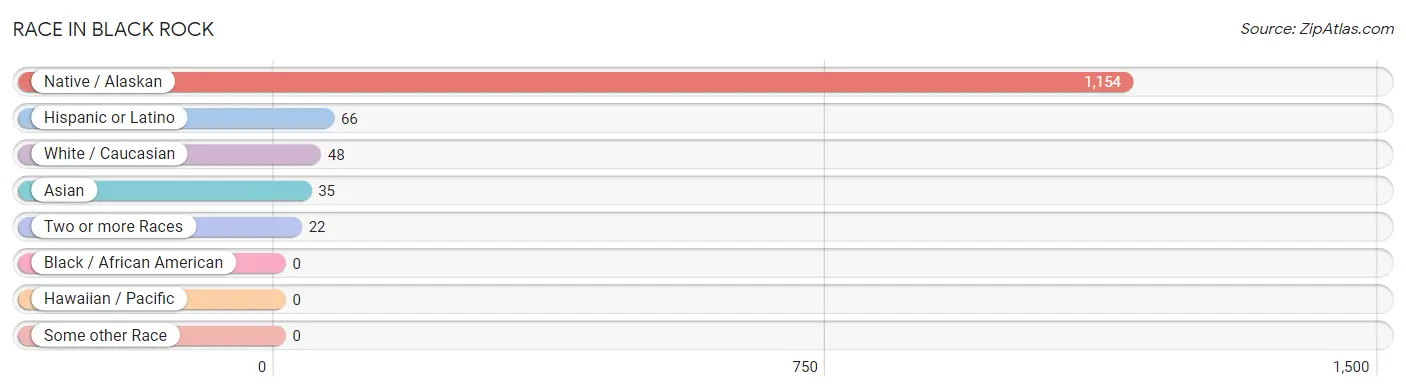
| Race | # Population | % Population |
| Asian | 35 | 2.8% |
| Black / African American | 0 | 0.0% |
| Hawaiian / Pacific | 0 | 0.0% |
| Hispanic or Latino | 66 | 5.2% |
| Native / Alaskan | 1,154 | 91.7% |
| White / Caucasian | 48 | 3.8% |
| Two or more Races | 22 | 1.8% |
| Some other Race | 0 | 0.0% |
| Total | 1,259 | 100.0% |
Ancestry in Black Rock
The most populous ancestries reported in Black Rock are Pueblo (1,145 | 90.9%), Mexican (50 | 4.0%), Korean (35 | 2.8%), Navajo (35 | 2.8%), and Spanish (16 | 1.3%), together accounting for 101.7% of all Black Rock residents.
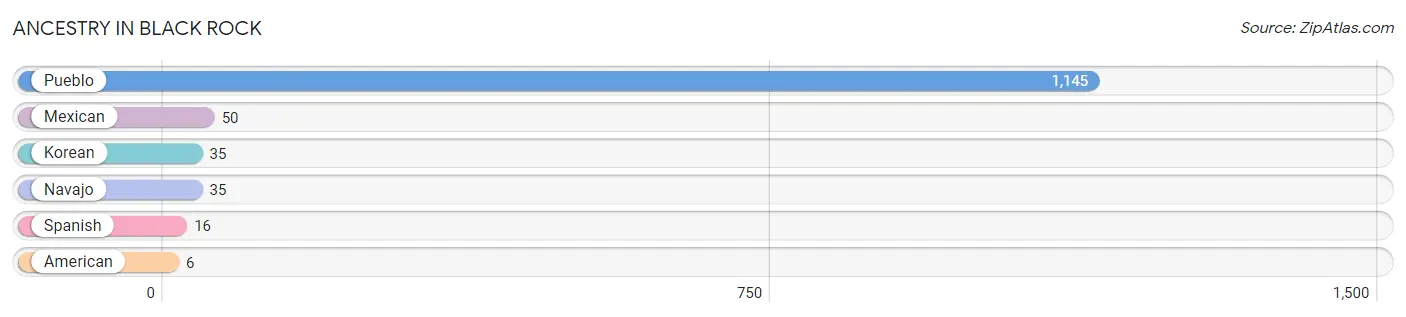
| Ancestry | # Population | % Population |
| American | 6 | 0.5% |
| Korean | 35 | 2.8% |
| Mexican | 50 | 4.0% |
| Navajo | 35 | 2.8% |
| Pueblo | 1,145 | 90.9% |
| Spanish | 16 | 1.3% | View All 6 Rows |
Immigrants in Black Rock
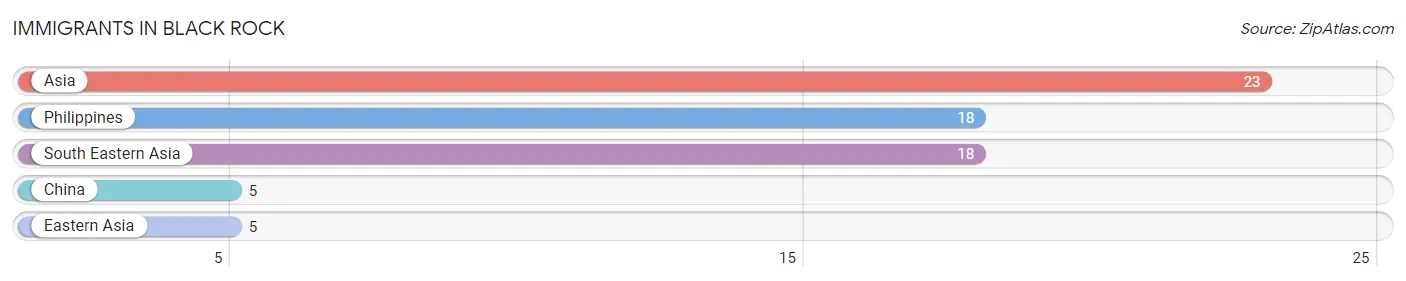
The most numerous immigrant groups reported in Black Rock came from Asia (23 | 1.8%), Philippines (18 | 1.4%), South Eastern Asia (18 | 1.4%), China (5 | 0.4%), and Eastern Asia (5 | 0.4%), together accounting for 5.5% of all Black Rock residents.
| Immigration Origin | # Population | % Population |
| Asia | 23 | 1.8% |
| China | 5 | 0.4% |
| Eastern Asia | 5 | 0.4% |
| Philippines | 18 | 1.4% |
| South Eastern Asia | 18 | 1.4% | View All 5 Rows |
Sex and Age in Black Rock
Sex and Age in Black Rock
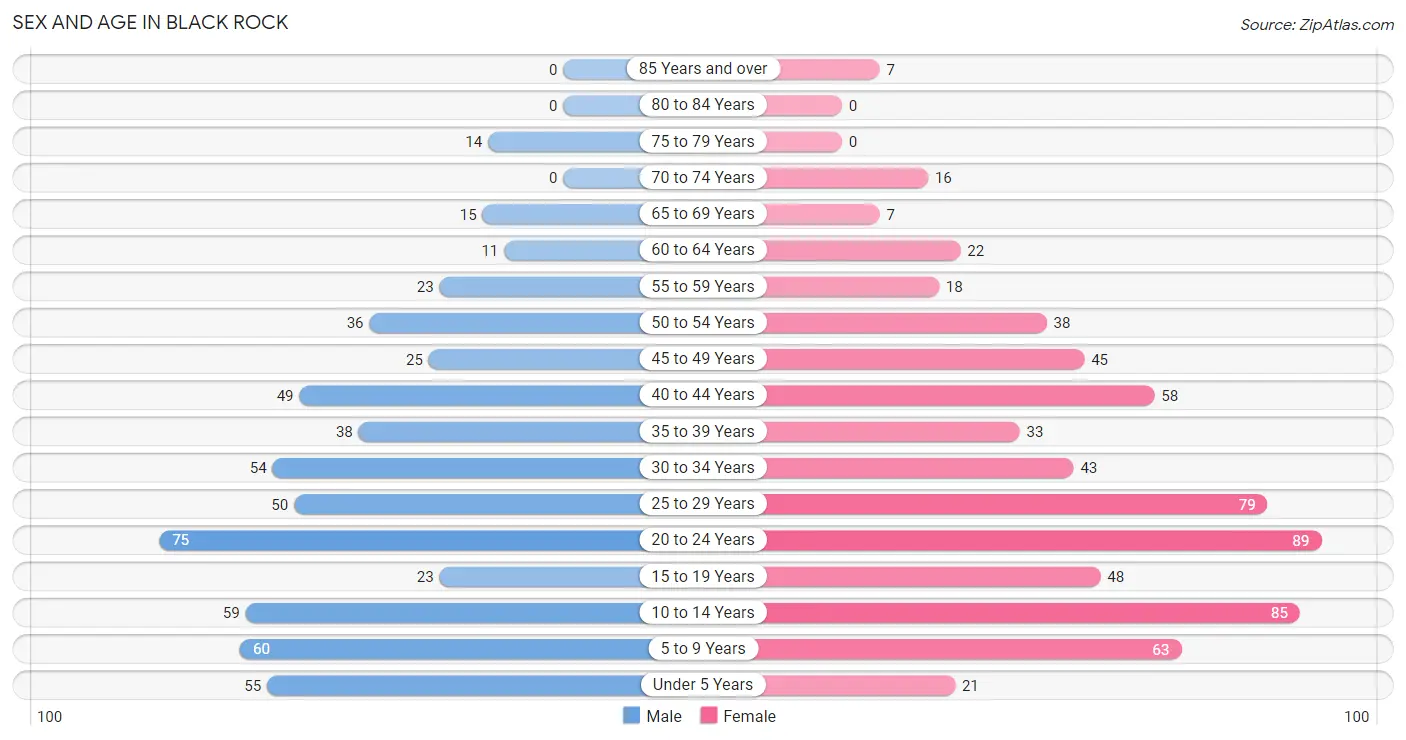
The most populous age groups in Black Rock are 20 to 24 Years (75 | 12.8%) for men and 20 to 24 Years (89 | 13.2%) for women.
| Age Bracket | Male | Female |
| Under 5 Years | 55 (9.4%) | 21 (3.1%) |
| 5 to 9 Years | 60 (10.2%) | 63 (9.4%) |
| 10 to 14 Years | 59 (10.1%) | 85 (12.7%) |
| 15 to 19 Years | 23 (3.9%) | 48 (7.1%) |
| 20 to 24 Years | 75 (12.8%) | 89 (13.2%) |
| 25 to 29 Years | 50 (8.5%) | 79 (11.8%) |
| 30 to 34 Years | 54 (9.2%) | 43 (6.4%) |
| 35 to 39 Years | 38 (6.5%) | 33 (4.9%) |
| 40 to 44 Years | 49 (8.4%) | 58 (8.6%) |
| 45 to 49 Years | 25 (4.3%) | 45 (6.7%) |
| 50 to 54 Years | 36 (6.1%) | 38 (5.7%) |
| 55 to 59 Years | 23 (3.9%) | 18 (2.7%) |
| 60 to 64 Years | 11 (1.9%) | 22 (3.3%) |
| 65 to 69 Years | 15 (2.6%) | 7 (1.0%) |
| 70 to 74 Years | 0 (0.0%) | 16 (2.4%) |
| 75 to 79 Years | 14 (2.4%) | 0 (0.0%) |
| 80 to 84 Years | 0 (0.0%) | 0 (0.0%) |
| 85 Years and over | 0 (0.0%) | 7 (1.0%) |
| Total | 587 (100.0%) | 672 (100.0%) |
Families and Households in Black Rock
Median Family Size in Black Rock
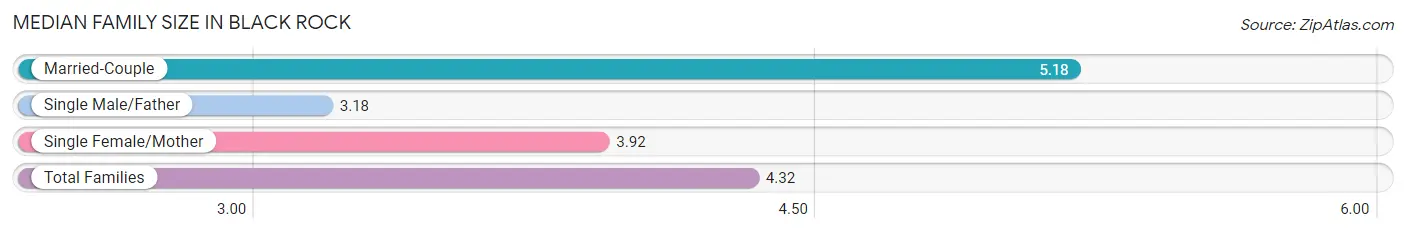
The median family size in Black Rock is 4.32 persons per family, with married-couple families (104 | 38.0%) accounting for the largest median family size of 5.18 persons per family. On the other hand, single male/father families (28 | 10.2%) represent the smallest median family size with 3.18 persons per family.
| Family Type | # Families | Family Size |
| Married-Couple | 104 (38.0%) | 5.18 |
| Single Male/Father | 28 (10.2%) | 3.18 |
| Single Female/Mother | 142 (51.8%) | 3.92 |
| Total Families | 274 (100.0%) | 4.32 |
Median Household Size in Black Rock
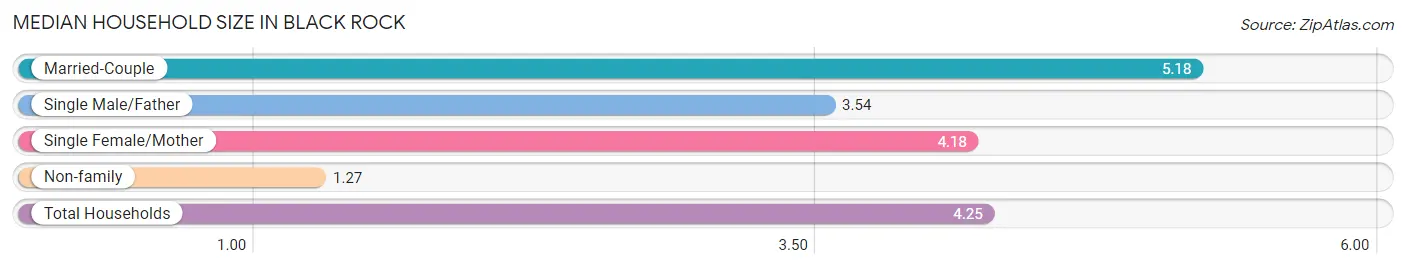
The median household size in Black Rock is 4.25 persons per household, with married-couple households (104 | 35.1%) accounting for the largest median household size of 5.18 persons per household. non-family households (22 | 7.4%) represent the smallest median household size with 1.27 persons per household.
| Household Type | # Households | Household Size |
| Married-Couple | 104 (35.1%) | 5.18 |
| Single Male/Father | 28 (9.5%) | 3.54 |
| Single Female/Mother | 142 (48.0%) | 4.18 |
| Non-family | 22 (7.4%) | 1.27 |
| Total Households | 296 (100.0%) | 4.25 |
Household Size by Marriage Status in Black Rock
Out of a total of 296 households in Black Rock, 274 (92.6%) are family households, while 22 (7.4%) are nonfamily households. The most numerous type of family households are 3-person households, comprising 88, and the most common type of nonfamily households are 1-person households, comprising 16.
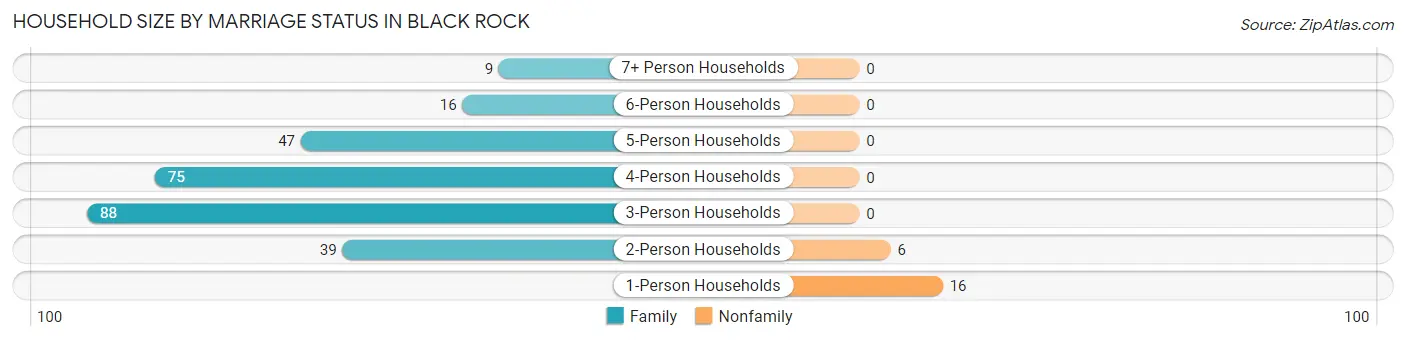
| Household Size | Family Households | Nonfamily Households |
| 1-Person Households | - | 16 (5.4%) |
| 2-Person Households | 39 (13.2%) | 6 (2.0%) |
| 3-Person Households | 88 (29.7%) | 0 (0.0%) |
| 4-Person Households | 75 (25.3%) | 0 (0.0%) |
| 5-Person Households | 47 (15.9%) | 0 (0.0%) |
| 6-Person Households | 16 (5.4%) | 0 (0.0%) |
| 7+ Person Households | 9 (3.0%) | 0 (0.0%) |
| Total | 274 (92.6%) | 22 (7.4%) |
Female Fertility in Black Rock
Fertility by Age in Black Rock
Average fertility rate in Black Rock is 33.0 births per 1,000 women. Women in the age bracket of 20 to 34 years have the highest fertility rate with 62.0 births per 1,000 women. Women in the age bracket of 20 to 34 years acount for 100.0% of all women with births.
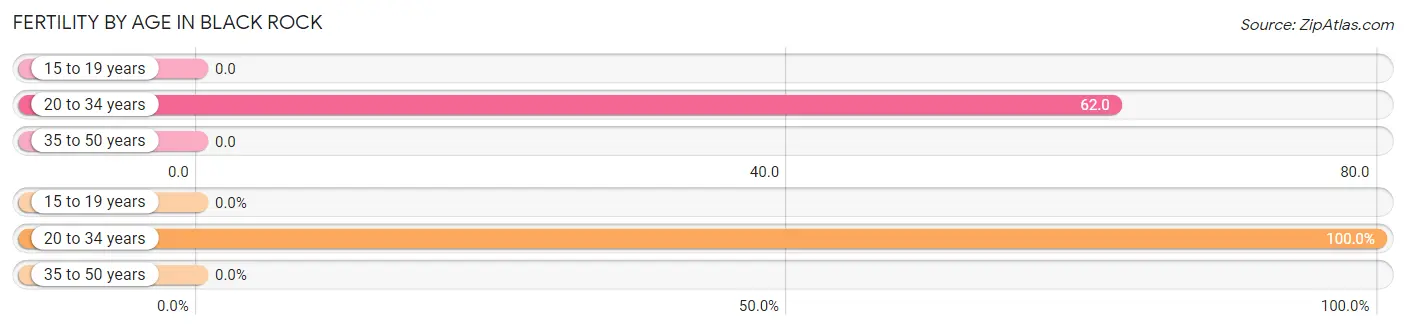
| Age Bracket | Women with Births | Births / 1,000 Women |
| 15 to 19 years | 0 (0.0%) | 0.0 |
| 20 to 34 years | 13 (100.0%) | 62.0 |
| 35 to 50 years | 0 (0.0%) | 0.0 |
| Total | 13 (100.0%) | 33.0 |
Fertility by Age by Marriage Status in Black Rock
53.8% of women with births (13) in Black Rock are married. The highest percentage of unmarried women with births falls into 20 to 34 years age bracket with 46.2% of them unmarried at the time of birth, while the lowest percentage of unmarried women with births belong to 20 to 34 years age bracket with 46.2% of them unmarried.
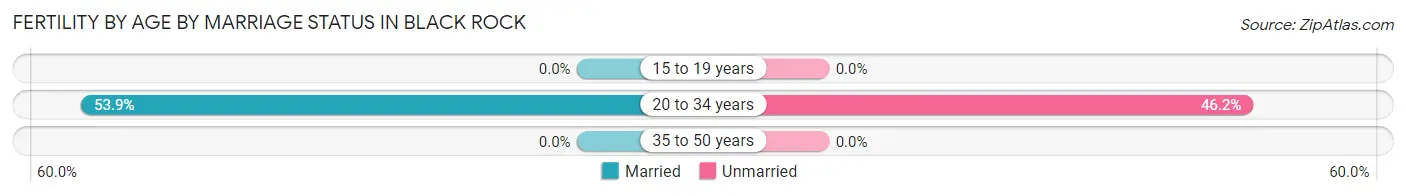
| Age Bracket | Married | Unmarried |
| 15 to 19 years | 0 (0.0%) | 0 (0.0%) |
| 20 to 34 years | 7 (53.8%) | 6 (46.2%) |
| 35 to 50 years | 0 (0.0%) | 0 (0.0%) |
| Total | 7 (53.8%) | 6 (46.2%) |
Fertility by Education in Black Rock
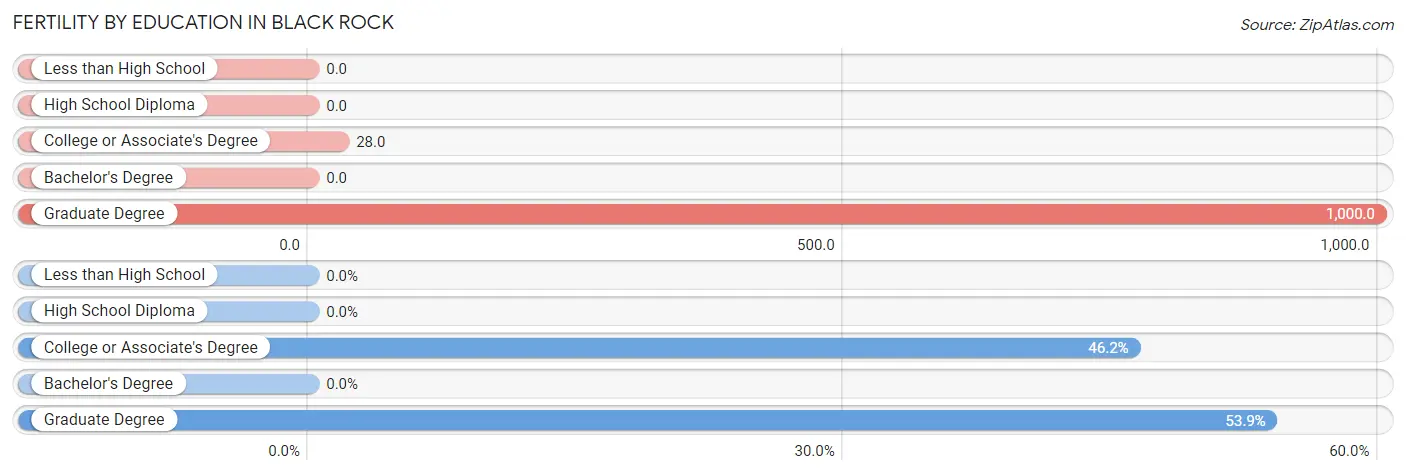
| Educational Attainment | Women with Births | Births / 1,000 Women |
| Less than High School | 0 (0.0%) | 0.0 |
| High School Diploma | 0 (0.0%) | 0.0 |
| College or Associate's Degree | 6 (46.2%) | 28.0 |
| Bachelor's Degree | 0 (0.0%) | 0.0 |
| Graduate Degree | 7 (53.8%) | 1,000.0 |
| Total | 13 (100.0%) | 33.0 |
Fertility by Education by Marriage Status in Black Rock
46.2% of women with births in Black Rock are unmarried. Women with the educational attainment of graduate degree are most likely to be married with 100.0% of them married at childbirth, while women with the educational attainment of college or associate's degree are least likely to be married with 100.0% of them unmarried at childbirth.
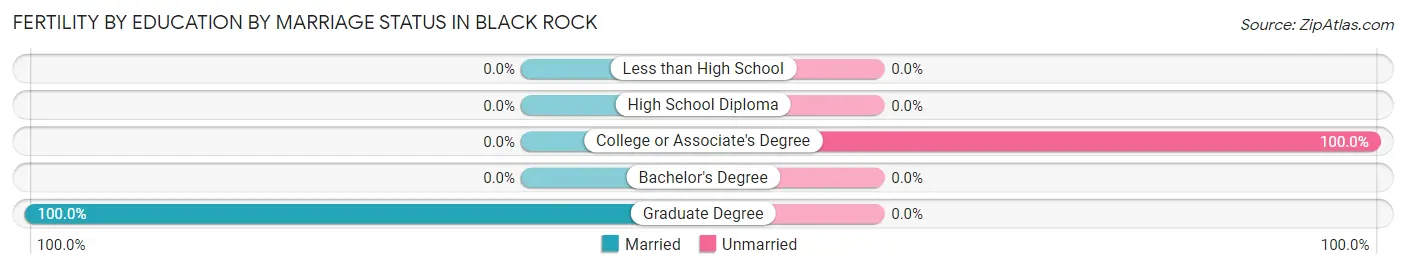
| Educational Attainment | Married | Unmarried |
| Less than High School | 0 (0.0%) | 0 (0.0%) |
| High School Diploma | 0 (0.0%) | 0 (0.0%) |
| College or Associate's Degree | 0 (0.0%) | 6 (100.0%) |
| Bachelor's Degree | 0 (0.0%) | 0 (0.0%) |
| Graduate Degree | 7 (100.0%) | 0 (0.0%) |
| Total | 7 (53.8%) | 6 (46.2%) |
Employment Characteristics in Black Rock
Employment by Class of Employer in Black Rock
Among the 452 employed individuals in Black Rock, private company employees (236 | 52.2%), local government employees (104 | 23.0%), and federal government employees (47 | 10.4%) make up the most common classes of employment.
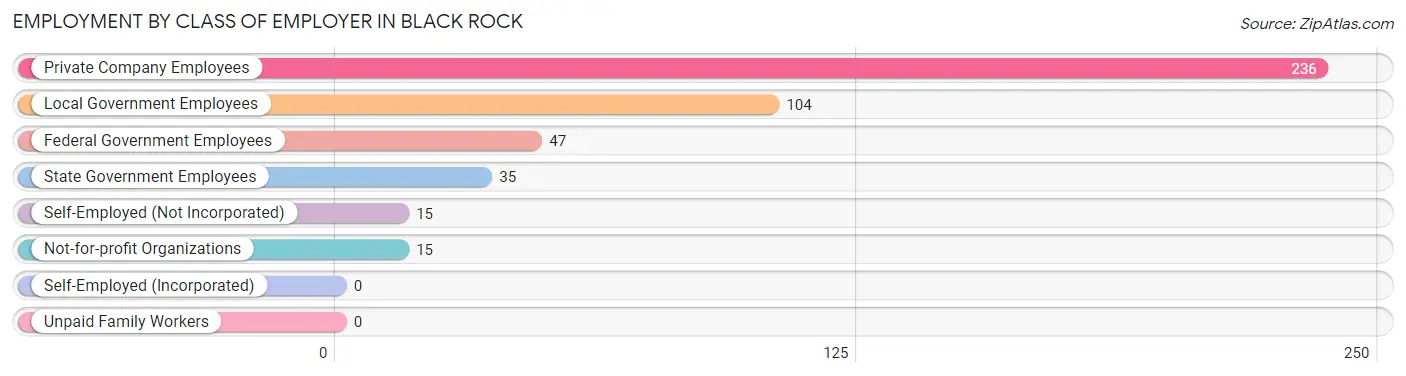
| Employer Class | # Employees | % Employees |
| Private Company Employees | 236 | 52.2% |
| Self-Employed (Incorporated) | 0 | 0.0% |
| Self-Employed (Not Incorporated) | 15 | 3.3% |
| Not-for-profit Organizations | 15 | 3.3% |
| Local Government Employees | 104 | 23.0% |
| State Government Employees | 35 | 7.7% |
| Federal Government Employees | 47 | 10.4% |
| Unpaid Family Workers | 0 | 0.0% |
| Total | 452 | 100.0% |
Employment Status by Age in Black Rock
According to the labor force statistics for Black Rock, out of the total population over 16 years of age (895), 57.8% or 517 individuals are in the labor force, with 11.4% or 59 of them unemployed. The age group with the highest labor force participation rate is 60 to 64 years, with 81.8% or 27 individuals in the labor force. Within the labor force, the 25 to 29 years age range has the highest percentage of unemployed individuals, with 32.5% or 25 of them being unemployed.
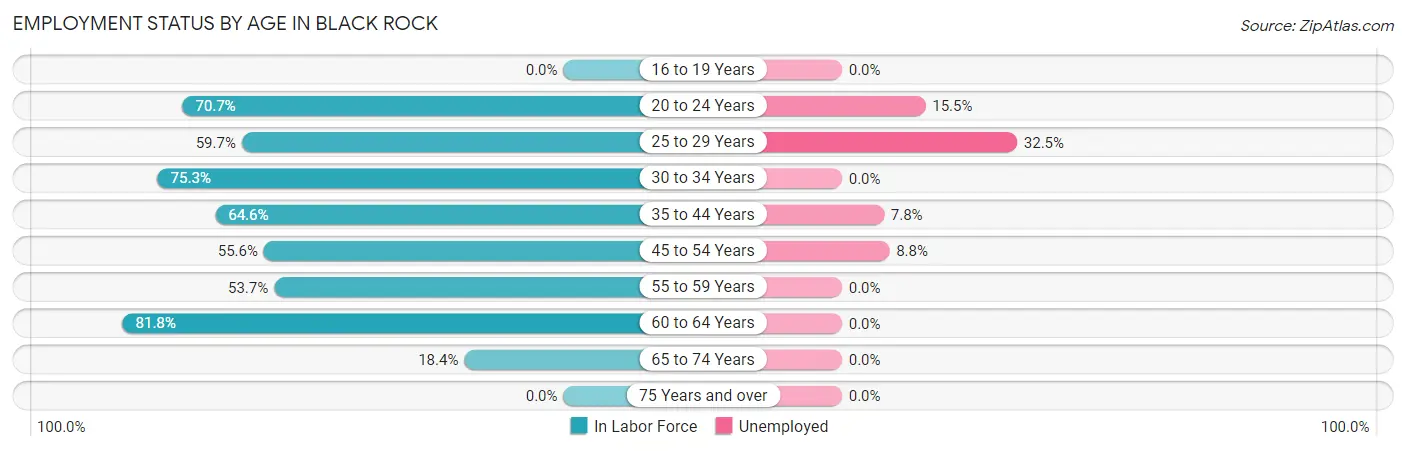
| Age Bracket | In Labor Force | Unemployed |
| 16 to 19 Years | 0 (0.0%) | 0 (0.0%) |
| 20 to 24 Years | 116 (70.7%) | 18 (15.5%) |
| 25 to 29 Years | 77 (59.7%) | 25 (32.5%) |
| 30 to 34 Years | 73 (75.3%) | 0 (0.0%) |
| 35 to 44 Years | 115 (64.6%) | 9 (7.8%) |
| 45 to 54 Years | 80 (55.6%) | 7 (8.8%) |
| 55 to 59 Years | 22 (53.7%) | 0 (0.0%) |
| 60 to 64 Years | 27 (81.8%) | 0 (0.0%) |
| 65 to 74 Years | 7 (18.4%) | 0 (0.0%) |
| 75 Years and over | 0 (0.0%) | 0 (0.0%) |
| Total | 517 (57.8%) | 59 (11.4%) |
Employment Status by Educational Attainment in Black Rock
According to labor force statistics for Black Rock, 63.3% of individuals (394) out of the total population between 25 and 64 years of age (622) are in the labor force, with 10.4% or 41 of them being unemployed. The group with the highest labor force participation rate are those with the educational attainment of bachelor's degree or higher, with 100.0% or 86 individuals in the labor force. Within the labor force, individuals with college / associate degree education have the highest percentage of unemployment, with 25.5% or 41 of them being unemployed.
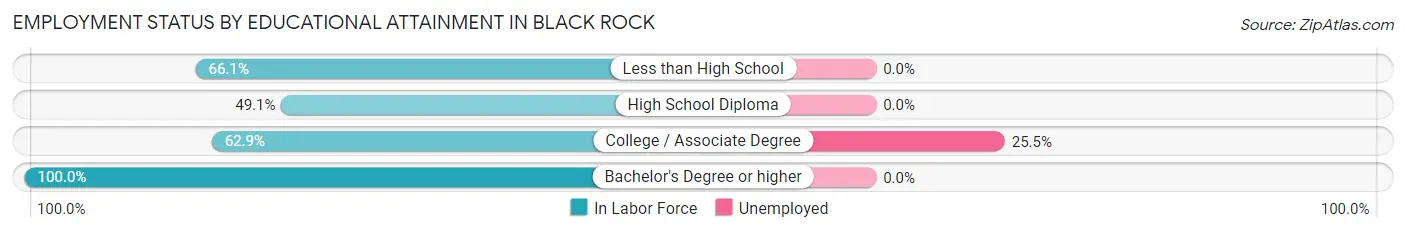
| Educational Attainment | In Labor Force | Unemployed |
| Less than High School | 37 (66.1%) | 0 (0.0%) |
| High School Diploma | 110 (49.1%) | 0 (0.0%) |
| College / Associate Degree | 161 (62.9%) | 65 (25.5%) |
| Bachelor's Degree or higher | 86 (100.0%) | 0 (0.0%) |
| Total | 394 (63.3%) | 65 (10.4%) |
Employment Occupations by Sex in Black Rock
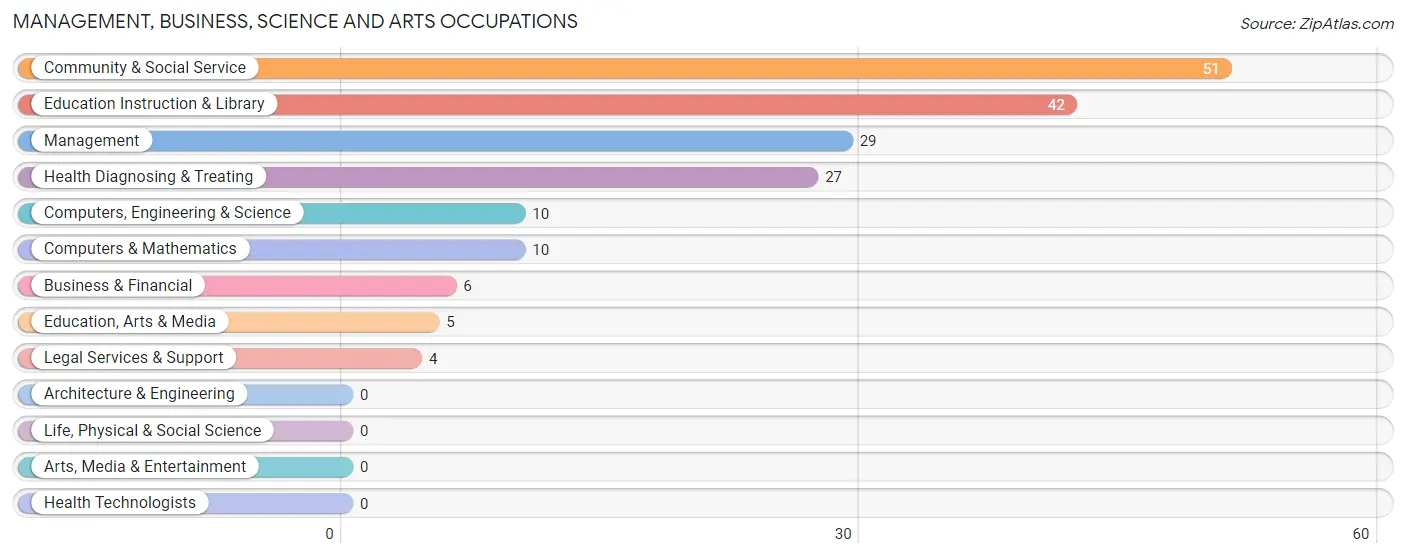
Management, Business, Science and Arts Occupations
The most common Management, Business, Science and Arts occupations in Black Rock are Community & Social Service (51 | 11.1%), Education Instruction & Library (42 | 9.2%), Management (29 | 6.3%), Health Diagnosing & Treating (27 | 5.9%), and Computers, Engineering & Science (10 | 2.2%).
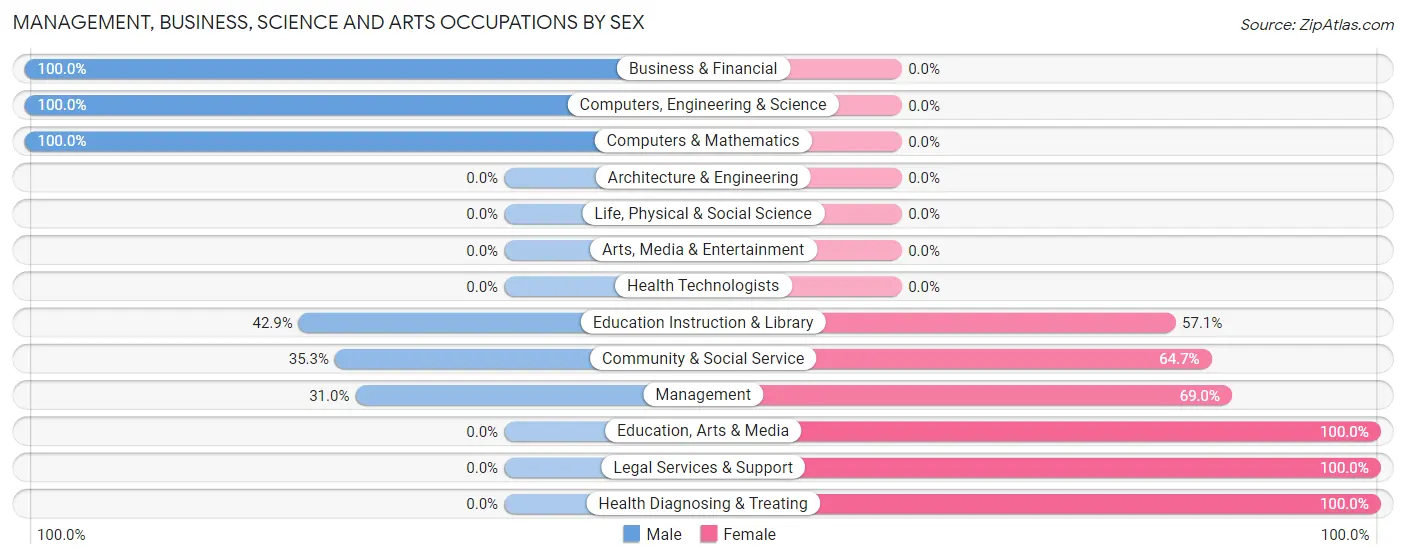
Management, Business, Science and Arts Occupations by Sex
Within the Management, Business, Science and Arts occupations in Black Rock, the most male-oriented occupations are Business & Financial (100.0%), Computers, Engineering & Science (100.0%), and Computers & Mathematics (100.0%), while the most female-oriented occupations are Education, Arts & Media (100.0%), Legal Services & Support (100.0%), and Health Diagnosing & Treating (100.0%).
| Occupation | Male | Female |
| Management | 9 (31.0%) | 20 (69.0%) |
| Business & Financial | 6 (100.0%) | 0 (0.0%) |
| Computers, Engineering & Science | 10 (100.0%) | 0 (0.0%) |
| Computers & Mathematics | 10 (100.0%) | 0 (0.0%) |
| Architecture & Engineering | 0 (0.0%) | 0 (0.0%) |
| Life, Physical & Social Science | 0 (0.0%) | 0 (0.0%) |
| Community & Social Service | 18 (35.3%) | 33 (64.7%) |
| Education, Arts & Media | 0 (0.0%) | 5 (100.0%) |
| Legal Services & Support | 0 (0.0%) | 4 (100.0%) |
| Education Instruction & Library | 18 (42.9%) | 24 (57.1%) |
| Arts, Media & Entertainment | 0 (0.0%) | 0 (0.0%) |
| Health Diagnosing & Treating | 0 (0.0%) | 27 (100.0%) |
| Health Technologists | 0 (0.0%) | 0 (0.0%) |
| Total (Category) | 43 (35.0%) | 80 (65.0%) |
| Total (Overall) | 200 (43.7%) | 258 (56.3%) |
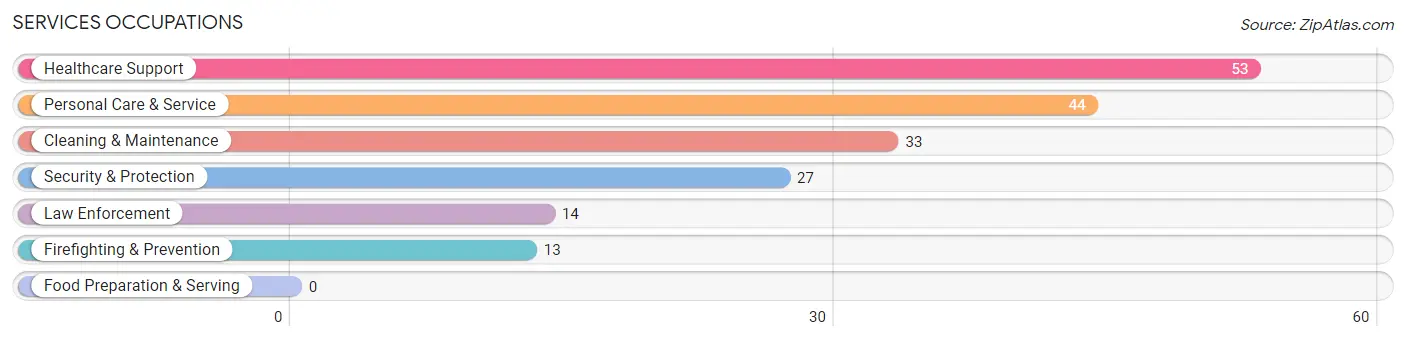
Services Occupations
The most common Services occupations in Black Rock are Healthcare Support (53 | 11.6%), Personal Care & Service (44 | 9.6%), Cleaning & Maintenance (33 | 7.2%), Security & Protection (27 | 5.9%), and Law Enforcement (14 | 3.1%).
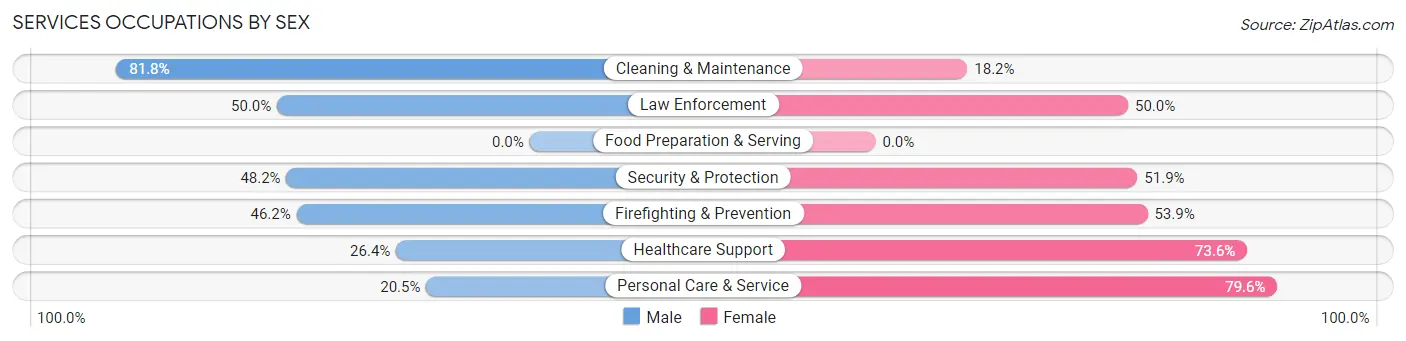
Services Occupations by Sex
Within the Services occupations in Black Rock, the most male-oriented occupations are Cleaning & Maintenance (81.8%), Law Enforcement (50.0%), and Security & Protection (48.1%), while the most female-oriented occupations are Personal Care & Service (79.5%), Healthcare Support (73.6%), and Firefighting & Prevention (53.8%).
| Occupation | Male | Female |
| Healthcare Support | 14 (26.4%) | 39 (73.6%) |
| Security & Protection | 13 (48.1%) | 14 (51.8%) |
| Firefighting & Prevention | 6 (46.2%) | 7 (53.8%) |
| Law Enforcement | 7 (50.0%) | 7 (50.0%) |
| Food Preparation & Serving | 0 (0.0%) | 0 (0.0%) |
| Cleaning & Maintenance | 27 (81.8%) | 6 (18.2%) |
| Personal Care & Service | 9 (20.4%) | 35 (79.5%) |
| Total (Category) | 63 (40.1%) | 94 (59.9%) |
| Total (Overall) | 200 (43.7%) | 258 (56.3%) |
Sales and Office Occupations
The most common Sales and Office occupations in Black Rock are Office & Administration (53 | 11.6%), and Sales & Related (47 | 10.3%).
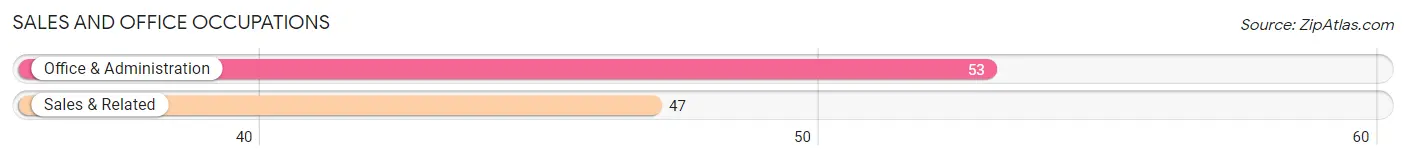
Sales and Office Occupations by Sex

| Occupation | Male | Female |
| Sales & Related | 30 (63.8%) | 17 (36.2%) |
| Office & Administration | 9 (17.0%) | 44 (83.0%) |
| Total (Category) | 39 (39.0%) | 61 (61.0%) |
| Total (Overall) | 200 (43.7%) | 258 (56.3%) |
Natural Resources, Construction and Maintenance Occupations
The most common Natural Resources, Construction and Maintenance occupations in Black Rock are Installation, Maintenance & Repair (14 | 3.1%), and Construction & Extraction (12 | 2.6%).
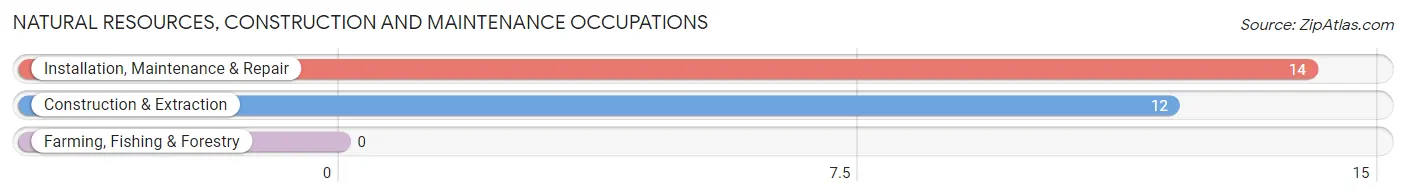
Natural Resources, Construction and Maintenance Occupations by Sex
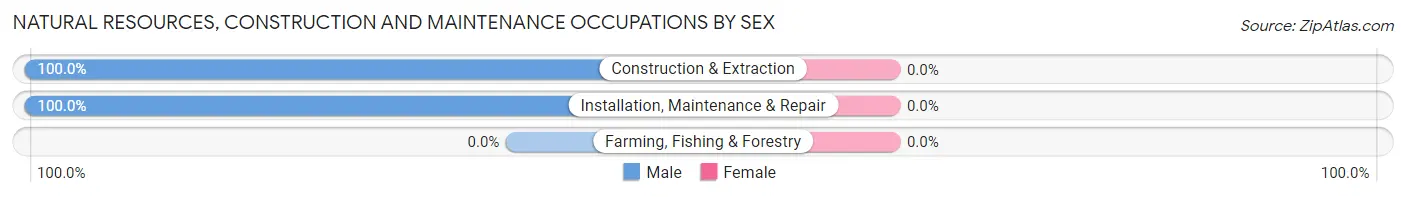
| Occupation | Male | Female |
| Farming, Fishing & Forestry | 0 (0.0%) | 0 (0.0%) |
| Construction & Extraction | 12 (100.0%) | 0 (0.0%) |
| Installation, Maintenance & Repair | 14 (100.0%) | 0 (0.0%) |
| Total (Category) | 26 (100.0%) | 0 (0.0%) |
| Total (Overall) | 200 (43.7%) | 258 (56.3%) |
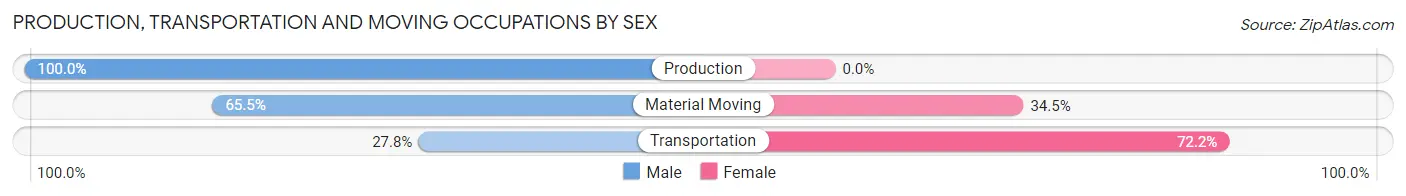
Production, Transportation and Moving Occupations
The most common Production, Transportation and Moving occupations in Black Rock are Material Moving (29 | 6.3%), Transportation (18 | 3.9%), and Production (5 | 1.1%).
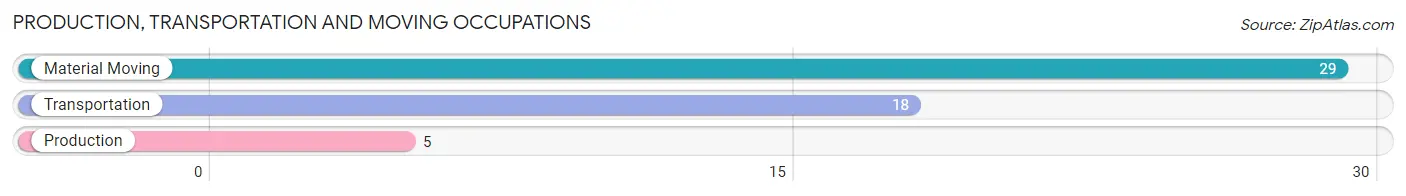
Production, Transportation and Moving Occupations by Sex
| Occupation | Male | Female |
| Production | 5 (100.0%) | 0 (0.0%) |
| Transportation | 5 (27.8%) | 13 (72.2%) |
| Material Moving | 19 (65.5%) | 10 (34.5%) |
| Total (Category) | 29 (55.8%) | 23 (44.2%) |
| Total (Overall) | 200 (43.7%) | 258 (56.3%) |
Employment Industries by Sex in Black Rock
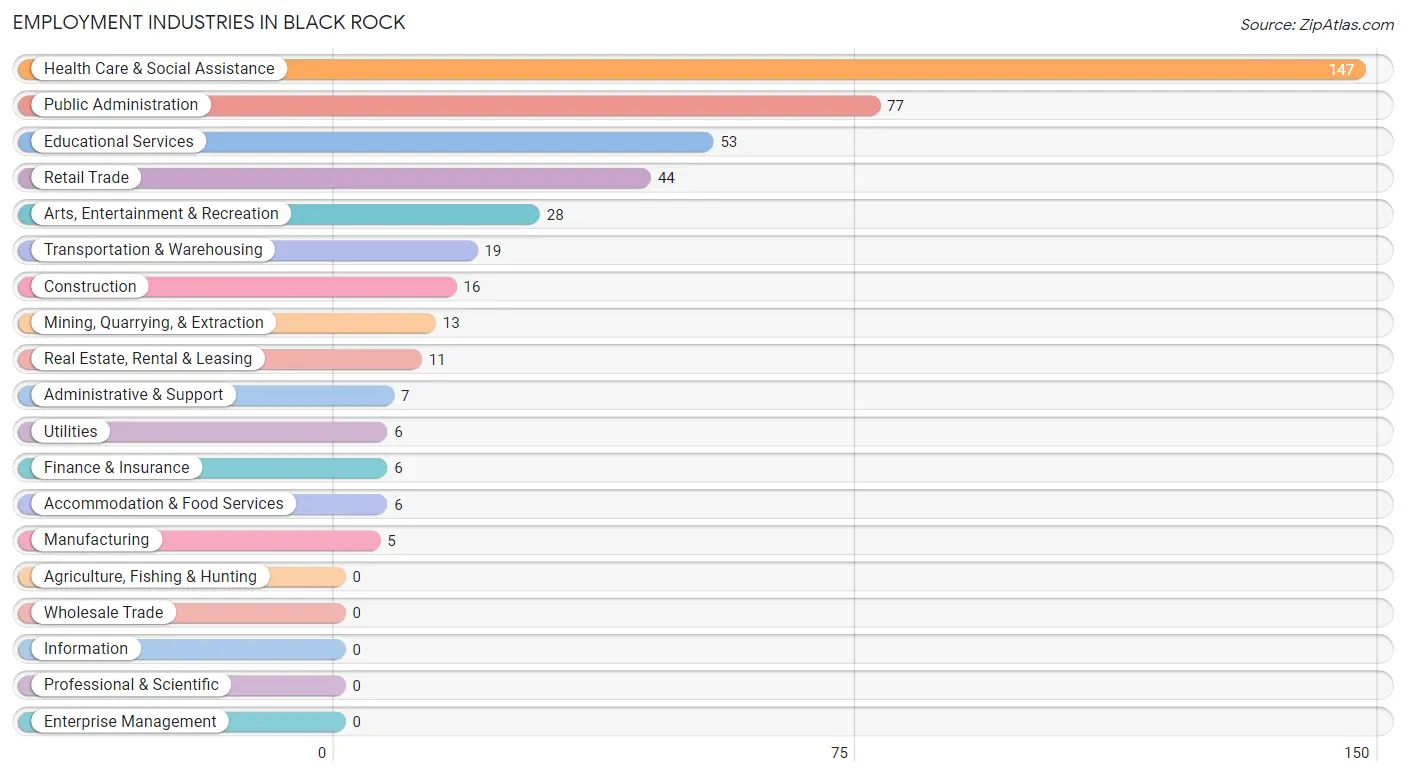
Employment Industries in Black Rock
The major employment industries in Black Rock include Health Care & Social Assistance (147 | 32.1%), Public Administration (77 | 16.8%), Educational Services (53 | 11.6%), Retail Trade (44 | 9.6%), and Arts, Entertainment & Recreation (28 | 6.1%).
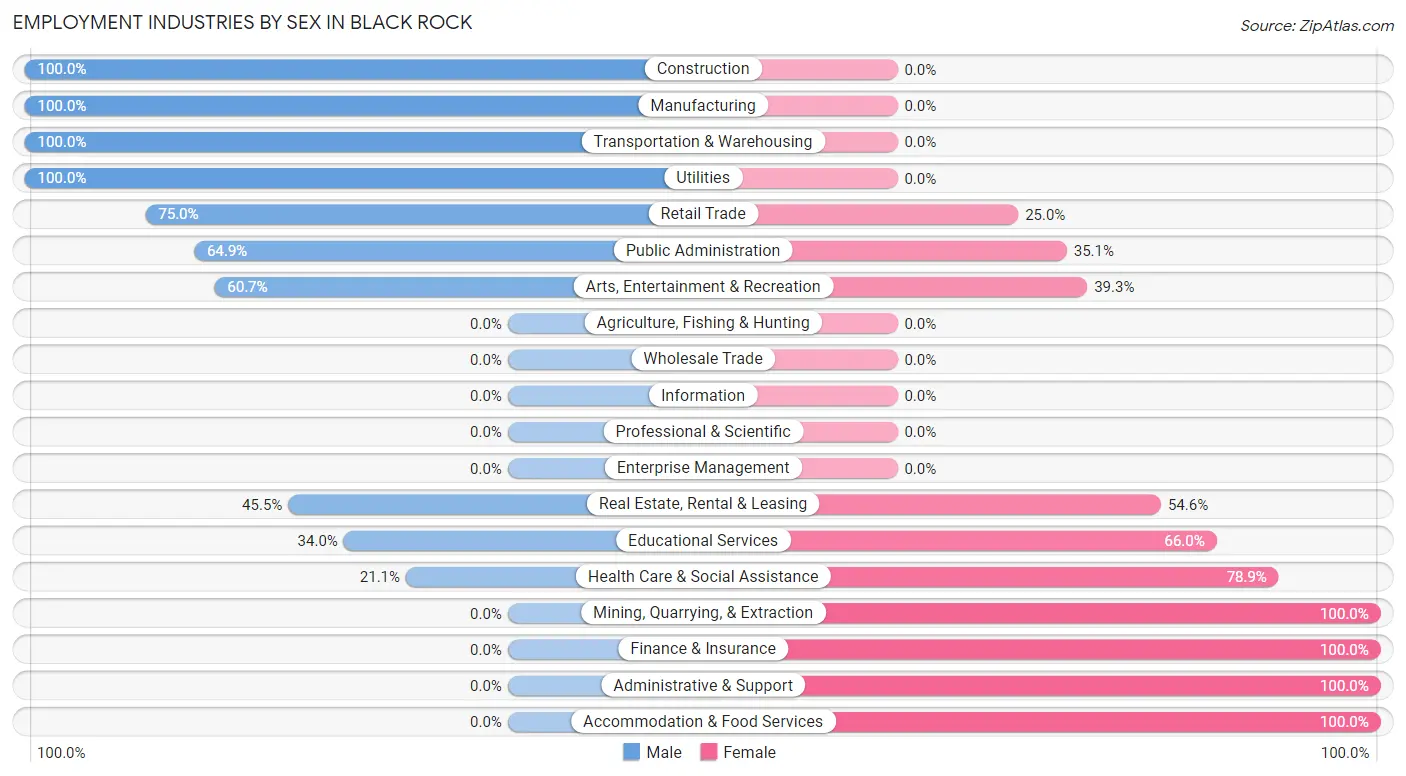
Employment Industries by Sex in Black Rock
The Black Rock industries that see more men than women are Construction (100.0%), Manufacturing (100.0%), and Transportation & Warehousing (100.0%), whereas the industries that tend to have a higher number of women are Mining, Quarrying, & Extraction (100.0%), Finance & Insurance (100.0%), and Administrative & Support (100.0%).
| Industry | Male | Female |
| Agriculture, Fishing & Hunting | 0 (0.0%) | 0 (0.0%) |
| Mining, Quarrying, & Extraction | 0 (0.0%) | 13 (100.0%) |
| Construction | 16 (100.0%) | 0 (0.0%) |
| Manufacturing | 5 (100.0%) | 0 (0.0%) |
| Wholesale Trade | 0 (0.0%) | 0 (0.0%) |
| Retail Trade | 33 (75.0%) | 11 (25.0%) |
| Transportation & Warehousing | 19 (100.0%) | 0 (0.0%) |
| Utilities | 6 (100.0%) | 0 (0.0%) |
| Information | 0 (0.0%) | 0 (0.0%) |
| Finance & Insurance | 0 (0.0%) | 6 (100.0%) |
| Real Estate, Rental & Leasing | 5 (45.5%) | 6 (54.5%) |
| Professional & Scientific | 0 (0.0%) | 0 (0.0%) |
| Enterprise Management | 0 (0.0%) | 0 (0.0%) |
| Administrative & Support | 0 (0.0%) | 7 (100.0%) |
| Educational Services | 18 (34.0%) | 35 (66.0%) |
| Health Care & Social Assistance | 31 (21.1%) | 116 (78.9%) |
| Arts, Entertainment & Recreation | 17 (60.7%) | 11 (39.3%) |
| Accommodation & Food Services | 0 (0.0%) | 6 (100.0%) |
| Public Administration | 50 (64.9%) | 27 (35.1%) |
| Total | 200 (43.7%) | 258 (56.3%) |
Education in Black Rock
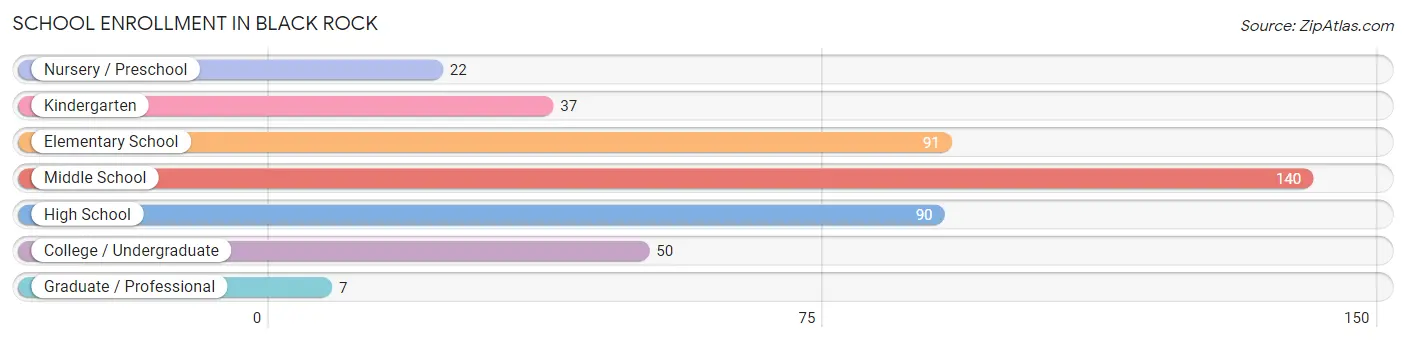
School Enrollment in Black Rock
The most common levels of schooling among the 437 students in Black Rock are middle school (140 | 32.0%), elementary school (91 | 20.8%), and high school (90 | 20.6%).
| School Level | # Students | % Students |
| Nursery / Preschool | 22 | 5.0% |
| Kindergarten | 37 | 8.5% |
| Elementary School | 91 | 20.8% |
| Middle School | 140 | 32.0% |
| High School | 90 | 20.6% |
| College / Undergraduate | 50 | 11.4% |
| Graduate / Professional | 7 | 1.6% |
| Total | 437 | 100.0% |
School Enrollment by Age by Funding Source in Black Rock
Out of a total of 437 students who are enrolled in schools in Black Rock, 55 (12.6%) attend a private institution, while the remaining 382 (87.4%) are enrolled in public schools. The age group of 35 years and over has the highest likelihood of being enrolled in private schools, with 5 (45.5% in the age bracket) enrolled. Conversely, the age group of 3 to 4 year olds has the lowest likelihood of being enrolled in a private school, with 37 (100.0% in the age bracket) attending a public institution.
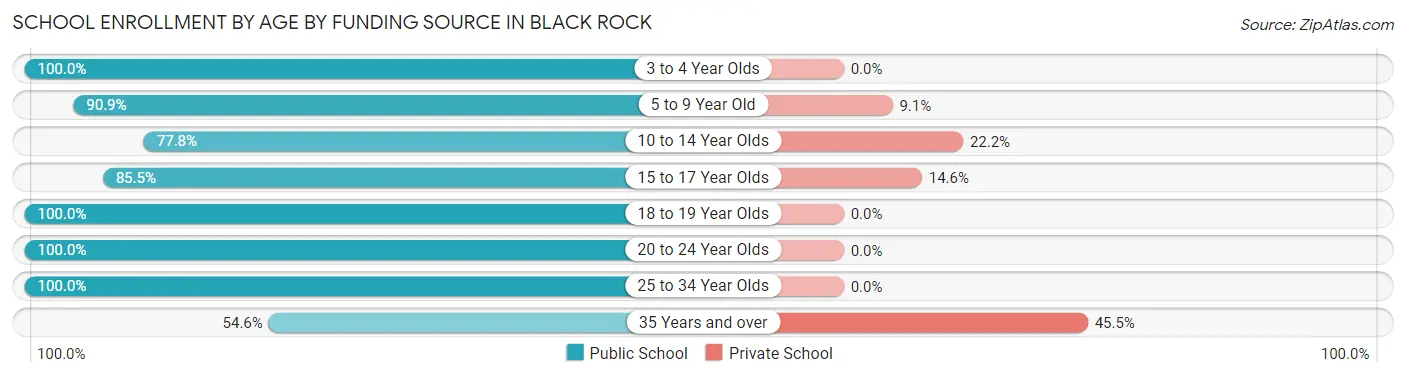
| Age Bracket | Public School | Private School |
| 3 to 4 Year Olds | 37 (100.0%) | 0 (0.0%) |
| 5 to 9 Year Old | 100 (90.9%) | 10 (9.1%) |
| 10 to 14 Year Olds | 112 (77.8%) | 32 (22.2%) |
| 15 to 17 Year Olds | 47 (85.5%) | 8 (14.5%) |
| 18 to 19 Year Olds | 16 (100.0%) | 0 (0.0%) |
| 20 to 24 Year Olds | 31 (100.0%) | 0 (0.0%) |
| 25 to 34 Year Olds | 33 (100.0%) | 0 (0.0%) |
| 35 Years and over | 6 (54.5%) | 5 (45.5%) |
| Total | 382 (87.4%) | 55 (12.6%) |
Educational Attainment by Field of Study in Black Rock
Education (31 | 36.0%), business (19 | 22.1%), arts & humanities (13 | 15.1%), computers & mathematics (10 | 11.6%), and literature & languages (8 | 9.3%) are the most common fields of study among 86 individuals in Black Rock who have obtained a bachelor's degree or higher.
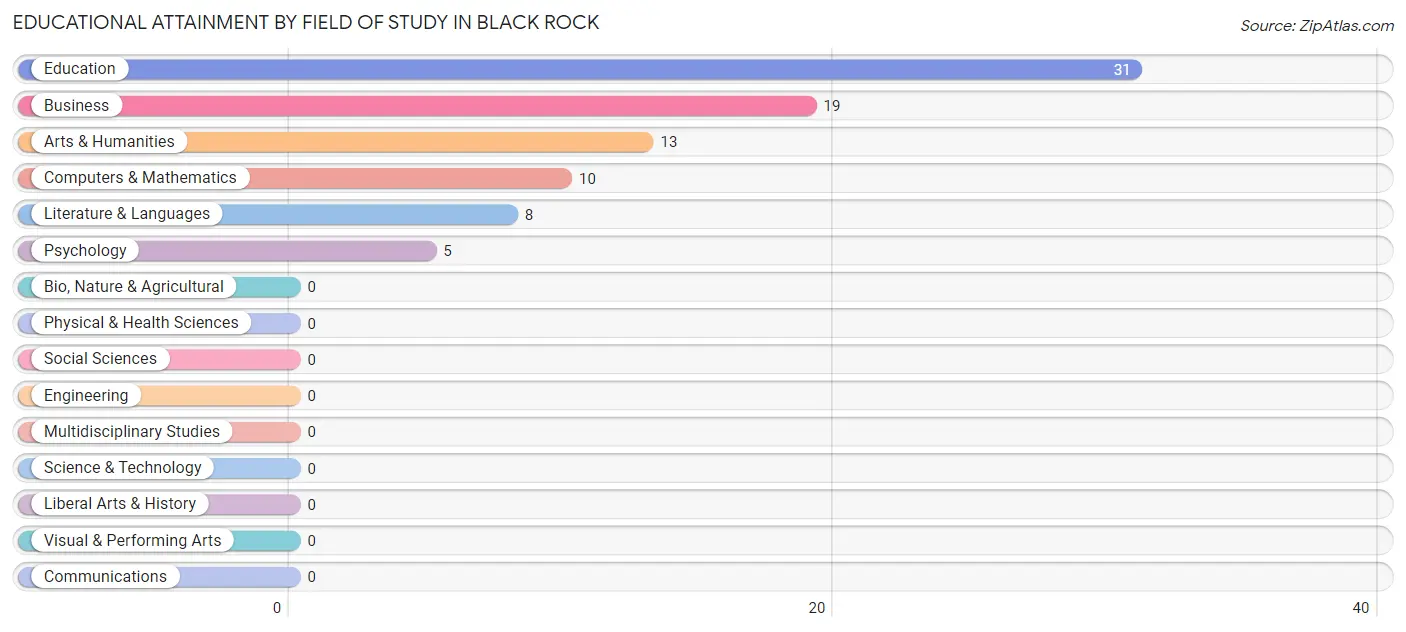
| Field of Study | # Graduates | % Graduates |
| Computers & Mathematics | 10 | 11.6% |
| Bio, Nature & Agricultural | 0 | 0.0% |
| Physical & Health Sciences | 0 | 0.0% |
| Psychology | 5 | 5.8% |
| Social Sciences | 0 | 0.0% |
| Engineering | 0 | 0.0% |
| Multidisciplinary Studies | 0 | 0.0% |
| Science & Technology | 0 | 0.0% |
| Business | 19 | 22.1% |
| Education | 31 | 36.0% |
| Literature & Languages | 8 | 9.3% |
| Liberal Arts & History | 0 | 0.0% |
| Visual & Performing Arts | 0 | 0.0% |
| Communications | 0 | 0.0% |
| Arts & Humanities | 13 | 15.1% |
| Total | 86 | 100.0% |
Transportation & Commute in Black Rock
Vehicle Availability by Sex in Black Rock
The most prevalent vehicle ownership categories in Black Rock are males with 1 vehicle (68, accounting for 34.0%) and females with 1 vehicle (84, making up 27.0%).
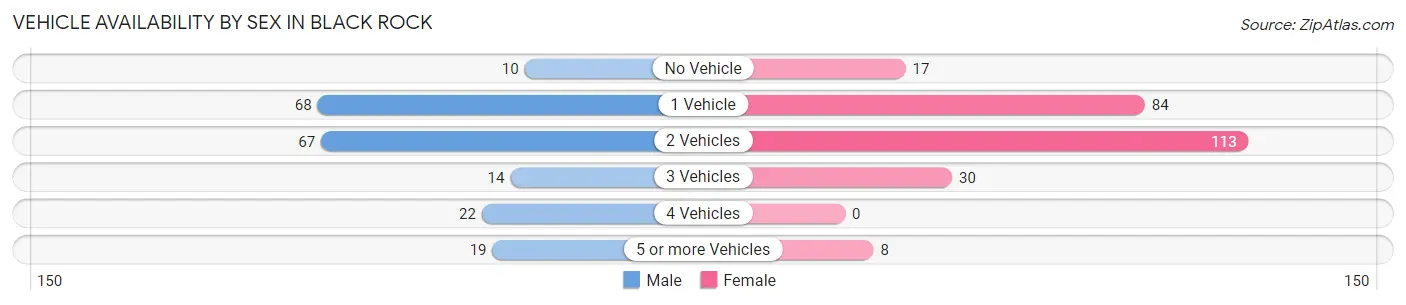
| Vehicles Available | Male | Female |
| No Vehicle | 10 (5.0%) | 17 (6.8%) |
| 1 Vehicle | 68 (34.0%) | 84 (33.3%) |
| 2 Vehicles | 67 (33.5%) | 113 (44.8%) |
| 3 Vehicles | 14 (7.0%) | 30 (11.9%) |
| 4 Vehicles | 22 (11.0%) | 0 (0.0%) |
| 5 or more Vehicles | 19 (9.5%) | 8 (3.2%) |
| Total | 200 (100.0%) | 252 (100.0%) |
Commute Time in Black Rock
The most frequently occuring commute durations in Black Rock are 10 to 14 minutes (90 commuters, 25.9%), 5 to 9 minutes (72 commuters, 20.7%), and 60 to 89 minutes (62 commuters, 17.8%).
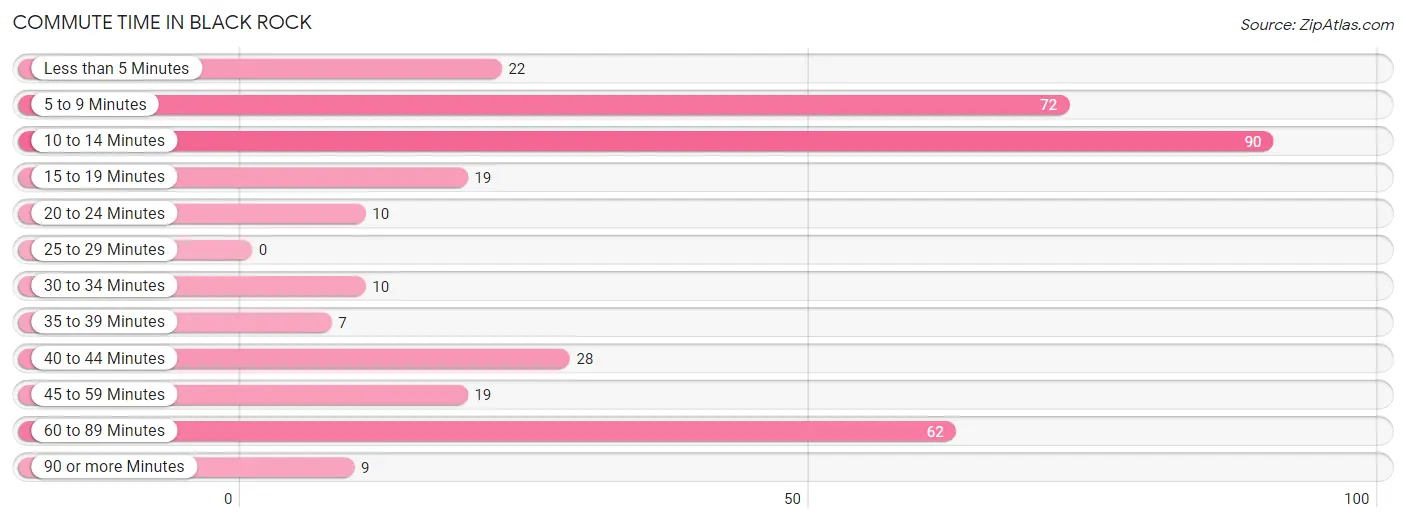
| Commute Time | # Commuters | % Commuters |
| Less than 5 Minutes | 22 | 6.3% |
| 5 to 9 Minutes | 72 | 20.7% |
| 10 to 14 Minutes | 90 | 25.9% |
| 15 to 19 Minutes | 19 | 5.5% |
| 20 to 24 Minutes | 10 | 2.9% |
| 25 to 29 Minutes | 0 | 0.0% |
| 30 to 34 Minutes | 10 | 2.9% |
| 35 to 39 Minutes | 7 | 2.0% |
| 40 to 44 Minutes | 28 | 8.1% |
| 45 to 59 Minutes | 19 | 5.5% |
| 60 to 89 Minutes | 62 | 17.8% |
| 90 or more Minutes | 9 | 2.6% |
Commute Time by Sex in Black Rock
The most common commute times in Black Rock are 10 to 14 minutes (46 commuters, 30.9%) for males and 60 to 89 minutes (55 commuters, 27.6%) for females.
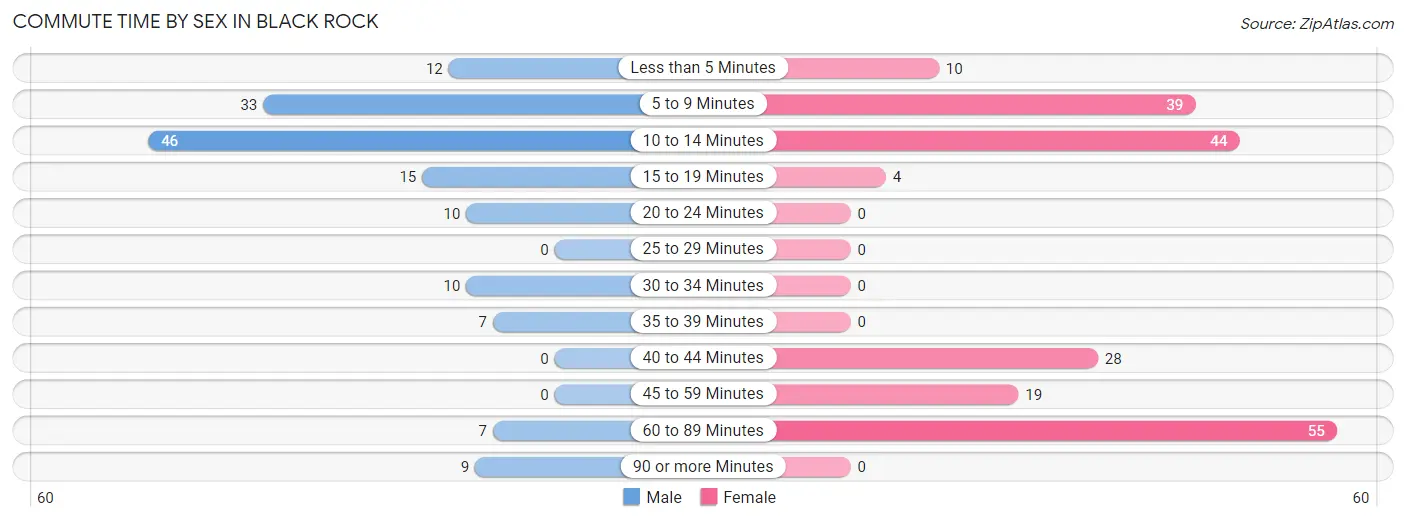
| Commute Time | Male | Female |
| Less than 5 Minutes | 12 (8.1%) | 10 (5.0%) |
| 5 to 9 Minutes | 33 (22.2%) | 39 (19.6%) |
| 10 to 14 Minutes | 46 (30.9%) | 44 (22.1%) |
| 15 to 19 Minutes | 15 (10.1%) | 4 (2.0%) |
| 20 to 24 Minutes | 10 (6.7%) | 0 (0.0%) |
| 25 to 29 Minutes | 0 (0.0%) | 0 (0.0%) |
| 30 to 34 Minutes | 10 (6.7%) | 0 (0.0%) |
| 35 to 39 Minutes | 7 (4.7%) | 0 (0.0%) |
| 40 to 44 Minutes | 0 (0.0%) | 28 (14.1%) |
| 45 to 59 Minutes | 0 (0.0%) | 19 (9.6%) |
| 60 to 89 Minutes | 7 (4.7%) | 55 (27.6%) |
| 90 or more Minutes | 9 (6.0%) | 0 (0.0%) |
Time of Departure to Work by Sex in Black Rock
The most frequent times of departure to work in Black Rock are 7:30 AM to 7:59 AM (85, 57.1%) for males and 7:30 AM to 7:59 AM (71, 35.7%) for females.
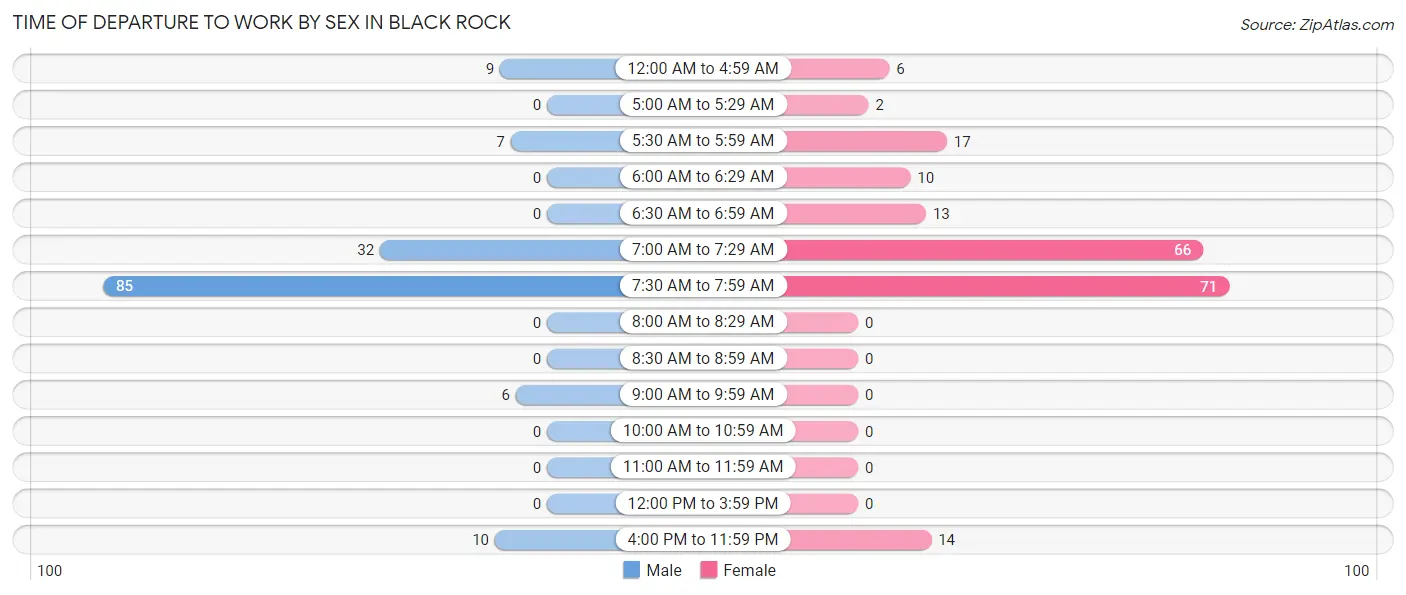
| Time of Departure | Male | Female |
| 12:00 AM to 4:59 AM | 9 (6.0%) | 6 (3.0%) |
| 5:00 AM to 5:29 AM | 0 (0.0%) | 2 (1.0%) |
| 5:30 AM to 5:59 AM | 7 (4.7%) | 17 (8.5%) |
| 6:00 AM to 6:29 AM | 0 (0.0%) | 10 (5.0%) |
| 6:30 AM to 6:59 AM | 0 (0.0%) | 13 (6.5%) |
| 7:00 AM to 7:29 AM | 32 (21.5%) | 66 (33.2%) |
| 7:30 AM to 7:59 AM | 85 (57.1%) | 71 (35.7%) |
| 8:00 AM to 8:29 AM | 0 (0.0%) | 0 (0.0%) |
| 8:30 AM to 8:59 AM | 0 (0.0%) | 0 (0.0%) |
| 9:00 AM to 9:59 AM | 6 (4.0%) | 0 (0.0%) |
| 10:00 AM to 10:59 AM | 0 (0.0%) | 0 (0.0%) |
| 11:00 AM to 11:59 AM | 0 (0.0%) | 0 (0.0%) |
| 12:00 PM to 3:59 PM | 0 (0.0%) | 0 (0.0%) |
| 4:00 PM to 11:59 PM | 10 (6.7%) | 14 (7.0%) |
| Total | 149 (100.0%) | 199 (100.0%) |
Housing Occupancy in Black Rock
Occupancy by Ownership in Black Rock
Of the total 296 dwellings in Black Rock, owner-occupied units account for 64 (21.6%), while renter-occupied units make up 232 (78.4%).
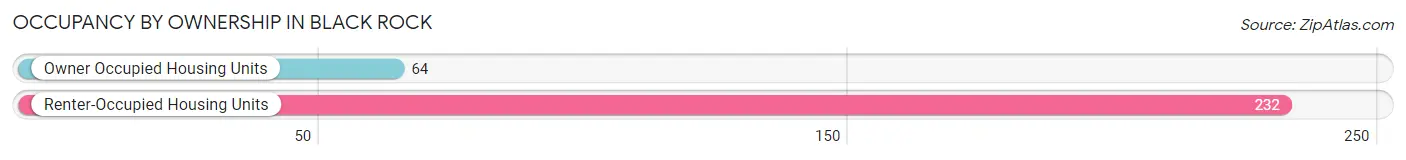
| Occupancy | # Housing Units | % Housing Units |
| Owner Occupied Housing Units | 64 | 21.6% |
| Renter-Occupied Housing Units | 232 | 78.4% |
| Total Occupied Housing Units | 296 | 100.0% |
Occupancy by Household Size in Black Rock
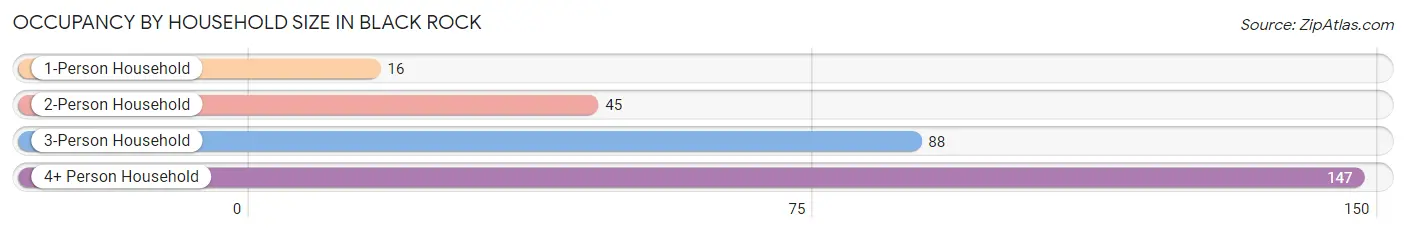
| Household Size | # Housing Units | % Housing Units |
| 1-Person Household | 16 | 5.4% |
| 2-Person Household | 45 | 15.2% |
| 3-Person Household | 88 | 29.7% |
| 4+ Person Household | 147 | 49.7% |
| Total Housing Units | 296 | 100.0% |
Occupancy by Ownership by Household Size in Black Rock
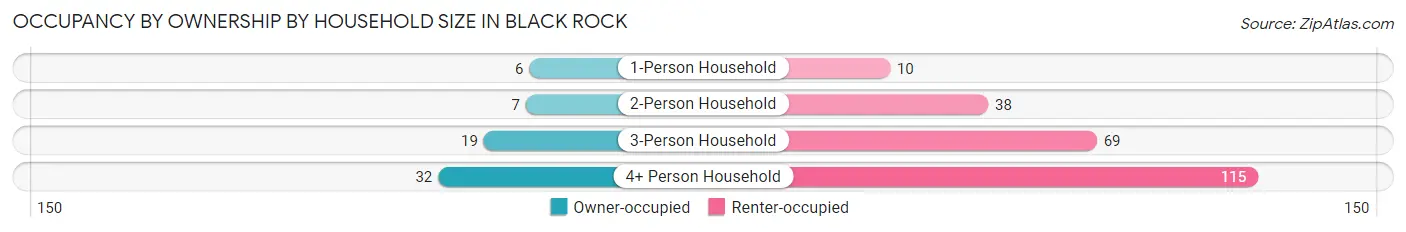
| Household Size | Owner-occupied | Renter-occupied |
| 1-Person Household | 6 (37.5%) | 10 (62.5%) |
| 2-Person Household | 7 (15.6%) | 38 (84.4%) |
| 3-Person Household | 19 (21.6%) | 69 (78.4%) |
| 4+ Person Household | 32 (21.8%) | 115 (78.2%) |
| Total Housing Units | 64 (21.6%) | 232 (78.4%) |
Occupancy by Educational Attainment in Black Rock
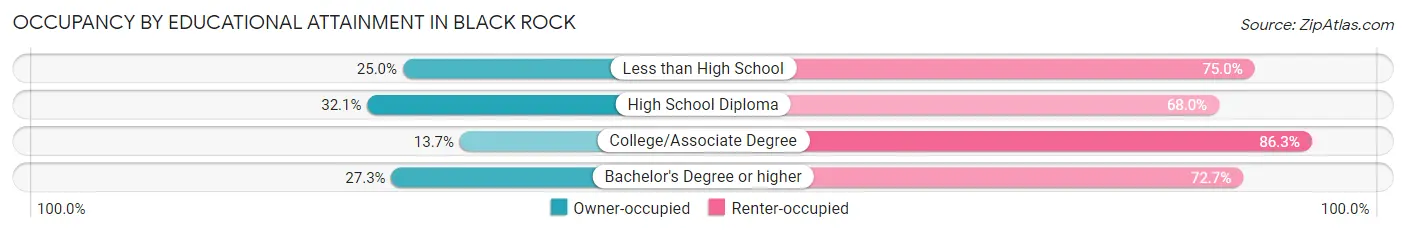
| Household Size | Owner-occupied | Renter-occupied |
| Less than High School | 7 (25.0%) | 21 (75.0%) |
| High School Diploma | 25 (32.1%) | 53 (67.9%) |
| College/Associate Degree | 20 (13.7%) | 126 (86.3%) |
| Bachelor's Degree or higher | 12 (27.3%) | 32 (72.7%) |
Occupancy by Age of Householder in Black Rock
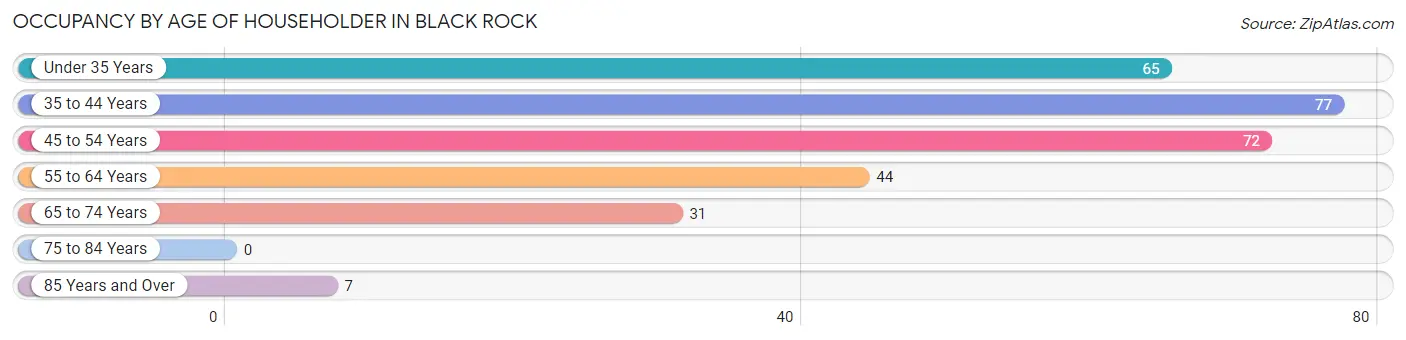
| Age Bracket | # Households | % Households |
| Under 35 Years | 65 | 22.0% |
| 35 to 44 Years | 77 | 26.0% |
| 45 to 54 Years | 72 | 24.3% |
| 55 to 64 Years | 44 | 14.9% |
| 65 to 74 Years | 31 | 10.5% |
| 75 to 84 Years | 0 | 0.0% |
| 85 Years and Over | 7 | 2.4% |
| Total | 296 | 100.0% |
Housing Finances in Black Rock
Median Income by Occupancy in Black Rock
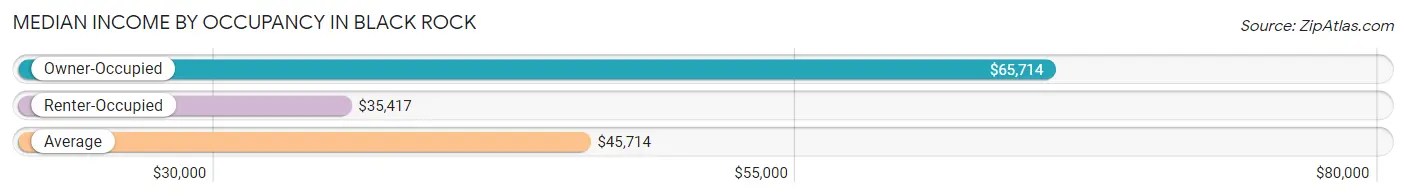
| Occupancy Type | # Households | Median Income |
| Owner-Occupied | 64 (21.6%) | $65,714 |
| Renter-Occupied | 232 (78.4%) | $35,417 |
| Average | 296 (100.0%) | $45,714 |
Occupancy by Householder Income Bracket in Black Rock
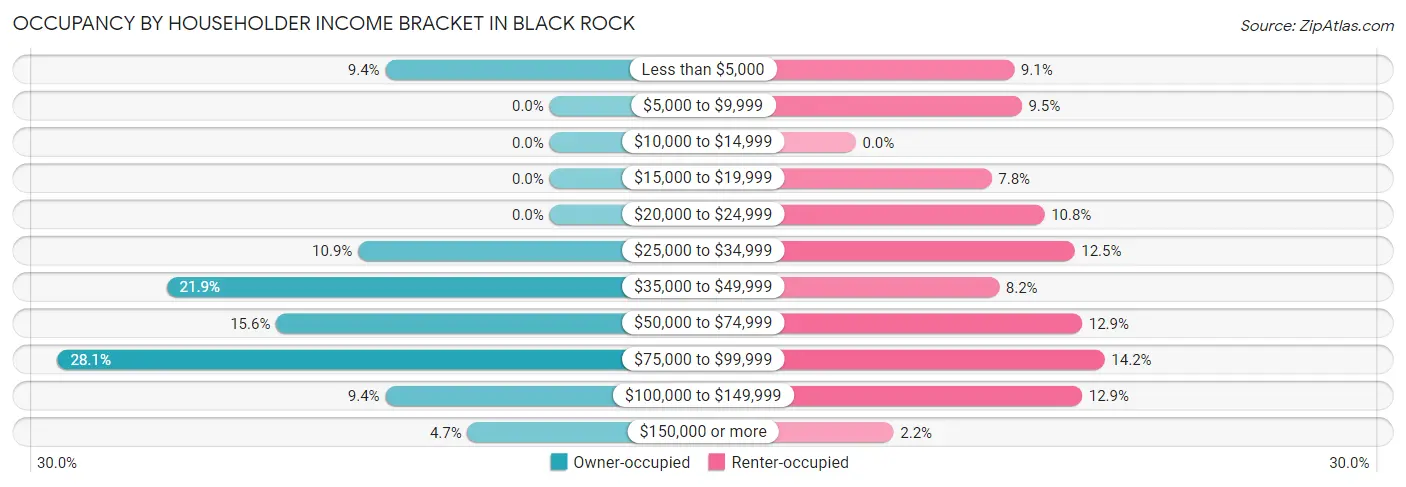
| Income Bracket | Owner-occupied | Renter-occupied |
| Less than $5,000 | 6 (9.4%) | 21 (9.0%) |
| $5,000 to $9,999 | 0 (0.0%) | 22 (9.5%) |
| $10,000 to $14,999 | 0 (0.0%) | 0 (0.0%) |
| $15,000 to $19,999 | 0 (0.0%) | 18 (7.8%) |
| $20,000 to $24,999 | 0 (0.0%) | 25 (10.8%) |
| $25,000 to $34,999 | 7 (10.9%) | 29 (12.5%) |
| $35,000 to $49,999 | 14 (21.9%) | 19 (8.2%) |
| $50,000 to $74,999 | 10 (15.6%) | 30 (12.9%) |
| $75,000 to $99,999 | 18 (28.1%) | 33 (14.2%) |
| $100,000 to $149,999 | 6 (9.4%) | 30 (12.9%) |
| $150,000 or more | 3 (4.7%) | 5 (2.2%) |
| Total | 64 (100.0%) | 232 (100.0%) |
Monthly Housing Cost Tiers in Black Rock
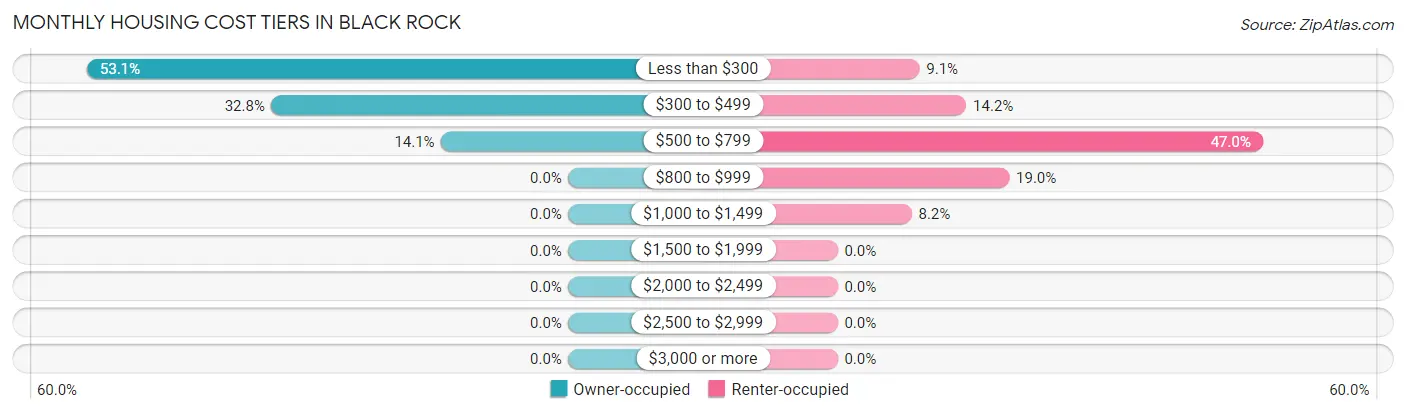
| Monthly Cost | Owner-occupied | Renter-occupied |
| Less than $300 | 34 (53.1%) | 21 (9.0%) |
| $300 to $499 | 21 (32.8%) | 33 (14.2%) |
| $500 to $799 | 9 (14.1%) | 109 (47.0%) |
| $800 to $999 | 0 (0.0%) | 44 (19.0%) |
| $1,000 to $1,499 | 0 (0.0%) | 19 (8.2%) |
| $1,500 to $1,999 | 0 (0.0%) | 0 (0.0%) |
| $2,000 to $2,499 | 0 (0.0%) | 0 (0.0%) |
| $2,500 to $2,999 | 0 (0.0%) | 0 (0.0%) |
| $3,000 or more | 0 (0.0%) | 0 (0.0%) |
| Total | 64 (100.0%) | 232 (100.0%) |
Physical Housing Characteristics in Black Rock
Housing Structures in Black Rock
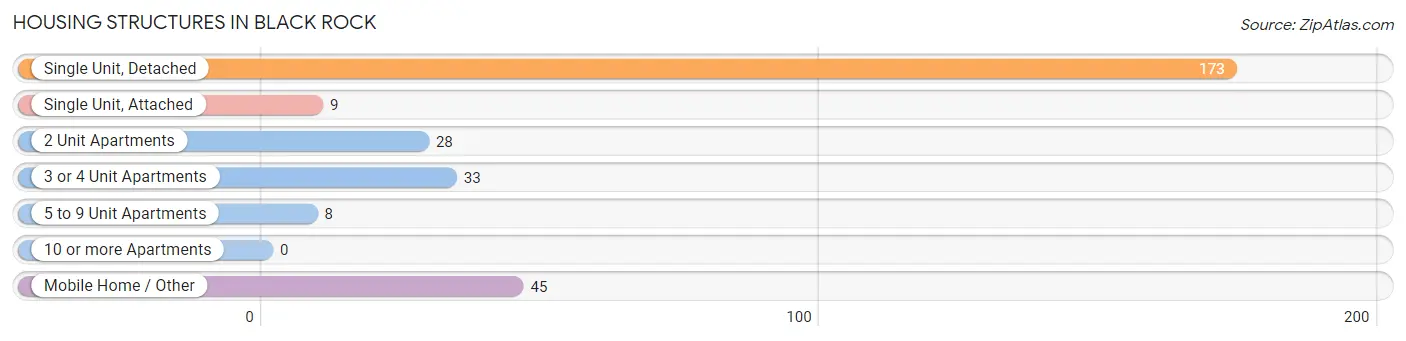
| Structure Type | # Housing Units | % Housing Units |
| Single Unit, Detached | 173 | 58.5% |
| Single Unit, Attached | 9 | 3.0% |
| 2 Unit Apartments | 28 | 9.5% |
| 3 or 4 Unit Apartments | 33 | 11.2% |
| 5 to 9 Unit Apartments | 8 | 2.7% |
| 10 or more Apartments | 0 | 0.0% |
| Mobile Home / Other | 45 | 15.2% |
| Total | 296 | 100.0% |
Housing Structures by Occupancy in Black Rock
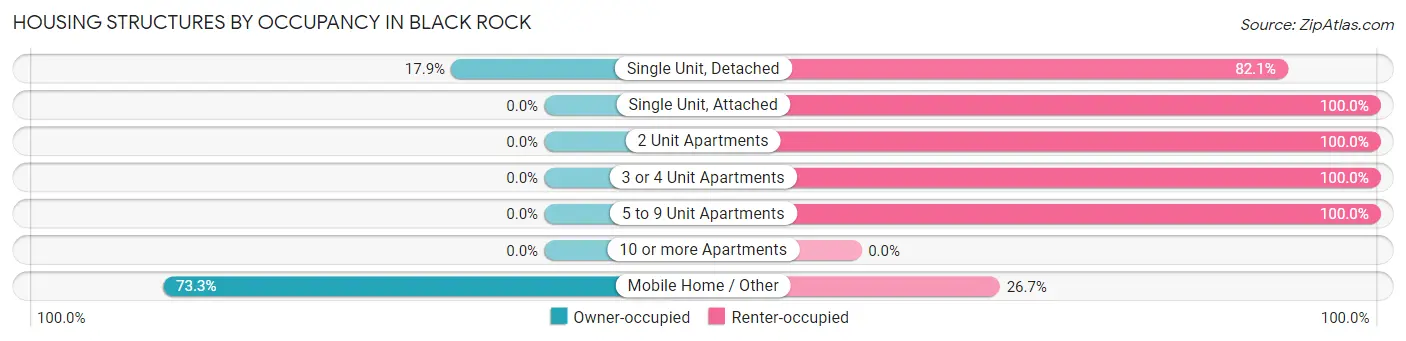
| Structure Type | Owner-occupied | Renter-occupied |
| Single Unit, Detached | 31 (17.9%) | 142 (82.1%) |
| Single Unit, Attached | 0 (0.0%) | 9 (100.0%) |
| 2 Unit Apartments | 0 (0.0%) | 28 (100.0%) |
| 3 or 4 Unit Apartments | 0 (0.0%) | 33 (100.0%) |
| 5 to 9 Unit Apartments | 0 (0.0%) | 8 (100.0%) |
| 10 or more Apartments | 0 (0.0%) | 0 (0.0%) |
| Mobile Home / Other | 33 (73.3%) | 12 (26.7%) |
| Total | 64 (21.6%) | 232 (78.4%) |
Housing Structures by Number of Rooms in Black Rock
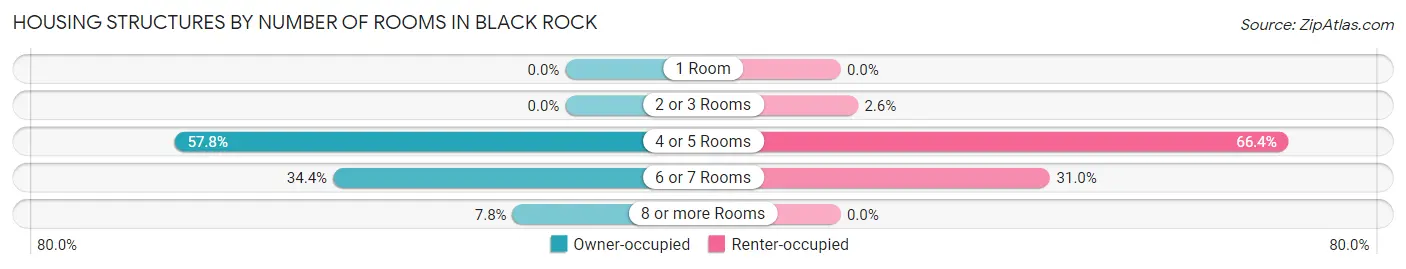
| Number of Rooms | Owner-occupied | Renter-occupied |
| 1 Room | 0 (0.0%) | 0 (0.0%) |
| 2 or 3 Rooms | 0 (0.0%) | 6 (2.6%) |
| 4 or 5 Rooms | 37 (57.8%) | 154 (66.4%) |
| 6 or 7 Rooms | 22 (34.4%) | 72 (31.0%) |
| 8 or more Rooms | 5 (7.8%) | 0 (0.0%) |
| Total | 64 (100.0%) | 232 (100.0%) |
Housing Structure by Heating Type in Black Rock
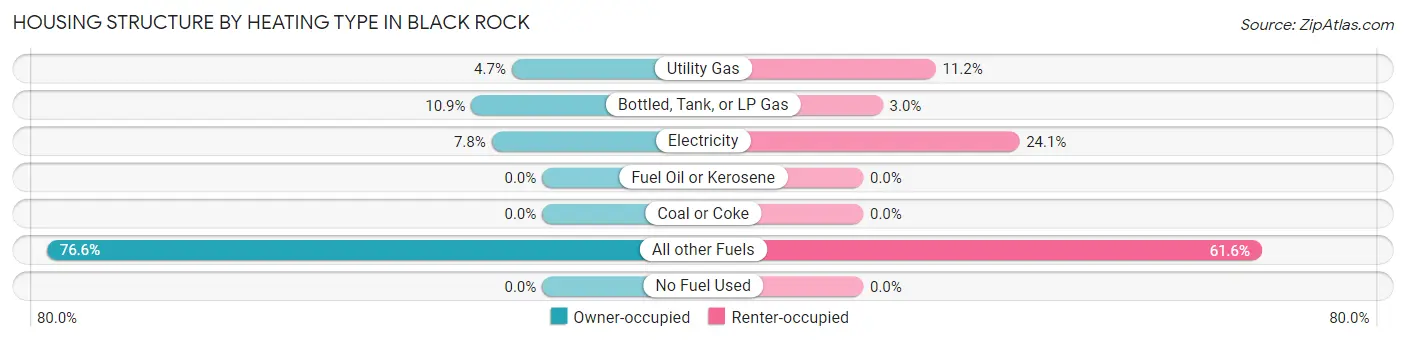
| Heating Type | Owner-occupied | Renter-occupied |
| Utility Gas | 3 (4.7%) | 26 (11.2%) |
| Bottled, Tank, or LP Gas | 7 (10.9%) | 7 (3.0%) |
| Electricity | 5 (7.8%) | 56 (24.1%) |
| Fuel Oil or Kerosene | 0 (0.0%) | 0 (0.0%) |
| Coal or Coke | 0 (0.0%) | 0 (0.0%) |
| All other Fuels | 49 (76.6%) | 143 (61.6%) |
| No Fuel Used | 0 (0.0%) | 0 (0.0%) |
| Total | 64 (100.0%) | 232 (100.0%) |
Household Vehicle Usage in Black Rock

| Vehicles per Household | Owner-occupied | Renter-occupied |
| No Vehicle | 0 (0.0%) | 33 (14.2%) |
| 1 Vehicle | 9 (14.1%) | 125 (53.9%) |
| 2 Vehicles | 21 (32.8%) | 64 (27.6%) |
| 3 or more Vehicles | 34 (53.1%) | 10 (4.3%) |
| Total | 64 (100.0%) | 232 (100.0%) |
Real Estate & Mortgages in Black Rock
Real Estate and Mortgage Overview in Black Rock
| Characteristic | Without Mortgage | With Mortgage |
| Housing Units | 55 | 9 |
| Median Property Value | $95,800 | $0 |
| Median Household Income | $62,917 | $3 |
| Monthly Housing Costs | $185 | $0 |
| Real Estate Taxes | - | - |
Property Value by Mortgage Status in Black Rock
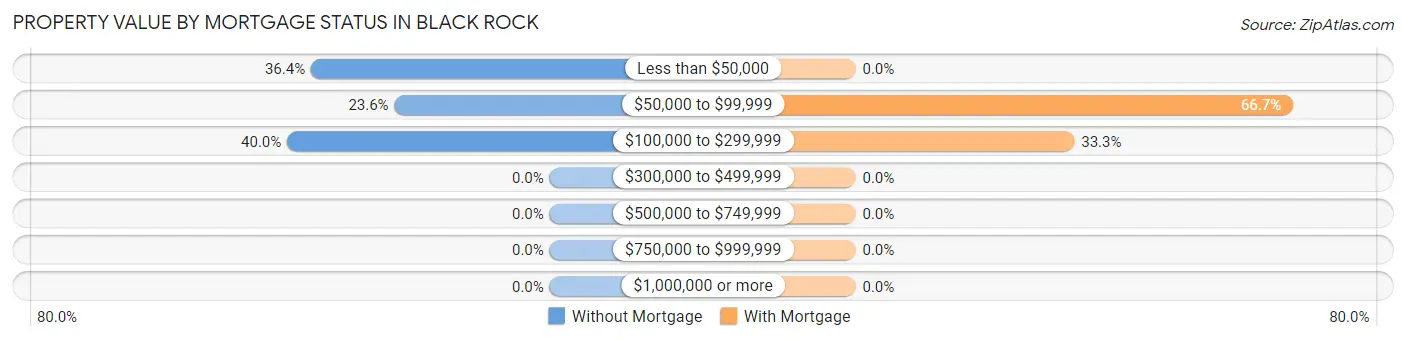
| Property Value | Without Mortgage | With Mortgage |
| Less than $50,000 | 20 (36.4%) | 0 (0.0%) |
| $50,000 to $99,999 | 13 (23.6%) | 6 (66.7%) |
| $100,000 to $299,999 | 22 (40.0%) | 3 (33.3%) |
| $300,000 to $499,999 | 0 (0.0%) | 0 (0.0%) |
| $500,000 to $749,999 | 0 (0.0%) | 0 (0.0%) |
| $750,000 to $999,999 | 0 (0.0%) | 0 (0.0%) |
| $1,000,000 or more | 0 (0.0%) | 0 (0.0%) |
| Total | 55 (100.0%) | 9 (100.0%) |
Household Income by Mortgage Status in Black Rock
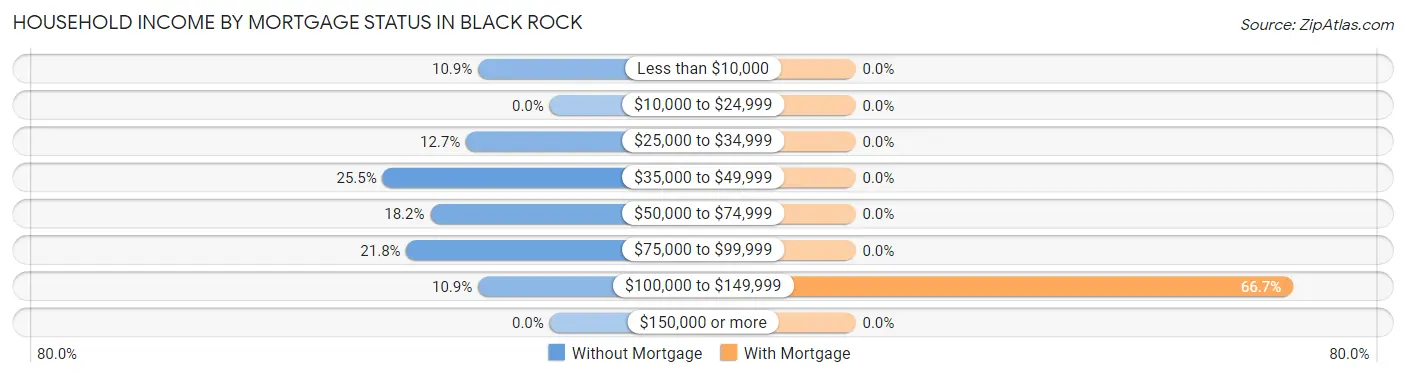
| Household Income | Without Mortgage | With Mortgage |
| Less than $10,000 | 6 (10.9%) | 0 (0.0%) |
| $10,000 to $24,999 | 0 (0.0%) | 0 (0.0%) |
| $25,000 to $34,999 | 7 (12.7%) | 0 (0.0%) |
| $35,000 to $49,999 | 14 (25.5%) | 0 (0.0%) |
| $50,000 to $74,999 | 10 (18.2%) | 0 (0.0%) |
| $75,000 to $99,999 | 12 (21.8%) | 0 (0.0%) |
| $100,000 to $149,999 | 6 (10.9%) | 6 (66.7%) |
| $150,000 or more | 0 (0.0%) | 0 (0.0%) |
| Total | 55 (100.0%) | 9 (100.0%) |
Property Value to Household Income Ratio in Black Rock
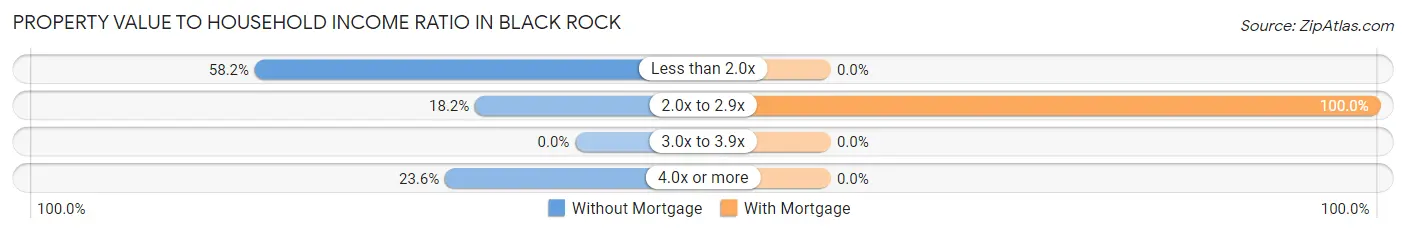
| Value-to-Income Ratio | Without Mortgage | With Mortgage |
| Less than 2.0x | 32 (58.2%) | 0 (0.0%) |
| 2.0x to 2.9x | 10 (18.2%) | 9 (100.0%) |
| 3.0x to 3.9x | 0 (0.0%) | 0 (0.0%) |
| 4.0x or more | 13 (23.6%) | 0 (0.0%) |
| Total | 55 (100.0%) | 9 (100.0%) |
Real Estate Taxes by Mortgage Status in Black Rock
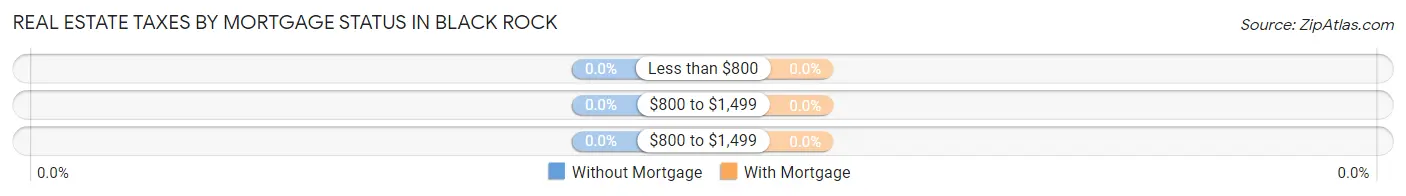
| Property Taxes | Without Mortgage | With Mortgage |
| Less than $800 | 0 (0.0%) | 0 (0.0%) |
| $800 to $1,499 | 0 (0.0%) | 0 (0.0%) |
| $800 to $1,499 | 0 (0.0%) | 0 (0.0%) |
| Total | 55 (100.0%) | 9 (100.0%) |
Health & Disability in Black Rock
Health Insurance Coverage by Age in Black Rock
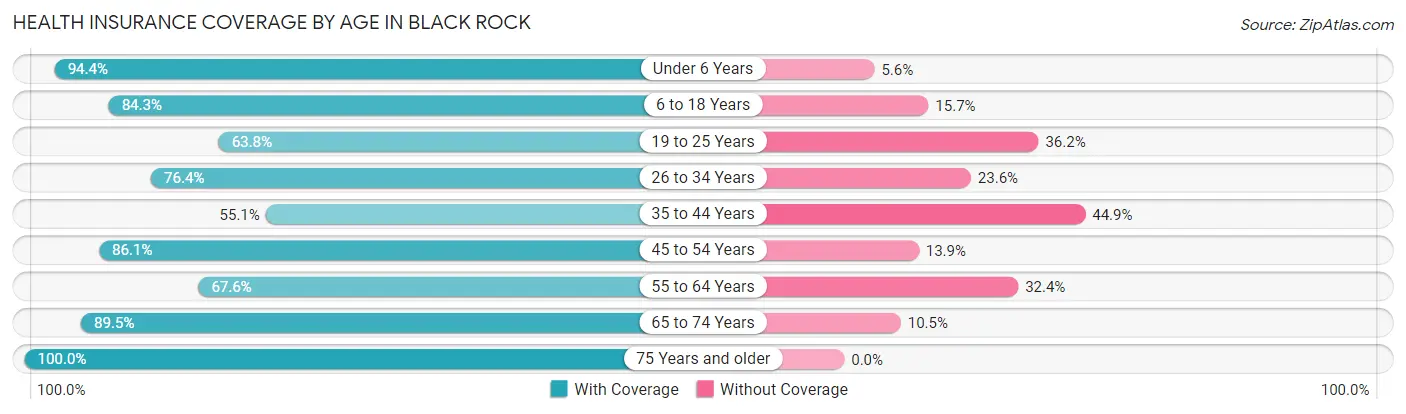
| Age Bracket | With Coverage | Without Coverage |
| Under 6 Years | 84 (94.4%) | 5 (5.6%) |
| 6 to 18 Years | 274 (84.3%) | 51 (15.7%) |
| 19 to 25 Years | 111 (63.8%) | 63 (36.2%) |
| 26 to 34 Years | 165 (76.4%) | 51 (23.6%) |
| 35 to 44 Years | 98 (55.1%) | 80 (44.9%) |
| 45 to 54 Years | 124 (86.1%) | 20 (13.9%) |
| 55 to 64 Years | 50 (67.6%) | 24 (32.4%) |
| 65 to 74 Years | 34 (89.5%) | 4 (10.5%) |
| 75 Years and older | 21 (100.0%) | 0 (0.0%) |
| Total | 961 (76.3%) | 298 (23.7%) |
Health Insurance Coverage by Citizenship Status in Black Rock
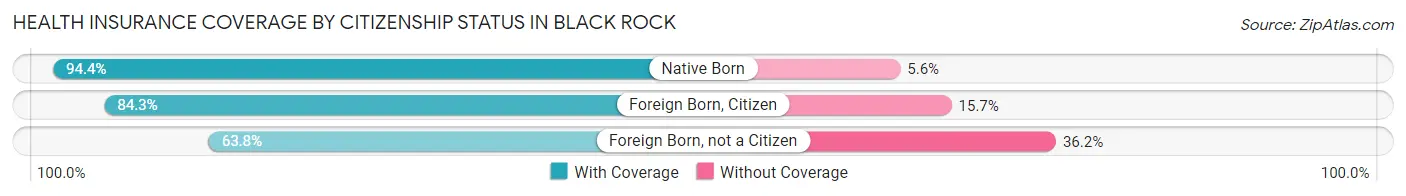
| Citizenship Status | With Coverage | Without Coverage |
| Native Born | 84 (94.4%) | 5 (5.6%) |
| Foreign Born, Citizen | 274 (84.3%) | 51 (15.7%) |
| Foreign Born, not a Citizen | 111 (63.8%) | 63 (36.2%) |
Health Insurance Coverage by Household Income in Black Rock
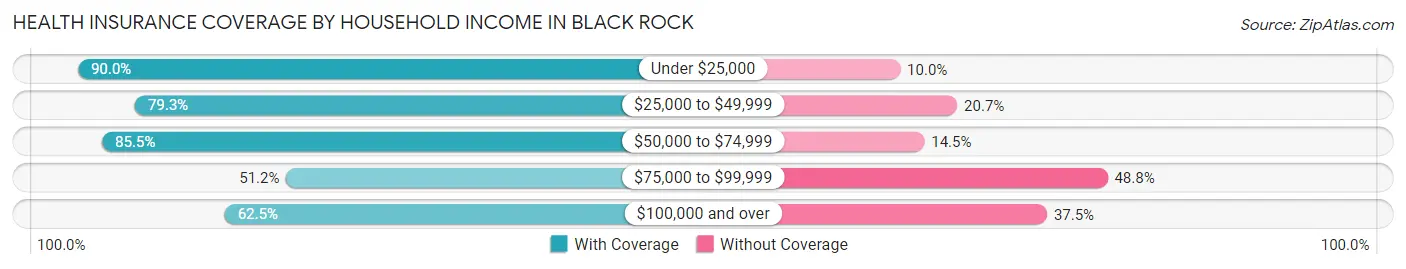
| Household Income | With Coverage | Without Coverage |
| Under $25,000 | 306 (90.0%) | 34 (10.0%) |
| $25,000 to $49,999 | 211 (79.3%) | 55 (20.7%) |
| $50,000 to $74,999 | 206 (85.5%) | 35 (14.5%) |
| $75,000 to $99,999 | 88 (51.2%) | 84 (48.8%) |
| $100,000 and over | 150 (62.5%) | 90 (37.5%) |
Public vs Private Health Insurance Coverage by Age in Black Rock
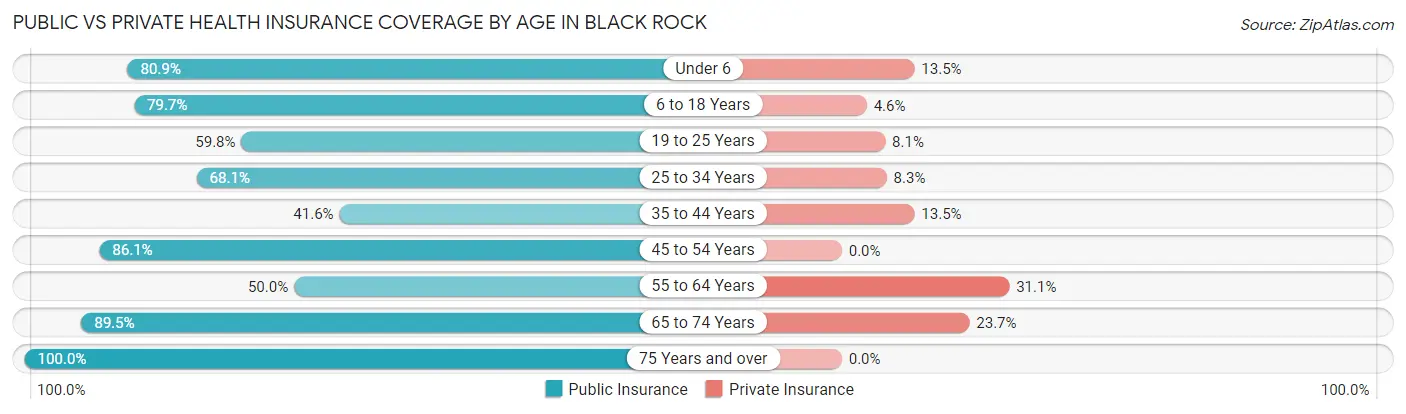
| Age Bracket | Public Insurance | Private Insurance |
| Under 6 | 72 (80.9%) | 12 (13.5%) |
| 6 to 18 Years | 259 (79.7%) | 15 (4.6%) |
| 19 to 25 Years | 104 (59.8%) | 14 (8.1%) |
| 25 to 34 Years | 147 (68.1%) | 18 (8.3%) |
| 35 to 44 Years | 74 (41.6%) | 24 (13.5%) |
| 45 to 54 Years | 124 (86.1%) | 0 (0.0%) |
| 55 to 64 Years | 37 (50.0%) | 23 (31.1%) |
| 65 to 74 Years | 34 (89.5%) | 9 (23.7%) |
| 75 Years and over | 21 (100.0%) | 0 (0.0%) |
| Total | 872 (69.3%) | 115 (9.1%) |
Disability Status by Sex by Age in Black Rock
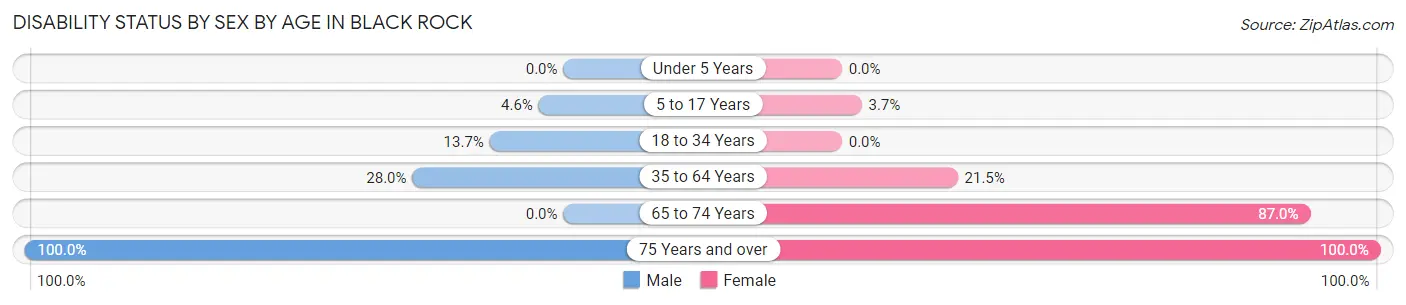
| Age Bracket | Male | Female |
| Under 5 Years | 0 (0.0%) | 0 (0.0%) |
| 5 to 17 Years | 6 (4.6%) | 7 (3.7%) |
| 18 to 34 Years | 26 (13.7%) | 0 (0.0%) |
| 35 to 64 Years | 51 (28.0%) | 46 (21.5%) |
| 65 to 74 Years | 0 (0.0%) | 20 (87.0%) |
| 75 Years and over | 14 (100.0%) | 7 (100.0%) |
Disability Class by Sex by Age in Black Rock
Disability Class: Hearing Difficulty
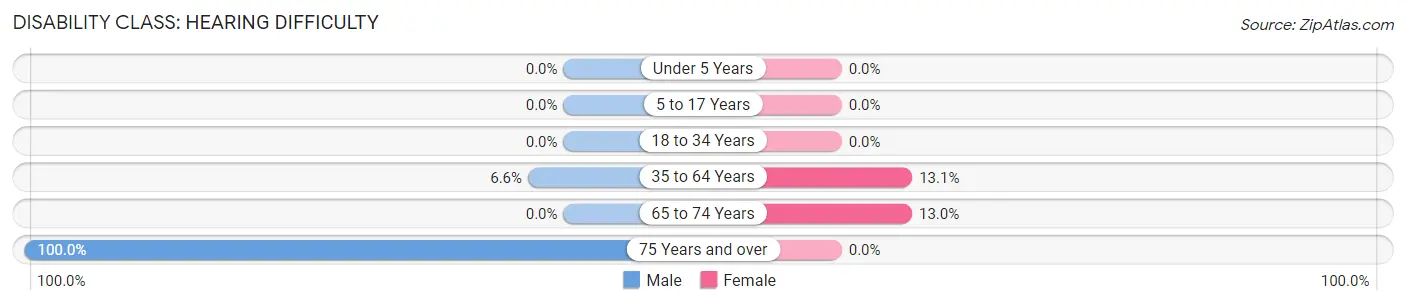
| Age Bracket | Male | Female |
| Under 5 Years | 0 (0.0%) | 0 (0.0%) |
| 5 to 17 Years | 0 (0.0%) | 0 (0.0%) |
| 18 to 34 Years | 0 (0.0%) | 0 (0.0%) |
| 35 to 64 Years | 12 (6.6%) | 28 (13.1%) |
| 65 to 74 Years | 0 (0.0%) | 3 (13.0%) |
| 75 Years and over | 14 (100.0%) | 0 (0.0%) |
Disability Class: Vision Difficulty
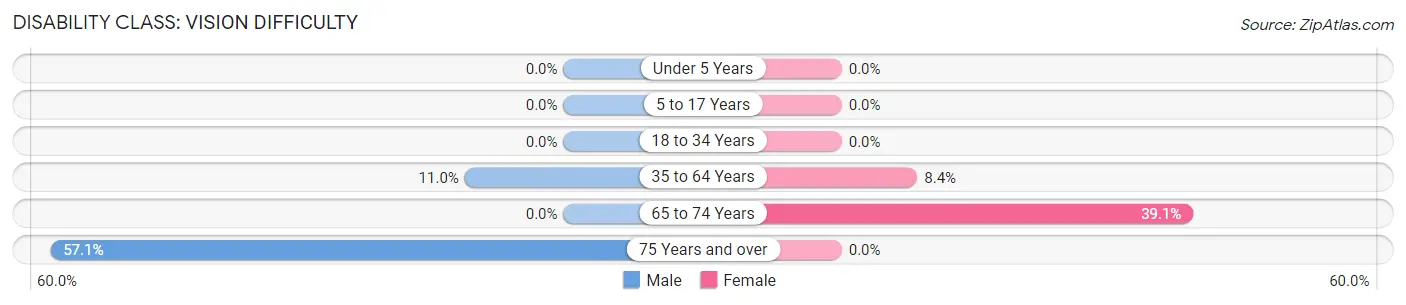
| Age Bracket | Male | Female |
| Under 5 Years | 0 (0.0%) | 0 (0.0%) |
| 5 to 17 Years | 0 (0.0%) | 0 (0.0%) |
| 18 to 34 Years | 0 (0.0%) | 0 (0.0%) |
| 35 to 64 Years | 20 (11.0%) | 18 (8.4%) |
| 65 to 74 Years | 0 (0.0%) | 9 (39.1%) |
| 75 Years and over | 8 (57.1%) | 0 (0.0%) |
Disability Class: Cognitive Difficulty
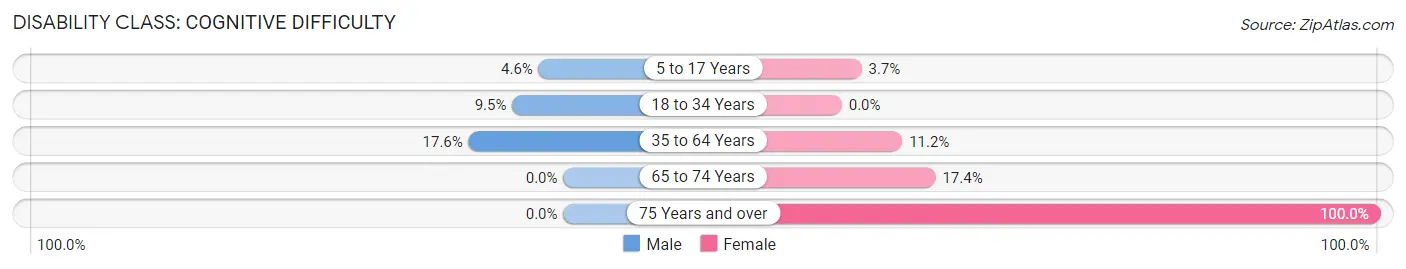
| Age Bracket | Male | Female |
| 5 to 17 Years | 6 (4.6%) | 7 (3.7%) |
| 18 to 34 Years | 18 (9.5%) | 0 (0.0%) |
| 35 to 64 Years | 32 (17.6%) | 24 (11.2%) |
| 65 to 74 Years | 0 (0.0%) | 4 (17.4%) |
| 75 Years and over | 0 (0.0%) | 7 (100.0%) |
Disability Class: Ambulatory Difficulty
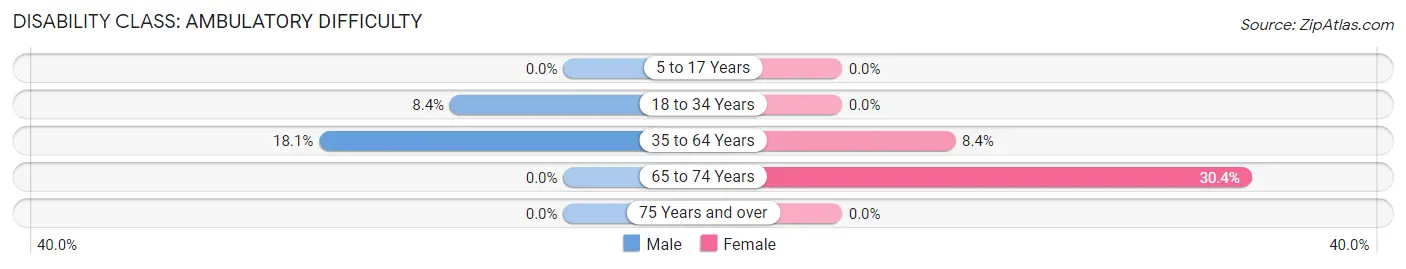
| Age Bracket | Male | Female |
| 5 to 17 Years | 0 (0.0%) | 0 (0.0%) |
| 18 to 34 Years | 16 (8.4%) | 0 (0.0%) |
| 35 to 64 Years | 33 (18.1%) | 18 (8.4%) |
| 65 to 74 Years | 0 (0.0%) | 7 (30.4%) |
| 75 Years and over | 0 (0.0%) | 0 (0.0%) |
Disability Class: Self-Care Difficulty
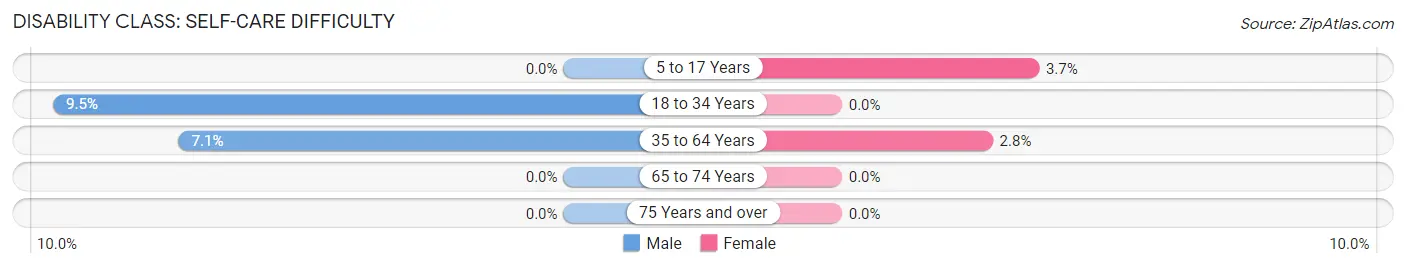
| Age Bracket | Male | Female |
| 5 to 17 Years | 0 (0.0%) | 7 (3.7%) |
| 18 to 34 Years | 18 (9.5%) | 0 (0.0%) |
| 35 to 64 Years | 13 (7.1%) | 6 (2.8%) |
| 65 to 74 Years | 0 (0.0%) | 0 (0.0%) |
| 75 Years and over | 0 (0.0%) | 0 (0.0%) |
Technology Access in Black Rock
Computing Device Access in Black Rock
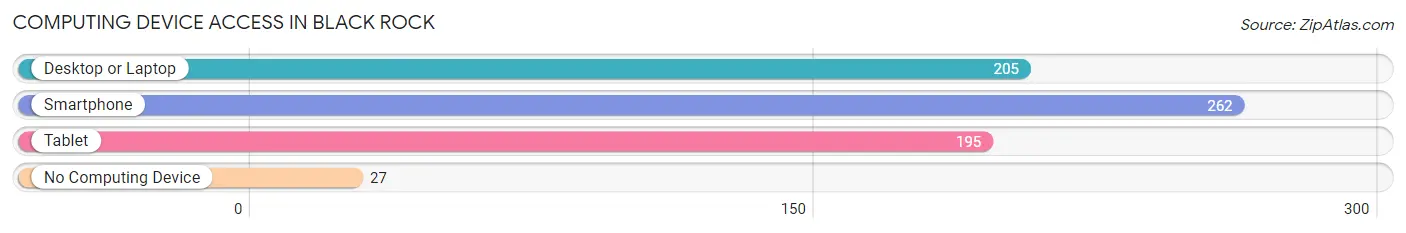
| Device Type | # Households | % Households |
| Desktop or Laptop | 205 | 69.3% |
| Smartphone | 262 | 88.5% |
| Tablet | 195 | 65.9% |
| No Computing Device | 27 | 9.1% |
| Total | 296 | 100.0% |
Internet Access in Black Rock
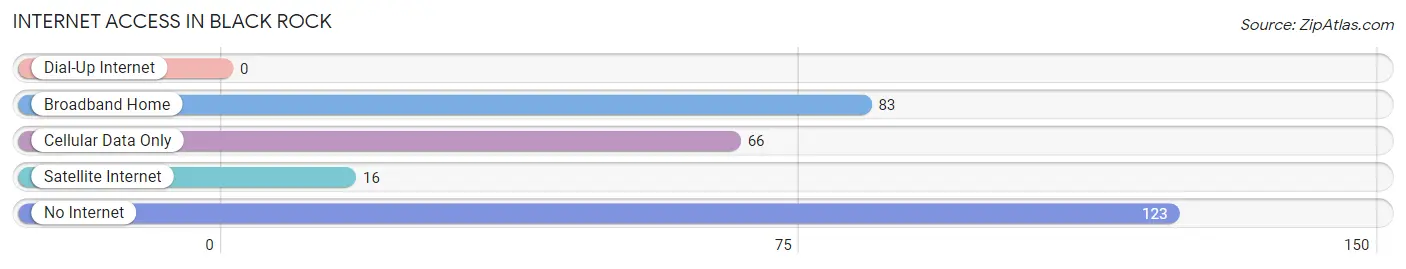
| Internet Type | # Households | % Households |
| Dial-Up Internet | 0 | 0.0% |
| Broadband Home | 83 | 28.0% |
| Cellular Data Only | 66 | 22.3% |
| Satellite Internet | 16 | 5.4% |
| No Internet | 123 | 41.5% |
| Total | 296 | 100.0% |
Black Rock Summary
Black Rock is a small unincorporated community located in the northwest corner of New Mexico. It is situated in the high desert of the San Juan Basin, near the Four Corners region. The area is known for its rugged beauty and its rich cultural heritage.
History
The area around Black Rock has been inhabited for thousands of years. The earliest known inhabitants were the Anasazi, who lived in the area from around 1000 BC to 1300 AD. The Navajo Nation also has a long history in the area, and the Navajo language is still spoken by many of the residents.
The first European settlers arrived in the area in the late 1800s. The town of Black Rock was established in 1883, and the first post office was established in 1884. The town was named after the nearby Black Rock Mesa, which was a prominent landmark in the area.
The town grew slowly over the years, and by the early 1900s it had a population of around 200 people. The town was primarily a farming and ranching community, and it was also known for its mining operations.
Geography
Black Rock is located in the northwest corner of New Mexico, near the Four Corners region. The town is situated in the high desert of the San Juan Basin, at an elevation of 5,400 feet. The area is known for its rugged beauty, with red sandstone cliffs, mesas, and canyons.
The climate in Black Rock is semi-arid, with hot summers and cold winters. The average annual precipitation is around 8 inches, and the average annual temperature is around 50 degrees Fahrenheit.
Economy
The economy of Black Rock is primarily based on agriculture and ranching. The town is also known for its mining operations, which produce copper, uranium, and other minerals.
The town also has a small tourism industry, with visitors coming to the area to enjoy the rugged beauty of the landscape.
Demographics
As of the 2010 census, the population of Black Rock was 545. The racial makeup of the town was 94.3% White, 0.7% African American, 0.7% Native American, 0.2% Asian, 0.2% Pacific Islander, and 3.1% from other races.
The median household income in Black Rock was $31,250, and the median family income was $35,000. The per capita income was $14,845. About 17.2% of the population was below the poverty line.
Conclusion
Black Rock is a small unincorporated community located in the northwest corner of New Mexico. It is situated in the high desert of the San Juan Basin, near the Four Corners region. The area is known for its rugged beauty and its rich cultural heritage. The economy of Black Rock is primarily based on agriculture and ranching, and the town also has a small tourism industry. As of the 2010 census, the population of Black Rock was 545. The racial makeup of the town was 94.3% White, 0.7% African American, 0.7% Native American, 0.2% Asian, 0.2% Pacific Islander, and 3.1% from other races. The median household income in Black Rock was $31,250, and the median family income was $35,000. The per capita income was $14,845. About 17.2% of the population was below the poverty line.
Common Questions
What is Per Capita Income in Black Rock?
Per Capita income in Black Rock is $14,885.
What is the Median Family Income in Black Rock?
Median Family Income in Black Rock is $37,115.
What is the Median Household income in Black Rock?
Median Household Income in Black Rock is $45,714.
What is Income or Wage Gap in Black Rock?
Income or Wage Gap in Black Rock is 1.4%.
Women in Black Rock earn 98.6 cents for every dollar earned by a man.
What is Family Income Deficit in Black Rock?
Family Income Deficit in Black Rock is $11,220.
Families that are below poverty line in Black Rock earn $11,220 less on average than the poverty threshold level.
What is Inequality or Gini Index in Black Rock?
Inequality or Gini Index in Black Rock is 0.44.
What is the Total Population of Black Rock?
Total Population of Black Rock is 1,259.
What is the Total Male Population of Black Rock?
Total Male Population of Black Rock is 587.
What is the Total Female Population of Black Rock?
Total Female Population of Black Rock is 672.
What is the Ratio of Males per 100 Females in Black Rock?
There are 87.35 Males per 100 Females in Black Rock.
What is the Ratio of Females per 100 Males in Black Rock?
There are 114.48 Females per 100 Males in Black Rock.
What is the Median Population Age in Black Rock?
Median Population Age in Black Rock is 27.4 Years.
What is the Average Family Size in Black Rock
Average Family Size in Black Rock is 4.3 People.
What is the Average Household Size in Black Rock
Average Household Size in Black Rock is 4.2 People.
How Large is the Labor Force in Black Rock?
There are 517 People in the Labor Forcein in Black Rock.
What is the Percentage of People in the Labor Force in Black Rock?
57.8% of People are in the Labor Force in Black Rock.
What is the Unemployment Rate in Black Rock?
Unemployment Rate in Black Rock is 11.4%.