Dulce, NM Map & Demographics
Dulce Map
Dulce Overview
$22,772
PER CAPITA INCOME
$59,063
AVG FAMILY INCOME
$41,250
AVG HOUSEHOLD INCOME
22.9%
WAGE / INCOME GAP [ % ]
77.1¢/ $1
WAGE / INCOME GAP [ $ ]
0.40
INEQUALITY / GINI INDEX
2,261
TOTAL POPULATION
1,081
MALE POPULATION
1,180
FEMALE POPULATION
91.61
MALES / 100 FEMALES
109.16
FEMALES / 100 MALES
40.6
MEDIAN AGE
3.9
AVG FAMILY SIZE
2.9
AVG HOUSEHOLD SIZE
1,076
LABOR FORCE [ PEOPLE ]
60.0%
PERCENT IN LABOR FORCE
19.1%
UNEMPLOYMENT RATE
Dulce Zip Codes
Dulce Area Codes
Income in Dulce
Income Overview in Dulce
Per Capita Income in Dulce is $22,772, while median incomes of families and households are $59,063 and $41,250 respectively.
| Characteristic | Number | Measure |
| Per Capita Income | 2,261 | $22,772 |
| Median Family Income | 421 | $59,063 |
| Mean Family Income | 421 | $58,950 |
| Median Household Income | 781 | $41,250 |
| Mean Household Income | 781 | $51,149 |
| Income Deficit | 421 | $0 |
| Wage / Income Gap (%) | 2,261 | 22.94% |
| Wage / Income Gap ($) | 2,261 | 77.06¢ per $1 |
| Gini / Inequality Index | 2,261 | 0.40 |
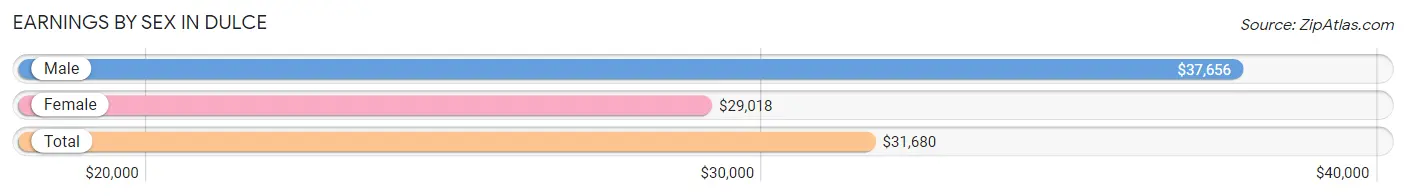
Earnings by Sex in Dulce
Average Earnings in Dulce are $31,680, $37,656 for men and $29,018 for women, a difference of 22.9%.
| Sex | Number | Average Earnings |
| Male | 526 (49.3%) | $37,656 |
| Female | 540 (50.7%) | $29,018 |
| Total | 1,066 (100.0%) | $31,680 |
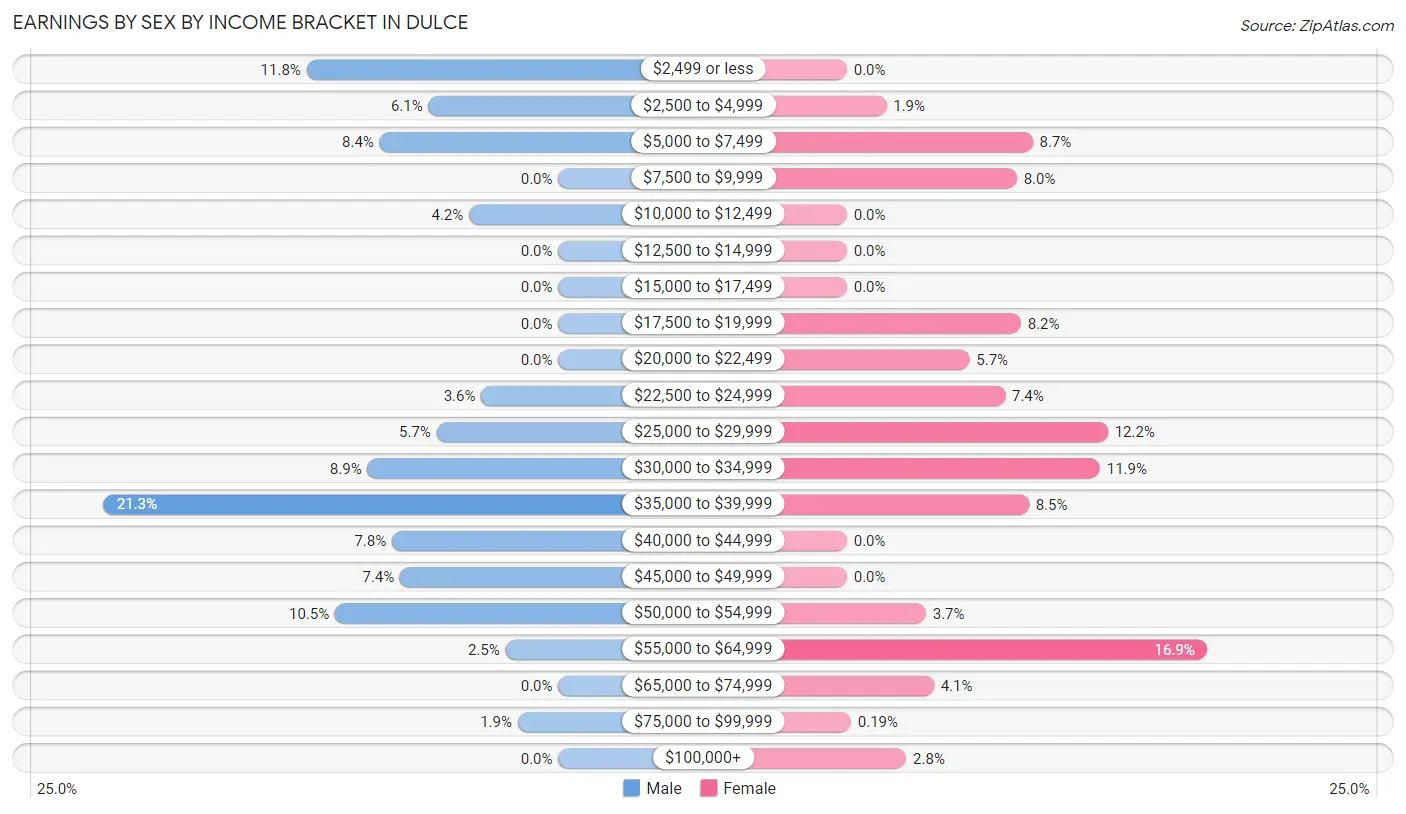
Earnings by Sex by Income Bracket in Dulce
The most common earnings brackets in Dulce are $35,000 to $39,999 for men (112 | 21.3%) and $55,000 to $64,999 for women (91 | 16.9%).
| Income | Male | Female |
| $2,499 or less | 62 (11.8%) | 0 (0.0%) |
| $2,500 to $4,999 | 32 (6.1%) | 10 (1.8%) |
| $5,000 to $7,499 | 44 (8.4%) | 47 (8.7%) |
| $7,500 to $9,999 | 0 (0.0%) | 43 (8.0%) |
| $10,000 to $12,499 | 22 (4.2%) | 0 (0.0%) |
| $12,500 to $14,999 | 0 (0.0%) | 0 (0.0%) |
| $15,000 to $17,499 | 0 (0.0%) | 0 (0.0%) |
| $17,500 to $19,999 | 0 (0.0%) | 44 (8.2%) |
| $20,000 to $22,499 | 0 (0.0%) | 31 (5.7%) |
| $22,500 to $24,999 | 19 (3.6%) | 40 (7.4%) |
| $25,000 to $29,999 | 30 (5.7%) | 66 (12.2%) |
| $30,000 to $34,999 | 47 (8.9%) | 64 (11.8%) |
| $35,000 to $39,999 | 112 (21.3%) | 46 (8.5%) |
| $40,000 to $44,999 | 41 (7.8%) | 0 (0.0%) |
| $45,000 to $49,999 | 39 (7.4%) | 0 (0.0%) |
| $50,000 to $54,999 | 55 (10.5%) | 20 (3.7%) |
| $55,000 to $64,999 | 13 (2.5%) | 91 (16.9%) |
| $65,000 to $74,999 | 0 (0.0%) | 22 (4.1%) |
| $75,000 to $99,999 | 10 (1.9%) | 1 (0.2%) |
| $100,000+ | 0 (0.0%) | 15 (2.8%) |
| Total | 526 (100.0%) | 540 (100.0%) |
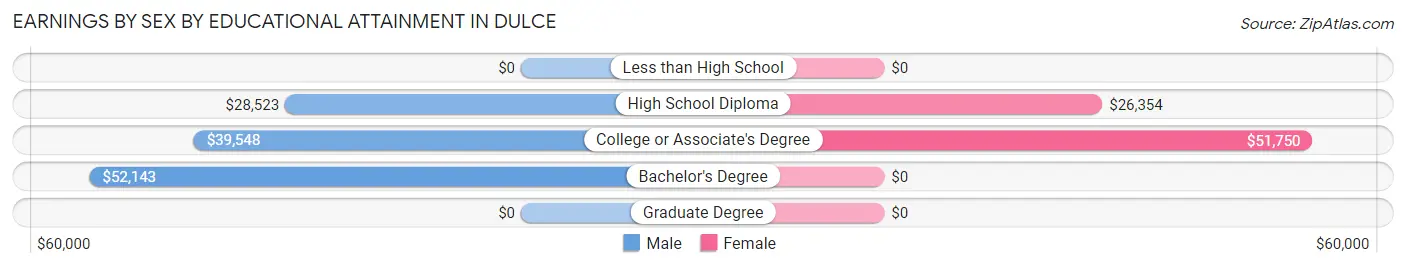
Earnings by Sex by Educational Attainment in Dulce
Average earnings in Dulce are $37,991 for men and $33,258 for women, a difference of 12.5%. Men with an educational attainment of bachelor's degree enjoy the highest average annual earnings of $52,143, while those with high school diploma education earn the least with $28,523. Women with an educational attainment of college or associate's degree earn the most with the average annual earnings of $51,750, while those with high school diploma education have the smallest earnings of $26,354.
| Educational Attainment | Male Income | Female Income |
| Less than High School | - | - |
| High School Diploma | $28,523 | $26,354 |
| College or Associate's Degree | $39,548 | $51,750 |
| Bachelor's Degree | $52,143 | $0 |
| Graduate Degree | - | - |
| Total | $37,991 | $33,258 |
Family Income in Dulce
Family Income Brackets in Dulce
According to the Dulce family income data, there are 129 families falling into the $50,000 to $74,999 income range, which is the most common income bracket and makes up 30.6% of all families.
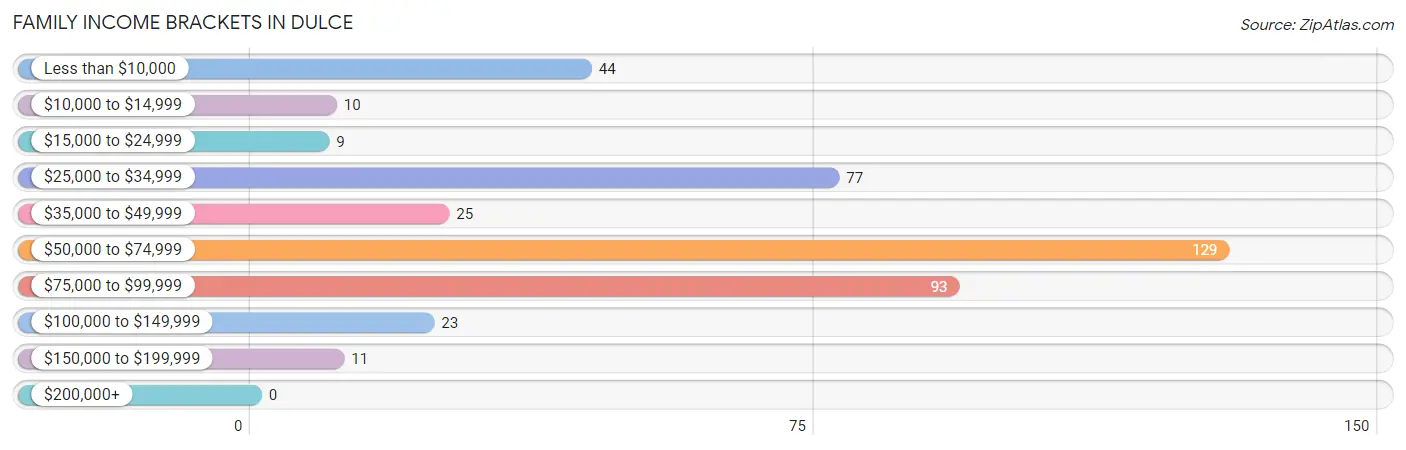
| Income Bracket | # Families | % Families |
| Less than $10,000 | 44 | 10.5% |
| $10,000 to $14,999 | 10 | 2.4% |
| $15,000 to $24,999 | 9 | 2.1% |
| $25,000 to $34,999 | 77 | 18.3% |
| $35,000 to $49,999 | 25 | 5.9% |
| $50,000 to $74,999 | 129 | 30.6% |
| $75,000 to $99,999 | 93 | 22.1% |
| $100,000 to $149,999 | 23 | 5.5% |
| $150,000 to $199,999 | 11 | 2.6% |
| $200,000+ | 0 | 0.0% |
Family Income by Famaliy Size in Dulce
3-person families (153 | 36.3%) account for the highest median family income in Dulce with $63,973 per family, while 2-person families (221 | 52.5%) have the highest median income of $25,387 per family member.
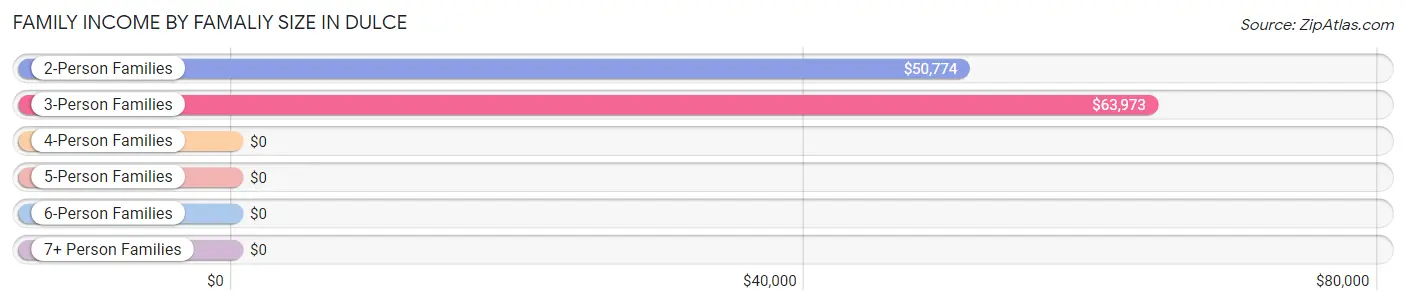
| Income Bracket | # Families | Median Income |
| 2-Person Families | 221 (52.5%) | $50,774 |
| 3-Person Families | 153 (36.3%) | $63,973 |
| 4-Person Families | 36 (8.6%) | $0 |
| 5-Person Families | 0 (0.0%) | $0 |
| 6-Person Families | 11 (2.6%) | $0 |
| 7+ Person Families | 0 (0.0%) | $0 |
| Total | 421 (100.0%) | $59,063 |
Family Income by Number of Earners in Dulce
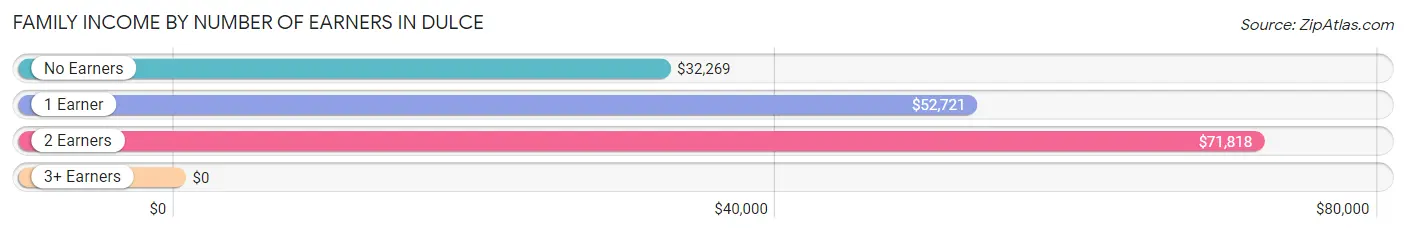
| Number of Earners | # Families | Median Income |
| No Earners | 73 (17.3%) | $32,269 |
| 1 Earner | 253 (60.1%) | $52,721 |
| 2 Earners | 84 (20.0%) | $71,818 |
| 3+ Earners | 11 (2.6%) | $0 |
| Total | 421 (100.0%) | $59,063 |
Household Income in Dulce
Household Income Brackets in Dulce
With 159 households falling in the category, the $50,000 to $74,999 income range is the most frequent in Dulce, accounting for 20.4% of all households.
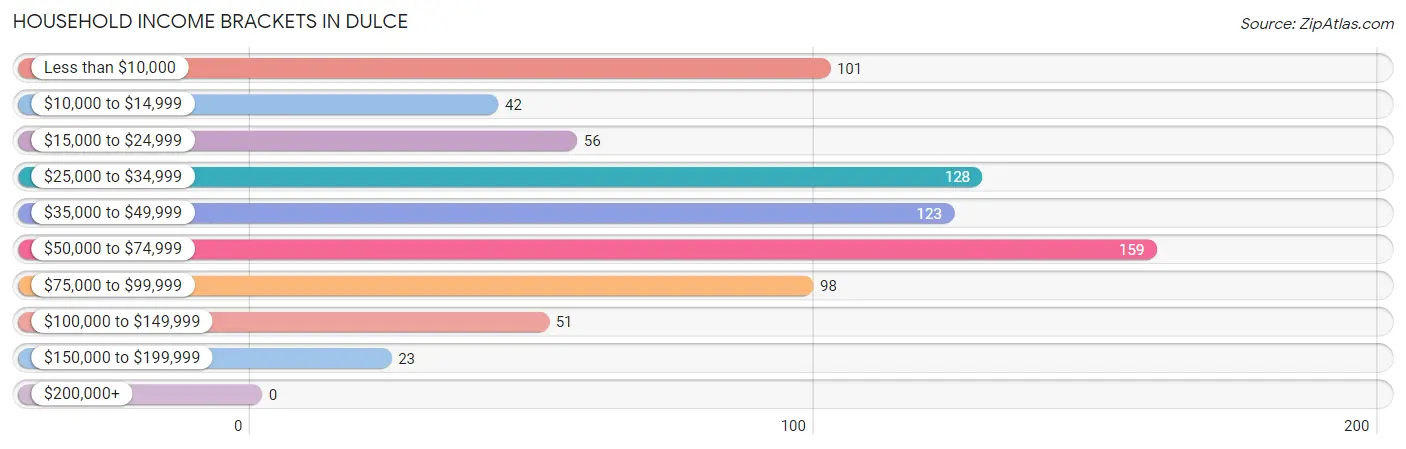
| Income Bracket | # Households | % Households |
| Less than $10,000 | 101 | 12.9% |
| $10,000 to $14,999 | 42 | 5.4% |
| $15,000 to $24,999 | 56 | 7.2% |
| $25,000 to $34,999 | 128 | 16.4% |
| $35,000 to $49,999 | 123 | 15.7% |
| $50,000 to $74,999 | 159 | 20.4% |
| $75,000 to $99,999 | 98 | 12.5% |
| $100,000 to $149,999 | 51 | 6.5% |
| $150,000 to $199,999 | 23 | 2.9% |
| $200,000+ | 0 | 0.0% |
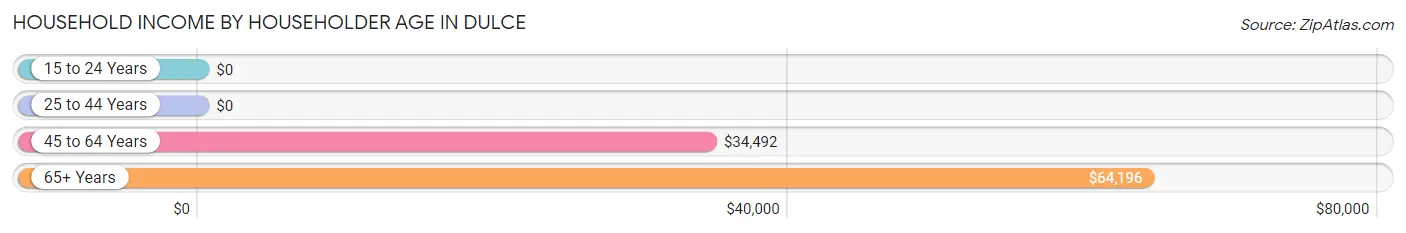
Household Income by Householder Age in Dulce
The median household income in Dulce is $41,250, with the highest median household income of $64,196 found in the 65+ years age bracket for the primary householder. A total of 186 households (23.8%) fall into this category.
| Income Bracket | # Households | Median Income |
| 15 to 24 Years | 0 (0.0%) | $0 |
| 25 to 44 Years | 234 (30.0%) | $0 |
| 45 to 64 Years | 361 (46.2%) | $34,492 |
| 65+ Years | 186 (23.8%) | $64,196 |
| Total | 781 (100.0%) | $41,250 |
Poverty in Dulce
Income Below Poverty by Sex and Age in Dulce
With 20.0% poverty level for males and 8.5% for females among the residents of Dulce, 12 to 14 year old males and 12 to 14 year old females are the most vulnerable to poverty, with 18 males (100.0%) and 40 females (40.0%) in their respective age groups living below the poverty level.
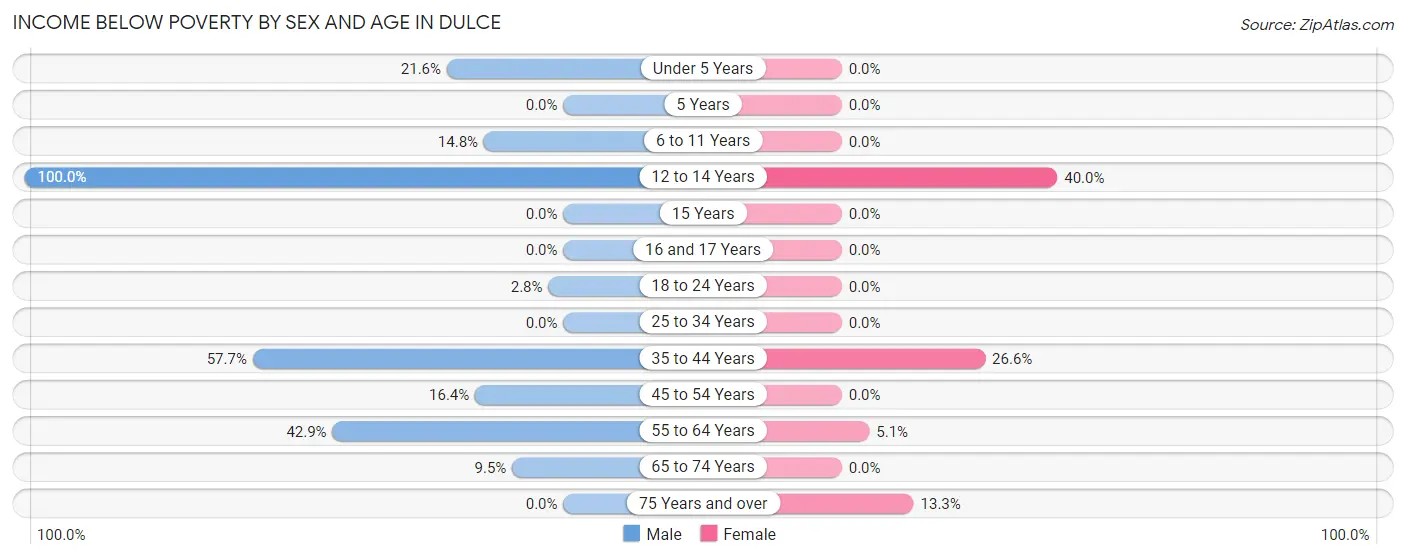
| Age Bracket | Male | Female |
| Under 5 Years | 16 (21.6%) | 0 (0.0%) |
| 5 Years | 0 (0.0%) | 0 (0.0%) |
| 6 to 11 Years | 18 (14.7%) | 0 (0.0%) |
| 12 to 14 Years | 18 (100.0%) | 40 (40.0%) |
| 15 Years | 0 (0.0%) | 0 (0.0%) |
| 16 and 17 Years | 0 (0.0%) | 0 (0.0%) |
| 18 to 24 Years | 1 (2.8%) | 0 (0.0%) |
| 25 to 34 Years | 0 (0.0%) | 0 (0.0%) |
| 35 to 44 Years | 49 (57.7%) | 33 (26.6%) |
| 45 to 54 Years | 19 (16.4%) | 0 (0.0%) |
| 55 to 64 Years | 75 (42.9%) | 12 (5.1%) |
| 65 to 74 Years | 17 (9.5%) | 0 (0.0%) |
| 75 Years and over | 0 (0.0%) | 8 (13.3%) |
| Total | 213 (20.0%) | 93 (8.5%) |
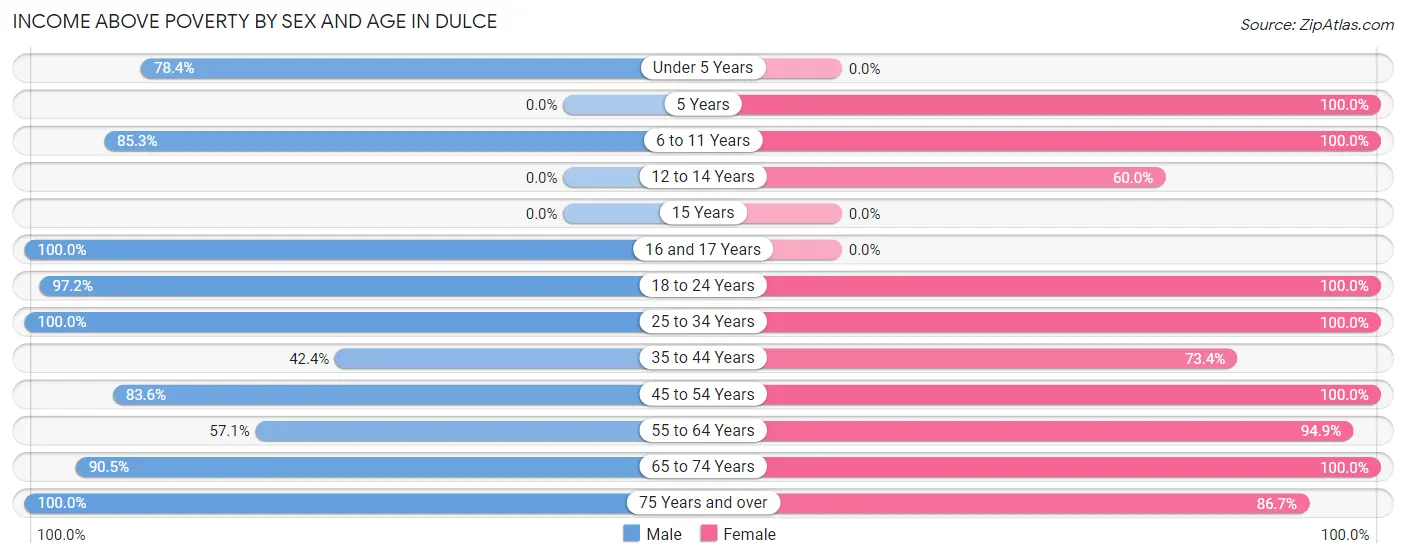
Income Above Poverty by Sex and Age in Dulce
According to the poverty statistics in Dulce, males aged 16 and 17 years and females aged 5 years are the age groups that are most secure financially, with 100.0% of males and 100.0% of females in these age groups living above the poverty line.
| Age Bracket | Male | Female |
| Under 5 Years | 58 (78.4%) | 0 (0.0%) |
| 5 Years | 0 (0.0%) | 21 (100.0%) |
| 6 to 11 Years | 104 (85.3%) | 43 (100.0%) |
| 12 to 14 Years | 0 (0.0%) | 60 (60.0%) |
| 15 Years | 0 (0.0%) | 0 (0.0%) |
| 16 and 17 Years | 38 (100.0%) | 0 (0.0%) |
| 18 to 24 Years | 35 (97.2%) | 150 (100.0%) |
| 25 to 34 Years | 196 (100.0%) | 119 (100.0%) |
| 35 to 44 Years | 36 (42.3%) | 91 (73.4%) |
| 45 to 54 Years | 97 (83.6%) | 145 (100.0%) |
| 55 to 64 Years | 100 (57.1%) | 223 (94.9%) |
| 65 to 74 Years | 162 (90.5%) | 95 (100.0%) |
| 75 Years and over | 27 (100.0%) | 52 (86.7%) |
| Total | 853 (80.0%) | 999 (91.5%) |
Income Below Poverty Among Married-Couple Families in Dulce
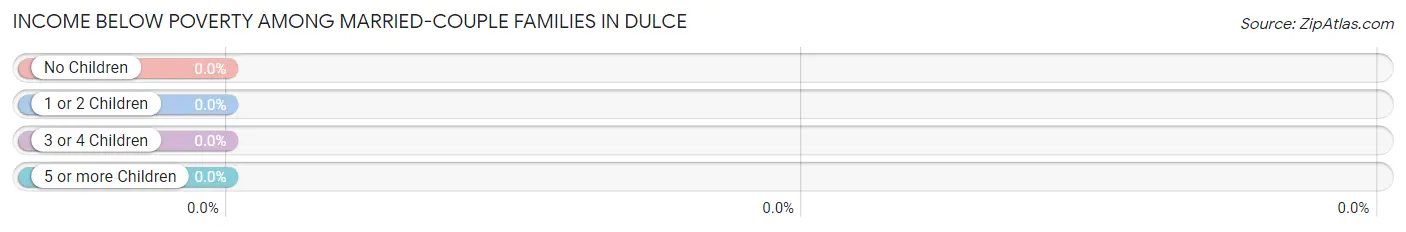
| Children | Above Poverty | Below Poverty |
| No Children | 213 (100.0%) | 0 (0.0%) |
| 1 or 2 Children | 12 (100.0%) | 0 (0.0%) |
| 3 or 4 Children | 0 (0.0%) | 0 (0.0%) |
| 5 or more Children | 0 (0.0%) | 0 (0.0%) |
| Total | 225 (100.0%) | 0 (0.0%) |
Income Below Poverty Among Single-Parent Households in Dulce
According to the poverty data in Dulce, 51.6% or 32 single-father households and 16.4% or 22 single-mother households are living below the poverty line. Among single-father households, those with 1 or 2 children have the highest poverty rate, with 32 households (51.6%) experiencing poverty. Likewise, among single-mother households, those with 1 or 2 children have the highest poverty rate, with 22 households (36.7%) falling below the poverty line.
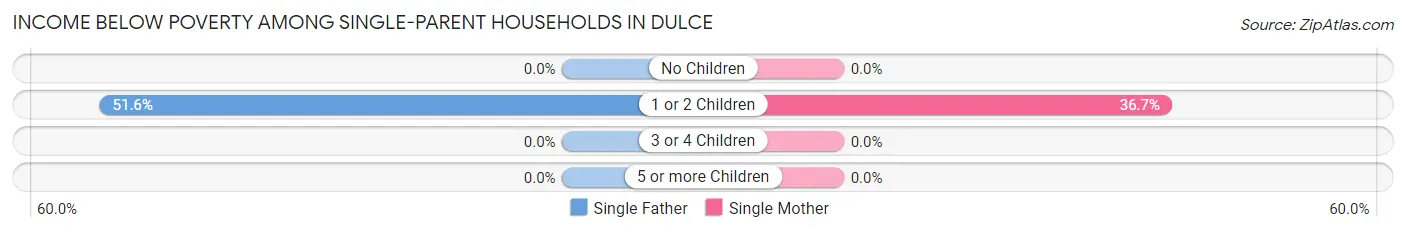
| Children | Single Father | Single Mother |
| No Children | 0 (0.0%) | 0 (0.0%) |
| 1 or 2 Children | 32 (51.6%) | 22 (36.7%) |
| 3 or 4 Children | 0 (0.0%) | 0 (0.0%) |
| 5 or more Children | 0 (0.0%) | 0 (0.0%) |
| Total | 32 (51.6%) | 22 (16.4%) |
Income Below Poverty Among Married-Couple vs Single-Parent Households in Dulce
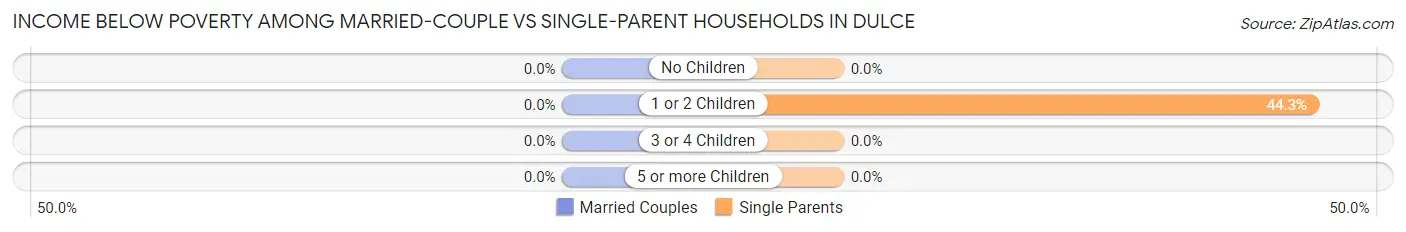
| Children | Married-Couple Families | Single-Parent Households |
| No Children | 0 (0.0%) | 0 (0.0%) |
| 1 or 2 Children | 0 (0.0%) | 54 (44.3%) |
| 3 or 4 Children | 0 (0.0%) | 0 (0.0%) |
| 5 or more Children | 0 (0.0%) | 0 (0.0%) |
| Total | 0 (0.0%) | 54 (27.6%) |
Race in Dulce
The most populous races in Dulce are Native / Alaskan (1,991 | 88.1%), Hispanic or Latino (132 | 5.8%), and Two or more Races (123 | 5.4%).
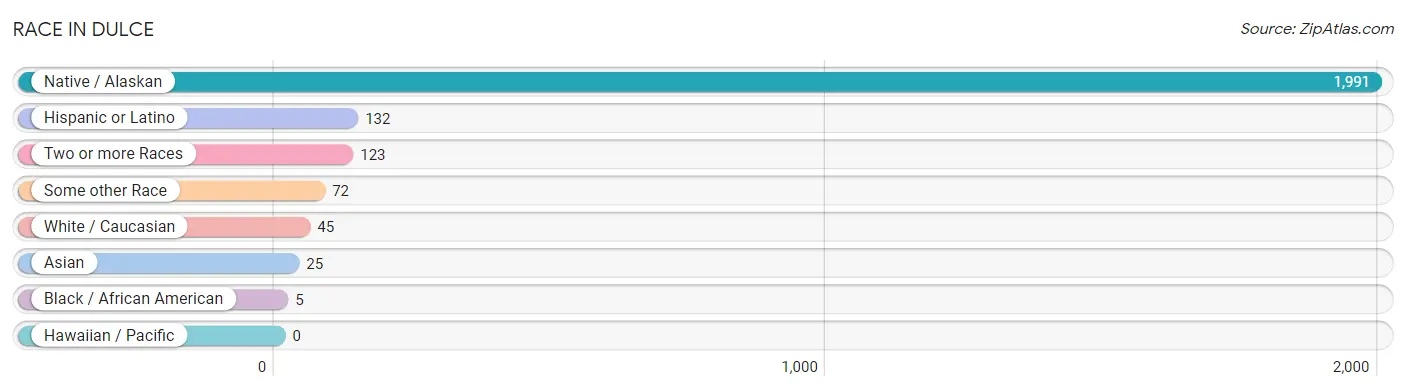
| Race | # Population | % Population |
| Asian | 25 | 1.1% |
| Black / African American | 5 | 0.2% |
| Hawaiian / Pacific | 0 | 0.0% |
| Hispanic or Latino | 132 | 5.8% |
| Native / Alaskan | 1,991 | 88.1% |
| White / Caucasian | 45 | 2.0% |
| Two or more Races | 123 | 5.4% |
| Some other Race | 72 | 3.2% |
| Total | 2,261 | 100.0% |
Ancestry in Dulce
The most populous ancestries reported in Dulce are Apache (1,782 | 78.8%), Navajo (200 | 8.8%), Spanish (61 | 2.7%), Hopi (34 | 1.5%), and Korean (25 | 1.1%), together accounting for 93.0% of all Dulce residents.
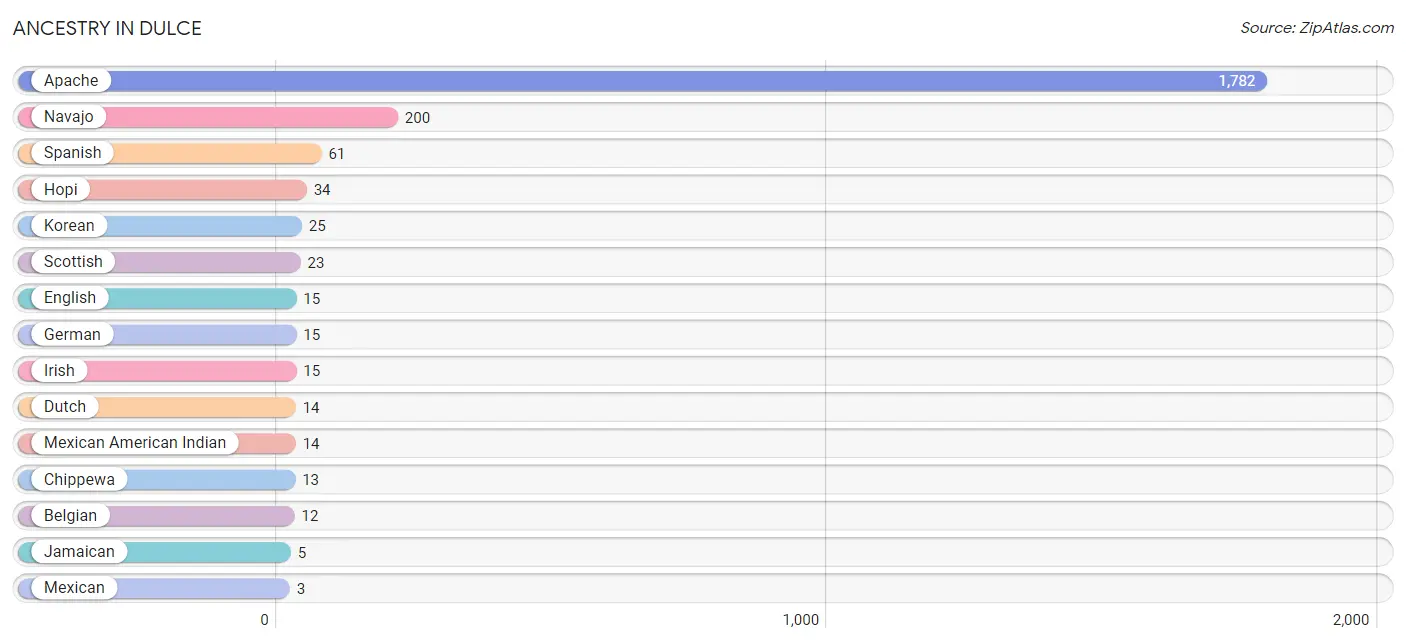
| Ancestry | # Population | % Population |
| Apache | 1,782 | 78.8% |
| Belgian | 12 | 0.5% |
| Chippewa | 13 | 0.6% |
| Dutch | 14 | 0.6% |
| English | 15 | 0.7% |
| German | 15 | 0.7% |
| Hopi | 34 | 1.5% |
| Irish | 15 | 0.7% |
| Jamaican | 5 | 0.2% |
| Korean | 25 | 1.1% |
| Mexican | 3 | 0.1% |
| Mexican American Indian | 14 | 0.6% |
| Navajo | 200 | 8.8% |
| Scottish | 23 | 1.0% |
| Spanish | 61 | 2.7% | View All 15 Rows |
Immigrants in Dulce
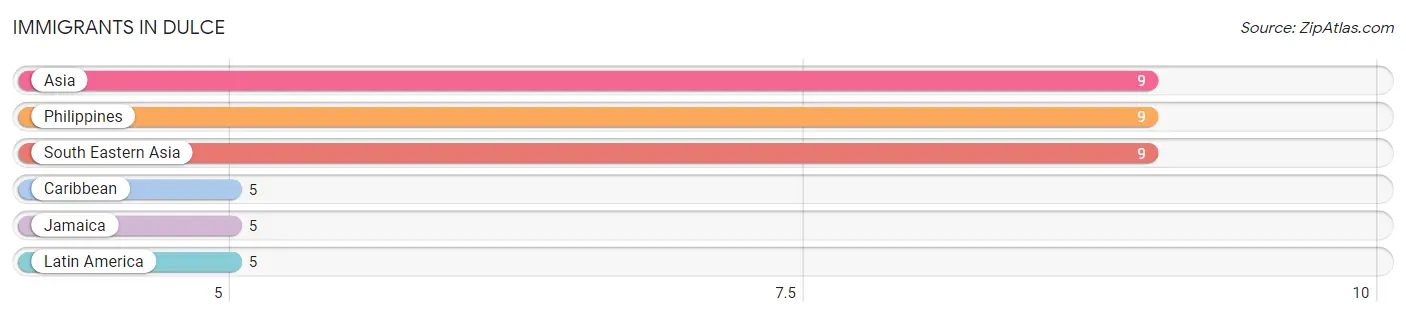
The most numerous immigrant groups reported in Dulce came from Asia (9 | 0.4%), Philippines (9 | 0.4%), South Eastern Asia (9 | 0.4%), Caribbean (5 | 0.2%), and Jamaica (5 | 0.2%), together accounting for 1.6% of all Dulce residents.
| Immigration Origin | # Population | % Population |
| Asia | 9 | 0.4% |
| Caribbean | 5 | 0.2% |
| Jamaica | 5 | 0.2% |
| Latin America | 5 | 0.2% |
| Philippines | 9 | 0.4% |
| South Eastern Asia | 9 | 0.4% | View All 6 Rows |
Sex and Age in Dulce
Sex and Age in Dulce
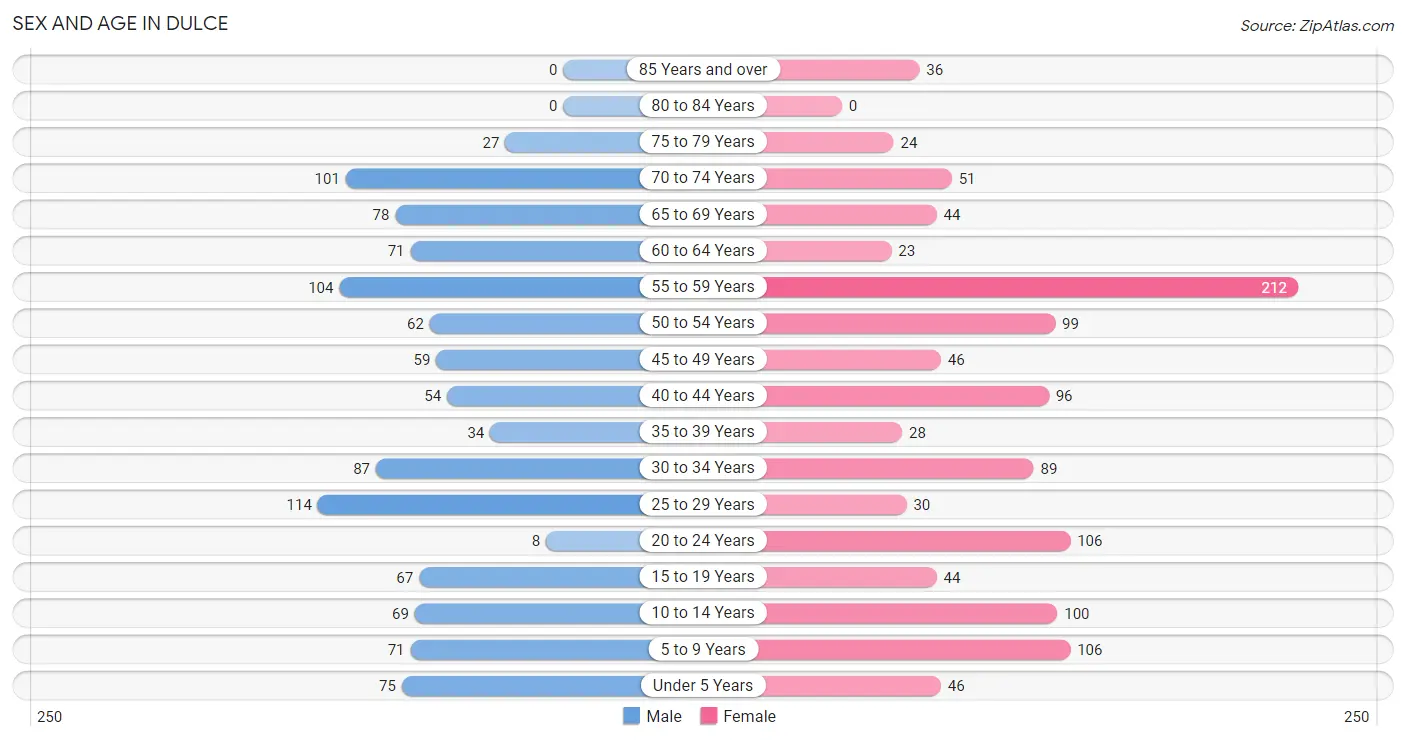
The most populous age groups in Dulce are 25 to 29 Years (114 | 10.5%) for men and 55 to 59 Years (212 | 18.0%) for women.
| Age Bracket | Male | Female |
| Under 5 Years | 75 (6.9%) | 46 (3.9%) |
| 5 to 9 Years | 71 (6.6%) | 106 (9.0%) |
| 10 to 14 Years | 69 (6.4%) | 100 (8.5%) |
| 15 to 19 Years | 67 (6.2%) | 44 (3.7%) |
| 20 to 24 Years | 8 (0.7%) | 106 (9.0%) |
| 25 to 29 Years | 114 (10.5%) | 30 (2.5%) |
| 30 to 34 Years | 87 (8.1%) | 89 (7.5%) |
| 35 to 39 Years | 34 (3.2%) | 28 (2.4%) |
| 40 to 44 Years | 54 (5.0%) | 96 (8.1%) |
| 45 to 49 Years | 59 (5.5%) | 46 (3.9%) |
| 50 to 54 Years | 62 (5.7%) | 99 (8.4%) |
| 55 to 59 Years | 104 (9.6%) | 212 (18.0%) |
| 60 to 64 Years | 71 (6.6%) | 23 (1.9%) |
| 65 to 69 Years | 78 (7.2%) | 44 (3.7%) |
| 70 to 74 Years | 101 (9.3%) | 51 (4.3%) |
| 75 to 79 Years | 27 (2.5%) | 24 (2.0%) |
| 80 to 84 Years | 0 (0.0%) | 0 (0.0%) |
| 85 Years and over | 0 (0.0%) | 36 (3.0%) |
| Total | 1,081 (100.0%) | 1,180 (100.0%) |
Families and Households in Dulce
Median Family Size in Dulce
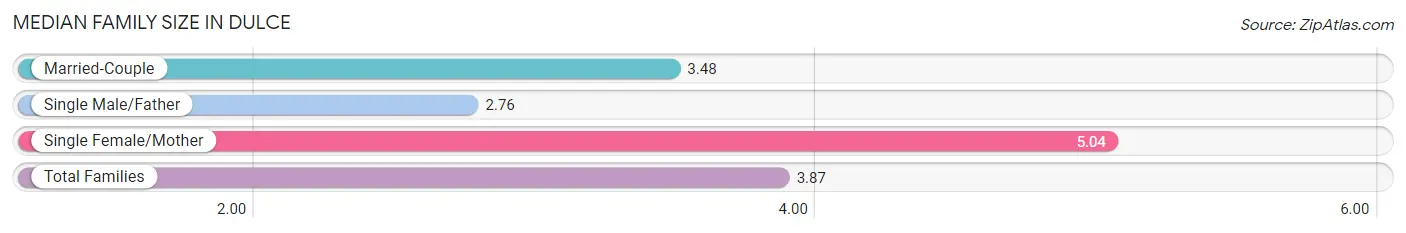
The median family size in Dulce is 3.87 persons per family, with single female/mother families (134 | 31.8%) accounting for the largest median family size of 5.04 persons per family. On the other hand, single male/father families (62 | 14.7%) represent the smallest median family size with 2.76 persons per family.
| Family Type | # Families | Family Size |
| Married-Couple | 225 (53.4%) | 3.48 |
| Single Male/Father | 62 (14.7%) | 2.76 |
| Single Female/Mother | 134 (31.8%) | 5.04 |
| Total Families | 421 (100.0%) | 3.87 |
Median Household Size in Dulce
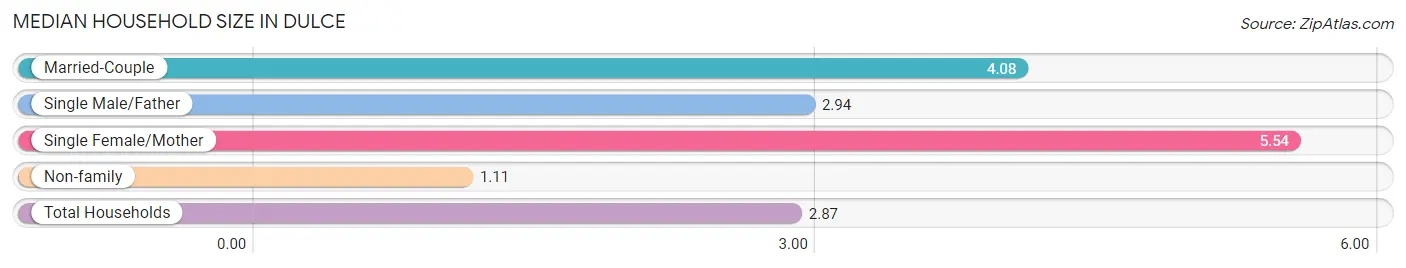
The median household size in Dulce is 2.87 persons per household, with single female/mother households (134 | 17.2%) accounting for the largest median household size of 5.54 persons per household. non-family households (360 | 46.1%) represent the smallest median household size with 1.11 persons per household.
| Household Type | # Households | Household Size |
| Married-Couple | 225 (28.8%) | 4.08 |
| Single Male/Father | 62 (7.9%) | 2.94 |
| Single Female/Mother | 134 (17.2%) | 5.54 |
| Non-family | 360 (46.1%) | 1.11 |
| Total Households | 781 (100.0%) | 2.87 |
Household Size by Marriage Status in Dulce
Out of a total of 781 households in Dulce, 421 (53.9%) are family households, while 360 (46.1%) are nonfamily households. The most numerous type of family households are 2-person households, comprising 196, and the most common type of nonfamily households are 1-person households, comprising 299.
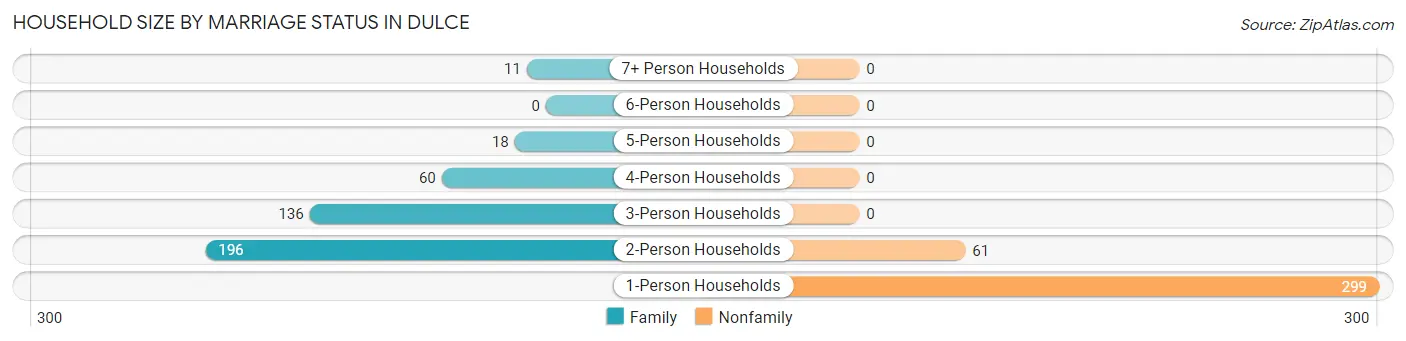
| Household Size | Family Households | Nonfamily Households |
| 1-Person Households | - | 299 (38.3%) |
| 2-Person Households | 196 (25.1%) | 61 (7.8%) |
| 3-Person Households | 136 (17.4%) | 0 (0.0%) |
| 4-Person Households | 60 (7.7%) | 0 (0.0%) |
| 5-Person Households | 18 (2.3%) | 0 (0.0%) |
| 6-Person Households | 0 (0.0%) | 0 (0.0%) |
| 7+ Person Households | 11 (1.4%) | 0 (0.0%) |
| Total | 421 (53.9%) | 360 (46.1%) |
Female Fertility in Dulce
Fertility by Age in Dulce
| Age Bracket | Women with Births | Births / 1,000 Women |
| 15 to 19 years | 0 (0.0%) | 0.0 |
| 20 to 34 years | 0 (0.0%) | 0.0 |
| 35 to 50 years | 0 (0.0%) | 0.0 |
| Total | 0 (0.0%) | 0.0 |
Fertility by Age by Marriage Status in Dulce
| Age Bracket | Married | Unmarried |
| 15 to 19 years | 0 (0.0%) | 0 (0.0%) |
| 20 to 34 years | 0 (0.0%) | 0 (0.0%) |
| 35 to 50 years | 0 (0.0%) | 0 (0.0%) |
| Total | 0 (0.0%) | 0 (0.0%) |
Fertility by Education in Dulce
| Educational Attainment | Women with Births | Births / 1,000 Women |
| Less than High School | 0 (0.0%) | 0.0 |
| High School Diploma | 0 (0.0%) | 0.0 |
| College or Associate's Degree | 0 (0.0%) | 0.0 |
| Bachelor's Degree | 0 (0.0%) | 0.0 |
| Graduate Degree | 0 (0.0%) | 0.0 |
| Total | 0 (0.0%) | 0.0 |
Fertility by Education by Marriage Status in Dulce
| Educational Attainment | Married | Unmarried |
| Less than High School | 0 (0.0%) | 0 (0.0%) |
| High School Diploma | 0 (0.0%) | 0 (0.0%) |
| College or Associate's Degree | 0 (0.0%) | 0 (0.0%) |
| Bachelor's Degree | 0 (0.0%) | 0 (0.0%) |
| Graduate Degree | 0 (0.0%) | 0 (0.0%) |
| Total | 0 (0.0%) | 0 (0.0%) |
Employment Characteristics in Dulce
Employment by Class of Employer in Dulce
Among the 825 employed individuals in Dulce, federal government employees (381 | 46.2%), private company employees (190 | 23.0%), and local government employees (120 | 14.5%) make up the most common classes of employment.
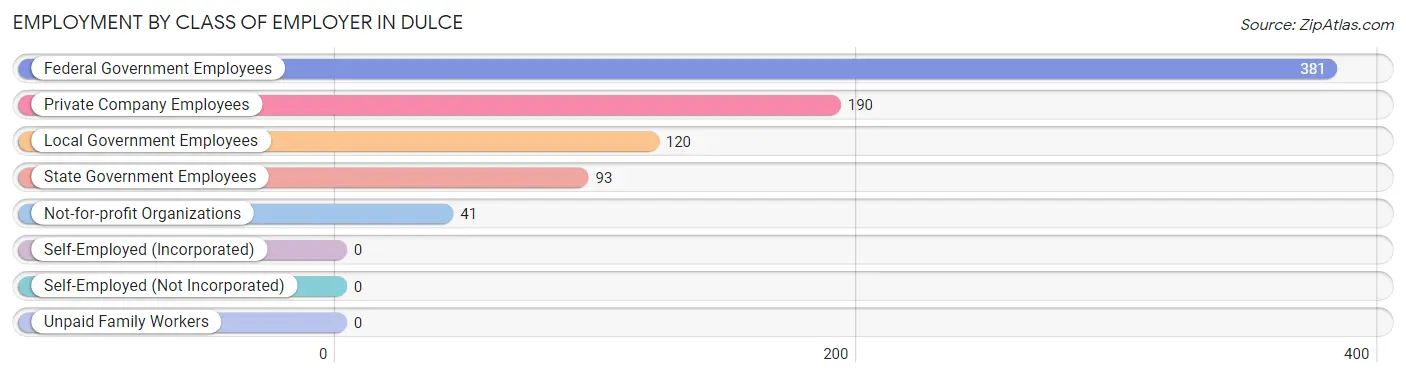
| Employer Class | # Employees | % Employees |
| Private Company Employees | 190 | 23.0% |
| Self-Employed (Incorporated) | 0 | 0.0% |
| Self-Employed (Not Incorporated) | 0 | 0.0% |
| Not-for-profit Organizations | 41 | 5.0% |
| Local Government Employees | 120 | 14.5% |
| State Government Employees | 93 | 11.3% |
| Federal Government Employees | 381 | 46.2% |
| Unpaid Family Workers | 0 | 0.0% |
| Total | 825 | 100.0% |
Employment Status by Age in Dulce
According to the labor force statistics for Dulce, out of the total population over 16 years of age (1,794), 60.0% or 1,076 individuals are in the labor force, with 19.1% or 206 of them unemployed. The age group with the highest labor force participation rate is 20 to 24 years, with 93.9% or 107 individuals in the labor force. Within the labor force, the 20 to 24 years age range has the highest percentage of unemployed individuals, with 41.1% or 44 of them being unemployed.
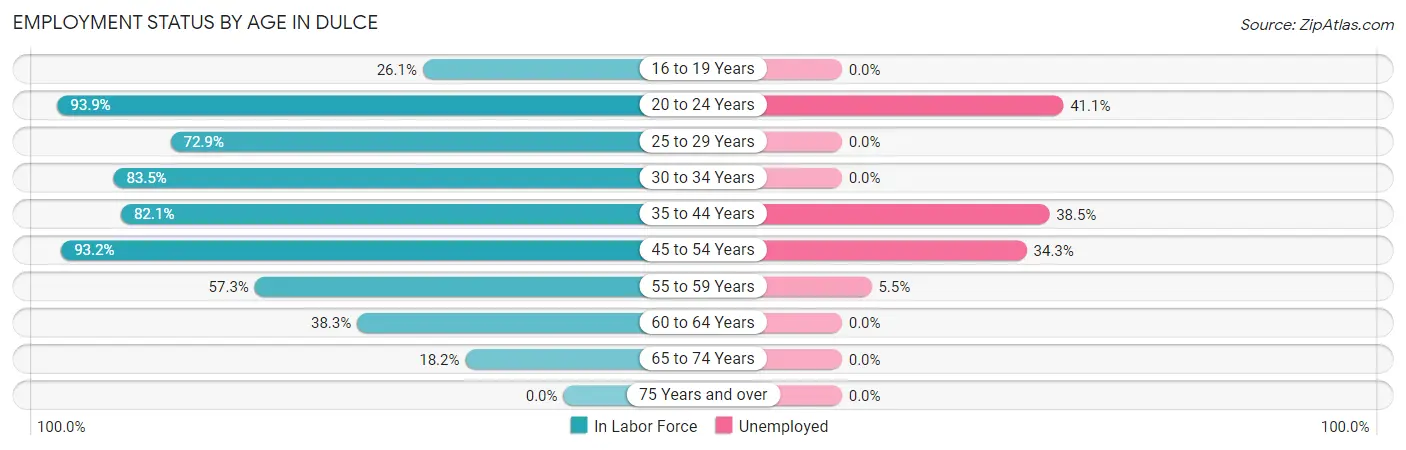
| Age Bracket | In Labor Force | Unemployed |
| 16 to 19 Years | 29 (26.1%) | 0 (0.0%) |
| 20 to 24 Years | 107 (93.9%) | 44 (41.1%) |
| 25 to 29 Years | 105 (72.9%) | 0 (0.0%) |
| 30 to 34 Years | 147 (83.5%) | 0 (0.0%) |
| 35 to 44 Years | 174 (82.1%) | 67 (38.5%) |
| 45 to 54 Years | 248 (93.2%) | 85 (34.3%) |
| 55 to 59 Years | 181 (57.3%) | 10 (5.5%) |
| 60 to 64 Years | 36 (38.3%) | 0 (0.0%) |
| 65 to 74 Years | 50 (18.2%) | 0 (0.0%) |
| 75 Years and over | 0 (0.0%) | 0 (0.0%) |
| Total | 1,076 (60.0%) | 206 (19.1%) |
Employment Status by Educational Attainment in Dulce
According to labor force statistics for Dulce, 73.8% of individuals (892) out of the total population between 25 and 64 years of age (1,208) are in the labor force, with 18.2% or 162 of them being unemployed. The group with the highest labor force participation rate are those with the educational attainment of college / associate degree, with 79.1% or 353 individuals in the labor force. Within the labor force, individuals with less than high school education have the highest percentage of unemployment, with 34.7% or 17 of them being unemployed.
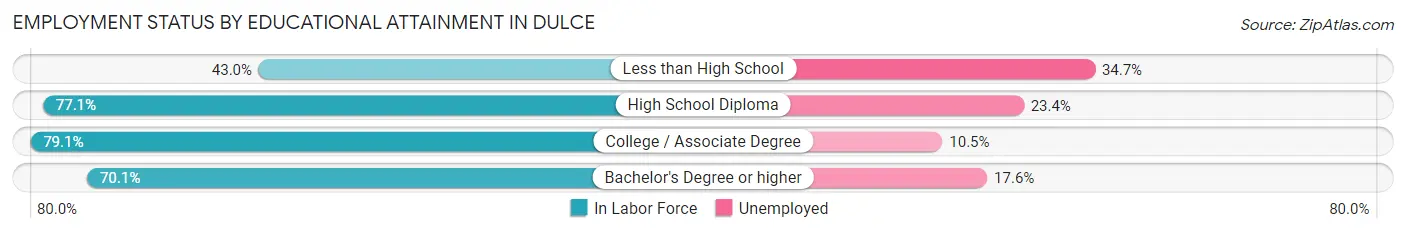
| Educational Attainment | In Labor Force | Unemployed |
| Less than High School | 49 (43.0%) | 40 (34.7%) |
| High School Diploma | 381 (77.1%) | 116 (23.4%) |
| College / Associate Degree | 353 (79.1%) | 47 (10.5%) |
| Bachelor's Degree or higher | 108 (70.1%) | 27 (17.6%) |
| Total | 892 (73.8%) | 220 (18.2%) |
Employment Occupations by Sex in Dulce
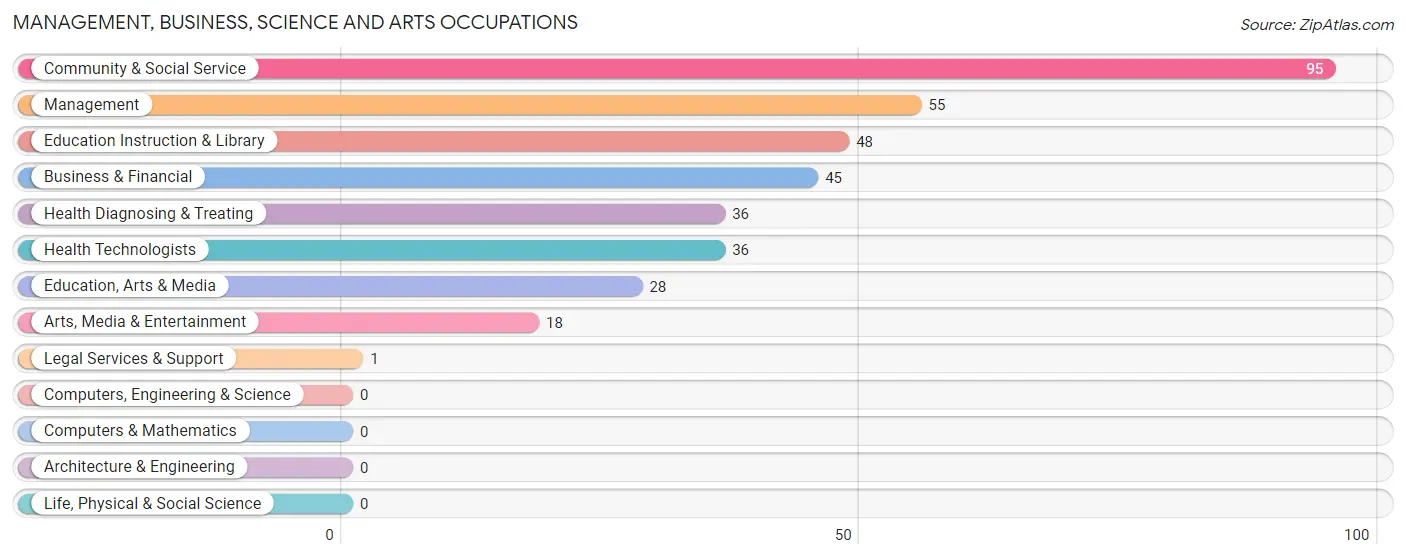
Management, Business, Science and Arts Occupations
The most common Management, Business, Science and Arts occupations in Dulce are Community & Social Service (95 | 10.9%), Management (55 | 6.3%), Education Instruction & Library (48 | 5.5%), Business & Financial (45 | 5.2%), and Health Diagnosing & Treating (36 | 4.1%).
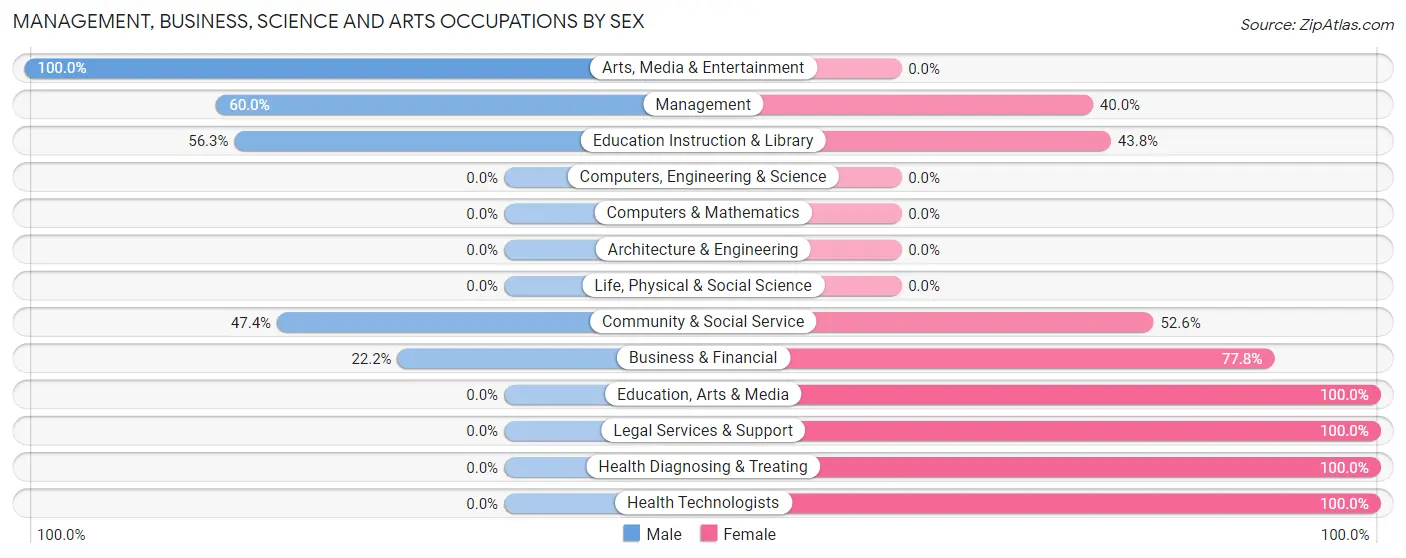
Management, Business, Science and Arts Occupations by Sex
Within the Management, Business, Science and Arts occupations in Dulce, the most male-oriented occupations are Arts, Media & Entertainment (100.0%), Management (60.0%), and Education Instruction & Library (56.2%), while the most female-oriented occupations are Education, Arts & Media (100.0%), Legal Services & Support (100.0%), and Health Diagnosing & Treating (100.0%).
| Occupation | Male | Female |
| Management | 33 (60.0%) | 22 (40.0%) |
| Business & Financial | 10 (22.2%) | 35 (77.8%) |
| Computers, Engineering & Science | 0 (0.0%) | 0 (0.0%) |
| Computers & Mathematics | 0 (0.0%) | 0 (0.0%) |
| Architecture & Engineering | 0 (0.0%) | 0 (0.0%) |
| Life, Physical & Social Science | 0 (0.0%) | 0 (0.0%) |
| Community & Social Service | 45 (47.4%) | 50 (52.6%) |
| Education, Arts & Media | 0 (0.0%) | 28 (100.0%) |
| Legal Services & Support | 0 (0.0%) | 1 (100.0%) |
| Education Instruction & Library | 27 (56.2%) | 21 (43.8%) |
| Arts, Media & Entertainment | 18 (100.0%) | 0 (0.0%) |
| Health Diagnosing & Treating | 0 (0.0%) | 36 (100.0%) |
| Health Technologists | 0 (0.0%) | 36 (100.0%) |
| Total (Category) | 88 (38.1%) | 143 (61.9%) |
| Total (Overall) | 450 (51.7%) | 421 (48.3%) |
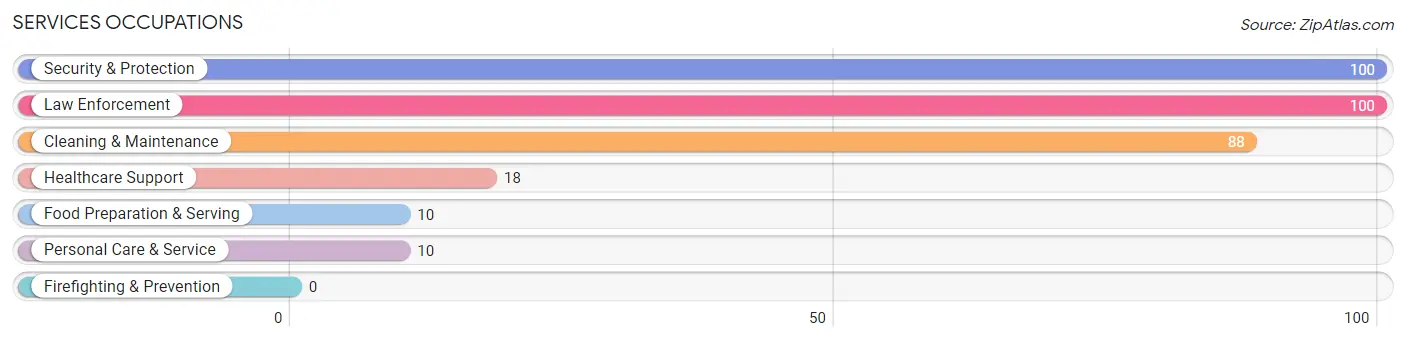
Services Occupations
The most common Services occupations in Dulce are Security & Protection (100 | 11.5%), Law Enforcement (100 | 11.5%), Cleaning & Maintenance (88 | 10.1%), Healthcare Support (18 | 2.1%), and Food Preparation & Serving (10 | 1.1%).
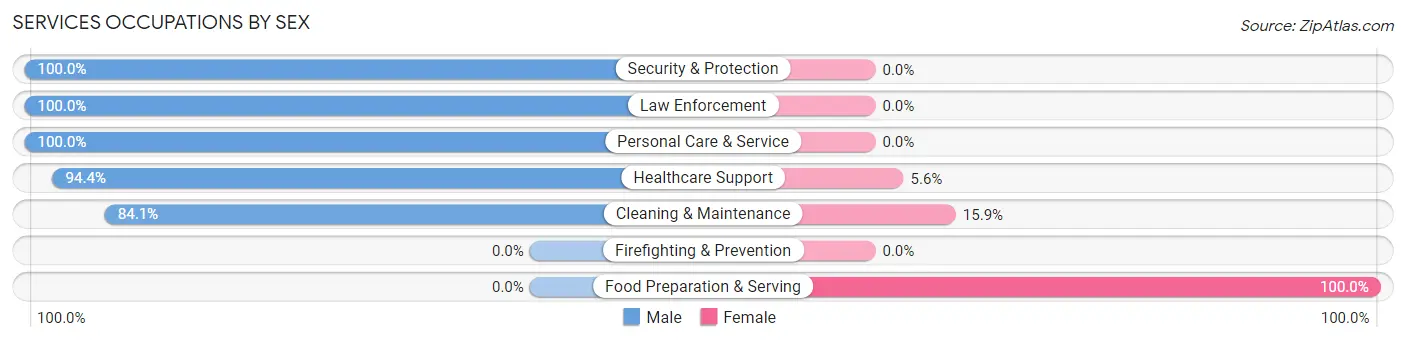
Services Occupations by Sex
Within the Services occupations in Dulce, the most male-oriented occupations are Security & Protection (100.0%), Law Enforcement (100.0%), and Personal Care & Service (100.0%), while the most female-oriented occupations are Food Preparation & Serving (100.0%), Cleaning & Maintenance (15.9%), and Healthcare Support (5.6%).
| Occupation | Male | Female |
| Healthcare Support | 17 (94.4%) | 1 (5.6%) |
| Security & Protection | 100 (100.0%) | 0 (0.0%) |
| Firefighting & Prevention | 0 (0.0%) | 0 (0.0%) |
| Law Enforcement | 100 (100.0%) | 0 (0.0%) |
| Food Preparation & Serving | 0 (0.0%) | 10 (100.0%) |
| Cleaning & Maintenance | 74 (84.1%) | 14 (15.9%) |
| Personal Care & Service | 10 (100.0%) | 0 (0.0%) |
| Total (Category) | 201 (88.9%) | 25 (11.1%) |
| Total (Overall) | 450 (51.7%) | 421 (48.3%) |
Sales and Office Occupations
The most common Sales and Office occupations in Dulce are Office & Administration (191 | 21.9%), and Sales & Related (27 | 3.1%).

Sales and Office Occupations by Sex

| Occupation | Male | Female |
| Sales & Related | 18 (66.7%) | 9 (33.3%) |
| Office & Administration | 0 (0.0%) | 191 (100.0%) |
| Total (Category) | 18 (8.3%) | 200 (91.7%) |
| Total (Overall) | 450 (51.7%) | 421 (48.3%) |
Natural Resources, Construction and Maintenance Occupations
The most common Natural Resources, Construction and Maintenance occupations in Dulce are Construction & Extraction (99 | 11.4%), Installation, Maintenance & Repair (19 | 2.2%), and Farming, Fishing & Forestry (11 | 1.3%).
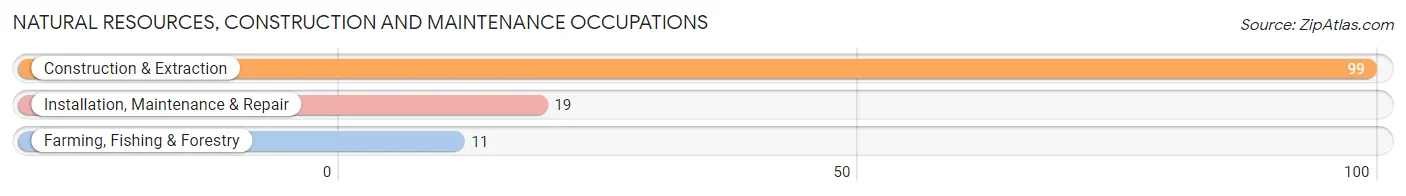
Natural Resources, Construction and Maintenance Occupations by Sex
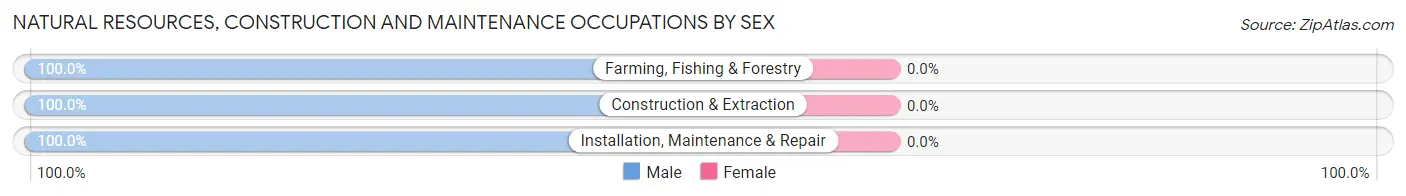
| Occupation | Male | Female |
| Farming, Fishing & Forestry | 11 (100.0%) | 0 (0.0%) |
| Construction & Extraction | 99 (100.0%) | 0 (0.0%) |
| Installation, Maintenance & Repair | 19 (100.0%) | 0 (0.0%) |
| Total (Category) | 129 (100.0%) | 0 (0.0%) |
| Total (Overall) | 450 (51.7%) | 421 (48.3%) |
Production, Transportation and Moving Occupations
The most common Production, Transportation and Moving occupations in Dulce are Material Moving (57 | 6.5%), and Production (10 | 1.1%).
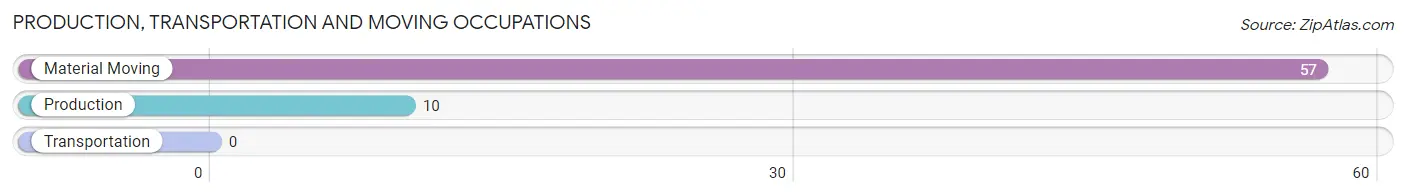
Production, Transportation and Moving Occupations by Sex
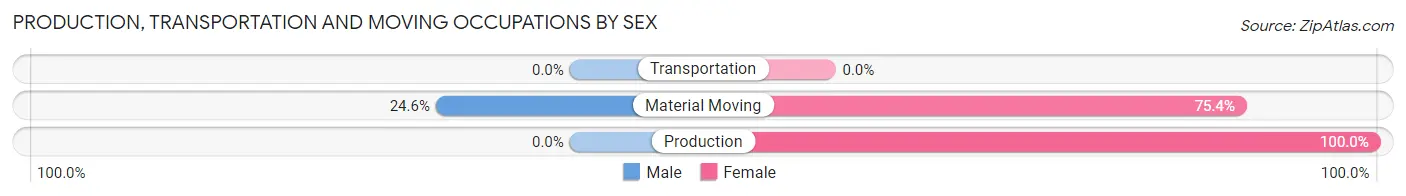
| Occupation | Male | Female |
| Production | 0 (0.0%) | 10 (100.0%) |
| Transportation | 0 (0.0%) | 0 (0.0%) |
| Material Moving | 14 (24.6%) | 43 (75.4%) |
| Total (Category) | 14 (20.9%) | 53 (79.1%) |
| Total (Overall) | 450 (51.7%) | 421 (48.3%) |
Employment Industries by Sex in Dulce
Employment Industries in Dulce
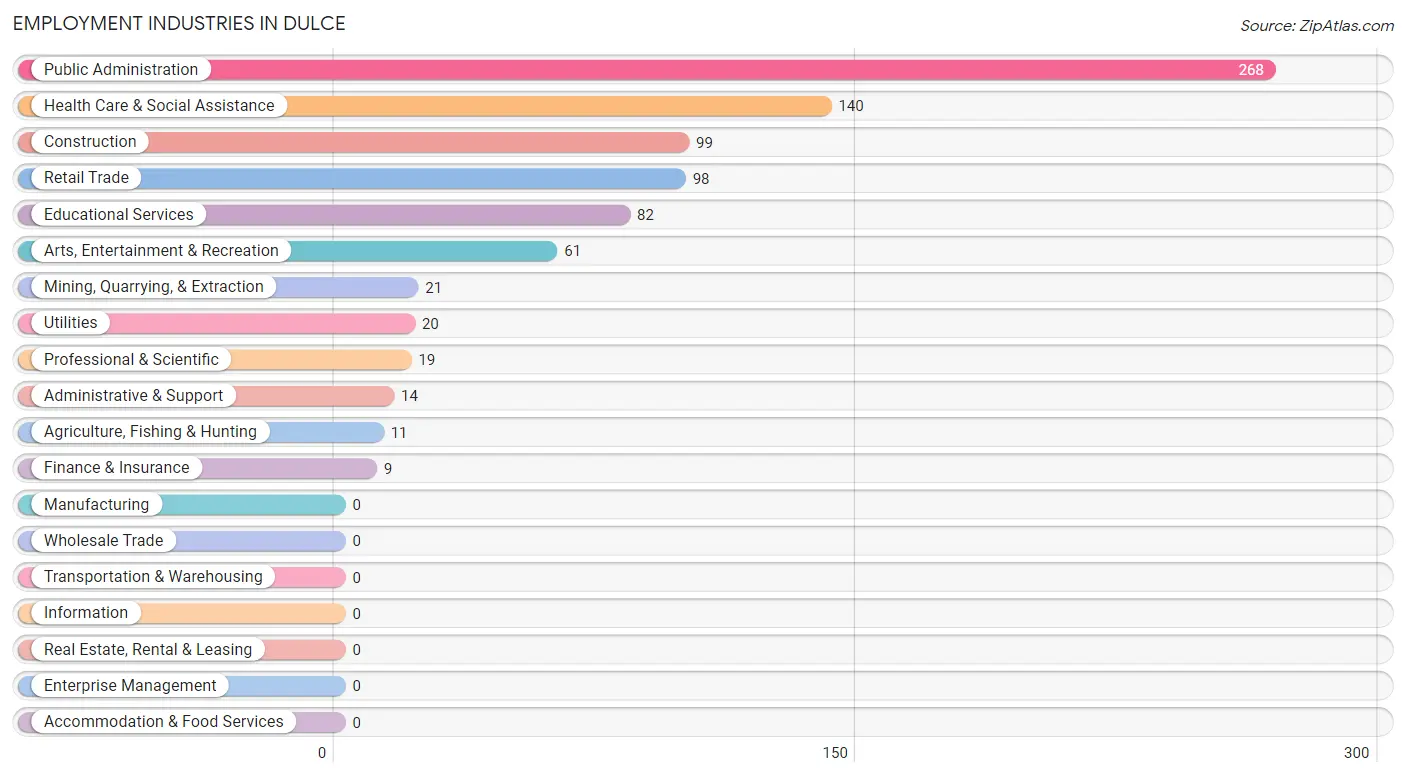
The major employment industries in Dulce include Public Administration (268 | 30.8%), Health Care & Social Assistance (140 | 16.1%), Construction (99 | 11.4%), Retail Trade (98 | 11.3%), and Educational Services (82 | 9.4%).
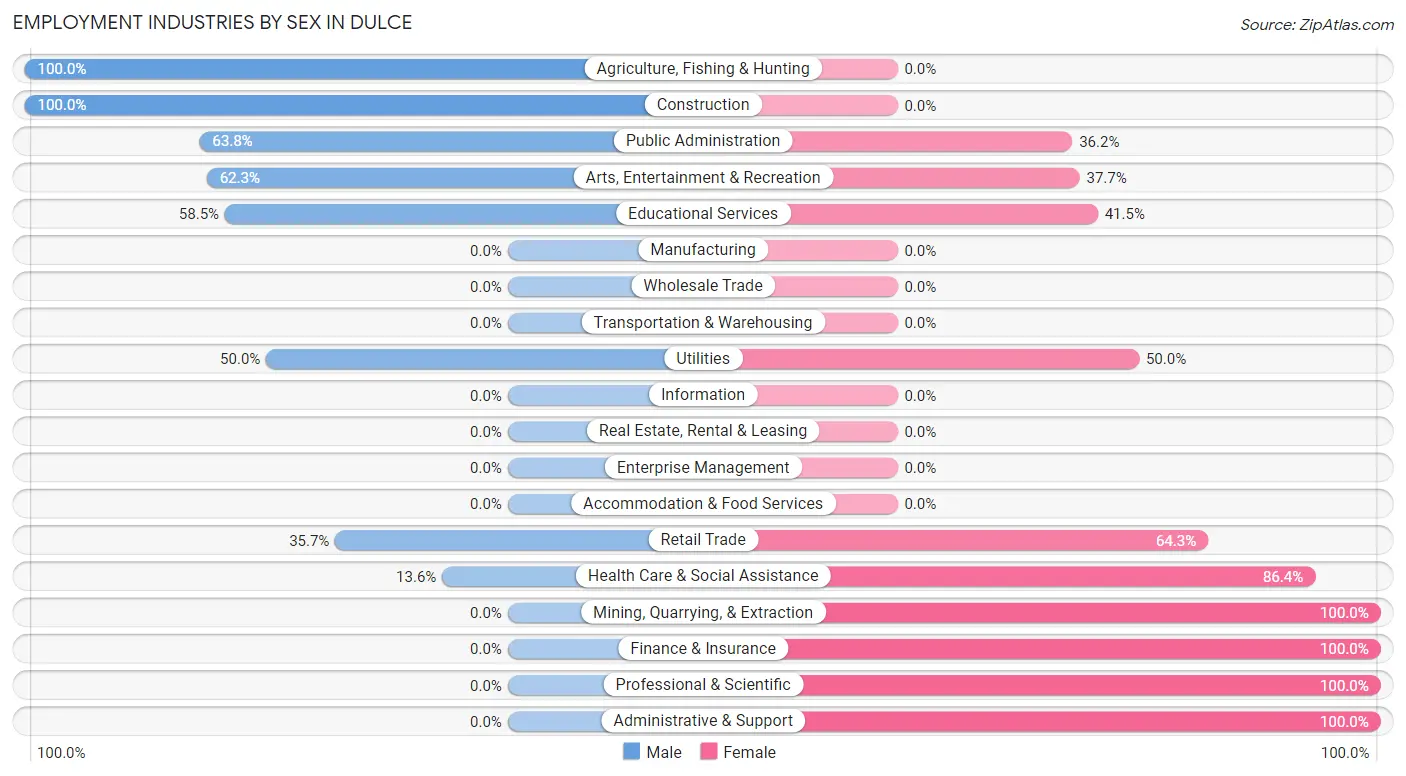
Employment Industries by Sex in Dulce
The Dulce industries that see more men than women are Agriculture, Fishing & Hunting (100.0%), Construction (100.0%), and Public Administration (63.8%), whereas the industries that tend to have a higher number of women are Mining, Quarrying, & Extraction (100.0%), Finance & Insurance (100.0%), and Professional & Scientific (100.0%).
| Industry | Male | Female |
| Agriculture, Fishing & Hunting | 11 (100.0%) | 0 (0.0%) |
| Mining, Quarrying, & Extraction | 0 (0.0%) | 21 (100.0%) |
| Construction | 99 (100.0%) | 0 (0.0%) |
| Manufacturing | 0 (0.0%) | 0 (0.0%) |
| Wholesale Trade | 0 (0.0%) | 0 (0.0%) |
| Retail Trade | 35 (35.7%) | 63 (64.3%) |
| Transportation & Warehousing | 0 (0.0%) | 0 (0.0%) |
| Utilities | 10 (50.0%) | 10 (50.0%) |
| Information | 0 (0.0%) | 0 (0.0%) |
| Finance & Insurance | 0 (0.0%) | 9 (100.0%) |
| Real Estate, Rental & Leasing | 0 (0.0%) | 0 (0.0%) |
| Professional & Scientific | 0 (0.0%) | 19 (100.0%) |
| Enterprise Management | 0 (0.0%) | 0 (0.0%) |
| Administrative & Support | 0 (0.0%) | 14 (100.0%) |
| Educational Services | 48 (58.5%) | 34 (41.5%) |
| Health Care & Social Assistance | 19 (13.6%) | 121 (86.4%) |
| Arts, Entertainment & Recreation | 38 (62.3%) | 23 (37.7%) |
| Accommodation & Food Services | 0 (0.0%) | 0 (0.0%) |
| Public Administration | 171 (63.8%) | 97 (36.2%) |
| Total | 450 (51.7%) | 421 (48.3%) |
Education in Dulce
School Enrollment in Dulce
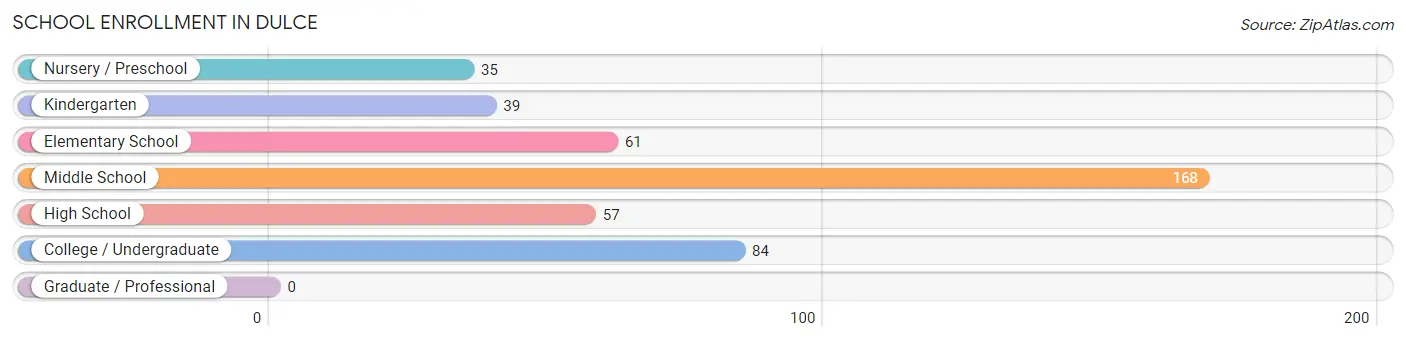
The most common levels of schooling among the 444 students in Dulce are middle school (168 | 37.8%), college / undergraduate (84 | 18.9%), and elementary school (61 | 13.7%).
| School Level | # Students | % Students |
| Nursery / Preschool | 35 | 7.9% |
| Kindergarten | 39 | 8.8% |
| Elementary School | 61 | 13.7% |
| Middle School | 168 | 37.8% |
| High School | 57 | 12.8% |
| College / Undergraduate | 84 | 18.9% |
| Graduate / Professional | 0 | 0.0% |
| Total | 444 | 100.0% |
School Enrollment by Age by Funding Source in Dulce
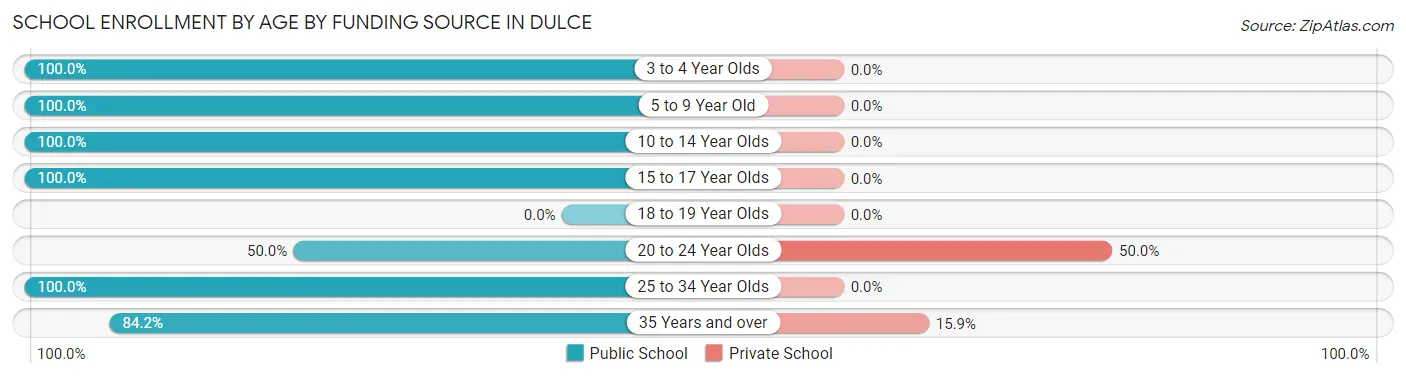
Out of a total of 444 students who are enrolled in schools in Dulce, 14 (3.2%) attend a private institution, while the remaining 430 (96.8%) are enrolled in public schools. The age group of 20 to 24 year olds has the highest likelihood of being enrolled in private schools, with 1 (50.0% in the age bracket) enrolled. Conversely, the age group of 3 to 4 year olds has the lowest likelihood of being enrolled in a private school, with 14 (100.0% in the age bracket) attending a public institution.
| Age Bracket | Public School | Private School |
| 3 to 4 Year Olds | 14 (100.0%) | 0 (0.0%) |
| 5 to 9 Year Old | 138 (100.0%) | 0 (0.0%) |
| 10 to 14 Year Olds | 151 (100.0%) | 0 (0.0%) |
| 15 to 17 Year Olds | 38 (100.0%) | 0 (0.0%) |
| 18 to 19 Year Olds | 0 (0.0%) | 0 (0.0%) |
| 20 to 24 Year Olds | 1 (50.0%) | 1 (50.0%) |
| 25 to 34 Year Olds | 19 (100.0%) | 0 (0.0%) |
| 35 Years and over | 69 (84.2%) | 13 (15.9%) |
| Total | 430 (96.8%) | 14 (3.2%) |
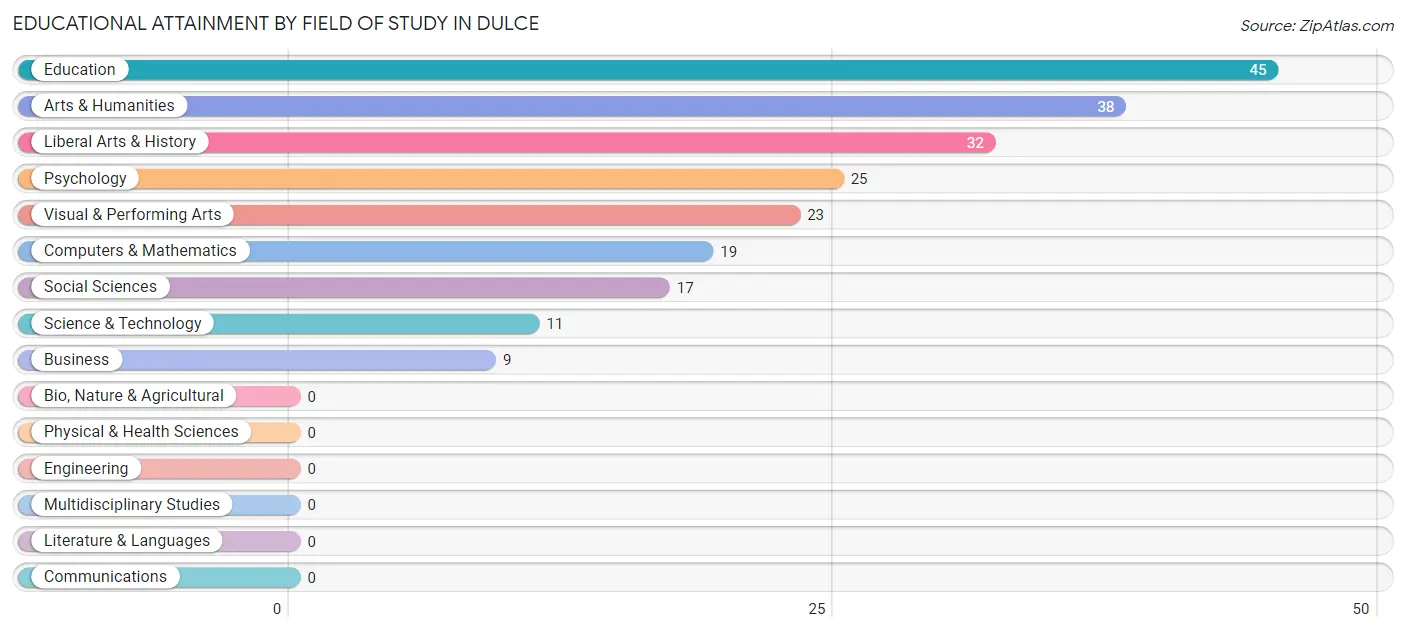
Educational Attainment by Field of Study in Dulce
Education (45 | 20.5%), arts & humanities (38 | 17.3%), liberal arts & history (32 | 14.6%), psychology (25 | 11.4%), and visual & performing arts (23 | 10.5%) are the most common fields of study among 219 individuals in Dulce who have obtained a bachelor's degree or higher.
| Field of Study | # Graduates | % Graduates |
| Computers & Mathematics | 19 | 8.7% |
| Bio, Nature & Agricultural | 0 | 0.0% |
| Physical & Health Sciences | 0 | 0.0% |
| Psychology | 25 | 11.4% |
| Social Sciences | 17 | 7.8% |
| Engineering | 0 | 0.0% |
| Multidisciplinary Studies | 0 | 0.0% |
| Science & Technology | 11 | 5.0% |
| Business | 9 | 4.1% |
| Education | 45 | 20.5% |
| Literature & Languages | 0 | 0.0% |
| Liberal Arts & History | 32 | 14.6% |
| Visual & Performing Arts | 23 | 10.5% |
| Communications | 0 | 0.0% |
| Arts & Humanities | 38 | 17.3% |
| Total | 219 | 100.0% |
Transportation & Commute in Dulce
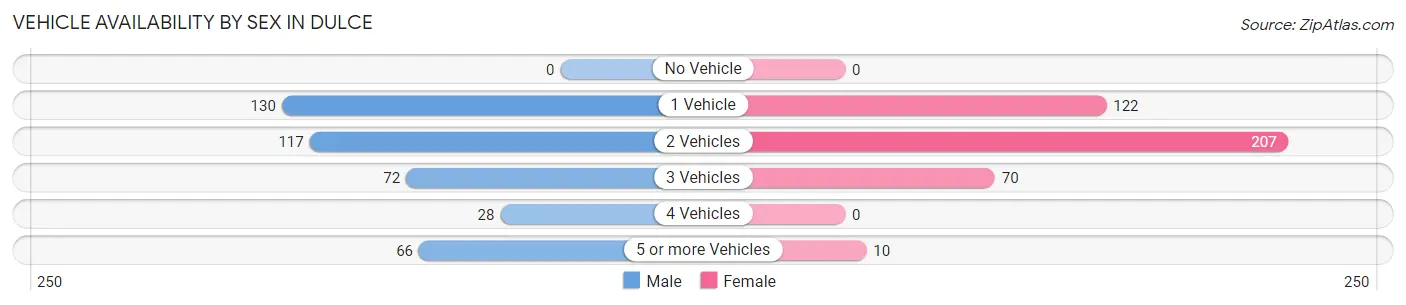
Vehicle Availability by Sex in Dulce
The most prevalent vehicle ownership categories in Dulce are males with 1 vehicle (130, accounting for 31.5%) and females with 1 vehicle (122, making up 31.8%).
| Vehicles Available | Male | Female |
| No Vehicle | 0 (0.0%) | 0 (0.0%) |
| 1 Vehicle | 130 (31.5%) | 122 (29.8%) |
| 2 Vehicles | 117 (28.3%) | 207 (50.6%) |
| 3 Vehicles | 72 (17.4%) | 70 (17.1%) |
| 4 Vehicles | 28 (6.8%) | 0 (0.0%) |
| 5 or more Vehicles | 66 (16.0%) | 10 (2.4%) |
| Total | 413 (100.0%) | 409 (100.0%) |
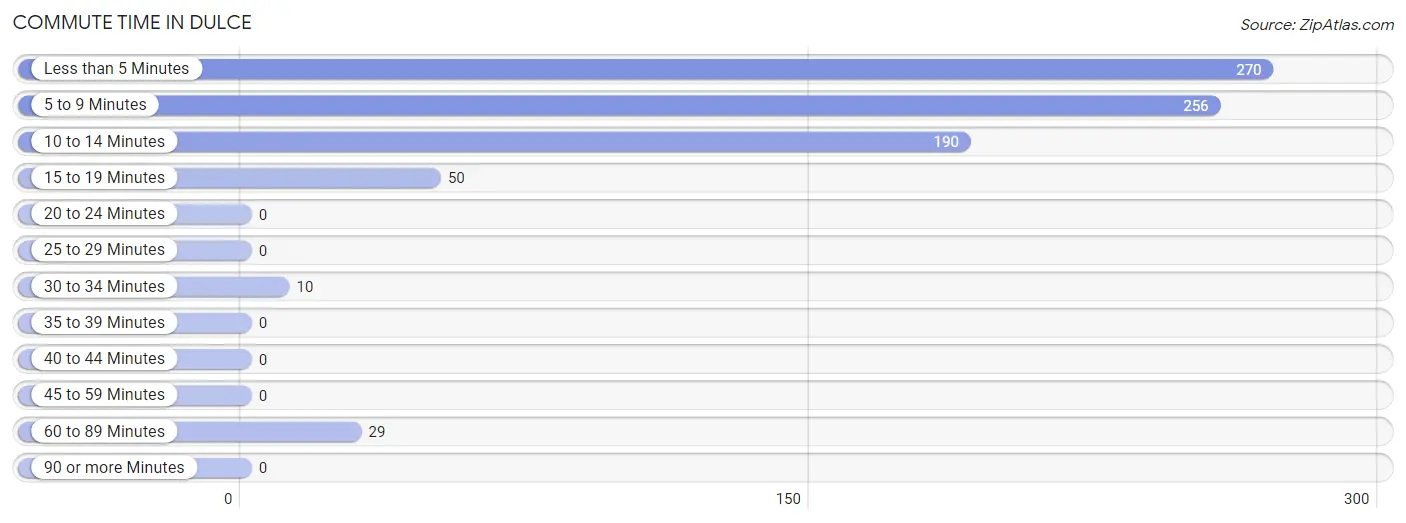
Commute Time in Dulce
The most frequently occuring commute durations in Dulce are less than 5 minutes (270 commuters, 33.5%), 5 to 9 minutes (256 commuters, 31.8%), and 10 to 14 minutes (190 commuters, 23.6%).
| Commute Time | # Commuters | % Commuters |
| Less than 5 Minutes | 270 | 33.5% |
| 5 to 9 Minutes | 256 | 31.8% |
| 10 to 14 Minutes | 190 | 23.6% |
| 15 to 19 Minutes | 50 | 6.2% |
| 20 to 24 Minutes | 0 | 0.0% |
| 25 to 29 Minutes | 0 | 0.0% |
| 30 to 34 Minutes | 10 | 1.2% |
| 35 to 39 Minutes | 0 | 0.0% |
| 40 to 44 Minutes | 0 | 0.0% |
| 45 to 59 Minutes | 0 | 0.0% |
| 60 to 89 Minutes | 29 | 3.6% |
| 90 or more Minutes | 0 | 0.0% |
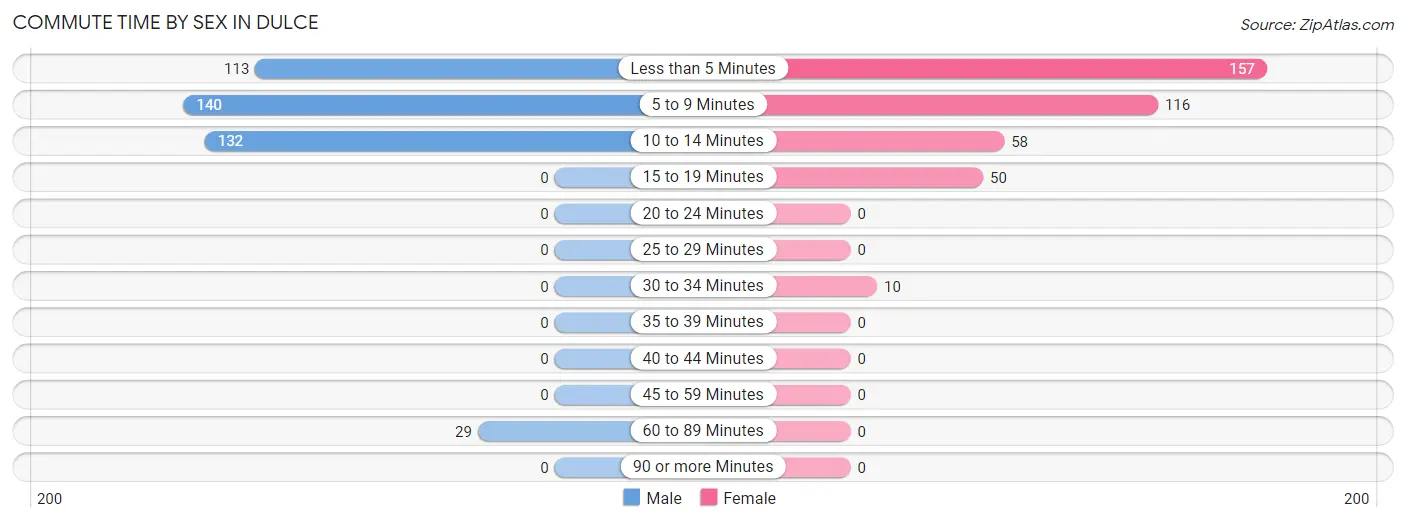
Commute Time by Sex in Dulce
The most common commute times in Dulce are 5 to 9 minutes (140 commuters, 33.8%) for males and less than 5 minutes (157 commuters, 40.2%) for females.
| Commute Time | Male | Female |
| Less than 5 Minutes | 113 (27.3%) | 157 (40.2%) |
| 5 to 9 Minutes | 140 (33.8%) | 116 (29.7%) |
| 10 to 14 Minutes | 132 (31.9%) | 58 (14.8%) |
| 15 to 19 Minutes | 0 (0.0%) | 50 (12.8%) |
| 20 to 24 Minutes | 0 (0.0%) | 0 (0.0%) |
| 25 to 29 Minutes | 0 (0.0%) | 0 (0.0%) |
| 30 to 34 Minutes | 0 (0.0%) | 10 (2.6%) |
| 35 to 39 Minutes | 0 (0.0%) | 0 (0.0%) |
| 40 to 44 Minutes | 0 (0.0%) | 0 (0.0%) |
| 45 to 59 Minutes | 0 (0.0%) | 0 (0.0%) |
| 60 to 89 Minutes | 29 (7.0%) | 0 (0.0%) |
| 90 or more Minutes | 0 (0.0%) | 0 (0.0%) |
Time of Departure to Work by Sex in Dulce
The most frequent times of departure to work in Dulce are 7:30 AM to 7:59 AM (206, 49.8%) for males and 7:30 AM to 7:59 AM (149, 38.1%) for females.
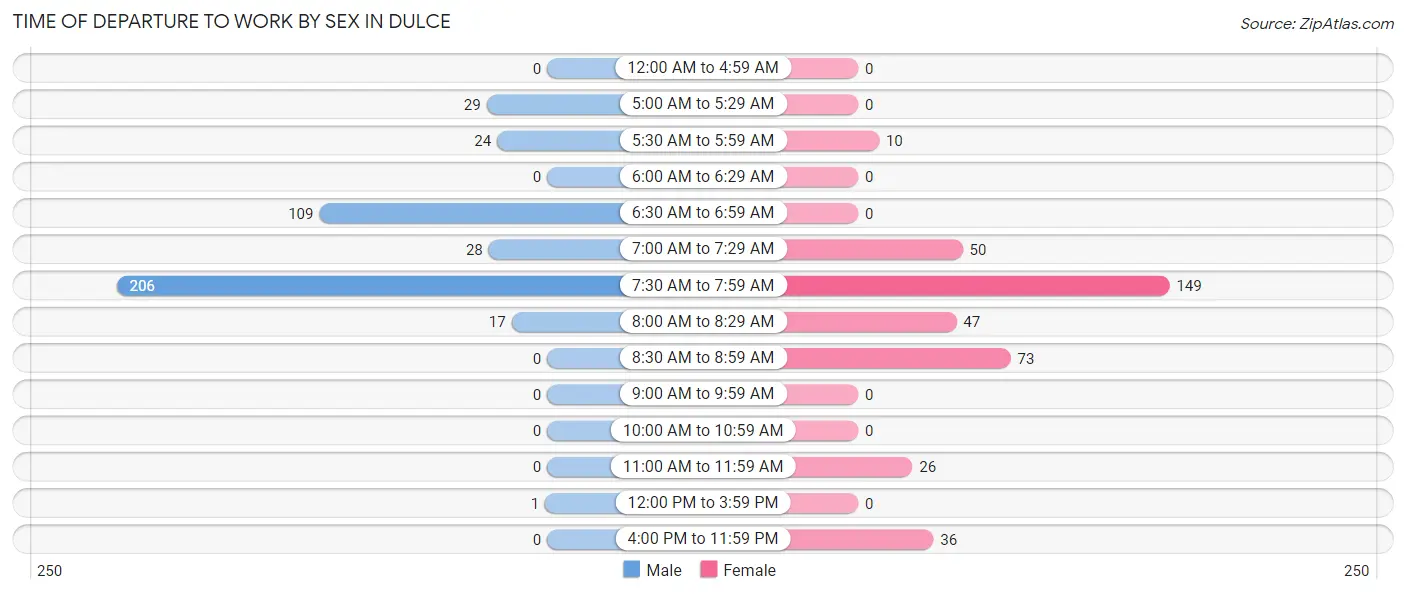
| Time of Departure | Male | Female |
| 12:00 AM to 4:59 AM | 0 (0.0%) | 0 (0.0%) |
| 5:00 AM to 5:29 AM | 29 (7.0%) | 0 (0.0%) |
| 5:30 AM to 5:59 AM | 24 (5.8%) | 10 (2.6%) |
| 6:00 AM to 6:29 AM | 0 (0.0%) | 0 (0.0%) |
| 6:30 AM to 6:59 AM | 109 (26.3%) | 0 (0.0%) |
| 7:00 AM to 7:29 AM | 28 (6.8%) | 50 (12.8%) |
| 7:30 AM to 7:59 AM | 206 (49.8%) | 149 (38.1%) |
| 8:00 AM to 8:29 AM | 17 (4.1%) | 47 (12.0%) |
| 8:30 AM to 8:59 AM | 0 (0.0%) | 73 (18.7%) |
| 9:00 AM to 9:59 AM | 0 (0.0%) | 0 (0.0%) |
| 10:00 AM to 10:59 AM | 0 (0.0%) | 0 (0.0%) |
| 11:00 AM to 11:59 AM | 0 (0.0%) | 26 (6.7%) |
| 12:00 PM to 3:59 PM | 1 (0.2%) | 0 (0.0%) |
| 4:00 PM to 11:59 PM | 0 (0.0%) | 36 (9.2%) |
| Total | 414 (100.0%) | 391 (100.0%) |
Housing Occupancy in Dulce
Occupancy by Ownership in Dulce
Of the total 781 dwellings in Dulce, owner-occupied units account for 443 (56.7%), while renter-occupied units make up 338 (43.3%).
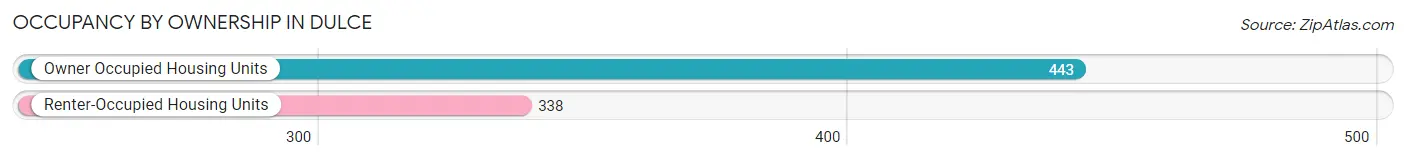
| Occupancy | # Housing Units | % Housing Units |
| Owner Occupied Housing Units | 443 | 56.7% |
| Renter-Occupied Housing Units | 338 | 43.3% |
| Total Occupied Housing Units | 781 | 100.0% |
Occupancy by Household Size in Dulce
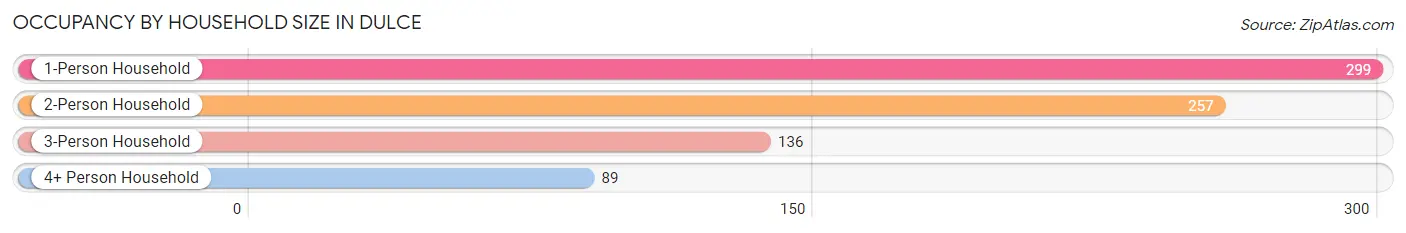
| Household Size | # Housing Units | % Housing Units |
| 1-Person Household | 299 | 38.3% |
| 2-Person Household | 257 | 32.9% |
| 3-Person Household | 136 | 17.4% |
| 4+ Person Household | 89 | 11.4% |
| Total Housing Units | 781 | 100.0% |
Occupancy by Ownership by Household Size in Dulce
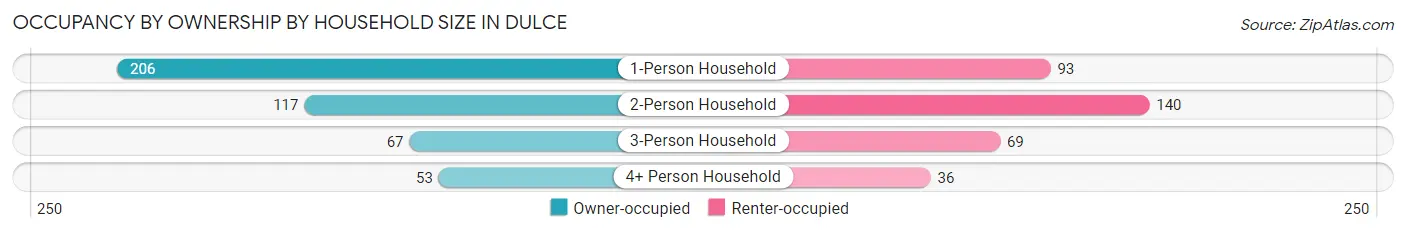
| Household Size | Owner-occupied | Renter-occupied |
| 1-Person Household | 206 (68.9%) | 93 (31.1%) |
| 2-Person Household | 117 (45.5%) | 140 (54.5%) |
| 3-Person Household | 67 (49.3%) | 69 (50.7%) |
| 4+ Person Household | 53 (59.6%) | 36 (40.5%) |
| Total Housing Units | 443 (56.7%) | 338 (43.3%) |
Occupancy by Educational Attainment in Dulce
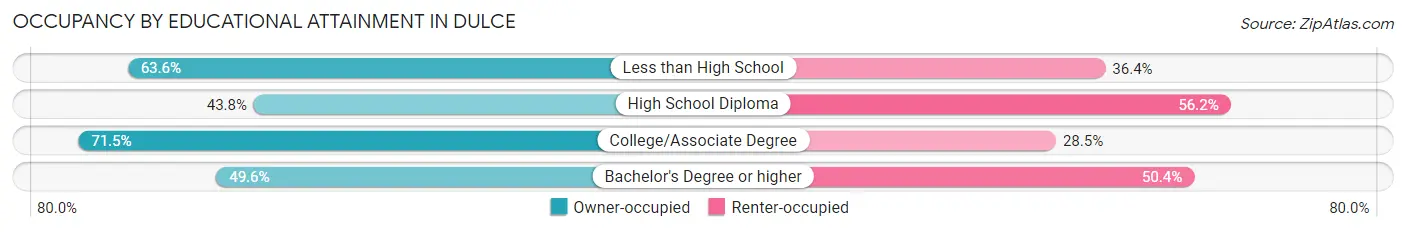
| Household Size | Owner-occupied | Renter-occupied |
| Less than High School | 49 (63.6%) | 28 (36.4%) |
| High School Diploma | 131 (43.8%) | 168 (56.2%) |
| College/Associate Degree | 203 (71.5%) | 81 (28.5%) |
| Bachelor's Degree or higher | 60 (49.6%) | 61 (50.4%) |
Occupancy by Age of Householder in Dulce
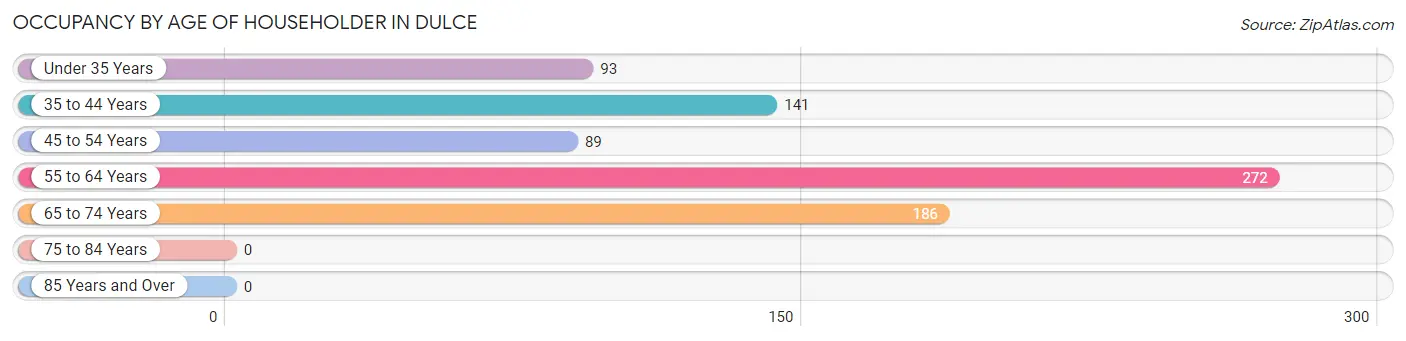
| Age Bracket | # Households | % Households |
| Under 35 Years | 93 | 11.9% |
| 35 to 44 Years | 141 | 18.0% |
| 45 to 54 Years | 89 | 11.4% |
| 55 to 64 Years | 272 | 34.8% |
| 65 to 74 Years | 186 | 23.8% |
| 75 to 84 Years | 0 | 0.0% |
| 85 Years and Over | 0 | 0.0% |
| Total | 781 | 100.0% |
Housing Finances in Dulce
Median Income by Occupancy in Dulce
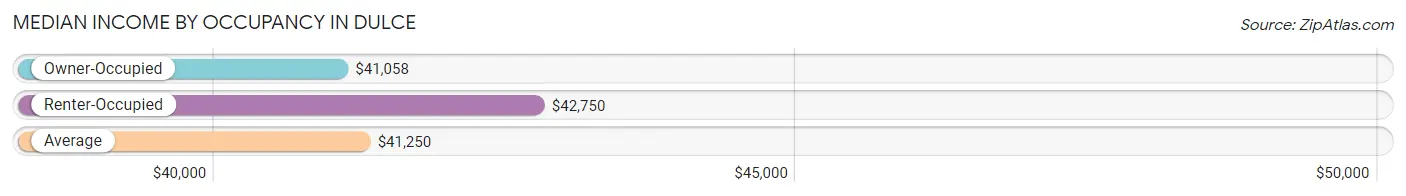
| Occupancy Type | # Households | Median Income |
| Owner-Occupied | 443 (56.7%) | $41,058 |
| Renter-Occupied | 338 (43.3%) | $42,750 |
| Average | 781 (100.0%) | $41,250 |
Occupancy by Householder Income Bracket in Dulce
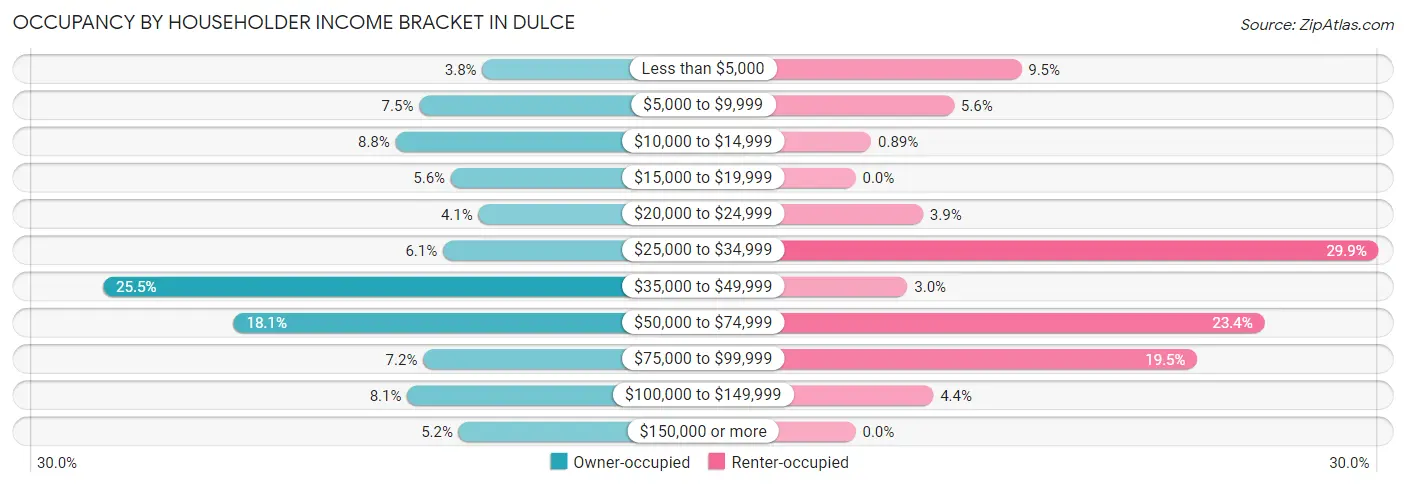
| Income Bracket | Owner-occupied | Renter-occupied |
| Less than $5,000 | 17 (3.8%) | 32 (9.5%) |
| $5,000 to $9,999 | 33 (7.4%) | 19 (5.6%) |
| $10,000 to $14,999 | 39 (8.8%) | 3 (0.9%) |
| $15,000 to $19,999 | 25 (5.6%) | 0 (0.0%) |
| $20,000 to $24,999 | 18 (4.1%) | 13 (3.8%) |
| $25,000 to $34,999 | 27 (6.1%) | 101 (29.9%) |
| $35,000 to $49,999 | 113 (25.5%) | 10 (3.0%) |
| $50,000 to $74,999 | 80 (18.1%) | 79 (23.4%) |
| $75,000 to $99,999 | 32 (7.2%) | 66 (19.5%) |
| $100,000 to $149,999 | 36 (8.1%) | 15 (4.4%) |
| $150,000 or more | 23 (5.2%) | 0 (0.0%) |
| Total | 443 (100.0%) | 338 (100.0%) |
Monthly Housing Cost Tiers in Dulce
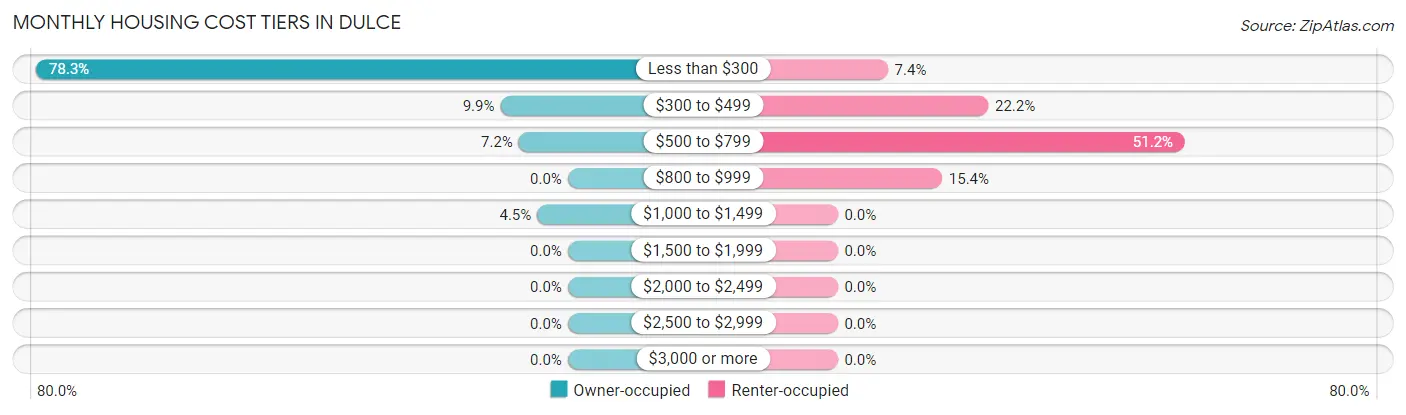
| Monthly Cost | Owner-occupied | Renter-occupied |
| Less than $300 | 347 (78.3%) | 25 (7.4%) |
| $300 to $499 | 44 (9.9%) | 75 (22.2%) |
| $500 to $799 | 32 (7.2%) | 173 (51.2%) |
| $800 to $999 | 0 (0.0%) | 52 (15.4%) |
| $1,000 to $1,499 | 20 (4.5%) | 0 (0.0%) |
| $1,500 to $1,999 | 0 (0.0%) | 0 (0.0%) |
| $2,000 to $2,499 | 0 (0.0%) | 0 (0.0%) |
| $2,500 to $2,999 | 0 (0.0%) | 0 (0.0%) |
| $3,000 or more | 0 (0.0%) | 0 (0.0%) |
| Total | 443 (100.0%) | 338 (100.0%) |
Physical Housing Characteristics in Dulce
Housing Structures in Dulce
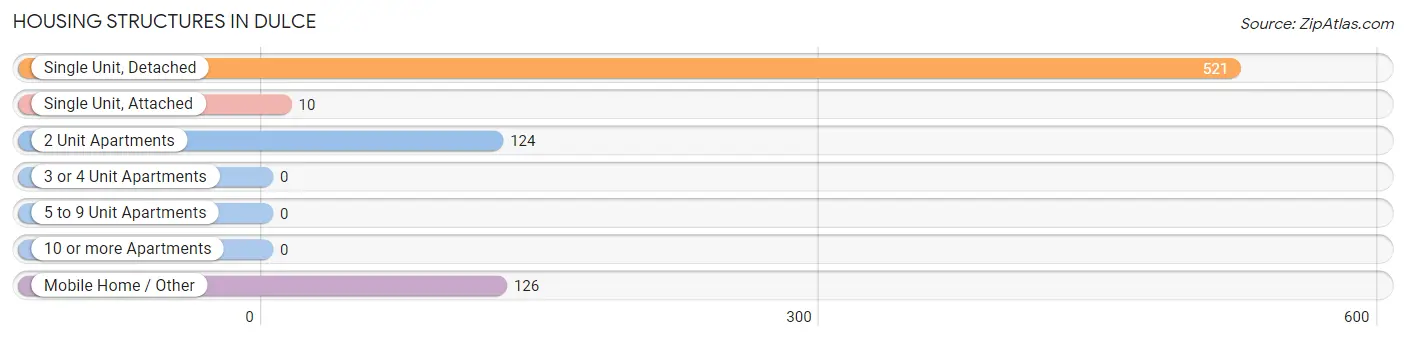
| Structure Type | # Housing Units | % Housing Units |
| Single Unit, Detached | 521 | 66.7% |
| Single Unit, Attached | 10 | 1.3% |
| 2 Unit Apartments | 124 | 15.9% |
| 3 or 4 Unit Apartments | 0 | 0.0% |
| 5 to 9 Unit Apartments | 0 | 0.0% |
| 10 or more Apartments | 0 | 0.0% |
| Mobile Home / Other | 126 | 16.1% |
| Total | 781 | 100.0% |
Housing Structures by Occupancy in Dulce
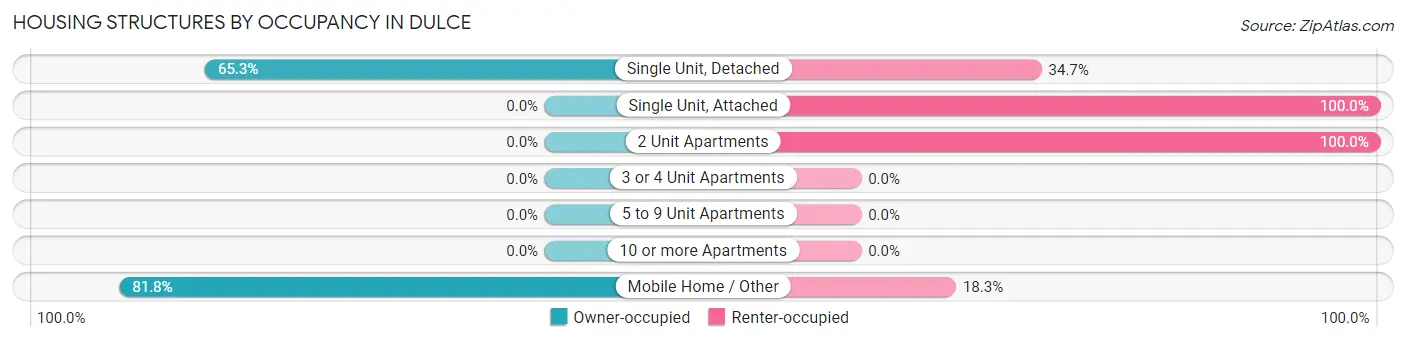
| Structure Type | Owner-occupied | Renter-occupied |
| Single Unit, Detached | 340 (65.3%) | 181 (34.7%) |
| Single Unit, Attached | 0 (0.0%) | 10 (100.0%) |
| 2 Unit Apartments | 0 (0.0%) | 124 (100.0%) |
| 3 or 4 Unit Apartments | 0 (0.0%) | 0 (0.0%) |
| 5 to 9 Unit Apartments | 0 (0.0%) | 0 (0.0%) |
| 10 or more Apartments | 0 (0.0%) | 0 (0.0%) |
| Mobile Home / Other | 103 (81.8%) | 23 (18.2%) |
| Total | 443 (56.7%) | 338 (43.3%) |
Housing Structures by Number of Rooms in Dulce
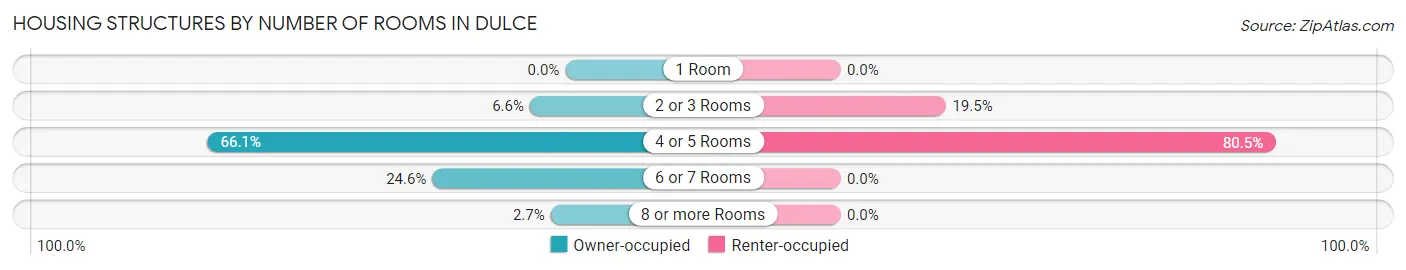
| Number of Rooms | Owner-occupied | Renter-occupied |
| 1 Room | 0 (0.0%) | 0 (0.0%) |
| 2 or 3 Rooms | 29 (6.6%) | 66 (19.5%) |
| 4 or 5 Rooms | 293 (66.1%) | 272 (80.5%) |
| 6 or 7 Rooms | 109 (24.6%) | 0 (0.0%) |
| 8 or more Rooms | 12 (2.7%) | 0 (0.0%) |
| Total | 443 (100.0%) | 338 (100.0%) |
Housing Structure by Heating Type in Dulce
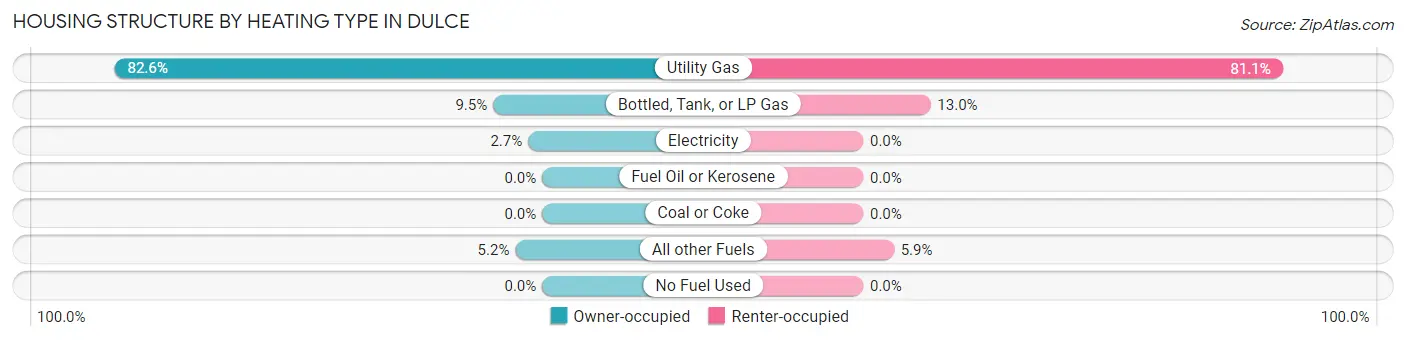
| Heating Type | Owner-occupied | Renter-occupied |
| Utility Gas | 366 (82.6%) | 274 (81.1%) |
| Bottled, Tank, or LP Gas | 42 (9.5%) | 44 (13.0%) |
| Electricity | 12 (2.7%) | 0 (0.0%) |
| Fuel Oil or Kerosene | 0 (0.0%) | 0 (0.0%) |
| Coal or Coke | 0 (0.0%) | 0 (0.0%) |
| All other Fuels | 23 (5.2%) | 20 (5.9%) |
| No Fuel Used | 0 (0.0%) | 0 (0.0%) |
| Total | 443 (100.0%) | 338 (100.0%) |
Household Vehicle Usage in Dulce
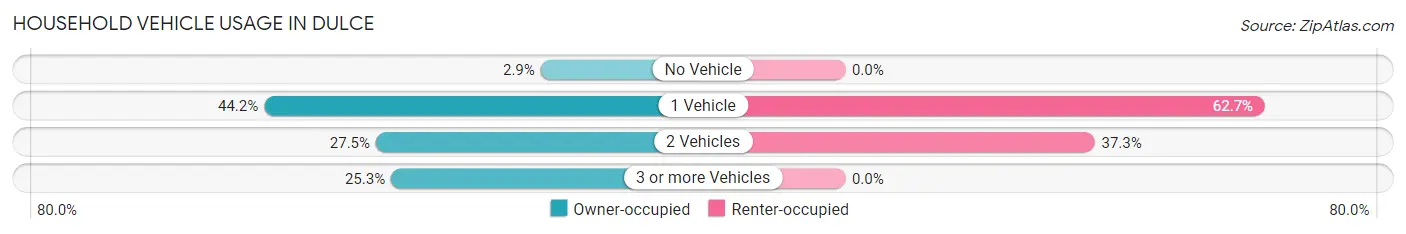
| Vehicles per Household | Owner-occupied | Renter-occupied |
| No Vehicle | 13 (2.9%) | 0 (0.0%) |
| 1 Vehicle | 196 (44.2%) | 212 (62.7%) |
| 2 Vehicles | 122 (27.5%) | 126 (37.3%) |
| 3 or more Vehicles | 112 (25.3%) | 0 (0.0%) |
| Total | 443 (100.0%) | 338 (100.0%) |
Real Estate & Mortgages in Dulce
Real Estate and Mortgage Overview in Dulce
| Characteristic | Without Mortgage | With Mortgage |
| Housing Units | 391 | 52 |
| Median Property Value | $55,600 | $114,300 |
| Median Household Income | $40,481 | $0 |
| Monthly Housing Costs | $144 | $0 |
| Real Estate Taxes | - | - |
Property Value by Mortgage Status in Dulce
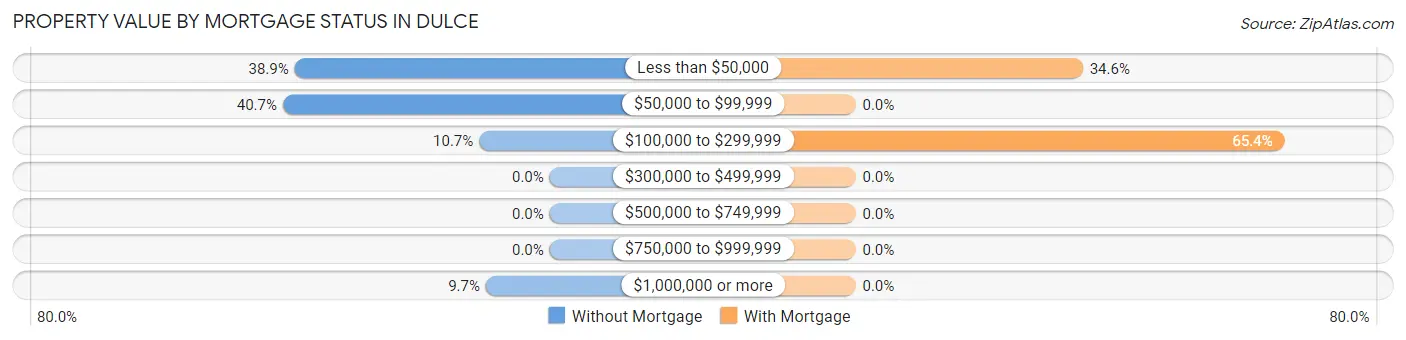
| Property Value | Without Mortgage | With Mortgage |
| Less than $50,000 | 152 (38.9%) | 18 (34.6%) |
| $50,000 to $99,999 | 159 (40.7%) | 0 (0.0%) |
| $100,000 to $299,999 | 42 (10.7%) | 34 (65.4%) |
| $300,000 to $499,999 | 0 (0.0%) | 0 (0.0%) |
| $500,000 to $749,999 | 0 (0.0%) | 0 (0.0%) |
| $750,000 to $999,999 | 0 (0.0%) | 0 (0.0%) |
| $1,000,000 or more | 38 (9.7%) | 0 (0.0%) |
| Total | 391 (100.0%) | 52 (100.0%) |
Household Income by Mortgage Status in Dulce
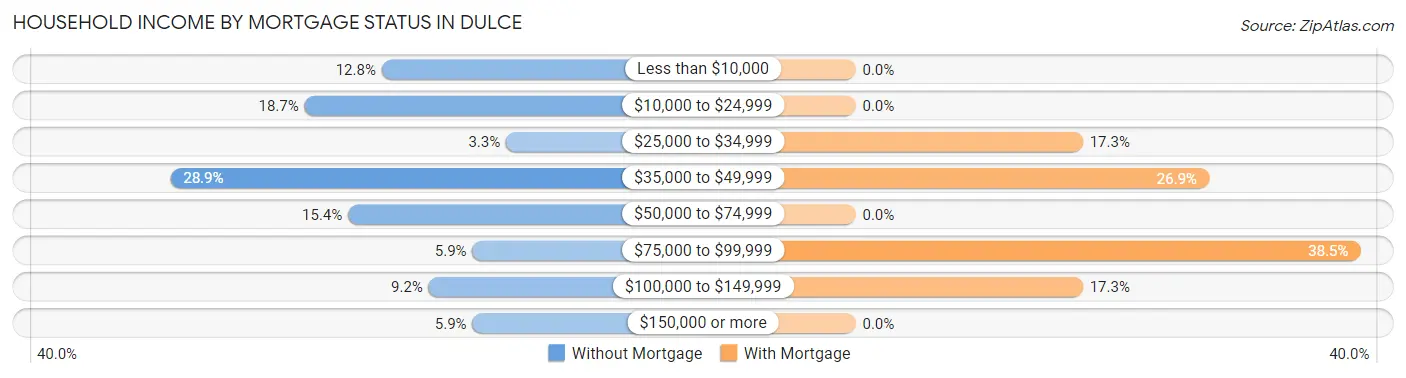
| Household Income | Without Mortgage | With Mortgage |
| Less than $10,000 | 50 (12.8%) | 0 (0.0%) |
| $10,000 to $24,999 | 73 (18.7%) | 0 (0.0%) |
| $25,000 to $34,999 | 13 (3.3%) | 9 (17.3%) |
| $35,000 to $49,999 | 113 (28.9%) | 14 (26.9%) |
| $50,000 to $74,999 | 60 (15.3%) | 0 (0.0%) |
| $75,000 to $99,999 | 23 (5.9%) | 20 (38.5%) |
| $100,000 to $149,999 | 36 (9.2%) | 9 (17.3%) |
| $150,000 or more | 23 (5.9%) | 0 (0.0%) |
| Total | 391 (100.0%) | 52 (100.0%) |
Property Value to Household Income Ratio in Dulce
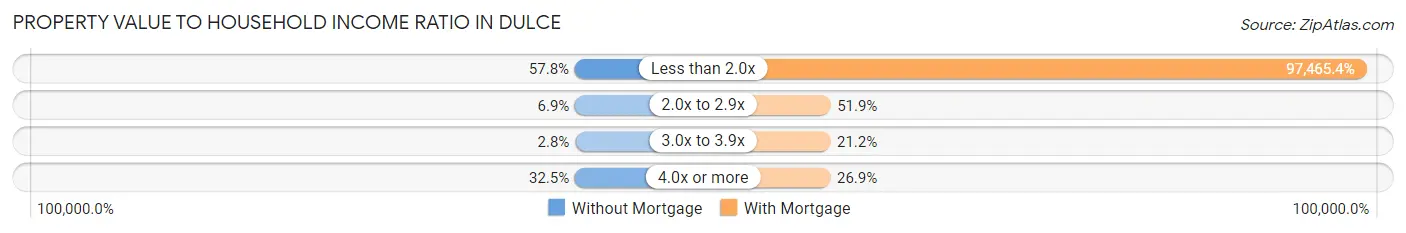
| Value-to-Income Ratio | Without Mortgage | With Mortgage |
| Less than 2.0x | 226 (57.8%) | 50,682 (97,465.4%) |
| 2.0x to 2.9x | 27 (6.9%) | 27 (51.9%) |
| 3.0x to 3.9x | 11 (2.8%) | 11 (21.1%) |
| 4.0x or more | 127 (32.5%) | 14 (26.9%) |
| Total | 391 (100.0%) | 52 (100.0%) |
Real Estate Taxes by Mortgage Status in Dulce
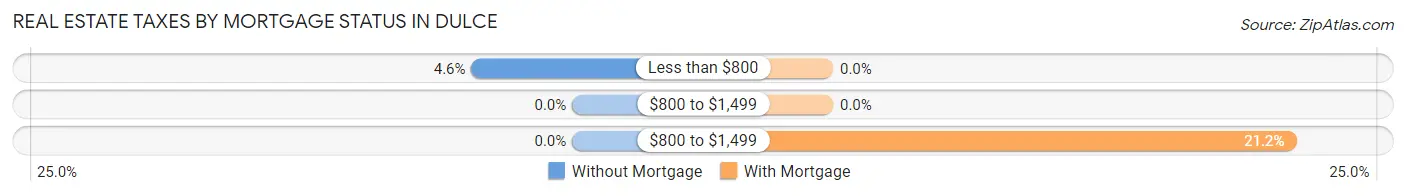
| Property Taxes | Without Mortgage | With Mortgage |
| Less than $800 | 18 (4.6%) | 0 (0.0%) |
| $800 to $1,499 | 0 (0.0%) | 0 (0.0%) |
| $800 to $1,499 | 0 (0.0%) | 11 (21.1%) |
| Total | 391 (100.0%) | 52 (100.0%) |
Health & Disability in Dulce
Health Insurance Coverage by Age in Dulce
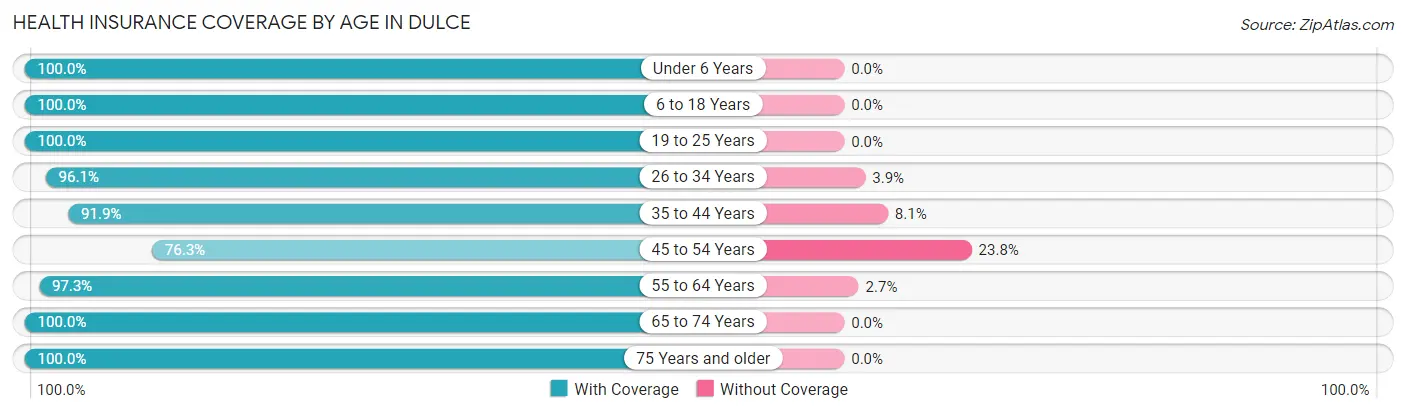
| Age Bracket | With Coverage | Without Coverage |
| Under 6 Years | 142 (100.0%) | 0 (0.0%) |
| 6 to 18 Years | 392 (100.0%) | 0 (0.0%) |
| 19 to 25 Years | 167 (100.0%) | 0 (0.0%) |
| 26 to 34 Years | 293 (96.1%) | 12 (3.9%) |
| 35 to 44 Years | 192 (91.9%) | 17 (8.1%) |
| 45 to 54 Years | 199 (76.2%) | 62 (23.7%) |
| 55 to 64 Years | 399 (97.3%) | 11 (2.7%) |
| 65 to 74 Years | 274 (100.0%) | 0 (0.0%) |
| 75 Years and older | 87 (100.0%) | 0 (0.0%) |
| Total | 2,145 (95.5%) | 102 (4.5%) |
Health Insurance Coverage by Citizenship Status in Dulce

| Citizenship Status | With Coverage | Without Coverage |
| Native Born | 142 (100.0%) | 0 (0.0%) |
| Foreign Born, Citizen | 392 (100.0%) | 0 (0.0%) |
| Foreign Born, not a Citizen | 167 (100.0%) | 0 (0.0%) |
Health Insurance Coverage by Household Income in Dulce
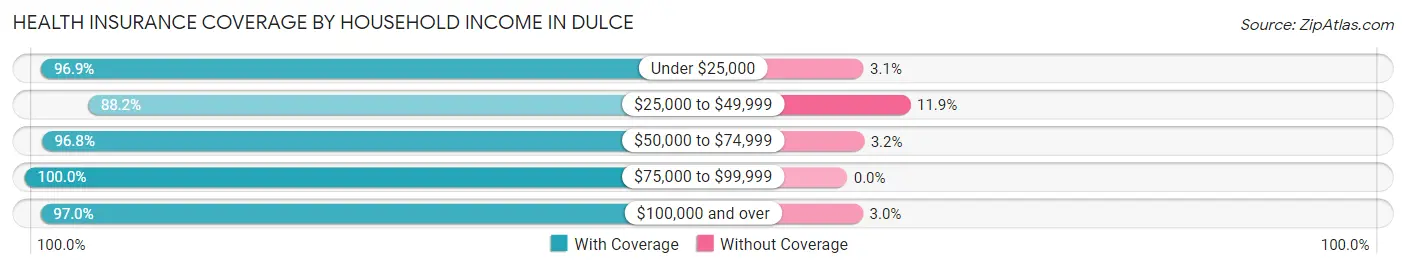
| Household Income | With Coverage | Without Coverage |
| Under $25,000 | 347 (96.9%) | 11 (3.1%) |
| $25,000 to $49,999 | 439 (88.1%) | 59 (11.8%) |
| $50,000 to $74,999 | 520 (96.8%) | 17 (3.2%) |
| $75,000 to $99,999 | 343 (100.0%) | 0 (0.0%) |
| $100,000 and over | 492 (97.0%) | 15 (3.0%) |
Public vs Private Health Insurance Coverage by Age in Dulce
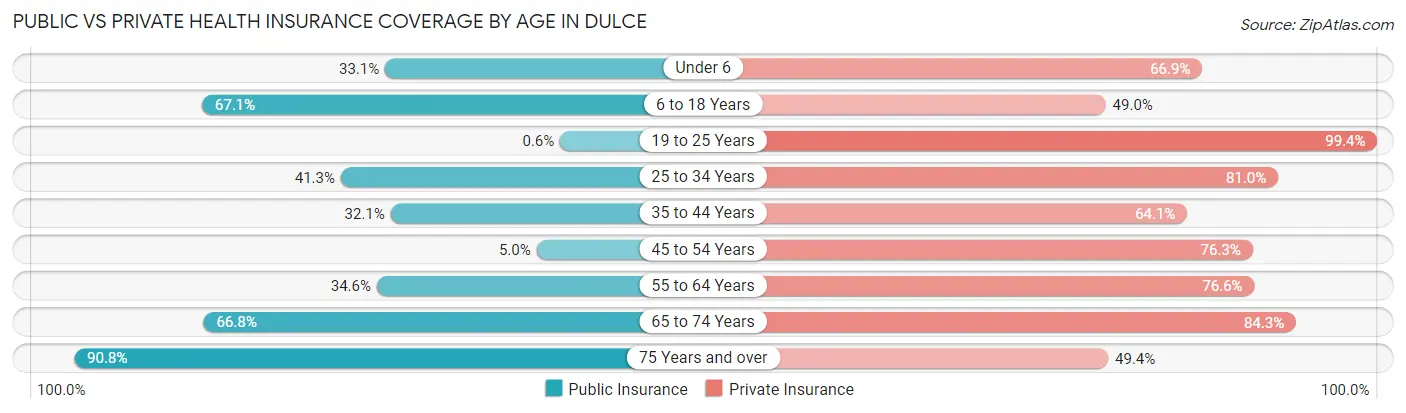
| Age Bracket | Public Insurance | Private Insurance |
| Under 6 | 47 (33.1%) | 95 (66.9%) |
| 6 to 18 Years | 263 (67.1%) | 192 (49.0%) |
| 19 to 25 Years | 1 (0.6%) | 166 (99.4%) |
| 25 to 34 Years | 126 (41.3%) | 247 (81.0%) |
| 35 to 44 Years | 67 (32.1%) | 134 (64.1%) |
| 45 to 54 Years | 13 (5.0%) | 199 (76.2%) |
| 55 to 64 Years | 142 (34.6%) | 314 (76.6%) |
| 65 to 74 Years | 183 (66.8%) | 231 (84.3%) |
| 75 Years and over | 79 (90.8%) | 43 (49.4%) |
| Total | 921 (41.0%) | 1,621 (72.1%) |
Disability Status by Sex by Age in Dulce
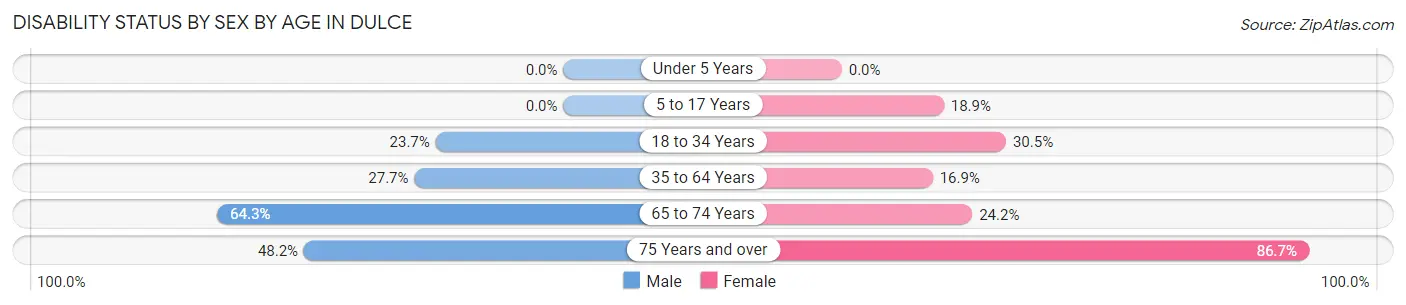
| Age Bracket | Male | Female |
| Under 5 Years | 0 (0.0%) | 0 (0.0%) |
| 5 to 17 Years | 0 (0.0%) | 39 (18.9%) |
| 18 to 34 Years | 55 (23.7%) | 82 (30.5%) |
| 35 to 64 Years | 104 (27.7%) | 85 (16.9%) |
| 65 to 74 Years | 115 (64.2%) | 23 (24.2%) |
| 75 Years and over | 13 (48.1%) | 52 (86.7%) |
Disability Class by Sex by Age in Dulce
Disability Class: Hearing Difficulty
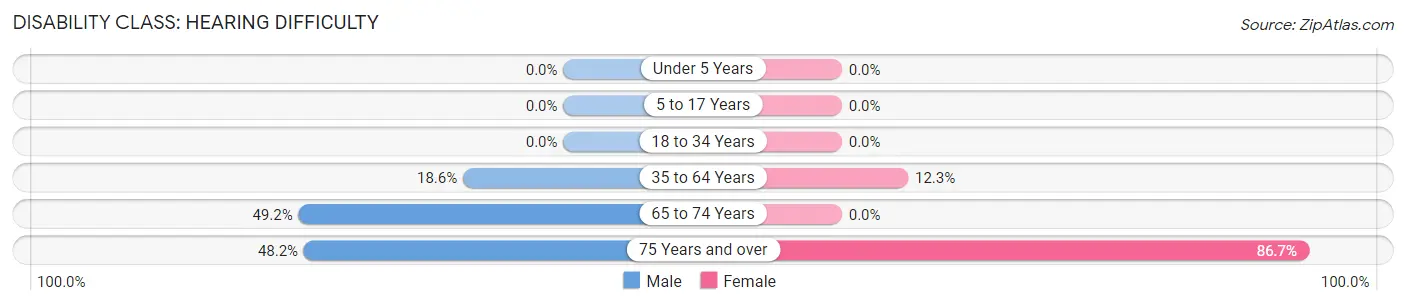
| Age Bracket | Male | Female |
| Under 5 Years | 0 (0.0%) | 0 (0.0%) |
| 5 to 17 Years | 0 (0.0%) | 0 (0.0%) |
| 18 to 34 Years | 0 (0.0%) | 0 (0.0%) |
| 35 to 64 Years | 70 (18.6%) | 62 (12.3%) |
| 65 to 74 Years | 88 (49.2%) | 0 (0.0%) |
| 75 Years and over | 13 (48.1%) | 52 (86.7%) |
Disability Class: Vision Difficulty
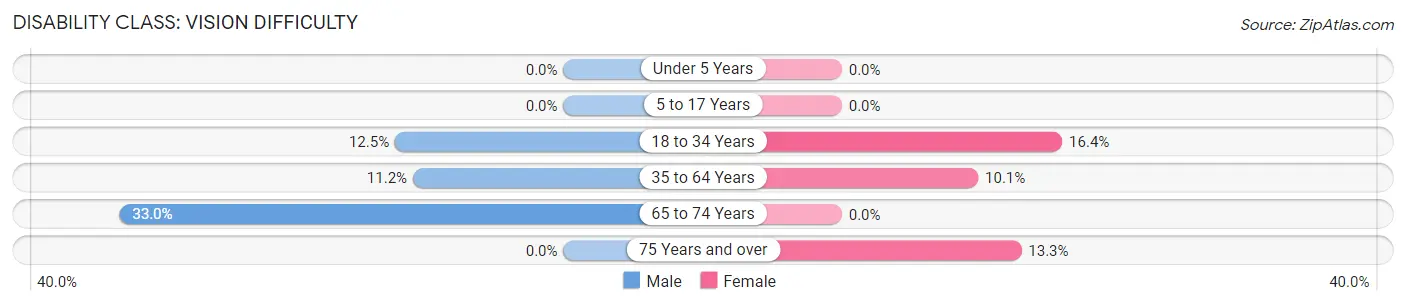
| Age Bracket | Male | Female |
| Under 5 Years | 0 (0.0%) | 0 (0.0%) |
| 5 to 17 Years | 0 (0.0%) | 0 (0.0%) |
| 18 to 34 Years | 29 (12.5%) | 44 (16.4%) |
| 35 to 64 Years | 42 (11.2%) | 51 (10.1%) |
| 65 to 74 Years | 59 (33.0%) | 0 (0.0%) |
| 75 Years and over | 0 (0.0%) | 8 (13.3%) |
Disability Class: Cognitive Difficulty
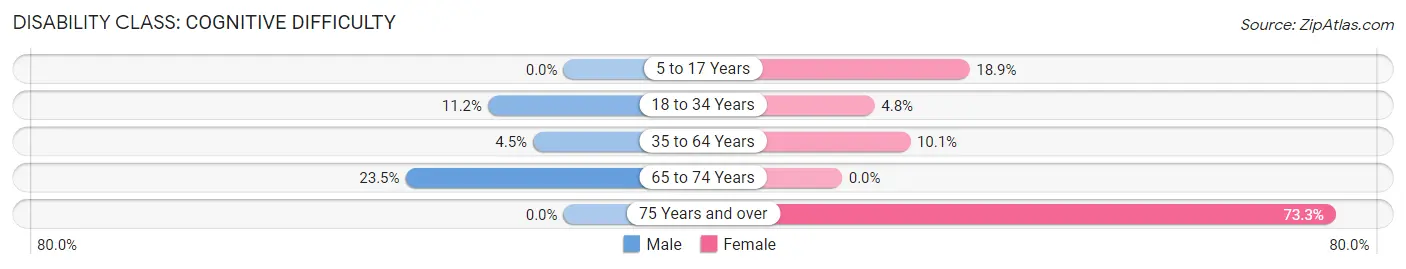
| Age Bracket | Male | Female |
| 5 to 17 Years | 0 (0.0%) | 39 (18.9%) |
| 18 to 34 Years | 26 (11.2%) | 13 (4.8%) |
| 35 to 64 Years | 17 (4.5%) | 51 (10.1%) |
| 65 to 74 Years | 42 (23.5%) | 0 (0.0%) |
| 75 Years and over | 0 (0.0%) | 44 (73.3%) |
Disability Class: Ambulatory Difficulty
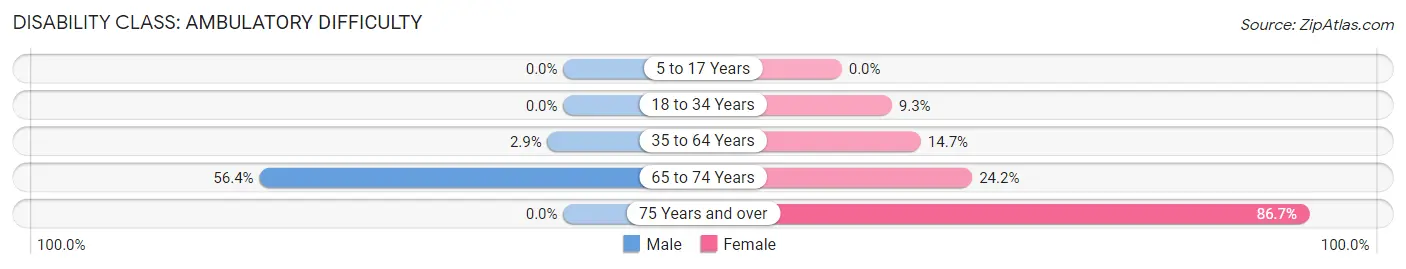
| Age Bracket | Male | Female |
| 5 to 17 Years | 0 (0.0%) | 0 (0.0%) |
| 18 to 34 Years | 0 (0.0%) | 25 (9.3%) |
| 35 to 64 Years | 11 (2.9%) | 74 (14.7%) |
| 65 to 74 Years | 101 (56.4%) | 23 (24.2%) |
| 75 Years and over | 0 (0.0%) | 52 (86.7%) |
Disability Class: Self-Care Difficulty
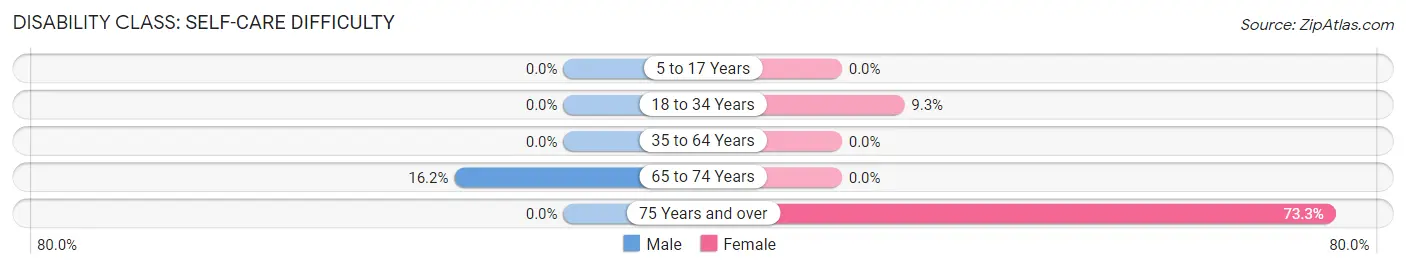
| Age Bracket | Male | Female |
| 5 to 17 Years | 0 (0.0%) | 0 (0.0%) |
| 18 to 34 Years | 0 (0.0%) | 25 (9.3%) |
| 35 to 64 Years | 0 (0.0%) | 0 (0.0%) |
| 65 to 74 Years | 29 (16.2%) | 0 (0.0%) |
| 75 Years and over | 0 (0.0%) | 44 (73.3%) |
Technology Access in Dulce
Computing Device Access in Dulce
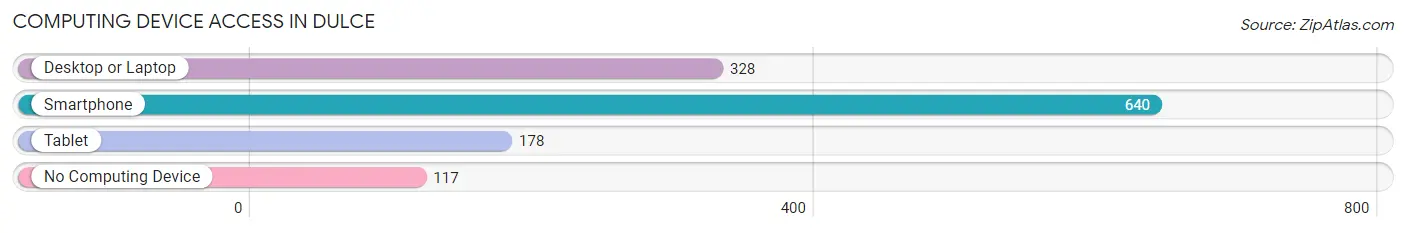
| Device Type | # Households | % Households |
| Desktop or Laptop | 328 | 42.0% |
| Smartphone | 640 | 82.0% |
| Tablet | 178 | 22.8% |
| No Computing Device | 117 | 15.0% |
| Total | 781 | 100.0% |
Internet Access in Dulce
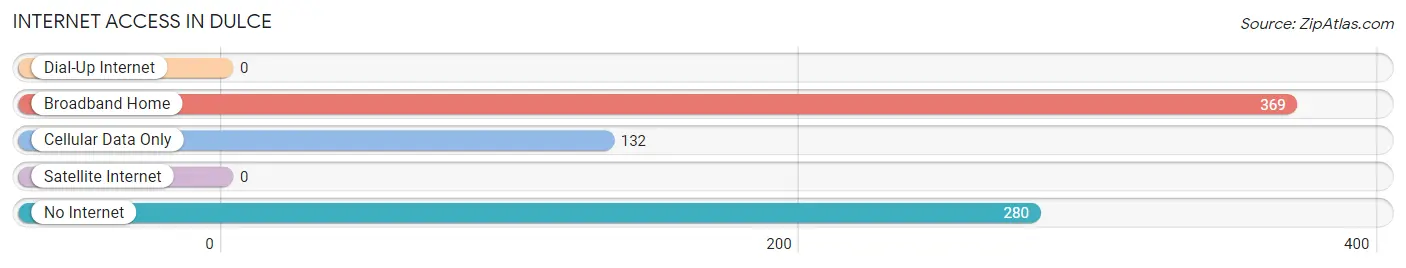
| Internet Type | # Households | % Households |
| Dial-Up Internet | 0 | 0.0% |
| Broadband Home | 369 | 47.2% |
| Cellular Data Only | 132 | 16.9% |
| Satellite Internet | 0 | 0.0% |
| No Internet | 280 | 35.8% |
| Total | 781 | 100.0% |
Dulce Summary
Dulce is a small town located in the Jicarilla Apache Nation in Rio Arriba County, New Mexico. It is situated in the foothills of the Sangre de Cristo Mountains, near the Colorado border. The town is home to the Jicarilla Apache Nation, a federally recognized tribe of Native Americans. The population of Dulce was 1,631 at the 2000 census.
Geography
Dulce is located at 36°59'25" North, 106°59'25" West (36.990278, -106.990278). According to the United States Census Bureau, the town has a total area of 1.2 square miles (3.1 km2), all of it land.
History
The area around Dulce has been inhabited by Native Americans for centuries. The Jicarilla Apache Nation has lived in the area since the late 1700s. The town of Dulce was established in the early 1900s as a trading post for the Jicarilla Apache Nation. The town was named after the Spanish word for “sweet”, due to the abundance of wild honey in the area.
Economy
The economy of Dulce is largely based on tourism and the Jicarilla Apache Nation. The Jicarilla Apache Nation operates a casino, a hotel, and a number of other businesses in the town. The tribe also operates a number of cultural and educational programs, including a museum and a language program. The town also has a number of small businesses, including restaurants, shops, and services.
Demographics
As of the census of 2000, there were 1,631 people, 545 households, and 431 families residing in the town. The population density was 1,346.2 people per square mile (519.3/km2). There were 602 housing units at an average density of 498.2 per square mile (192.2/km2). The racial makeup of the town was 62.45% Native American, 0.37% White, 0.12% African American, 0.37% Asian, 0.06% Pacific Islander, 33.45% from other races, and 3.19% from two or more races. Hispanic or Latino of any race were 57.45% of the population.
There were 545 households, out of which 43.3% had children under the age of 18 living with them, 48.3% were married couples living together, 20.2% had a female householder with no husband present, and 24.7% were non-families. 21.3% of all households were made up of individuals, and 8.2% had someone living alone who was 65 years of age or older. The average household size was 2.98 and the average family size was 3.45.
In the town, the population was spread out, with 33.7% under the age of 18, 9.2% from 18 to 24, 27.2% from 25 to 44, 20.2% from 45 to 64, and 9.7% who were 65 years of age or older. The median age was 31 years. For every 100 females, there were 97.2 males. For every 100 females age 18 and over, there were 94.2 males.
The median income for a household in the town was $20,938, and the median income for a family was $22,917. Males had a median income of $25,000 versus $17,500 for females. The per capita income for the town was $9,845. About 28.2% of families and 33.2% of the population were below the poverty line, including 41.2% of those under age 18 and 28.3% of those age 65 or over.
Common Questions
What is Per Capita Income in Dulce?
Per Capita income in Dulce is $22,772.
What is the Median Family Income in Dulce?
Median Family Income in Dulce is $59,063.
What is the Median Household income in Dulce?
Median Household Income in Dulce is $41,250.
What is Income or Wage Gap in Dulce?
Income or Wage Gap in Dulce is 22.9%.
Women in Dulce earn 77.1 cents for every dollar earned by a man.
What is Inequality or Gini Index in Dulce?
Inequality or Gini Index in Dulce is 0.40.
What is the Total Population of Dulce?
Total Population of Dulce is 2,261.
What is the Total Male Population of Dulce?
Total Male Population of Dulce is 1,081.
What is the Total Female Population of Dulce?
Total Female Population of Dulce is 1,180.
What is the Ratio of Males per 100 Females in Dulce?
There are 91.61 Males per 100 Females in Dulce.
What is the Ratio of Females per 100 Males in Dulce?
There are 109.16 Females per 100 Males in Dulce.
What is the Median Population Age in Dulce?
Median Population Age in Dulce is 40.6 Years.
What is the Average Family Size in Dulce
Average Family Size in Dulce is 3.9 People.
What is the Average Household Size in Dulce
Average Household Size in Dulce is 2.9 People.
How Large is the Labor Force in Dulce?
There are 1,076 People in the Labor Forcein in Dulce.
What is the Percentage of People in the Labor Force in Dulce?
60.0% of People are in the Labor Force in Dulce.
What is the Unemployment Rate in Dulce?
Unemployment Rate in Dulce is 19.1%.