San Pedro, NM Map & Demographics
San Pedro Map
San Pedro Overview
$26,825
PER CAPITA INCOME
$68,409
AVG FAMILY INCOME
0.23
INEQUALITY / GINI INDEX
232
TOTAL POPULATION
110
MALE POPULATION
122
FEMALE POPULATION
90.16
MALES / 100 FEMALES
110.91
FEMALES / 100 MALES
35.4
MEDIAN AGE
5.5
AVG FAMILY SIZE
3.5
AVG HOUSEHOLD SIZE
63
LABOR FORCE [ PEOPLE ]
44.4%
PERCENT IN LABOR FORCE
Income in San Pedro
Income Overview in San Pedro
| Characteristic | Number | Measure |
| Per Capita Income | 232 | $26,825 |
| Median Family Income | 30 | $68,409 |
| Mean Family Income | 30 | $70,593 |
| Median Household Income | 65 | $0 |
| Mean Household Income | 65 | $91,798 |
| Income Deficit | 30 | $0 |
| Wage / Income Gap (%) | 232 | 0.00% |
| Wage / Income Gap ($) | 232 | 100.00¢ per $1 |
| Gini / Inequality Index | 232 | 0.23 |
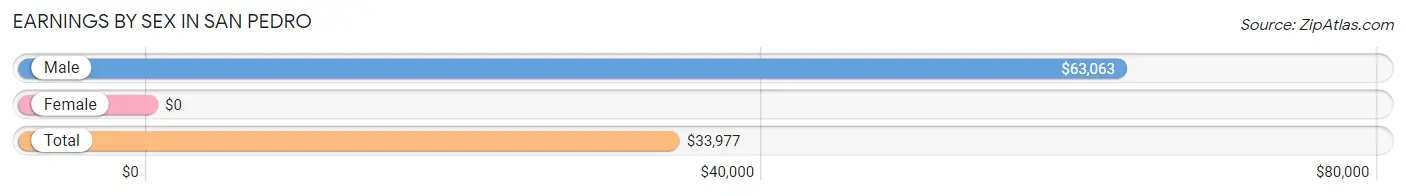
Earnings by Sex in San Pedro
| Sex | Number | Average Earnings |
| Male | 31 (42.5%) | $63,063 |
| Female | 42 (57.5%) | $0 |
| Total | 73 (100.0%) | $33,977 |
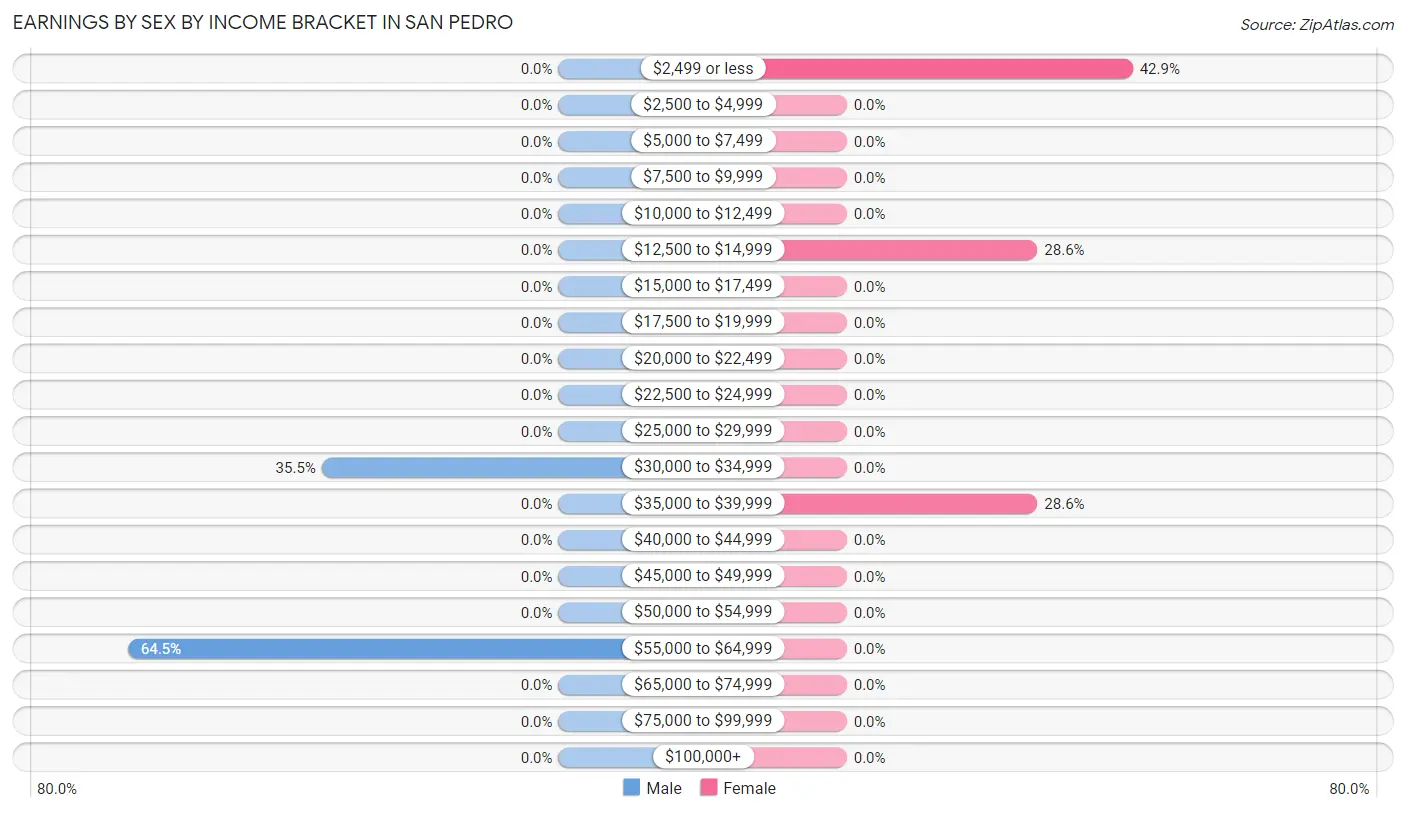
Earnings by Sex by Income Bracket in San Pedro
The most common earnings brackets in San Pedro are $55,000 to $64,999 for men (20 | 64.5%) and $2,499 or less for women (18 | 42.9%).
| Income | Male | Female |
| $2,499 or less | 0 (0.0%) | 18 (42.9%) |
| $2,500 to $4,999 | 0 (0.0%) | 0 (0.0%) |
| $5,000 to $7,499 | 0 (0.0%) | 0 (0.0%) |
| $7,500 to $9,999 | 0 (0.0%) | 0 (0.0%) |
| $10,000 to $12,499 | 0 (0.0%) | 0 (0.0%) |
| $12,500 to $14,999 | 0 (0.0%) | 12 (28.6%) |
| $15,000 to $17,499 | 0 (0.0%) | 0 (0.0%) |
| $17,500 to $19,999 | 0 (0.0%) | 0 (0.0%) |
| $20,000 to $22,499 | 0 (0.0%) | 0 (0.0%) |
| $22,500 to $24,999 | 0 (0.0%) | 0 (0.0%) |
| $25,000 to $29,999 | 0 (0.0%) | 0 (0.0%) |
| $30,000 to $34,999 | 11 (35.5%) | 0 (0.0%) |
| $35,000 to $39,999 | 0 (0.0%) | 12 (28.6%) |
| $40,000 to $44,999 | 0 (0.0%) | 0 (0.0%) |
| $45,000 to $49,999 | 0 (0.0%) | 0 (0.0%) |
| $50,000 to $54,999 | 0 (0.0%) | 0 (0.0%) |
| $55,000 to $64,999 | 20 (64.5%) | 0 (0.0%) |
| $65,000 to $74,999 | 0 (0.0%) | 0 (0.0%) |
| $75,000 to $99,999 | 0 (0.0%) | 0 (0.0%) |
| $100,000+ | 0 (0.0%) | 0 (0.0%) |
| Total | 31 (100.0%) | 42 (100.0%) |
Earnings by Sex by Educational Attainment in San Pedro
| Educational Attainment | Male Income | Female Income |
| Less than High School | - | - |
| High School Diploma | - | - |
| College or Associate's Degree | - | - |
| Bachelor's Degree | - | - |
| Graduate Degree | - | - |
| Total | $63,063 | $0 |
Family Income in San Pedro
Family Income Brackets in San Pedro
According to the San Pedro family income data, there are 22 families falling into the $50,000 to $74,999 income range, which is the most common income bracket and makes up 73.3% of all families.
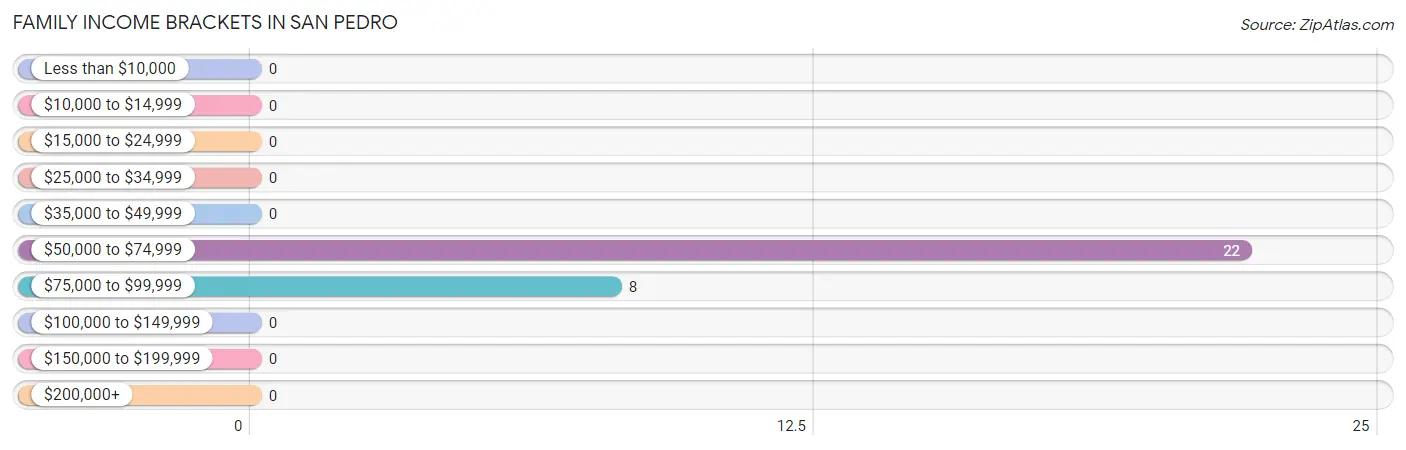
| Income Bracket | # Families | % Families |
| Less than $10,000 | 0 | 0.0% |
| $10,000 to $14,999 | 0 | 0.0% |
| $15,000 to $24,999 | 0 | 0.0% |
| $25,000 to $34,999 | 0 | 0.0% |
| $35,000 to $49,999 | 0 | 0.0% |
| $50,000 to $74,999 | 22 | 73.3% |
| $75,000 to $99,999 | 8 | 26.7% |
| $100,000 to $149,999 | 0 | 0.0% |
| $150,000 to $199,999 | 0 | 0.0% |
| $200,000+ | 0 | 0.0% |
Family Income by Famaliy Size in San Pedro
| Income Bracket | # Families | Median Income |
| 2-Person Families | 0 (0.0%) | $0 |
| 3-Person Families | 8 (26.7%) | $0 |
| 4-Person Families | 0 (0.0%) | $0 |
| 5-Person Families | 11 (36.7%) | $0 |
| 6-Person Families | 0 (0.0%) | $0 |
| 7+ Person Families | 11 (36.7%) | $0 |
| Total | 30 (100.0%) | $68,409 |
Family Income by Number of Earners in San Pedro
| Number of Earners | # Families | Median Income |
| No Earners | 0 (0.0%) | $0 |
| 1 Earner | 19 (63.3%) | $0 |
| 2 Earners | 11 (36.7%) | $0 |
| 3+ Earners | 0 (0.0%) | $0 |
| Total | 30 (100.0%) | $68,409 |
Household Income in San Pedro
Household Income Brackets in San Pedro
With 32 households falling in the category, the $50,000 to $74,999 income range is the most frequent in San Pedro, accounting for 49.2% of all households.
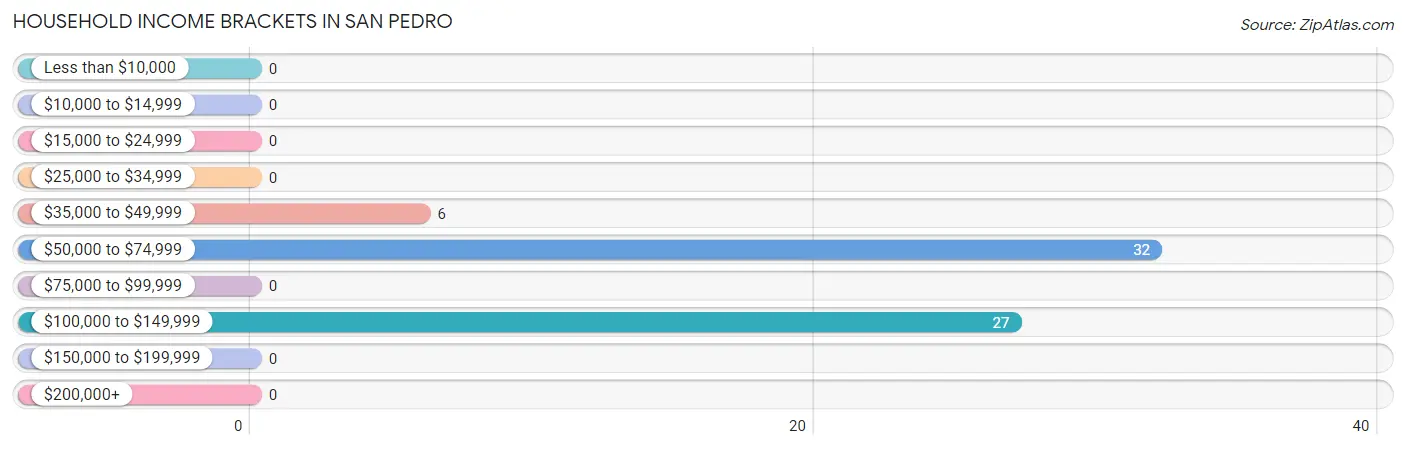
| Income Bracket | # Households | % Households |
| Less than $10,000 | 0 | 0.0% |
| $10,000 to $14,999 | 0 | 0.0% |
| $15,000 to $24,999 | 0 | 0.0% |
| $25,000 to $34,999 | 0 | 0.0% |
| $35,000 to $49,999 | 6 | 9.2% |
| $50,000 to $74,999 | 32 | 49.2% |
| $75,000 to $99,999 | 0 | 0.0% |
| $100,000 to $149,999 | 27 | 41.5% |
| $150,000 to $199,999 | 0 | 0.0% |
| $200,000+ | 0 | 0.0% |
Household Income by Householder Age in San Pedro
| Income Bracket | # Households | Median Income |
| 15 to 24 Years | 0 (0.0%) | $0 |
| 25 to 44 Years | 22 (33.9%) | $0 |
| 45 to 64 Years | 8 (12.3%) | $0 |
| 65+ Years | 35 (53.8%) | $0 |
| Total | 65 (100.0%) | $0 |
Poverty in San Pedro
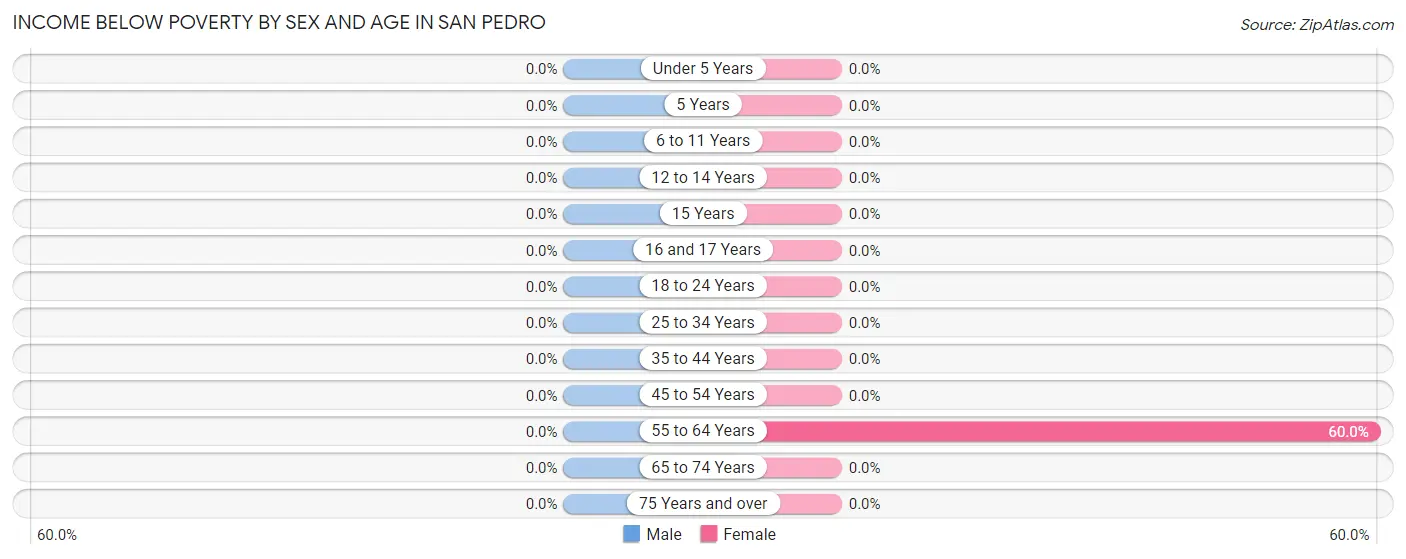
Income Below Poverty by Sex and Age in San Pedro
| Age Bracket | Male | Female |
| Under 5 Years | 0 (0.0%) | 0 (0.0%) |
| 5 Years | 0 (0.0%) | 0 (0.0%) |
| 6 to 11 Years | 0 (0.0%) | 0 (0.0%) |
| 12 to 14 Years | 0 (0.0%) | 0 (0.0%) |
| 15 Years | 0 (0.0%) | 0 (0.0%) |
| 16 and 17 Years | 0 (0.0%) | 0 (0.0%) |
| 18 to 24 Years | 0 (0.0%) | 0 (0.0%) |
| 25 to 34 Years | 0 (0.0%) | 0 (0.0%) |
| 35 to 44 Years | 0 (0.0%) | 0 (0.0%) |
| 45 to 54 Years | 0 (0.0%) | 0 (0.0%) |
| 55 to 64 Years | 0 (0.0%) | 12 (60.0%) |
| 65 to 74 Years | 0 (0.0%) | 0 (0.0%) |
| 75 Years and over | 0 (0.0%) | 0 (0.0%) |
| Total | 0 (0.0%) | 12 (9.8%) |
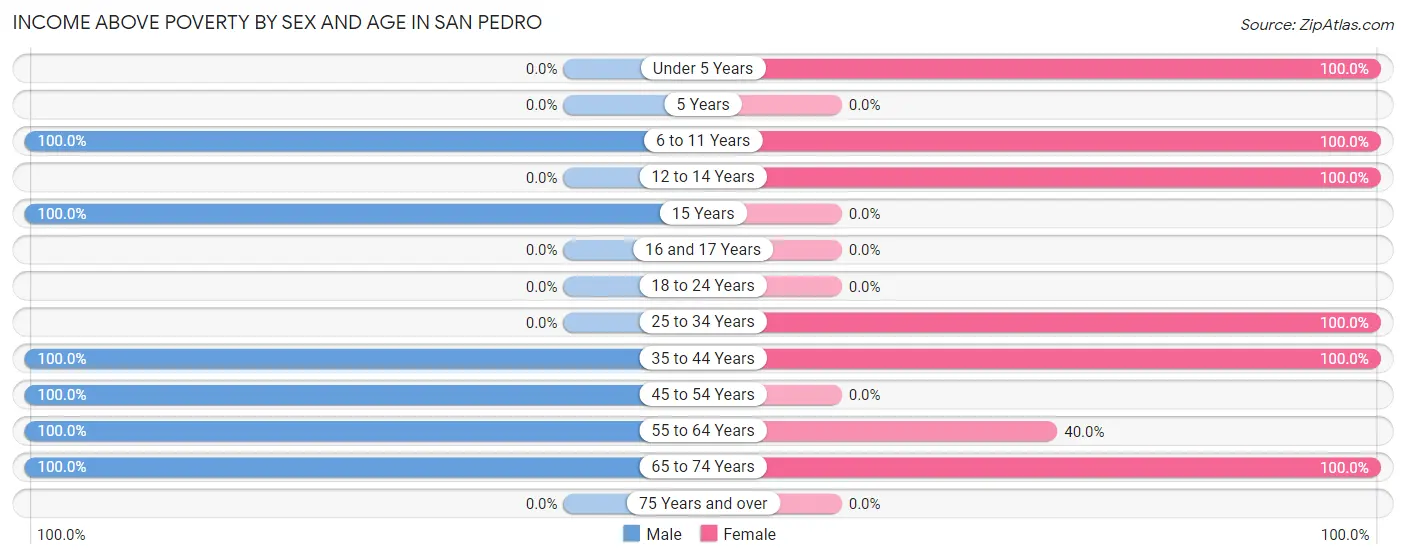
Income Above Poverty by Sex and Age in San Pedro
According to the poverty statistics in San Pedro, males aged 6 to 11 years and females aged under 5 years are the age groups that are most secure financially, with 100.0% of males and 100.0% of females in these age groups living above the poverty line.
| Age Bracket | Male | Female |
| Under 5 Years | 0 (0.0%) | 23 (100.0%) |
| 5 Years | 0 (0.0%) | 0 (0.0%) |
| 6 to 11 Years | 36 (100.0%) | 10 (100.0%) |
| 12 to 14 Years | 0 (0.0%) | 10 (100.0%) |
| 15 Years | 10 (100.0%) | 0 (0.0%) |
| 16 and 17 Years | 0 (0.0%) | 0 (0.0%) |
| 18 to 24 Years | 0 (0.0%) | 0 (0.0%) |
| 25 to 34 Years | 0 (0.0%) | 22 (100.0%) |
| 35 to 44 Years | 22 (100.0%) | 12 (100.0%) |
| 45 to 54 Years | 12 (100.0%) | 0 (0.0%) |
| 55 to 64 Years | 9 (100.0%) | 8 (40.0%) |
| 65 to 74 Years | 20 (100.0%) | 25 (100.0%) |
| 75 Years and over | 0 (0.0%) | 0 (0.0%) |
| Total | 109 (100.0%) | 110 (90.2%) |
Income Below Poverty Among Married-Couple Families in San Pedro
| Children | Above Poverty | Below Poverty |
| No Children | 0 (0.0%) | 0 (0.0%) |
| 1 or 2 Children | 0 (0.0%) | 0 (0.0%) |
| 3 or 4 Children | 11 (100.0%) | 0 (0.0%) |
| 5 or more Children | 11 (100.0%) | 0 (0.0%) |
| Total | 22 (100.0%) | 0 (0.0%) |
Income Below Poverty Among Single-Parent Households in San Pedro
| Children | Single Father | Single Mother |
| No Children | 0 (0.0%) | 0 (0.0%) |
| 1 or 2 Children | 0 (0.0%) | 0 (0.0%) |
| 3 or 4 Children | 0 (0.0%) | 0 (0.0%) |
| 5 or more Children | 0 (0.0%) | 0 (0.0%) |
| Total | 0 (0.0%) | 0 (0.0%) |
Income Below Poverty Among Married-Couple vs Single-Parent Households in San Pedro
| Children | Married-Couple Families | Single-Parent Households |
| No Children | 0 (0.0%) | 0 (0.0%) |
| 1 or 2 Children | 0 (0.0%) | 0 (0.0%) |
| 3 or 4 Children | 0 (0.0%) | 0 (0.0%) |
| 5 or more Children | 0 (0.0%) | 0 (0.0%) |
| Total | 0 (0.0%) | 0 (0.0%) |
Race in San Pedro
The most populous races in San Pedro are , and White / Caucasian (232 | 100.0%).
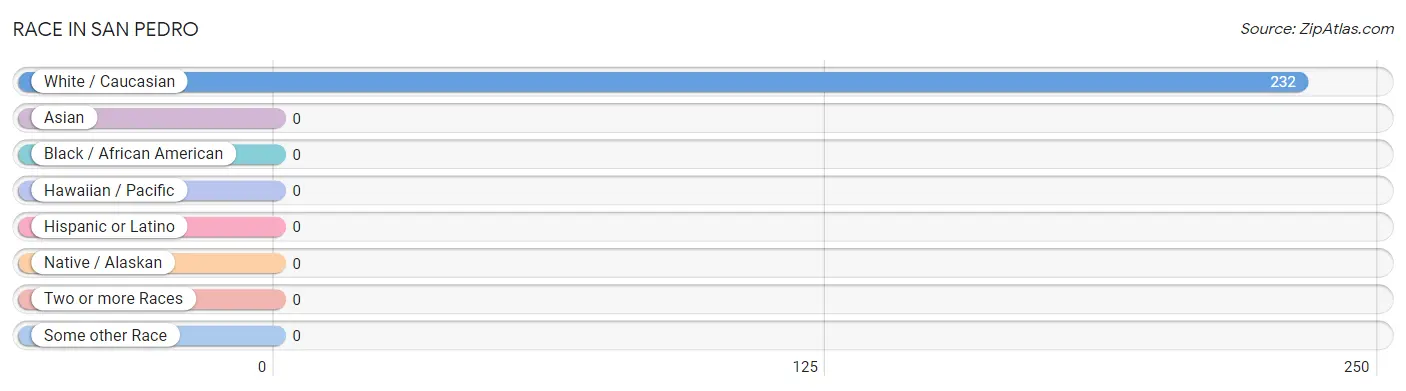
| Race | # Population | % Population |
| Asian | 0 | 0.0% |
| Black / African American | 0 | 0.0% |
| Hawaiian / Pacific | 0 | 0.0% |
| Hispanic or Latino | 0 | 0.0% |
| Native / Alaskan | 0 | 0.0% |
| White / Caucasian | 232 | 100.0% |
| Two or more Races | 0 | 0.0% |
| Some other Race | 0 | 0.0% |
| Total | 232 | 100.0% |
Ancestry in San Pedro
The most populous ancestries reported in San Pedro are English (67 | 28.9%), German (30 | 12.9%), Czech (10 | 4.3%), Norwegian (10 | 4.3%), and Scottish (10 | 4.3%), together accounting for 54.7% of all San Pedro residents.
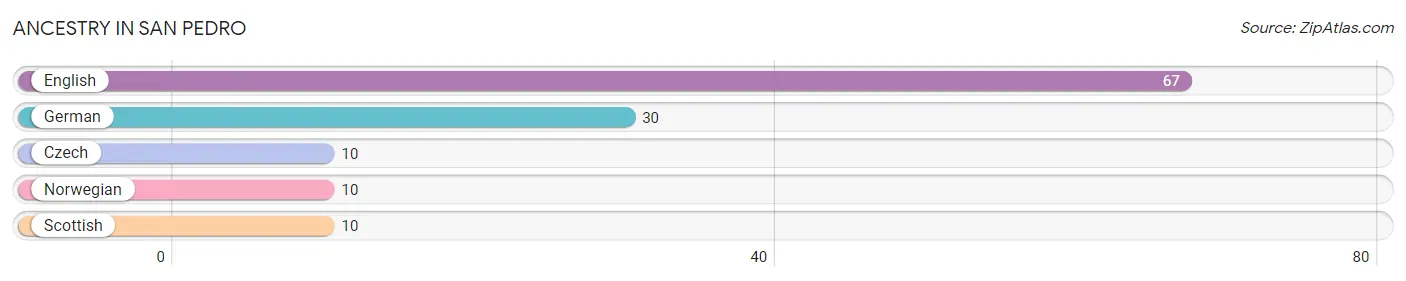
| Ancestry | # Population | % Population |
| Czech | 10 | 4.3% |
| English | 67 | 28.9% |
| German | 30 | 12.9% |
| Norwegian | 10 | 4.3% |
| Scottish | 10 | 4.3% | View All 5 Rows |
Immigrants in San Pedro

| Immigration Origin | # Population | % Population | View All 0 Rows |
Sex and Age in San Pedro
Sex and Age in San Pedro
The most populous age groups in San Pedro are 35 to 39 Years (22 | 20.0%) for men and Under 5 Years (23 | 18.9%) for women.
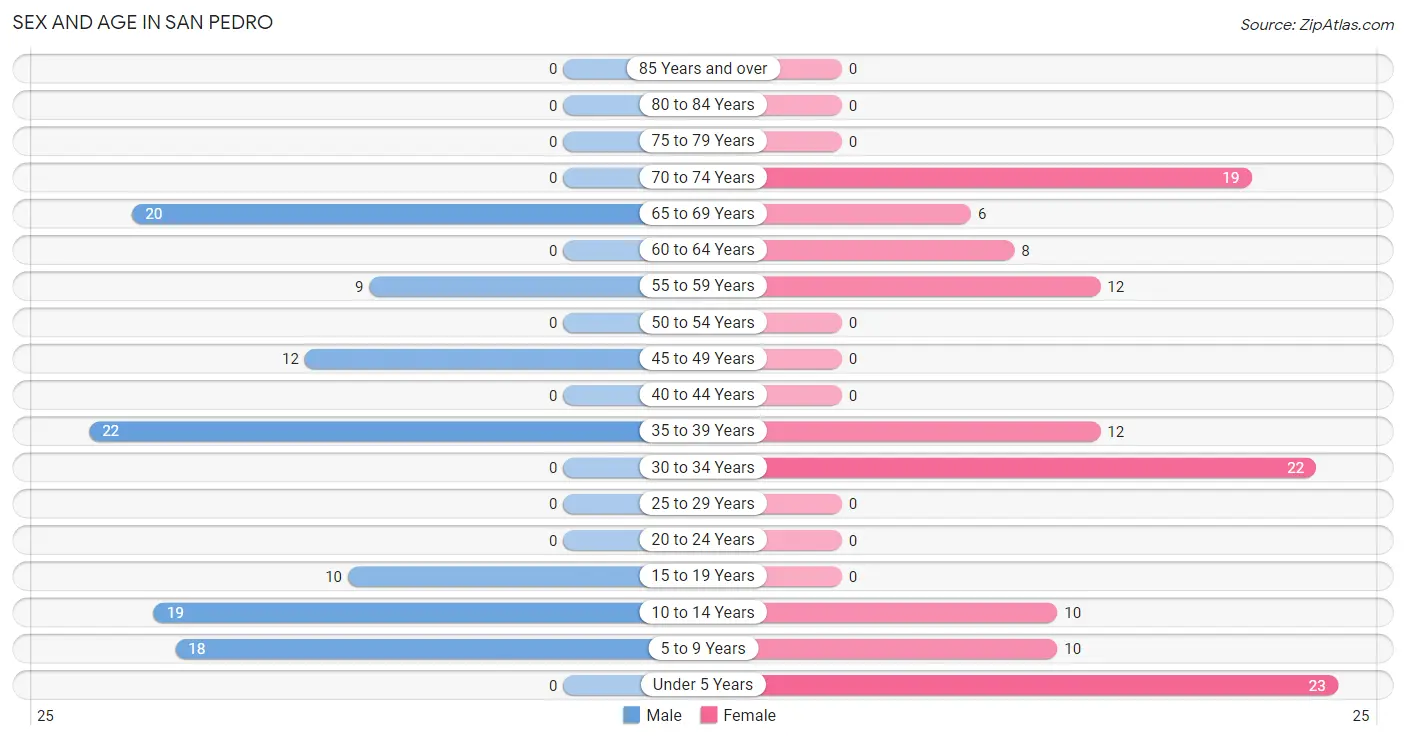
| Age Bracket | Male | Female |
| Under 5 Years | 0 (0.0%) | 23 (18.9%) |
| 5 to 9 Years | 18 (16.4%) | 10 (8.2%) |
| 10 to 14 Years | 19 (17.3%) | 10 (8.2%) |
| 15 to 19 Years | 10 (9.1%) | 0 (0.0%) |
| 20 to 24 Years | 0 (0.0%) | 0 (0.0%) |
| 25 to 29 Years | 0 (0.0%) | 0 (0.0%) |
| 30 to 34 Years | 0 (0.0%) | 22 (18.0%) |
| 35 to 39 Years | 22 (20.0%) | 12 (9.8%) |
| 40 to 44 Years | 0 (0.0%) | 0 (0.0%) |
| 45 to 49 Years | 12 (10.9%) | 0 (0.0%) |
| 50 to 54 Years | 0 (0.0%) | 0 (0.0%) |
| 55 to 59 Years | 9 (8.2%) | 12 (9.8%) |
| 60 to 64 Years | 0 (0.0%) | 8 (6.6%) |
| 65 to 69 Years | 20 (18.2%) | 6 (4.9%) |
| 70 to 74 Years | 0 (0.0%) | 19 (15.6%) |
| 75 to 79 Years | 0 (0.0%) | 0 (0.0%) |
| 80 to 84 Years | 0 (0.0%) | 0 (0.0%) |
| 85 Years and over | 0 (0.0%) | 0 (0.0%) |
| Total | 110 (100.0%) | 122 (100.0%) |
Families and Households in San Pedro
Median Family Size in San Pedro
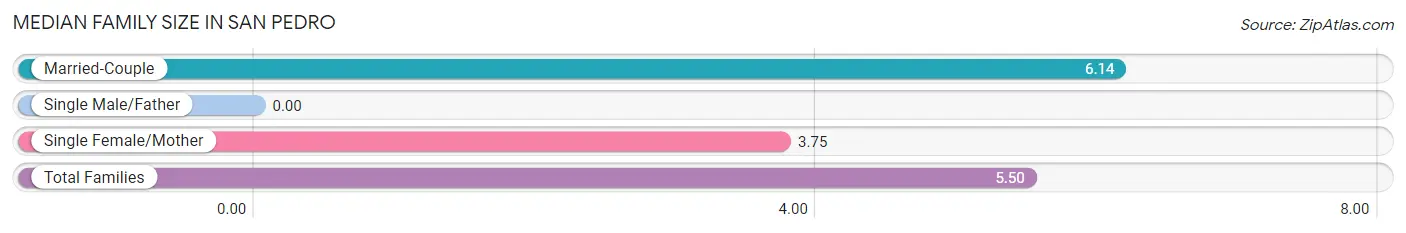
| Family Type | # Families | Family Size |
| Married-Couple | 22 (73.3%) | 6.14 |
| Single Male/Father | 0 (0.0%) | - |
| Single Female/Mother | 8 (26.7%) | 3.75 |
| Total Families | 30 (100.0%) | 5.50 |
Median Household Size in San Pedro
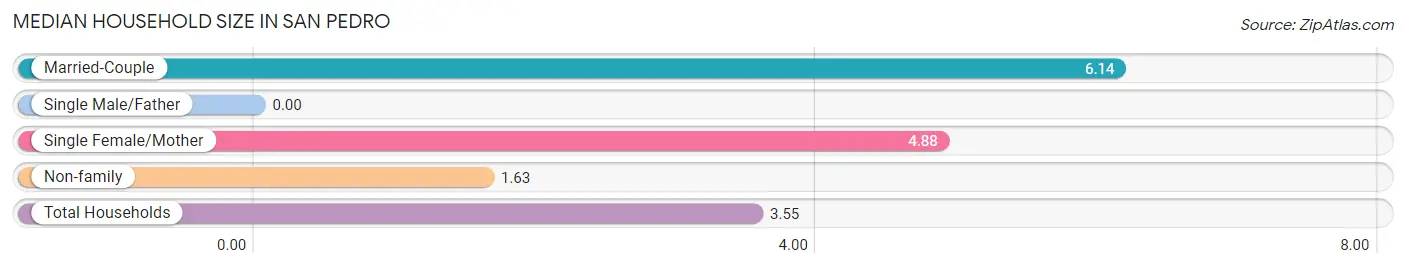
| Household Type | # Households | Household Size |
| Married-Couple | 22 (33.9%) | 6.14 |
| Single Male/Father | 0 (0.0%) | - |
| Single Female/Mother | 8 (12.3%) | 4.88 |
| Non-family | 35 (53.8%) | 1.63 |
| Total Households | 65 (100.0%) | 3.55 |
Household Size by Marriage Status in San Pedro
Out of a total of 65 households in San Pedro, 30 (46.2%) are family households, while 35 (53.8%) are nonfamily households. The most numerous type of family households are 5-person households, comprising 11, and the most common type of nonfamily households are 2-person households, comprising 20.
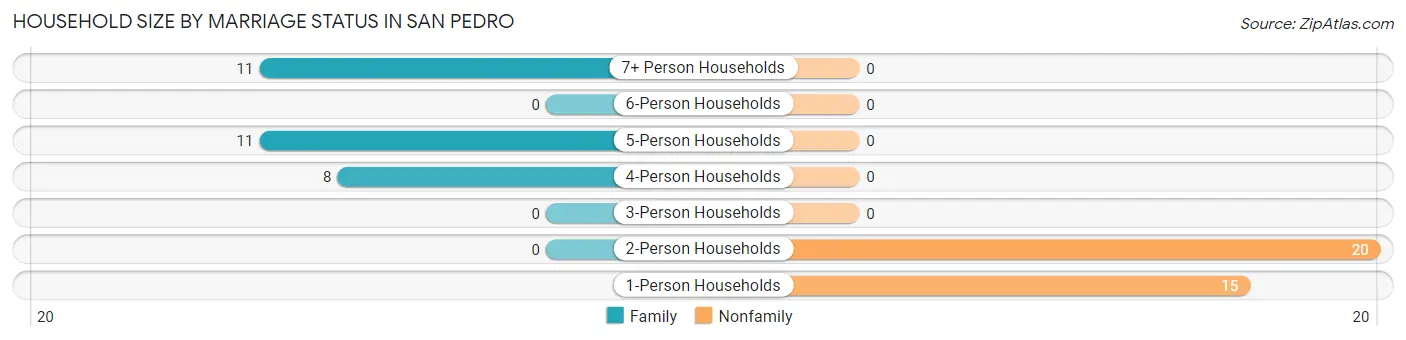
| Household Size | Family Households | Nonfamily Households |
| 1-Person Households | - | 15 (23.1%) |
| 2-Person Households | 0 (0.0%) | 20 (30.8%) |
| 3-Person Households | 0 (0.0%) | 0 (0.0%) |
| 4-Person Households | 8 (12.3%) | 0 (0.0%) |
| 5-Person Households | 11 (16.9%) | 0 (0.0%) |
| 6-Person Households | 0 (0.0%) | 0 (0.0%) |
| 7+ Person Households | 11 (16.9%) | 0 (0.0%) |
| Total | 30 (46.2%) | 35 (53.8%) |
Female Fertility in San Pedro
Fertility by Age in San Pedro
Average fertility rate in San Pedro is 353.0 births per 1,000 women. Women in the age bracket of 35 to 50 years have the highest fertility rate with 1,000.0 births per 1,000 women. Women in the age bracket of 35 to 50 years acount for 100.0% of all women with births.

| Age Bracket | Women with Births | Births / 1,000 Women |
| 15 to 19 years | 0 (0.0%) | 0.0 |
| 20 to 34 years | 0 (0.0%) | 0.0 |
| 35 to 50 years | 12 (100.0%) | 1,000.0 |
| Total | 12 (100.0%) | 353.0 |
Fertility by Age by Marriage Status in San Pedro
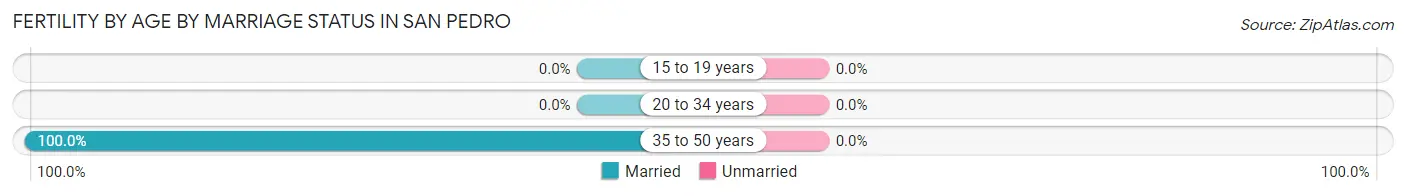
| Age Bracket | Married | Unmarried |
| 15 to 19 years | 0 (0.0%) | 0 (0.0%) |
| 20 to 34 years | 0 (0.0%) | 0 (0.0%) |
| 35 to 50 years | 12 (100.0%) | 0 (0.0%) |
| Total | 12 (100.0%) | 0 (0.0%) |
Fertility by Education in San Pedro
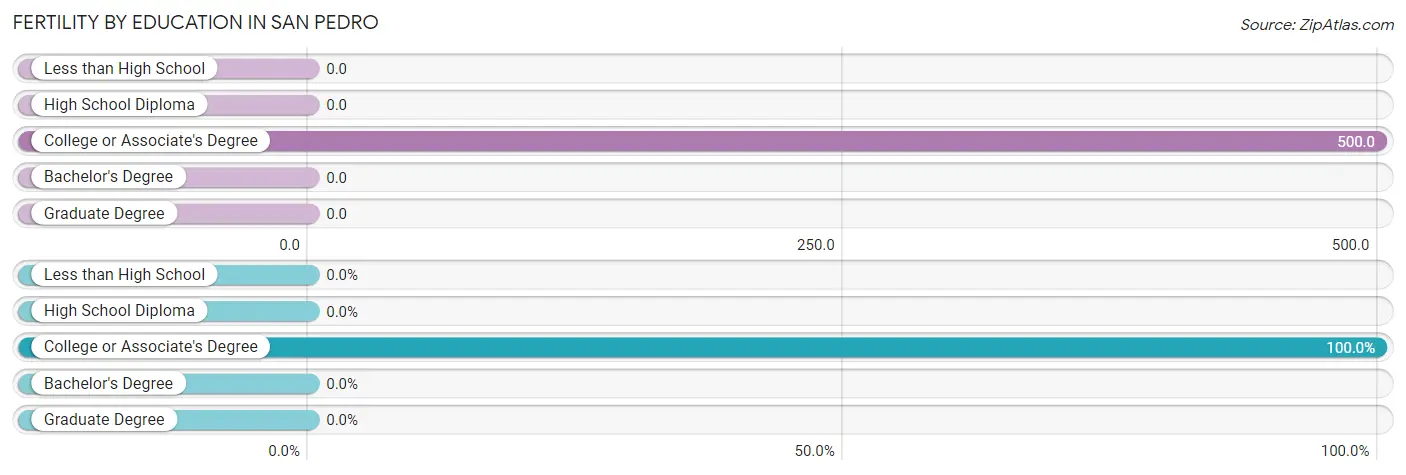
| Educational Attainment | Women with Births | Births / 1,000 Women |
| Less than High School | 0 (0.0%) | 0.0 |
| High School Diploma | 0 (0.0%) | 0.0 |
| College or Associate's Degree | 12 (100.0%) | 500.0 |
| Bachelor's Degree | 0 (0.0%) | 0.0 |
| Graduate Degree | 0 (0.0%) | 0.0 |
| Total | 12 (100.0%) | 353.0 |
Fertility by Education by Marriage Status in San Pedro
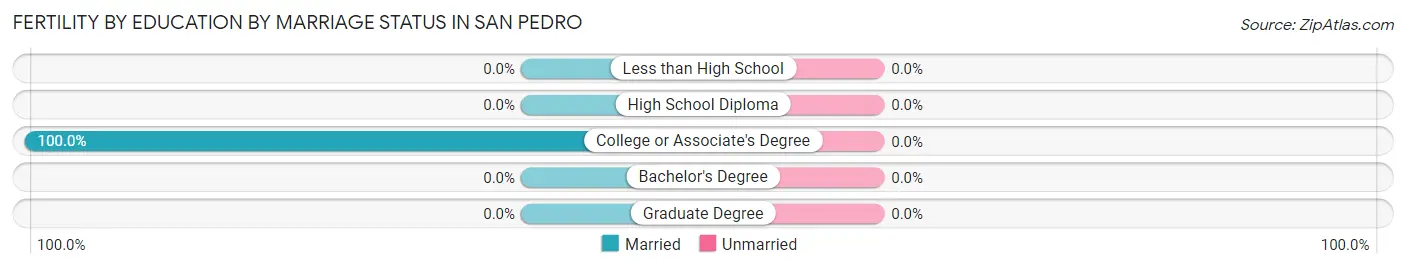
| Educational Attainment | Married | Unmarried |
| Less than High School | 0 (0.0%) | 0 (0.0%) |
| High School Diploma | 0 (0.0%) | 0 (0.0%) |
| College or Associate's Degree | 12 (100.0%) | 0 (0.0%) |
| Bachelor's Degree | 0 (0.0%) | 0 (0.0%) |
| Graduate Degree | 0 (0.0%) | 0 (0.0%) |
| Total | 12 (100.0%) | 0 (0.0%) |
Employment Characteristics in San Pedro
Employment by Class of Employer in San Pedro
Among the 63 employed individuals in San Pedro, private company employees (32 | 50.8%), state government employees (12 | 19.1%), and federal government employees (11 | 17.5%) make up the most common classes of employment.
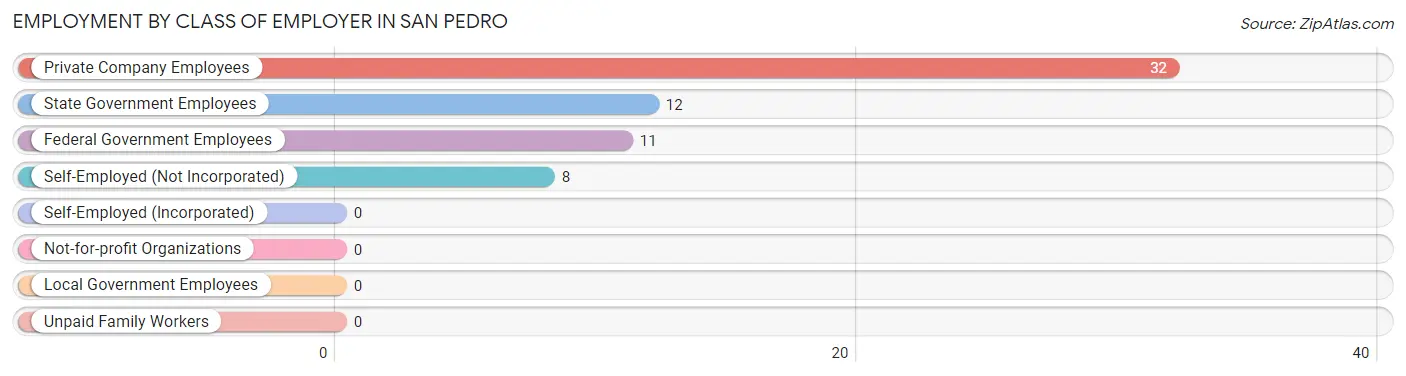
| Employer Class | # Employees | % Employees |
| Private Company Employees | 32 | 50.8% |
| Self-Employed (Incorporated) | 0 | 0.0% |
| Self-Employed (Not Incorporated) | 8 | 12.7% |
| Not-for-profit Organizations | 0 | 0.0% |
| Local Government Employees | 0 | 0.0% |
| State Government Employees | 12 | 19.1% |
| Federal Government Employees | 11 | 17.5% |
| Unpaid Family Workers | 0 | 0.0% |
| Total | 63 | 100.0% |
Employment Status by Age in San Pedro
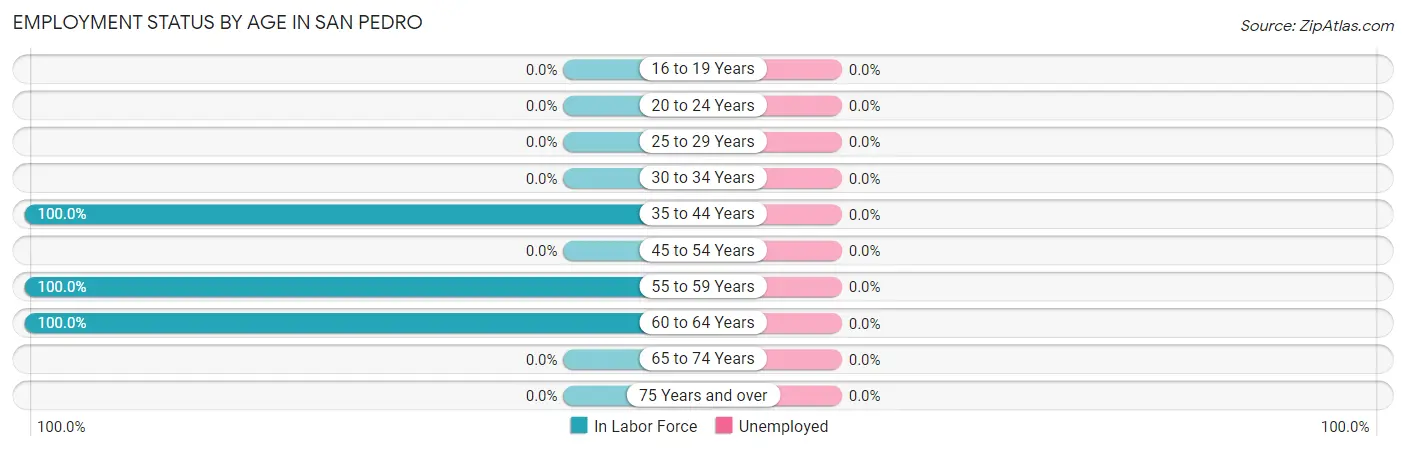
| Age Bracket | In Labor Force | Unemployed |
| 16 to 19 Years | 0 (0.0%) | 0 (0.0%) |
| 20 to 24 Years | 0 (0.0%) | 0 (0.0%) |
| 25 to 29 Years | 0 (0.0%) | 0 (0.0%) |
| 30 to 34 Years | 0 (0.0%) | 0 (0.0%) |
| 35 to 44 Years | 34 (100.0%) | 0 (0.0%) |
| 45 to 54 Years | 0 (0.0%) | 0 (0.0%) |
| 55 to 59 Years | 21 (100.0%) | 0 (0.0%) |
| 60 to 64 Years | 8 (100.0%) | 0 (0.0%) |
| 65 to 74 Years | 0 (0.0%) | 0 (0.0%) |
| 75 Years and over | 0 (0.0%) | 0 (0.0%) |
| Total | 63 (44.4%) | 0 (0.0%) |
Employment Status by Educational Attainment in San Pedro
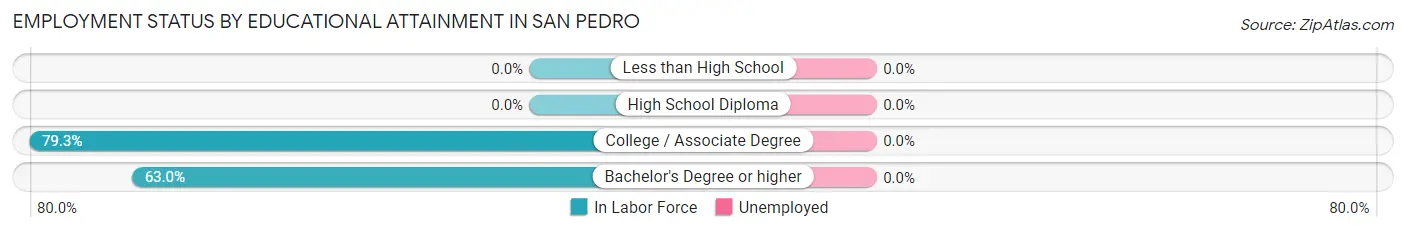
| Educational Attainment | In Labor Force | Unemployed |
| Less than High School | 0 (0.0%) | 0 (0.0%) |
| High School Diploma | 0 (0.0%) | 0 (0.0%) |
| College / Associate Degree | 46 (79.3%) | 0 (0.0%) |
| Bachelor's Degree or higher | 17 (63.0%) | 0 (0.0%) |
| Total | 63 (64.9%) | 0 (0.0%) |
Employment Occupations by Sex in San Pedro
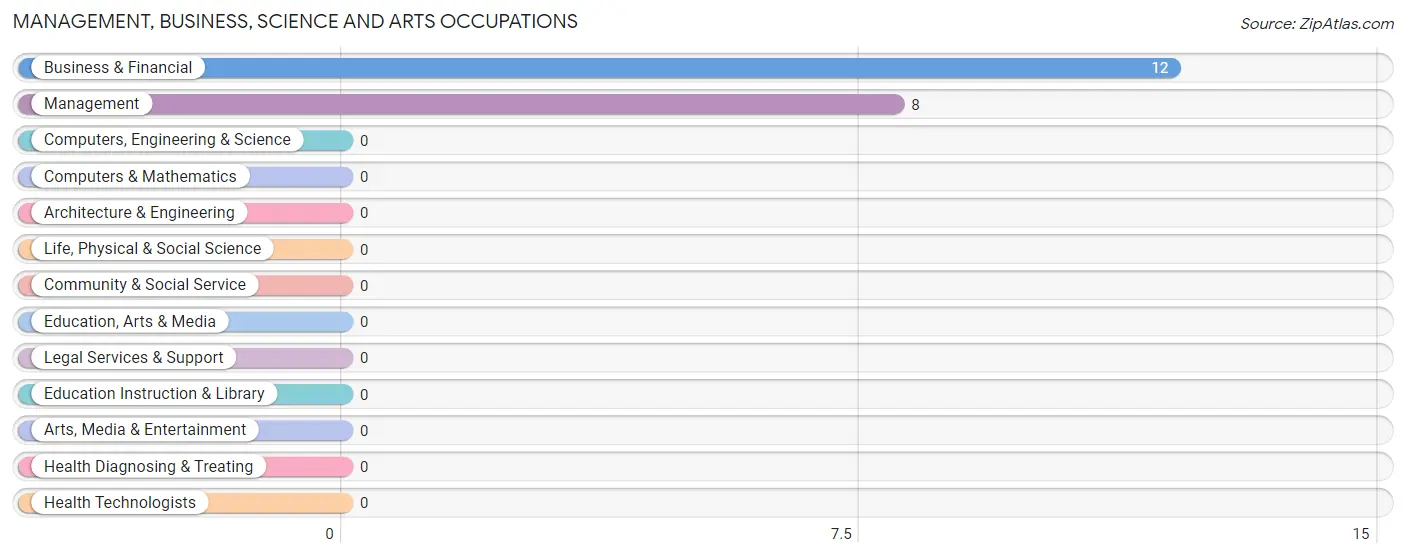
Management, Business, Science and Arts Occupations
The most common Management, Business, Science and Arts occupations in San Pedro are Business & Financial (12 | 23.1%), and Management (8 | 15.4%).
Management, Business, Science and Arts Occupations by Sex
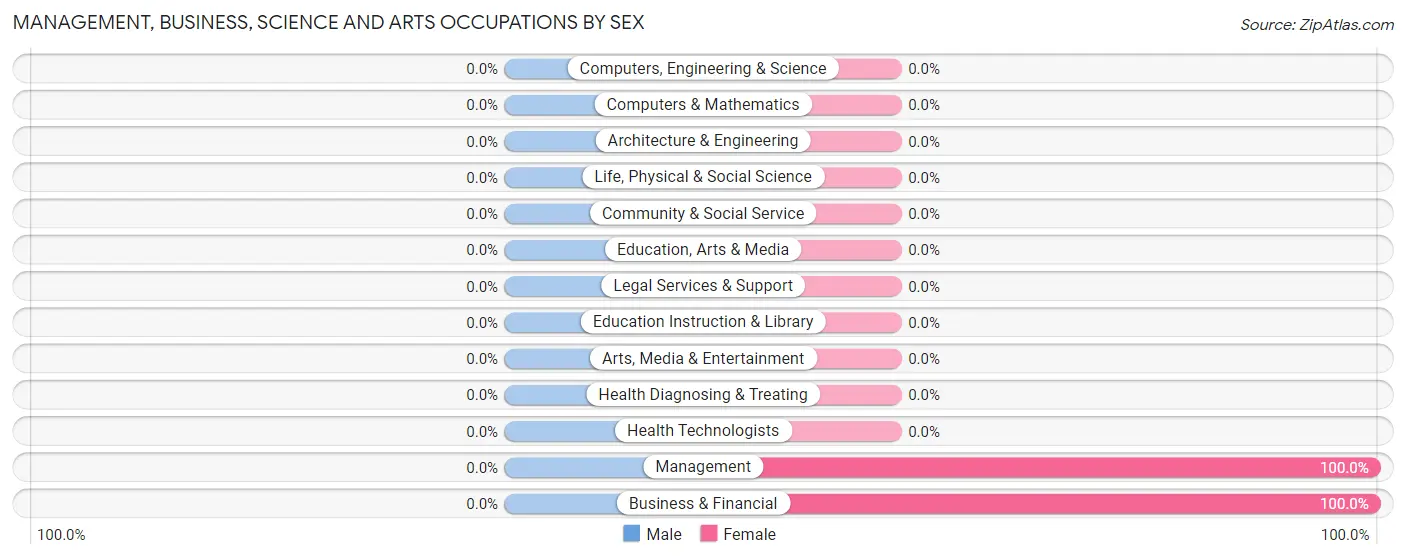
| Occupation | Male | Female |
| Management | 0 (0.0%) | 8 (100.0%) |
| Business & Financial | 0 (0.0%) | 12 (100.0%) |
| Computers, Engineering & Science | 0 (0.0%) | 0 (0.0%) |
| Computers & Mathematics | 0 (0.0%) | 0 (0.0%) |
| Architecture & Engineering | 0 (0.0%) | 0 (0.0%) |
| Life, Physical & Social Science | 0 (0.0%) | 0 (0.0%) |
| Community & Social Service | 0 (0.0%) | 0 (0.0%) |
| Education, Arts & Media | 0 (0.0%) | 0 (0.0%) |
| Legal Services & Support | 0 (0.0%) | 0 (0.0%) |
| Education Instruction & Library | 0 (0.0%) | 0 (0.0%) |
| Arts, Media & Entertainment | 0 (0.0%) | 0 (0.0%) |
| Health Diagnosing & Treating | 0 (0.0%) | 0 (0.0%) |
| Health Technologists | 0 (0.0%) | 0 (0.0%) |
| Total (Category) | 0 (0.0%) | 20 (100.0%) |
| Total (Overall) | 20 (38.5%) | 32 (61.5%) |
Services Occupations
The most common Services occupations in San Pedro are Security & Protection (9 | 17.3%), and Firefighting & Prevention (9 | 17.3%).
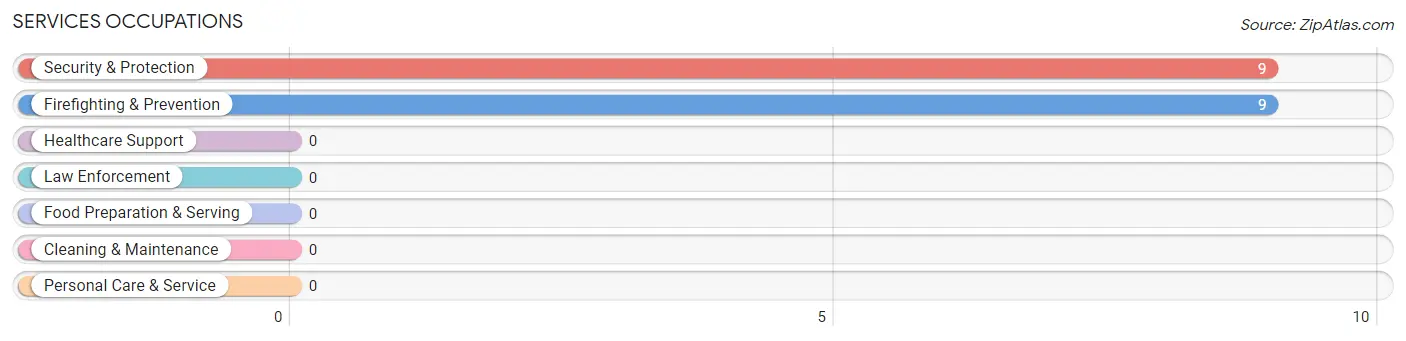
Services Occupations by Sex
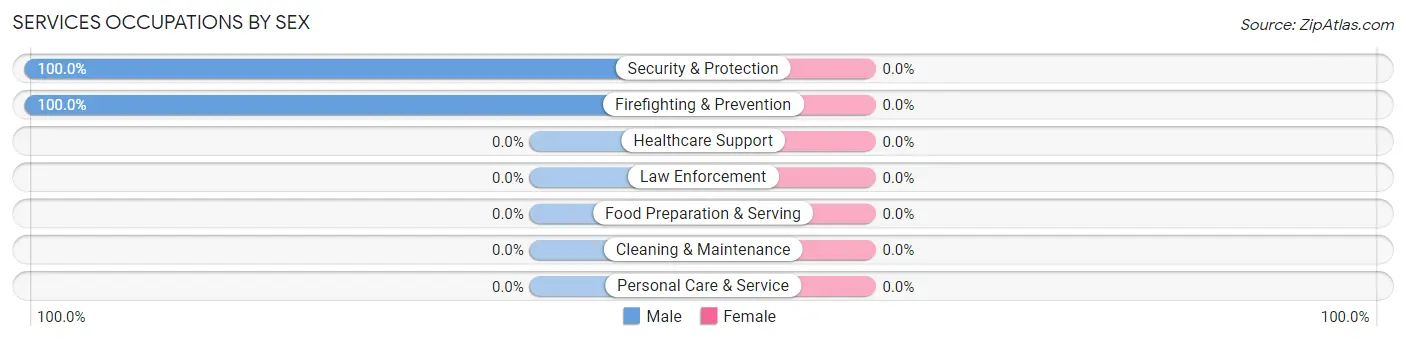
| Occupation | Male | Female |
| Healthcare Support | 0 (0.0%) | 0 (0.0%) |
| Security & Protection | 9 (100.0%) | 0 (0.0%) |
| Firefighting & Prevention | 9 (100.0%) | 0 (0.0%) |
| Law Enforcement | 0 (0.0%) | 0 (0.0%) |
| Food Preparation & Serving | 0 (0.0%) | 0 (0.0%) |
| Cleaning & Maintenance | 0 (0.0%) | 0 (0.0%) |
| Personal Care & Service | 0 (0.0%) | 0 (0.0%) |
| Total (Category) | 9 (100.0%) | 0 (0.0%) |
| Total (Overall) | 20 (38.5%) | 32 (61.5%) |
Sales and Office Occupations
The most common Sales and Office occupations in San Pedro are , and Sales & Related (12 | 23.1%).
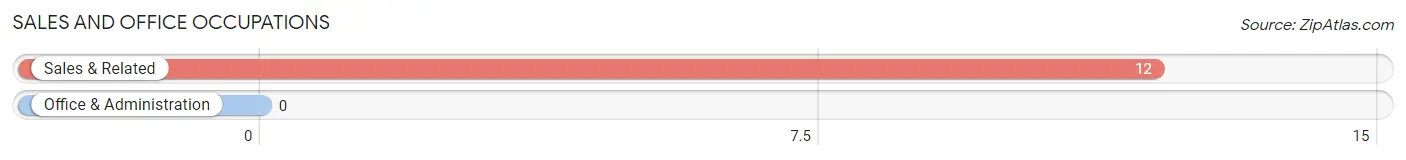
Sales and Office Occupations by Sex
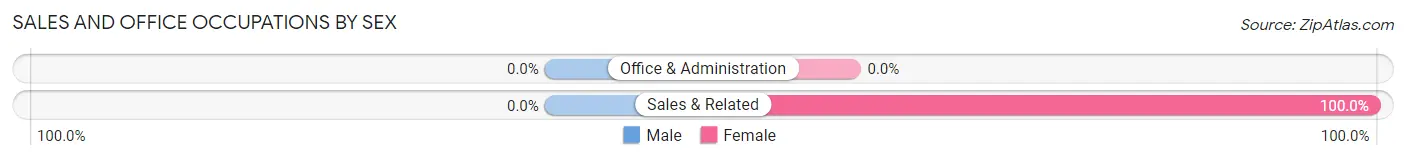
| Occupation | Male | Female |
| Sales & Related | 0 (0.0%) | 12 (100.0%) |
| Office & Administration | 0 (0.0%) | 0 (0.0%) |
| Total (Category) | 0 (0.0%) | 12 (100.0%) |
| Total (Overall) | 20 (38.5%) | 32 (61.5%) |
Natural Resources, Construction and Maintenance Occupations
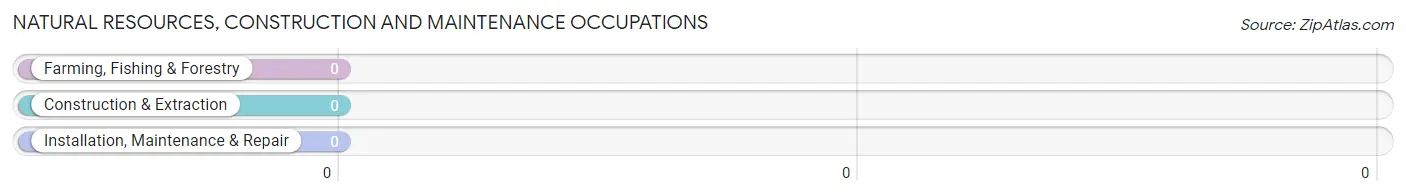
Natural Resources, Construction and Maintenance Occupations by Sex
| Occupation | Male | Female |
| Farming, Fishing & Forestry | 0 (0.0%) | 0 (0.0%) |
| Construction & Extraction | 0 (0.0%) | 0 (0.0%) |
| Installation, Maintenance & Repair | 0 (0.0%) | 0 (0.0%) |
| Total (Category) | 0 (0.0%) | 0 (0.0%) |
| Total (Overall) | 20 (38.5%) | 32 (61.5%) |
Production, Transportation and Moving Occupations
The most common Production, Transportation and Moving occupations in San Pedro are , and Material Moving (11 | 21.1%).
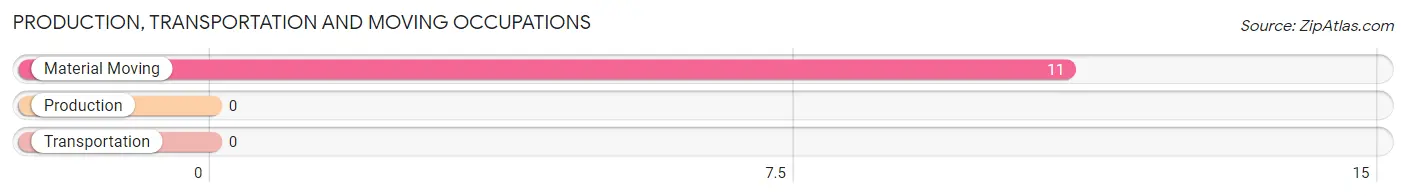
Production, Transportation and Moving Occupations by Sex
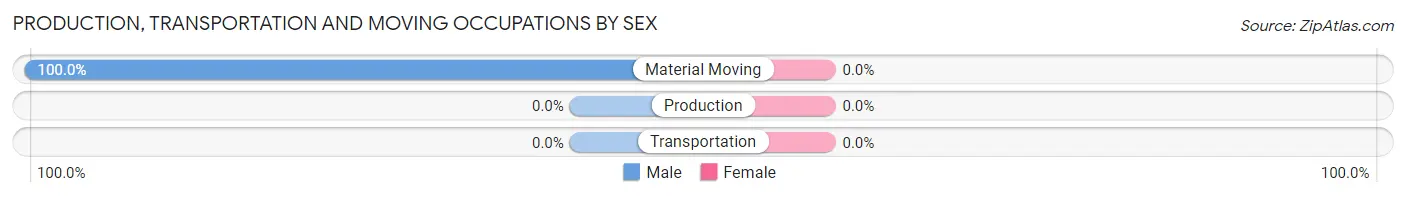
| Occupation | Male | Female |
| Production | 0 (0.0%) | 0 (0.0%) |
| Transportation | 0 (0.0%) | 0 (0.0%) |
| Material Moving | 11 (100.0%) | 0 (0.0%) |
| Total (Category) | 11 (100.0%) | 0 (0.0%) |
| Total (Overall) | 20 (38.5%) | 32 (61.5%) |
Employment Industries by Sex in San Pedro
Employment Industries in San Pedro
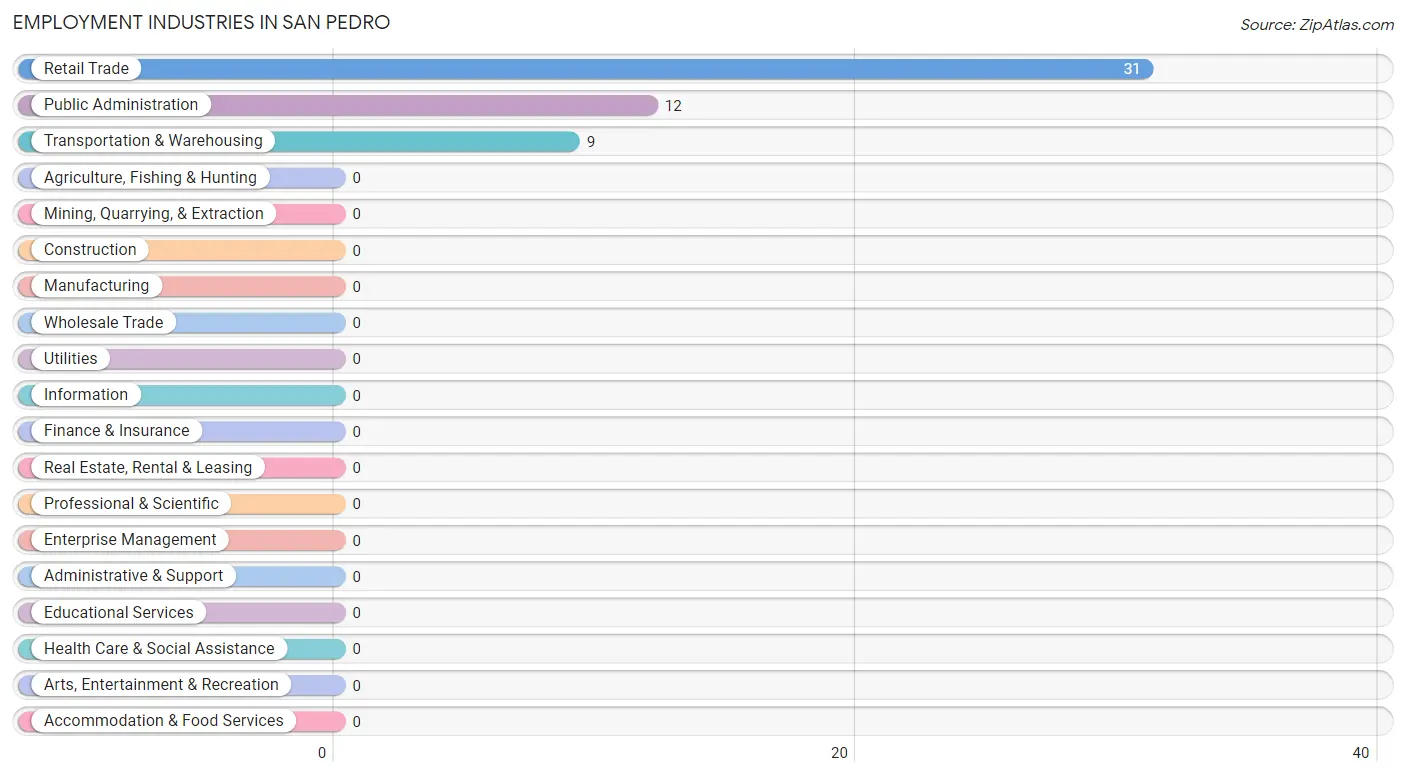
The major employment industries in San Pedro include Retail Trade (31 | 59.6%), Public Administration (12 | 23.1%), and Transportation & Warehousing (9 | 17.3%).
Employment Industries by Sex in San Pedro
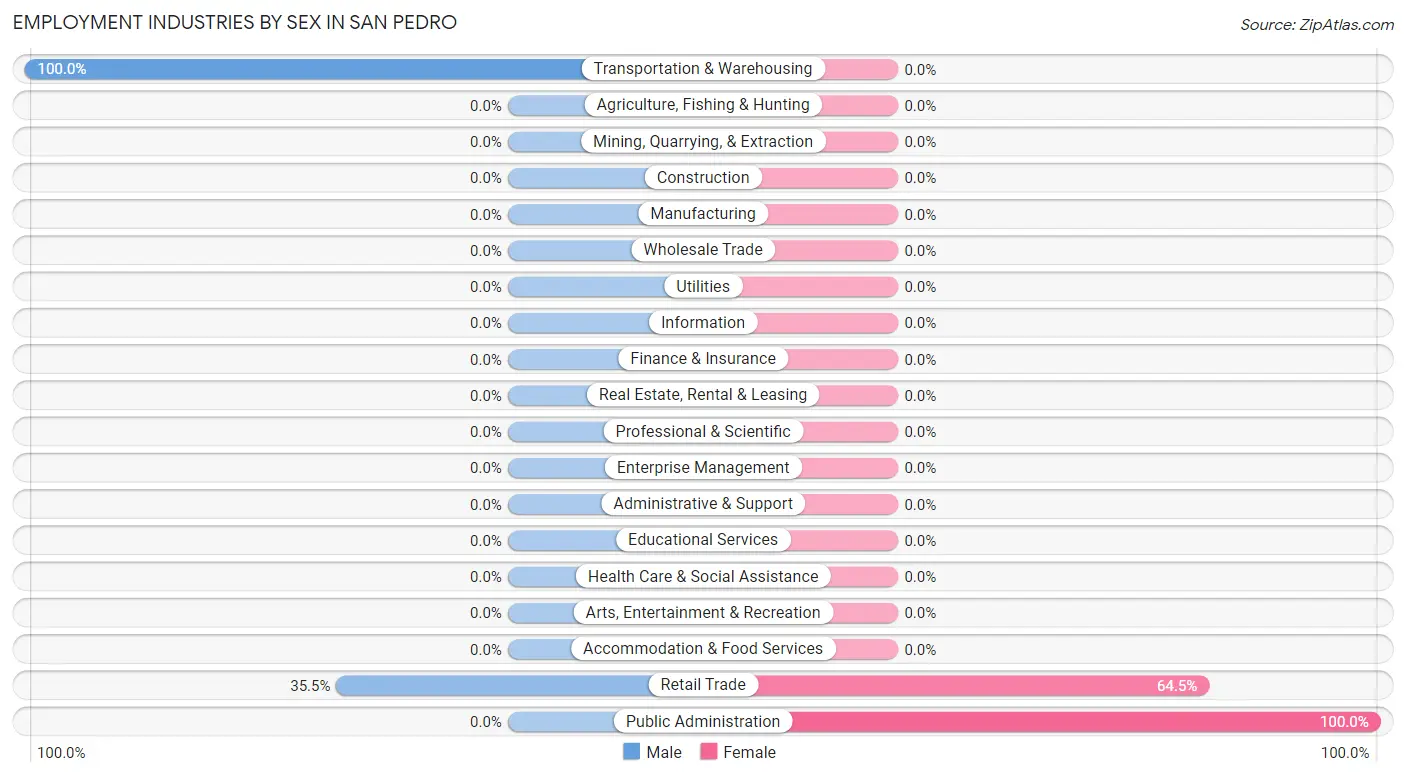
The San Pedro industries that see more men than women are Transportation & Warehousing (100.0%), and Retail Trade (35.5%), whereas the industries that tend to have a higher number of women are Public Administration (100.0%), and Retail Trade (64.5%).
| Industry | Male | Female |
| Agriculture, Fishing & Hunting | 0 (0.0%) | 0 (0.0%) |
| Mining, Quarrying, & Extraction | 0 (0.0%) | 0 (0.0%) |
| Construction | 0 (0.0%) | 0 (0.0%) |
| Manufacturing | 0 (0.0%) | 0 (0.0%) |
| Wholesale Trade | 0 (0.0%) | 0 (0.0%) |
| Retail Trade | 11 (35.5%) | 20 (64.5%) |
| Transportation & Warehousing | 9 (100.0%) | 0 (0.0%) |
| Utilities | 0 (0.0%) | 0 (0.0%) |
| Information | 0 (0.0%) | 0 (0.0%) |
| Finance & Insurance | 0 (0.0%) | 0 (0.0%) |
| Real Estate, Rental & Leasing | 0 (0.0%) | 0 (0.0%) |
| Professional & Scientific | 0 (0.0%) | 0 (0.0%) |
| Enterprise Management | 0 (0.0%) | 0 (0.0%) |
| Administrative & Support | 0 (0.0%) | 0 (0.0%) |
| Educational Services | 0 (0.0%) | 0 (0.0%) |
| Health Care & Social Assistance | 0 (0.0%) | 0 (0.0%) |
| Arts, Entertainment & Recreation | 0 (0.0%) | 0 (0.0%) |
| Accommodation & Food Services | 0 (0.0%) | 0 (0.0%) |
| Public Administration | 0 (0.0%) | 12 (100.0%) |
| Total | 20 (38.5%) | 32 (61.5%) |
Education in San Pedro
School Enrollment in San Pedro
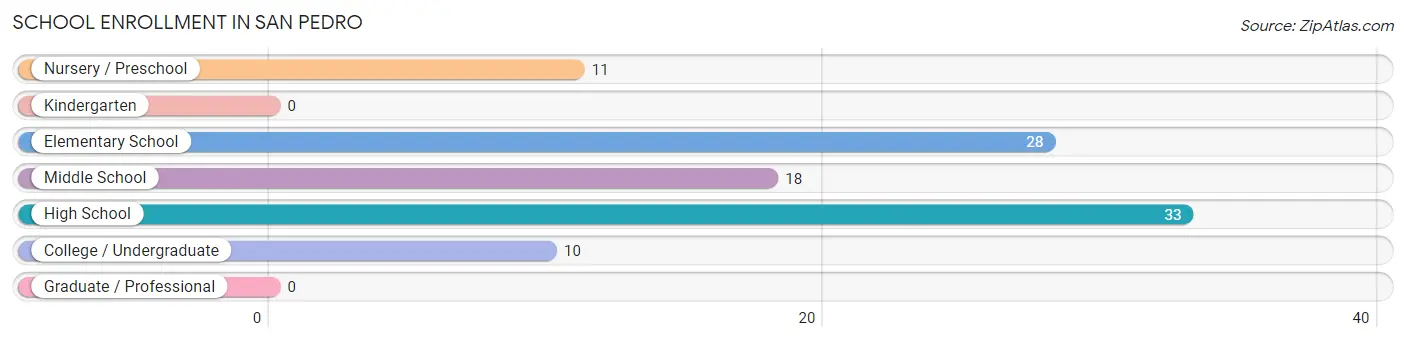
The most common levels of schooling among the 100 students in San Pedro are high school (33 | 33.0%), elementary school (28 | 28.0%), and middle school (18 | 18.0%).
| School Level | # Students | % Students |
| Nursery / Preschool | 11 | 11.0% |
| Kindergarten | 0 | 0.0% |
| Elementary School | 28 | 28.0% |
| Middle School | 18 | 18.0% |
| High School | 33 | 33.0% |
| College / Undergraduate | 10 | 10.0% |
| Graduate / Professional | 0 | 0.0% |
| Total | 100 | 100.0% |
School Enrollment by Age by Funding Source in San Pedro
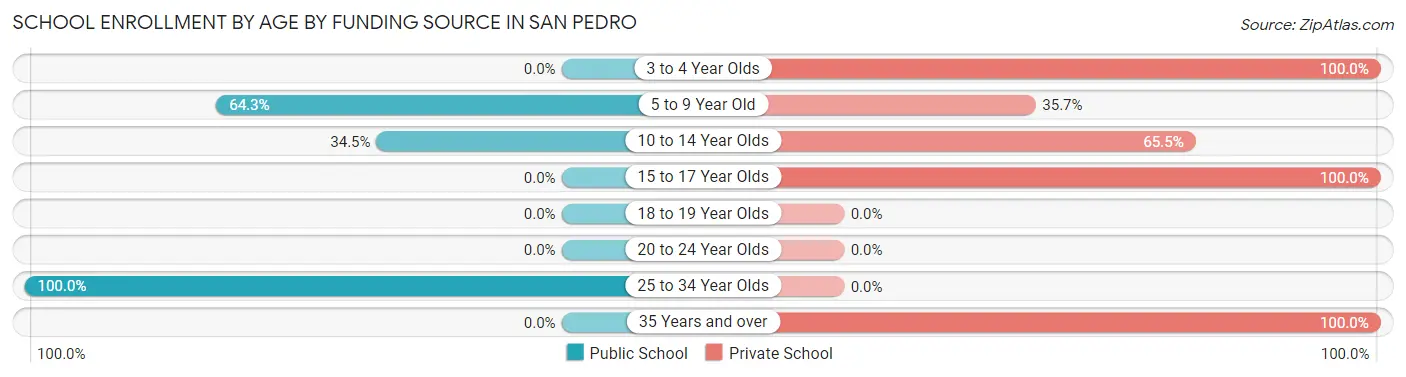
Out of a total of 100 students who are enrolled in schools in San Pedro, 62 (62.0%) attend a private institution, while the remaining 38 (38.0%) are enrolled in public schools. The age group of 3 to 4 year olds has the highest likelihood of being enrolled in private schools, with 11 (100.0% in the age bracket) enrolled. Conversely, the age group of 25 to 34 year olds has the lowest likelihood of being enrolled in a private school, with 10 (100.0% in the age bracket) attending a public institution.
| Age Bracket | Public School | Private School |
| 3 to 4 Year Olds | 0 (0.0%) | 11 (100.0%) |
| 5 to 9 Year Old | 18 (64.3%) | 10 (35.7%) |
| 10 to 14 Year Olds | 10 (34.5%) | 19 (65.5%) |
| 15 to 17 Year Olds | 0 (0.0%) | 10 (100.0%) |
| 18 to 19 Year Olds | 0 (0.0%) | 0 (0.0%) |
| 20 to 24 Year Olds | 0 (0.0%) | 0 (0.0%) |
| 25 to 34 Year Olds | 10 (100.0%) | 0 (0.0%) |
| 35 Years and over | 0 (0.0%) | 12 (100.0%) |
| Total | 38 (38.0%) | 62 (62.0%) |
Educational Attainment by Field of Study in San Pedro
Visual & performing arts (15 | 19.7%), literature & languages (14 | 18.4%), computers & mathematics (10 | 13.2%), business (10 | 13.2%), and arts & humanities (10 | 13.2%) are the most common fields of study among 76 individuals in San Pedro who have obtained a bachelor's degree or higher.
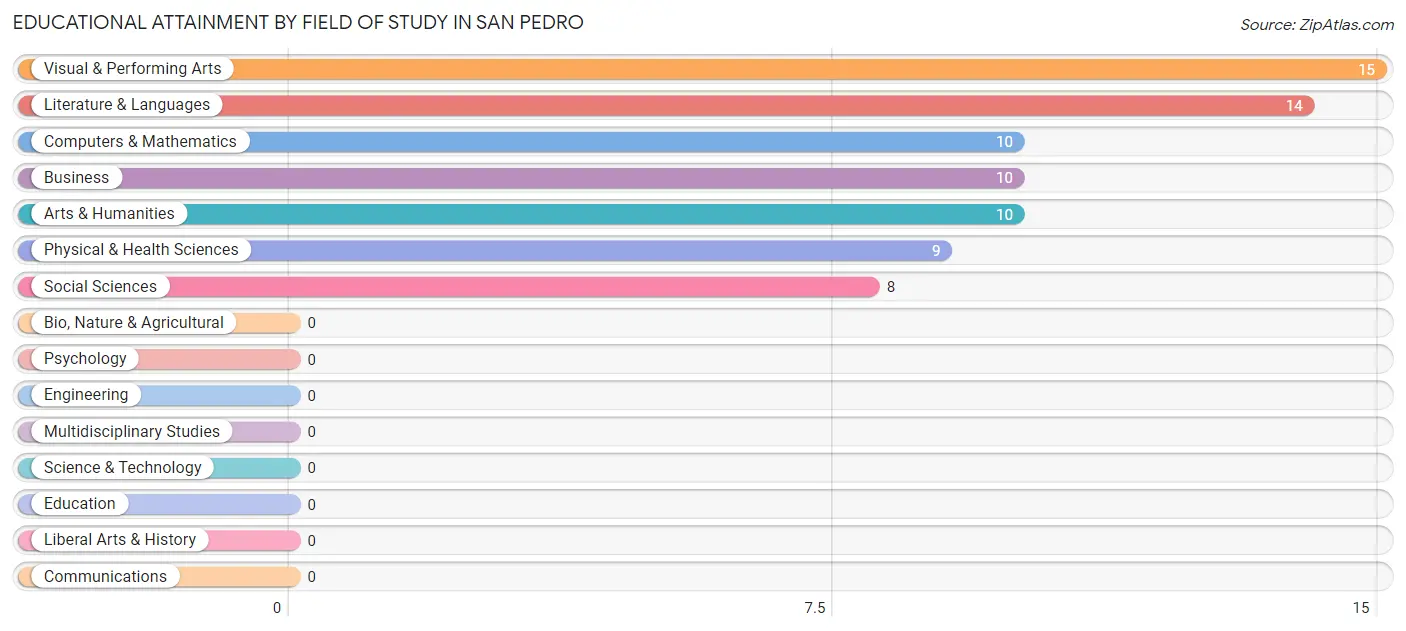
| Field of Study | # Graduates | % Graduates |
| Computers & Mathematics | 10 | 13.2% |
| Bio, Nature & Agricultural | 0 | 0.0% |
| Physical & Health Sciences | 9 | 11.8% |
| Psychology | 0 | 0.0% |
| Social Sciences | 8 | 10.5% |
| Engineering | 0 | 0.0% |
| Multidisciplinary Studies | 0 | 0.0% |
| Science & Technology | 0 | 0.0% |
| Business | 10 | 13.2% |
| Education | 0 | 0.0% |
| Literature & Languages | 14 | 18.4% |
| Liberal Arts & History | 0 | 0.0% |
| Visual & Performing Arts | 15 | 19.7% |
| Communications | 0 | 0.0% |
| Arts & Humanities | 10 | 13.2% |
| Total | 76 | 100.0% |
Transportation & Commute in San Pedro
Vehicle Availability by Sex in San Pedro
The most prevalent vehicle ownership categories in San Pedro are males with 3 vehicles (20, accounting for 64.5%) and females with 3 vehicles (32, making up 62.5%).
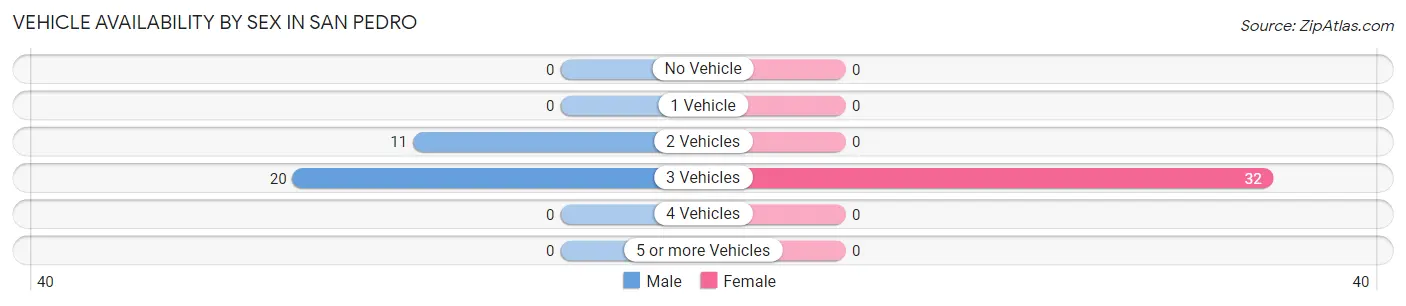
| Vehicles Available | Male | Female |
| No Vehicle | 0 (0.0%) | 0 (0.0%) |
| 1 Vehicle | 0 (0.0%) | 0 (0.0%) |
| 2 Vehicles | 11 (35.5%) | 0 (0.0%) |
| 3 Vehicles | 20 (64.5%) | 32 (100.0%) |
| 4 Vehicles | 0 (0.0%) | 0 (0.0%) |
| 5 or more Vehicles | 0 (0.0%) | 0 (0.0%) |
| Total | 31 (100.0%) | 32 (100.0%) |
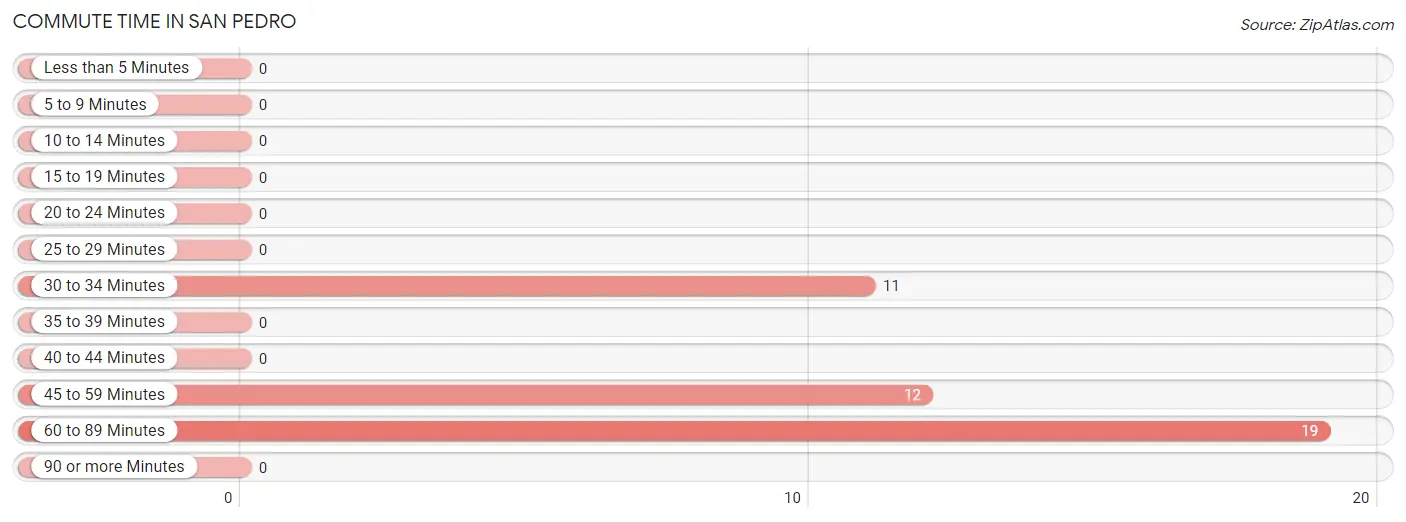
Commute Time in San Pedro
The most frequently occuring commute durations in San Pedro are 60 to 89 minutes (19 commuters, 45.2%), 45 to 59 minutes (12 commuters, 28.6%), and 30 to 34 minutes (11 commuters, 26.2%).
| Commute Time | # Commuters | % Commuters |
| Less than 5 Minutes | 0 | 0.0% |
| 5 to 9 Minutes | 0 | 0.0% |
| 10 to 14 Minutes | 0 | 0.0% |
| 15 to 19 Minutes | 0 | 0.0% |
| 20 to 24 Minutes | 0 | 0.0% |
| 25 to 29 Minutes | 0 | 0.0% |
| 30 to 34 Minutes | 11 | 26.2% |
| 35 to 39 Minutes | 0 | 0.0% |
| 40 to 44 Minutes | 0 | 0.0% |
| 45 to 59 Minutes | 12 | 28.6% |
| 60 to 89 Minutes | 19 | 45.2% |
| 90 or more Minutes | 0 | 0.0% |
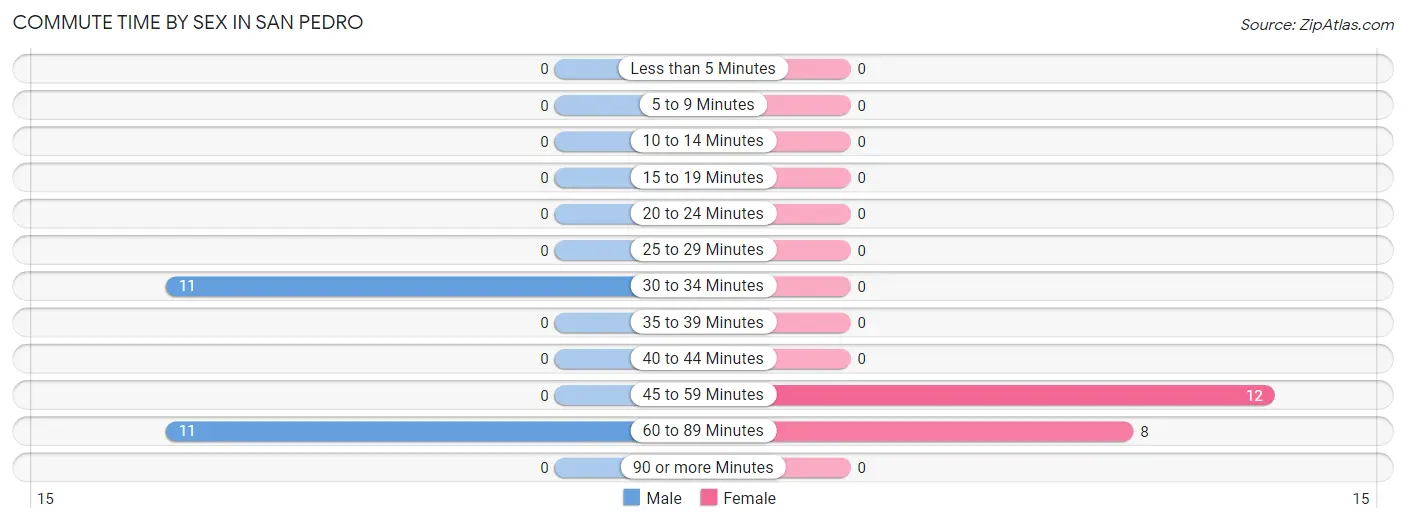
Commute Time by Sex in San Pedro
The most common commute times in San Pedro are 30 to 34 minutes (11 commuters, 50.0%) for males and 45 to 59 minutes (12 commuters, 60.0%) for females.
| Commute Time | Male | Female |
| Less than 5 Minutes | 0 (0.0%) | 0 (0.0%) |
| 5 to 9 Minutes | 0 (0.0%) | 0 (0.0%) |
| 10 to 14 Minutes | 0 (0.0%) | 0 (0.0%) |
| 15 to 19 Minutes | 0 (0.0%) | 0 (0.0%) |
| 20 to 24 Minutes | 0 (0.0%) | 0 (0.0%) |
| 25 to 29 Minutes | 0 (0.0%) | 0 (0.0%) |
| 30 to 34 Minutes | 11 (50.0%) | 0 (0.0%) |
| 35 to 39 Minutes | 0 (0.0%) | 0 (0.0%) |
| 40 to 44 Minutes | 0 (0.0%) | 0 (0.0%) |
| 45 to 59 Minutes | 0 (0.0%) | 12 (60.0%) |
| 60 to 89 Minutes | 11 (50.0%) | 8 (40.0%) |
| 90 or more Minutes | 0 (0.0%) | 0 (0.0%) |
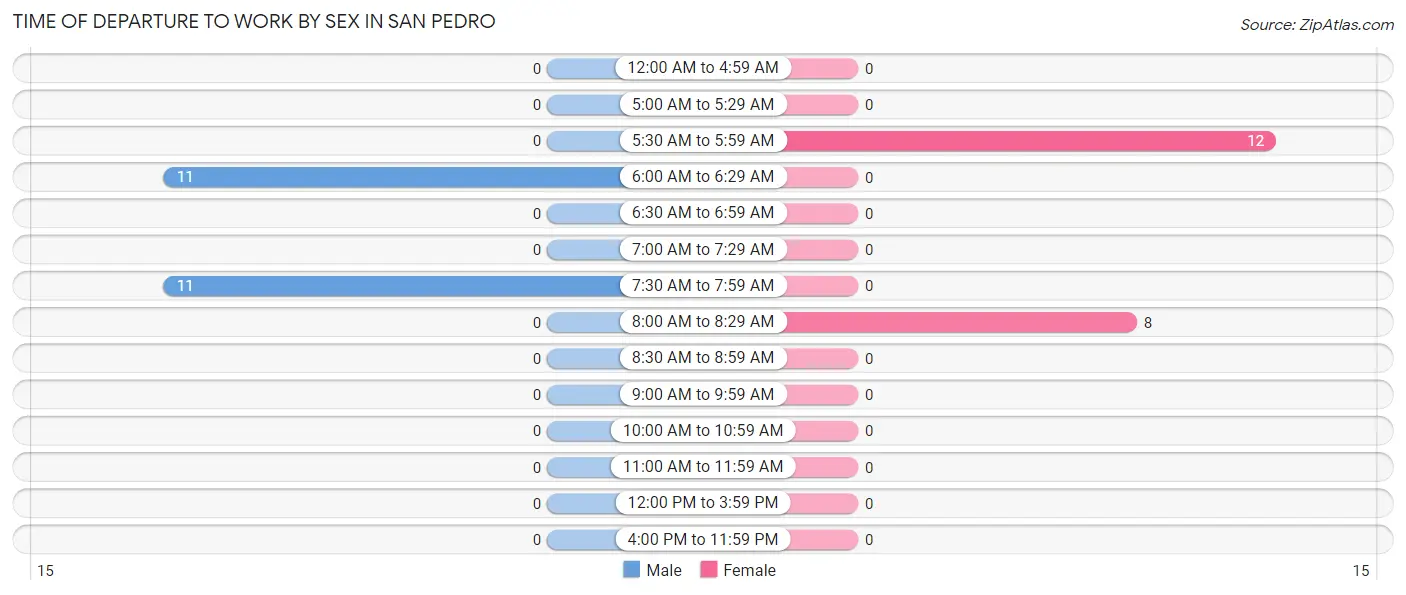
Time of Departure to Work by Sex in San Pedro
The most frequent times of departure to work in San Pedro are 6:00 AM to 6:29 AM (11, 50.0%) for males and 5:30 AM to 5:59 AM (12, 60.0%) for females.
| Time of Departure | Male | Female |
| 12:00 AM to 4:59 AM | 0 (0.0%) | 0 (0.0%) |
| 5:00 AM to 5:29 AM | 0 (0.0%) | 0 (0.0%) |
| 5:30 AM to 5:59 AM | 0 (0.0%) | 12 (60.0%) |
| 6:00 AM to 6:29 AM | 11 (50.0%) | 0 (0.0%) |
| 6:30 AM to 6:59 AM | 0 (0.0%) | 0 (0.0%) |
| 7:00 AM to 7:29 AM | 0 (0.0%) | 0 (0.0%) |
| 7:30 AM to 7:59 AM | 11 (50.0%) | 0 (0.0%) |
| 8:00 AM to 8:29 AM | 0 (0.0%) | 8 (40.0%) |
| 8:30 AM to 8:59 AM | 0 (0.0%) | 0 (0.0%) |
| 9:00 AM to 9:59 AM | 0 (0.0%) | 0 (0.0%) |
| 10:00 AM to 10:59 AM | 0 (0.0%) | 0 (0.0%) |
| 11:00 AM to 11:59 AM | 0 (0.0%) | 0 (0.0%) |
| 12:00 PM to 3:59 PM | 0 (0.0%) | 0 (0.0%) |
| 4:00 PM to 11:59 PM | 0 (0.0%) | 0 (0.0%) |
| Total | 22 (100.0%) | 20 (100.0%) |
Housing Occupancy in San Pedro
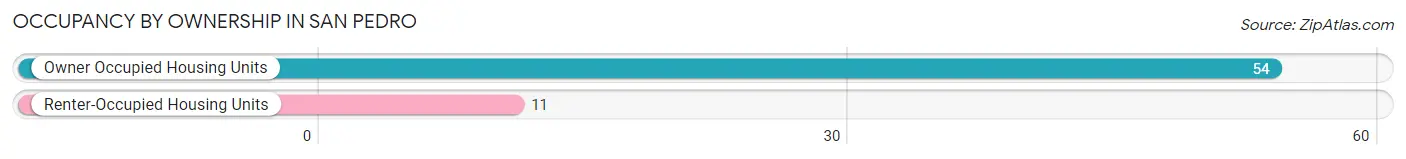
Occupancy by Ownership in San Pedro
Of the total 65 dwellings in San Pedro, owner-occupied units account for 54 (83.1%), while renter-occupied units make up 11 (16.9%).
| Occupancy | # Housing Units | % Housing Units |
| Owner Occupied Housing Units | 54 | 83.1% |
| Renter-Occupied Housing Units | 11 | 16.9% |
| Total Occupied Housing Units | 65 | 100.0% |
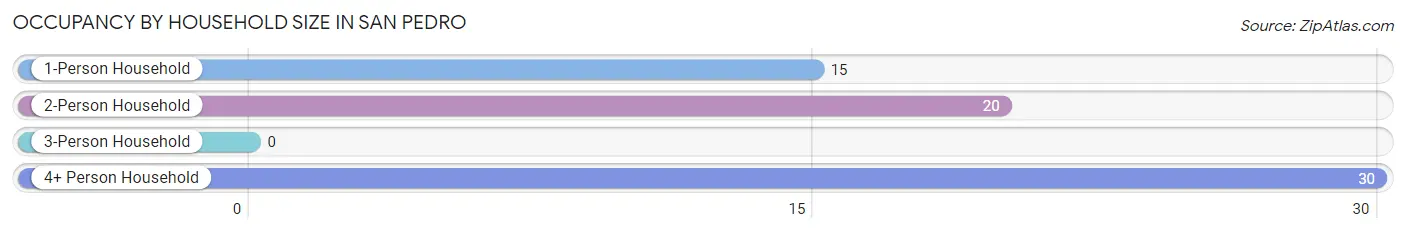
Occupancy by Household Size in San Pedro
| Household Size | # Housing Units | % Housing Units |
| 1-Person Household | 15 | 23.1% |
| 2-Person Household | 20 | 30.8% |
| 3-Person Household | 0 | 0.0% |
| 4+ Person Household | 30 | 46.2% |
| Total Housing Units | 65 | 100.0% |
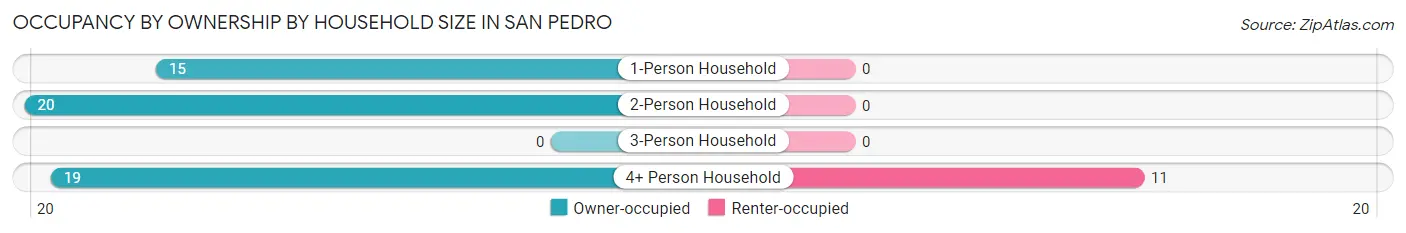
Occupancy by Ownership by Household Size in San Pedro
| Household Size | Owner-occupied | Renter-occupied |
| 1-Person Household | 15 (100.0%) | 0 (0.0%) |
| 2-Person Household | 20 (100.0%) | 0 (0.0%) |
| 3-Person Household | 0 (0.0%) | 0 (0.0%) |
| 4+ Person Household | 19 (63.3%) | 11 (36.7%) |
| Total Housing Units | 54 (83.1%) | 11 (16.9%) |
Occupancy by Educational Attainment in San Pedro
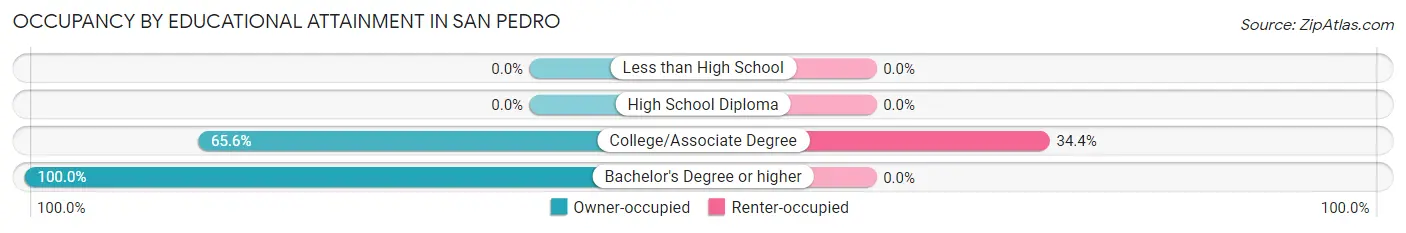
| Household Size | Owner-occupied | Renter-occupied |
| Less than High School | 0 (0.0%) | 0 (0.0%) |
| High School Diploma | 0 (0.0%) | 0 (0.0%) |
| College/Associate Degree | 21 (65.6%) | 11 (34.4%) |
| Bachelor's Degree or higher | 33 (100.0%) | 0 (0.0%) |
Occupancy by Age of Householder in San Pedro
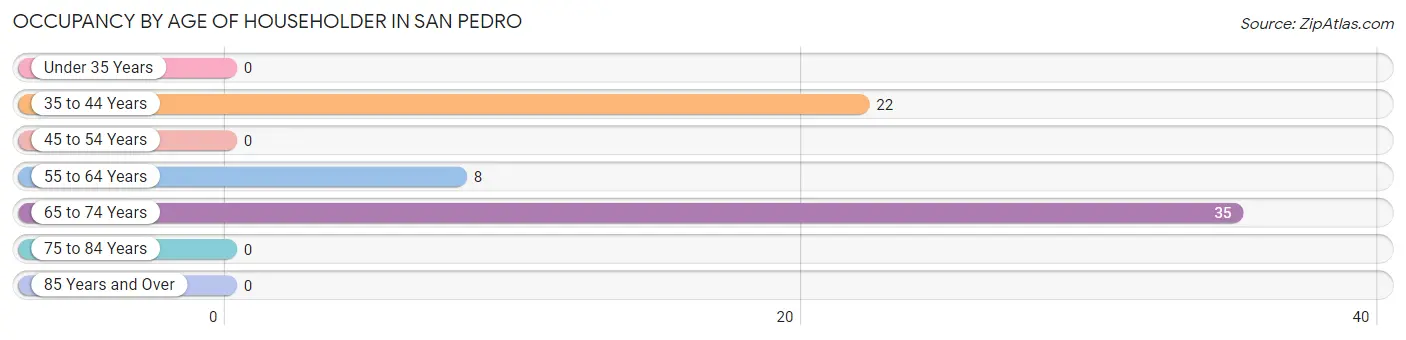
| Age Bracket | # Households | % Households |
| Under 35 Years | 0 | 0.0% |
| 35 to 44 Years | 22 | 33.9% |
| 45 to 54 Years | 0 | 0.0% |
| 55 to 64 Years | 8 | 12.3% |
| 65 to 74 Years | 35 | 53.8% |
| 75 to 84 Years | 0 | 0.0% |
| 85 Years and Over | 0 | 0.0% |
| Total | 65 | 100.0% |
Housing Finances in San Pedro
Median Income by Occupancy in San Pedro
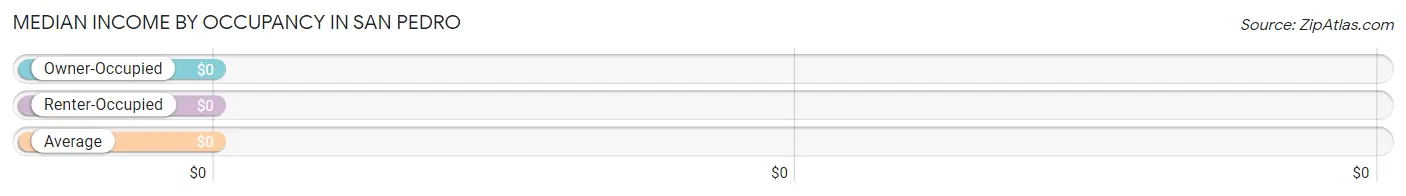
| Occupancy Type | # Households | Median Income |
| Owner-Occupied | 54 (83.1%) | $0 |
| Renter-Occupied | 11 (16.9%) | $0 |
| Average | 65 (100.0%) | $0 |
Occupancy by Householder Income Bracket in San Pedro
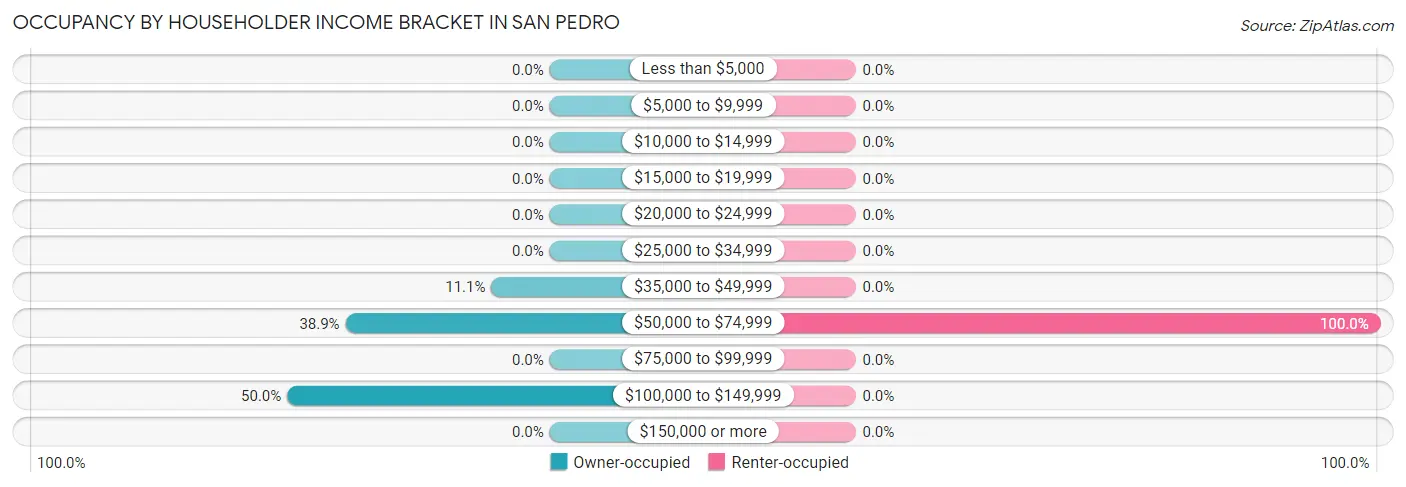
| Income Bracket | Owner-occupied | Renter-occupied |
| Less than $5,000 | 0 (0.0%) | 0 (0.0%) |
| $5,000 to $9,999 | 0 (0.0%) | 0 (0.0%) |
| $10,000 to $14,999 | 0 (0.0%) | 0 (0.0%) |
| $15,000 to $19,999 | 0 (0.0%) | 0 (0.0%) |
| $20,000 to $24,999 | 0 (0.0%) | 0 (0.0%) |
| $25,000 to $34,999 | 0 (0.0%) | 0 (0.0%) |
| $35,000 to $49,999 | 6 (11.1%) | 0 (0.0%) |
| $50,000 to $74,999 | 21 (38.9%) | 11 (100.0%) |
| $75,000 to $99,999 | 0 (0.0%) | 0 (0.0%) |
| $100,000 to $149,999 | 27 (50.0%) | 0 (0.0%) |
| $150,000 or more | 0 (0.0%) | 0 (0.0%) |
| Total | 54 (100.0%) | 11 (100.0%) |
Monthly Housing Cost Tiers in San Pedro
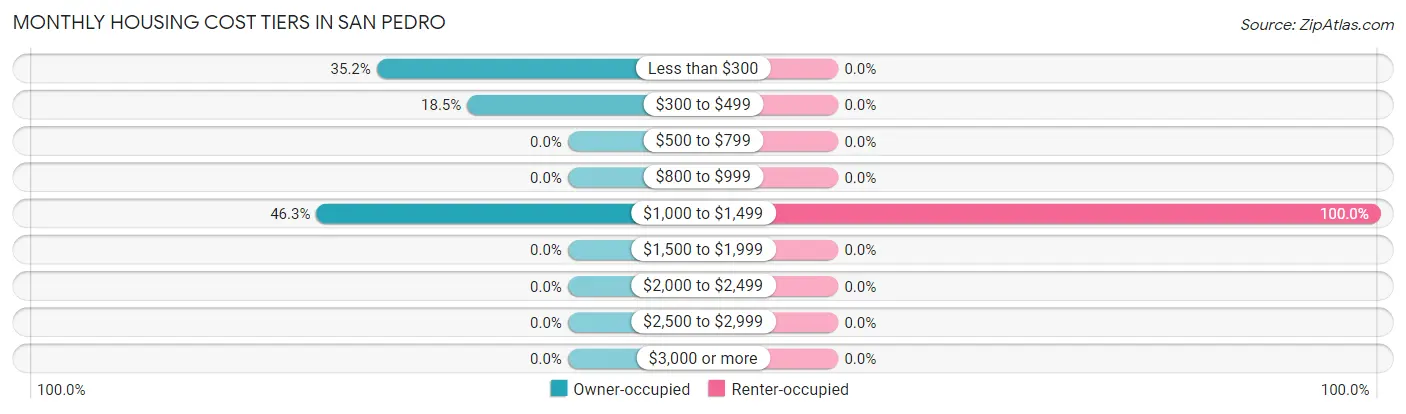
| Monthly Cost | Owner-occupied | Renter-occupied |
| Less than $300 | 19 (35.2%) | 0 (0.0%) |
| $300 to $499 | 10 (18.5%) | 0 (0.0%) |
| $500 to $799 | 0 (0.0%) | 0 (0.0%) |
| $800 to $999 | 0 (0.0%) | 0 (0.0%) |
| $1,000 to $1,499 | 25 (46.3%) | 11 (100.0%) |
| $1,500 to $1,999 | 0 (0.0%) | 0 (0.0%) |
| $2,000 to $2,499 | 0 (0.0%) | 0 (0.0%) |
| $2,500 to $2,999 | 0 (0.0%) | 0 (0.0%) |
| $3,000 or more | 0 (0.0%) | 0 (0.0%) |
| Total | 54 (100.0%) | 11 (100.0%) |
Physical Housing Characteristics in San Pedro
Housing Structures in San Pedro
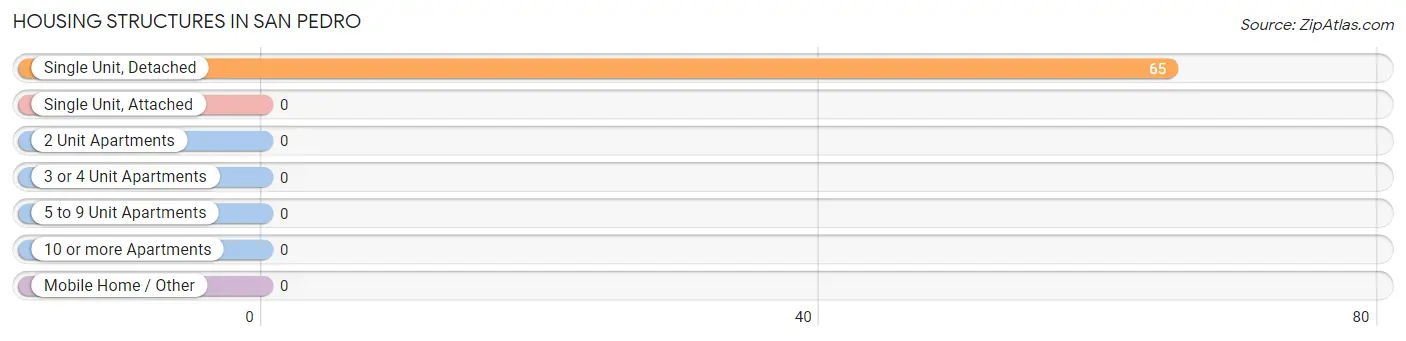
| Structure Type | # Housing Units | % Housing Units |
| Single Unit, Detached | 65 | 100.0% |
| Single Unit, Attached | 0 | 0.0% |
| 2 Unit Apartments | 0 | 0.0% |
| 3 or 4 Unit Apartments | 0 | 0.0% |
| 5 to 9 Unit Apartments | 0 | 0.0% |
| 10 or more Apartments | 0 | 0.0% |
| Mobile Home / Other | 0 | 0.0% |
| Total | 65 | 100.0% |
Housing Structures by Occupancy in San Pedro
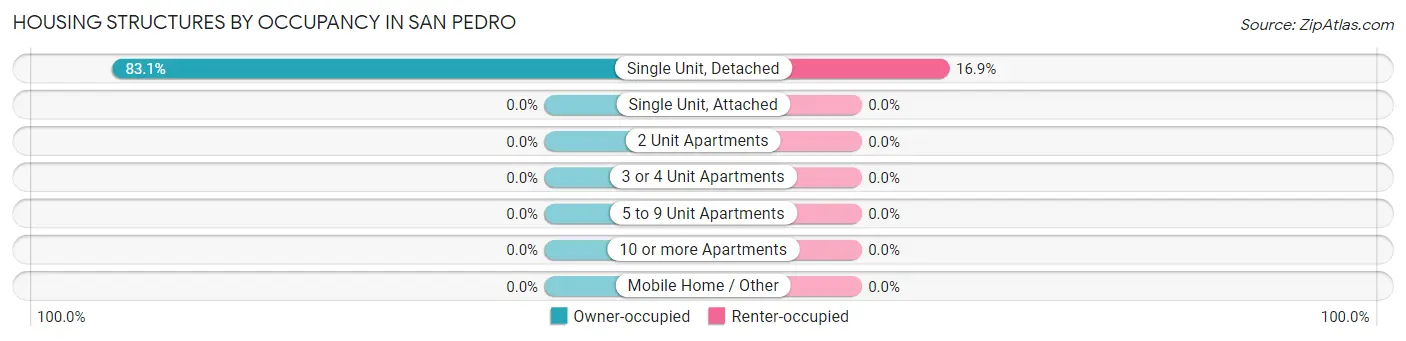
| Structure Type | Owner-occupied | Renter-occupied |
| Single Unit, Detached | 54 (83.1%) | 11 (16.9%) |
| Single Unit, Attached | 0 (0.0%) | 0 (0.0%) |
| 2 Unit Apartments | 0 (0.0%) | 0 (0.0%) |
| 3 or 4 Unit Apartments | 0 (0.0%) | 0 (0.0%) |
| 5 to 9 Unit Apartments | 0 (0.0%) | 0 (0.0%) |
| 10 or more Apartments | 0 (0.0%) | 0 (0.0%) |
| Mobile Home / Other | 0 (0.0%) | 0 (0.0%) |
| Total | 54 (83.1%) | 11 (16.9%) |
Housing Structures by Number of Rooms in San Pedro
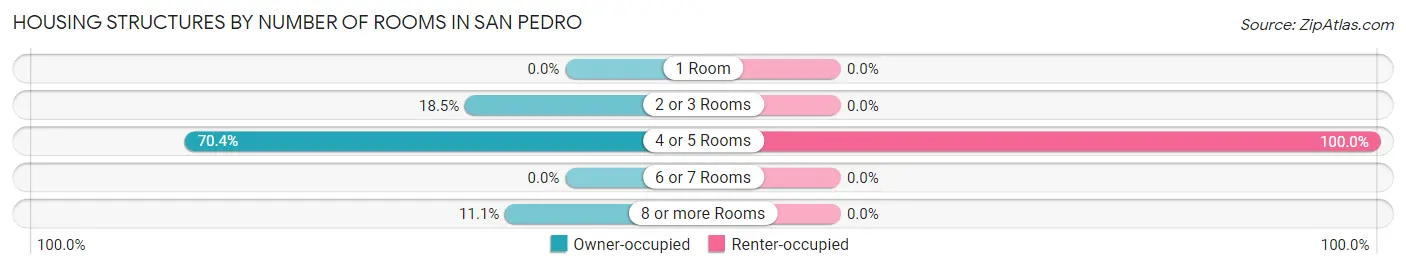
| Number of Rooms | Owner-occupied | Renter-occupied |
| 1 Room | 0 (0.0%) | 0 (0.0%) |
| 2 or 3 Rooms | 10 (18.5%) | 0 (0.0%) |
| 4 or 5 Rooms | 38 (70.4%) | 11 (100.0%) |
| 6 or 7 Rooms | 0 (0.0%) | 0 (0.0%) |
| 8 or more Rooms | 6 (11.1%) | 0 (0.0%) |
| Total | 54 (100.0%) | 11 (100.0%) |
Housing Structure by Heating Type in San Pedro
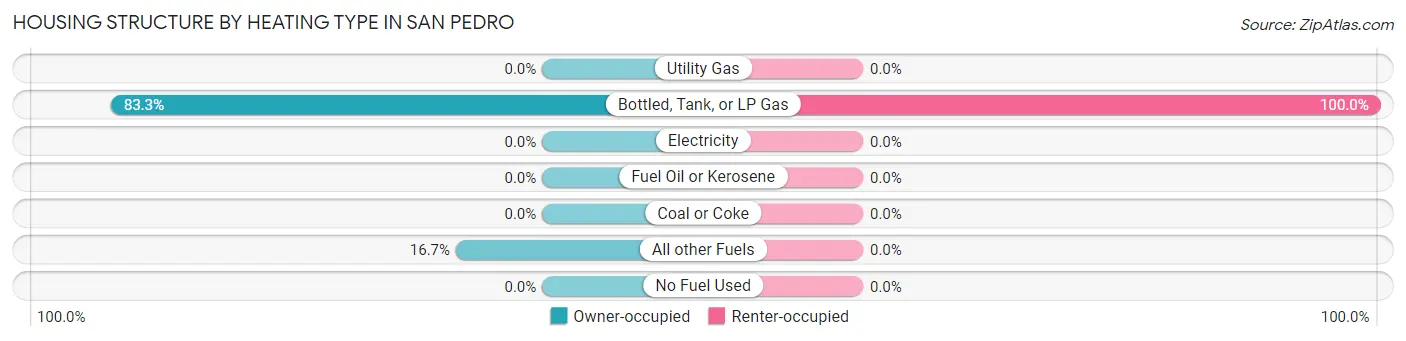
| Heating Type | Owner-occupied | Renter-occupied |
| Utility Gas | 0 (0.0%) | 0 (0.0%) |
| Bottled, Tank, or LP Gas | 45 (83.3%) | 11 (100.0%) |
| Electricity | 0 (0.0%) | 0 (0.0%) |
| Fuel Oil or Kerosene | 0 (0.0%) | 0 (0.0%) |
| Coal or Coke | 0 (0.0%) | 0 (0.0%) |
| All other Fuels | 9 (16.7%) | 0 (0.0%) |
| No Fuel Used | 0 (0.0%) | 0 (0.0%) |
| Total | 54 (100.0%) | 11 (100.0%) |
Household Vehicle Usage in San Pedro
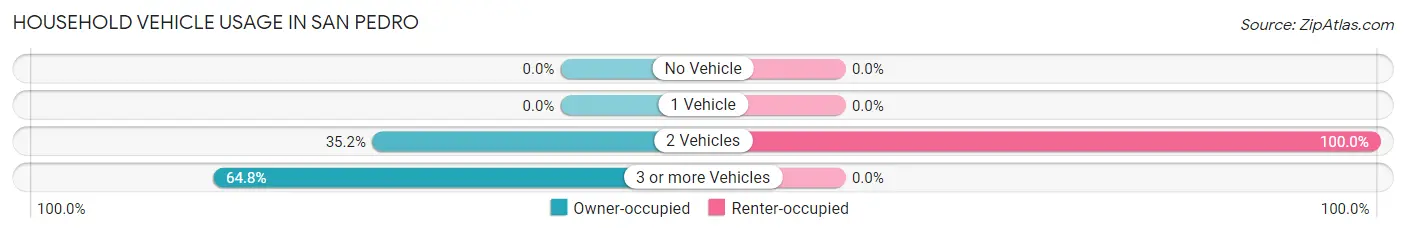
| Vehicles per Household | Owner-occupied | Renter-occupied |
| No Vehicle | 0 (0.0%) | 0 (0.0%) |
| 1 Vehicle | 0 (0.0%) | 0 (0.0%) |
| 2 Vehicles | 19 (35.2%) | 11 (100.0%) |
| 3 or more Vehicles | 35 (64.8%) | 0 (0.0%) |
| Total | 54 (100.0%) | 11 (100.0%) |
Real Estate & Mortgages in San Pedro
Real Estate and Mortgage Overview in San Pedro
| Characteristic | Without Mortgage | With Mortgage |
| Housing Units | 35 | 19 |
| Median Property Value | - | - |
| Median Household Income | - | - |
| Monthly Housing Costs | $292 | $0 |
| Real Estate Taxes | - | - |
Property Value by Mortgage Status in San Pedro
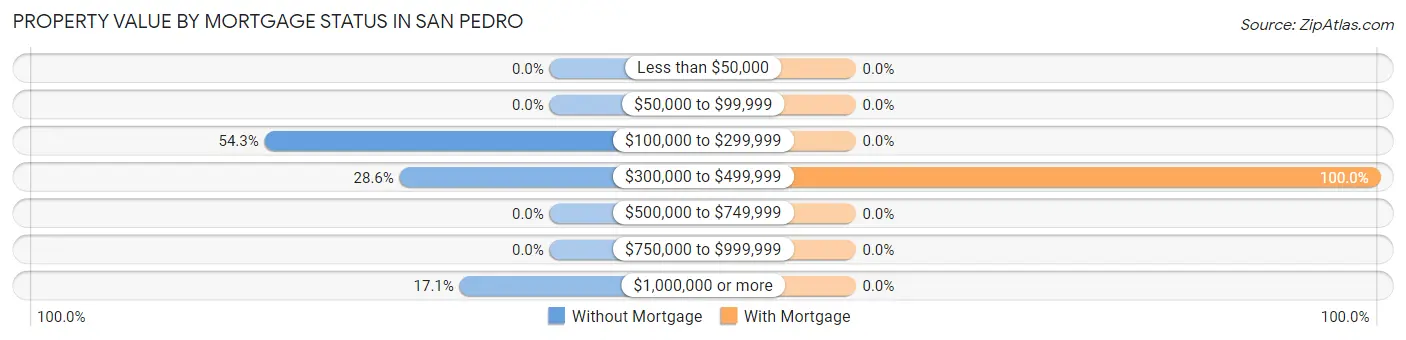
| Property Value | Without Mortgage | With Mortgage |
| Less than $50,000 | 0 (0.0%) | 0 (0.0%) |
| $50,000 to $99,999 | 0 (0.0%) | 0 (0.0%) |
| $100,000 to $299,999 | 19 (54.3%) | 0 (0.0%) |
| $300,000 to $499,999 | 10 (28.6%) | 19 (100.0%) |
| $500,000 to $749,999 | 0 (0.0%) | 0 (0.0%) |
| $750,000 to $999,999 | 0 (0.0%) | 0 (0.0%) |
| $1,000,000 or more | 6 (17.1%) | 0 (0.0%) |
| Total | 35 (100.0%) | 19 (100.0%) |
Household Income by Mortgage Status in San Pedro
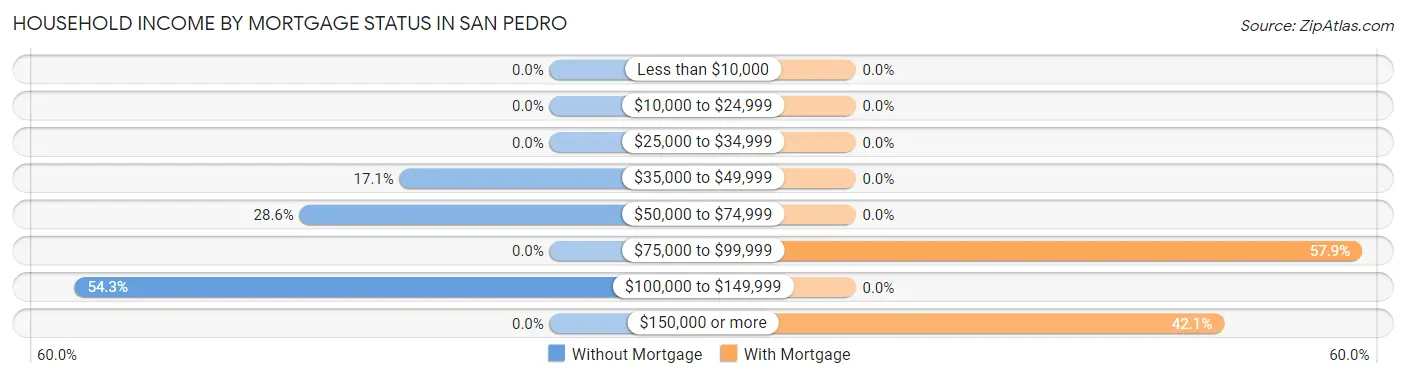
| Household Income | Without Mortgage | With Mortgage |
| Less than $10,000 | 0 (0.0%) | 0 (0.0%) |
| $10,000 to $24,999 | 0 (0.0%) | 0 (0.0%) |
| $25,000 to $34,999 | 0 (0.0%) | 0 (0.0%) |
| $35,000 to $49,999 | 6 (17.1%) | 0 (0.0%) |
| $50,000 to $74,999 | 10 (28.6%) | 0 (0.0%) |
| $75,000 to $99,999 | 0 (0.0%) | 11 (57.9%) |
| $100,000 to $149,999 | 19 (54.3%) | 0 (0.0%) |
| $150,000 or more | 0 (0.0%) | 8 (42.1%) |
| Total | 35 (100.0%) | 19 (100.0%) |
Property Value to Household Income Ratio in San Pedro
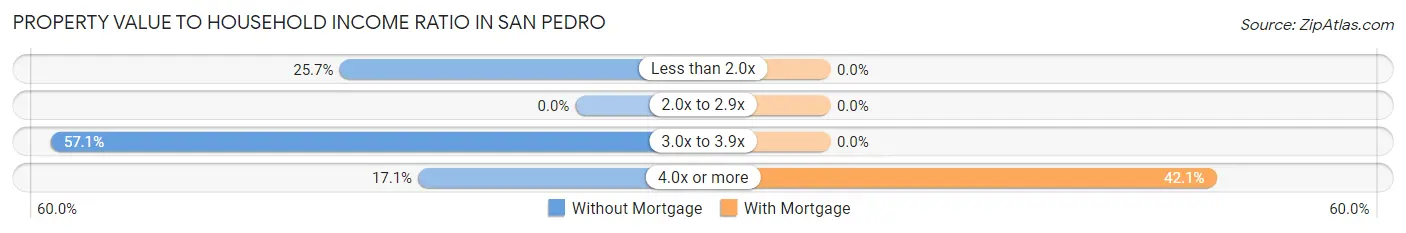
| Value-to-Income Ratio | Without Mortgage | With Mortgage |
| Less than 2.0x | 9 (25.7%) | 0 (0.0%) |
| 2.0x to 2.9x | 0 (0.0%) | 0 (0.0%) |
| 3.0x to 3.9x | 20 (57.1%) | 0 (0.0%) |
| 4.0x or more | 6 (17.1%) | 8 (42.1%) |
| Total | 35 (100.0%) | 19 (100.0%) |
Real Estate Taxes by Mortgage Status in San Pedro
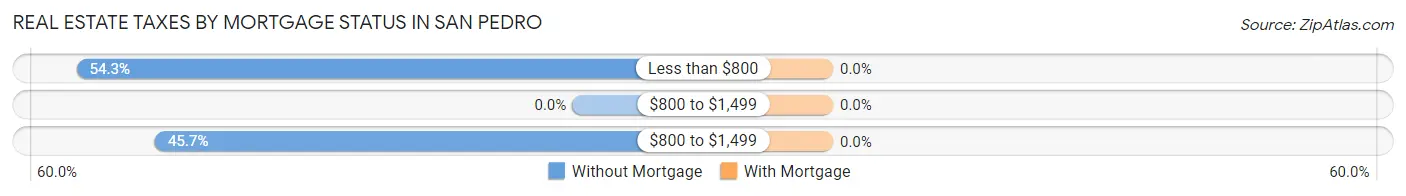
| Property Taxes | Without Mortgage | With Mortgage |
| Less than $800 | 19 (54.3%) | 0 (0.0%) |
| $800 to $1,499 | 0 (0.0%) | 0 (0.0%) |
| $800 to $1,499 | 16 (45.7%) | 0 (0.0%) |
| Total | 35 (100.0%) | 19 (100.0%) |
Health & Disability in San Pedro
Health Insurance Coverage by Age in San Pedro
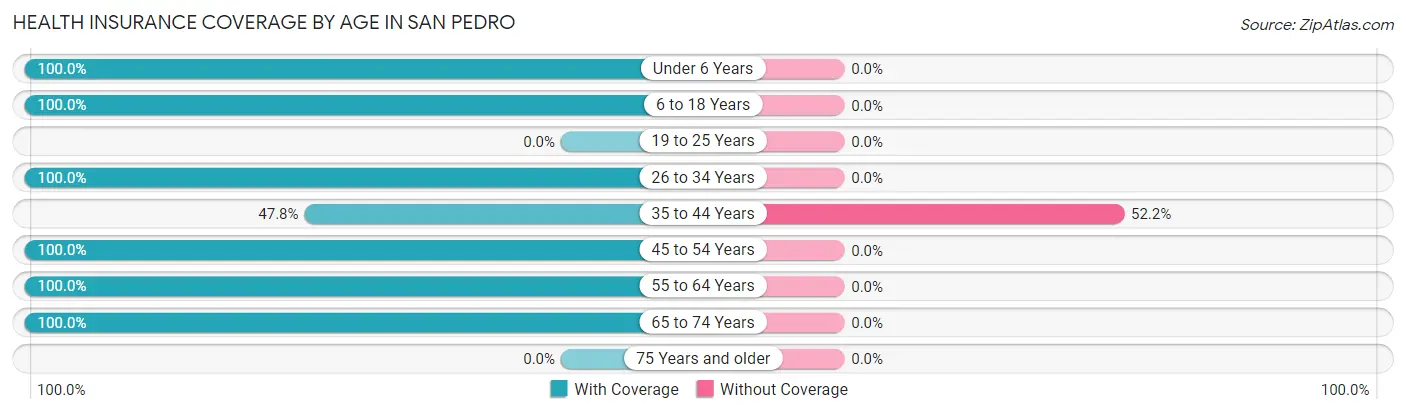
| Age Bracket | With Coverage | Without Coverage |
| Under 6 Years | 23 (100.0%) | 0 (0.0%) |
| 6 to 18 Years | 66 (100.0%) | 0 (0.0%) |
| 19 to 25 Years | 0 (0.0%) | 0 (0.0%) |
| 26 to 34 Years | 22 (100.0%) | 0 (0.0%) |
| 35 to 44 Years | 11 (47.8%) | 12 (52.2%) |
| 45 to 54 Years | 12 (100.0%) | 0 (0.0%) |
| 55 to 64 Years | 29 (100.0%) | 0 (0.0%) |
| 65 to 74 Years | 45 (100.0%) | 0 (0.0%) |
| 75 Years and older | 0 (0.0%) | 0 (0.0%) |
| Total | 208 (94.6%) | 12 (5.4%) |
Health Insurance Coverage by Citizenship Status in San Pedro
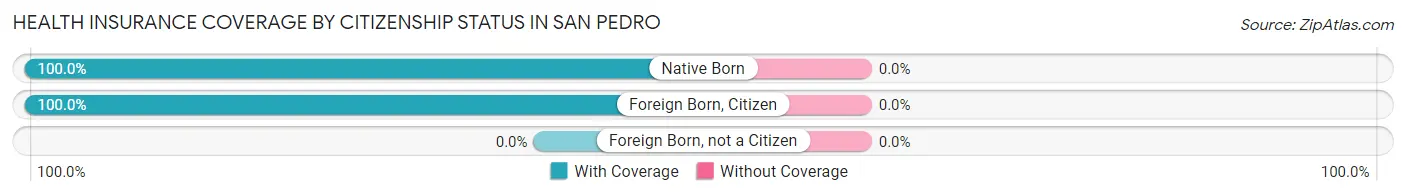
| Citizenship Status | With Coverage | Without Coverage |
| Native Born | 23 (100.0%) | 0 (0.0%) |
| Foreign Born, Citizen | 66 (100.0%) | 0 (0.0%) |
| Foreign Born, not a Citizen | 0 (0.0%) | 0 (0.0%) |
Health Insurance Coverage by Household Income in San Pedro
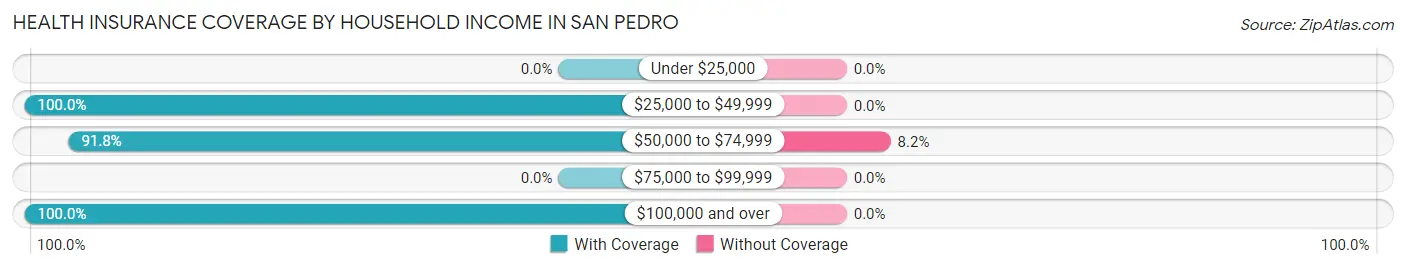
| Household Income | With Coverage | Without Coverage |
| Under $25,000 | 0 (0.0%) | 0 (0.0%) |
| $25,000 to $49,999 | 6 (100.0%) | 0 (0.0%) |
| $50,000 to $74,999 | 134 (91.8%) | 12 (8.2%) |
| $75,000 to $99,999 | 0 (0.0%) | 0 (0.0%) |
| $100,000 and over | 68 (100.0%) | 0 (0.0%) |
Public vs Private Health Insurance Coverage by Age in San Pedro
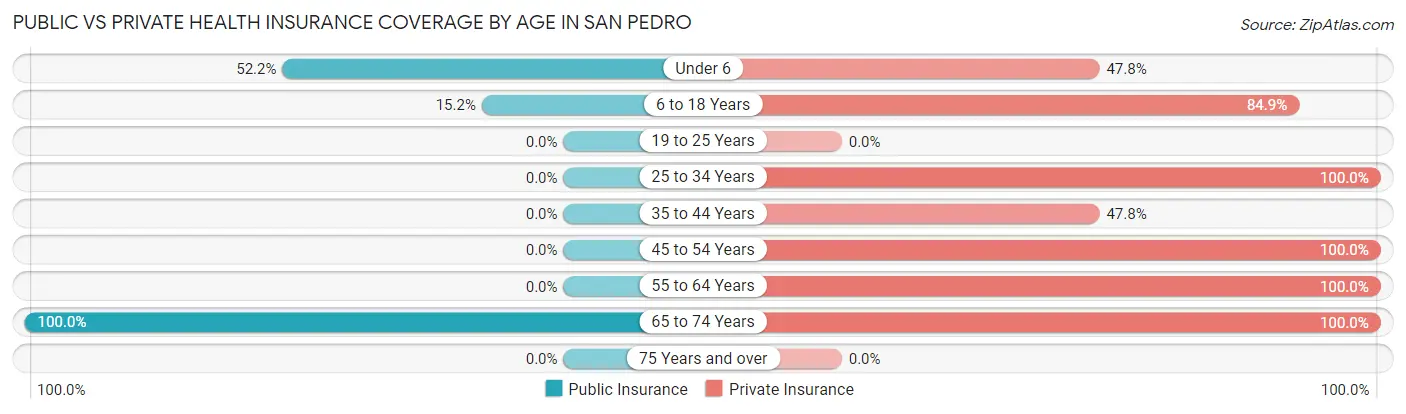
| Age Bracket | Public Insurance | Private Insurance |
| Under 6 | 12 (52.2%) | 11 (47.8%) |
| 6 to 18 Years | 10 (15.1%) | 56 (84.9%) |
| 19 to 25 Years | 0 (0.0%) | 0 (0.0%) |
| 25 to 34 Years | 0 (0.0%) | 22 (100.0%) |
| 35 to 44 Years | 0 (0.0%) | 11 (47.8%) |
| 45 to 54 Years | 0 (0.0%) | 12 (100.0%) |
| 55 to 64 Years | 0 (0.0%) | 29 (100.0%) |
| 65 to 74 Years | 45 (100.0%) | 45 (100.0%) |
| 75 Years and over | 0 (0.0%) | 0 (0.0%) |
| Total | 67 (30.4%) | 186 (84.6%) |
Disability Status by Sex by Age in San Pedro
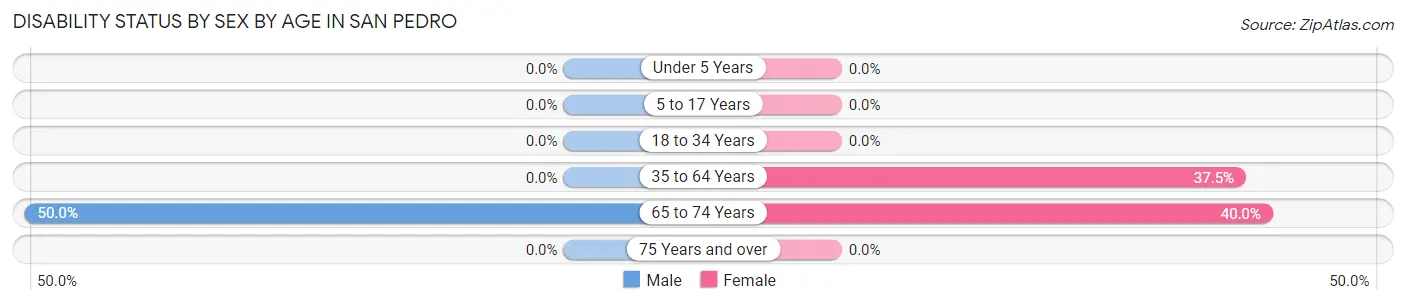
| Age Bracket | Male | Female |
| Under 5 Years | 0 (0.0%) | 0 (0.0%) |
| 5 to 17 Years | 0 (0.0%) | 0 (0.0%) |
| 18 to 34 Years | 0 (0.0%) | 0 (0.0%) |
| 35 to 64 Years | 0 (0.0%) | 12 (37.5%) |
| 65 to 74 Years | 10 (50.0%) | 10 (40.0%) |
| 75 Years and over | 0 (0.0%) | 0 (0.0%) |
Disability Class by Sex by Age in San Pedro
Disability Class: Hearing Difficulty
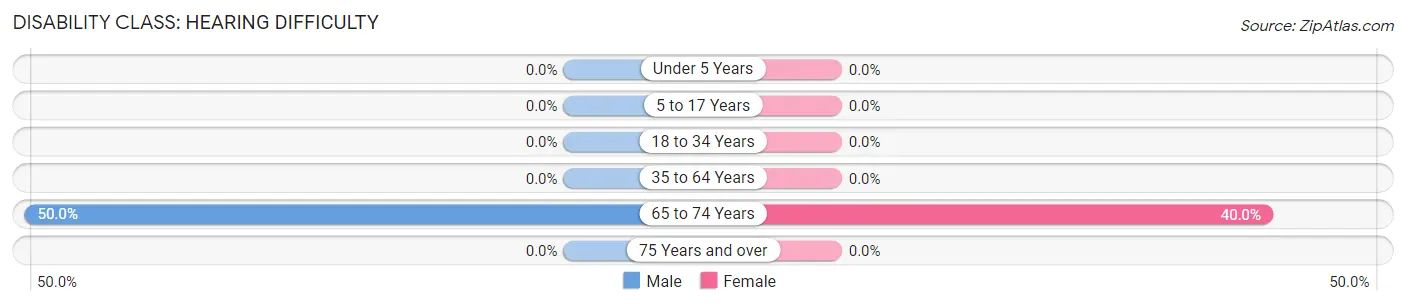
| Age Bracket | Male | Female |
| Under 5 Years | 0 (0.0%) | 0 (0.0%) |
| 5 to 17 Years | 0 (0.0%) | 0 (0.0%) |
| 18 to 34 Years | 0 (0.0%) | 0 (0.0%) |
| 35 to 64 Years | 0 (0.0%) | 0 (0.0%) |
| 65 to 74 Years | 10 (50.0%) | 10 (40.0%) |
| 75 Years and over | 0 (0.0%) | 0 (0.0%) |
Disability Class: Vision Difficulty
| Age Bracket | Male | Female |
| Under 5 Years | 0 (0.0%) | 0 (0.0%) |
| 5 to 17 Years | 0 (0.0%) | 0 (0.0%) |
| 18 to 34 Years | 0 (0.0%) | 0 (0.0%) |
| 35 to 64 Years | 0 (0.0%) | 0 (0.0%) |
| 65 to 74 Years | 0 (0.0%) | 0 (0.0%) |
| 75 Years and over | 0 (0.0%) | 0 (0.0%) |
Disability Class: Cognitive Difficulty
| Age Bracket | Male | Female |
| 5 to 17 Years | 0 (0.0%) | 0 (0.0%) |
| 18 to 34 Years | 0 (0.0%) | 0 (0.0%) |
| 35 to 64 Years | 0 (0.0%) | 0 (0.0%) |
| 65 to 74 Years | 0 (0.0%) | 0 (0.0%) |
| 75 Years and over | 0 (0.0%) | 0 (0.0%) |
Disability Class: Ambulatory Difficulty
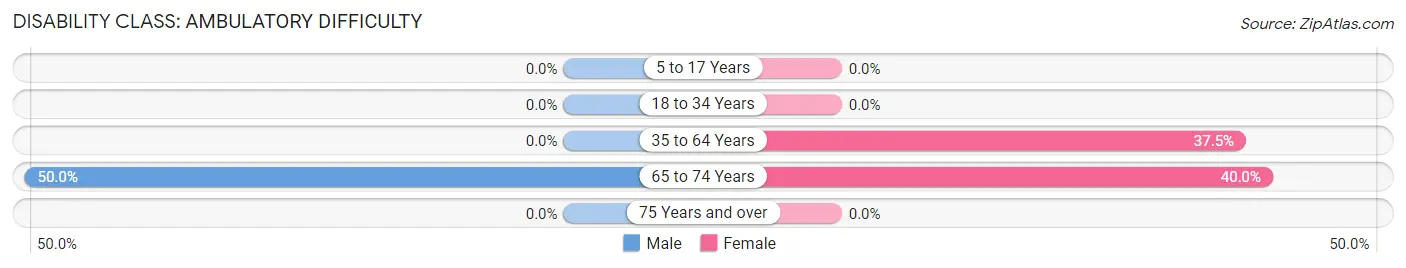
| Age Bracket | Male | Female |
| 5 to 17 Years | 0 (0.0%) | 0 (0.0%) |
| 18 to 34 Years | 0 (0.0%) | 0 (0.0%) |
| 35 to 64 Years | 0 (0.0%) | 12 (37.5%) |
| 65 to 74 Years | 10 (50.0%) | 10 (40.0%) |
| 75 Years and over | 0 (0.0%) | 0 (0.0%) |
Disability Class: Self-Care Difficulty
| Age Bracket | Male | Female |
| 5 to 17 Years | 0 (0.0%) | 0 (0.0%) |
| 18 to 34 Years | 0 (0.0%) | 0 (0.0%) |
| 35 to 64 Years | 0 (0.0%) | 0 (0.0%) |
| 65 to 74 Years | 0 (0.0%) | 0 (0.0%) |
| 75 Years and over | 0 (0.0%) | 0 (0.0%) |
Technology Access in San Pedro
Computing Device Access in San Pedro
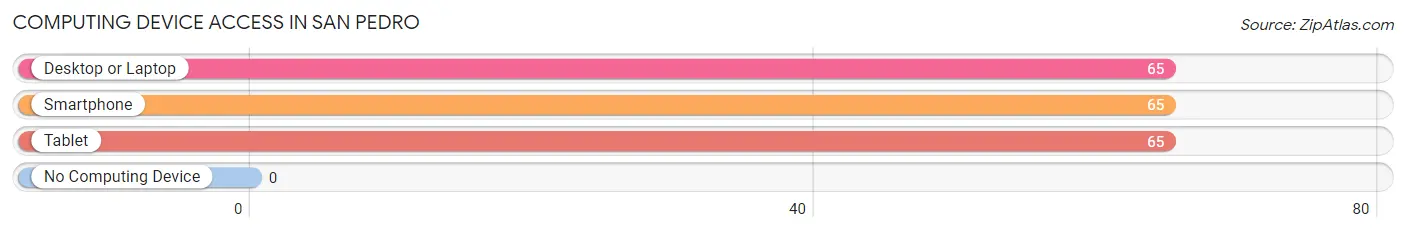
| Device Type | # Households | % Households |
| Desktop or Laptop | 65 | 100.0% |
| Smartphone | 65 | 100.0% |
| Tablet | 65 | 100.0% |
| No Computing Device | 0 | 0.0% |
| Total | 65 | 100.0% |
Internet Access in San Pedro
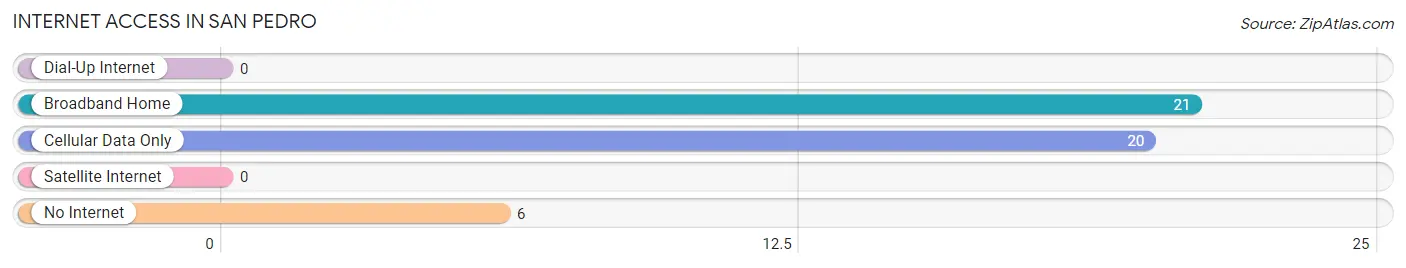
| Internet Type | # Households | % Households |
| Dial-Up Internet | 0 | 0.0% |
| Broadband Home | 21 | 32.3% |
| Cellular Data Only | 20 | 30.8% |
| Satellite Internet | 0 | 0.0% |
| No Internet | 6 | 9.2% |
| Total | 65 | 100.0% |
San Pedro Summary
San Pedro, New Mexico is a small town located in the south-central part of the state. It is situated in the San Pedro Valley, which is part of the Chihuahuan Desert. The town is located in the foothills of the San Pedro Mountains, which are part of the larger Sierra Madre Occidental mountain range. San Pedro is located in the county of Socorro, and is part of the Albuquerque metropolitan area.
History
San Pedro was founded in 1881 by a group of settlers from the nearby town of Socorro. The settlers were looking for a place to settle and farm, and the San Pedro Valley provided them with the perfect opportunity. The town was named after the nearby San Pedro River, which was named after Saint Peter. The town quickly grew, and by the early 1900s, it had become a bustling community with a population of over 1,000 people.
The town was an important stop on the El Paso and Southwestern Railroad, which connected El Paso, Texas to Albuquerque, New Mexico. The railroad provided the town with a steady source of income, and it also allowed for the development of the local economy.
In the early 1900s, San Pedro was a major center for the production of wool and mohair. The town was also home to several large ranches, which provided the town with a steady source of income.
Geography
San Pedro is located in the San Pedro Valley, which is part of the Chihuahuan Desert. The town is situated in the foothills of the San Pedro Mountains, which are part of the larger Sierra Madre Occidental mountain range. The town is located in the county of Socorro, and is part of the Albuquerque metropolitan area.
The town is located at an elevation of 4,890 feet above sea level. The climate in San Pedro is semi-arid, with hot summers and mild winters. The average annual temperature is around 60 degrees Fahrenheit.
Economy
San Pedro’s economy is largely based on agriculture and ranching. The town is home to several large ranches, which provide the town with a steady source of income. The town is also home to several small businesses, including restaurants, stores, and other services.
The town is also home to several manufacturing companies, which produce a variety of products, including furniture, clothing, and electronics. The town is also home to several oil and gas companies, which provide the town with a steady source of income.
Demographics
As of the 2010 census, the population of San Pedro was 1,845. The town is predominantly Hispanic, with over 90% of the population identifying as Hispanic or Latino. The median household income in San Pedro is $30,000, and the median age is 33.
San Pedro is a small town with a close-knit community. The town is home to several churches, and the townspeople are very active in their local church. The town is also home to several schools, including a public elementary school and a private high school.
San Pedro is a small town with a rich history and a vibrant economy. The town is home to several ranches, businesses, and manufacturing companies, which provide the town with a steady source of income. The town is also home to a close-knit community, which is very active in their local church. The town is a great place to live, work, and raise a family.
Common Questions
What is Per Capita Income in San Pedro?
Per Capita income in San Pedro is $26,825.
What is the Median Family Income in San Pedro?
Median Family Income in San Pedro is $68,409.
What is Inequality or Gini Index in San Pedro?
Inequality or Gini Index in San Pedro is 0.23.
What is the Total Population of San Pedro?
Total Population of San Pedro is 232.
What is the Total Male Population of San Pedro?
Total Male Population of San Pedro is 110.
What is the Total Female Population of San Pedro?
Total Female Population of San Pedro is 122.
What is the Ratio of Males per 100 Females in San Pedro?
There are 90.16 Males per 100 Females in San Pedro.
What is the Ratio of Females per 100 Males in San Pedro?
There are 110.91 Females per 100 Males in San Pedro.
What is the Median Population Age in San Pedro?
Median Population Age in San Pedro is 35.4 Years.
What is the Average Family Size in San Pedro
Average Family Size in San Pedro is 5.5 People.
What is the Average Household Size in San Pedro
Average Household Size in San Pedro is 3.5 People.
How Large is the Labor Force in San Pedro?
There are 63 People in the Labor Forcein in San Pedro.
What is the Percentage of People in the Labor Force in San Pedro?
44.4% of People are in the Labor Force in San Pedro.