San Miguel, NM Map & Demographics
San Miguel Map
San Miguel Overview
$28,002
PER CAPITA INCOME
$66,000
AVG FAMILY INCOME
$52,721
AVG HOUSEHOLD INCOME
0.47
INEQUALITY / GINI INDEX
594
TOTAL POPULATION
367
MALE POPULATION
227
FEMALE POPULATION
161.67
MALES / 100 FEMALES
61.85
FEMALES / 100 MALES
37.5
MEDIAN AGE
3.1
AVG FAMILY SIZE
2.6
AVG HOUSEHOLD SIZE
284
LABOR FORCE [ PEOPLE ]
56.2%
PERCENT IN LABOR FORCE
San Miguel Area Codes
Income in San Miguel
Income Overview in San Miguel
Per Capita Income in San Miguel is $28,002, while median incomes of families and households are $66,000 and $52,721 respectively.
| Characteristic | Number | Measure |
| Per Capita Income | 594 | $28,002 |
| Median Family Income | 176 | $66,000 |
| Mean Family Income | 176 | $82,768 |
| Median Household Income | 227 | $52,721 |
| Mean Household Income | 227 | $68,955 |
| Income Deficit | 176 | $0 |
| Wage / Income Gap (%) | 594 | 0.00% |
| Wage / Income Gap ($) | 594 | 100.00¢ per $1 |
| Gini / Inequality Index | 594 | 0.47 |
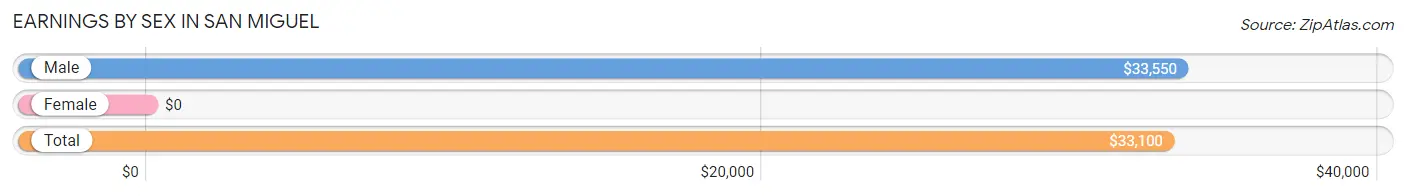
Earnings by Sex in San Miguel
| Sex | Number | Average Earnings |
| Male | 193 (65.6%) | $33,550 |
| Female | 101 (34.4%) | $0 |
| Total | 294 (100.0%) | $33,100 |
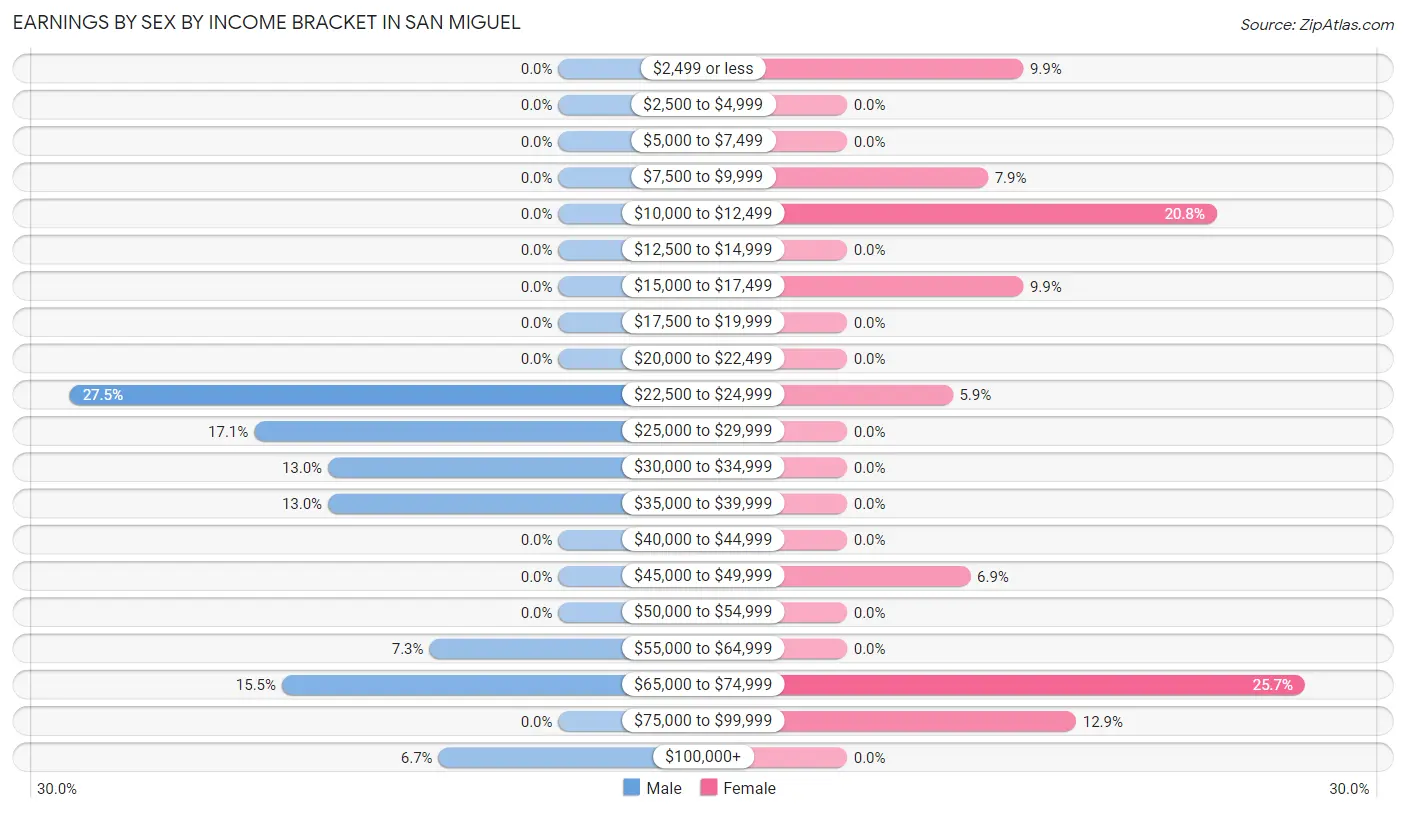
Earnings by Sex by Income Bracket in San Miguel
The most common earnings brackets in San Miguel are $22,500 to $24,999 for men (53 | 27.5%) and $65,000 to $74,999 for women (26 | 25.7%).
| Income | Male | Female |
| $2,499 or less | 0 (0.0%) | 10 (9.9%) |
| $2,500 to $4,999 | 0 (0.0%) | 0 (0.0%) |
| $5,000 to $7,499 | 0 (0.0%) | 0 (0.0%) |
| $7,500 to $9,999 | 0 (0.0%) | 8 (7.9%) |
| $10,000 to $12,499 | 0 (0.0%) | 21 (20.8%) |
| $12,500 to $14,999 | 0 (0.0%) | 0 (0.0%) |
| $15,000 to $17,499 | 0 (0.0%) | 10 (9.9%) |
| $17,500 to $19,999 | 0 (0.0%) | 0 (0.0%) |
| $20,000 to $22,499 | 0 (0.0%) | 0 (0.0%) |
| $22,500 to $24,999 | 53 (27.5%) | 6 (5.9%) |
| $25,000 to $29,999 | 33 (17.1%) | 0 (0.0%) |
| $30,000 to $34,999 | 25 (13.0%) | 0 (0.0%) |
| $35,000 to $39,999 | 25 (13.0%) | 0 (0.0%) |
| $40,000 to $44,999 | 0 (0.0%) | 0 (0.0%) |
| $45,000 to $49,999 | 0 (0.0%) | 7 (6.9%) |
| $50,000 to $54,999 | 0 (0.0%) | 0 (0.0%) |
| $55,000 to $64,999 | 14 (7.2%) | 0 (0.0%) |
| $65,000 to $74,999 | 30 (15.5%) | 26 (25.7%) |
| $75,000 to $99,999 | 0 (0.0%) | 13 (12.9%) |
| $100,000+ | 13 (6.7%) | 0 (0.0%) |
| Total | 193 (100.0%) | 101 (100.0%) |
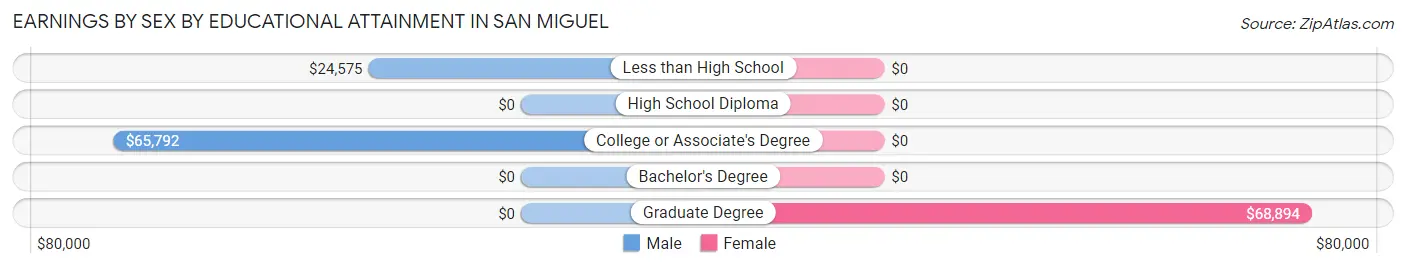
Earnings by Sex by Educational Attainment in San Miguel
| Educational Attainment | Male Income | Female Income |
| Less than High School | $24,575 | $0 |
| High School Diploma | - | - |
| College or Associate's Degree | $65,792 | $0 |
| Bachelor's Degree | - | - |
| Graduate Degree | - | - |
| Total | $34,500 | $0 |
Family Income in San Miguel
Family Income Brackets in San Miguel
According to the San Miguel family income data, there are 57 families falling into the $50,000 to $74,999 income range, which is the most common income bracket and makes up 32.4% of all families.
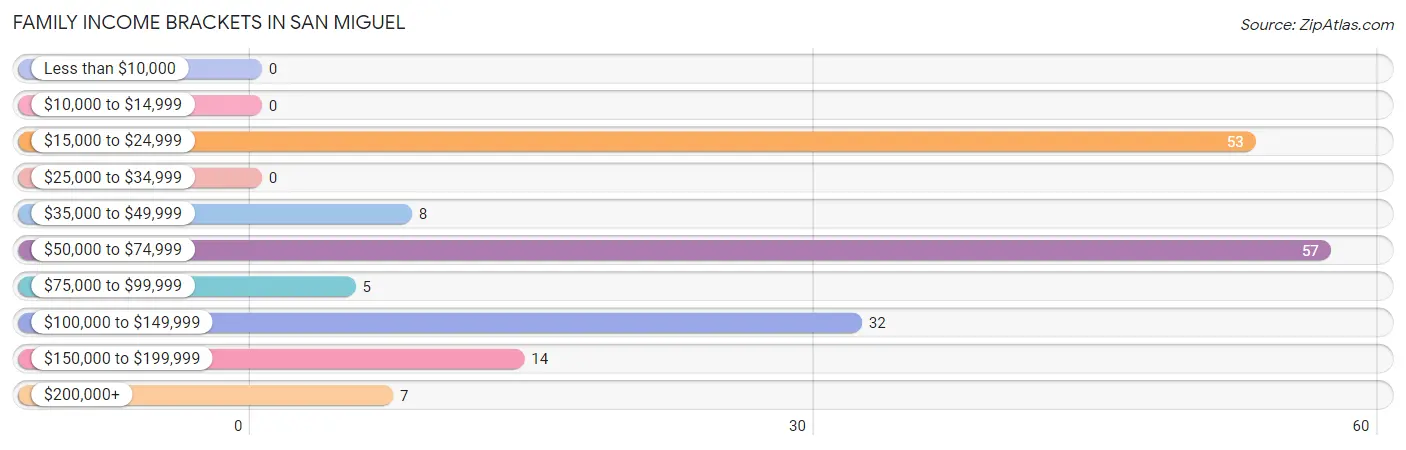
| Income Bracket | # Families | % Families |
| Less than $10,000 | 0 | 0.0% |
| $10,000 to $14,999 | 0 | 0.0% |
| $15,000 to $24,999 | 53 | 30.1% |
| $25,000 to $34,999 | 0 | 0.0% |
| $35,000 to $49,999 | 8 | 4.5% |
| $50,000 to $74,999 | 57 | 32.4% |
| $75,000 to $99,999 | 5 | 2.8% |
| $100,000 to $149,999 | 32 | 18.2% |
| $150,000 to $199,999 | 14 | 8.0% |
| $200,000+ | 7 | 4.0% |
Family Income by Famaliy Size in San Miguel
3-person families (51 | 29.0%) account for the highest median family income in San Miguel with $134,471 per family, while 3-person families (51 | 29.0%) have the highest median income of $44,824 per family member.
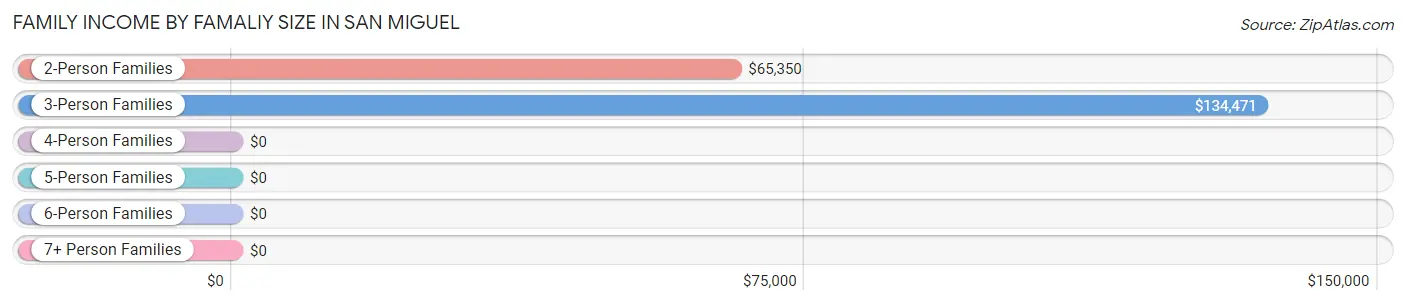
| Income Bracket | # Families | Median Income |
| 2-Person Families | 57 (32.4%) | $65,350 |
| 3-Person Families | 51 (29.0%) | $134,471 |
| 4-Person Families | 53 (30.1%) | $0 |
| 5-Person Families | 6 (3.4%) | $0 |
| 6-Person Families | 0 (0.0%) | $0 |
| 7+ Person Families | 9 (5.1%) | $0 |
| Total | 176 (100.0%) | $66,000 |
Family Income by Number of Earners in San Miguel
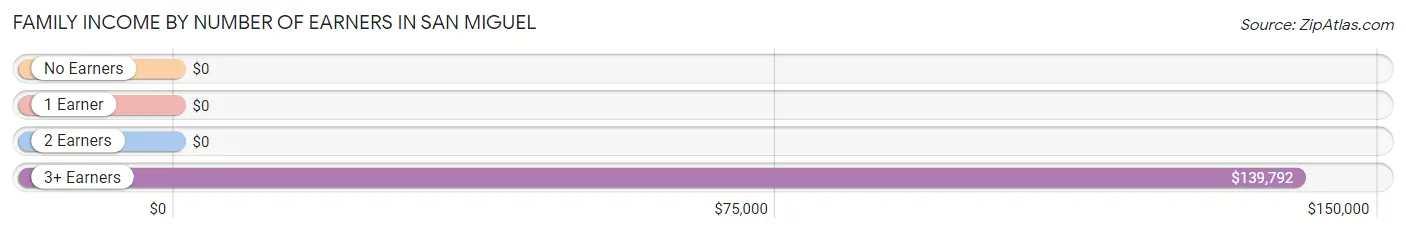
| Number of Earners | # Families | Median Income |
| No Earners | 13 (7.4%) | $0 |
| 1 Earner | 101 (57.4%) | $0 |
| 2 Earners | 33 (18.8%) | $0 |
| 3+ Earners | 29 (16.5%) | $139,792 |
| Total | 176 (100.0%) | $66,000 |
Household Income in San Miguel
Household Income Brackets in San Miguel
With 63 households falling in the category, the $15,000 to $24,999 income range is the most frequent in San Miguel, accounting for 27.8% of all households.
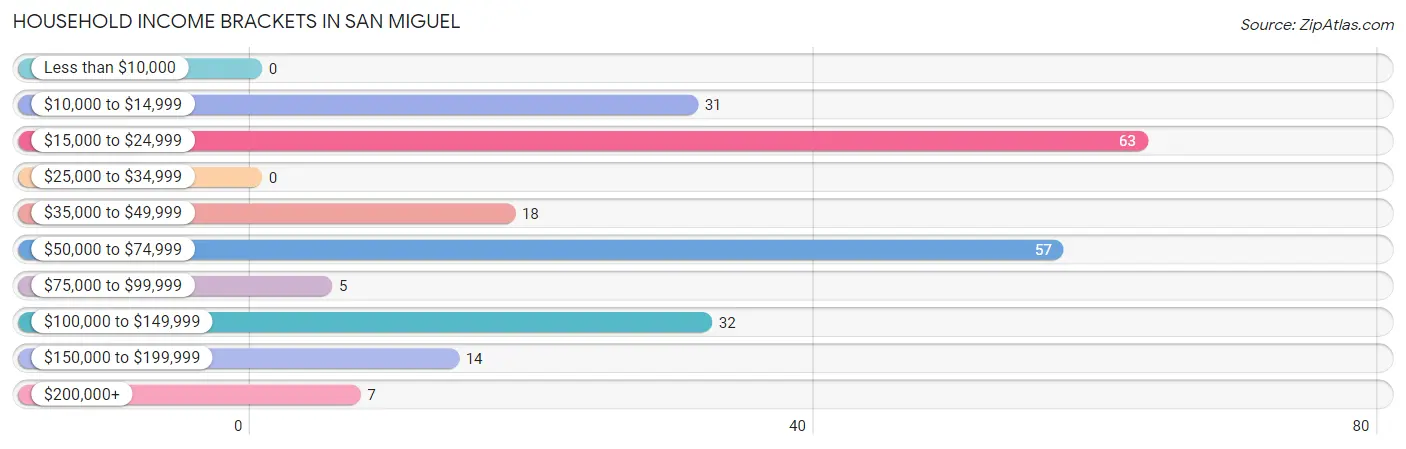
| Income Bracket | # Households | % Households |
| Less than $10,000 | 0 | 0.0% |
| $10,000 to $14,999 | 31 | 13.7% |
| $15,000 to $24,999 | 63 | 27.8% |
| $25,000 to $34,999 | 0 | 0.0% |
| $35,000 to $49,999 | 18 | 7.9% |
| $50,000 to $74,999 | 57 | 25.1% |
| $75,000 to $99,999 | 5 | 2.2% |
| $100,000 to $149,999 | 32 | 14.1% |
| $150,000 to $199,999 | 14 | 6.2% |
| $200,000+ | 7 | 3.1% |
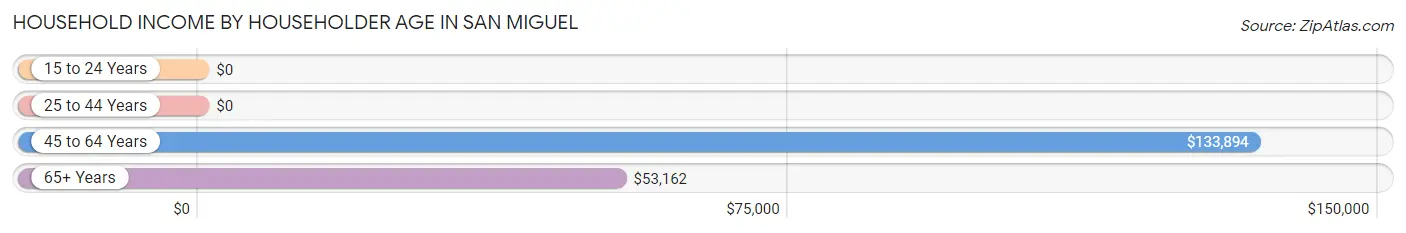
Household Income by Householder Age in San Miguel
The median household income in San Miguel is $52,721, with the highest median household income of $133,894 found in the 45 to 64 years age bracket for the primary householder. A total of 63 households (27.8%) fall into this category.
| Income Bracket | # Households | Median Income |
| 15 to 24 Years | 0 (0.0%) | $0 |
| 25 to 44 Years | 53 (23.4%) | $0 |
| 45 to 64 Years | 63 (27.8%) | $133,894 |
| 65+ Years | 111 (48.9%) | $53,162 |
| Total | 227 (100.0%) | $52,721 |
Poverty in San Miguel
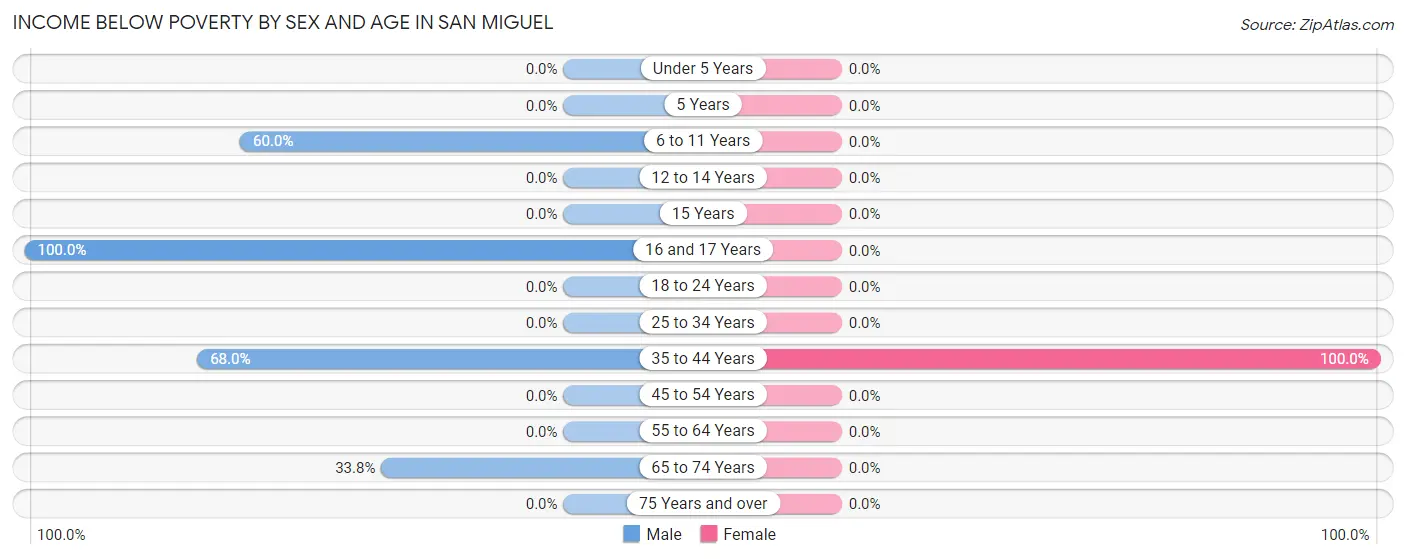
Income Below Poverty by Sex and Age in San Miguel
With 32.4% poverty level for males and 13.2% for females among the residents of San Miguel, 16 and 17 year old males and 35 to 44 year old females are the most vulnerable to poverty, with 21 males (100.0%) and 30 females (100.0%) in their respective age groups living below the poverty level.
| Age Bracket | Male | Female |
| Under 5 Years | 0 (0.0%) | 0 (0.0%) |
| 5 Years | 0 (0.0%) | 0 (0.0%) |
| 6 to 11 Years | 21 (60.0%) | 0 (0.0%) |
| 12 to 14 Years | 0 (0.0%) | 0 (0.0%) |
| 15 Years | 0 (0.0%) | 0 (0.0%) |
| 16 and 17 Years | 21 (100.0%) | 0 (0.0%) |
| 18 to 24 Years | 0 (0.0%) | 0 (0.0%) |
| 25 to 34 Years | 0 (0.0%) | 0 (0.0%) |
| 35 to 44 Years | 53 (67.9%) | 30 (100.0%) |
| 45 to 54 Years | 0 (0.0%) | 0 (0.0%) |
| 55 to 64 Years | 0 (0.0%) | 0 (0.0%) |
| 65 to 74 Years | 24 (33.8%) | 0 (0.0%) |
| 75 Years and over | 0 (0.0%) | 0 (0.0%) |
| Total | 119 (32.4%) | 30 (13.2%) |
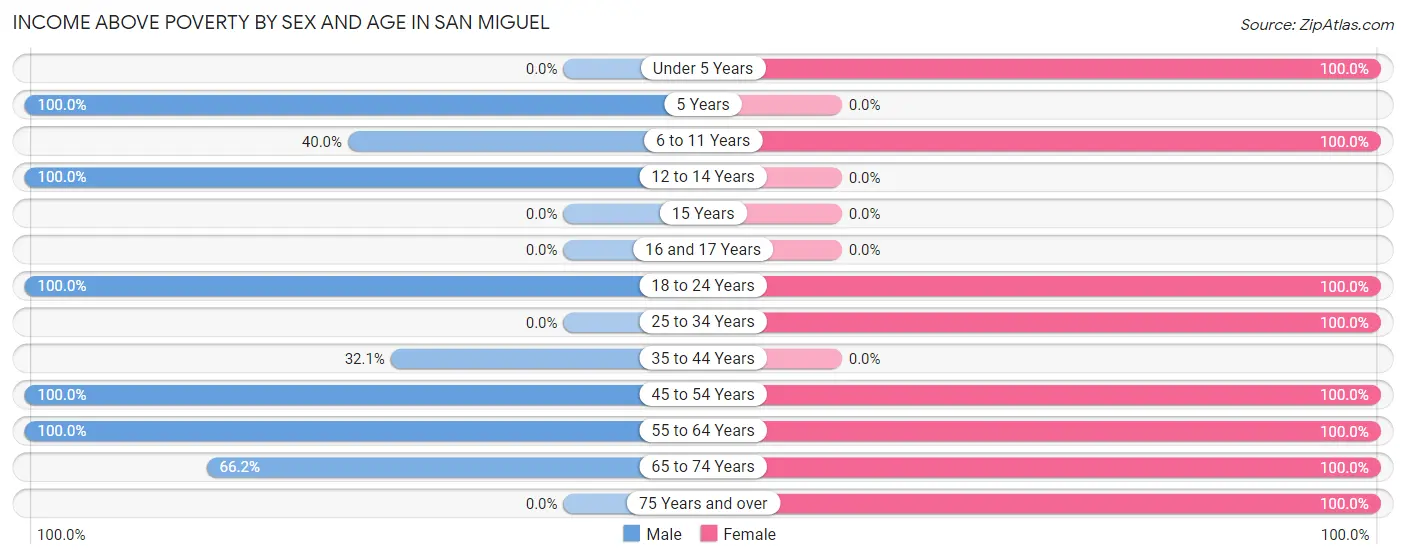
Income Above Poverty by Sex and Age in San Miguel
According to the poverty statistics in San Miguel, males aged 5 years and females aged under 5 years are the age groups that are most secure financially, with 100.0% of males and 100.0% of females in these age groups living above the poverty line.
| Age Bracket | Male | Female |
| Under 5 Years | 0 (0.0%) | 11 (100.0%) |
| 5 Years | 7 (100.0%) | 0 (0.0%) |
| 6 to 11 Years | 14 (40.0%) | 25 (100.0%) |
| 12 to 14 Years | 11 (100.0%) | 0 (0.0%) |
| 15 Years | 0 (0.0%) | 0 (0.0%) |
| 16 and 17 Years | 0 (0.0%) | 0 (0.0%) |
| 18 to 24 Years | 52 (100.0%) | 8 (100.0%) |
| 25 to 34 Years | 0 (0.0%) | 31 (100.0%) |
| 35 to 44 Years | 25 (32.1%) | 0 (0.0%) |
| 45 to 54 Years | 44 (100.0%) | 48 (100.0%) |
| 55 to 64 Years | 48 (100.0%) | 20 (100.0%) |
| 65 to 74 Years | 47 (66.2%) | 44 (100.0%) |
| 75 Years and over | 0 (0.0%) | 10 (100.0%) |
| Total | 248 (67.6%) | 197 (86.8%) |
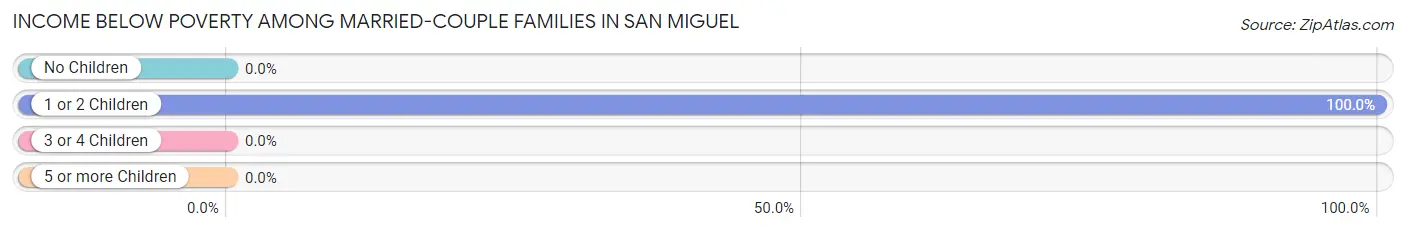
Income Below Poverty Among Married-Couple Families in San Miguel
The poverty statistics for married-couple families in San Miguel show that 43.8% or 53 of the total 121 families live below the poverty line. Families with 1 or 2 children have the highest poverty rate of 100.0%, comprising of 53 families. On the other hand, families with no children have the lowest poverty rate of 0.0%, which includes 0 families.
| Children | Above Poverty | Below Poverty |
| No Children | 59 (100.0%) | 0 (0.0%) |
| 1 or 2 Children | 0 (0.0%) | 53 (100.0%) |
| 3 or 4 Children | 9 (100.0%) | 0 (0.0%) |
| 5 or more Children | 0 (0.0%) | 0 (0.0%) |
| Total | 68 (56.2%) | 53 (43.8%) |
Income Below Poverty Among Single-Parent Households in San Miguel
| Children | Single Father | Single Mother |
| No Children | 0 (0.0%) | 0 (0.0%) |
| 1 or 2 Children | 0 (0.0%) | 0 (0.0%) |
| 3 or 4 Children | 0 (0.0%) | 0 (0.0%) |
| 5 or more Children | 0 (0.0%) | 0 (0.0%) |
| Total | 0 (0.0%) | 0 (0.0%) |
Income Below Poverty Among Married-Couple vs Single-Parent Households in San Miguel
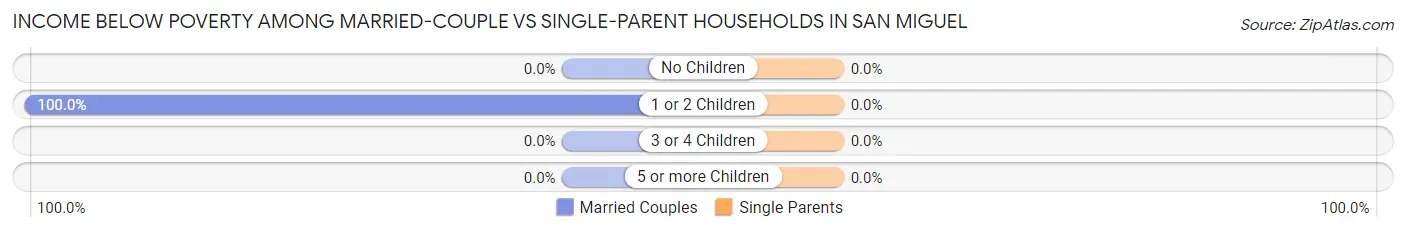
| Children | Married-Couple Families | Single-Parent Households |
| No Children | 0 (0.0%) | 0 (0.0%) |
| 1 or 2 Children | 53 (100.0%) | 0 (0.0%) |
| 3 or 4 Children | 0 (0.0%) | 0 (0.0%) |
| 5 or more Children | 0 (0.0%) | 0 (0.0%) |
| Total | 53 (43.8%) | 0 (0.0%) |
Race in San Miguel
The most populous races in San Miguel are Hispanic or Latino (564 | 95.0%), White / Caucasian (316 | 53.2%), and Two or more Races (177 | 29.8%).
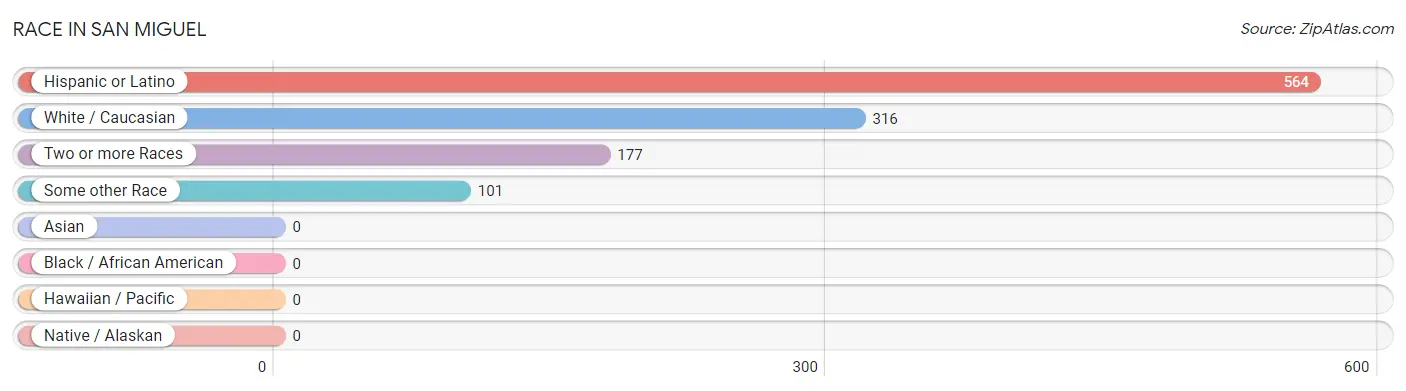
| Race | # Population | % Population |
| Asian | 0 | 0.0% |
| Black / African American | 0 | 0.0% |
| Hawaiian / Pacific | 0 | 0.0% |
| Hispanic or Latino | 564 | 95.0% |
| Native / Alaskan | 0 | 0.0% |
| White / Caucasian | 316 | 53.2% |
| Two or more Races | 177 | 29.8% |
| Some other Race | 101 | 17.0% |
| Total | 594 | 100.0% |
Ancestry in San Miguel
The most populous ancestries reported in San Miguel are Mexican (564 | 95.0%), Irish (16 | 2.7%), and American (7 | 1.2%), together accounting for 98.8% of all San Miguel residents.
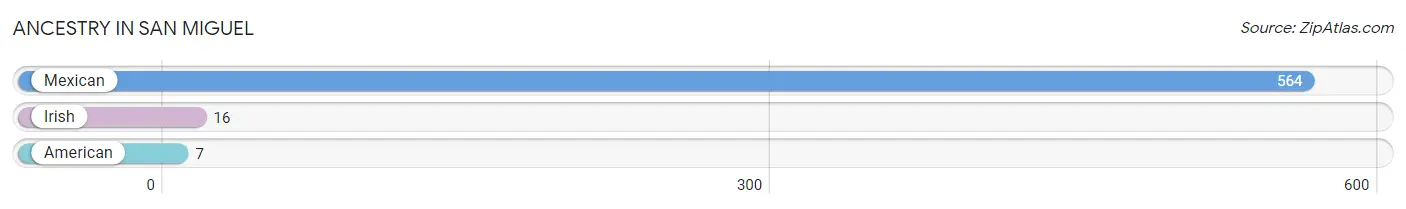
| Ancestry | # Population | % Population |
| American | 7 | 1.2% |
| Irish | 16 | 2.7% |
| Mexican | 564 | 95.0% | View All 3 Rows |
Immigrants in San Miguel
The most numerous immigrant groups reported in San Miguel came from Central America (82 | 13.8%), Latin America (82 | 13.8%), and Mexico (82 | 13.8%), together accounting for 41.4% of all San Miguel residents.
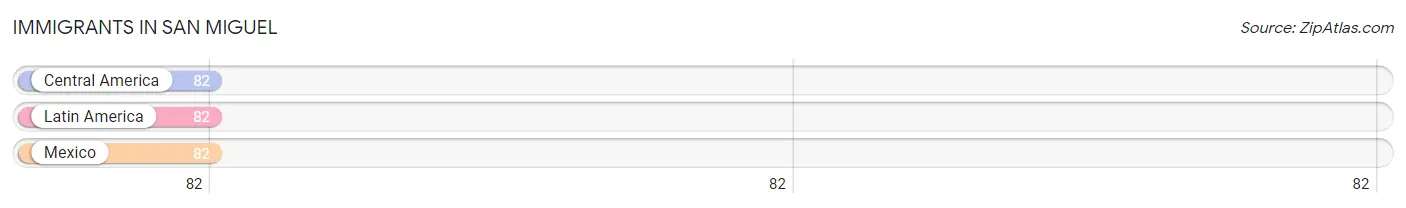
| Immigration Origin | # Population | % Population |
| Central America | 82 | 13.8% |
| Latin America | 82 | 13.8% |
| Mexico | 82 | 13.8% | View All 3 Rows |
Sex and Age in San Miguel
Sex and Age in San Miguel
The most populous age groups in San Miguel are 35 to 39 Years (78 | 21.2%) for men and 35 to 39 Years (30 | 13.2%) for women.
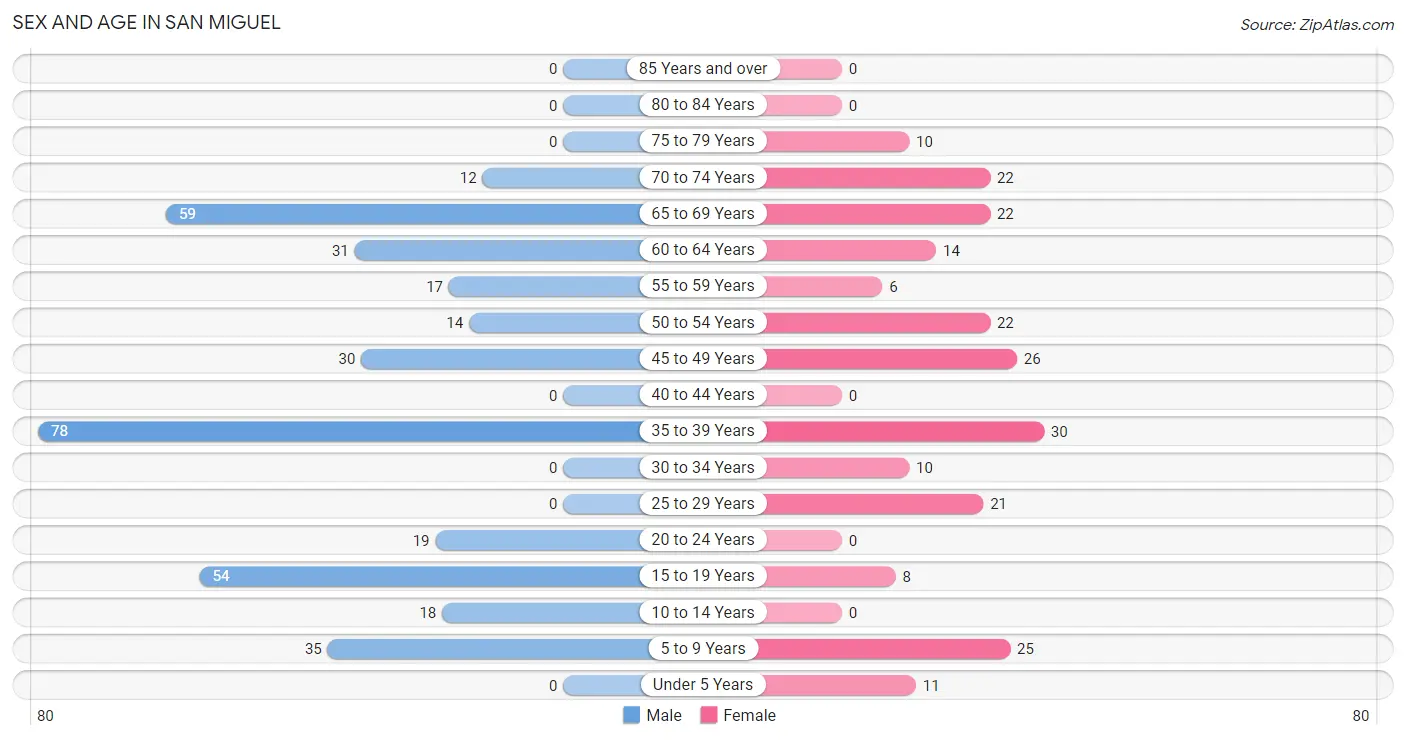
| Age Bracket | Male | Female |
| Under 5 Years | 0 (0.0%) | 11 (4.9%) |
| 5 to 9 Years | 35 (9.5%) | 25 (11.0%) |
| 10 to 14 Years | 18 (4.9%) | 0 (0.0%) |
| 15 to 19 Years | 54 (14.7%) | 8 (3.5%) |
| 20 to 24 Years | 19 (5.2%) | 0 (0.0%) |
| 25 to 29 Years | 0 (0.0%) | 21 (9.2%) |
| 30 to 34 Years | 0 (0.0%) | 10 (4.4%) |
| 35 to 39 Years | 78 (21.2%) | 30 (13.2%) |
| 40 to 44 Years | 0 (0.0%) | 0 (0.0%) |
| 45 to 49 Years | 30 (8.2%) | 26 (11.5%) |
| 50 to 54 Years | 14 (3.8%) | 22 (9.7%) |
| 55 to 59 Years | 17 (4.6%) | 6 (2.6%) |
| 60 to 64 Years | 31 (8.5%) | 14 (6.2%) |
| 65 to 69 Years | 59 (16.1%) | 22 (9.7%) |
| 70 to 74 Years | 12 (3.3%) | 22 (9.7%) |
| 75 to 79 Years | 0 (0.0%) | 10 (4.4%) |
| 80 to 84 Years | 0 (0.0%) | 0 (0.0%) |
| 85 Years and over | 0 (0.0%) | 0 (0.0%) |
| Total | 367 (100.0%) | 227 (100.0%) |
Families and Households in San Miguel
Median Family Size in San Miguel
The median family size in San Miguel is 3.09 persons per family, with married-couple families (121 | 68.8%) accounting for the largest median family size of 3.36 persons per family. On the other hand, single female/mother families (17 | 9.7%) represent the smallest median family size with 2.47 persons per family.
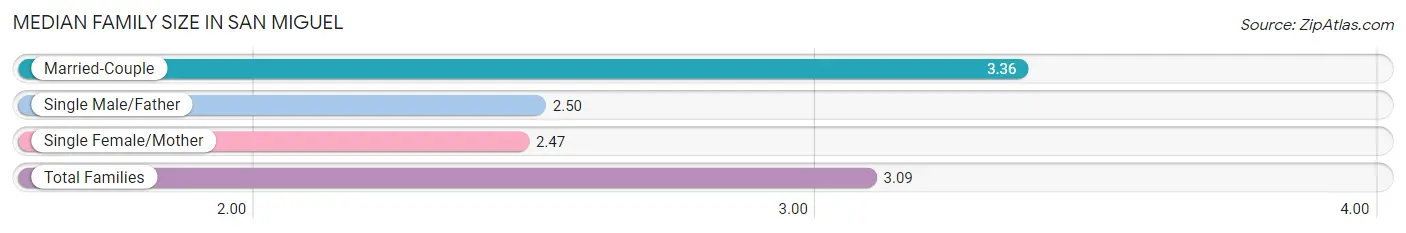
| Family Type | # Families | Family Size |
| Married-Couple | 121 (68.8%) | 3.36 |
| Single Male/Father | 38 (21.6%) | 2.50 |
| Single Female/Mother | 17 (9.7%) | 2.47 |
| Total Families | 176 (100.0%) | 3.09 |
Median Household Size in San Miguel
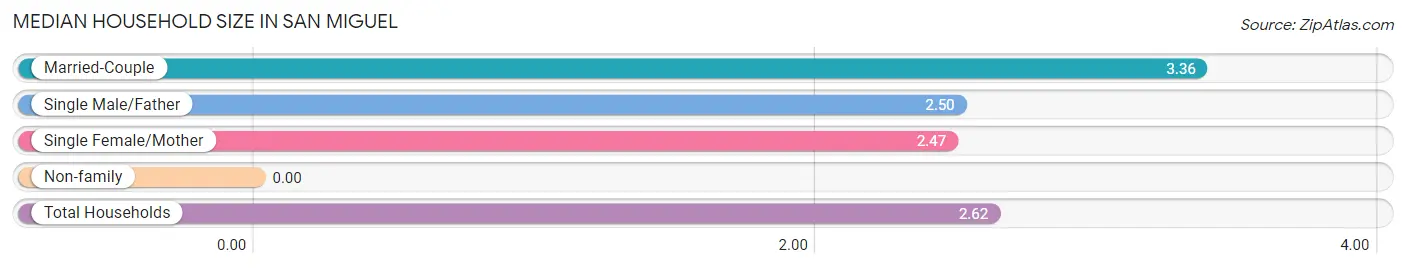
| Household Type | # Households | Household Size |
| Married-Couple | 121 (53.3%) | 3.36 |
| Single Male/Father | 38 (16.7%) | 2.50 |
| Single Female/Mother | 17 (7.5%) | 2.47 |
| Non-family | 51 (22.5%) | - |
| Total Households | 227 (100.0%) | 2.62 |
Household Size by Marriage Status in San Miguel
Out of a total of 227 households in San Miguel, 176 (77.5%) are family households, while 51 (22.5%) are nonfamily households. The most numerous type of family households are 2-person households, comprising 57, and the most common type of nonfamily households are 1-person households, comprising 51.
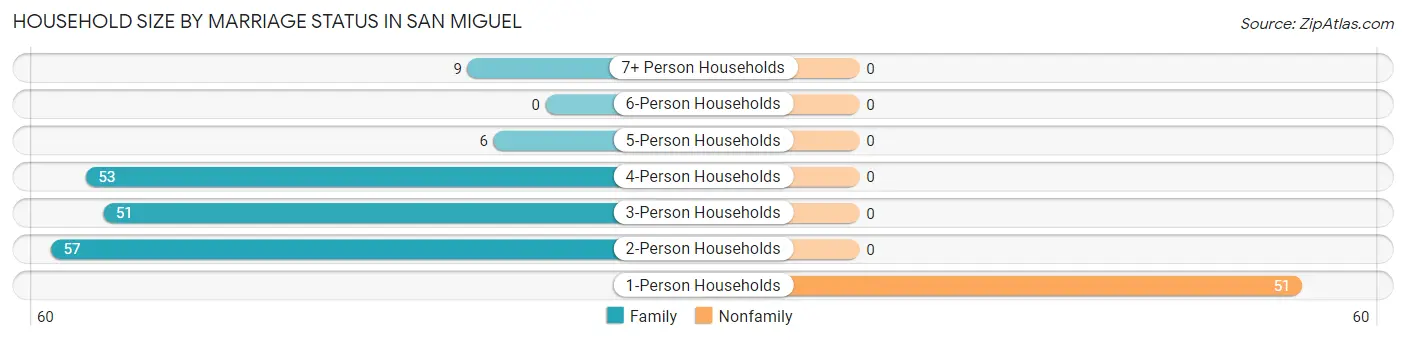
| Household Size | Family Households | Nonfamily Households |
| 1-Person Households | - | 51 (22.5%) |
| 2-Person Households | 57 (25.1%) | 0 (0.0%) |
| 3-Person Households | 51 (22.5%) | 0 (0.0%) |
| 4-Person Households | 53 (23.4%) | 0 (0.0%) |
| 5-Person Households | 6 (2.6%) | 0 (0.0%) |
| 6-Person Households | 0 (0.0%) | 0 (0.0%) |
| 7+ Person Households | 9 (4.0%) | 0 (0.0%) |
| Total | 176 (77.5%) | 51 (22.5%) |
Female Fertility in San Miguel
Fertility by Age in San Miguel
Average fertility rate in San Miguel is 147.0 births per 1,000 women. Women in the age bracket of 20 to 34 years have the highest fertility rate with 452.0 births per 1,000 women. Women in the age bracket of 20 to 34 years acount for 100.0% of all women with births.
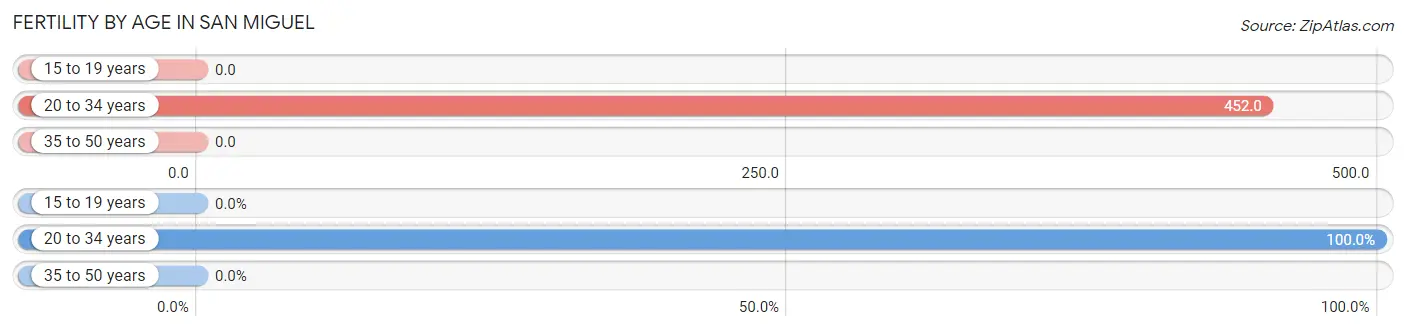
| Age Bracket | Women with Births | Births / 1,000 Women |
| 15 to 19 years | 0 (0.0%) | 0.0 |
| 20 to 34 years | 14 (100.0%) | 452.0 |
| 35 to 50 years | 0 (0.0%) | 0.0 |
| Total | 14 (100.0%) | 147.0 |
Fertility by Age by Marriage Status in San Miguel
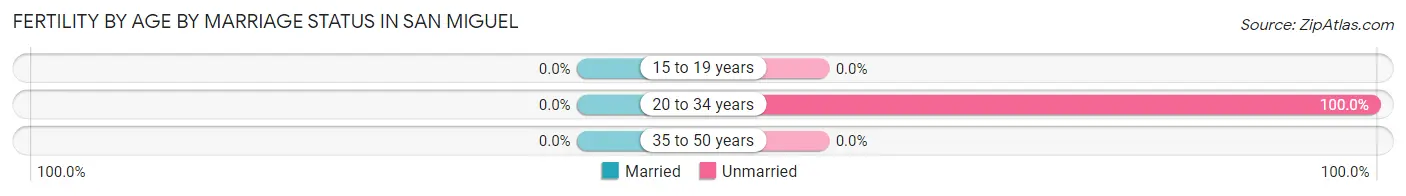
| Age Bracket | Married | Unmarried |
| 15 to 19 years | 0 (0.0%) | 0 (0.0%) |
| 20 to 34 years | 0 (0.0%) | 14 (100.0%) |
| 35 to 50 years | 0 (0.0%) | 0 (0.0%) |
| Total | 0 (0.0%) | 14 (100.0%) |
Fertility by Education in San Miguel
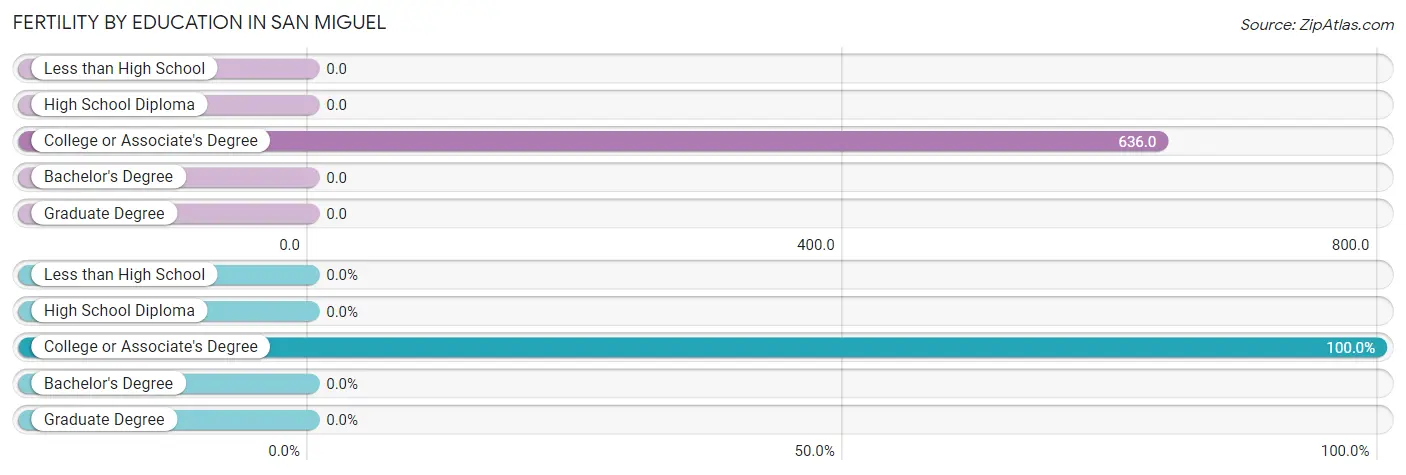
| Educational Attainment | Women with Births | Births / 1,000 Women |
| Less than High School | 0 (0.0%) | 0.0 |
| High School Diploma | 0 (0.0%) | 0.0 |
| College or Associate's Degree | 14 (100.0%) | 636.0 |
| Bachelor's Degree | 0 (0.0%) | 0.0 |
| Graduate Degree | 0 (0.0%) | 0.0 |
| Total | 14 (100.0%) | 147.0 |
Fertility by Education by Marriage Status in San Miguel
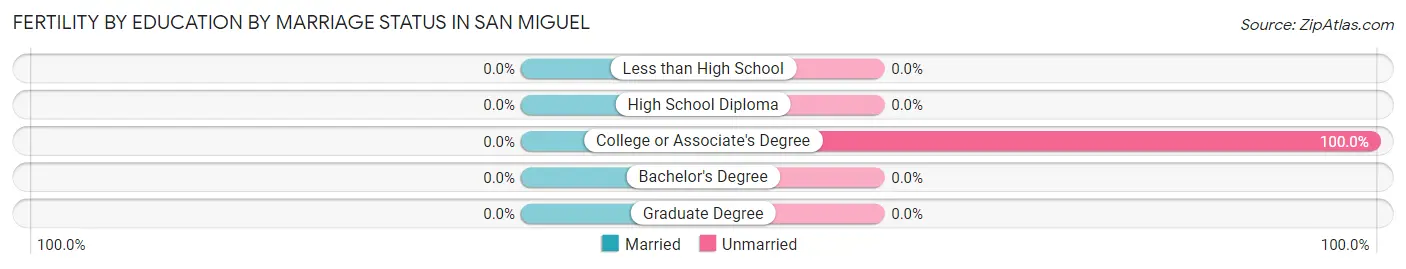
| Educational Attainment | Married | Unmarried |
| Less than High School | 0 (0.0%) | 0 (0.0%) |
| High School Diploma | 0 (0.0%) | 0 (0.0%) |
| College or Associate's Degree | 0 (0.0%) | 14 (100.0%) |
| Bachelor's Degree | 0 (0.0%) | 0 (0.0%) |
| Graduate Degree | 0 (0.0%) | 0 (0.0%) |
| Total | 0 (0.0%) | 14 (100.0%) |
Employment Characteristics in San Miguel
Employment by Class of Employer in San Miguel
Among the 284 employed individuals in San Miguel, private company employees (130 | 45.8%), local government employees (68 | 23.9%), and self-employed (incorporated) (60 | 21.1%) make up the most common classes of employment.
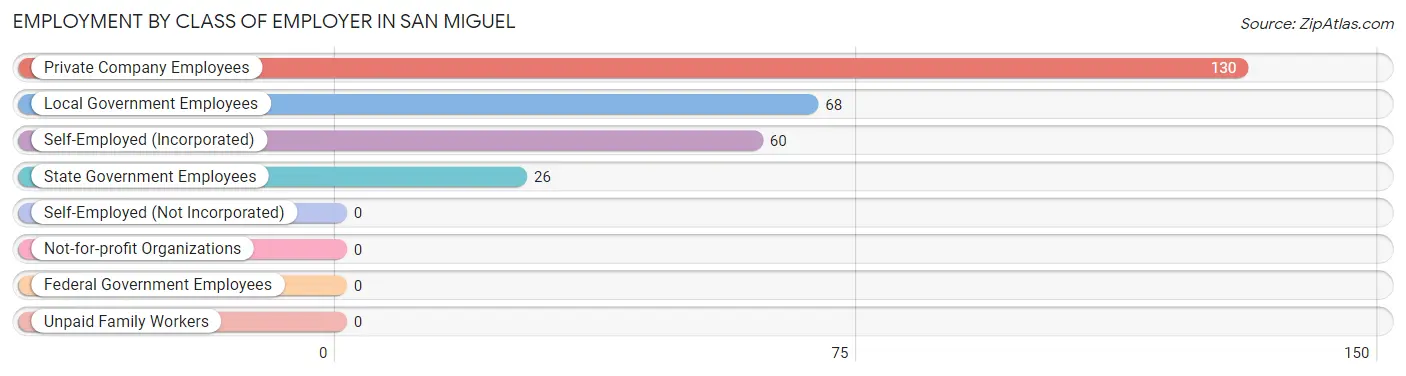
| Employer Class | # Employees | % Employees |
| Private Company Employees | 130 | 45.8% |
| Self-Employed (Incorporated) | 60 | 21.1% |
| Self-Employed (Not Incorporated) | 0 | 0.0% |
| Not-for-profit Organizations | 0 | 0.0% |
| Local Government Employees | 68 | 23.9% |
| State Government Employees | 26 | 9.1% |
| Federal Government Employees | 0 | 0.0% |
| Unpaid Family Workers | 0 | 0.0% |
| Total | 284 | 100.0% |
Employment Status by Age in San Miguel
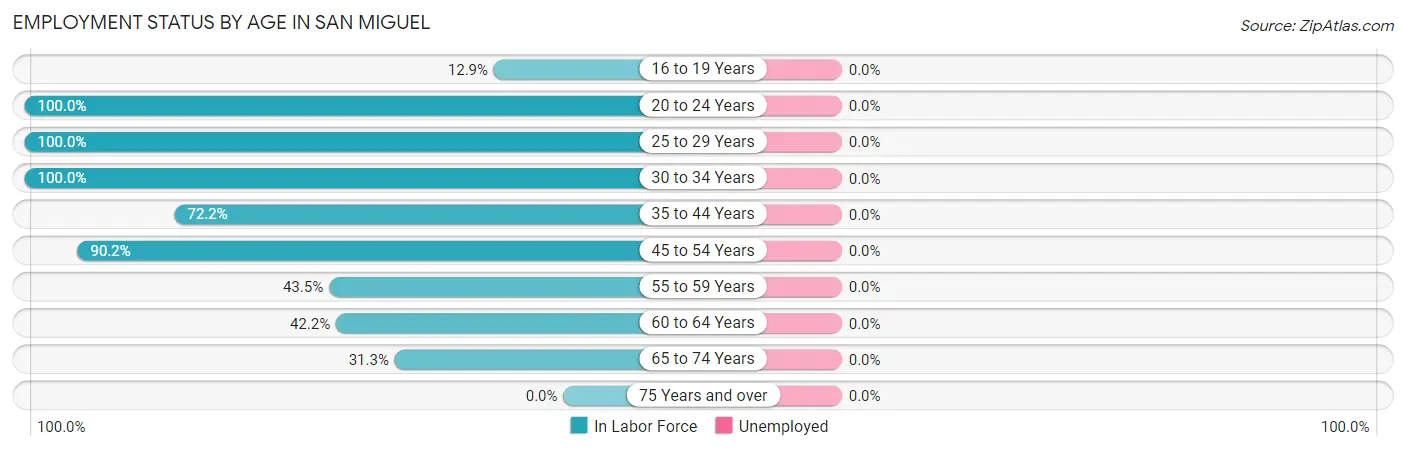
| Age Bracket | In Labor Force | Unemployed |
| 16 to 19 Years | 8 (12.9%) | 0 (0.0%) |
| 20 to 24 Years | 19 (100.0%) | 0 (0.0%) |
| 25 to 29 Years | 21 (100.0%) | 0 (0.0%) |
| 30 to 34 Years | 10 (100.0%) | 0 (0.0%) |
| 35 to 44 Years | 78 (72.2%) | 0 (0.0%) |
| 45 to 54 Years | 83 (90.2%) | 0 (0.0%) |
| 55 to 59 Years | 10 (43.5%) | 0 (0.0%) |
| 60 to 64 Years | 19 (42.2%) | 0 (0.0%) |
| 65 to 74 Years | 36 (31.3%) | 0 (0.0%) |
| 75 Years and over | 0 (0.0%) | 0 (0.0%) |
| Total | 284 (56.2%) | 0 (0.0%) |
Employment Status by Educational Attainment in San Miguel
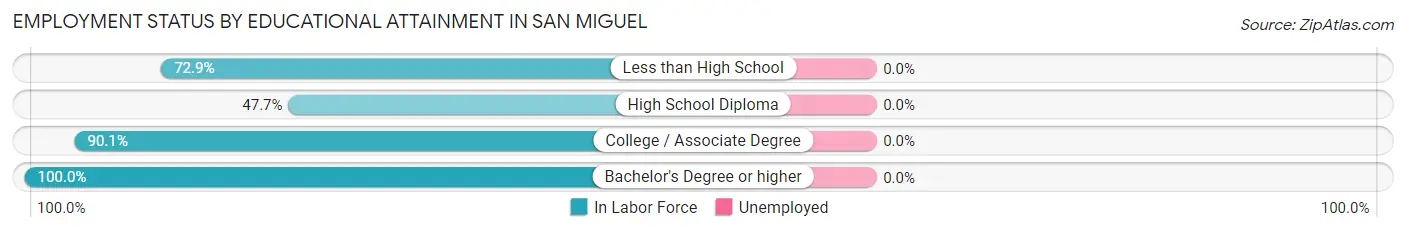
| Educational Attainment | In Labor Force | Unemployed |
| Less than High School | 70 (72.9%) | 0 (0.0%) |
| High School Diploma | 41 (47.7%) | 0 (0.0%) |
| College / Associate Degree | 64 (90.1%) | 0 (0.0%) |
| Bachelor's Degree or higher | 46 (100.0%) | 0 (0.0%) |
| Total | 221 (73.9%) | 0 (0.0%) |
Employment Occupations by Sex in San Miguel
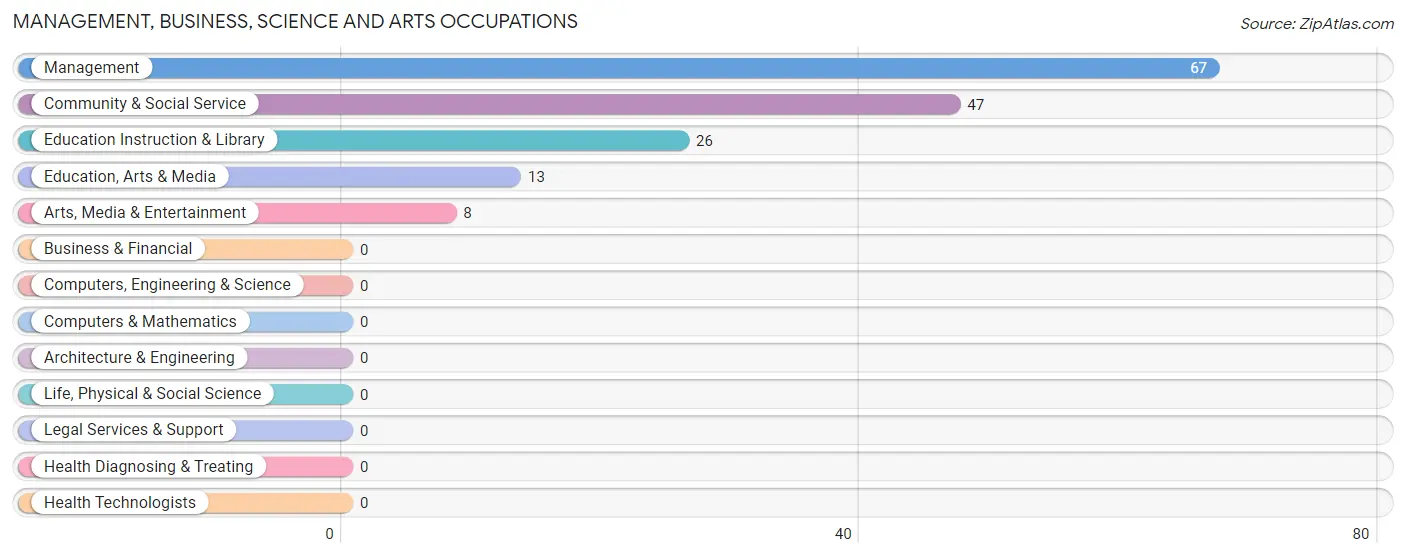
Management, Business, Science and Arts Occupations
The most common Management, Business, Science and Arts occupations in San Miguel are Management (67 | 23.6%), Community & Social Service (47 | 16.6%), Education Instruction & Library (26 | 9.1%), Education, Arts & Media (13 | 4.6%), and Arts, Media & Entertainment (8 | 2.8%).
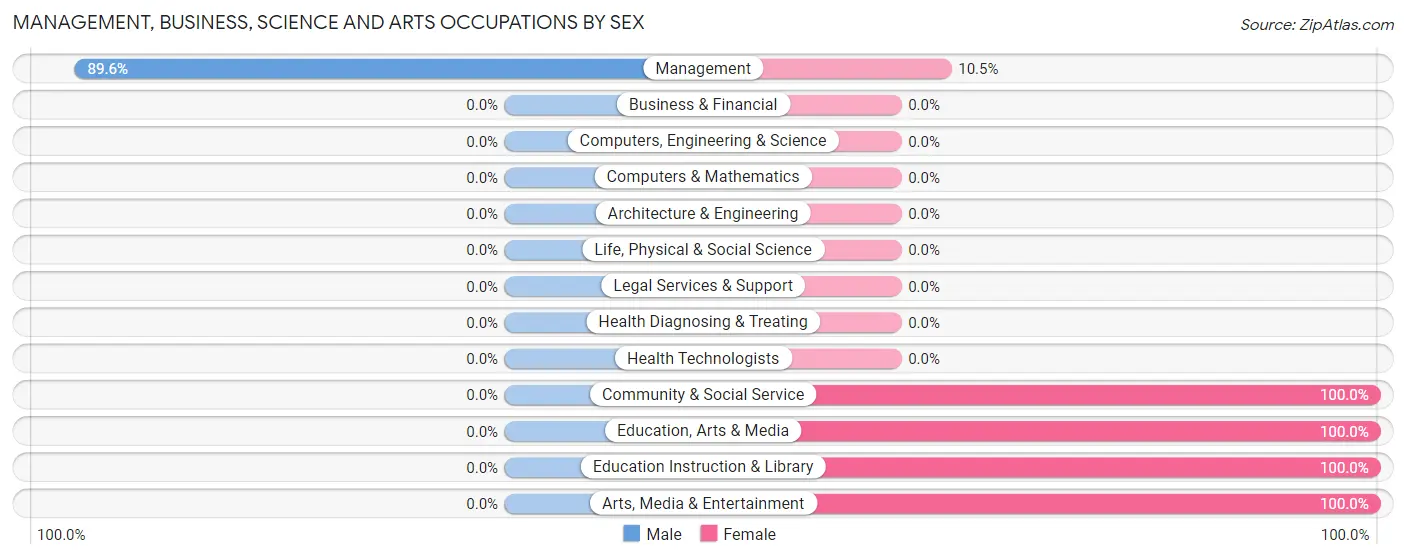
Management, Business, Science and Arts Occupations by Sex
| Occupation | Male | Female |
| Management | 60 (89.5%) | 7 (10.4%) |
| Business & Financial | 0 (0.0%) | 0 (0.0%) |
| Computers, Engineering & Science | 0 (0.0%) | 0 (0.0%) |
| Computers & Mathematics | 0 (0.0%) | 0 (0.0%) |
| Architecture & Engineering | 0 (0.0%) | 0 (0.0%) |
| Life, Physical & Social Science | 0 (0.0%) | 0 (0.0%) |
| Community & Social Service | 0 (0.0%) | 47 (100.0%) |
| Education, Arts & Media | 0 (0.0%) | 13 (100.0%) |
| Legal Services & Support | 0 (0.0%) | 0 (0.0%) |
| Education Instruction & Library | 0 (0.0%) | 26 (100.0%) |
| Arts, Media & Entertainment | 0 (0.0%) | 8 (100.0%) |
| Health Diagnosing & Treating | 0 (0.0%) | 0 (0.0%) |
| Health Technologists | 0 (0.0%) | 0 (0.0%) |
| Total (Category) | 60 (52.6%) | 54 (47.4%) |
| Total (Overall) | 193 (68.0%) | 91 (32.0%) |
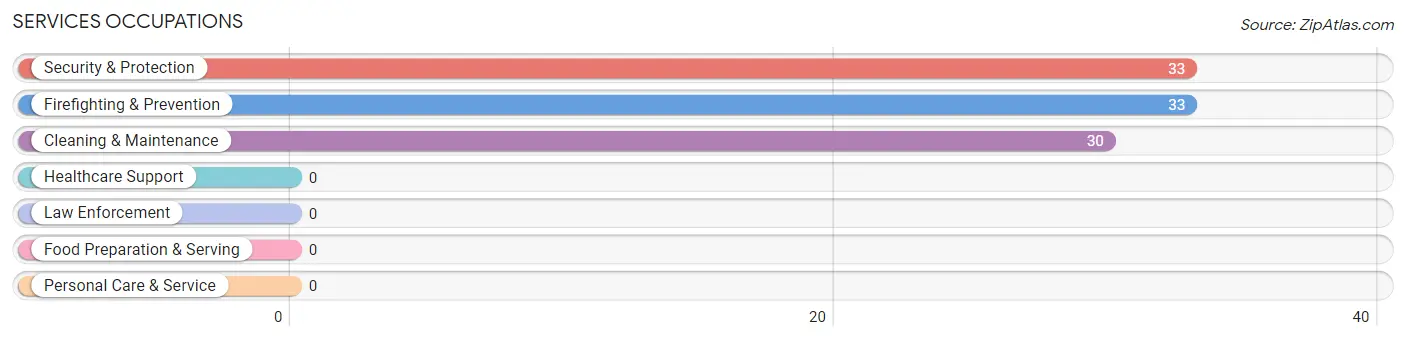
Services Occupations
The most common Services occupations in San Miguel are Security & Protection (33 | 11.6%), Firefighting & Prevention (33 | 11.6%), and Cleaning & Maintenance (30 | 10.6%).
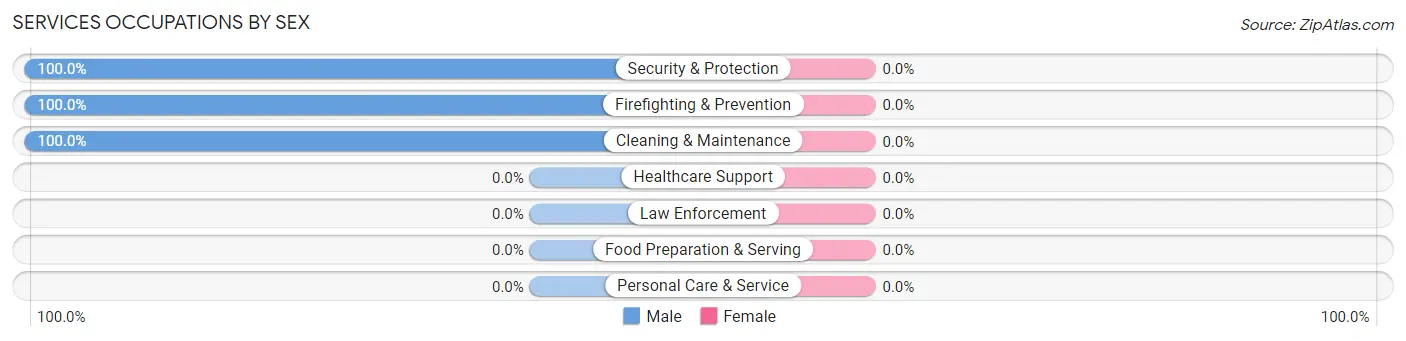
Services Occupations by Sex
| Occupation | Male | Female |
| Healthcare Support | 0 (0.0%) | 0 (0.0%) |
| Security & Protection | 33 (100.0%) | 0 (0.0%) |
| Firefighting & Prevention | 33 (100.0%) | 0 (0.0%) |
| Law Enforcement | 0 (0.0%) | 0 (0.0%) |
| Food Preparation & Serving | 0 (0.0%) | 0 (0.0%) |
| Cleaning & Maintenance | 30 (100.0%) | 0 (0.0%) |
| Personal Care & Service | 0 (0.0%) | 0 (0.0%) |
| Total (Category) | 63 (100.0%) | 0 (0.0%) |
| Total (Overall) | 193 (68.0%) | 91 (32.0%) |
Sales and Office Occupations
The most common Sales and Office occupations in San Miguel are , and Office & Administration (6 | 2.1%).
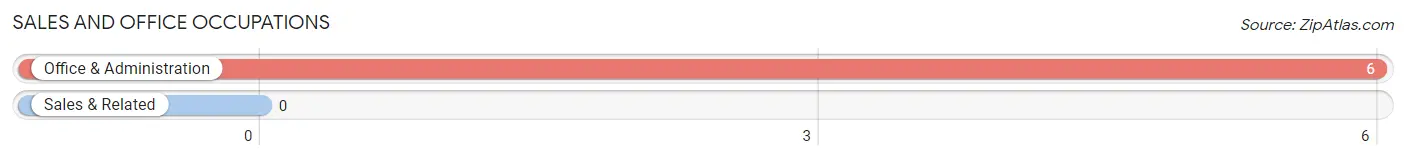
Sales and Office Occupations by Sex

| Occupation | Male | Female |
| Sales & Related | 0 (0.0%) | 0 (0.0%) |
| Office & Administration | 0 (0.0%) | 6 (100.0%) |
| Total (Category) | 0 (0.0%) | 6 (100.0%) |
| Total (Overall) | 193 (68.0%) | 91 (32.0%) |
Natural Resources, Construction and Maintenance Occupations
The most common Natural Resources, Construction and Maintenance occupations in San Miguel are Farming, Fishing & Forestry (25 | 8.8%), Installation, Maintenance & Repair (25 | 8.8%), and Construction & Extraction (16 | 5.6%).
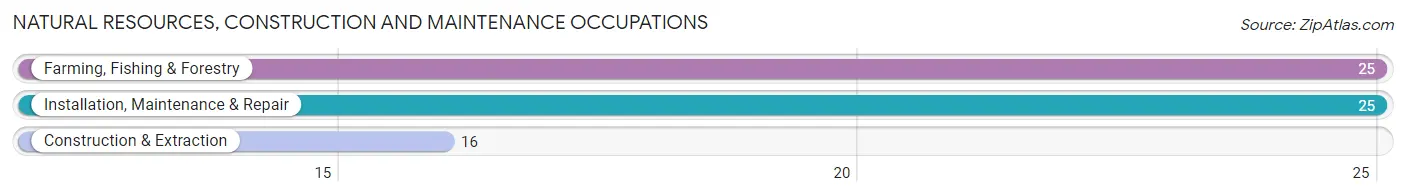
Natural Resources, Construction and Maintenance Occupations by Sex
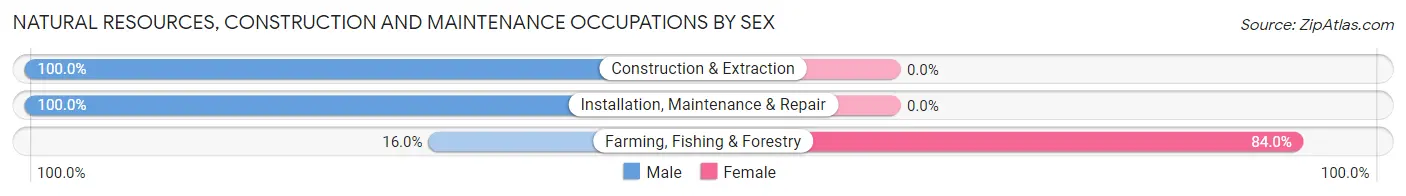
| Occupation | Male | Female |
| Farming, Fishing & Forestry | 4 (16.0%) | 21 (84.0%) |
| Construction & Extraction | 16 (100.0%) | 0 (0.0%) |
| Installation, Maintenance & Repair | 25 (100.0%) | 0 (0.0%) |
| Total (Category) | 45 (68.2%) | 21 (31.8%) |
| Total (Overall) | 193 (68.0%) | 91 (32.0%) |
Production, Transportation and Moving Occupations
The most common Production, Transportation and Moving occupations in San Miguel are , and Transportation (35 | 12.3%).
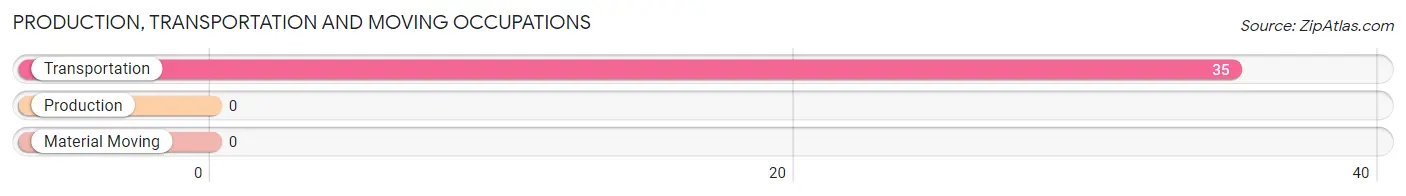
Production, Transportation and Moving Occupations by Sex
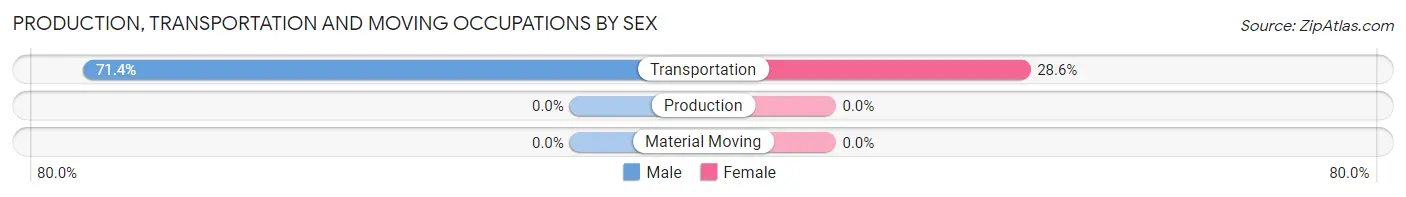
| Occupation | Male | Female |
| Production | 0 (0.0%) | 0 (0.0%) |
| Transportation | 25 (71.4%) | 10 (28.6%) |
| Material Moving | 0 (0.0%) | 0 (0.0%) |
| Total (Category) | 25 (71.4%) | 10 (28.6%) |
| Total (Overall) | 193 (68.0%) | 91 (32.0%) |
Employment Industries by Sex in San Miguel
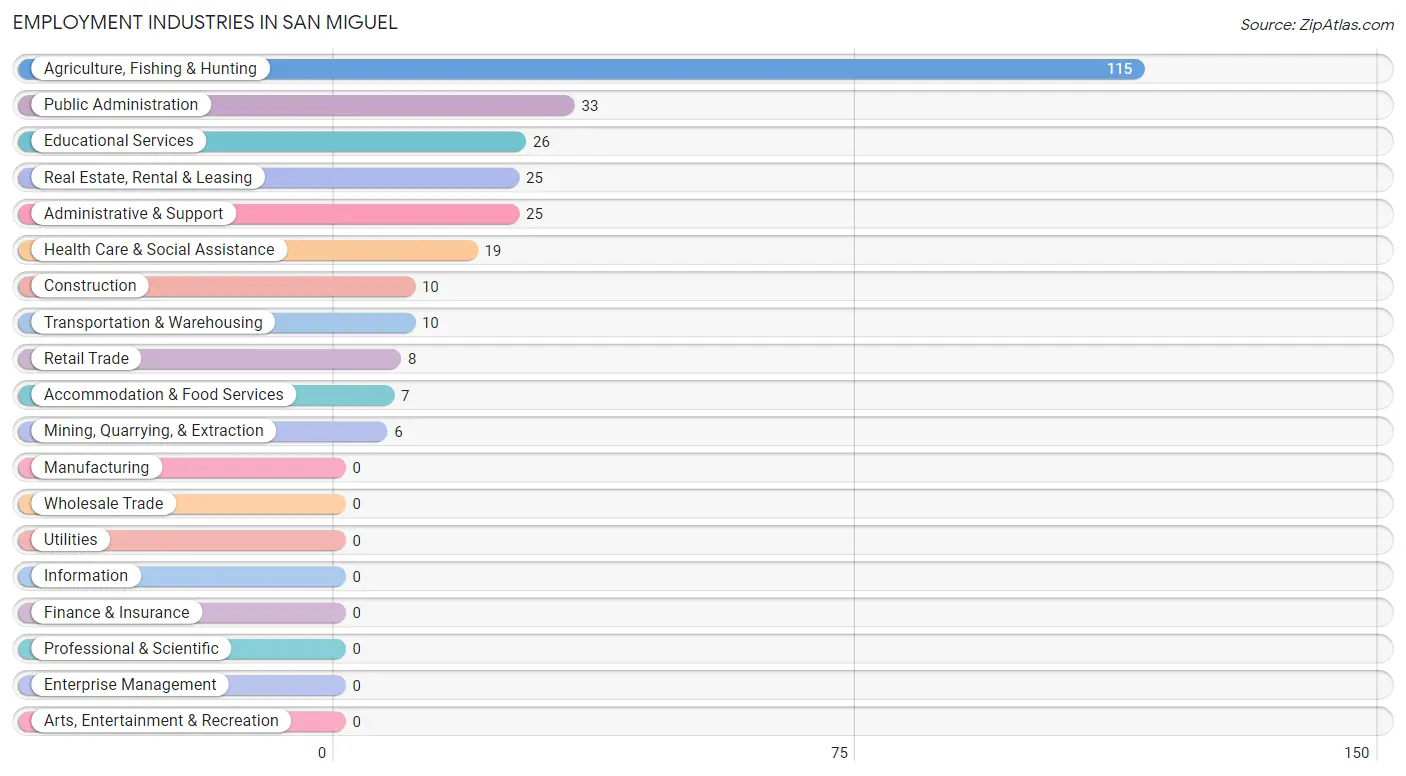
Employment Industries in San Miguel
The major employment industries in San Miguel include Agriculture, Fishing & Hunting (115 | 40.5%), Public Administration (33 | 11.6%), Educational Services (26 | 9.1%), Real Estate, Rental & Leasing (25 | 8.8%), and Administrative & Support (25 | 8.8%).
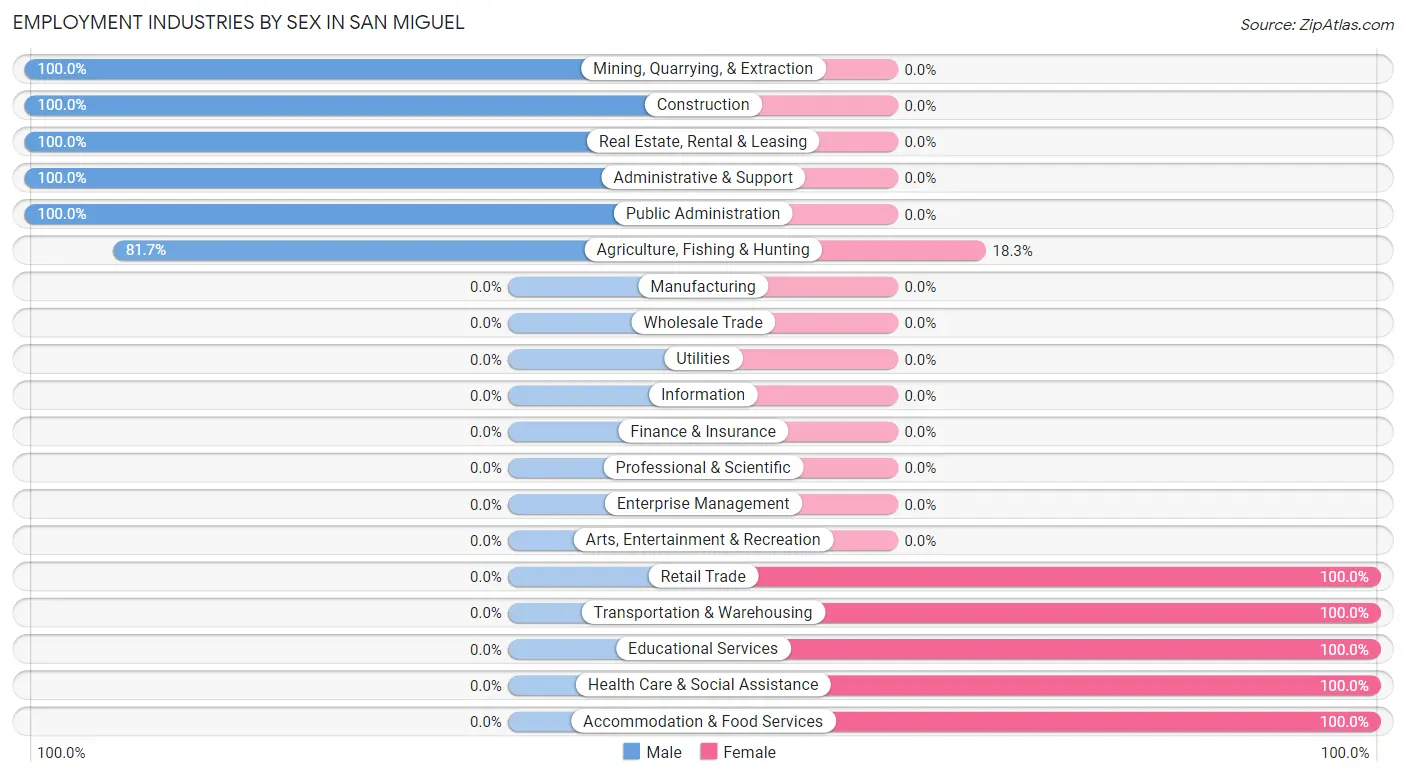
Employment Industries by Sex in San Miguel
The San Miguel industries that see more men than women are Mining, Quarrying, & Extraction (100.0%), Construction (100.0%), and Real Estate, Rental & Leasing (100.0%), whereas the industries that tend to have a higher number of women are Retail Trade (100.0%), Transportation & Warehousing (100.0%), and Educational Services (100.0%).
| Industry | Male | Female |
| Agriculture, Fishing & Hunting | 94 (81.7%) | 21 (18.3%) |
| Mining, Quarrying, & Extraction | 6 (100.0%) | 0 (0.0%) |
| Construction | 10 (100.0%) | 0 (0.0%) |
| Manufacturing | 0 (0.0%) | 0 (0.0%) |
| Wholesale Trade | 0 (0.0%) | 0 (0.0%) |
| Retail Trade | 0 (0.0%) | 8 (100.0%) |
| Transportation & Warehousing | 0 (0.0%) | 10 (100.0%) |
| Utilities | 0 (0.0%) | 0 (0.0%) |
| Information | 0 (0.0%) | 0 (0.0%) |
| Finance & Insurance | 0 (0.0%) | 0 (0.0%) |
| Real Estate, Rental & Leasing | 25 (100.0%) | 0 (0.0%) |
| Professional & Scientific | 0 (0.0%) | 0 (0.0%) |
| Enterprise Management | 0 (0.0%) | 0 (0.0%) |
| Administrative & Support | 25 (100.0%) | 0 (0.0%) |
| Educational Services | 0 (0.0%) | 26 (100.0%) |
| Health Care & Social Assistance | 0 (0.0%) | 19 (100.0%) |
| Arts, Entertainment & Recreation | 0 (0.0%) | 0 (0.0%) |
| Accommodation & Food Services | 0 (0.0%) | 7 (100.0%) |
| Public Administration | 33 (100.0%) | 0 (0.0%) |
| Total | 193 (68.0%) | 91 (32.0%) |
Education in San Miguel
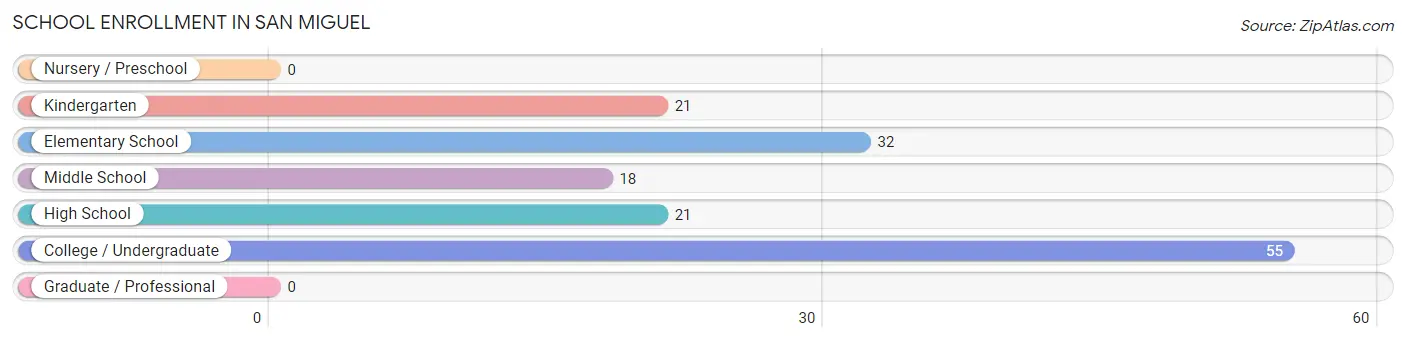
School Enrollment in San Miguel
The most common levels of schooling among the 147 students in San Miguel are college / undergraduate (55 | 37.4%), elementary school (32 | 21.8%), and kindergarten (21 | 14.3%).
| School Level | # Students | % Students |
| Nursery / Preschool | 0 | 0.0% |
| Kindergarten | 21 | 14.3% |
| Elementary School | 32 | 21.8% |
| Middle School | 18 | 12.2% |
| High School | 21 | 14.3% |
| College / Undergraduate | 55 | 37.4% |
| Graduate / Professional | 0 | 0.0% |
| Total | 147 | 100.0% |
School Enrollment by Age by Funding Source in San Miguel
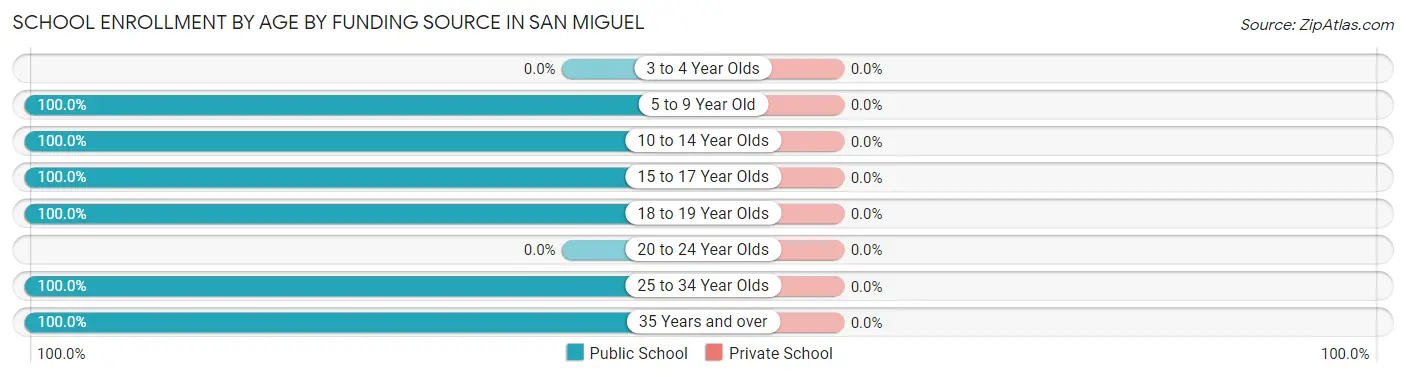
| Age Bracket | Public School | Private School |
| 3 to 4 Year Olds | 0 (0.0%) | 0 (0.0%) |
| 5 to 9 Year Old | 53 (100.0%) | 0 (0.0%) |
| 10 to 14 Year Olds | 18 (100.0%) | 0 (0.0%) |
| 15 to 17 Year Olds | 21 (100.0%) | 0 (0.0%) |
| 18 to 19 Year Olds | 41 (100.0%) | 0 (0.0%) |
| 20 to 24 Year Olds | 0 (0.0%) | 0 (0.0%) |
| 25 to 34 Year Olds | 7 (100.0%) | 0 (0.0%) |
| 35 Years and over | 7 (100.0%) | 0 (0.0%) |
| Total | 147 (100.0%) | 0 (0.0%) |
Educational Attainment by Field of Study in San Miguel
Education (33 | 58.9%), arts & humanities (13 | 23.2%), and computers & mathematics (10 | 17.9%) are the most common fields of study among 56 individuals in San Miguel who have obtained a bachelor's degree or higher.
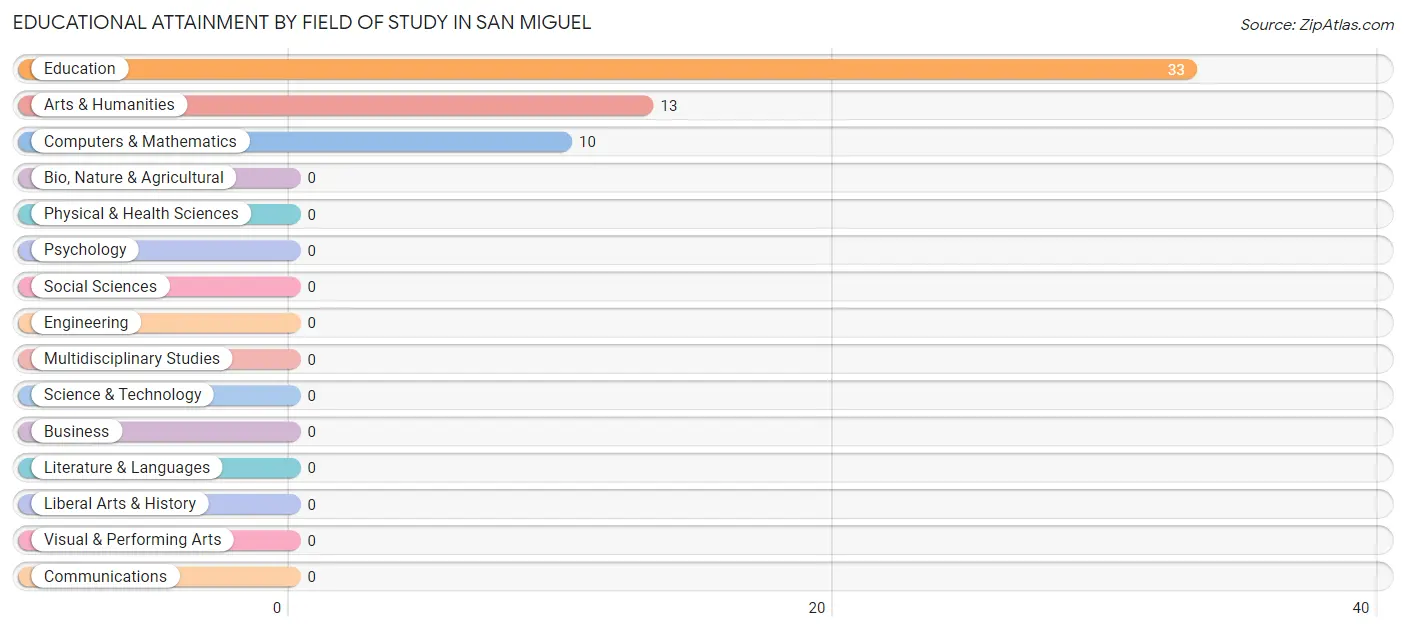
| Field of Study | # Graduates | % Graduates |
| Computers & Mathematics | 10 | 17.9% |
| Bio, Nature & Agricultural | 0 | 0.0% |
| Physical & Health Sciences | 0 | 0.0% |
| Psychology | 0 | 0.0% |
| Social Sciences | 0 | 0.0% |
| Engineering | 0 | 0.0% |
| Multidisciplinary Studies | 0 | 0.0% |
| Science & Technology | 0 | 0.0% |
| Business | 0 | 0.0% |
| Education | 33 | 58.9% |
| Literature & Languages | 0 | 0.0% |
| Liberal Arts & History | 0 | 0.0% |
| Visual & Performing Arts | 0 | 0.0% |
| Communications | 0 | 0.0% |
| Arts & Humanities | 13 | 23.2% |
| Total | 56 | 100.0% |
Transportation & Commute in San Miguel
Vehicle Availability by Sex in San Miguel
The most prevalent vehicle ownership categories in San Miguel are males with 2 vehicles (70, accounting for 36.3%) and females with 2 vehicles (21, making up 76.9%).
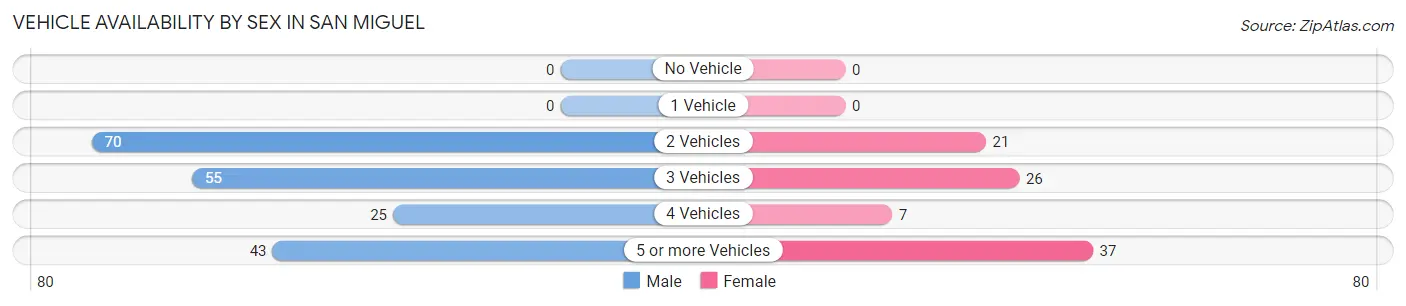
| Vehicles Available | Male | Female |
| No Vehicle | 0 (0.0%) | 0 (0.0%) |
| 1 Vehicle | 0 (0.0%) | 0 (0.0%) |
| 2 Vehicles | 70 (36.3%) | 21 (23.1%) |
| 3 Vehicles | 55 (28.5%) | 26 (28.6%) |
| 4 Vehicles | 25 (13.0%) | 7 (7.7%) |
| 5 or more Vehicles | 43 (22.3%) | 37 (40.7%) |
| Total | 193 (100.0%) | 91 (100.0%) |
Commute Time in San Miguel
The most frequently occuring commute durations in San Miguel are 20 to 24 minutes (98 commuters, 34.5%), 60 to 89 minutes (78 commuters, 27.5%), and 25 to 29 minutes (53 commuters, 18.7%).
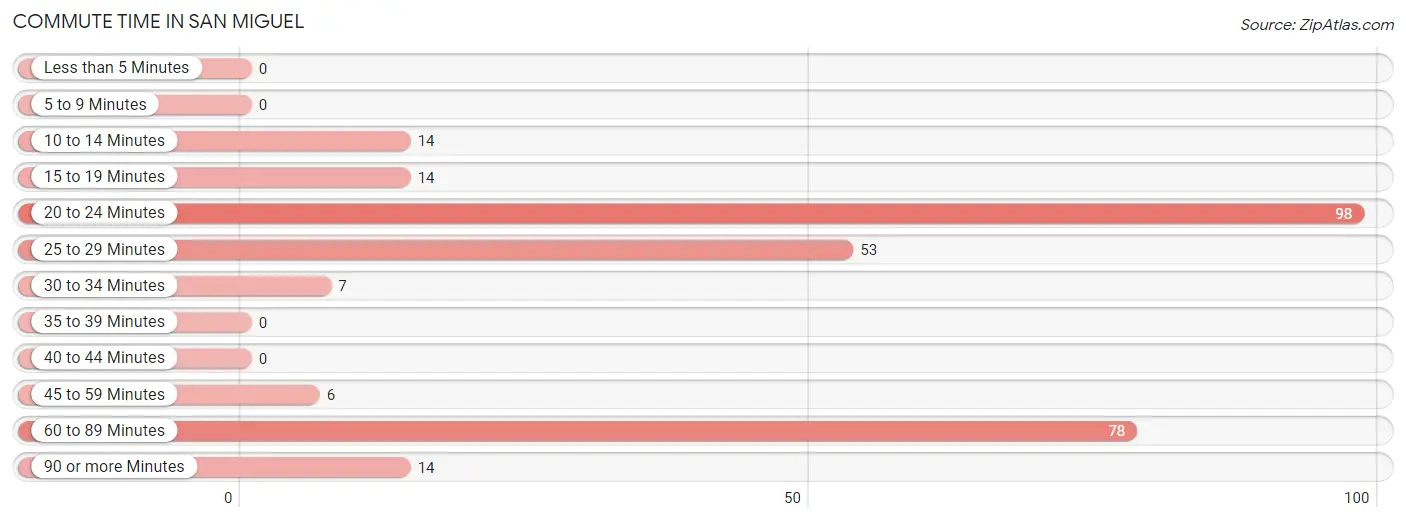
| Commute Time | # Commuters | % Commuters |
| Less than 5 Minutes | 0 | 0.0% |
| 5 to 9 Minutes | 0 | 0.0% |
| 10 to 14 Minutes | 14 | 4.9% |
| 15 to 19 Minutes | 14 | 4.9% |
| 20 to 24 Minutes | 98 | 34.5% |
| 25 to 29 Minutes | 53 | 18.7% |
| 30 to 34 Minutes | 7 | 2.5% |
| 35 to 39 Minutes | 0 | 0.0% |
| 40 to 44 Minutes | 0 | 0.0% |
| 45 to 59 Minutes | 6 | 2.1% |
| 60 to 89 Minutes | 78 | 27.5% |
| 90 or more Minutes | 14 | 4.9% |
Commute Time by Sex in San Miguel
The most common commute times in San Miguel are 20 to 24 minutes (88 commuters, 45.6%) for males and 25 to 29 minutes (47 commuters, 51.6%) for females.
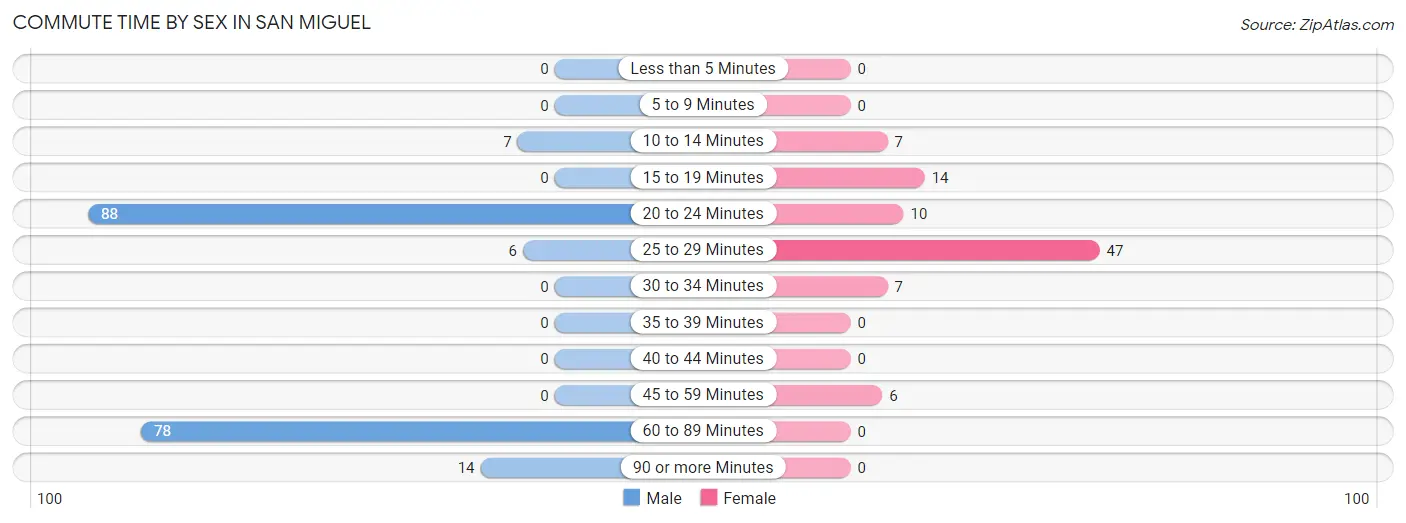
| Commute Time | Male | Female |
| Less than 5 Minutes | 0 (0.0%) | 0 (0.0%) |
| 5 to 9 Minutes | 0 (0.0%) | 0 (0.0%) |
| 10 to 14 Minutes | 7 (3.6%) | 7 (7.7%) |
| 15 to 19 Minutes | 0 (0.0%) | 14 (15.4%) |
| 20 to 24 Minutes | 88 (45.6%) | 10 (11.0%) |
| 25 to 29 Minutes | 6 (3.1%) | 47 (51.6%) |
| 30 to 34 Minutes | 0 (0.0%) | 7 (7.7%) |
| 35 to 39 Minutes | 0 (0.0%) | 0 (0.0%) |
| 40 to 44 Minutes | 0 (0.0%) | 0 (0.0%) |
| 45 to 59 Minutes | 0 (0.0%) | 6 (6.6%) |
| 60 to 89 Minutes | 78 (40.4%) | 0 (0.0%) |
| 90 or more Minutes | 14 (7.2%) | 0 (0.0%) |
Time of Departure to Work by Sex in San Miguel
The most frequent times of departure to work in San Miguel are 5:30 AM to 5:59 AM (82, 42.5%) for males and 7:30 AM to 7:59 AM (27, 29.7%) for females.
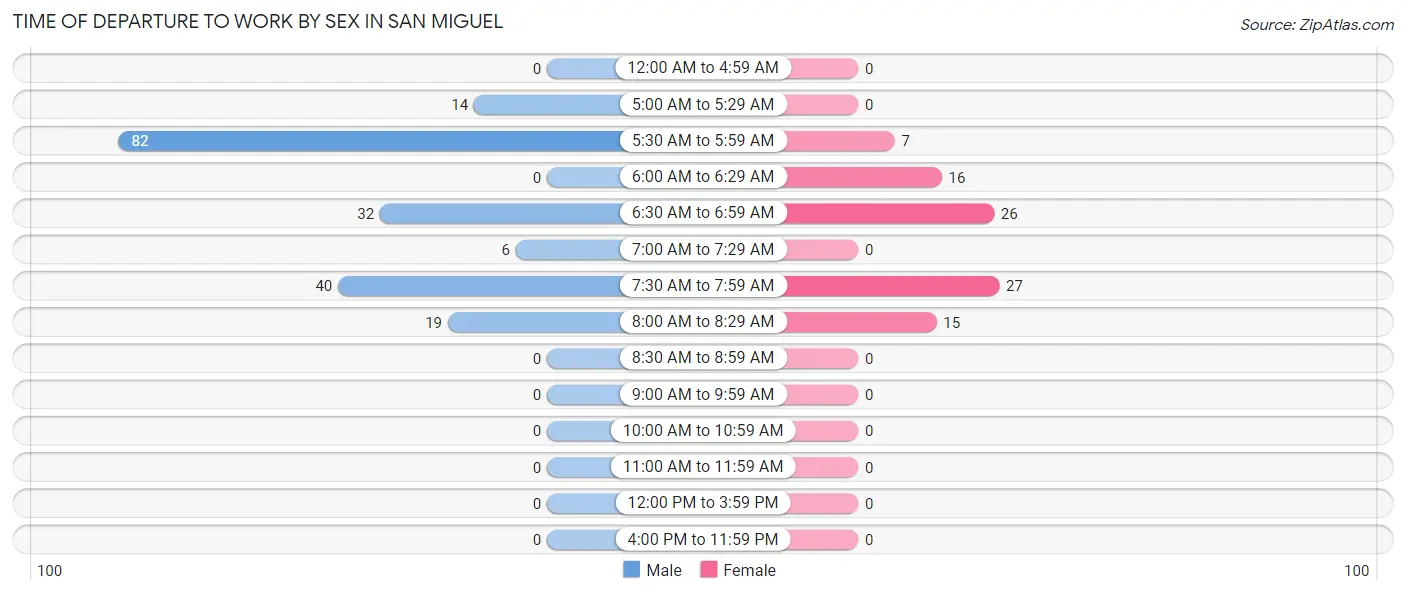
| Time of Departure | Male | Female |
| 12:00 AM to 4:59 AM | 0 (0.0%) | 0 (0.0%) |
| 5:00 AM to 5:29 AM | 14 (7.2%) | 0 (0.0%) |
| 5:30 AM to 5:59 AM | 82 (42.5%) | 7 (7.7%) |
| 6:00 AM to 6:29 AM | 0 (0.0%) | 16 (17.6%) |
| 6:30 AM to 6:59 AM | 32 (16.6%) | 26 (28.6%) |
| 7:00 AM to 7:29 AM | 6 (3.1%) | 0 (0.0%) |
| 7:30 AM to 7:59 AM | 40 (20.7%) | 27 (29.7%) |
| 8:00 AM to 8:29 AM | 19 (9.8%) | 15 (16.5%) |
| 8:30 AM to 8:59 AM | 0 (0.0%) | 0 (0.0%) |
| 9:00 AM to 9:59 AM | 0 (0.0%) | 0 (0.0%) |
| 10:00 AM to 10:59 AM | 0 (0.0%) | 0 (0.0%) |
| 11:00 AM to 11:59 AM | 0 (0.0%) | 0 (0.0%) |
| 12:00 PM to 3:59 PM | 0 (0.0%) | 0 (0.0%) |
| 4:00 PM to 11:59 PM | 0 (0.0%) | 0 (0.0%) |
| Total | 193 (100.0%) | 91 (100.0%) |
Housing Occupancy in San Miguel
Occupancy by Ownership in San Miguel
Of the total 227 dwellings in San Miguel, owner-occupied units account for 227 (100.0%), while renter-occupied units make up 0 (0.0%).
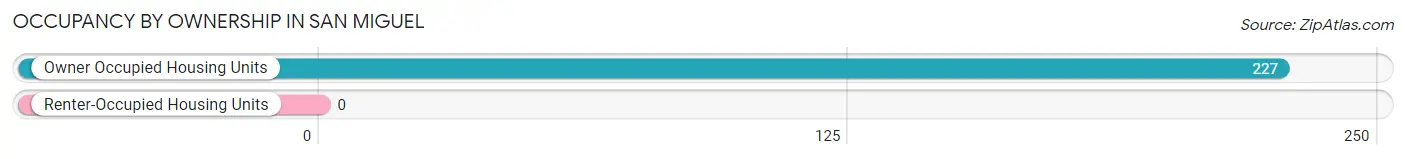
| Occupancy | # Housing Units | % Housing Units |
| Owner Occupied Housing Units | 227 | 100.0% |
| Renter-Occupied Housing Units | 0 | 0.0% |
| Total Occupied Housing Units | 227 | 100.0% |
Occupancy by Household Size in San Miguel
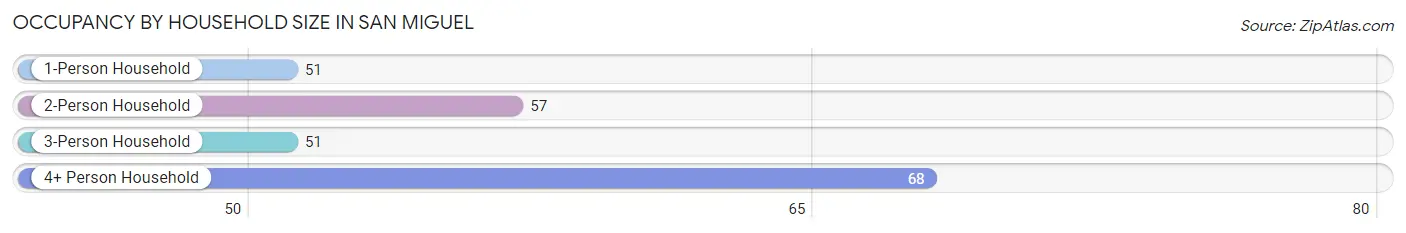
| Household Size | # Housing Units | % Housing Units |
| 1-Person Household | 51 | 22.5% |
| 2-Person Household | 57 | 25.1% |
| 3-Person Household | 51 | 22.5% |
| 4+ Person Household | 68 | 30.0% |
| Total Housing Units | 227 | 100.0% |
Occupancy by Ownership by Household Size in San Miguel
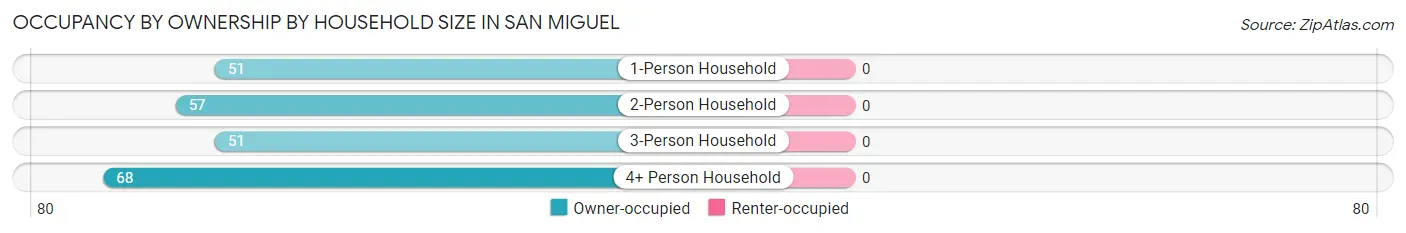
| Household Size | Owner-occupied | Renter-occupied |
| 1-Person Household | 51 (100.0%) | 0 (0.0%) |
| 2-Person Household | 57 (100.0%) | 0 (0.0%) |
| 3-Person Household | 51 (100.0%) | 0 (0.0%) |
| 4+ Person Household | 68 (100.0%) | 0 (0.0%) |
| Total Housing Units | 227 (100.0%) | 0 (0.0%) |
Occupancy by Educational Attainment in San Miguel
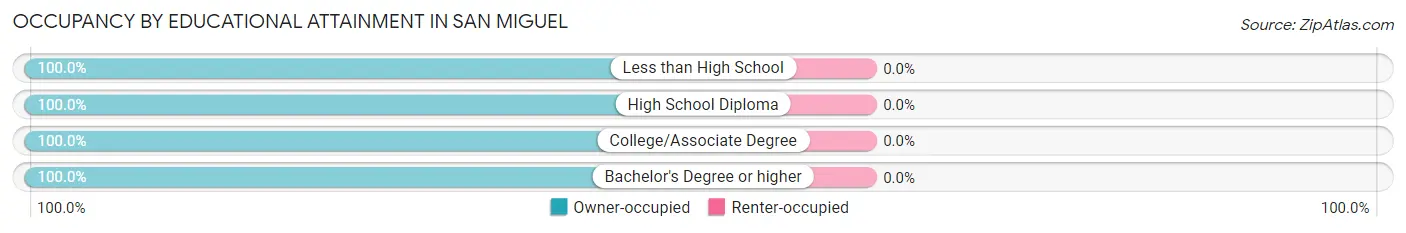
| Household Size | Owner-occupied | Renter-occupied |
| Less than High School | 79 (100.0%) | 0 (0.0%) |
| High School Diploma | 57 (100.0%) | 0 (0.0%) |
| College/Associate Degree | 55 (100.0%) | 0 (0.0%) |
| Bachelor's Degree or higher | 36 (100.0%) | 0 (0.0%) |
Occupancy by Age of Householder in San Miguel
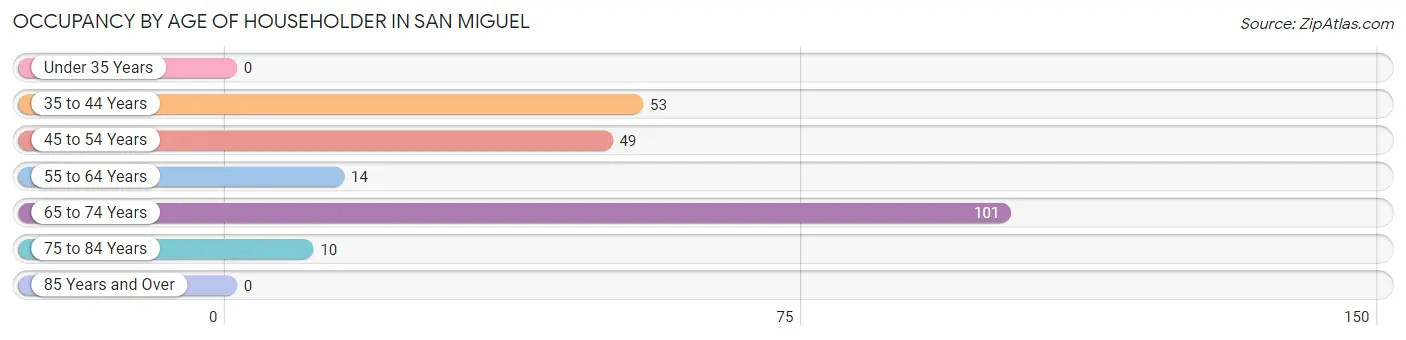
| Age Bracket | # Households | % Households |
| Under 35 Years | 0 | 0.0% |
| 35 to 44 Years | 53 | 23.4% |
| 45 to 54 Years | 49 | 21.6% |
| 55 to 64 Years | 14 | 6.2% |
| 65 to 74 Years | 101 | 44.5% |
| 75 to 84 Years | 10 | 4.4% |
| 85 Years and Over | 0 | 0.0% |
| Total | 227 | 100.0% |
Housing Finances in San Miguel
Median Income by Occupancy in San Miguel
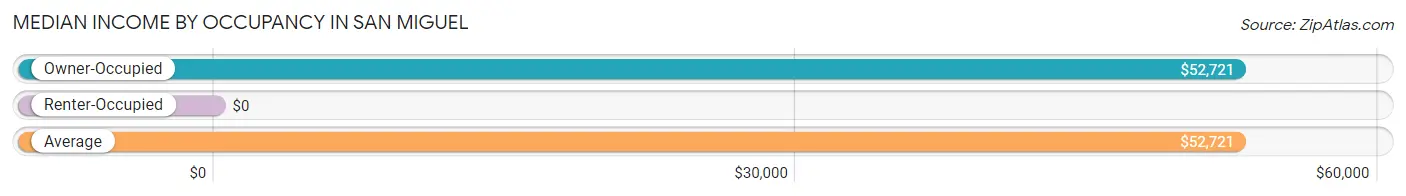
| Occupancy Type | # Households | Median Income |
| Owner-Occupied | 227 (100.0%) | $52,721 |
| Renter-Occupied | 0 (0.0%) | $0 |
| Average | 227 (100.0%) | $52,721 |
Occupancy by Householder Income Bracket in San Miguel
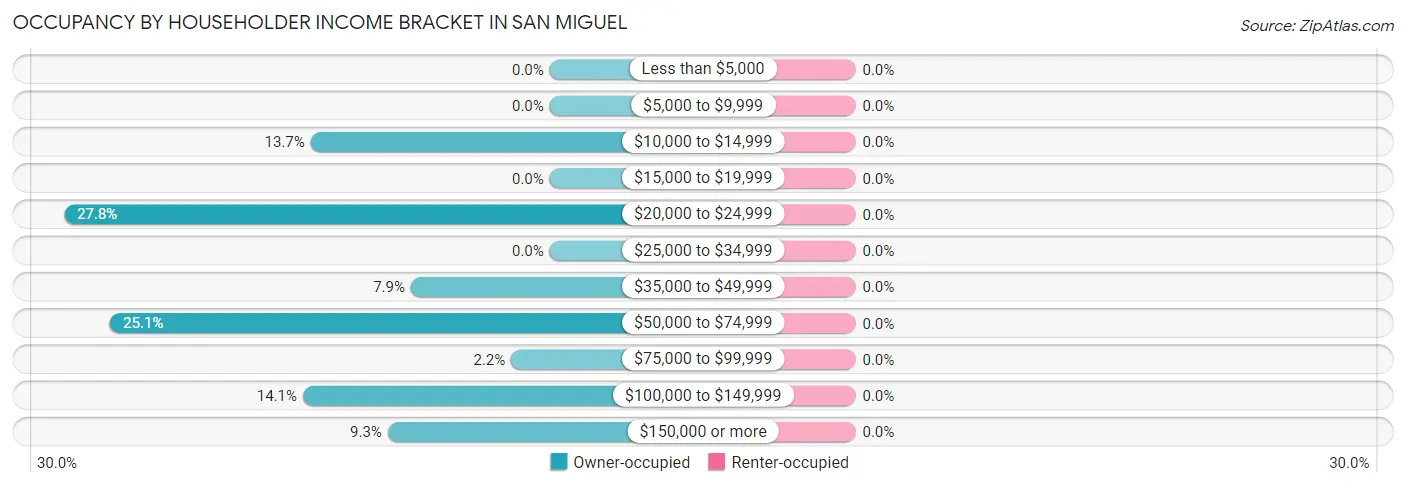
| Income Bracket | Owner-occupied | Renter-occupied |
| Less than $5,000 | 0 (0.0%) | 0 (0.0%) |
| $5,000 to $9,999 | 0 (0.0%) | 0 (0.0%) |
| $10,000 to $14,999 | 31 (13.7%) | 0 (0.0%) |
| $15,000 to $19,999 | 0 (0.0%) | 0 (0.0%) |
| $20,000 to $24,999 | 63 (27.8%) | 0 (0.0%) |
| $25,000 to $34,999 | 0 (0.0%) | 0 (0.0%) |
| $35,000 to $49,999 | 18 (7.9%) | 0 (0.0%) |
| $50,000 to $74,999 | 57 (25.1%) | 0 (0.0%) |
| $75,000 to $99,999 | 5 (2.2%) | 0 (0.0%) |
| $100,000 to $149,999 | 32 (14.1%) | 0 (0.0%) |
| $150,000 or more | 21 (9.2%) | 0 (0.0%) |
| Total | 227 (100.0%) | 0 (0.0%) |
Monthly Housing Cost Tiers in San Miguel
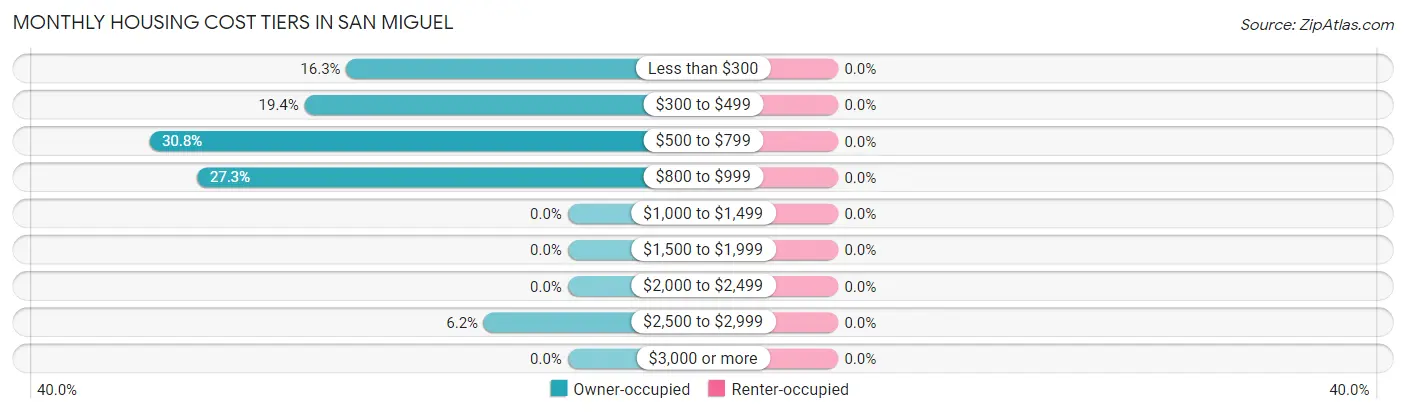
| Monthly Cost | Owner-occupied | Renter-occupied |
| Less than $300 | 37 (16.3%) | 0 (0.0%) |
| $300 to $499 | 44 (19.4%) | 0 (0.0%) |
| $500 to $799 | 70 (30.8%) | 0 (0.0%) |
| $800 to $999 | 62 (27.3%) | 0 (0.0%) |
| $1,000 to $1,499 | 0 (0.0%) | 0 (0.0%) |
| $1,500 to $1,999 | 0 (0.0%) | 0 (0.0%) |
| $2,000 to $2,499 | 0 (0.0%) | 0 (0.0%) |
| $2,500 to $2,999 | 14 (6.2%) | 0 (0.0%) |
| $3,000 or more | 0 (0.0%) | 0 (0.0%) |
| Total | 227 (100.0%) | 0 (0.0%) |
Physical Housing Characteristics in San Miguel
Housing Structures in San Miguel
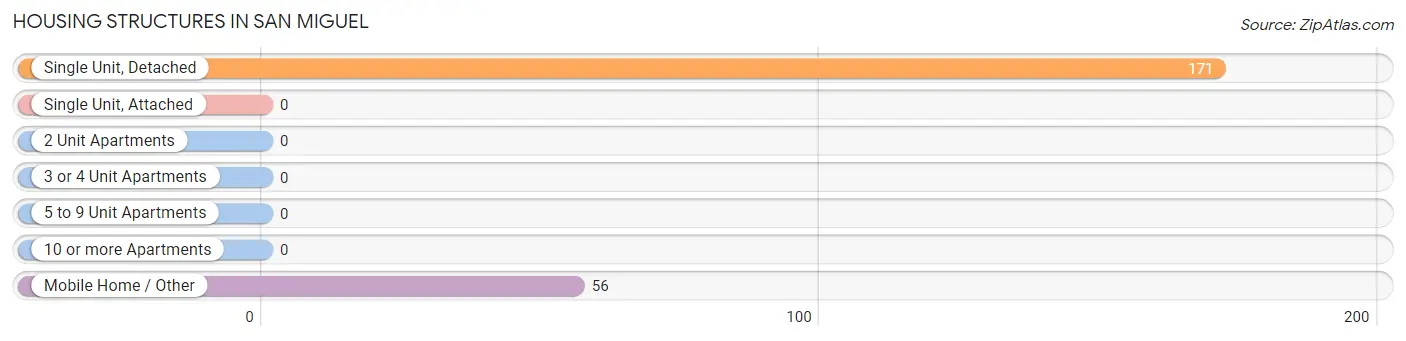
| Structure Type | # Housing Units | % Housing Units |
| Single Unit, Detached | 171 | 75.3% |
| Single Unit, Attached | 0 | 0.0% |
| 2 Unit Apartments | 0 | 0.0% |
| 3 or 4 Unit Apartments | 0 | 0.0% |
| 5 to 9 Unit Apartments | 0 | 0.0% |
| 10 or more Apartments | 0 | 0.0% |
| Mobile Home / Other | 56 | 24.7% |
| Total | 227 | 100.0% |
Housing Structures by Occupancy in San Miguel
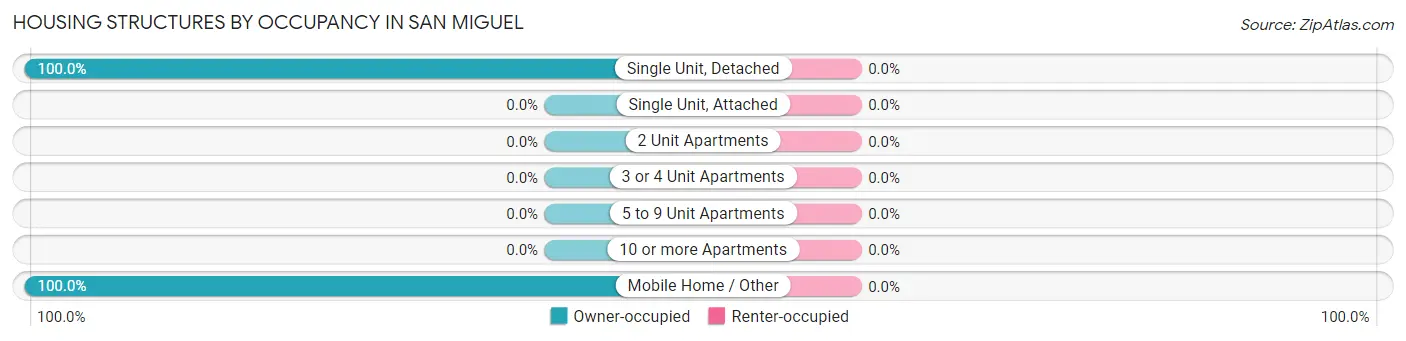
| Structure Type | Owner-occupied | Renter-occupied |
| Single Unit, Detached | 171 (100.0%) | 0 (0.0%) |
| Single Unit, Attached | 0 (0.0%) | 0 (0.0%) |
| 2 Unit Apartments | 0 (0.0%) | 0 (0.0%) |
| 3 or 4 Unit Apartments | 0 (0.0%) | 0 (0.0%) |
| 5 to 9 Unit Apartments | 0 (0.0%) | 0 (0.0%) |
| 10 or more Apartments | 0 (0.0%) | 0 (0.0%) |
| Mobile Home / Other | 56 (100.0%) | 0 (0.0%) |
| Total | 227 (100.0%) | 0 (0.0%) |
Housing Structures by Number of Rooms in San Miguel
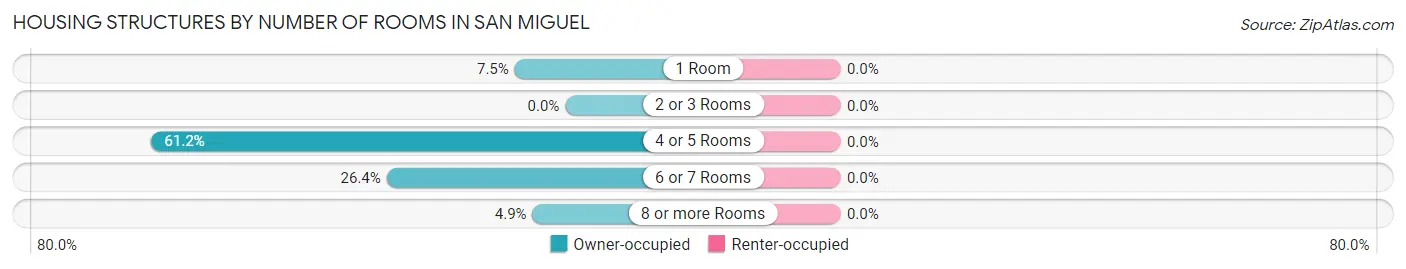
| Number of Rooms | Owner-occupied | Renter-occupied |
| 1 Room | 17 (7.5%) | 0 (0.0%) |
| 2 or 3 Rooms | 0 (0.0%) | 0 (0.0%) |
| 4 or 5 Rooms | 139 (61.2%) | 0 (0.0%) |
| 6 or 7 Rooms | 60 (26.4%) | 0 (0.0%) |
| 8 or more Rooms | 11 (4.9%) | 0 (0.0%) |
| Total | 227 (100.0%) | 0 (0.0%) |
Housing Structure by Heating Type in San Miguel
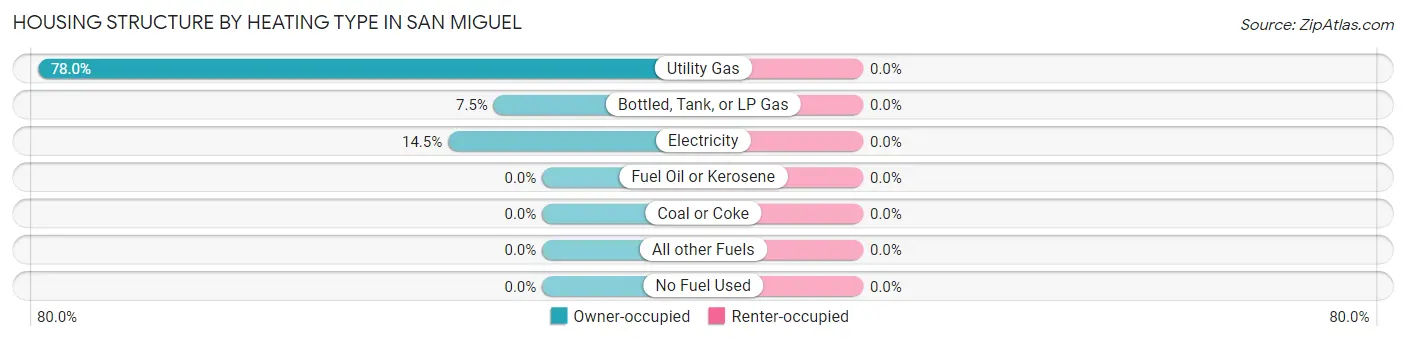
| Heating Type | Owner-occupied | Renter-occupied |
| Utility Gas | 177 (78.0%) | 0 (0.0%) |
| Bottled, Tank, or LP Gas | 17 (7.5%) | 0 (0.0%) |
| Electricity | 33 (14.5%) | 0 (0.0%) |
| Fuel Oil or Kerosene | 0 (0.0%) | 0 (0.0%) |
| Coal or Coke | 0 (0.0%) | 0 (0.0%) |
| All other Fuels | 0 (0.0%) | 0 (0.0%) |
| No Fuel Used | 0 (0.0%) | 0 (0.0%) |
| Total | 227 (100.0%) | 0 (0.0%) |
Household Vehicle Usage in San Miguel
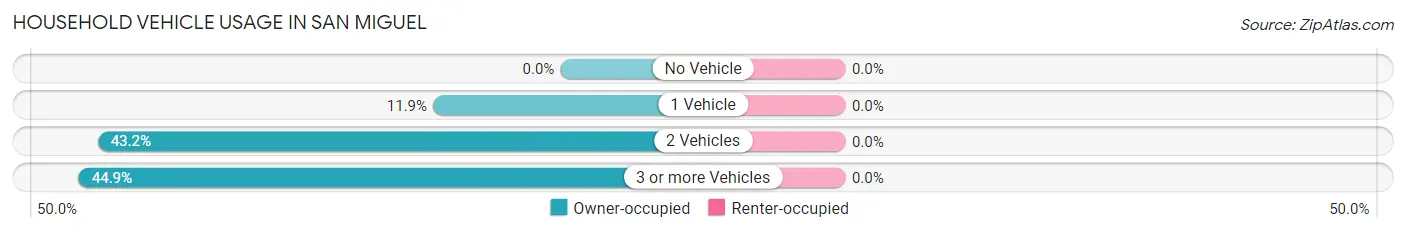
| Vehicles per Household | Owner-occupied | Renter-occupied |
| No Vehicle | 0 (0.0%) | 0 (0.0%) |
| 1 Vehicle | 27 (11.9%) | 0 (0.0%) |
| 2 Vehicles | 98 (43.2%) | 0 (0.0%) |
| 3 or more Vehicles | 102 (44.9%) | 0 (0.0%) |
| Total | 227 (100.0%) | 0 (0.0%) |
Real Estate & Mortgages in San Miguel
Real Estate and Mortgage Overview in San Miguel
| Characteristic | Without Mortgage | With Mortgage |
| Housing Units | 98 | 129 |
| Median Property Value | $86,500 | $118,200 |
| Median Household Income | $60,000 | $14 |
| Monthly Housing Costs | $326 | $0 |
| Real Estate Taxes | $506 | $0 |
Property Value by Mortgage Status in San Miguel
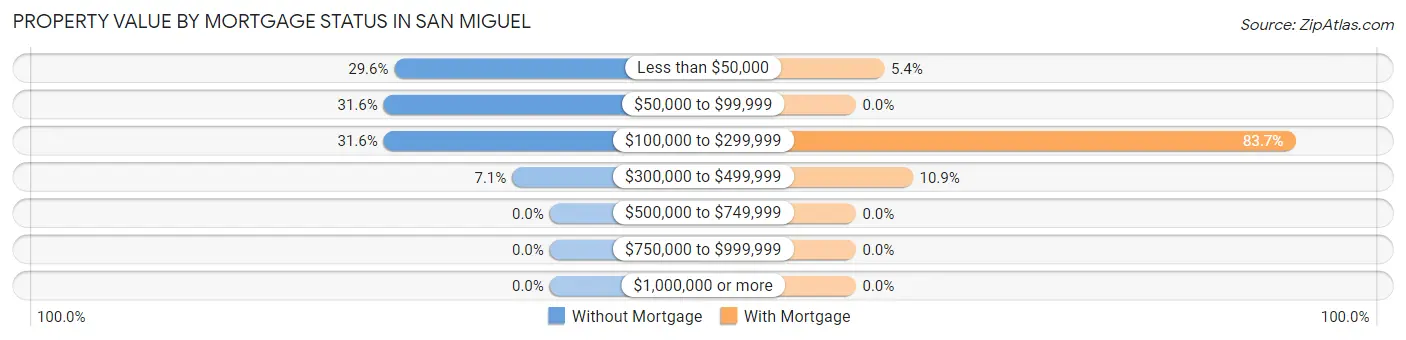
| Property Value | Without Mortgage | With Mortgage |
| Less than $50,000 | 29 (29.6%) | 7 (5.4%) |
| $50,000 to $99,999 | 31 (31.6%) | 0 (0.0%) |
| $100,000 to $299,999 | 31 (31.6%) | 108 (83.7%) |
| $300,000 to $499,999 | 7 (7.1%) | 14 (10.8%) |
| $500,000 to $749,999 | 0 (0.0%) | 0 (0.0%) |
| $750,000 to $999,999 | 0 (0.0%) | 0 (0.0%) |
| $1,000,000 or more | 0 (0.0%) | 0 (0.0%) |
| Total | 98 (100.0%) | 129 (100.0%) |
Household Income by Mortgage Status in San Miguel
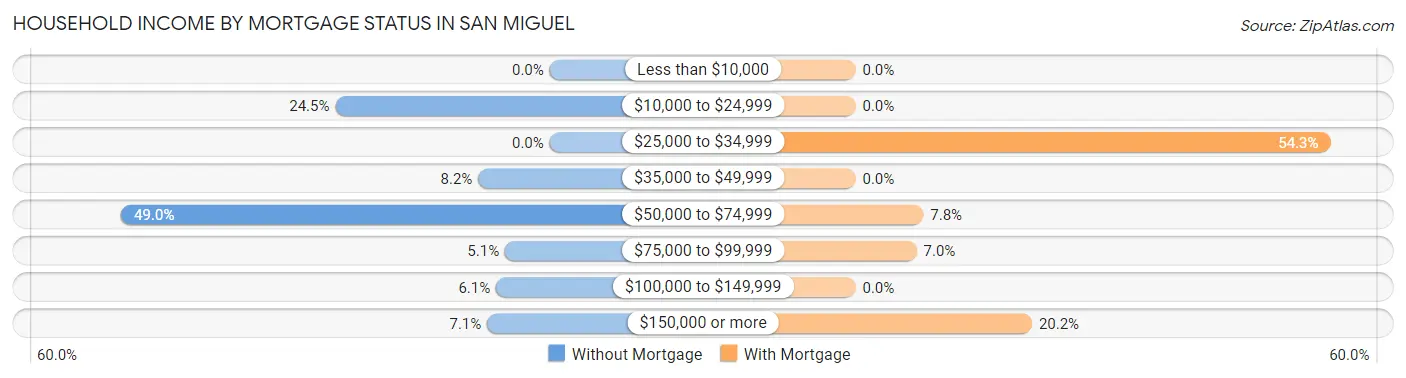
| Household Income | Without Mortgage | With Mortgage |
| Less than $10,000 | 0 (0.0%) | 0 (0.0%) |
| $10,000 to $24,999 | 24 (24.5%) | 0 (0.0%) |
| $25,000 to $34,999 | 0 (0.0%) | 70 (54.3%) |
| $35,000 to $49,999 | 8 (8.2%) | 0 (0.0%) |
| $50,000 to $74,999 | 48 (49.0%) | 10 (7.7%) |
| $75,000 to $99,999 | 5 (5.1%) | 9 (7.0%) |
| $100,000 to $149,999 | 6 (6.1%) | 0 (0.0%) |
| $150,000 or more | 7 (7.1%) | 26 (20.2%) |
| Total | 98 (100.0%) | 129 (100.0%) |
Property Value to Household Income Ratio in San Miguel
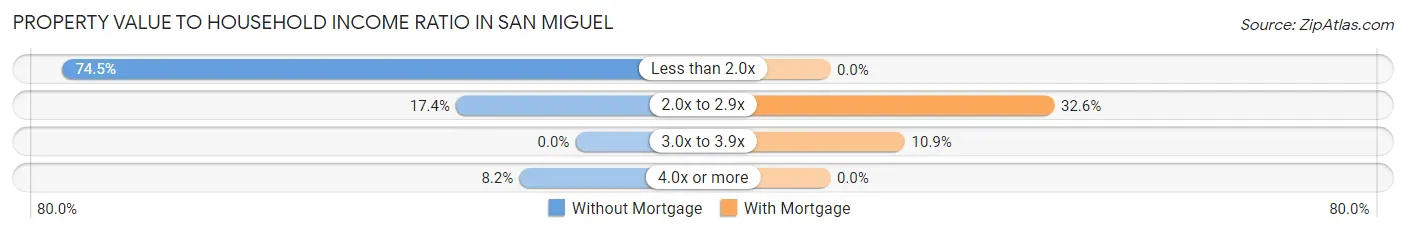
| Value-to-Income Ratio | Without Mortgage | With Mortgage |
| Less than 2.0x | 73 (74.5%) | 0 (0.0%) |
| 2.0x to 2.9x | 17 (17.3%) | 42 (32.6%) |
| 3.0x to 3.9x | 0 (0.0%) | 14 (10.8%) |
| 4.0x or more | 8 (8.2%) | 0 (0.0%) |
| Total | 98 (100.0%) | 129 (100.0%) |
Real Estate Taxes by Mortgage Status in San Miguel
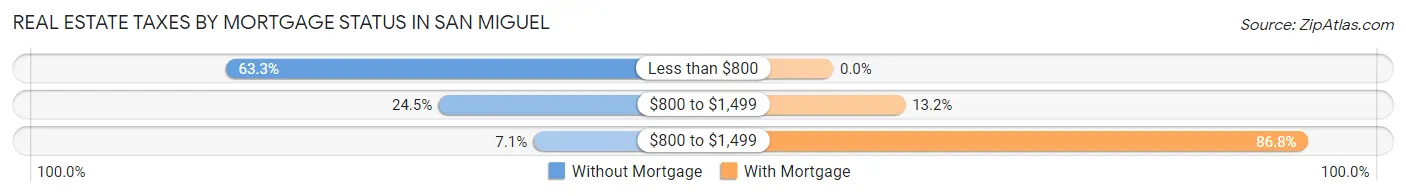
| Property Taxes | Without Mortgage | With Mortgage |
| Less than $800 | 62 (63.3%) | 0 (0.0%) |
| $800 to $1,499 | 24 (24.5%) | 17 (13.2%) |
| $800 to $1,499 | 7 (7.1%) | 112 (86.8%) |
| Total | 98 (100.0%) | 129 (100.0%) |
Health & Disability in San Miguel
Health Insurance Coverage by Age in San Miguel
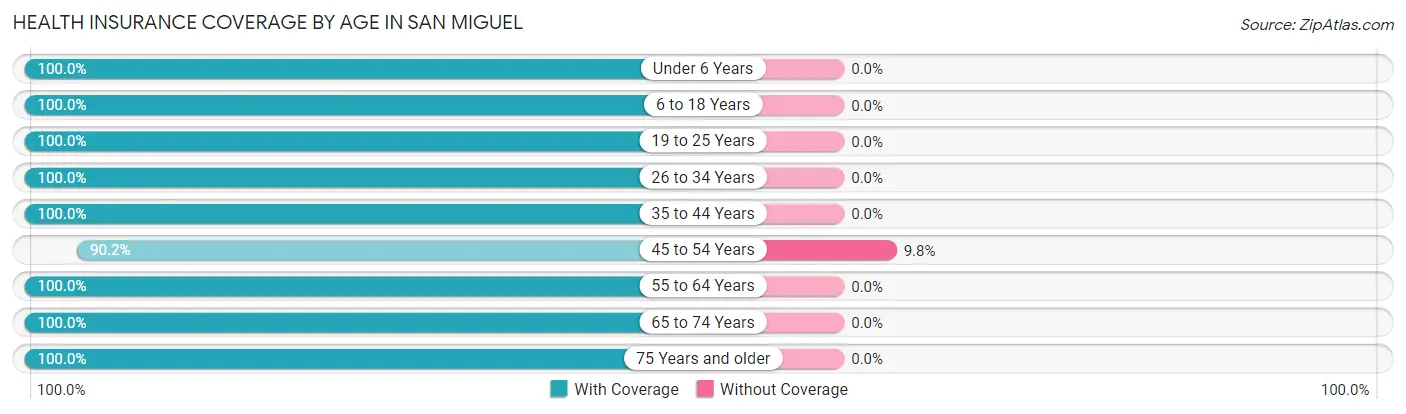
| Age Bracket | With Coverage | Without Coverage |
| Under 6 Years | 18 (100.0%) | 0 (0.0%) |
| 6 to 18 Years | 92 (100.0%) | 0 (0.0%) |
| 19 to 25 Years | 60 (100.0%) | 0 (0.0%) |
| 26 to 34 Years | 31 (100.0%) | 0 (0.0%) |
| 35 to 44 Years | 108 (100.0%) | 0 (0.0%) |
| 45 to 54 Years | 83 (90.2%) | 9 (9.8%) |
| 55 to 64 Years | 68 (100.0%) | 0 (0.0%) |
| 65 to 74 Years | 115 (100.0%) | 0 (0.0%) |
| 75 Years and older | 10 (100.0%) | 0 (0.0%) |
| Total | 585 (98.5%) | 9 (1.5%) |
Health Insurance Coverage by Citizenship Status in San Miguel
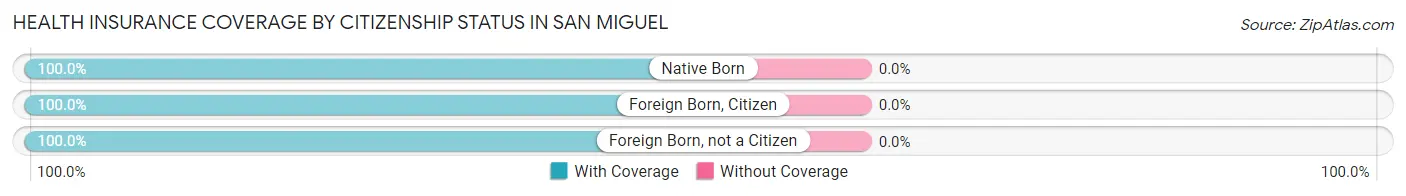
| Citizenship Status | With Coverage | Without Coverage |
| Native Born | 18 (100.0%) | 0 (0.0%) |
| Foreign Born, Citizen | 92 (100.0%) | 0 (0.0%) |
| Foreign Born, not a Citizen | 60 (100.0%) | 0 (0.0%) |
Health Insurance Coverage by Household Income in San Miguel
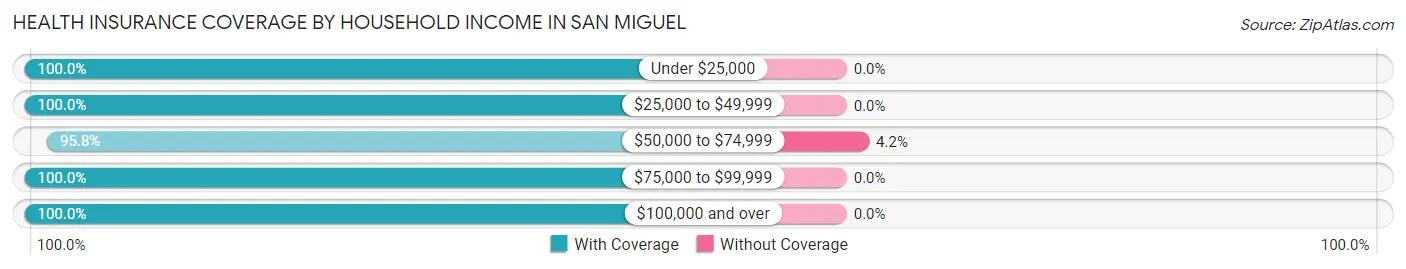
| Household Income | With Coverage | Without Coverage |
| Under $25,000 | 166 (100.0%) | 0 (0.0%) |
| $25,000 to $49,999 | 27 (100.0%) | 0 (0.0%) |
| $50,000 to $74,999 | 206 (95.8%) | 9 (4.2%) |
| $75,000 to $99,999 | 17 (100.0%) | 0 (0.0%) |
| $100,000 and over | 169 (100.0%) | 0 (0.0%) |
Public vs Private Health Insurance Coverage by Age in San Miguel
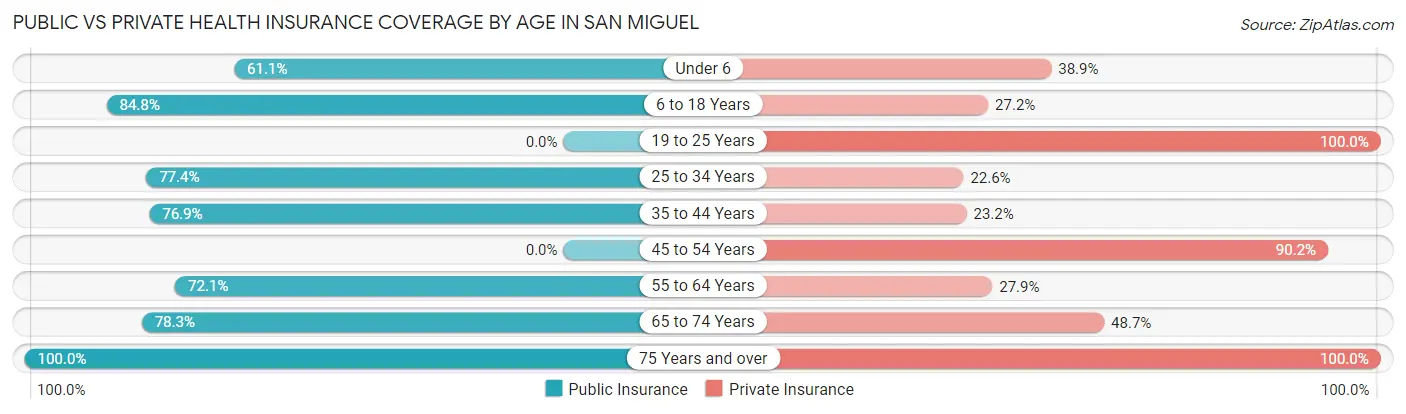
| Age Bracket | Public Insurance | Private Insurance |
| Under 6 | 11 (61.1%) | 7 (38.9%) |
| 6 to 18 Years | 78 (84.8%) | 25 (27.2%) |
| 19 to 25 Years | 0 (0.0%) | 60 (100.0%) |
| 25 to 34 Years | 24 (77.4%) | 7 (22.6%) |
| 35 to 44 Years | 83 (76.8%) | 25 (23.2%) |
| 45 to 54 Years | 0 (0.0%) | 83 (90.2%) |
| 55 to 64 Years | 49 (72.1%) | 19 (27.9%) |
| 65 to 74 Years | 90 (78.3%) | 56 (48.7%) |
| 75 Years and over | 10 (100.0%) | 10 (100.0%) |
| Total | 345 (58.1%) | 292 (49.2%) |
Disability Status by Sex by Age in San Miguel
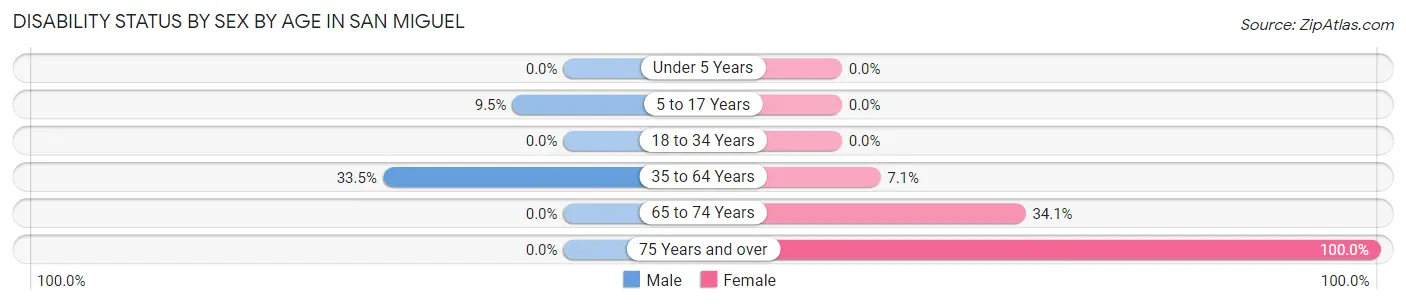
| Age Bracket | Male | Female |
| Under 5 Years | 0 (0.0%) | 0 (0.0%) |
| 5 to 17 Years | 7 (9.5%) | 0 (0.0%) |
| 18 to 34 Years | 0 (0.0%) | 0 (0.0%) |
| 35 to 64 Years | 57 (33.5%) | 7 (7.1%) |
| 65 to 74 Years | 0 (0.0%) | 15 (34.1%) |
| 75 Years and over | 0 (0.0%) | 10 (100.0%) |
Disability Class by Sex by Age in San Miguel
Disability Class: Hearing Difficulty
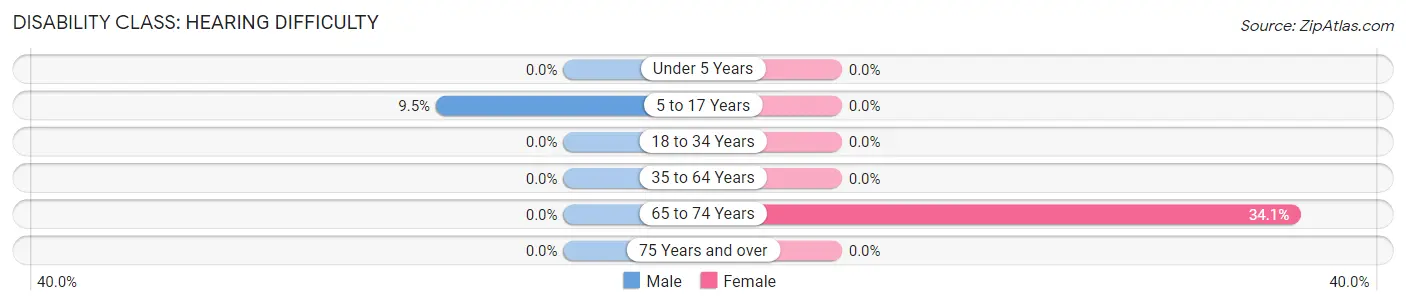
| Age Bracket | Male | Female |
| Under 5 Years | 0 (0.0%) | 0 (0.0%) |
| 5 to 17 Years | 7 (9.5%) | 0 (0.0%) |
| 18 to 34 Years | 0 (0.0%) | 0 (0.0%) |
| 35 to 64 Years | 0 (0.0%) | 0 (0.0%) |
| 65 to 74 Years | 0 (0.0%) | 15 (34.1%) |
| 75 Years and over | 0 (0.0%) | 0 (0.0%) |
Disability Class: Vision Difficulty
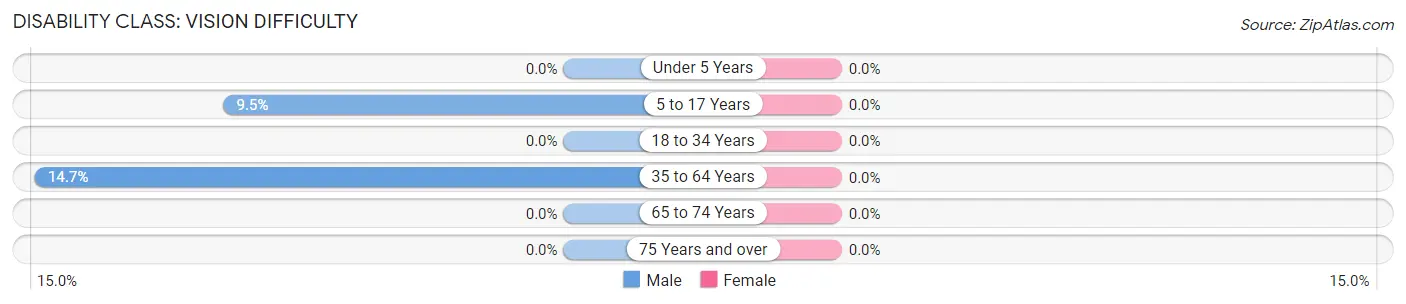
| Age Bracket | Male | Female |
| Under 5 Years | 0 (0.0%) | 0 (0.0%) |
| 5 to 17 Years | 7 (9.5%) | 0 (0.0%) |
| 18 to 34 Years | 0 (0.0%) | 0 (0.0%) |
| 35 to 64 Years | 25 (14.7%) | 0 (0.0%) |
| 65 to 74 Years | 0 (0.0%) | 0 (0.0%) |
| 75 Years and over | 0 (0.0%) | 0 (0.0%) |
Disability Class: Cognitive Difficulty
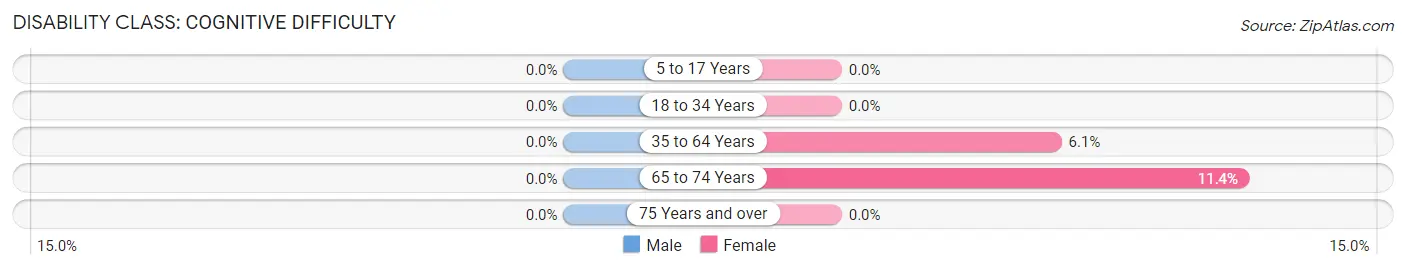
| Age Bracket | Male | Female |
| 5 to 17 Years | 0 (0.0%) | 0 (0.0%) |
| 18 to 34 Years | 0 (0.0%) | 0 (0.0%) |
| 35 to 64 Years | 0 (0.0%) | 6 (6.1%) |
| 65 to 74 Years | 0 (0.0%) | 5 (11.4%) |
| 75 Years and over | 0 (0.0%) | 0 (0.0%) |
Disability Class: Ambulatory Difficulty
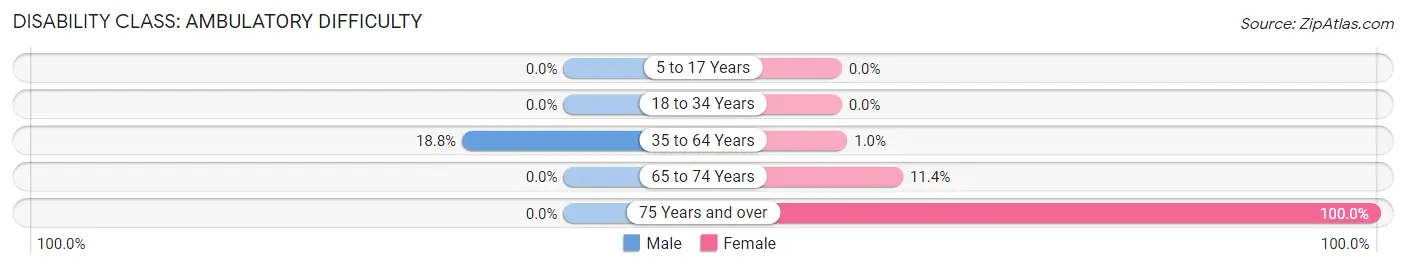
| Age Bracket | Male | Female |
| 5 to 17 Years | 0 (0.0%) | 0 (0.0%) |
| 18 to 34 Years | 0 (0.0%) | 0 (0.0%) |
| 35 to 64 Years | 32 (18.8%) | 1 (1.0%) |
| 65 to 74 Years | 0 (0.0%) | 5 (11.4%) |
| 75 Years and over | 0 (0.0%) | 10 (100.0%) |
Disability Class: Self-Care Difficulty
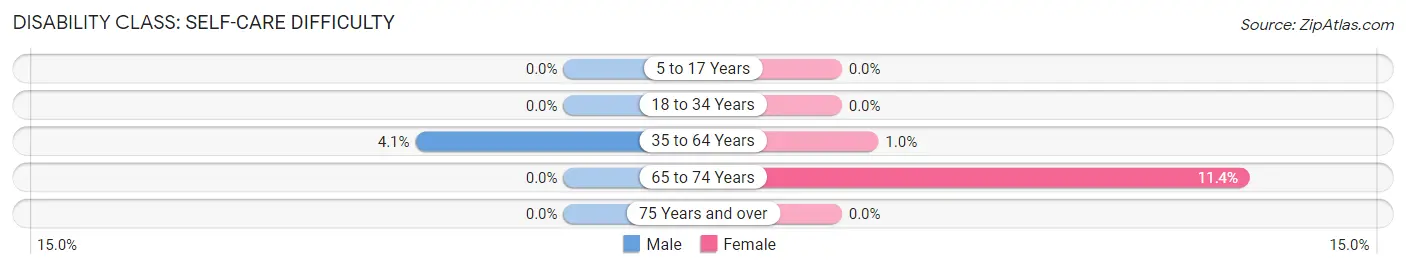
| Age Bracket | Male | Female |
| 5 to 17 Years | 0 (0.0%) | 0 (0.0%) |
| 18 to 34 Years | 0 (0.0%) | 0 (0.0%) |
| 35 to 64 Years | 7 (4.1%) | 1 (1.0%) |
| 65 to 74 Years | 0 (0.0%) | 5 (11.4%) |
| 75 Years and over | 0 (0.0%) | 0 (0.0%) |
Technology Access in San Miguel
Computing Device Access in San Miguel
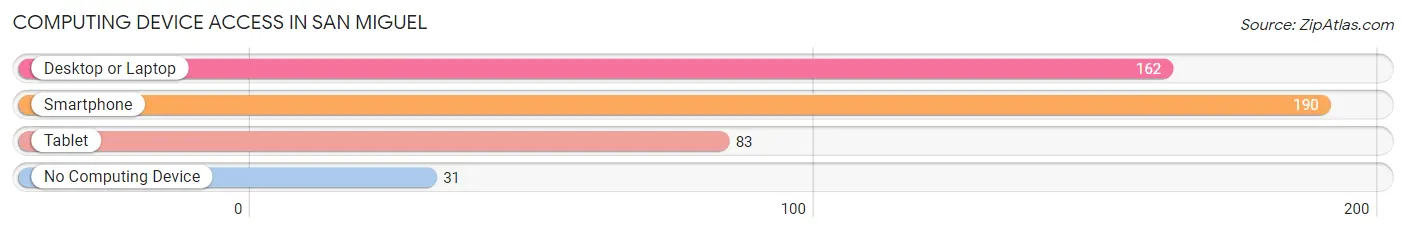
| Device Type | # Households | % Households |
| Desktop or Laptop | 162 | 71.4% |
| Smartphone | 190 | 83.7% |
| Tablet | 83 | 36.6% |
| No Computing Device | 31 | 13.7% |
| Total | 227 | 100.0% |
Internet Access in San Miguel
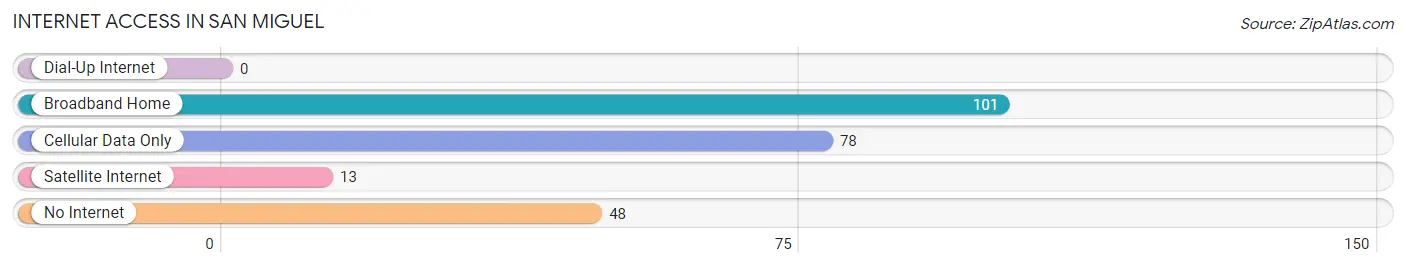
| Internet Type | # Households | % Households |
| Dial-Up Internet | 0 | 0.0% |
| Broadband Home | 101 | 44.5% |
| Cellular Data Only | 78 | 34.4% |
| Satellite Internet | 13 | 5.7% |
| No Internet | 48 | 21.1% |
| Total | 227 | 100.0% |
San Miguel Summary
History
The area now known as San Miguel, New Mexico has been inhabited for thousands of years. The earliest known inhabitants were the Jornada Mogollon people, who lived in the area from around 1000 BCE to around 1450 CE. The Jornada Mogollon were a semi-nomadic people who lived in small villages and hunted and gathered for food. They were known for their pottery and basketry, which have been found in archaeological sites throughout the area.
The first Europeans to arrive in the area were Spanish explorers in the late 1500s. They established a mission in the area in 1659, which was the first permanent European settlement in the area. The mission was named San Miguel de Socorro, after the Archangel Michael. The mission was abandoned in 1680 due to Apache raids, but was re-established in 1710.
In 1821, Mexico gained independence from Spain and the area became part of the Mexican state of Chihuahua. In 1848, the area became part of the United States after the Mexican-American War. The area was then part of the New Mexico Territory until 1912, when it became part of the state of New Mexico.
Geography
San Miguel is located in the south-central part of New Mexico, in the Rio Grande Valley. The area is mostly flat, with some rolling hills. The Rio Grande River runs through the area, providing irrigation for the area’s agricultural industry. The climate is semi-arid, with hot summers and mild winters.
The area is home to several wildlife species, including coyotes, bobcats, mule deer, and javelinas. The area is also home to several species of birds, including roadrunners, quail, and hawks.
Economy
The economy of San Miguel is largely based on agriculture. The area is known for its production of chile peppers, onions, and other vegetables. The area is also home to several dairy farms, which produce milk, cheese, and other dairy products.
The area is also home to several manufacturing companies, which produce a variety of products, including furniture, clothing, and electronics. The area is also home to several oil and gas companies, which produce oil and natural gas for the region.
Demographics
As of the 2010 census, the population of San Miguel was 8,908. The population is largely Hispanic, with over 90% of the population identifying as Hispanic or Latino. The median household income is $30,945, and the median age is 33.
The area is home to several churches, including Catholic, Baptist, and Methodist. The area is also home to several schools, including elementary, middle, and high schools. The area is served by the San Miguel County Library, which provides access to books, magazines, and other media.
Conclusion
San Miguel, New Mexico is a small town in the south-central part of the state. The area has a long history, dating back to the Jornada Mogollon people who lived in the area thousands of years ago. The area is largely agricultural, with a focus on chile peppers, onions, and other vegetables. The area is also home to several manufacturing companies, oil and gas companies, and dairy farms. The population is largely Hispanic, with over 90% of the population identifying as Hispanic or Latino. The area is home to several churches and schools, and is served by the San Miguel County Library.
Common Questions
What is Per Capita Income in San Miguel?
Per Capita income in San Miguel is $28,002.
What is the Median Family Income in San Miguel?
Median Family Income in San Miguel is $66,000.
What is the Median Household income in San Miguel?
Median Household Income in San Miguel is $52,721.
What is Inequality or Gini Index in San Miguel?
Inequality or Gini Index in San Miguel is 0.47.
What is the Total Population of San Miguel?
Total Population of San Miguel is 594.
What is the Total Male Population of San Miguel?
Total Male Population of San Miguel is 367.
What is the Total Female Population of San Miguel?
Total Female Population of San Miguel is 227.
What is the Ratio of Males per 100 Females in San Miguel?
There are 161.67 Males per 100 Females in San Miguel.
What is the Ratio of Females per 100 Males in San Miguel?
There are 61.85 Females per 100 Males in San Miguel.
What is the Median Population Age in San Miguel?
Median Population Age in San Miguel is 37.5 Years.
What is the Average Family Size in San Miguel
Average Family Size in San Miguel is 3.1 People.
What is the Average Household Size in San Miguel
Average Household Size in San Miguel is 2.6 People.
How Large is the Labor Force in San Miguel?
There are 284 People in the Labor Forcein in San Miguel.
What is the Percentage of People in the Labor Force in San Miguel?
56.2% of People are in the Labor Force in San Miguel.