Pueblo Pintado, NM Map & Demographics
Pueblo Pintado Map
Pueblo Pintado Overview
$17,353
PER CAPITA INCOME
$41,786
AVG FAMILY INCOME
$40,536
AVG HOUSEHOLD INCOME
6.5%
WAGE / INCOME GAP [ % ]
93.5¢/ $1
WAGE / INCOME GAP [ $ ]
0.43
INEQUALITY / GINI INDEX
217
TOTAL POPULATION
122
MALE POPULATION
95
FEMALE POPULATION
128.42
MALES / 100 FEMALES
77.87
FEMALES / 100 MALES
48.5
MEDIAN AGE
3.0
AVG FAMILY SIZE
2.4
AVG HOUSEHOLD SIZE
63
LABOR FORCE [ PEOPLE ]
34.8%
PERCENT IN LABOR FORCE
19.0%
UNEMPLOYMENT RATE
Income in Pueblo Pintado
Income Overview in Pueblo Pintado
Per Capita Income in Pueblo Pintado is $17,353, while median incomes of families and households are $41,786 and $40,536 respectively.
| Characteristic | Number | Measure |
| Per Capita Income | 217 | $17,353 |
| Median Family Income | 64 | $41,786 |
| Mean Family Income | 64 | $44,405 |
| Median Household Income | 89 | $40,536 |
| Mean Household Income | 89 | $40,334 |
| Income Deficit | 64 | $0 |
| Wage / Income Gap (%) | 217 | 6.51% |
| Wage / Income Gap ($) | 217 | 93.49¢ per $1 |
| Gini / Inequality Index | 217 | 0.43 |
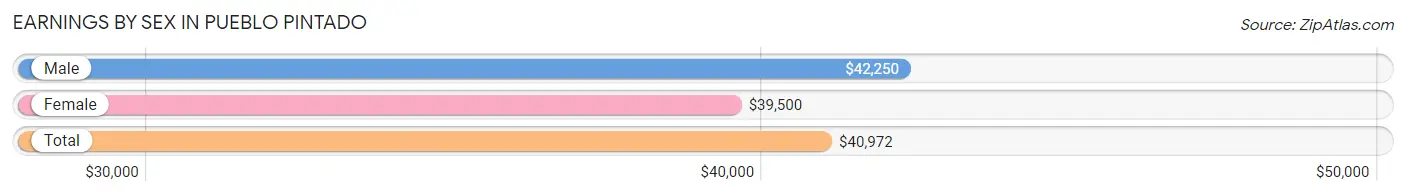
Earnings by Sex in Pueblo Pintado
Average Earnings in Pueblo Pintado are $40,972, $42,250 for men and $39,500 for women, a difference of 6.5%.
| Sex | Number | Average Earnings |
| Male | 23 (39.0%) | $42,250 |
| Female | 36 (61.0%) | $39,500 |
| Total | 59 (100.0%) | $40,972 |
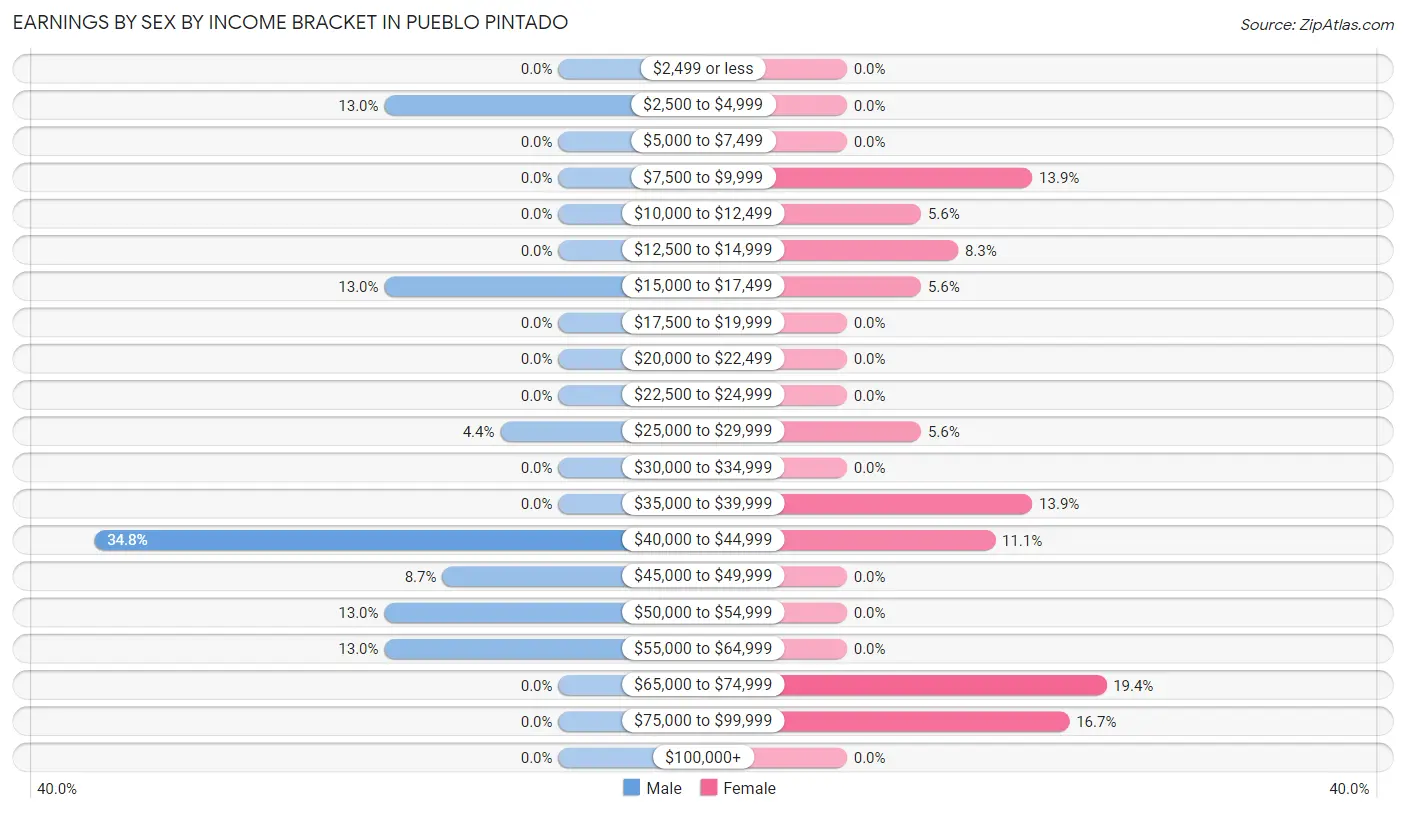
Earnings by Sex by Income Bracket in Pueblo Pintado
The most common earnings brackets in Pueblo Pintado are $40,000 to $44,999 for men (8 | 34.8%) and $65,000 to $74,999 for women (7 | 19.4%).
| Income | Male | Female |
| $2,499 or less | 0 (0.0%) | 0 (0.0%) |
| $2,500 to $4,999 | 3 (13.0%) | 0 (0.0%) |
| $5,000 to $7,499 | 0 (0.0%) | 0 (0.0%) |
| $7,500 to $9,999 | 0 (0.0%) | 5 (13.9%) |
| $10,000 to $12,499 | 0 (0.0%) | 2 (5.6%) |
| $12,500 to $14,999 | 0 (0.0%) | 3 (8.3%) |
| $15,000 to $17,499 | 3 (13.0%) | 2 (5.6%) |
| $17,500 to $19,999 | 0 (0.0%) | 0 (0.0%) |
| $20,000 to $22,499 | 0 (0.0%) | 0 (0.0%) |
| $22,500 to $24,999 | 0 (0.0%) | 0 (0.0%) |
| $25,000 to $29,999 | 1 (4.3%) | 2 (5.6%) |
| $30,000 to $34,999 | 0 (0.0%) | 0 (0.0%) |
| $35,000 to $39,999 | 0 (0.0%) | 5 (13.9%) |
| $40,000 to $44,999 | 8 (34.8%) | 4 (11.1%) |
| $45,000 to $49,999 | 2 (8.7%) | 0 (0.0%) |
| $50,000 to $54,999 | 3 (13.0%) | 0 (0.0%) |
| $55,000 to $64,999 | 3 (13.0%) | 0 (0.0%) |
| $65,000 to $74,999 | 0 (0.0%) | 7 (19.4%) |
| $75,000 to $99,999 | 0 (0.0%) | 6 (16.7%) |
| $100,000+ | 0 (0.0%) | 0 (0.0%) |
| Total | 23 (100.0%) | 36 (100.0%) |
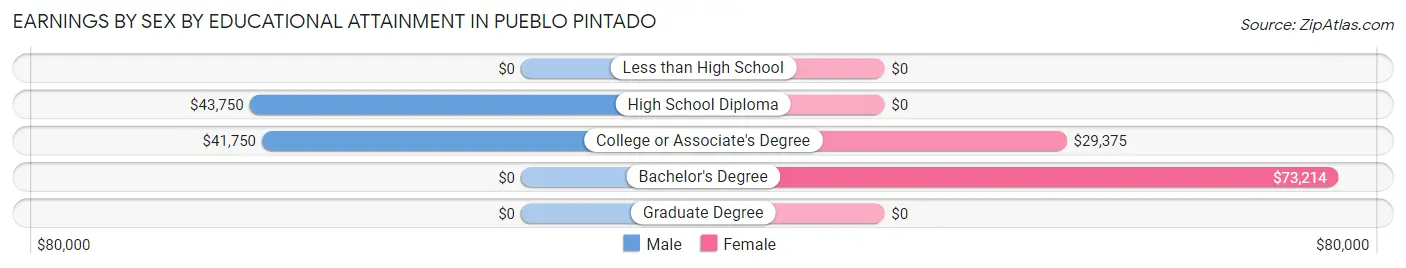
Earnings by Sex by Educational Attainment in Pueblo Pintado
Average earnings in Pueblo Pintado are $43,333 for men and $39,500 for women, a difference of 8.8%. Men with an educational attainment of high school diploma enjoy the highest average annual earnings of $43,750, while those with college or associate's degree education earn the least with $41,750. Women with an educational attainment of bachelor's degree earn the most with the average annual earnings of $73,214, while those with college or associate's degree education have the smallest earnings of $29,375.
| Educational Attainment | Male Income | Female Income |
| Less than High School | - | - |
| High School Diploma | $43,750 | $0 |
| College or Associate's Degree | $41,750 | $29,375 |
| Bachelor's Degree | - | - |
| Graduate Degree | - | - |
| Total | $43,333 | $39,500 |
Family Income in Pueblo Pintado
Family Income Brackets in Pueblo Pintado
According to the Pueblo Pintado family income data, there are 23 families falling into the $35,000 to $49,999 income range, which is the most common income bracket and makes up 35.9% of all families.
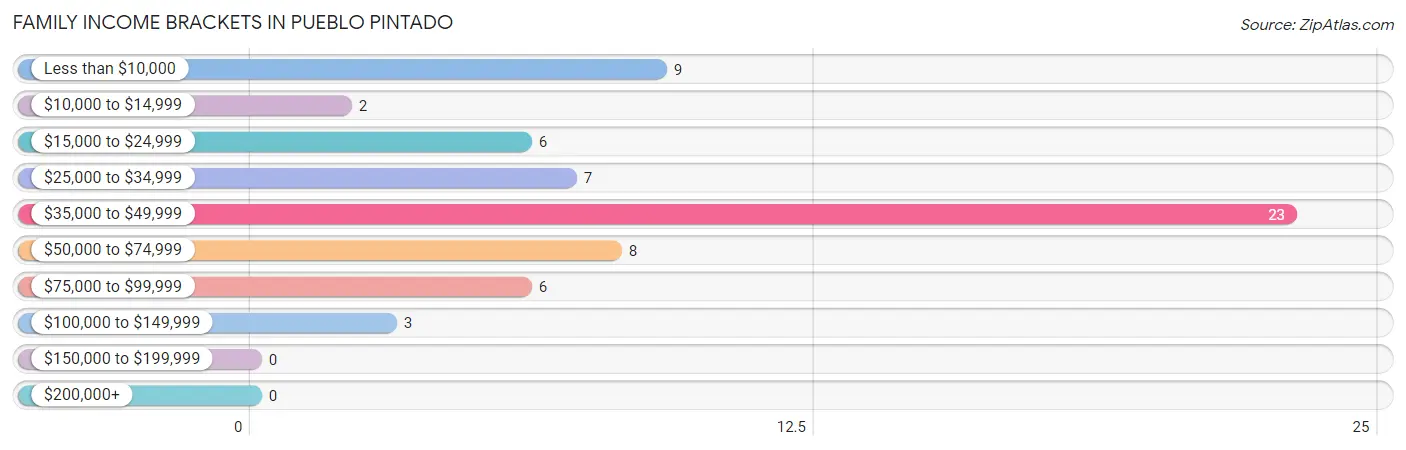
| Income Bracket | # Families | % Families |
| Less than $10,000 | 9 | 14.1% |
| $10,000 to $14,999 | 2 | 3.1% |
| $15,000 to $24,999 | 6 | 9.4% |
| $25,000 to $34,999 | 7 | 10.9% |
| $35,000 to $49,999 | 23 | 35.9% |
| $50,000 to $74,999 | 8 | 12.5% |
| $75,000 to $99,999 | 6 | 9.4% |
| $100,000 to $149,999 | 3 | 4.7% |
| $150,000 to $199,999 | 0 | 0.0% |
| $200,000+ | 0 | 0.0% |
Family Income by Famaliy Size in Pueblo Pintado
5-person families (9 | 14.1%) account for the highest median family income in Pueblo Pintado with $89,063 per family, while 2-person families (40 | 62.5%) have the highest median income of $18,334 per family member.
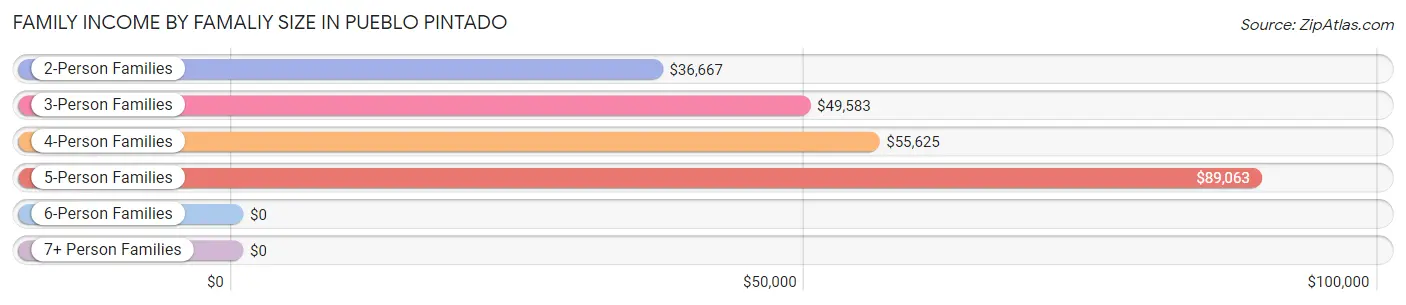
| Income Bracket | # Families | Median Income |
| 2-Person Families | 40 (62.5%) | $36,667 |
| 3-Person Families | 9 (14.1%) | $49,583 |
| 4-Person Families | 6 (9.4%) | $55,625 |
| 5-Person Families | 9 (14.1%) | $89,063 |
| 6-Person Families | 0 (0.0%) | $0 |
| 7+ Person Families | 0 (0.0%) | $0 |
| Total | 64 (100.0%) | $41,786 |
Family Income by Number of Earners in Pueblo Pintado
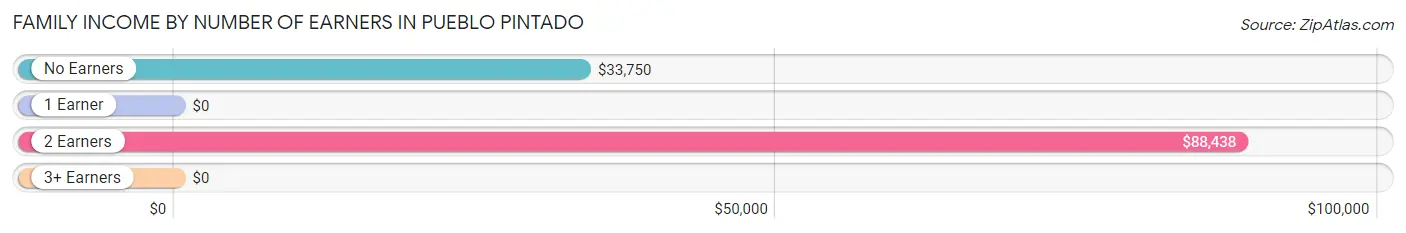
| Number of Earners | # Families | Median Income |
| No Earners | 36 (56.2%) | $33,750 |
| 1 Earner | 13 (20.3%) | $0 |
| 2 Earners | 15 (23.4%) | $88,438 |
| 3+ Earners | 0 (0.0%) | $0 |
| Total | 64 (100.0%) | $41,786 |
Household Income in Pueblo Pintado
Household Income Brackets in Pueblo Pintado
With 27 households falling in the category, the $35,000 to $49,999 income range is the most frequent in Pueblo Pintado, accounting for 30.3% of all households.
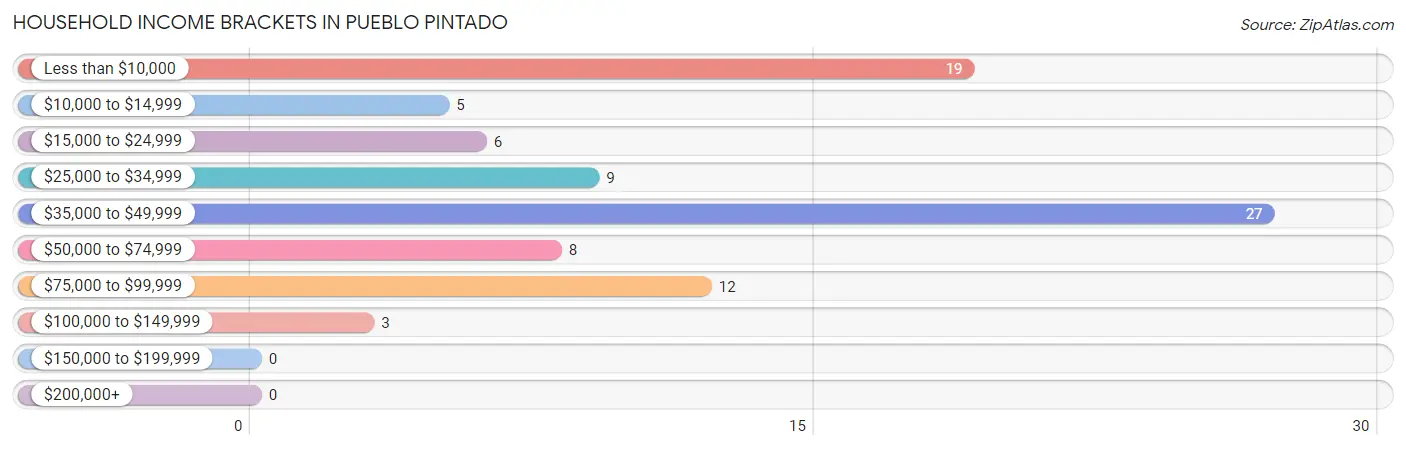
| Income Bracket | # Households | % Households |
| Less than $10,000 | 19 | 21.3% |
| $10,000 to $14,999 | 5 | 5.6% |
| $15,000 to $24,999 | 6 | 6.7% |
| $25,000 to $34,999 | 9 | 10.1% |
| $35,000 to $49,999 | 27 | 30.3% |
| $50,000 to $74,999 | 8 | 9.0% |
| $75,000 to $99,999 | 12 | 13.5% |
| $100,000 to $149,999 | 3 | 3.4% |
| $150,000 to $199,999 | 0 | 0.0% |
| $200,000+ | 0 | 0.0% |
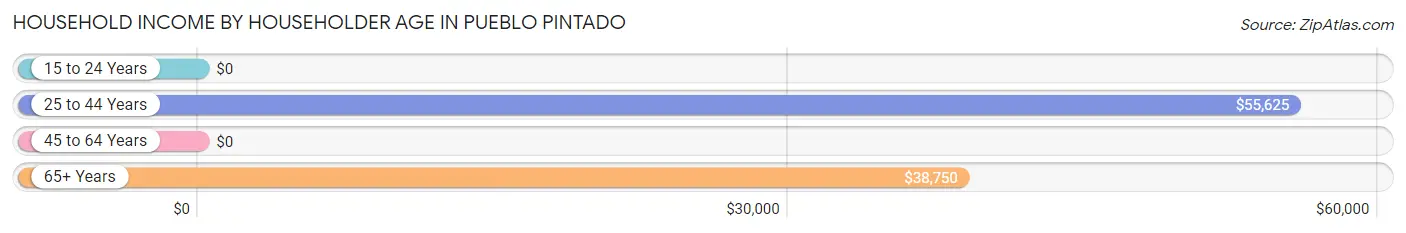
Household Income by Householder Age in Pueblo Pintado
The median household income in Pueblo Pintado is $40,536, with the highest median household income of $55,625 found in the 25 to 44 years age bracket for the primary householder. A total of 12 households (13.5%) fall into this category. Meanwhile, the 15 to 24 years age bracket for the primary householder has the lowest median household income of $0, with 3 households (3.4%) in this group.
| Income Bracket | # Households | Median Income |
| 15 to 24 Years | 3 (3.4%) | $0 |
| 25 to 44 Years | 12 (13.5%) | $55,625 |
| 45 to 64 Years | 44 (49.4%) | $0 |
| 65+ Years | 30 (33.7%) | $38,750 |
| Total | 89 (100.0%) | $40,536 |
Poverty in Pueblo Pintado
Income Below Poverty by Sex and Age in Pueblo Pintado
With 34.4% poverty level for males and 22.1% for females among the residents of Pueblo Pintado, 15 year old males and 5 year old females are the most vulnerable to poverty, with 3 males (100.0%) and 2 females (100.0%) in their respective age groups living below the poverty level.
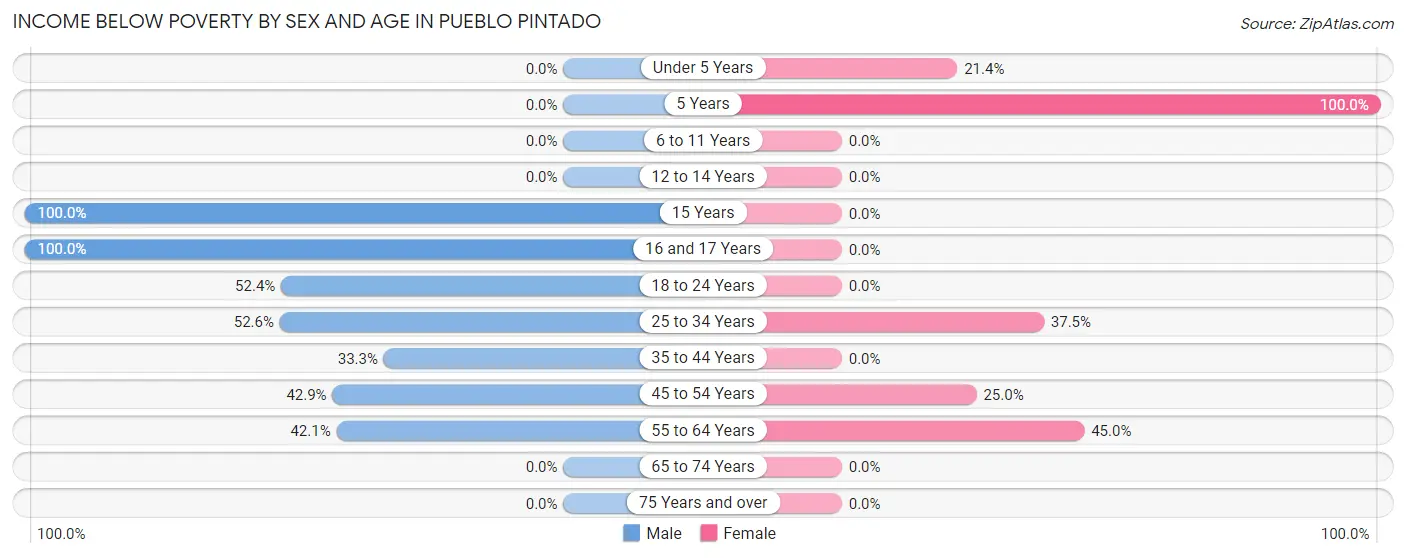
| Age Bracket | Male | Female |
| Under 5 Years | 0 (0.0%) | 3 (21.4%) |
| 5 Years | 0 (0.0%) | 2 (100.0%) |
| 6 to 11 Years | 0 (0.0%) | 0 (0.0%) |
| 12 to 14 Years | 0 (0.0%) | 0 (0.0%) |
| 15 Years | 3 (100.0%) | 0 (0.0%) |
| 16 and 17 Years | 2 (100.0%) | 0 (0.0%) |
| 18 to 24 Years | 11 (52.4%) | 0 (0.0%) |
| 25 to 34 Years | 10 (52.6%) | 3 (37.5%) |
| 35 to 44 Years | 2 (33.3%) | 0 (0.0%) |
| 45 to 54 Years | 6 (42.9%) | 4 (25.0%) |
| 55 to 64 Years | 8 (42.1%) | 9 (45.0%) |
| 65 to 74 Years | 0 (0.0%) | 0 (0.0%) |
| 75 Years and over | 0 (0.0%) | 0 (0.0%) |
| Total | 42 (34.4%) | 21 (22.1%) |
Income Above Poverty by Sex and Age in Pueblo Pintado
According to the poverty statistics in Pueblo Pintado, males aged 6 to 11 years and females aged 6 to 11 years are the age groups that are most secure financially, with 100.0% of males and 100.0% of females in these age groups living above the poverty line.
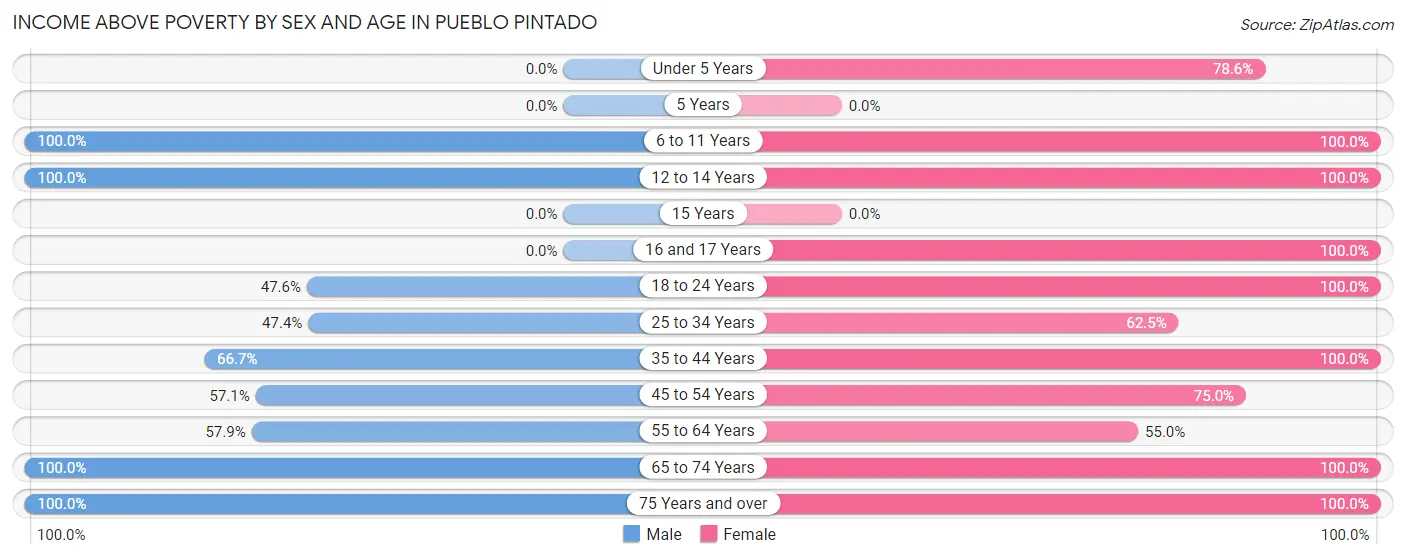
| Age Bracket | Male | Female |
| Under 5 Years | 0 (0.0%) | 11 (78.6%) |
| 5 Years | 0 (0.0%) | 0 (0.0%) |
| 6 to 11 Years | 2 (100.0%) | 3 (100.0%) |
| 12 to 14 Years | 9 (100.0%) | 3 (100.0%) |
| 15 Years | 0 (0.0%) | 0 (0.0%) |
| 16 and 17 Years | 0 (0.0%) | 3 (100.0%) |
| 18 to 24 Years | 10 (47.6%) | 5 (100.0%) |
| 25 to 34 Years | 9 (47.4%) | 5 (62.5%) |
| 35 to 44 Years | 4 (66.7%) | 3 (100.0%) |
| 45 to 54 Years | 8 (57.1%) | 12 (75.0%) |
| 55 to 64 Years | 11 (57.9%) | 11 (55.0%) |
| 65 to 74 Years | 20 (100.0%) | 10 (100.0%) |
| 75 Years and over | 7 (100.0%) | 8 (100.0%) |
| Total | 80 (65.6%) | 74 (77.9%) |
Income Below Poverty Among Married-Couple Families in Pueblo Pintado
The poverty statistics for married-couple families in Pueblo Pintado show that 4.0% or 2 of the total 50 families live below the poverty line. Families with no children have the highest poverty rate of 5.7%, comprising of 2 families. On the other hand, families with 1 or 2 children have the lowest poverty rate of 0.0%, which includes 0 families.
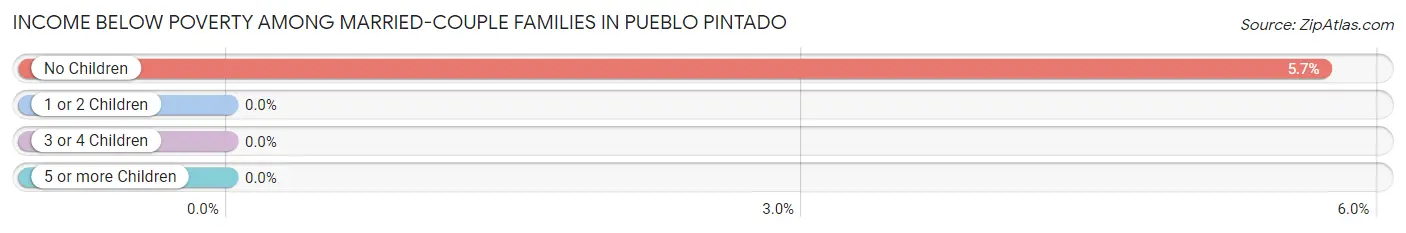
| Children | Above Poverty | Below Poverty |
| No Children | 33 (94.3%) | 2 (5.7%) |
| 1 or 2 Children | 15 (100.0%) | 0 (0.0%) |
| 3 or 4 Children | 0 (0.0%) | 0 (0.0%) |
| 5 or more Children | 0 (0.0%) | 0 (0.0%) |
| Total | 48 (96.0%) | 2 (4.0%) |
Income Below Poverty Among Single-Parent Households in Pueblo Pintado
According to the poverty data in Pueblo Pintado, 50.0% or 3 single-father households and 100.0% or 8 single-mother households are living below the poverty line. Among single-father households, those with no children have the highest poverty rate, with 3 households (50.0%) experiencing poverty. Likewise, among single-mother households, those with no children have the highest poverty rate, with 2 households (100.0%) falling below the poverty line.
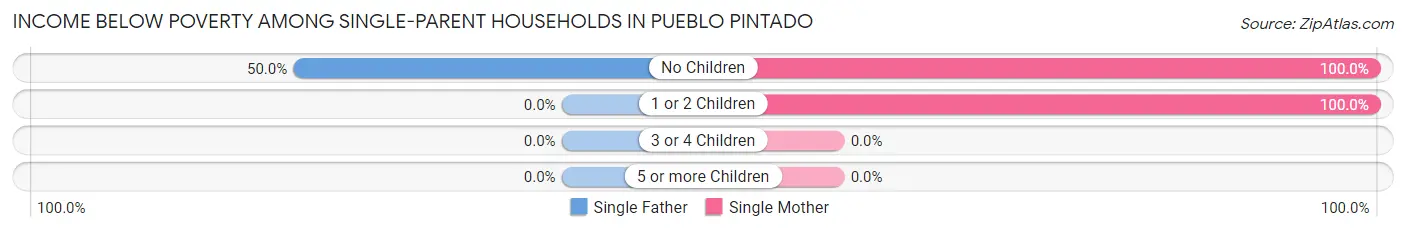
| Children | Single Father | Single Mother |
| No Children | 3 (50.0%) | 2 (100.0%) |
| 1 or 2 Children | 0 (0.0%) | 6 (100.0%) |
| 3 or 4 Children | 0 (0.0%) | 0 (0.0%) |
| 5 or more Children | 0 (0.0%) | 0 (0.0%) |
| Total | 3 (50.0%) | 8 (100.0%) |
Income Below Poverty Among Married-Couple vs Single-Parent Households in Pueblo Pintado
The poverty data for Pueblo Pintado shows that 2 of the married-couple family households (4.0%) and 11 of the single-parent households (78.6%) are living below the poverty level. Within the married-couple family households, those with no children have the highest poverty rate, with 2 households (5.7%) falling below the poverty line. Among the single-parent households, those with 1 or 2 children have the highest poverty rate, with 6 household (100.0%) living below poverty.
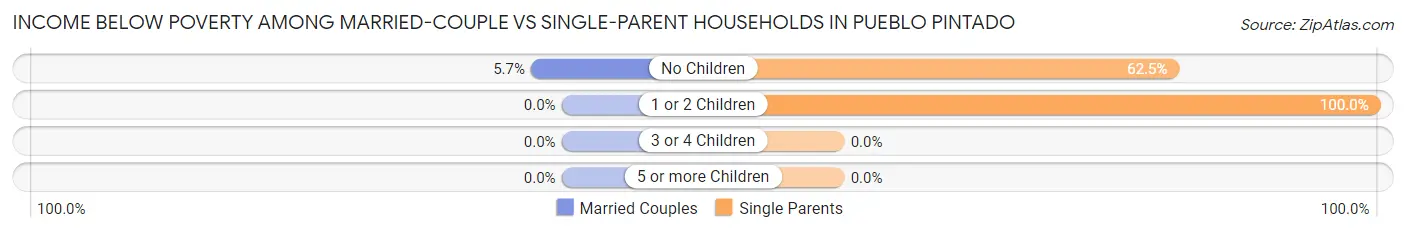
| Children | Married-Couple Families | Single-Parent Households |
| No Children | 2 (5.7%) | 5 (62.5%) |
| 1 or 2 Children | 0 (0.0%) | 6 (100.0%) |
| 3 or 4 Children | 0 (0.0%) | 0 (0.0%) |
| 5 or more Children | 0 (0.0%) | 0 (0.0%) |
| Total | 2 (4.0%) | 11 (78.6%) |
Race in Pueblo Pintado
The most populous races in Pueblo Pintado are Native / Alaskan (197 | 90.8%), Hispanic or Latino (14 | 6.5%), and Some other Race (14 | 6.5%).
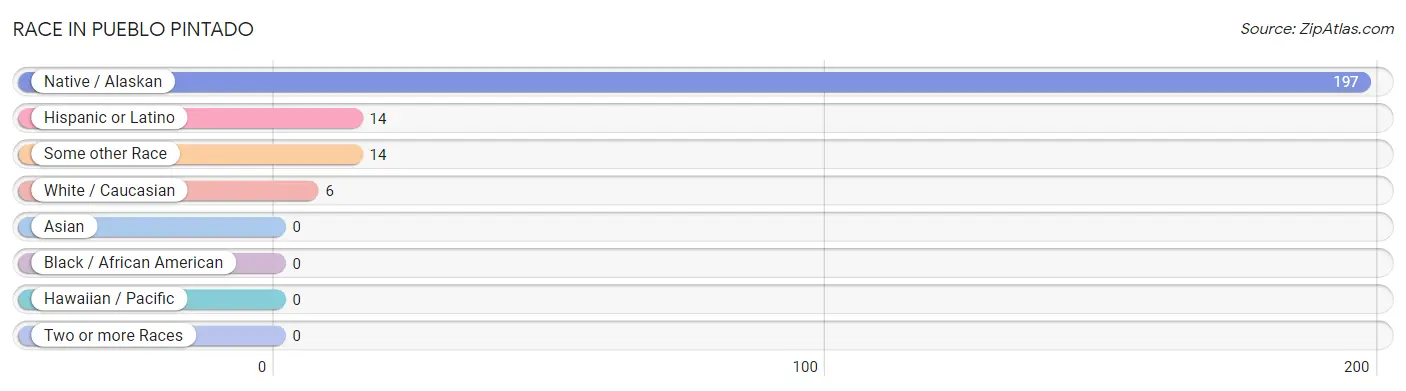
| Race | # Population | % Population |
| Asian | 0 | 0.0% |
| Black / African American | 0 | 0.0% |
| Hawaiian / Pacific | 0 | 0.0% |
| Hispanic or Latino | 14 | 6.5% |
| Native / Alaskan | 197 | 90.8% |
| White / Caucasian | 6 | 2.8% |
| Two or more Races | 0 | 0.0% |
| Some other Race | 14 | 6.5% |
| Total | 217 | 100.0% |
Ancestry in Pueblo Pintado
The most populous ancestries reported in Pueblo Pintado are Navajo (194 | 89.4%), Mexican (14 | 6.5%), German (6 | 2.8%), Scottish (6 | 2.8%), and Apache (3 | 1.4%), together accounting for 102.8% of all Pueblo Pintado residents.
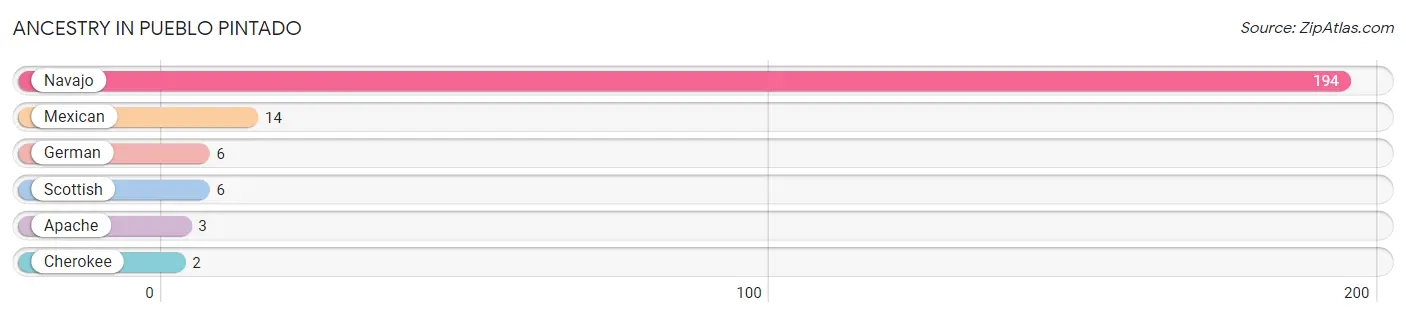
| Ancestry | # Population | % Population |
| Apache | 3 | 1.4% |
| Cherokee | 2 | 0.9% |
| German | 6 | 2.8% |
| Mexican | 14 | 6.5% |
| Navajo | 194 | 89.4% |
| Scottish | 6 | 2.8% | View All 6 Rows |
Immigrants in Pueblo Pintado

| Immigration Origin | # Population | % Population | View All 0 Rows |
Sex and Age in Pueblo Pintado
Sex and Age in Pueblo Pintado
The most populous age groups in Pueblo Pintado are 20 to 24 Years (21 | 17.2%) for men and 55 to 59 Years (15 | 15.8%) for women.
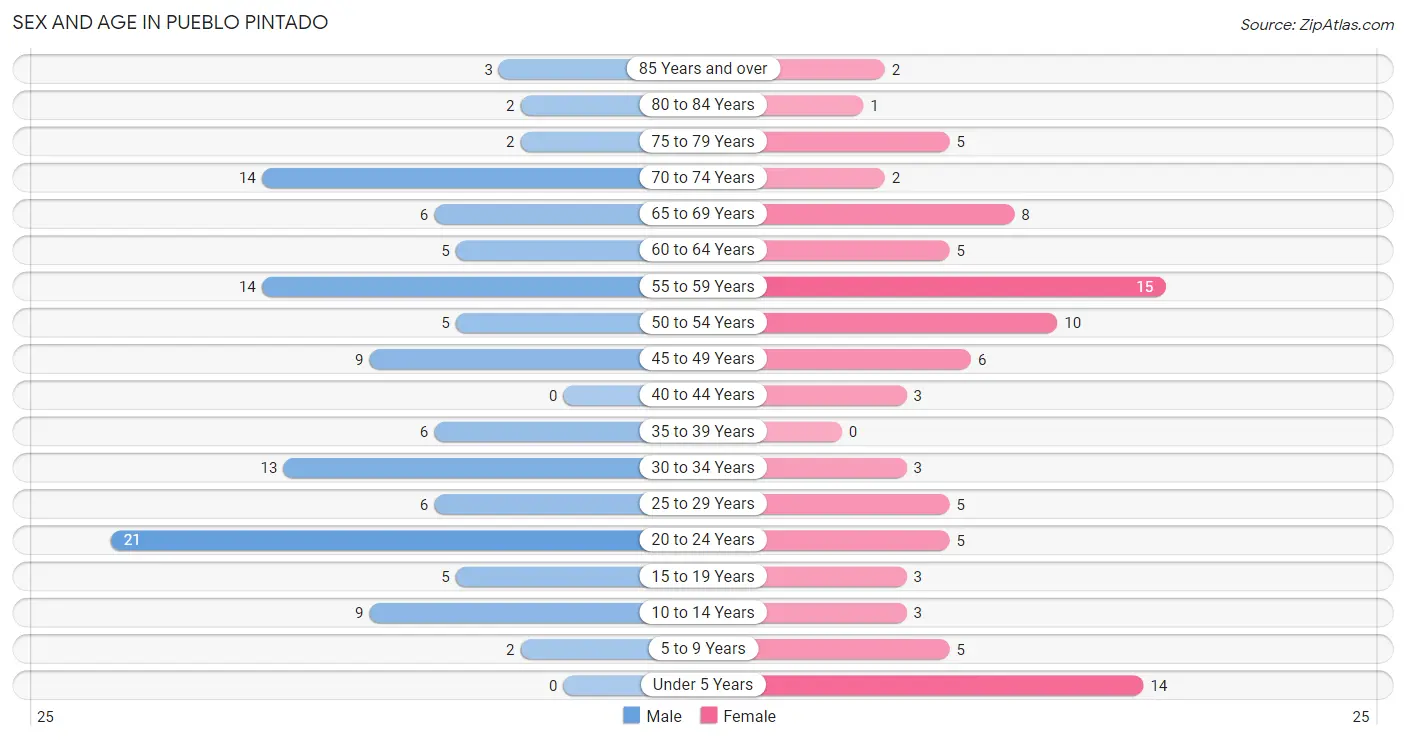
| Age Bracket | Male | Female |
| Under 5 Years | 0 (0.0%) | 14 (14.7%) |
| 5 to 9 Years | 2 (1.6%) | 5 (5.3%) |
| 10 to 14 Years | 9 (7.4%) | 3 (3.2%) |
| 15 to 19 Years | 5 (4.1%) | 3 (3.2%) |
| 20 to 24 Years | 21 (17.2%) | 5 (5.3%) |
| 25 to 29 Years | 6 (4.9%) | 5 (5.3%) |
| 30 to 34 Years | 13 (10.7%) | 3 (3.2%) |
| 35 to 39 Years | 6 (4.9%) | 0 (0.0%) |
| 40 to 44 Years | 0 (0.0%) | 3 (3.2%) |
| 45 to 49 Years | 9 (7.4%) | 6 (6.3%) |
| 50 to 54 Years | 5 (4.1%) | 10 (10.5%) |
| 55 to 59 Years | 14 (11.5%) | 15 (15.8%) |
| 60 to 64 Years | 5 (4.1%) | 5 (5.3%) |
| 65 to 69 Years | 6 (4.9%) | 8 (8.4%) |
| 70 to 74 Years | 14 (11.5%) | 2 (2.1%) |
| 75 to 79 Years | 2 (1.6%) | 5 (5.3%) |
| 80 to 84 Years | 2 (1.6%) | 1 (1.1%) |
| 85 Years and over | 3 (2.5%) | 2 (2.1%) |
| Total | 122 (100.0%) | 95 (100.0%) |
Families and Households in Pueblo Pintado
Median Family Size in Pueblo Pintado
The median family size in Pueblo Pintado is 2.95 persons per family, with single female/mother families (8 | 12.5%) accounting for the largest median family size of 4.13 persons per family. On the other hand, single male/father families (6 | 9.4%) represent the smallest median family size with 2.17 persons per family.
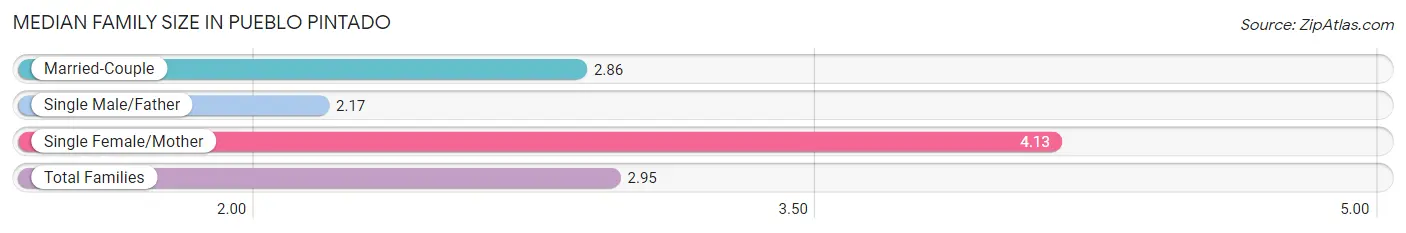
| Family Type | # Families | Family Size |
| Married-Couple | 50 (78.1%) | 2.86 |
| Single Male/Father | 6 (9.4%) | 2.17 |
| Single Female/Mother | 8 (12.5%) | 4.13 |
| Total Families | 64 (100.0%) | 2.95 |
Median Household Size in Pueblo Pintado
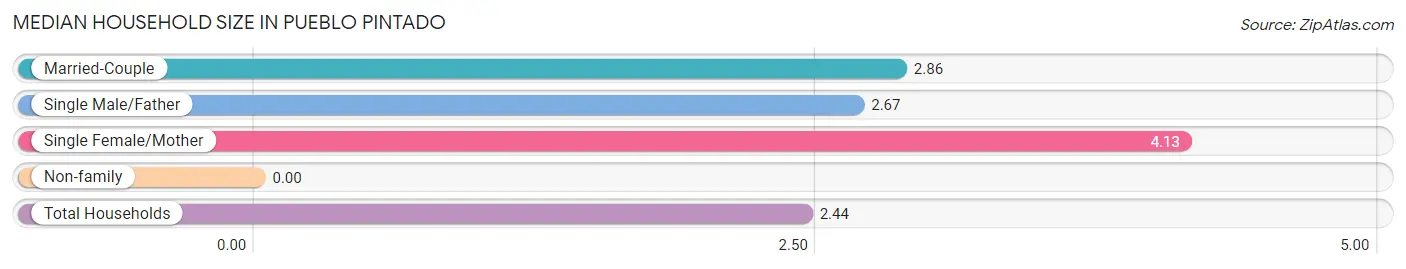
| Household Type | # Households | Household Size |
| Married-Couple | 50 (56.2%) | 2.86 |
| Single Male/Father | 6 (6.7%) | 2.67 |
| Single Female/Mother | 8 (9.0%) | 4.13 |
| Non-family | 25 (28.1%) | - |
| Total Households | 89 (100.0%) | 2.44 |
Household Size by Marriage Status in Pueblo Pintado
Out of a total of 89 households in Pueblo Pintado, 64 (71.9%) are family households, while 25 (28.1%) are nonfamily households. The most numerous type of family households are 2-person households, comprising 37, and the most common type of nonfamily households are 1-person households, comprising 25.
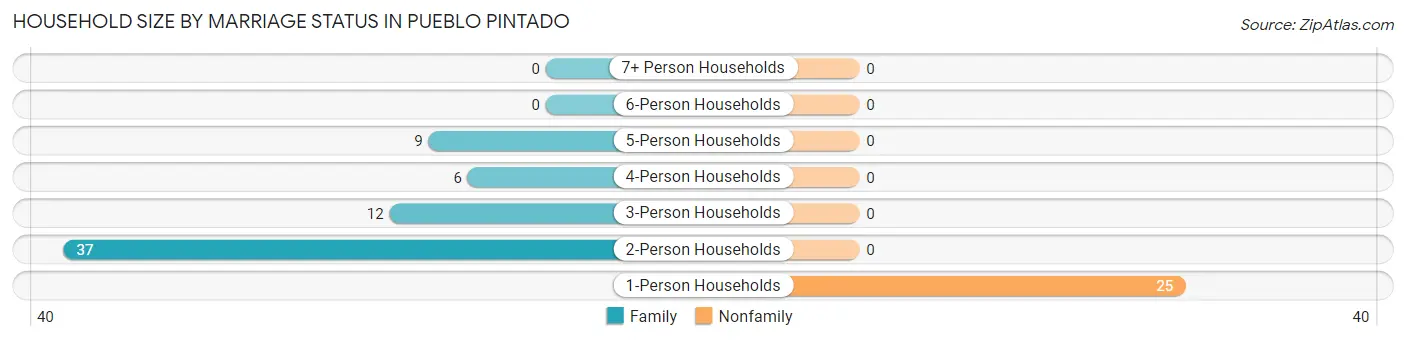
| Household Size | Family Households | Nonfamily Households |
| 1-Person Households | - | 25 (28.1%) |
| 2-Person Households | 37 (41.6%) | 0 (0.0%) |
| 3-Person Households | 12 (13.5%) | 0 (0.0%) |
| 4-Person Households | 6 (6.7%) | 0 (0.0%) |
| 5-Person Households | 9 (10.1%) | 0 (0.0%) |
| 6-Person Households | 0 (0.0%) | 0 (0.0%) |
| 7+ Person Households | 0 (0.0%) | 0 (0.0%) |
| Total | 64 (71.9%) | 25 (28.1%) |
Female Fertility in Pueblo Pintado
Fertility by Age in Pueblo Pintado
| Age Bracket | Women with Births | Births / 1,000 Women |
| 15 to 19 years | 0 (0.0%) | 0.0 |
| 20 to 34 years | 0 (0.0%) | 0.0 |
| 35 to 50 years | 0 (0.0%) | 0.0 |
| Total | 0 (0.0%) | 0.0 |
Fertility by Age by Marriage Status in Pueblo Pintado
| Age Bracket | Married | Unmarried |
| 15 to 19 years | 0 (0.0%) | 0 (0.0%) |
| 20 to 34 years | 0 (0.0%) | 0 (0.0%) |
| 35 to 50 years | 0 (0.0%) | 0 (0.0%) |
| Total | 0 (0.0%) | 0 (0.0%) |
Fertility by Education in Pueblo Pintado
| Educational Attainment | Women with Births | Births / 1,000 Women |
| Less than High School | 0 (0.0%) | 0.0 |
| High School Diploma | 0 (0.0%) | 0.0 |
| College or Associate's Degree | 0 (0.0%) | 0.0 |
| Bachelor's Degree | 0 (0.0%) | 0.0 |
| Graduate Degree | 0 (0.0%) | 0.0 |
| Total | 0 (0.0%) | 0.0 |
Fertility by Education by Marriage Status in Pueblo Pintado
| Educational Attainment | Married | Unmarried |
| Less than High School | 0 (0.0%) | 0 (0.0%) |
| High School Diploma | 0 (0.0%) | 0 (0.0%) |
| College or Associate's Degree | 0 (0.0%) | 0 (0.0%) |
| Bachelor's Degree | 0 (0.0%) | 0 (0.0%) |
| Graduate Degree | 0 (0.0%) | 0 (0.0%) |
| Total | 0 (0.0%) | 0 (0.0%) |
Employment Characteristics in Pueblo Pintado
Employment by Class of Employer in Pueblo Pintado
Among the 51 employed individuals in Pueblo Pintado, federal government employees (18 | 35.3%), private company employees (15 | 29.4%), and local government employees (13 | 25.5%) make up the most common classes of employment.
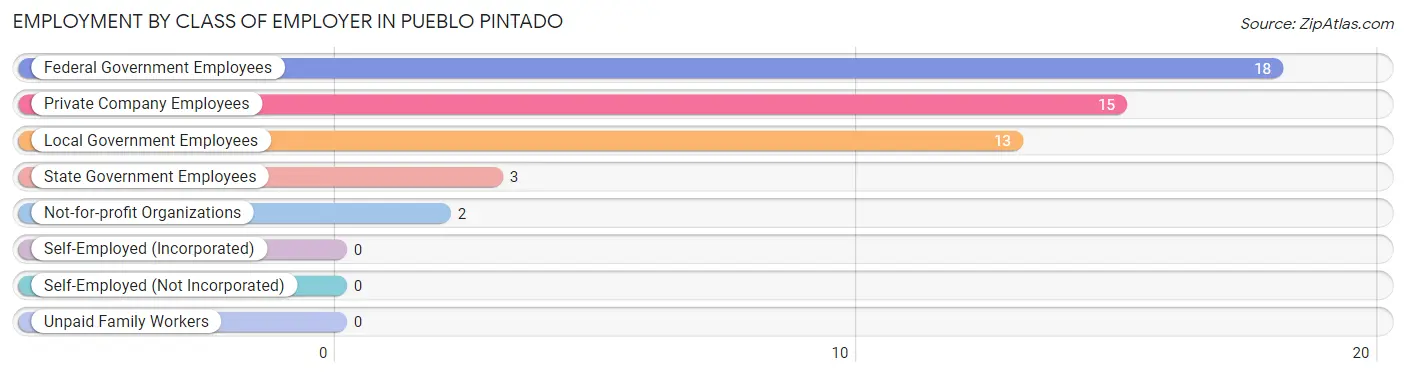
| Employer Class | # Employees | % Employees |
| Private Company Employees | 15 | 29.4% |
| Self-Employed (Incorporated) | 0 | 0.0% |
| Self-Employed (Not Incorporated) | 0 | 0.0% |
| Not-for-profit Organizations | 2 | 3.9% |
| Local Government Employees | 13 | 25.5% |
| State Government Employees | 3 | 5.9% |
| Federal Government Employees | 18 | 35.3% |
| Unpaid Family Workers | 0 | 0.0% |
| Total | 51 | 100.0% |
Employment Status by Age in Pueblo Pintado
According to the labor force statistics for Pueblo Pintado, out of the total population over 16 years of age (181), 34.8% or 63 individuals are in the labor force, with 19.0% or 12 of them unemployed. The age group with the highest labor force participation rate is 25 to 29 years, with 100.0% or 11 individuals in the labor force. Within the labor force, the 20 to 24 years age range has the highest percentage of unemployed individuals, with 100.0% or 5 of them being unemployed.
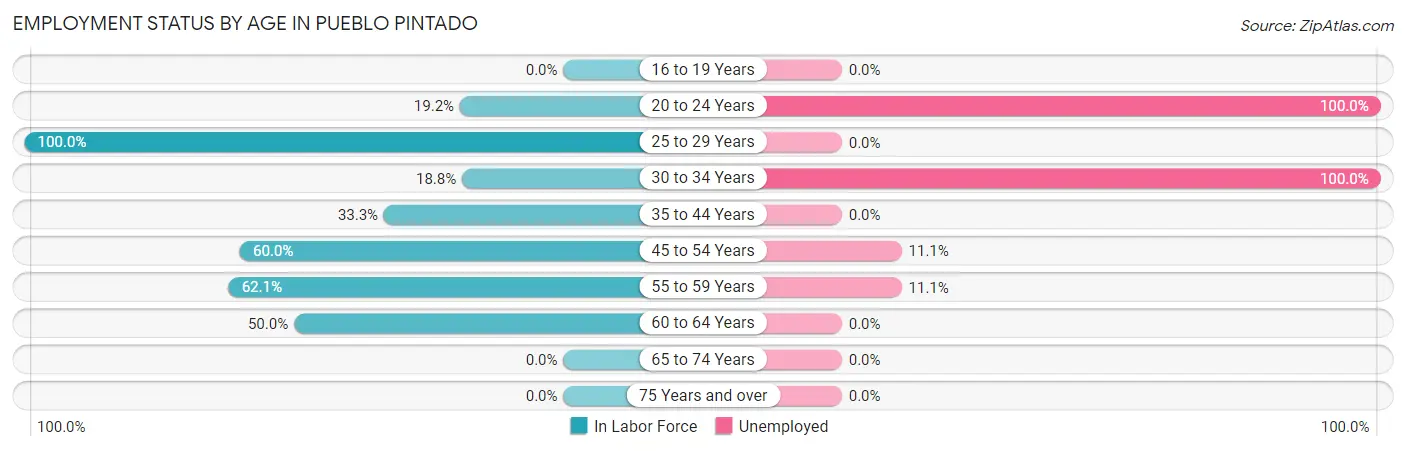
| Age Bracket | In Labor Force | Unemployed |
| 16 to 19 Years | 0 (0.0%) | 0 (0.0%) |
| 20 to 24 Years | 5 (19.2%) | 5 (100.0%) |
| 25 to 29 Years | 11 (100.0%) | 0 (0.0%) |
| 30 to 34 Years | 3 (18.8%) | 3 (100.0%) |
| 35 to 44 Years | 3 (33.3%) | 0 (0.0%) |
| 45 to 54 Years | 18 (60.0%) | 2 (11.1%) |
| 55 to 59 Years | 18 (62.1%) | 2 (11.1%) |
| 60 to 64 Years | 5 (50.0%) | 0 (0.0%) |
| 65 to 74 Years | 0 (0.0%) | 0 (0.0%) |
| 75 Years and over | 0 (0.0%) | 0 (0.0%) |
| Total | 63 (34.8%) | 12 (19.0%) |
Employment Status by Educational Attainment in Pueblo Pintado
According to labor force statistics for Pueblo Pintado, 55.2% of individuals (58) out of the total population between 25 and 64 years of age (105) are in the labor force, with 12.1% or 7 of them being unemployed. The group with the highest labor force participation rate are those with the educational attainment of bachelor's degree or higher, with 100.0% or 16 individuals in the labor force. Within the labor force, individuals with high school diploma education have the highest percentage of unemployment, with 38.5% or 5 of them being unemployed.
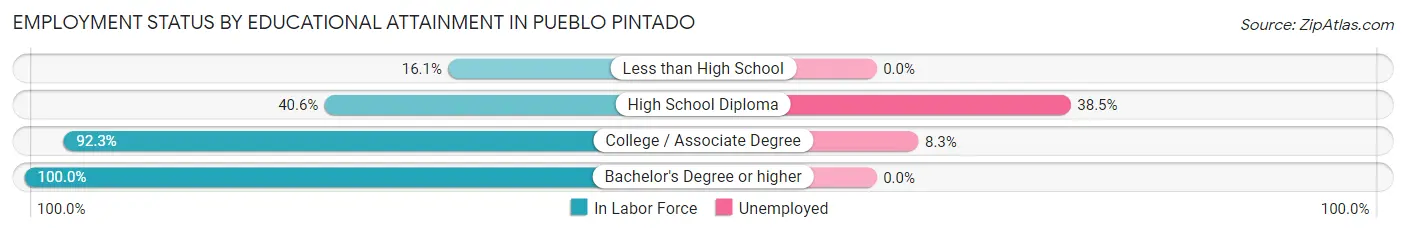
| Educational Attainment | In Labor Force | Unemployed |
| Less than High School | 5 (16.1%) | 0 (0.0%) |
| High School Diploma | 13 (40.6%) | 12 (38.5%) |
| College / Associate Degree | 24 (92.3%) | 2 (8.3%) |
| Bachelor's Degree or higher | 16 (100.0%) | 0 (0.0%) |
| Total | 58 (55.2%) | 13 (12.1%) |
Employment Occupations by Sex in Pueblo Pintado
Management, Business, Science and Arts Occupations
The most common Management, Business, Science and Arts occupations in Pueblo Pintado are Community & Social Service (22 | 43.1%), and Education Instruction & Library (22 | 43.1%).
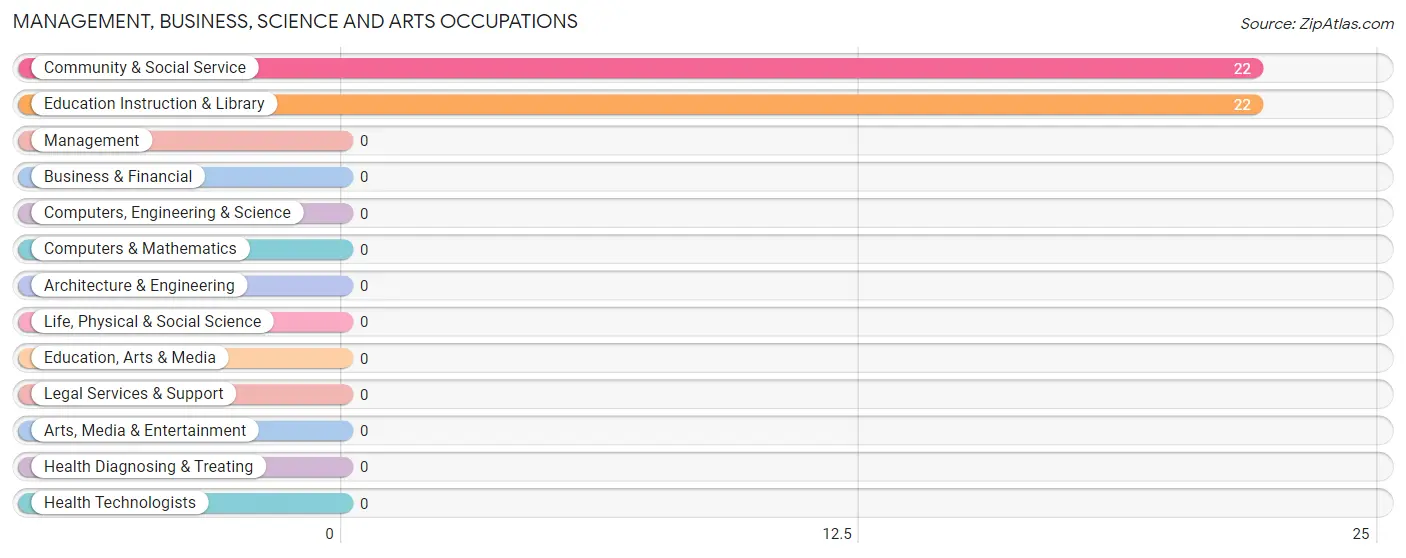
Management, Business, Science and Arts Occupations by Sex
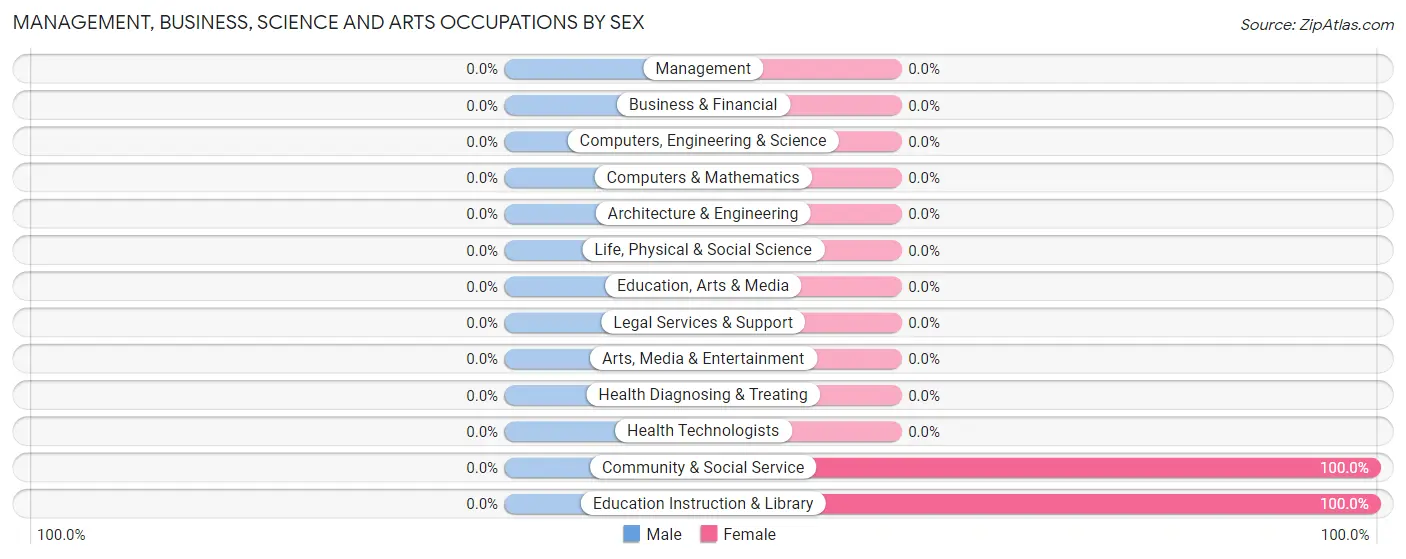
| Occupation | Male | Female |
| Management | 0 (0.0%) | 0 (0.0%) |
| Business & Financial | 0 (0.0%) | 0 (0.0%) |
| Computers, Engineering & Science | 0 (0.0%) | 0 (0.0%) |
| Computers & Mathematics | 0 (0.0%) | 0 (0.0%) |
| Architecture & Engineering | 0 (0.0%) | 0 (0.0%) |
| Life, Physical & Social Science | 0 (0.0%) | 0 (0.0%) |
| Community & Social Service | 0 (0.0%) | 22 (100.0%) |
| Education, Arts & Media | 0 (0.0%) | 0 (0.0%) |
| Legal Services & Support | 0 (0.0%) | 0 (0.0%) |
| Education Instruction & Library | 0 (0.0%) | 22 (100.0%) |
| Arts, Media & Entertainment | 0 (0.0%) | 0 (0.0%) |
| Health Diagnosing & Treating | 0 (0.0%) | 0 (0.0%) |
| Health Technologists | 0 (0.0%) | 0 (0.0%) |
| Total (Category) | 0 (0.0%) | 22 (100.0%) |
| Total (Overall) | 17 (33.3%) | 34 (66.7%) |
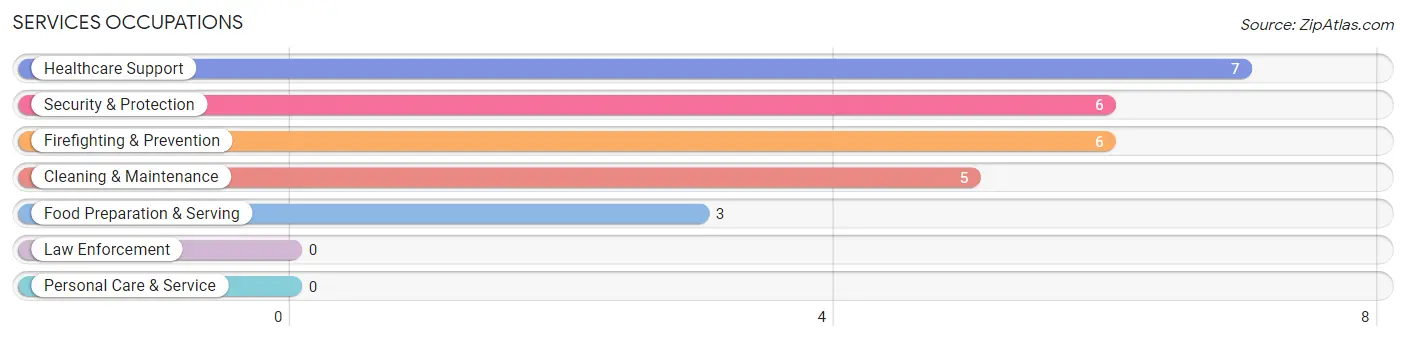
Services Occupations
The most common Services occupations in Pueblo Pintado are Healthcare Support (7 | 13.7%), Security & Protection (6 | 11.8%), Firefighting & Prevention (6 | 11.8%), Cleaning & Maintenance (5 | 9.8%), and Food Preparation & Serving (3 | 5.9%).
Services Occupations by Sex
Within the Services occupations in Pueblo Pintado, the most male-oriented occupations are Security & Protection (100.0%), Firefighting & Prevention (100.0%), and Cleaning & Maintenance (60.0%), while the most female-oriented occupations are Healthcare Support (100.0%), Food Preparation & Serving (100.0%), and Cleaning & Maintenance (40.0%).
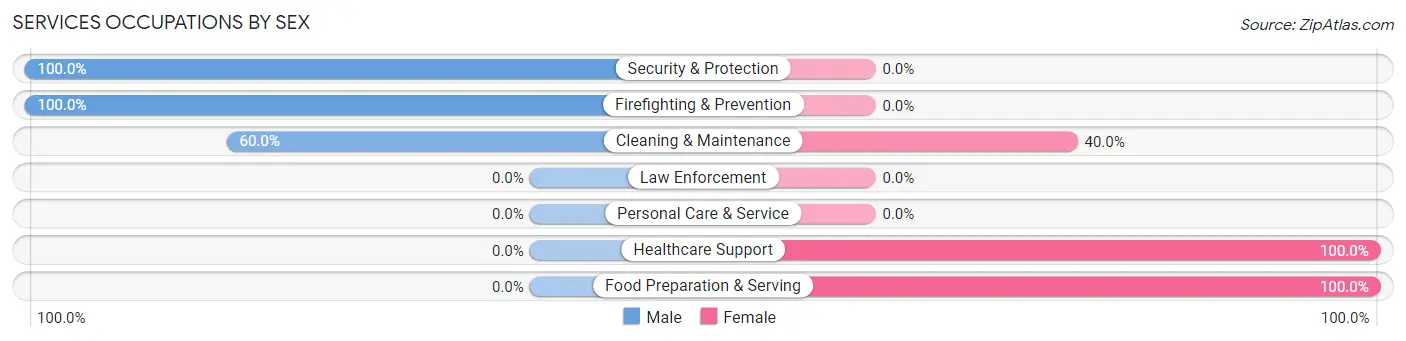
| Occupation | Male | Female |
| Healthcare Support | 0 (0.0%) | 7 (100.0%) |
| Security & Protection | 6 (100.0%) | 0 (0.0%) |
| Firefighting & Prevention | 6 (100.0%) | 0 (0.0%) |
| Law Enforcement | 0 (0.0%) | 0 (0.0%) |
| Food Preparation & Serving | 0 (0.0%) | 3 (100.0%) |
| Cleaning & Maintenance | 3 (60.0%) | 2 (40.0%) |
| Personal Care & Service | 0 (0.0%) | 0 (0.0%) |
| Total (Category) | 9 (42.9%) | 12 (57.1%) |
| Total (Overall) | 17 (33.3%) | 34 (66.7%) |
Sales and Office Occupations

Sales and Office Occupations by Sex
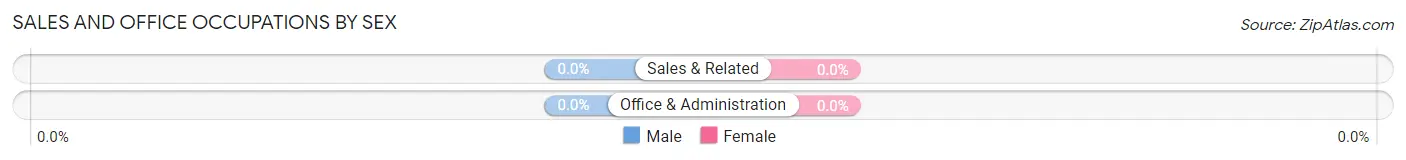
| Occupation | Male | Female |
| Sales & Related | 0 (0.0%) | 0 (0.0%) |
| Office & Administration | 0 (0.0%) | 0 (0.0%) |
| Total (Category) | 0 (0.0%) | 0 (0.0%) |
| Total (Overall) | 17 (33.3%) | 34 (66.7%) |
Natural Resources, Construction and Maintenance Occupations
The most common Natural Resources, Construction and Maintenance occupations in Pueblo Pintado are , and Construction & Extraction (5 | 9.8%).
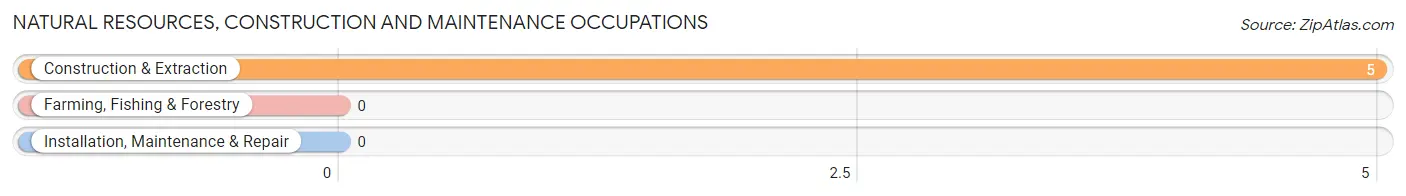
Natural Resources, Construction and Maintenance Occupations by Sex
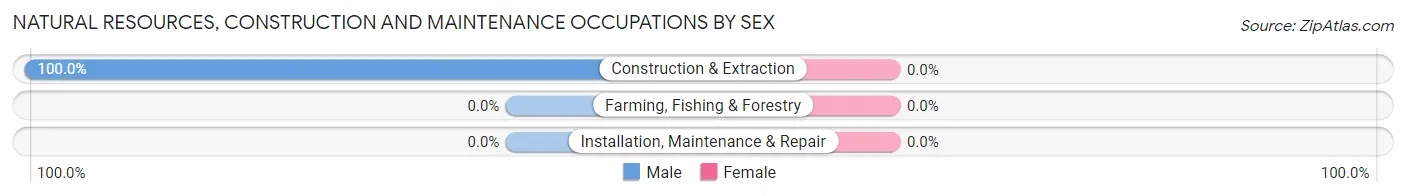
| Occupation | Male | Female |
| Farming, Fishing & Forestry | 0 (0.0%) | 0 (0.0%) |
| Construction & Extraction | 5 (100.0%) | 0 (0.0%) |
| Installation, Maintenance & Repair | 0 (0.0%) | 0 (0.0%) |
| Total (Category) | 5 (100.0%) | 0 (0.0%) |
| Total (Overall) | 17 (33.3%) | 34 (66.7%) |
Production, Transportation and Moving Occupations
The most common Production, Transportation and Moving occupations in Pueblo Pintado are , and Transportation (3 | 5.9%).
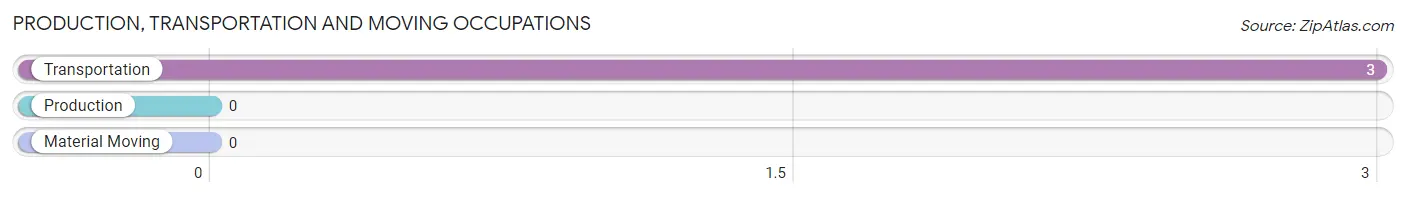
Production, Transportation and Moving Occupations by Sex
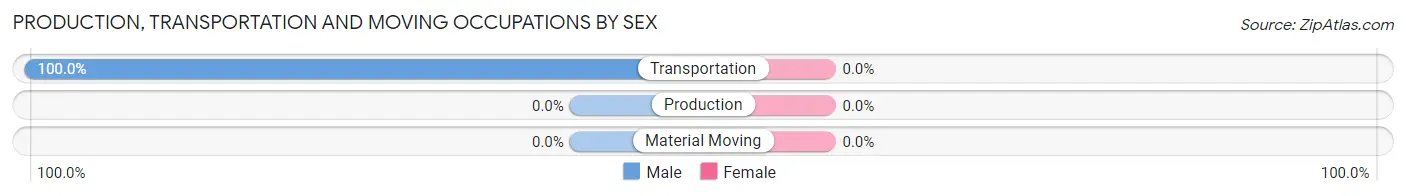
| Occupation | Male | Female |
| Production | 0 (0.0%) | 0 (0.0%) |
| Transportation | 3 (100.0%) | 0 (0.0%) |
| Material Moving | 0 (0.0%) | 0 (0.0%) |
| Total (Category) | 3 (100.0%) | 0 (0.0%) |
| Total (Overall) | 17 (33.3%) | 34 (66.7%) |
Employment Industries by Sex in Pueblo Pintado
Employment Industries in Pueblo Pintado
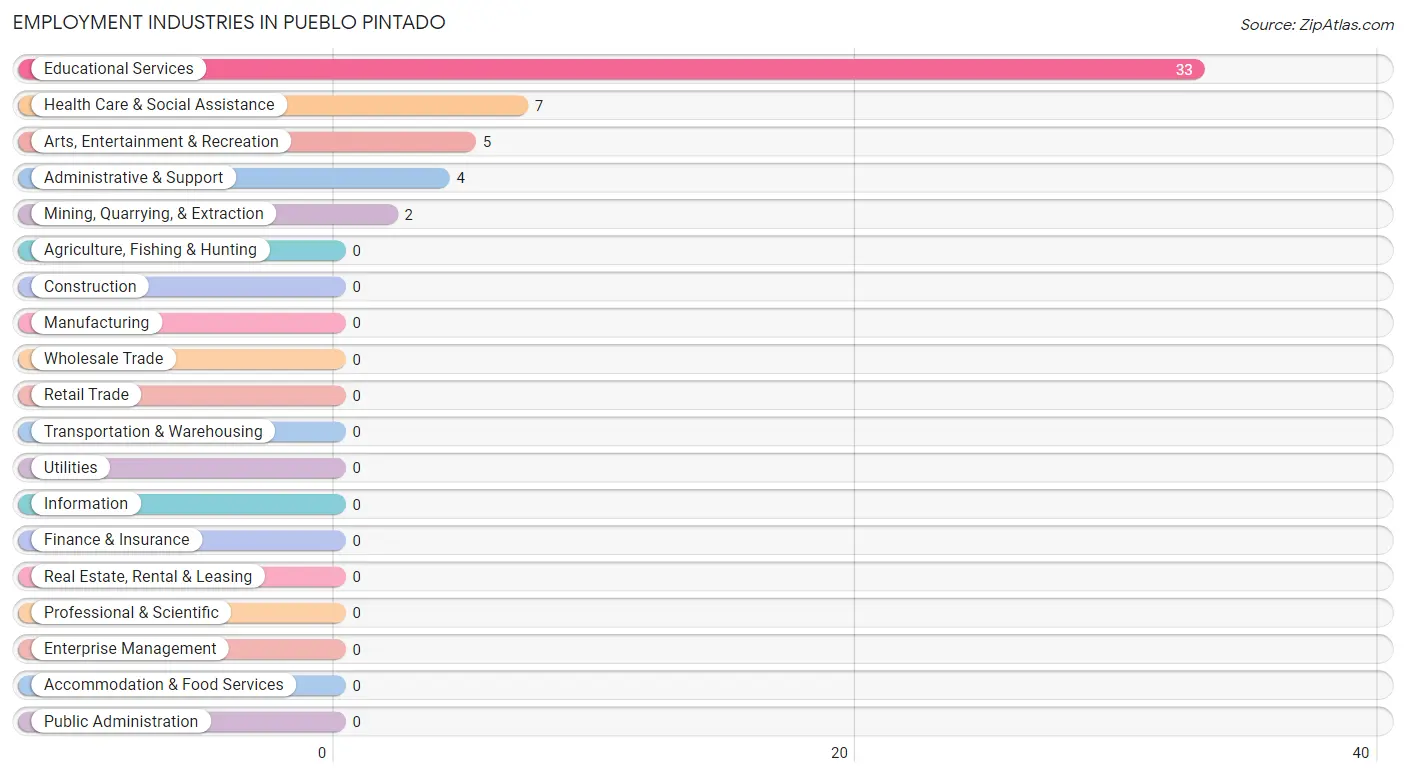
The major employment industries in Pueblo Pintado include Educational Services (33 | 64.7%), Health Care & Social Assistance (7 | 13.7%), Arts, Entertainment & Recreation (5 | 9.8%), Administrative & Support (4 | 7.8%), and Mining, Quarrying, & Extraction (2 | 3.9%).
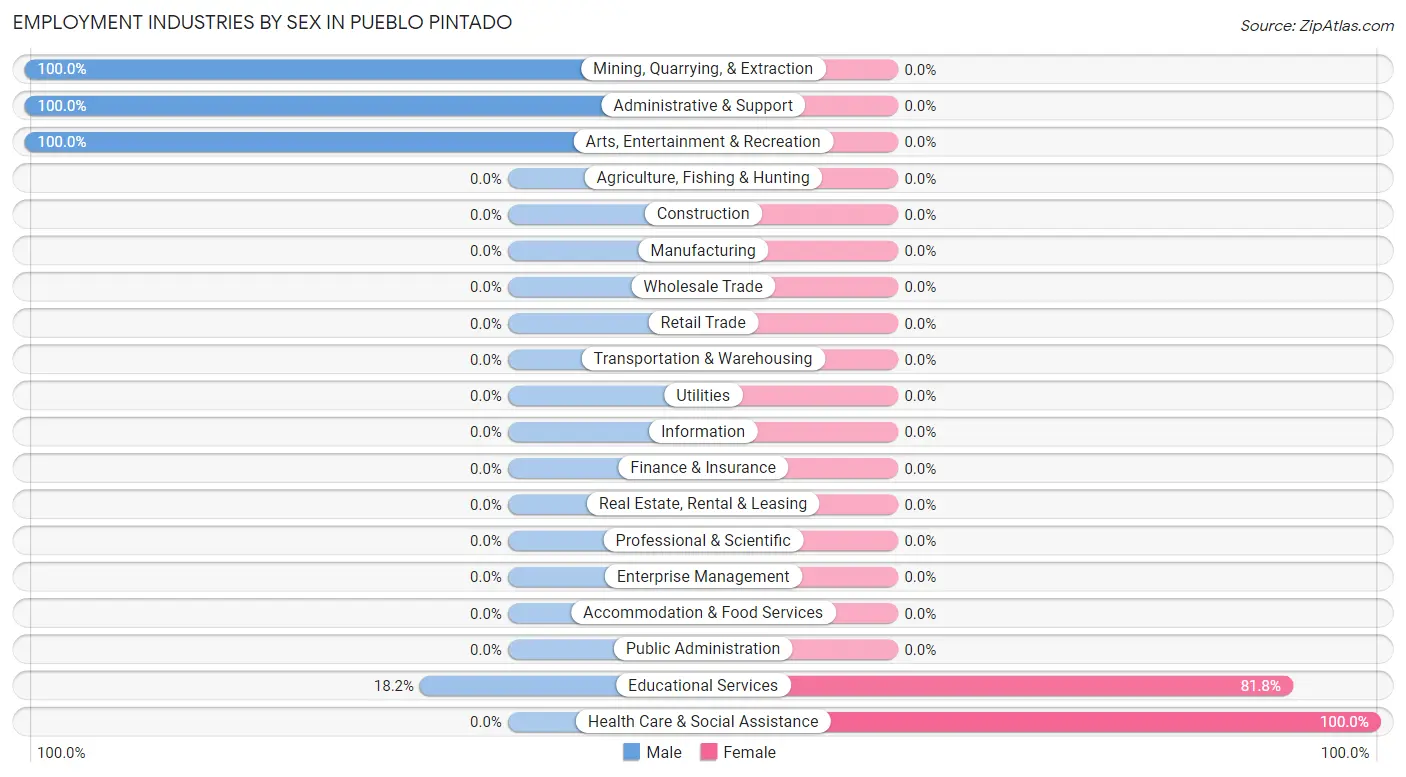
Employment Industries by Sex in Pueblo Pintado
The Pueblo Pintado industries that see more men than women are Mining, Quarrying, & Extraction (100.0%), Administrative & Support (100.0%), and Arts, Entertainment & Recreation (100.0%), whereas the industries that tend to have a higher number of women are Health Care & Social Assistance (100.0%), and Educational Services (81.8%).
| Industry | Male | Female |
| Agriculture, Fishing & Hunting | 0 (0.0%) | 0 (0.0%) |
| Mining, Quarrying, & Extraction | 2 (100.0%) | 0 (0.0%) |
| Construction | 0 (0.0%) | 0 (0.0%) |
| Manufacturing | 0 (0.0%) | 0 (0.0%) |
| Wholesale Trade | 0 (0.0%) | 0 (0.0%) |
| Retail Trade | 0 (0.0%) | 0 (0.0%) |
| Transportation & Warehousing | 0 (0.0%) | 0 (0.0%) |
| Utilities | 0 (0.0%) | 0 (0.0%) |
| Information | 0 (0.0%) | 0 (0.0%) |
| Finance & Insurance | 0 (0.0%) | 0 (0.0%) |
| Real Estate, Rental & Leasing | 0 (0.0%) | 0 (0.0%) |
| Professional & Scientific | 0 (0.0%) | 0 (0.0%) |
| Enterprise Management | 0 (0.0%) | 0 (0.0%) |
| Administrative & Support | 4 (100.0%) | 0 (0.0%) |
| Educational Services | 6 (18.2%) | 27 (81.8%) |
| Health Care & Social Assistance | 0 (0.0%) | 7 (100.0%) |
| Arts, Entertainment & Recreation | 5 (100.0%) | 0 (0.0%) |
| Accommodation & Food Services | 0 (0.0%) | 0 (0.0%) |
| Public Administration | 0 (0.0%) | 0 (0.0%) |
| Total | 17 (33.3%) | 34 (66.7%) |
Education in Pueblo Pintado
School Enrollment in Pueblo Pintado
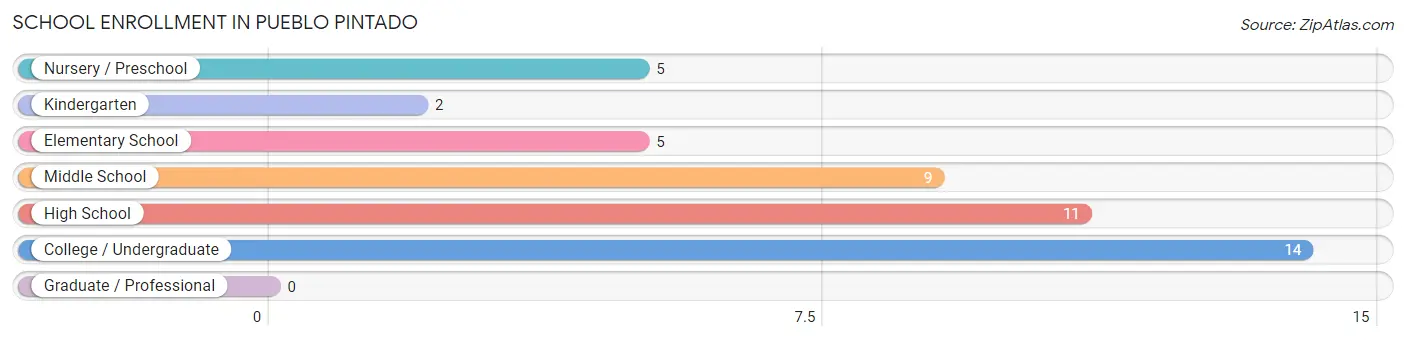
The most common levels of schooling among the 46 students in Pueblo Pintado are college / undergraduate (14 | 30.4%), high school (11 | 23.9%), and middle school (9 | 19.6%).
| School Level | # Students | % Students |
| Nursery / Preschool | 5 | 10.9% |
| Kindergarten | 2 | 4.3% |
| Elementary School | 5 | 10.9% |
| Middle School | 9 | 19.6% |
| High School | 11 | 23.9% |
| College / Undergraduate | 14 | 30.4% |
| Graduate / Professional | 0 | 0.0% |
| Total | 46 | 100.0% |
School Enrollment by Age by Funding Source in Pueblo Pintado
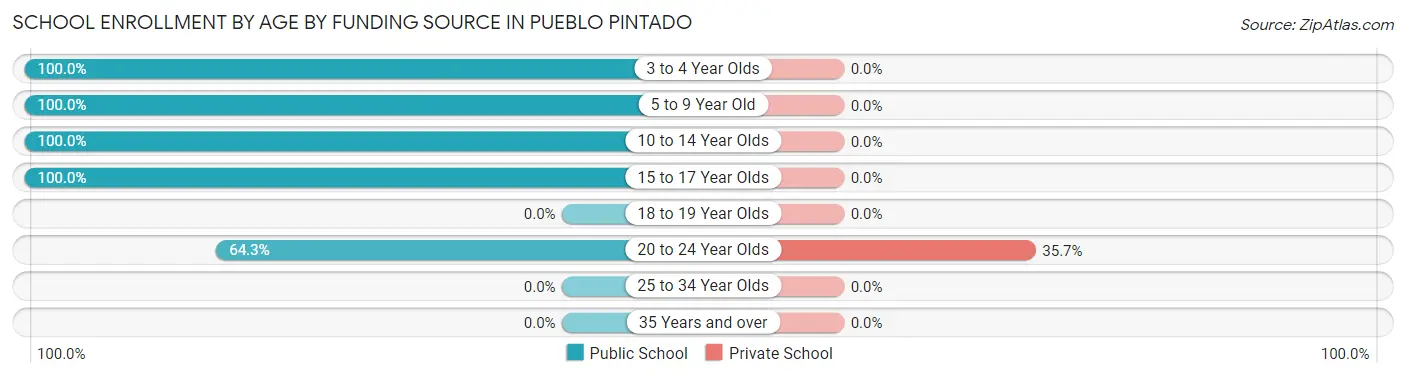
Out of a total of 46 students who are enrolled in schools in Pueblo Pintado, 5 (10.9%) attend a private institution, while the remaining 41 (89.1%) are enrolled in public schools. The age group of 20 to 24 year olds has the highest likelihood of being enrolled in private schools, with 5 (35.7% in the age bracket) enrolled. Conversely, the age group of 3 to 4 year olds has the lowest likelihood of being enrolled in a private school, with 5 (100.0% in the age bracket) attending a public institution.
| Age Bracket | Public School | Private School |
| 3 to 4 Year Olds | 5 (100.0%) | 0 (0.0%) |
| 5 to 9 Year Old | 7 (100.0%) | 0 (0.0%) |
| 10 to 14 Year Olds | 12 (100.0%) | 0 (0.0%) |
| 15 to 17 Year Olds | 8 (100.0%) | 0 (0.0%) |
| 18 to 19 Year Olds | 0 (0.0%) | 0 (0.0%) |
| 20 to 24 Year Olds | 9 (64.3%) | 5 (35.7%) |
| 25 to 34 Year Olds | 0 (0.0%) | 0 (0.0%) |
| 35 Years and over | 0 (0.0%) | 0 (0.0%) |
| Total | 41 (89.1%) | 5 (10.9%) |
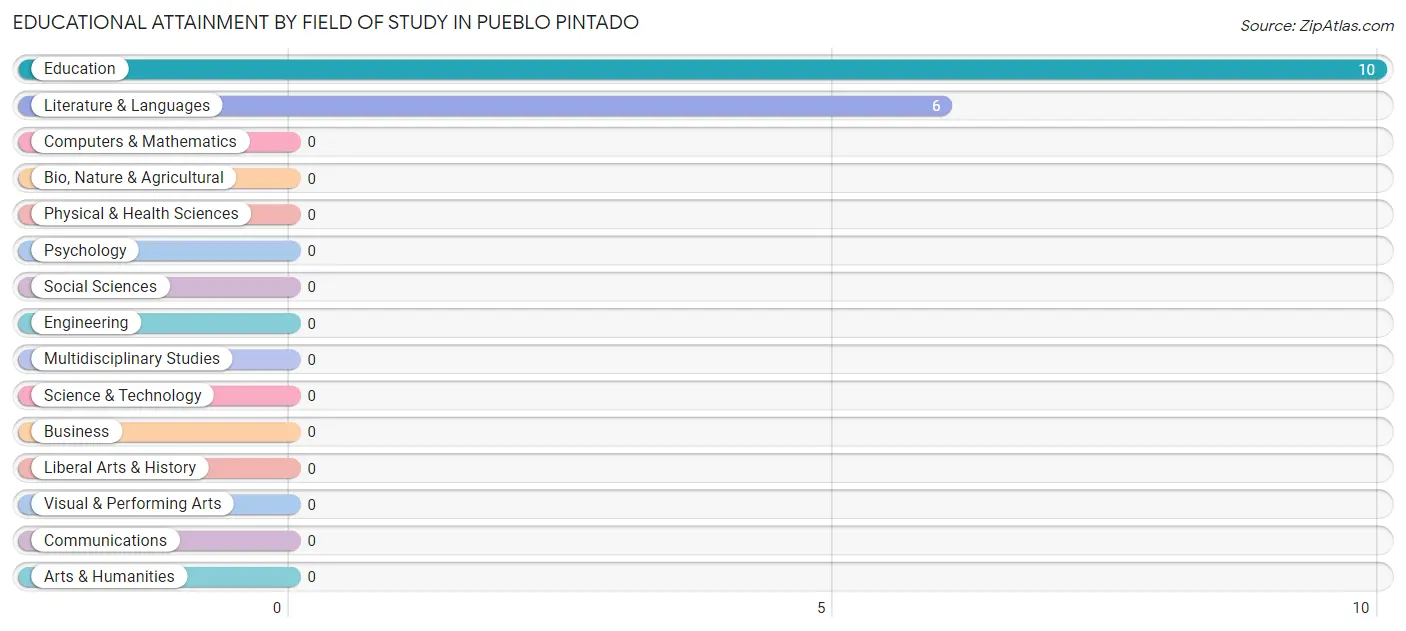
Educational Attainment by Field of Study in Pueblo Pintado
Education (10 | 62.5%), and literature & languages (6 | 37.5%) are the most common fields of study among 16 individuals in Pueblo Pintado who have obtained a bachelor's degree or higher.
| Field of Study | # Graduates | % Graduates |
| Computers & Mathematics | 0 | 0.0% |
| Bio, Nature & Agricultural | 0 | 0.0% |
| Physical & Health Sciences | 0 | 0.0% |
| Psychology | 0 | 0.0% |
| Social Sciences | 0 | 0.0% |
| Engineering | 0 | 0.0% |
| Multidisciplinary Studies | 0 | 0.0% |
| Science & Technology | 0 | 0.0% |
| Business | 0 | 0.0% |
| Education | 10 | 62.5% |
| Literature & Languages | 6 | 37.5% |
| Liberal Arts & History | 0 | 0.0% |
| Visual & Performing Arts | 0 | 0.0% |
| Communications | 0 | 0.0% |
| Arts & Humanities | 0 | 0.0% |
| Total | 16 | 100.0% |
Transportation & Commute in Pueblo Pintado
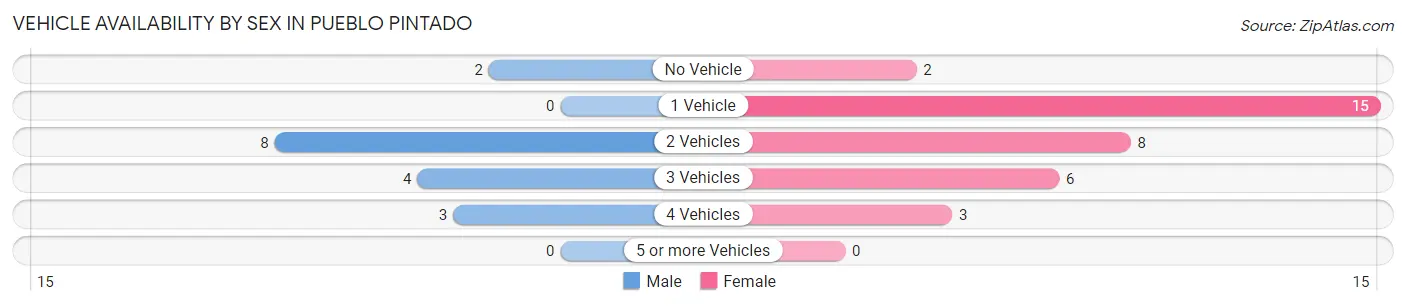
Vehicle Availability by Sex in Pueblo Pintado
The most prevalent vehicle ownership categories in Pueblo Pintado are males with 2 vehicles (8, accounting for 47.1%) and females with 2 vehicles (8, making up 23.5%).
| Vehicles Available | Male | Female |
| No Vehicle | 2 (11.8%) | 2 (5.9%) |
| 1 Vehicle | 0 (0.0%) | 15 (44.1%) |
| 2 Vehicles | 8 (47.1%) | 8 (23.5%) |
| 3 Vehicles | 4 (23.5%) | 6 (17.6%) |
| 4 Vehicles | 3 (17.6%) | 3 (8.8%) |
| 5 or more Vehicles | 0 (0.0%) | 0 (0.0%) |
| Total | 17 (100.0%) | 34 (100.0%) |
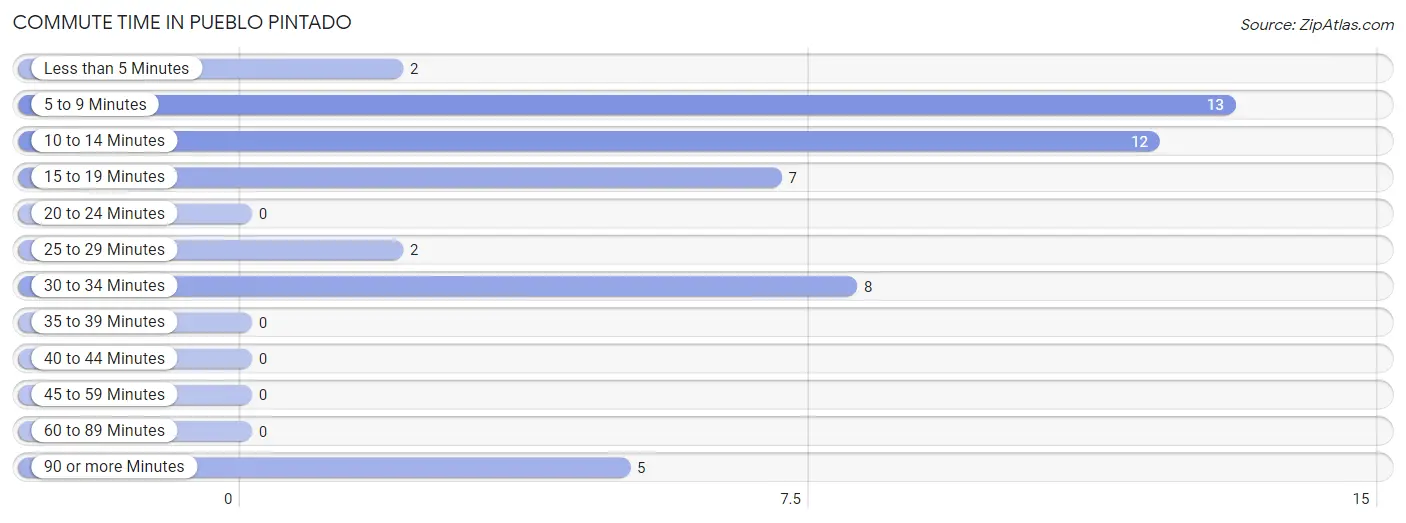
Commute Time in Pueblo Pintado
The most frequently occuring commute durations in Pueblo Pintado are 5 to 9 minutes (13 commuters, 26.5%), 10 to 14 minutes (12 commuters, 24.5%), and 30 to 34 minutes (8 commuters, 16.3%).
| Commute Time | # Commuters | % Commuters |
| Less than 5 Minutes | 2 | 4.1% |
| 5 to 9 Minutes | 13 | 26.5% |
| 10 to 14 Minutes | 12 | 24.5% |
| 15 to 19 Minutes | 7 | 14.3% |
| 20 to 24 Minutes | 0 | 0.0% |
| 25 to 29 Minutes | 2 | 4.1% |
| 30 to 34 Minutes | 8 | 16.3% |
| 35 to 39 Minutes | 0 | 0.0% |
| 40 to 44 Minutes | 0 | 0.0% |
| 45 to 59 Minutes | 0 | 0.0% |
| 60 to 89 Minutes | 0 | 0.0% |
| 90 or more Minutes | 5 | 10.2% |
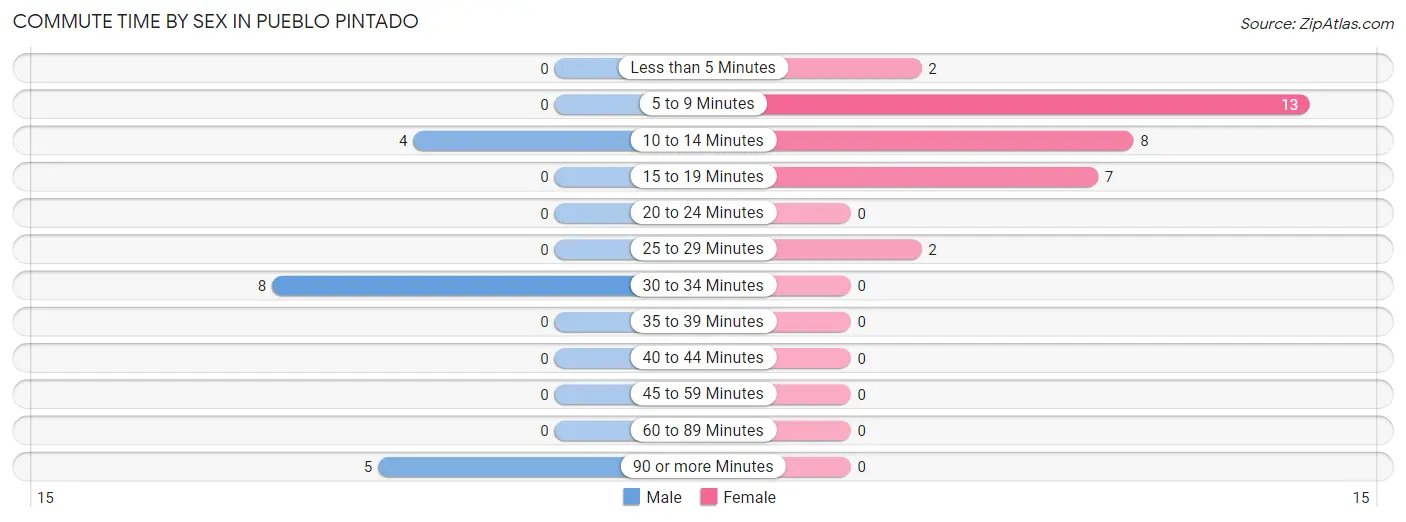
Commute Time by Sex in Pueblo Pintado
The most common commute times in Pueblo Pintado are 30 to 34 minutes (8 commuters, 47.1%) for males and 5 to 9 minutes (13 commuters, 40.6%) for females.
| Commute Time | Male | Female |
| Less than 5 Minutes | 0 (0.0%) | 2 (6.2%) |
| 5 to 9 Minutes | 0 (0.0%) | 13 (40.6%) |
| 10 to 14 Minutes | 4 (23.5%) | 8 (25.0%) |
| 15 to 19 Minutes | 0 (0.0%) | 7 (21.9%) |
| 20 to 24 Minutes | 0 (0.0%) | 0 (0.0%) |
| 25 to 29 Minutes | 0 (0.0%) | 2 (6.2%) |
| 30 to 34 Minutes | 8 (47.1%) | 0 (0.0%) |
| 35 to 39 Minutes | 0 (0.0%) | 0 (0.0%) |
| 40 to 44 Minutes | 0 (0.0%) | 0 (0.0%) |
| 45 to 59 Minutes | 0 (0.0%) | 0 (0.0%) |
| 60 to 89 Minutes | 0 (0.0%) | 0 (0.0%) |
| 90 or more Minutes | 5 (29.4%) | 0 (0.0%) |
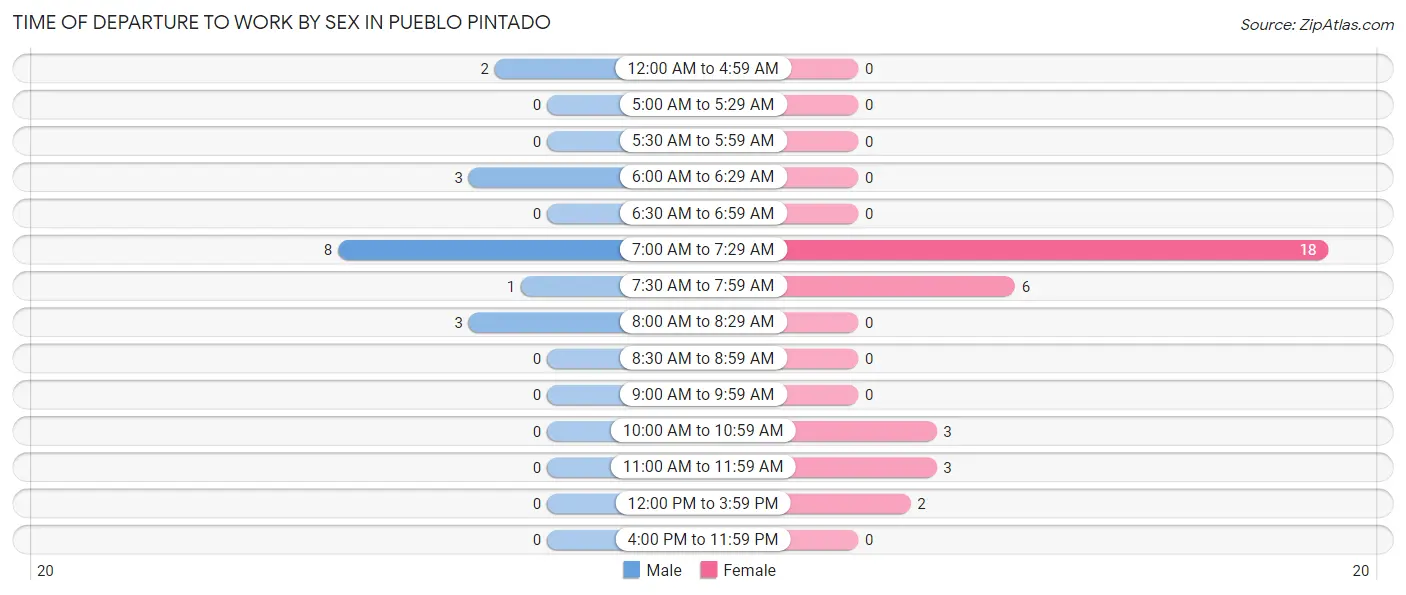
Time of Departure to Work by Sex in Pueblo Pintado
The most frequent times of departure to work in Pueblo Pintado are 7:00 AM to 7:29 AM (8, 47.1%) for males and 7:00 AM to 7:29 AM (18, 56.2%) for females.
| Time of Departure | Male | Female |
| 12:00 AM to 4:59 AM | 2 (11.8%) | 0 (0.0%) |
| 5:00 AM to 5:29 AM | 0 (0.0%) | 0 (0.0%) |
| 5:30 AM to 5:59 AM | 0 (0.0%) | 0 (0.0%) |
| 6:00 AM to 6:29 AM | 3 (17.6%) | 0 (0.0%) |
| 6:30 AM to 6:59 AM | 0 (0.0%) | 0 (0.0%) |
| 7:00 AM to 7:29 AM | 8 (47.1%) | 18 (56.2%) |
| 7:30 AM to 7:59 AM | 1 (5.9%) | 6 (18.8%) |
| 8:00 AM to 8:29 AM | 3 (17.6%) | 0 (0.0%) |
| 8:30 AM to 8:59 AM | 0 (0.0%) | 0 (0.0%) |
| 9:00 AM to 9:59 AM | 0 (0.0%) | 0 (0.0%) |
| 10:00 AM to 10:59 AM | 0 (0.0%) | 3 (9.4%) |
| 11:00 AM to 11:59 AM | 0 (0.0%) | 3 (9.4%) |
| 12:00 PM to 3:59 PM | 0 (0.0%) | 2 (6.2%) |
| 4:00 PM to 11:59 PM | 0 (0.0%) | 0 (0.0%) |
| Total | 17 (100.0%) | 32 (100.0%) |
Housing Occupancy in Pueblo Pintado
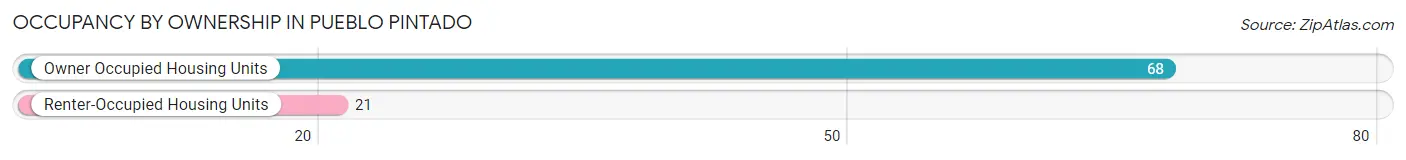
Occupancy by Ownership in Pueblo Pintado
Of the total 89 dwellings in Pueblo Pintado, owner-occupied units account for 68 (76.4%), while renter-occupied units make up 21 (23.6%).
| Occupancy | # Housing Units | % Housing Units |
| Owner Occupied Housing Units | 68 | 76.4% |
| Renter-Occupied Housing Units | 21 | 23.6% |
| Total Occupied Housing Units | 89 | 100.0% |
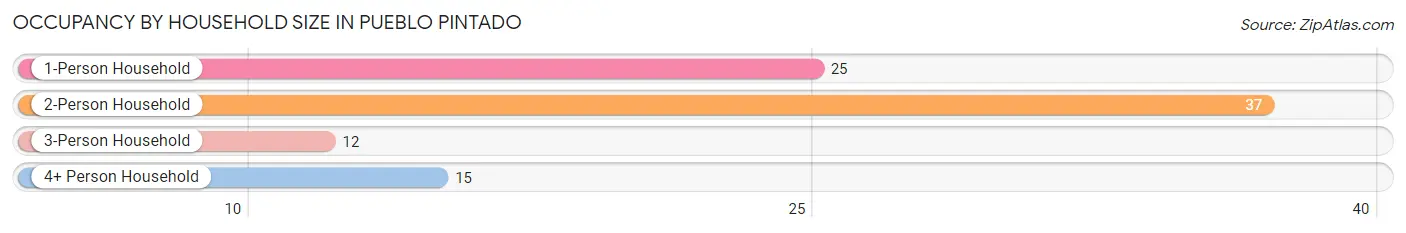
Occupancy by Household Size in Pueblo Pintado
| Household Size | # Housing Units | % Housing Units |
| 1-Person Household | 25 | 28.1% |
| 2-Person Household | 37 | 41.6% |
| 3-Person Household | 12 | 13.5% |
| 4+ Person Household | 15 | 16.9% |
| Total Housing Units | 89 | 100.0% |
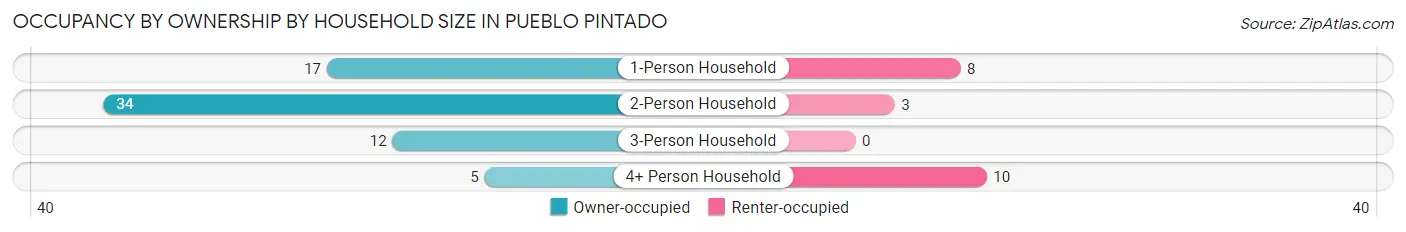
Occupancy by Ownership by Household Size in Pueblo Pintado
| Household Size | Owner-occupied | Renter-occupied |
| 1-Person Household | 17 (68.0%) | 8 (32.0%) |
| 2-Person Household | 34 (91.9%) | 3 (8.1%) |
| 3-Person Household | 12 (100.0%) | 0 (0.0%) |
| 4+ Person Household | 5 (33.3%) | 10 (66.7%) |
| Total Housing Units | 68 (76.4%) | 21 (23.6%) |
Occupancy by Educational Attainment in Pueblo Pintado
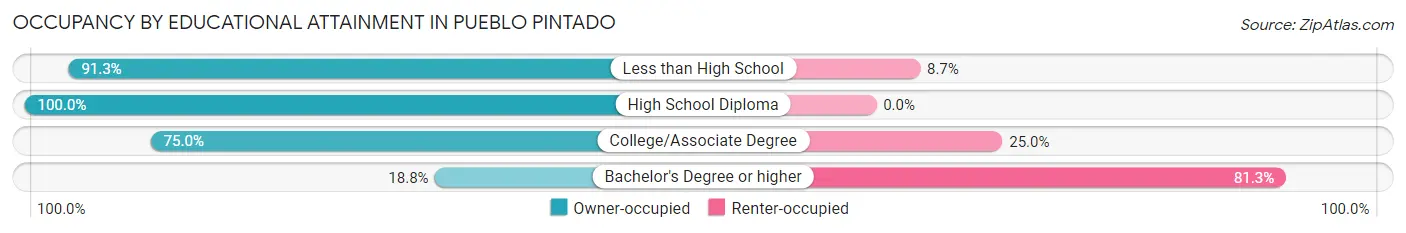
| Household Size | Owner-occupied | Renter-occupied |
| Less than High School | 21 (91.3%) | 2 (8.7%) |
| High School Diploma | 26 (100.0%) | 0 (0.0%) |
| College/Associate Degree | 18 (75.0%) | 6 (25.0%) |
| Bachelor's Degree or higher | 3 (18.8%) | 13 (81.2%) |
Occupancy by Age of Householder in Pueblo Pintado
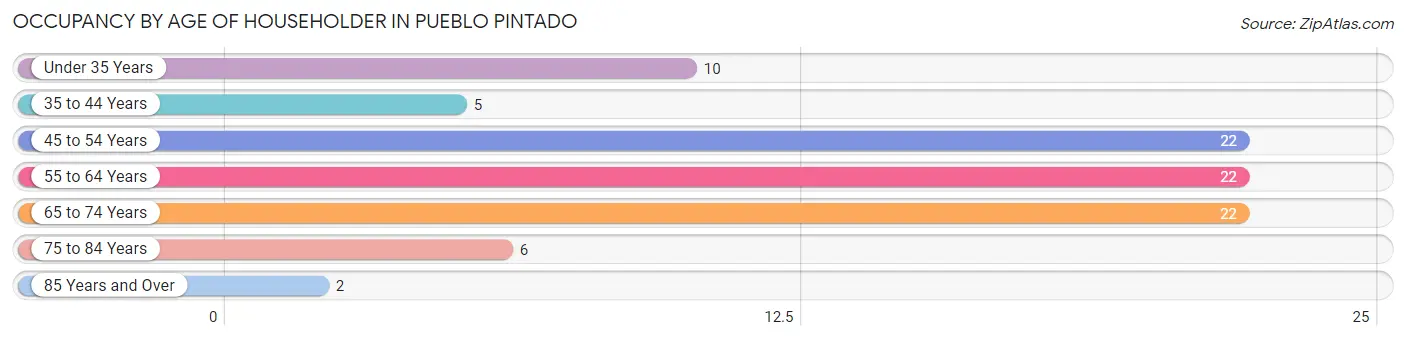
| Age Bracket | # Households | % Households |
| Under 35 Years | 10 | 11.2% |
| 35 to 44 Years | 5 | 5.6% |
| 45 to 54 Years | 22 | 24.7% |
| 55 to 64 Years | 22 | 24.7% |
| 65 to 74 Years | 22 | 24.7% |
| 75 to 84 Years | 6 | 6.7% |
| 85 Years and Over | 2 | 2.2% |
| Total | 89 | 100.0% |
Housing Finances in Pueblo Pintado
Median Income by Occupancy in Pueblo Pintado
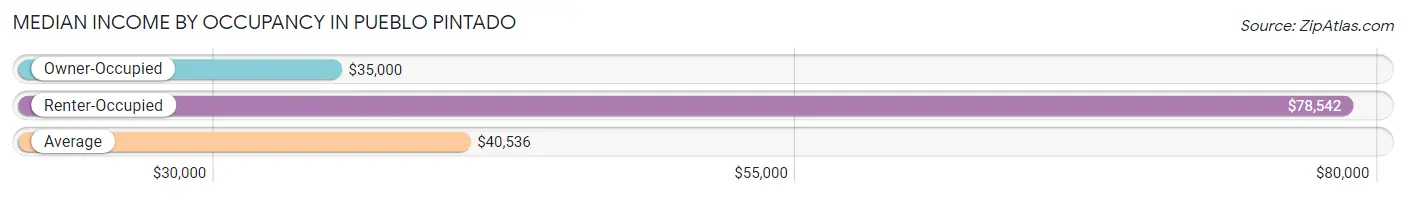
| Occupancy Type | # Households | Median Income |
| Owner-Occupied | 68 (76.4%) | $35,000 |
| Renter-Occupied | 21 (23.6%) | $78,542 |
| Average | 89 (100.0%) | $40,536 |
Occupancy by Householder Income Bracket in Pueblo Pintado
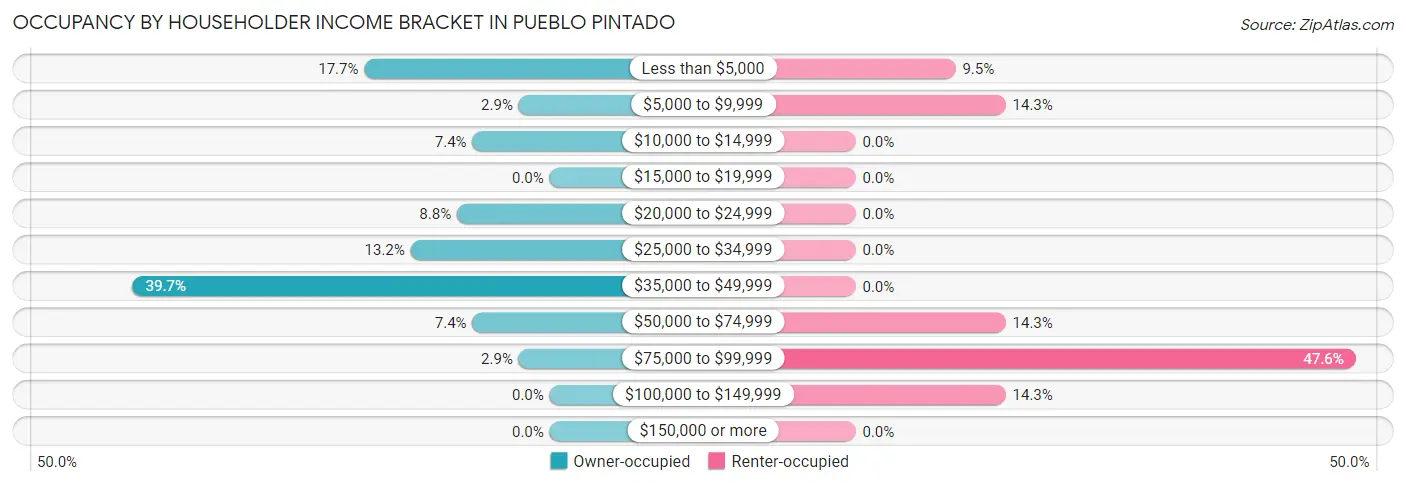
| Income Bracket | Owner-occupied | Renter-occupied |
| Less than $5,000 | 12 (17.6%) | 2 (9.5%) |
| $5,000 to $9,999 | 2 (2.9%) | 3 (14.3%) |
| $10,000 to $14,999 | 5 (7.3%) | 0 (0.0%) |
| $15,000 to $19,999 | 0 (0.0%) | 0 (0.0%) |
| $20,000 to $24,999 | 6 (8.8%) | 0 (0.0%) |
| $25,000 to $34,999 | 9 (13.2%) | 0 (0.0%) |
| $35,000 to $49,999 | 27 (39.7%) | 0 (0.0%) |
| $50,000 to $74,999 | 5 (7.3%) | 3 (14.3%) |
| $75,000 to $99,999 | 2 (2.9%) | 10 (47.6%) |
| $100,000 to $149,999 | 0 (0.0%) | 3 (14.3%) |
| $150,000 or more | 0 (0.0%) | 0 (0.0%) |
| Total | 68 (100.0%) | 21 (100.0%) |
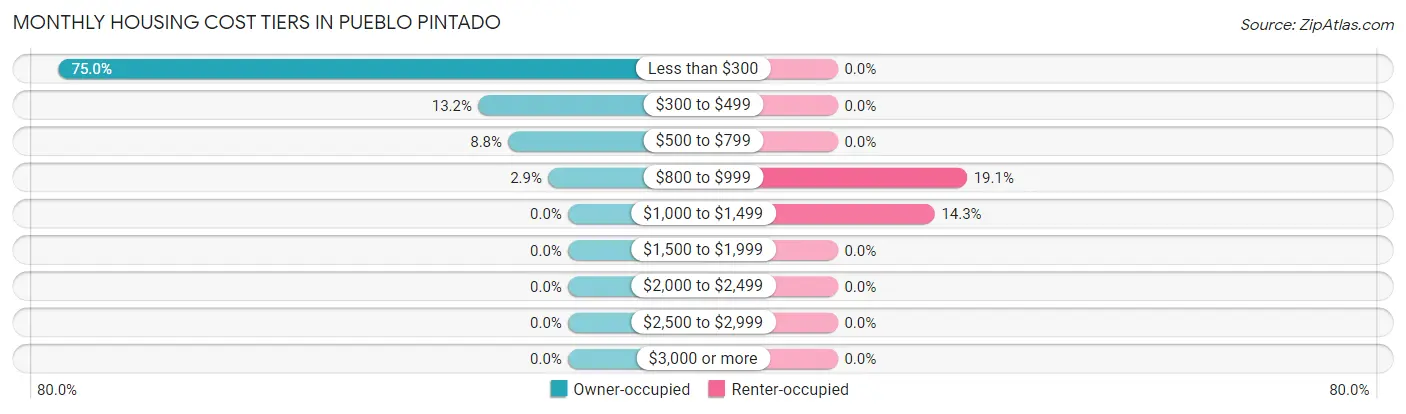
Monthly Housing Cost Tiers in Pueblo Pintado
| Monthly Cost | Owner-occupied | Renter-occupied |
| Less than $300 | 51 (75.0%) | 0 (0.0%) |
| $300 to $499 | 9 (13.2%) | 0 (0.0%) |
| $500 to $799 | 6 (8.8%) | 0 (0.0%) |
| $800 to $999 | 2 (2.9%) | 4 (19.1%) |
| $1,000 to $1,499 | 0 (0.0%) | 3 (14.3%) |
| $1,500 to $1,999 | 0 (0.0%) | 0 (0.0%) |
| $2,000 to $2,499 | 0 (0.0%) | 0 (0.0%) |
| $2,500 to $2,999 | 0 (0.0%) | 0 (0.0%) |
| $3,000 or more | 0 (0.0%) | 0 (0.0%) |
| Total | 68 (100.0%) | 21 (100.0%) |
Physical Housing Characteristics in Pueblo Pintado
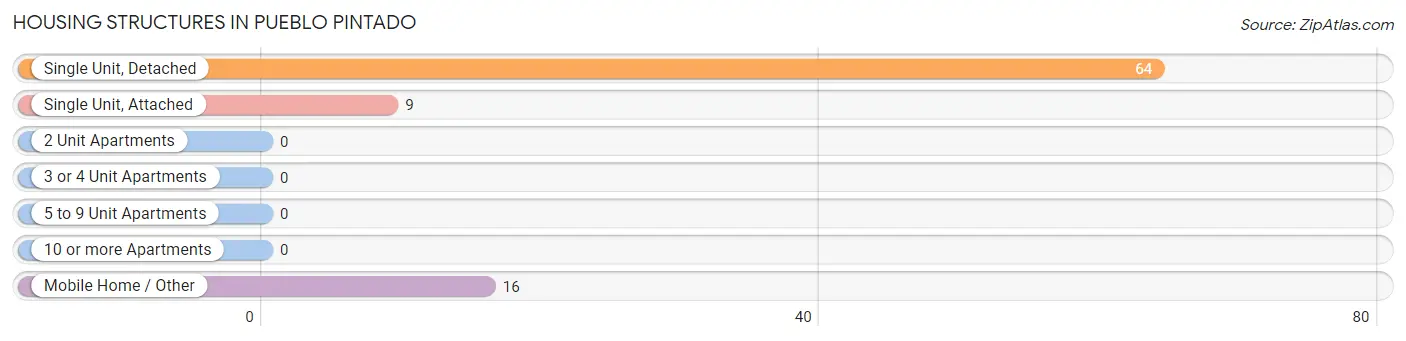
Housing Structures in Pueblo Pintado
| Structure Type | # Housing Units | % Housing Units |
| Single Unit, Detached | 64 | 71.9% |
| Single Unit, Attached | 9 | 10.1% |
| 2 Unit Apartments | 0 | 0.0% |
| 3 or 4 Unit Apartments | 0 | 0.0% |
| 5 to 9 Unit Apartments | 0 | 0.0% |
| 10 or more Apartments | 0 | 0.0% |
| Mobile Home / Other | 16 | 18.0% |
| Total | 89 | 100.0% |
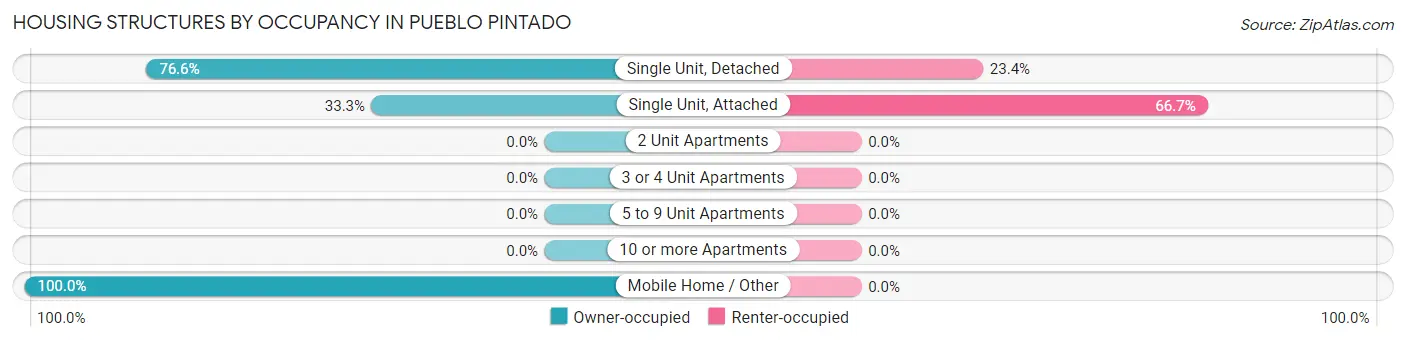
Housing Structures by Occupancy in Pueblo Pintado
| Structure Type | Owner-occupied | Renter-occupied |
| Single Unit, Detached | 49 (76.6%) | 15 (23.4%) |
| Single Unit, Attached | 3 (33.3%) | 6 (66.7%) |
| 2 Unit Apartments | 0 (0.0%) | 0 (0.0%) |
| 3 or 4 Unit Apartments | 0 (0.0%) | 0 (0.0%) |
| 5 to 9 Unit Apartments | 0 (0.0%) | 0 (0.0%) |
| 10 or more Apartments | 0 (0.0%) | 0 (0.0%) |
| Mobile Home / Other | 16 (100.0%) | 0 (0.0%) |
| Total | 68 (76.4%) | 21 (23.6%) |
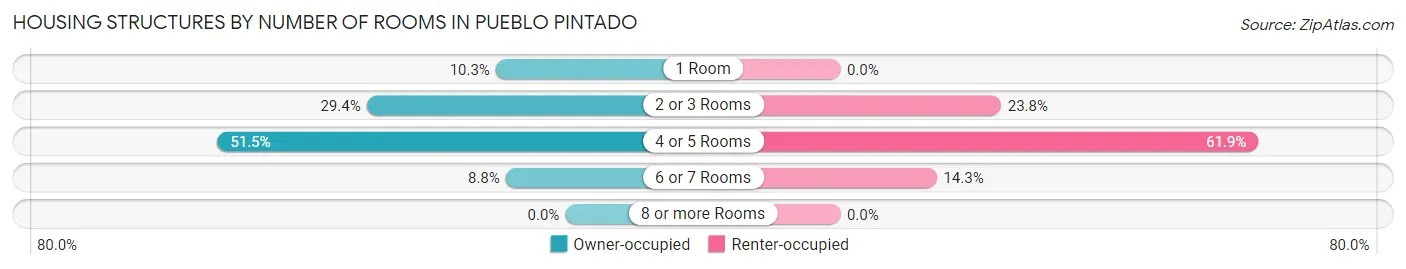
Housing Structures by Number of Rooms in Pueblo Pintado
| Number of Rooms | Owner-occupied | Renter-occupied |
| 1 Room | 7 (10.3%) | 0 (0.0%) |
| 2 or 3 Rooms | 20 (29.4%) | 5 (23.8%) |
| 4 or 5 Rooms | 35 (51.5%) | 13 (61.9%) |
| 6 or 7 Rooms | 6 (8.8%) | 3 (14.3%) |
| 8 or more Rooms | 0 (0.0%) | 0 (0.0%) |
| Total | 68 (100.0%) | 21 (100.0%) |
Housing Structure by Heating Type in Pueblo Pintado
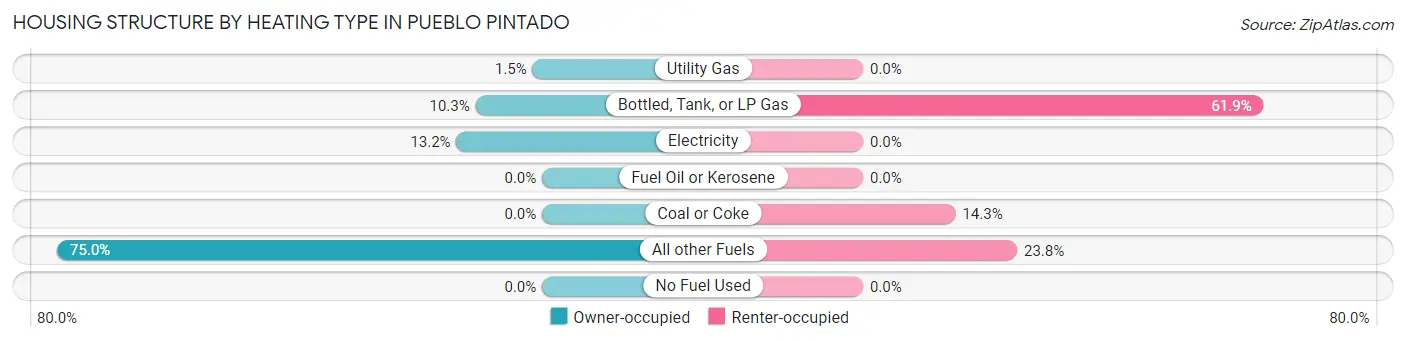
| Heating Type | Owner-occupied | Renter-occupied |
| Utility Gas | 1 (1.5%) | 0 (0.0%) |
| Bottled, Tank, or LP Gas | 7 (10.3%) | 13 (61.9%) |
| Electricity | 9 (13.2%) | 0 (0.0%) |
| Fuel Oil or Kerosene | 0 (0.0%) | 0 (0.0%) |
| Coal or Coke | 0 (0.0%) | 3 (14.3%) |
| All other Fuels | 51 (75.0%) | 5 (23.8%) |
| No Fuel Used | 0 (0.0%) | 0 (0.0%) |
| Total | 68 (100.0%) | 21 (100.0%) |
Household Vehicle Usage in Pueblo Pintado
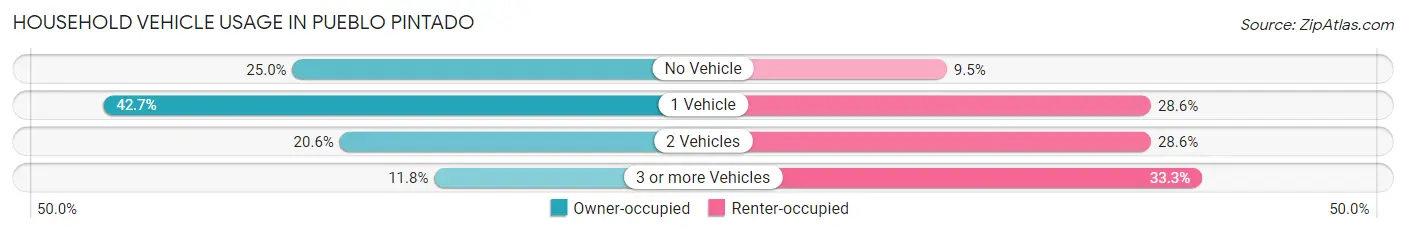
| Vehicles per Household | Owner-occupied | Renter-occupied |
| No Vehicle | 17 (25.0%) | 2 (9.5%) |
| 1 Vehicle | 29 (42.6%) | 6 (28.6%) |
| 2 Vehicles | 14 (20.6%) | 6 (28.6%) |
| 3 or more Vehicles | 8 (11.8%) | 7 (33.3%) |
| Total | 68 (100.0%) | 21 (100.0%) |
Real Estate & Mortgages in Pueblo Pintado
Real Estate and Mortgage Overview in Pueblo Pintado
| Characteristic | Without Mortgage | With Mortgage |
| Housing Units | 66 | 2 |
| Median Property Value | $81,700 | $0 |
| Median Household Income | $35,625 | $0 |
| Monthly Housing Costs | $219 | $0 |
| Real Estate Taxes | - | - |
Property Value by Mortgage Status in Pueblo Pintado
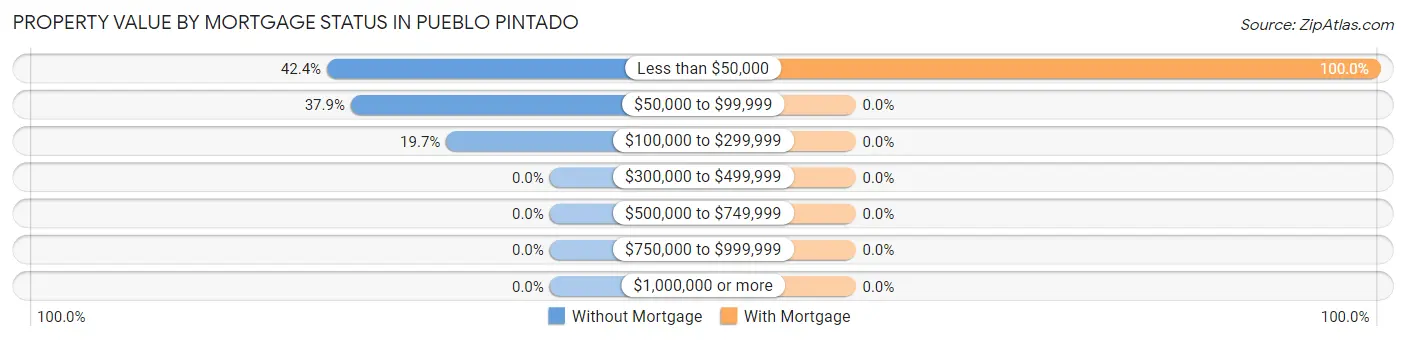
| Property Value | Without Mortgage | With Mortgage |
| Less than $50,000 | 28 (42.4%) | 2 (100.0%) |
| $50,000 to $99,999 | 25 (37.9%) | 0 (0.0%) |
| $100,000 to $299,999 | 13 (19.7%) | 0 (0.0%) |
| $300,000 to $499,999 | 0 (0.0%) | 0 (0.0%) |
| $500,000 to $749,999 | 0 (0.0%) | 0 (0.0%) |
| $750,000 to $999,999 | 0 (0.0%) | 0 (0.0%) |
| $1,000,000 or more | 0 (0.0%) | 0 (0.0%) |
| Total | 66 (100.0%) | 2 (100.0%) |
Household Income by Mortgage Status in Pueblo Pintado
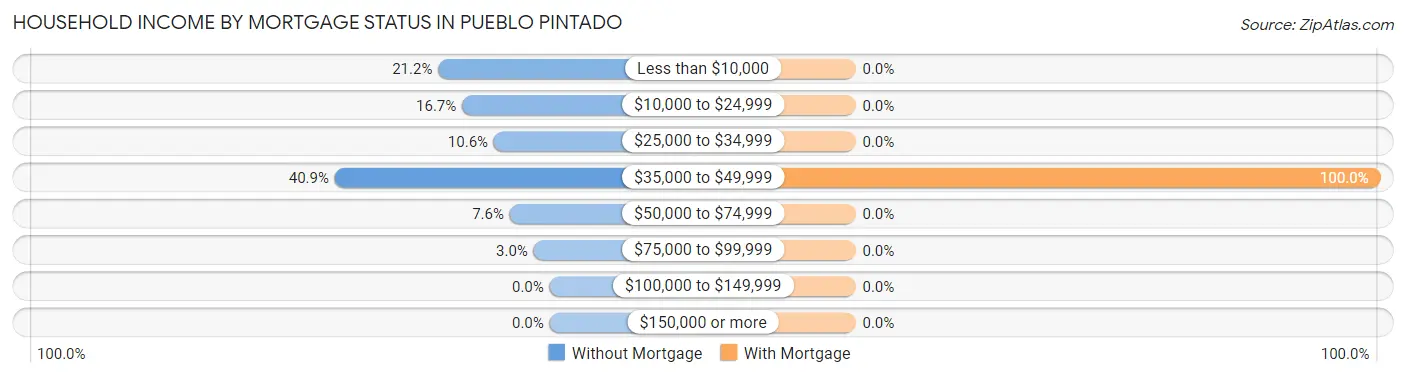
| Household Income | Without Mortgage | With Mortgage |
| Less than $10,000 | 14 (21.2%) | 0 (0.0%) |
| $10,000 to $24,999 | 11 (16.7%) | 0 (0.0%) |
| $25,000 to $34,999 | 7 (10.6%) | 0 (0.0%) |
| $35,000 to $49,999 | 27 (40.9%) | 2 (100.0%) |
| $50,000 to $74,999 | 5 (7.6%) | 0 (0.0%) |
| $75,000 to $99,999 | 2 (3.0%) | 0 (0.0%) |
| $100,000 to $149,999 | 0 (0.0%) | 0 (0.0%) |
| $150,000 or more | 0 (0.0%) | 0 (0.0%) |
| Total | 66 (100.0%) | 2 (100.0%) |
Property Value to Household Income Ratio in Pueblo Pintado
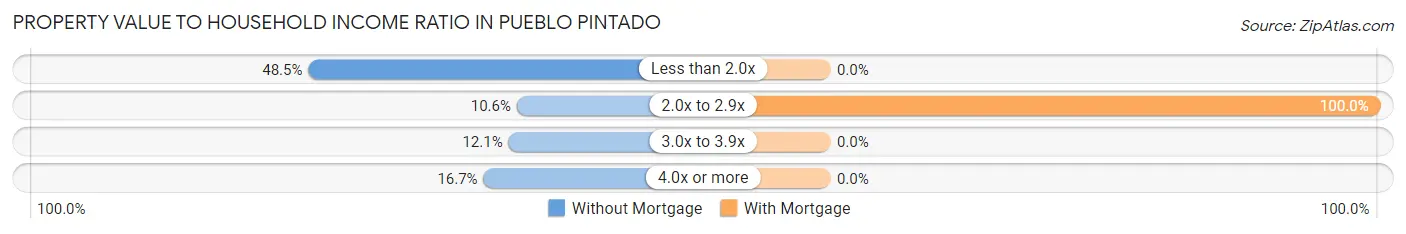
| Value-to-Income Ratio | Without Mortgage | With Mortgage |
| Less than 2.0x | 32 (48.5%) | 0 (0.0%) |
| 2.0x to 2.9x | 7 (10.6%) | 2 (100.0%) |
| 3.0x to 3.9x | 8 (12.1%) | 0 (0.0%) |
| 4.0x or more | 11 (16.7%) | 0 (0.0%) |
| Total | 66 (100.0%) | 2 (100.0%) |
Real Estate Taxes by Mortgage Status in Pueblo Pintado
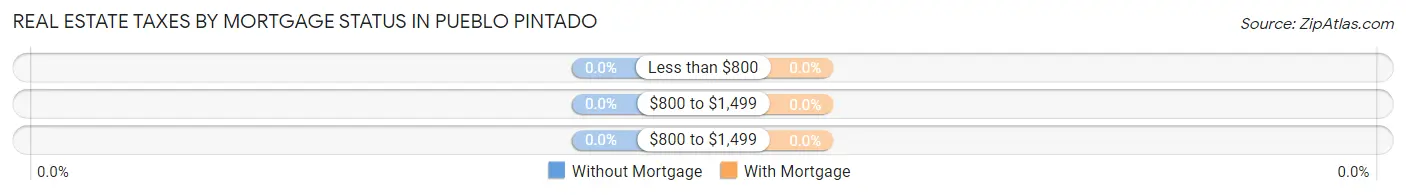
| Property Taxes | Without Mortgage | With Mortgage |
| Less than $800 | 0 (0.0%) | 0 (0.0%) |
| $800 to $1,499 | 0 (0.0%) | 0 (0.0%) |
| $800 to $1,499 | 0 (0.0%) | 0 (0.0%) |
| Total | 66 (100.0%) | 2 (100.0%) |
Health & Disability in Pueblo Pintado
Health Insurance Coverage by Age in Pueblo Pintado
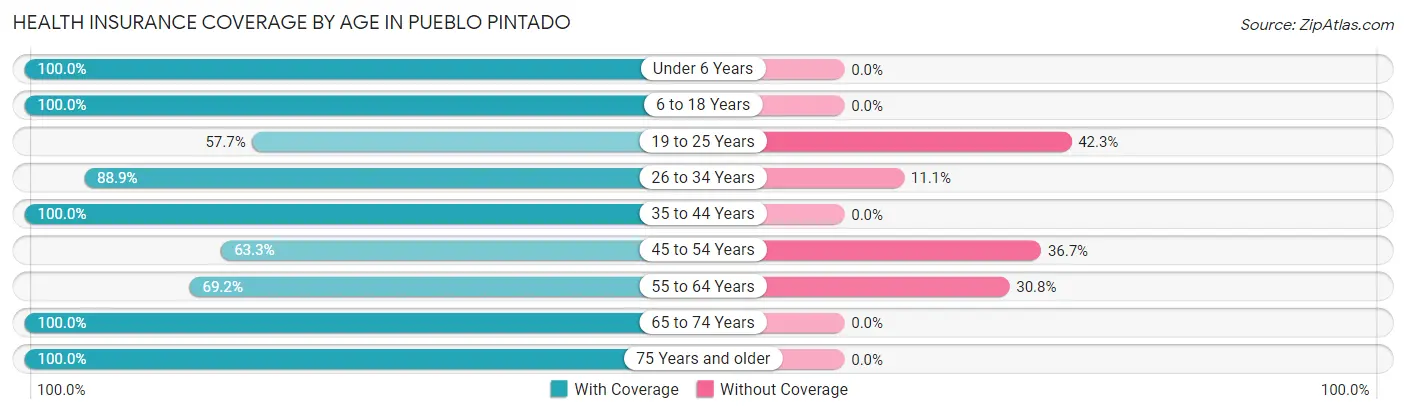
| Age Bracket | With Coverage | Without Coverage |
| Under 6 Years | 16 (100.0%) | 0 (0.0%) |
| 6 to 18 Years | 25 (100.0%) | 0 (0.0%) |
| 19 to 25 Years | 15 (57.7%) | 11 (42.3%) |
| 26 to 34 Years | 24 (88.9%) | 3 (11.1%) |
| 35 to 44 Years | 9 (100.0%) | 0 (0.0%) |
| 45 to 54 Years | 19 (63.3%) | 11 (36.7%) |
| 55 to 64 Years | 27 (69.2%) | 12 (30.8%) |
| 65 to 74 Years | 30 (100.0%) | 0 (0.0%) |
| 75 Years and older | 15 (100.0%) | 0 (0.0%) |
| Total | 180 (83.0%) | 37 (17.1%) |
Health Insurance Coverage by Citizenship Status in Pueblo Pintado
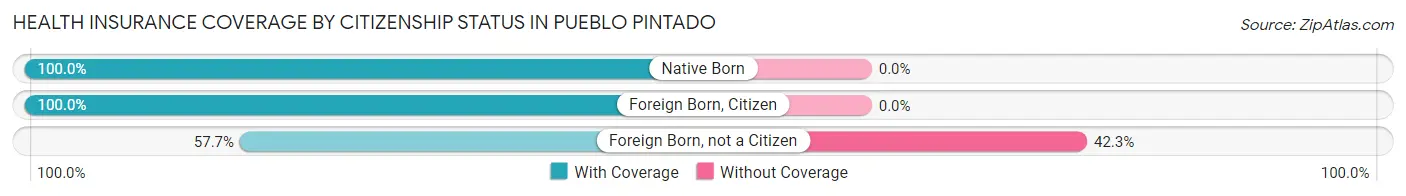
| Citizenship Status | With Coverage | Without Coverage |
| Native Born | 16 (100.0%) | 0 (0.0%) |
| Foreign Born, Citizen | 25 (100.0%) | 0 (0.0%) |
| Foreign Born, not a Citizen | 15 (57.7%) | 11 (42.3%) |
Health Insurance Coverage by Household Income in Pueblo Pintado
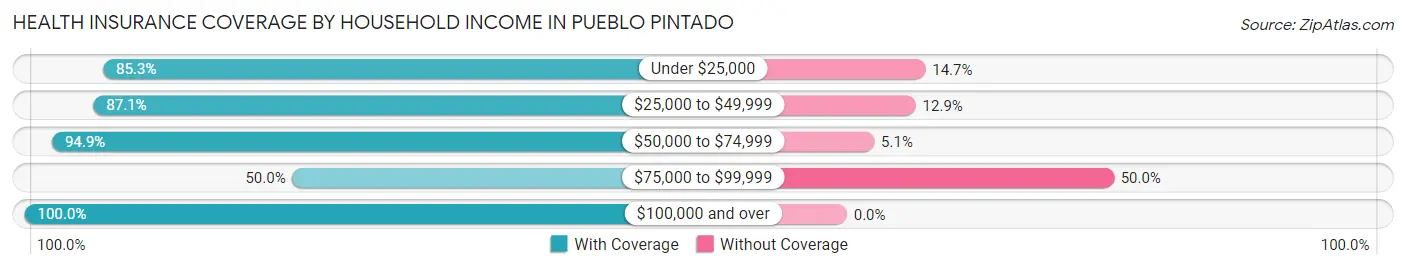
| Household Income | With Coverage | Without Coverage |
| Under $25,000 | 58 (85.3%) | 10 (14.7%) |
| $25,000 to $49,999 | 54 (87.1%) | 8 (12.9%) |
| $50,000 to $74,999 | 37 (94.9%) | 2 (5.1%) |
| $75,000 to $99,999 | 17 (50.0%) | 17 (50.0%) |
| $100,000 and over | 14 (100.0%) | 0 (0.0%) |
Public vs Private Health Insurance Coverage by Age in Pueblo Pintado
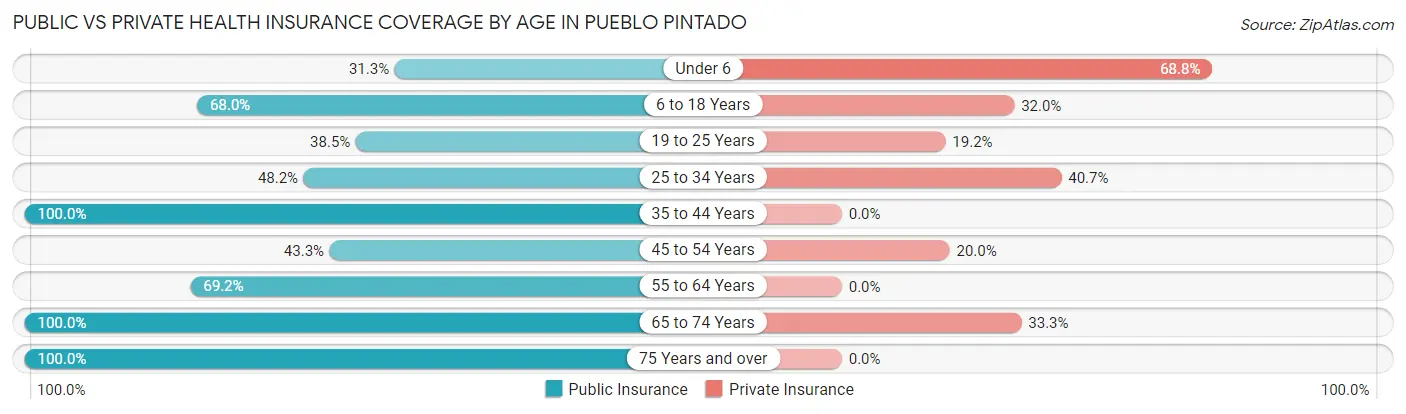
| Age Bracket | Public Insurance | Private Insurance |
| Under 6 | 5 (31.2%) | 11 (68.8%) |
| 6 to 18 Years | 17 (68.0%) | 8 (32.0%) |
| 19 to 25 Years | 10 (38.5%) | 5 (19.2%) |
| 25 to 34 Years | 13 (48.1%) | 11 (40.7%) |
| 35 to 44 Years | 9 (100.0%) | 0 (0.0%) |
| 45 to 54 Years | 13 (43.3%) | 6 (20.0%) |
| 55 to 64 Years | 27 (69.2%) | 0 (0.0%) |
| 65 to 74 Years | 30 (100.0%) | 10 (33.3%) |
| 75 Years and over | 15 (100.0%) | 0 (0.0%) |
| Total | 139 (64.1%) | 51 (23.5%) |
Disability Status by Sex by Age in Pueblo Pintado
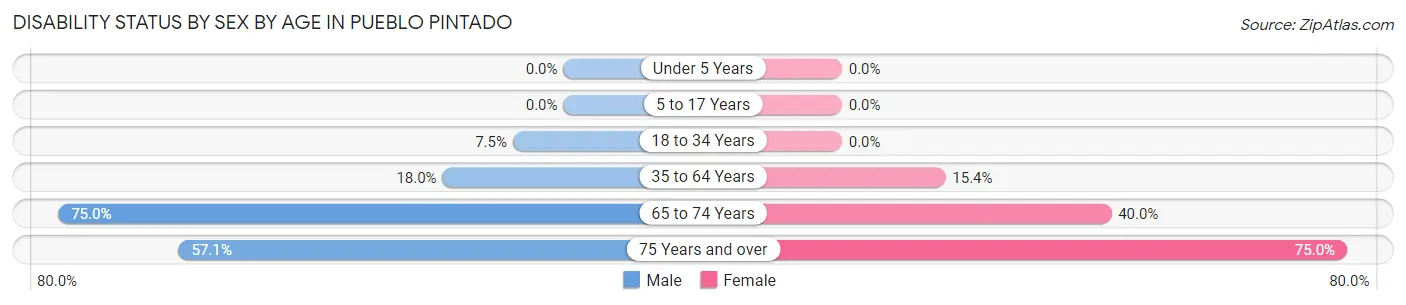
| Age Bracket | Male | Female |
| Under 5 Years | 0 (0.0%) | 0 (0.0%) |
| 5 to 17 Years | 0 (0.0%) | 0 (0.0%) |
| 18 to 34 Years | 3 (7.5%) | 0 (0.0%) |
| 35 to 64 Years | 7 (17.9%) | 6 (15.4%) |
| 65 to 74 Years | 15 (75.0%) | 4 (40.0%) |
| 75 Years and over | 4 (57.1%) | 6 (75.0%) |
Disability Class by Sex by Age in Pueblo Pintado
Disability Class: Hearing Difficulty
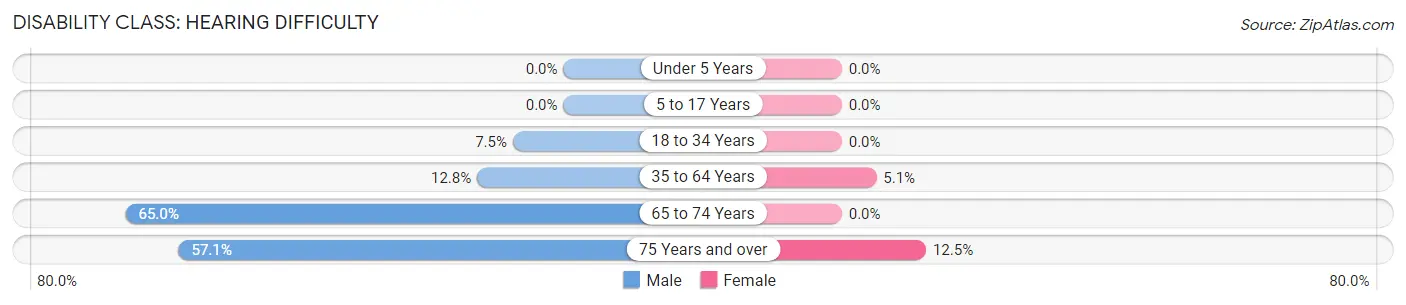
| Age Bracket | Male | Female |
| Under 5 Years | 0 (0.0%) | 0 (0.0%) |
| 5 to 17 Years | 0 (0.0%) | 0 (0.0%) |
| 18 to 34 Years | 3 (7.5%) | 0 (0.0%) |
| 35 to 64 Years | 5 (12.8%) | 2 (5.1%) |
| 65 to 74 Years | 13 (65.0%) | 0 (0.0%) |
| 75 Years and over | 4 (57.1%) | 1 (12.5%) |
Disability Class: Vision Difficulty
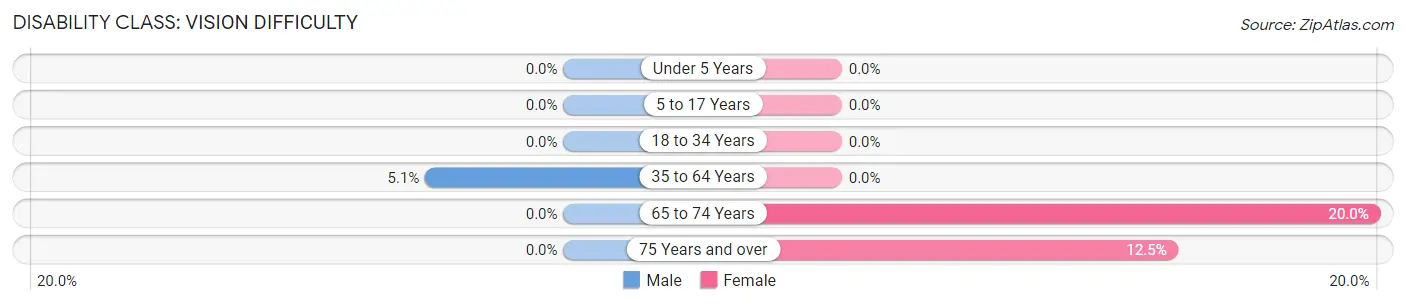
| Age Bracket | Male | Female |
| Under 5 Years | 0 (0.0%) | 0 (0.0%) |
| 5 to 17 Years | 0 (0.0%) | 0 (0.0%) |
| 18 to 34 Years | 0 (0.0%) | 0 (0.0%) |
| 35 to 64 Years | 2 (5.1%) | 0 (0.0%) |
| 65 to 74 Years | 0 (0.0%) | 2 (20.0%) |
| 75 Years and over | 0 (0.0%) | 1 (12.5%) |
Disability Class: Cognitive Difficulty
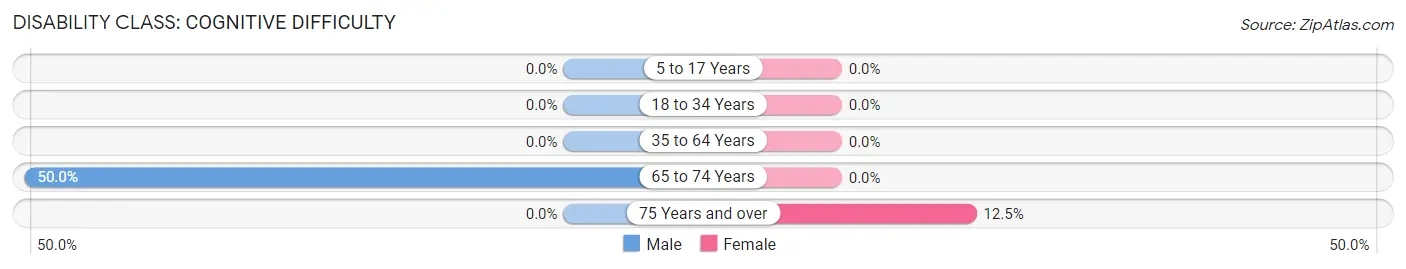
| Age Bracket | Male | Female |
| 5 to 17 Years | 0 (0.0%) | 0 (0.0%) |
| 18 to 34 Years | 0 (0.0%) | 0 (0.0%) |
| 35 to 64 Years | 0 (0.0%) | 0 (0.0%) |
| 65 to 74 Years | 10 (50.0%) | 0 (0.0%) |
| 75 Years and over | 0 (0.0%) | 1 (12.5%) |
Disability Class: Ambulatory Difficulty
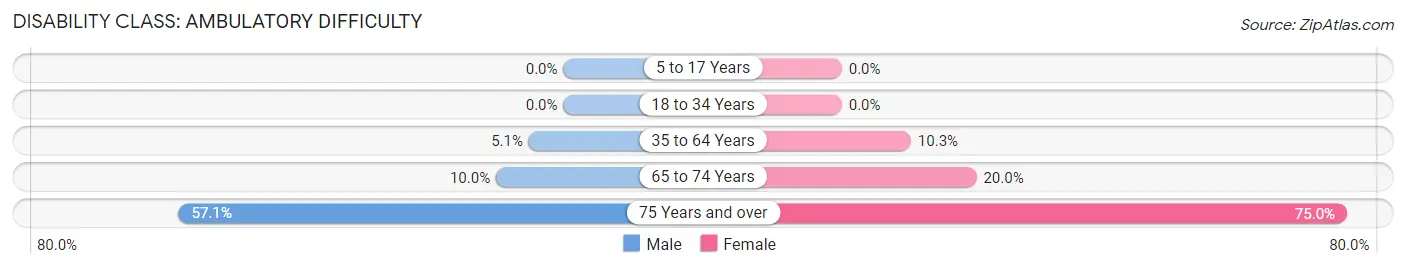
| Age Bracket | Male | Female |
| 5 to 17 Years | 0 (0.0%) | 0 (0.0%) |
| 18 to 34 Years | 0 (0.0%) | 0 (0.0%) |
| 35 to 64 Years | 2 (5.1%) | 4 (10.3%) |
| 65 to 74 Years | 2 (10.0%) | 2 (20.0%) |
| 75 Years and over | 4 (57.1%) | 6 (75.0%) |
Disability Class: Self-Care Difficulty
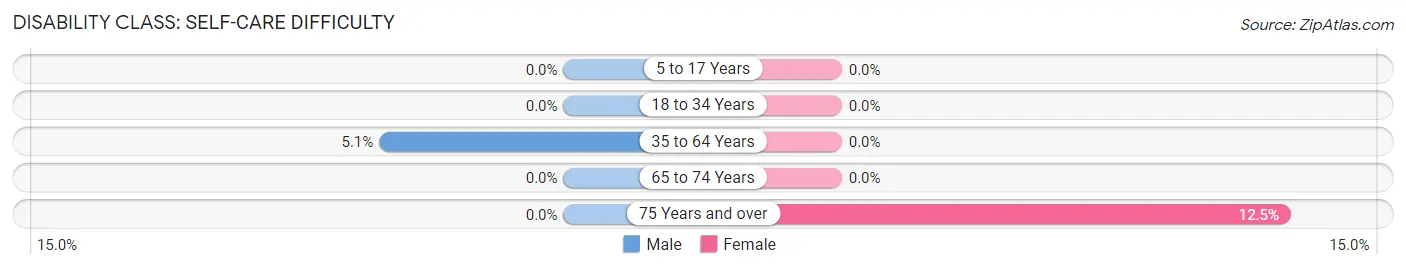
| Age Bracket | Male | Female |
| 5 to 17 Years | 0 (0.0%) | 0 (0.0%) |
| 18 to 34 Years | 0 (0.0%) | 0 (0.0%) |
| 35 to 64 Years | 2 (5.1%) | 0 (0.0%) |
| 65 to 74 Years | 0 (0.0%) | 0 (0.0%) |
| 75 Years and over | 0 (0.0%) | 1 (12.5%) |
Technology Access in Pueblo Pintado
Computing Device Access in Pueblo Pintado
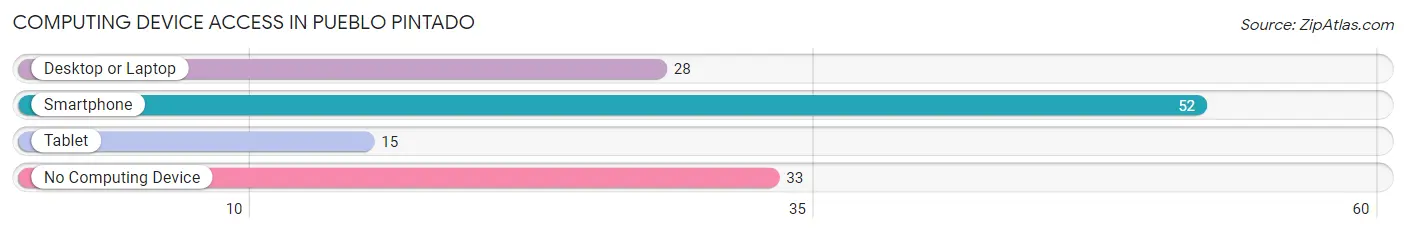
| Device Type | # Households | % Households |
| Desktop or Laptop | 28 | 31.5% |
| Smartphone | 52 | 58.4% |
| Tablet | 15 | 16.9% |
| No Computing Device | 33 | 37.1% |
| Total | 89 | 100.0% |
Internet Access in Pueblo Pintado

| Internet Type | # Households | % Households |
| Dial-Up Internet | 0 | 0.0% |
| Broadband Home | 0 | 0.0% |
| Cellular Data Only | 8 | 9.0% |
| Satellite Internet | 22 | 24.7% |
| No Internet | 59 | 66.3% |
| Total | 89 | 100.0% |
Pueblo Pintado Summary
Pueblo Pintado, New Mexico is a small unincorporated community located in San Juan County, New Mexico. It is situated in the Chaco Canyon region of the state, approximately 25 miles south of the city of Farmington. The community is home to approximately 200 people, most of whom are Native American.
History
The area that is now Pueblo Pintado has been inhabited for centuries by the Navajo people. The name Pueblo Pintado, which translates to “painted village” in Spanish, was given to the area by Spanish settlers in the late 1700s. The area was home to a number of small settlements, including the Pueblo Pintado settlement, which was established in the late 1800s.
The Pueblo Pintado settlement was a small farming community, and the residents were primarily Navajo. The community was largely self-sufficient, relying on the land for food and other resources. The settlement was also home to a trading post, which served as a hub for trading goods between the Navajo and other nearby tribes.
In the early 1900s, the Pueblo Pintado settlement was relocated to its current location. The relocation was due to the construction of the Navajo Indian Reservation, which was created in the early 1900s. The reservation was created to provide a safe haven for the Navajo people, and the relocation of the Pueblo Pintado settlement was part of this effort.
Geography
Pueblo Pintado is located in the Chaco Canyon region of New Mexico. The area is characterized by its dry climate and rugged terrain. The area is home to a variety of wildlife, including coyotes, bobcats, and deer.
The community is situated at an elevation of 5,400 feet, and the surrounding area is mostly flat. The area is also home to a number of small streams and rivers, which provide water for the community.
Economy
The economy of Pueblo Pintado is largely based on agriculture. The area is home to a number of small farms, which produce a variety of crops, including corn, beans, squash, and melons. The area is also home to a number of small businesses, including a trading post, a gas station, and a grocery store.
The community is also home to a number of artisans, who produce a variety of traditional Navajo crafts, such as jewelry, pottery, and baskets. These crafts are sold both locally and in nearby cities.
Demographics
As of the 2010 census, the population of Pueblo Pintado was approximately 200 people. The majority of the population is Native American, with the majority being Navajo. The median age of the population is 33 years old, and the median household income is $25,000.
The community is served by a number of public services, including a post office, a fire station, and a library. The community is also home to a number of churches, including the Pueblo Pintado Baptist Church and the Pueblo Pintado United Methodist Church.
Conclusion
Pueblo Pintado, New Mexico is a small unincorporated community located in San Juan County, New Mexico. The area has been inhabited for centuries by the Navajo people, and the name Pueblo Pintado, which translates to “painted village” in Spanish, was given to the area by Spanish settlers in the late 1700s. The economy of Pueblo Pintado is largely based on agriculture, and the area is home to a number of small businesses and artisans. The population of Pueblo Pintado is approximately 200 people, with the majority being Native American. The community is served by a number of public services, including a post office, a fire station, and a library.
Common Questions
What is Per Capita Income in Pueblo Pintado?
Per Capita income in Pueblo Pintado is $17,353.
What is the Median Family Income in Pueblo Pintado?
Median Family Income in Pueblo Pintado is $41,786.
What is the Median Household income in Pueblo Pintado?
Median Household Income in Pueblo Pintado is $40,536.
What is Income or Wage Gap in Pueblo Pintado?
Income or Wage Gap in Pueblo Pintado is 6.5%.
Women in Pueblo Pintado earn 93.5 cents for every dollar earned by a man.
What is Inequality or Gini Index in Pueblo Pintado?
Inequality or Gini Index in Pueblo Pintado is 0.43.
What is the Total Population of Pueblo Pintado?
Total Population of Pueblo Pintado is 217.
What is the Total Male Population of Pueblo Pintado?
Total Male Population of Pueblo Pintado is 122.
What is the Total Female Population of Pueblo Pintado?
Total Female Population of Pueblo Pintado is 95.
What is the Ratio of Males per 100 Females in Pueblo Pintado?
There are 128.42 Males per 100 Females in Pueblo Pintado.
What is the Ratio of Females per 100 Males in Pueblo Pintado?
There are 77.87 Females per 100 Males in Pueblo Pintado.
What is the Median Population Age in Pueblo Pintado?
Median Population Age in Pueblo Pintado is 48.5 Years.
What is the Average Family Size in Pueblo Pintado
Average Family Size in Pueblo Pintado is 3.0 People.
What is the Average Household Size in Pueblo Pintado
Average Household Size in Pueblo Pintado is 2.4 People.
How Large is the Labor Force in Pueblo Pintado?
There are 63 People in the Labor Forcein in Pueblo Pintado.
What is the Percentage of People in the Labor Force in Pueblo Pintado?
34.8% of People are in the Labor Force in Pueblo Pintado.
What is the Unemployment Rate in Pueblo Pintado?
Unemployment Rate in Pueblo Pintado is 19.0%.