Crystal, NM Map & Demographics
Crystal Map
Crystal Overview
$16,482
PER CAPITA INCOME
$53,333
AVG FAMILY INCOME
52.8%
WAGE / INCOME GAP [ % ]
47.2¢/ $1
WAGE / INCOME GAP [ $ ]
0.46
INEQUALITY / GINI INDEX
285
TOTAL POPULATION
145
MALE POPULATION
140
FEMALE POPULATION
103.57
MALES / 100 FEMALES
96.55
FEMALES / 100 MALES
35.8
MEDIAN AGE
4.9
AVG FAMILY SIZE
3.8
AVG HOUSEHOLD SIZE
104
LABOR FORCE [ PEOPLE ]
39.8%
PERCENT IN LABOR FORCE
3.8%
UNEMPLOYMENT RATE
Income in Crystal
Income Overview in Crystal
| Characteristic | Number | Measure |
| Per Capita Income | 285 | $16,482 |
| Median Family Income | 52 | $53,333 |
| Mean Family Income | 52 | $59,842 |
| Median Household Income | 73 | $0 |
| Mean Household Income | 73 | $49,988 |
| Income Deficit | 52 | $0 |
| Wage / Income Gap (%) | 285 | 52.79% |
| Wage / Income Gap ($) | 285 | 47.21¢ per $1 |
| Gini / Inequality Index | 285 | 0.46 |
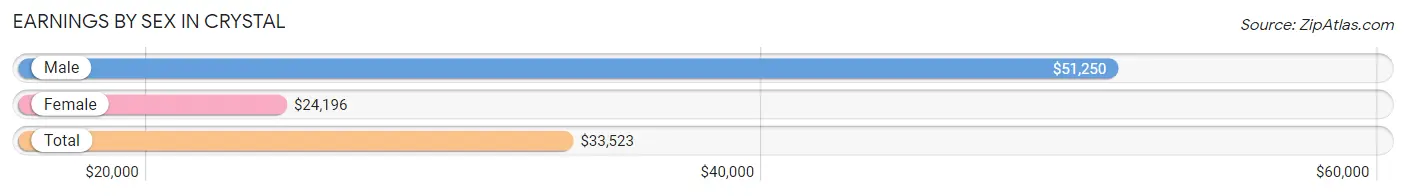
Earnings by Sex in Crystal
Average Earnings in Crystal are $33,523, $51,250 for men and $24,196 for women, a difference of 52.8%.
| Sex | Number | Average Earnings |
| Male | 50 (45.1%) | $51,250 |
| Female | 61 (54.9%) | $24,196 |
| Total | 111 (100.0%) | $33,523 |
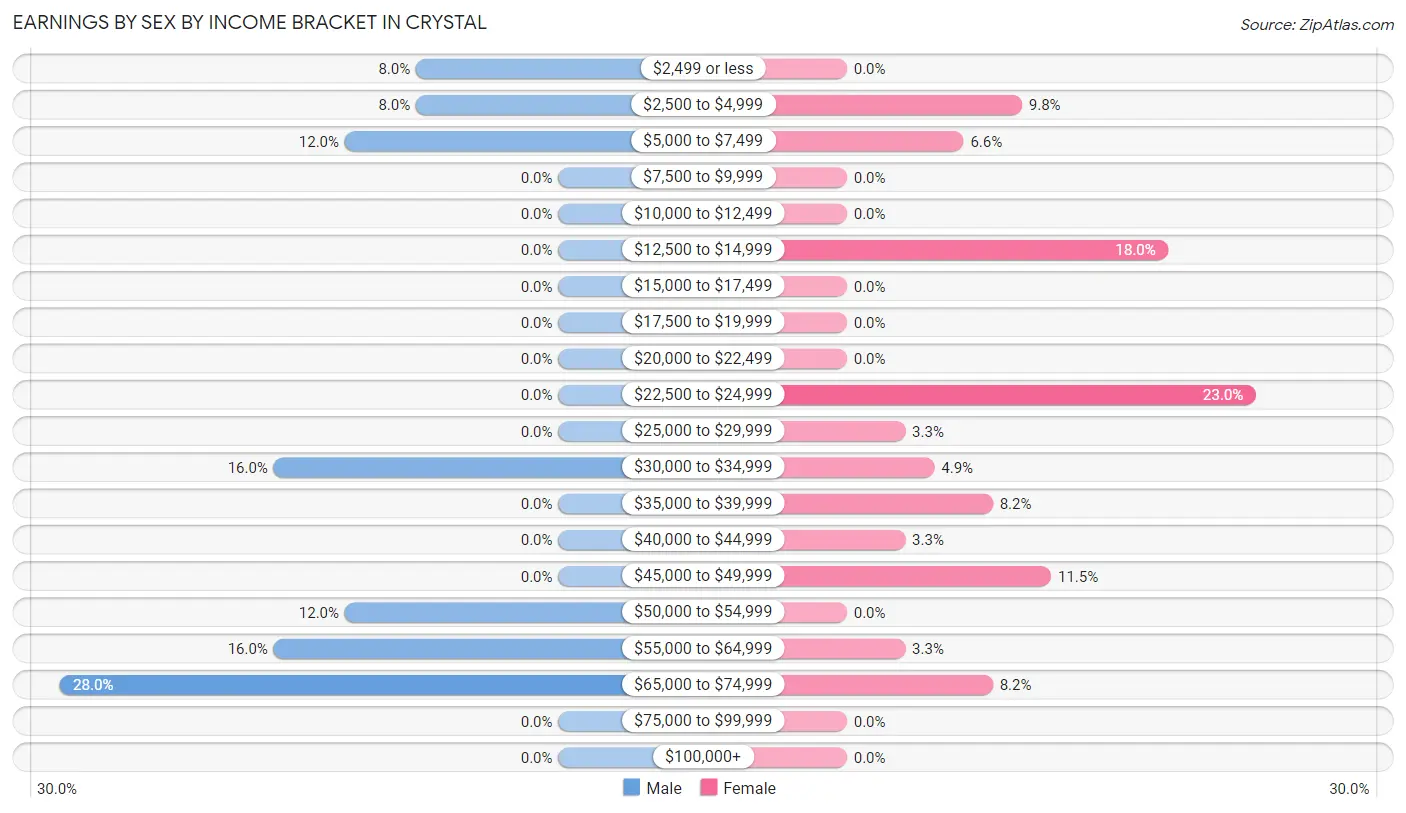
Earnings by Sex by Income Bracket in Crystal
The most common earnings brackets in Crystal are $65,000 to $74,999 for men (14 | 28.0%) and $22,500 to $24,999 for women (14 | 23.0%).
| Income | Male | Female |
| $2,499 or less | 4 (8.0%) | 0 (0.0%) |
| $2,500 to $4,999 | 4 (8.0%) | 6 (9.8%) |
| $5,000 to $7,499 | 6 (12.0%) | 4 (6.6%) |
| $7,500 to $9,999 | 0 (0.0%) | 0 (0.0%) |
| $10,000 to $12,499 | 0 (0.0%) | 0 (0.0%) |
| $12,500 to $14,999 | 0 (0.0%) | 11 (18.0%) |
| $15,000 to $17,499 | 0 (0.0%) | 0 (0.0%) |
| $17,500 to $19,999 | 0 (0.0%) | 0 (0.0%) |
| $20,000 to $22,499 | 0 (0.0%) | 0 (0.0%) |
| $22,500 to $24,999 | 0 (0.0%) | 14 (23.0%) |
| $25,000 to $29,999 | 0 (0.0%) | 2 (3.3%) |
| $30,000 to $34,999 | 8 (16.0%) | 3 (4.9%) |
| $35,000 to $39,999 | 0 (0.0%) | 5 (8.2%) |
| $40,000 to $44,999 | 0 (0.0%) | 2 (3.3%) |
| $45,000 to $49,999 | 0 (0.0%) | 7 (11.5%) |
| $50,000 to $54,999 | 6 (12.0%) | 0 (0.0%) |
| $55,000 to $64,999 | 8 (16.0%) | 2 (3.3%) |
| $65,000 to $74,999 | 14 (28.0%) | 5 (8.2%) |
| $75,000 to $99,999 | 0 (0.0%) | 0 (0.0%) |
| $100,000+ | 0 (0.0%) | 0 (0.0%) |
| Total | 50 (100.0%) | 61 (100.0%) |
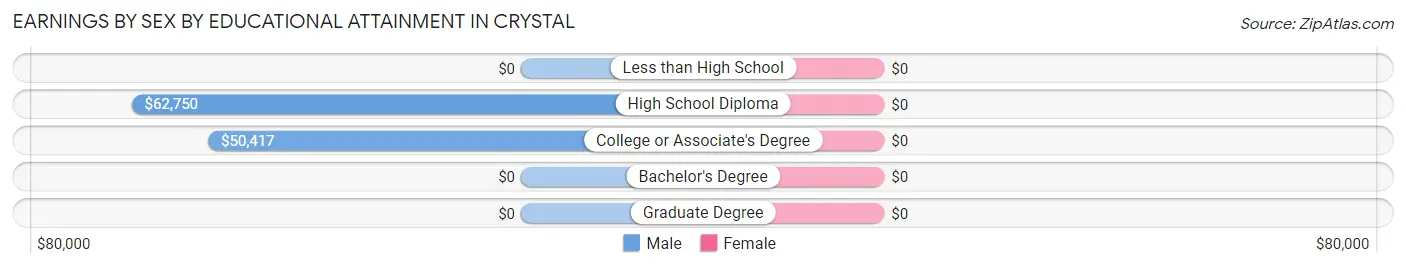
Earnings by Sex by Educational Attainment in Crystal
| Educational Attainment | Male Income | Female Income |
| Less than High School | - | - |
| High School Diploma | $62,750 | $0 |
| College or Associate's Degree | $50,417 | $0 |
| Bachelor's Degree | - | - |
| Graduate Degree | - | - |
| Total | $62,656 | $34,583 |
Family Income in Crystal
Family Income Brackets in Crystal
According to the Crystal family income data, there are 10 families falling into the $50,000 to $74,999 income range, which is the most common income bracket and makes up 19.2% of all families.
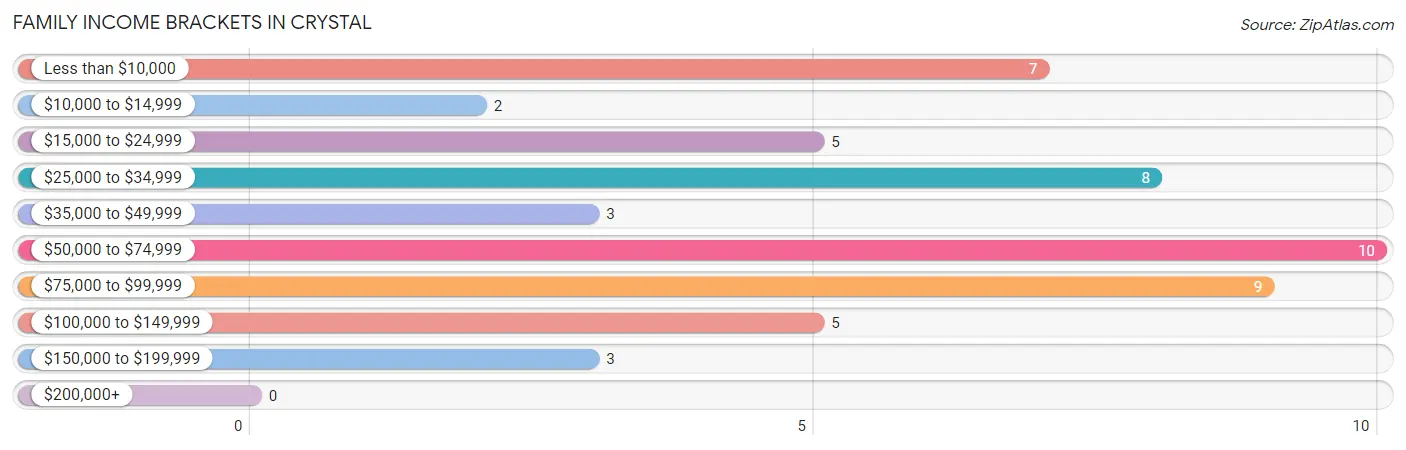
| Income Bracket | # Families | % Families |
| Less than $10,000 | 7 | 13.5% |
| $10,000 to $14,999 | 2 | 3.8% |
| $15,000 to $24,999 | 5 | 9.6% |
| $25,000 to $34,999 | 8 | 15.4% |
| $35,000 to $49,999 | 3 | 5.8% |
| $50,000 to $74,999 | 10 | 19.2% |
| $75,000 to $99,999 | 9 | 17.3% |
| $100,000 to $149,999 | 5 | 9.6% |
| $150,000 to $199,999 | 3 | 5.8% |
| $200,000+ | 0 | 0.0% |
Family Income by Famaliy Size in Crystal
5-person families (12 | 23.1%) account for the highest median family income in Crystal with $98,750 per family, while 2-person families (17 | 32.7%) have the highest median income of $23,125 per family member.
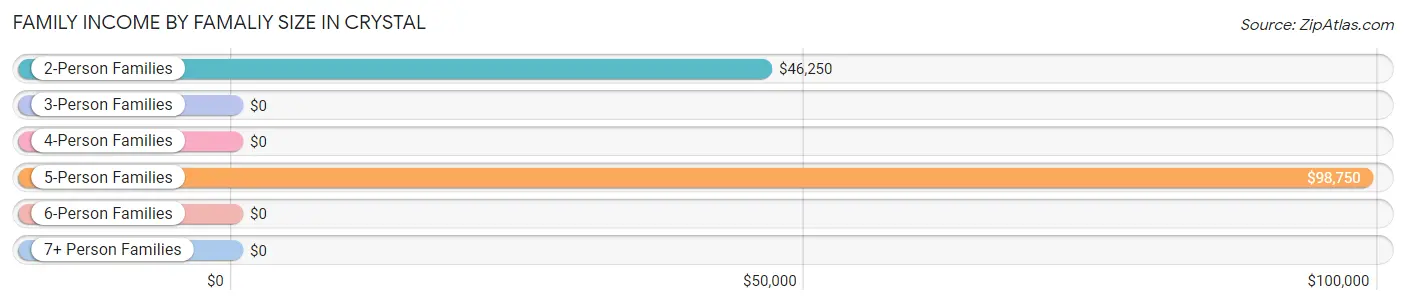
| Income Bracket | # Families | Median Income |
| 2-Person Families | 17 (32.7%) | $46,250 |
| 3-Person Families | 8 (15.4%) | $0 |
| 4-Person Families | 12 (23.1%) | $0 |
| 5-Person Families | 12 (23.1%) | $98,750 |
| 6-Person Families | 0 (0.0%) | $0 |
| 7+ Person Families | 3 (5.8%) | $0 |
| Total | 52 (100.0%) | $53,333 |
Family Income by Number of Earners in Crystal
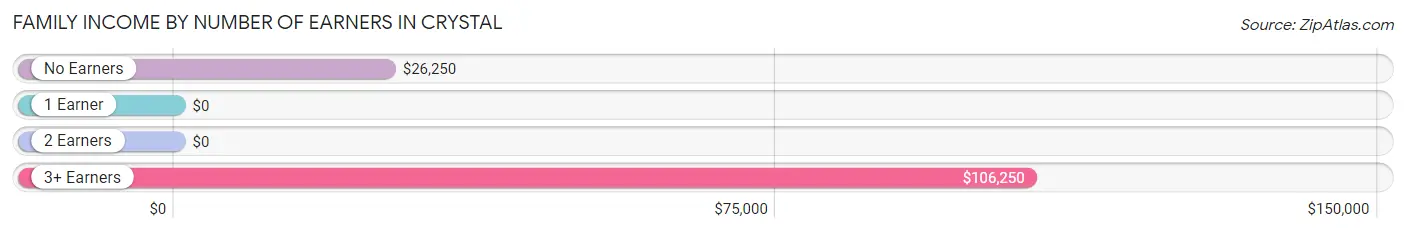
| Number of Earners | # Families | Median Income |
| No Earners | 14 (26.9%) | $26,250 |
| 1 Earner | 18 (34.6%) | $0 |
| 2 Earners | 11 (21.1%) | $0 |
| 3+ Earners | 9 (17.3%) | $106,250 |
| Total | 52 (100.0%) | $53,333 |
Household Income in Crystal
Household Income Brackets in Crystal
With 14 households falling in the category, the $50,000 to $74,999 income range is the most frequent in Crystal, accounting for 19.2% of all households.
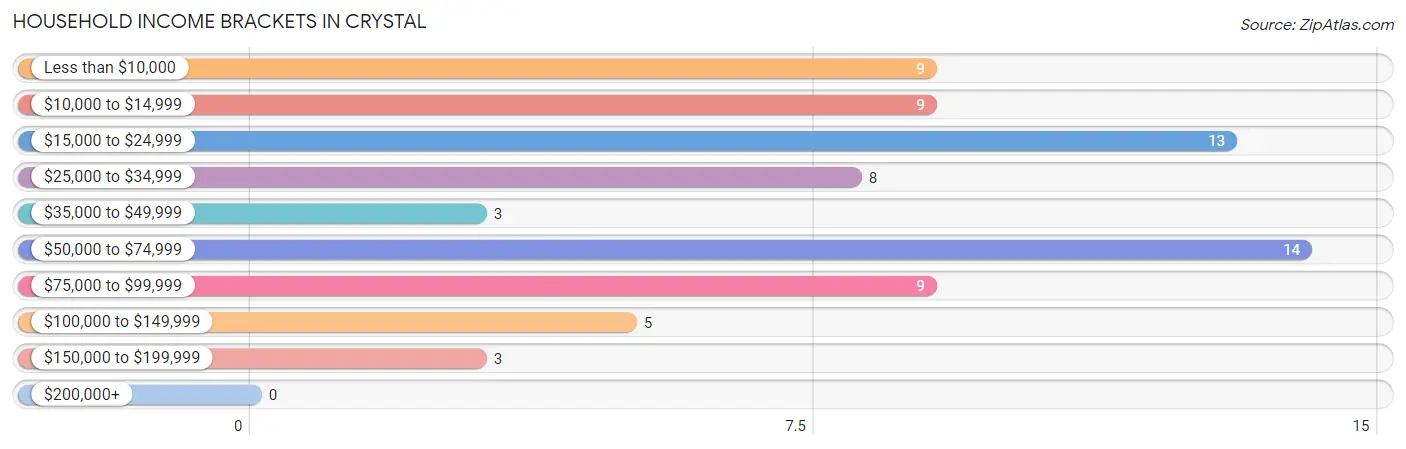
| Income Bracket | # Households | % Households |
| Less than $10,000 | 9 | 12.3% |
| $10,000 to $14,999 | 9 | 12.3% |
| $15,000 to $24,999 | 13 | 17.8% |
| $25,000 to $34,999 | 8 | 11.0% |
| $35,000 to $49,999 | 3 | 4.1% |
| $50,000 to $74,999 | 14 | 19.2% |
| $75,000 to $99,999 | 9 | 12.3% |
| $100,000 to $149,999 | 5 | 6.8% |
| $150,000 to $199,999 | 3 | 4.1% |
| $200,000+ | 0 | 0.0% |
Household Income by Householder Age in Crystal
The median household income in Crystal is $0, with the highest median household income of $55,625 found in the 45 to 64 years age bracket for the primary householder. A total of 41 households (56.2%) fall into this category.
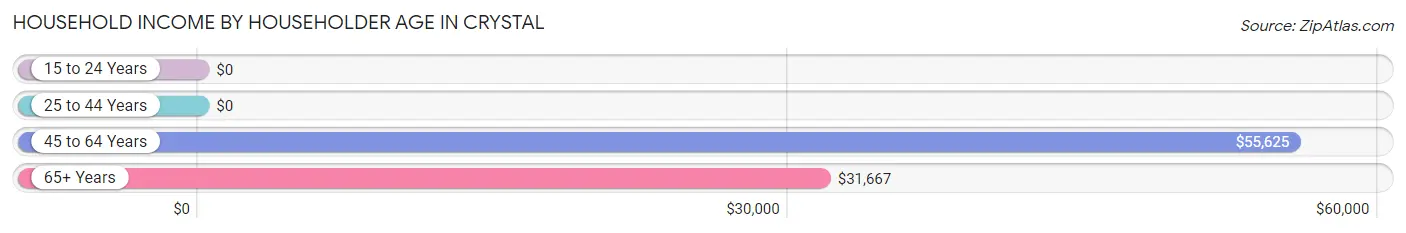
| Income Bracket | # Households | Median Income |
| 15 to 24 Years | 0 (0.0%) | $0 |
| 25 to 44 Years | 10 (13.7%) | $0 |
| 45 to 64 Years | 41 (56.2%) | $55,625 |
| 65+ Years | 22 (30.1%) | $31,667 |
| Total | 73 (100.0%) | $0 |
Poverty in Crystal
Income Below Poverty by Sex and Age in Crystal
With 34.5% poverty level for males and 32.1% for females among the residents of Crystal, under 5 year old males and 6 to 11 year old females are the most vulnerable to poverty, with 4 males (100.0%) and 4 females (100.0%) in their respective age groups living below the poverty level.
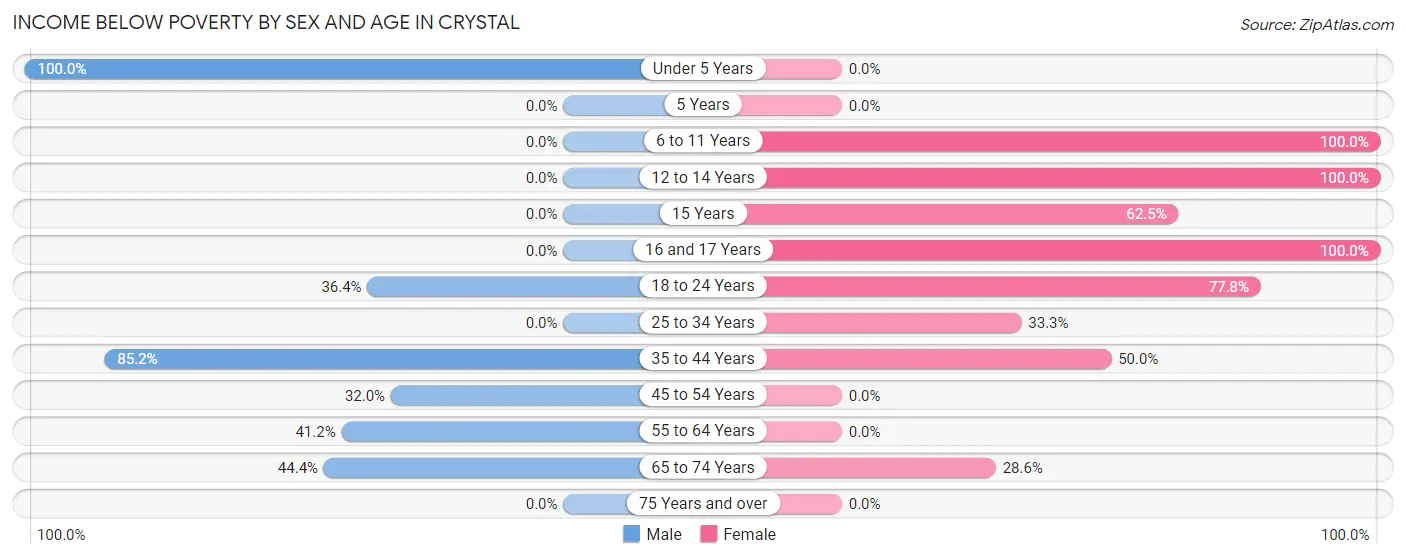
| Age Bracket | Male | Female |
| Under 5 Years | 4 (100.0%) | 0 (0.0%) |
| 5 Years | 0 (0.0%) | 0 (0.0%) |
| 6 to 11 Years | 0 (0.0%) | 4 (100.0%) |
| 12 to 14 Years | 0 (0.0%) | 4 (100.0%) |
| 15 Years | 0 (0.0%) | 5 (62.5%) |
| 16 and 17 Years | 0 (0.0%) | 5 (100.0%) |
| 18 to 24 Years | 4 (36.4%) | 14 (77.8%) |
| 25 to 34 Years | 0 (0.0%) | 7 (33.3%) |
| 35 to 44 Years | 23 (85.2%) | 4 (50.0%) |
| 45 to 54 Years | 8 (32.0%) | 0 (0.0%) |
| 55 to 64 Years | 7 (41.2%) | 0 (0.0%) |
| 65 to 74 Years | 4 (44.4%) | 2 (28.6%) |
| 75 Years and over | 0 (0.0%) | 0 (0.0%) |
| Total | 50 (34.5%) | 45 (32.1%) |
Income Above Poverty by Sex and Age in Crystal
According to the poverty statistics in Crystal, males aged 16 and 17 years and females aged under 5 years are the age groups that are most secure financially, with 100.0% of males and 100.0% of females in these age groups living above the poverty line.
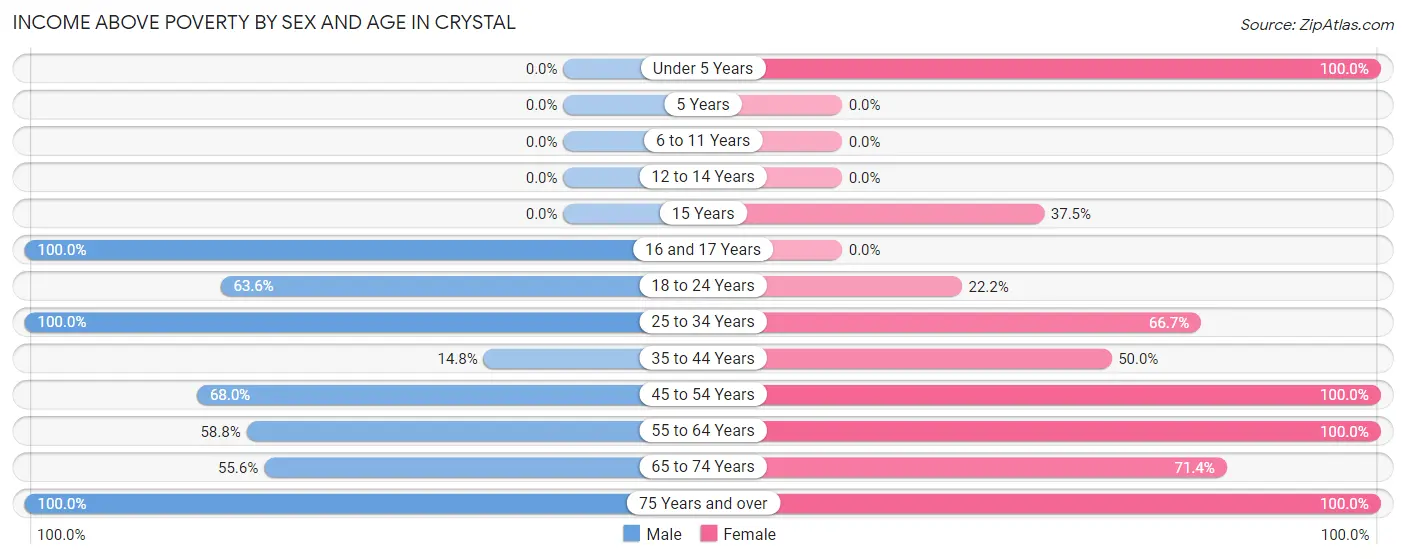
| Age Bracket | Male | Female |
| Under 5 Years | 0 (0.0%) | 4 (100.0%) |
| 5 Years | 0 (0.0%) | 0 (0.0%) |
| 6 to 11 Years | 0 (0.0%) | 0 (0.0%) |
| 12 to 14 Years | 0 (0.0%) | 0 (0.0%) |
| 15 Years | 0 (0.0%) | 3 (37.5%) |
| 16 and 17 Years | 10 (100.0%) | 0 (0.0%) |
| 18 to 24 Years | 7 (63.6%) | 4 (22.2%) |
| 25 to 34 Years | 40 (100.0%) | 14 (66.7%) |
| 35 to 44 Years | 4 (14.8%) | 4 (50.0%) |
| 45 to 54 Years | 17 (68.0%) | 28 (100.0%) |
| 55 to 64 Years | 10 (58.8%) | 16 (100.0%) |
| 65 to 74 Years | 5 (55.6%) | 5 (71.4%) |
| 75 Years and over | 2 (100.0%) | 17 (100.0%) |
| Total | 95 (65.5%) | 95 (67.9%) |
Income Below Poverty Among Married-Couple Families in Crystal
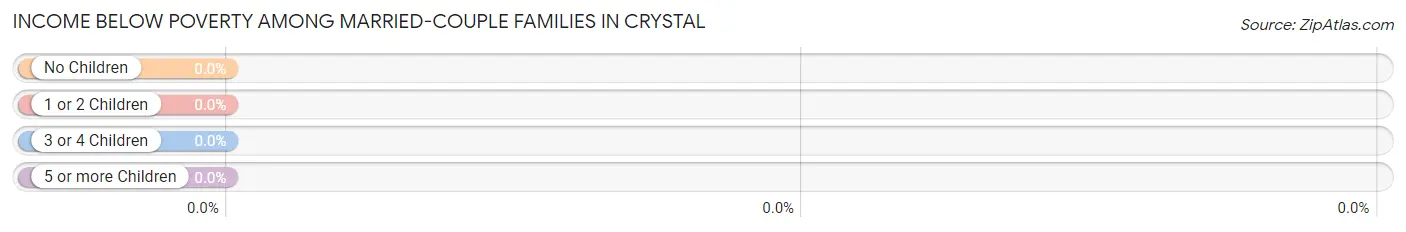
| Children | Above Poverty | Below Poverty |
| No Children | 9 (100.0%) | 0 (0.0%) |
| 1 or 2 Children | 6 (100.0%) | 0 (0.0%) |
| 3 or 4 Children | 0 (0.0%) | 0 (0.0%) |
| 5 or more Children | 0 (0.0%) | 0 (0.0%) |
| Total | 15 (100.0%) | 0 (0.0%) |
Income Below Poverty Among Single-Parent Households in Crystal
According to the poverty data in Crystal, 70.0% or 7 single-father households and 18.5% or 5 single-mother households are living below the poverty line. Among single-father households, those with no children have the highest poverty rate, with 3 households (100.0%) experiencing poverty. Likewise, among single-mother households, those with 1 or 2 children have the highest poverty rate, with 3 households (33.3%) falling below the poverty line.
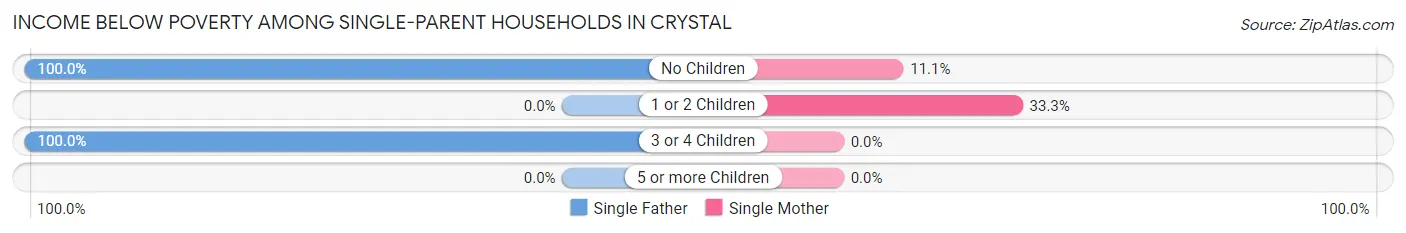
| Children | Single Father | Single Mother |
| No Children | 3 (100.0%) | 2 (11.1%) |
| 1 or 2 Children | 0 (0.0%) | 3 (33.3%) |
| 3 or 4 Children | 4 (100.0%) | 0 (0.0%) |
| 5 or more Children | 0 (0.0%) | 0 (0.0%) |
| Total | 7 (70.0%) | 5 (18.5%) |
Income Below Poverty Among Married-Couple vs Single-Parent Households in Crystal
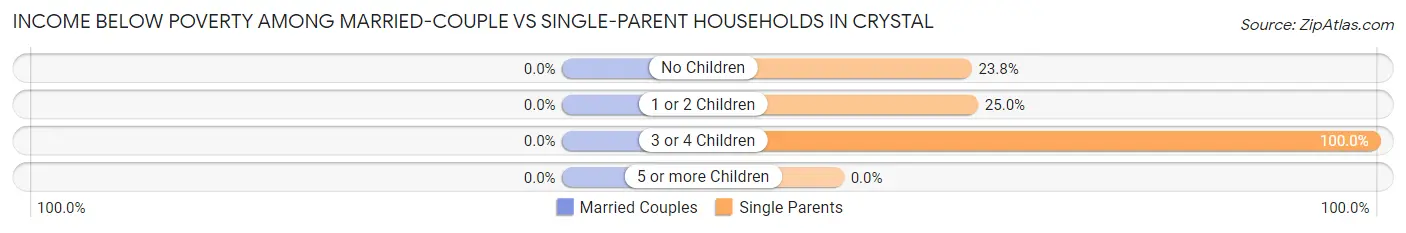
| Children | Married-Couple Families | Single-Parent Households |
| No Children | 0 (0.0%) | 5 (23.8%) |
| 1 or 2 Children | 0 (0.0%) | 3 (25.0%) |
| 3 or 4 Children | 0 (0.0%) | 4 (100.0%) |
| 5 or more Children | 0 (0.0%) | 0 (0.0%) |
| Total | 0 (0.0%) | 12 (32.4%) |
Race in Crystal
The most populous races in Crystal are Native / Alaskan (277 | 97.2%), Hispanic or Latino (11 | 3.9%), and Two or more Races (8 | 2.8%).
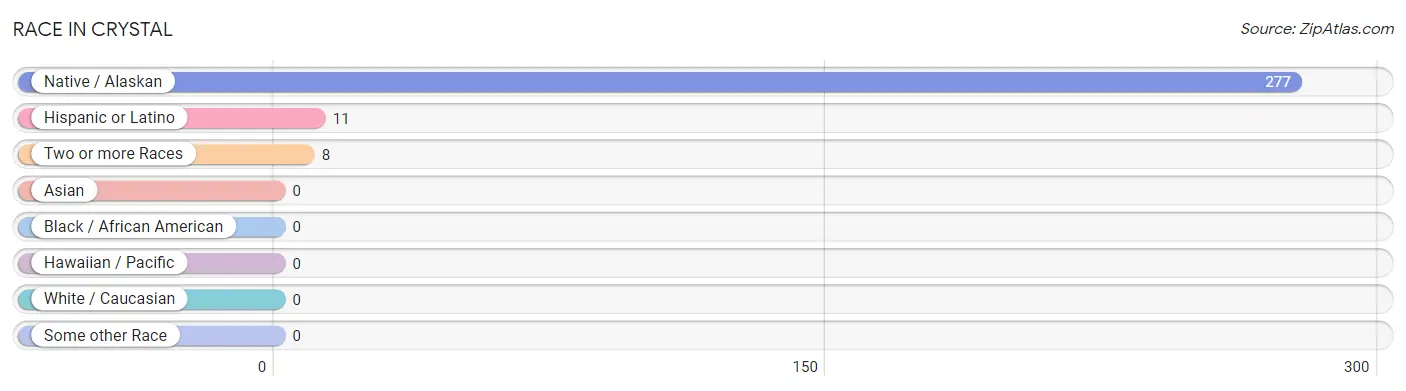
| Race | # Population | % Population |
| Asian | 0 | 0.0% |
| Black / African American | 0 | 0.0% |
| Hawaiian / Pacific | 0 | 0.0% |
| Hispanic or Latino | 11 | 3.9% |
| Native / Alaskan | 277 | 97.2% |
| White / Caucasian | 0 | 0.0% |
| Two or more Races | 8 | 2.8% |
| Some other Race | 0 | 0.0% |
| Total | 285 | 100.0% |
Ancestry in Crystal
The most populous ancestries reported in Crystal are Navajo (277 | 97.2%), Mexican (11 | 3.9%), Irish (5 | 1.8%), Italian (5 | 1.8%), and Hopi (3 | 1.1%), together accounting for 105.6% of all Crystal residents.
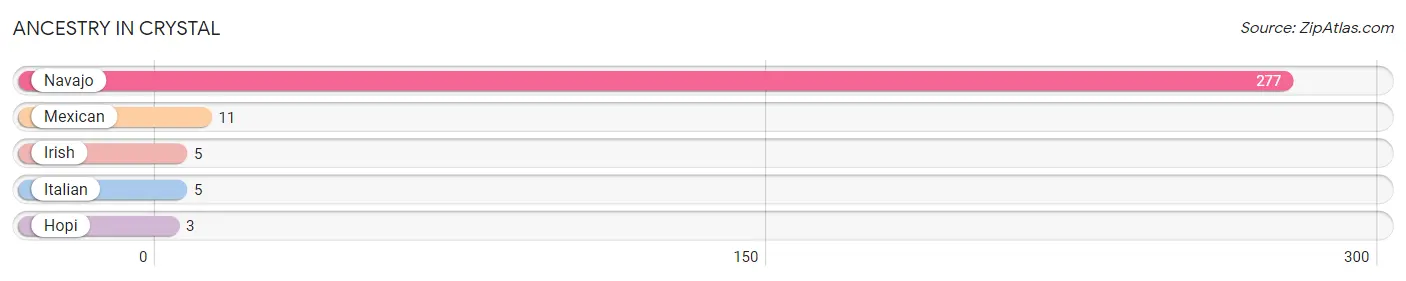
| Ancestry | # Population | % Population |
| Hopi | 3 | 1.1% |
| Irish | 5 | 1.8% |
| Italian | 5 | 1.8% |
| Mexican | 11 | 3.9% |
| Navajo | 277 | 97.2% | View All 5 Rows |
Immigrants in Crystal

| Immigration Origin | # Population | % Population | View All 0 Rows |
Sex and Age in Crystal
Sex and Age in Crystal
The most populous age groups in Crystal are 25 to 29 Years (30 | 20.7%) for men and 20 to 24 Years (18 | 12.9%) for women.
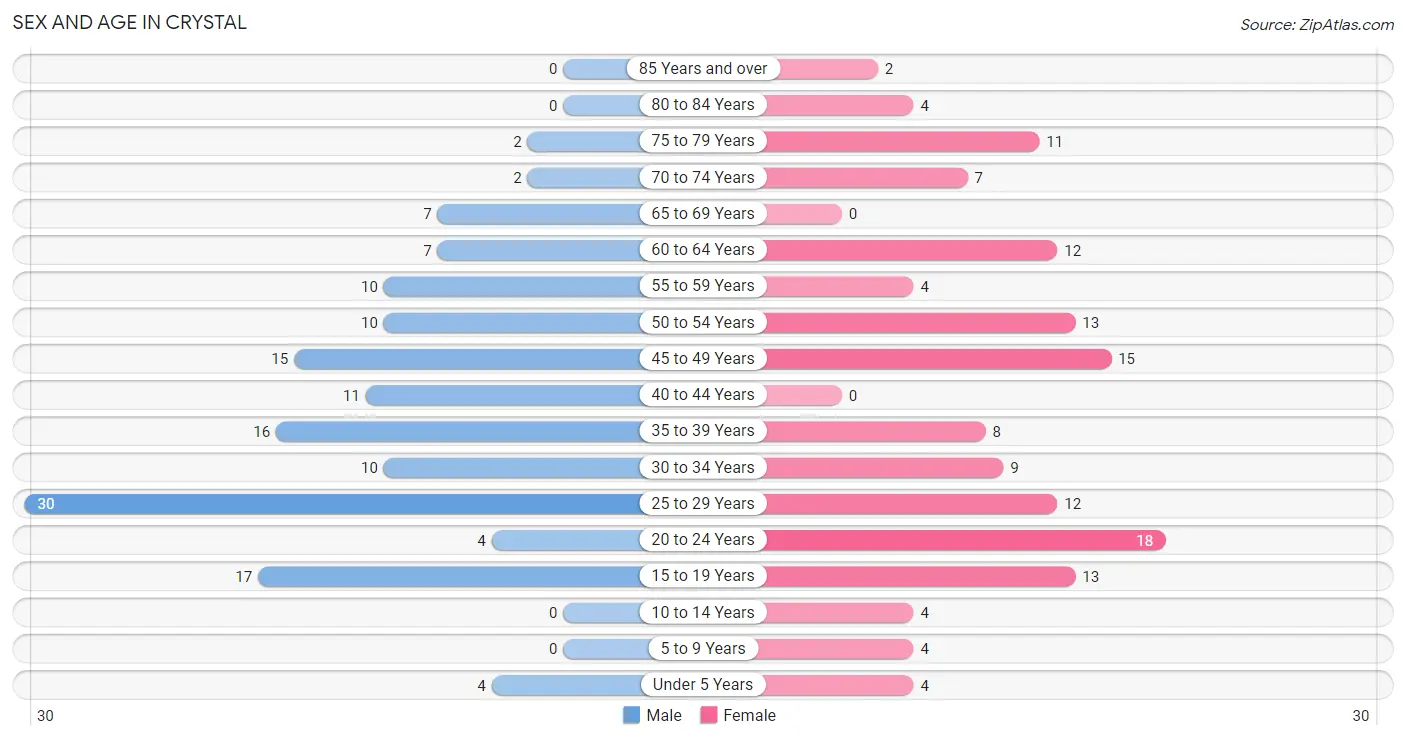
| Age Bracket | Male | Female |
| Under 5 Years | 4 (2.8%) | 4 (2.9%) |
| 5 to 9 Years | 0 (0.0%) | 4 (2.9%) |
| 10 to 14 Years | 0 (0.0%) | 4 (2.9%) |
| 15 to 19 Years | 17 (11.7%) | 13 (9.3%) |
| 20 to 24 Years | 4 (2.8%) | 18 (12.9%) |
| 25 to 29 Years | 30 (20.7%) | 12 (8.6%) |
| 30 to 34 Years | 10 (6.9%) | 9 (6.4%) |
| 35 to 39 Years | 16 (11.0%) | 8 (5.7%) |
| 40 to 44 Years | 11 (7.6%) | 0 (0.0%) |
| 45 to 49 Years | 15 (10.3%) | 15 (10.7%) |
| 50 to 54 Years | 10 (6.9%) | 13 (9.3%) |
| 55 to 59 Years | 10 (6.9%) | 4 (2.9%) |
| 60 to 64 Years | 7 (4.8%) | 12 (8.6%) |
| 65 to 69 Years | 7 (4.8%) | 0 (0.0%) |
| 70 to 74 Years | 2 (1.4%) | 7 (5.0%) |
| 75 to 79 Years | 2 (1.4%) | 11 (7.9%) |
| 80 to 84 Years | 0 (0.0%) | 4 (2.9%) |
| 85 Years and over | 0 (0.0%) | 2 (1.4%) |
| Total | 145 (100.0%) | 140 (100.0%) |
Families and Households in Crystal
Median Family Size in Crystal
The median family size in Crystal is 4.90 persons per family, with single female/mother families (27 | 51.9%) accounting for the largest median family size of 5.07 persons per family. On the other hand, married-couple families (15 | 28.8%) represent the smallest median family size with 4.60 persons per family.
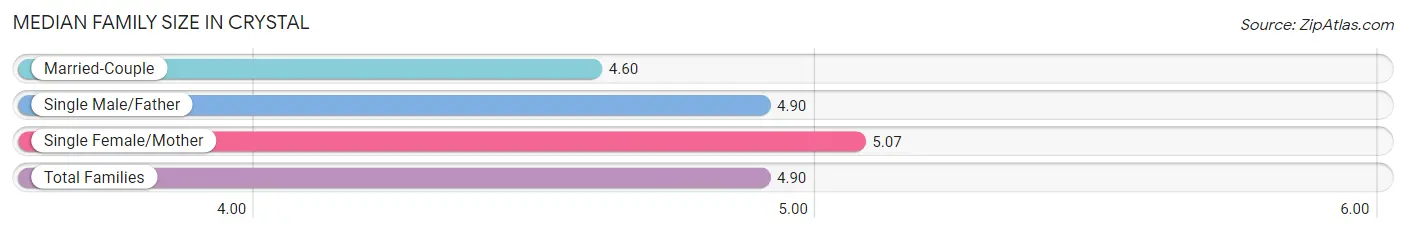
| Family Type | # Families | Family Size |
| Married-Couple | 15 (28.8%) | 4.60 |
| Single Male/Father | 10 (19.2%) | 4.90 |
| Single Female/Mother | 27 (51.9%) | 5.07 |
| Total Families | 52 (100.0%) | 4.90 |
Median Household Size in Crystal
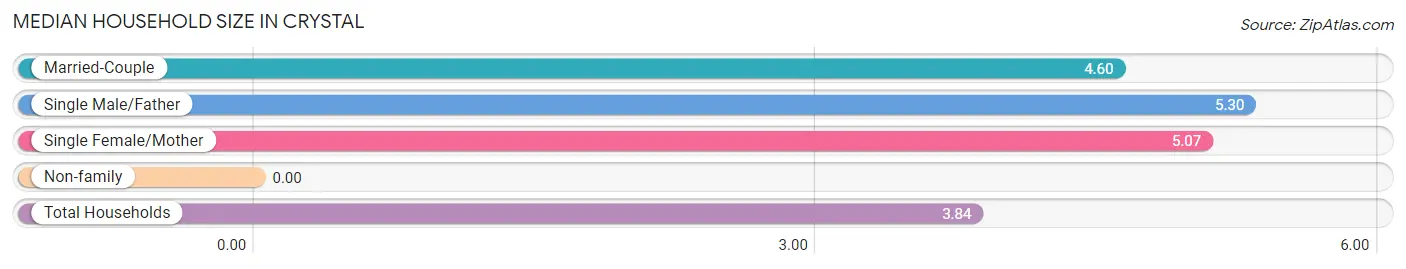
| Household Type | # Households | Household Size |
| Married-Couple | 15 (20.5%) | 4.60 |
| Single Male/Father | 10 (13.7%) | 5.30 |
| Single Female/Mother | 27 (37.0%) | 5.07 |
| Non-family | 21 (28.8%) | - |
| Total Households | 73 (100.0%) | 3.84 |
Household Size by Marriage Status in Crystal
Out of a total of 73 households in Crystal, 52 (71.2%) are family households, while 21 (28.8%) are nonfamily households. The most numerous type of family households are 2-person households, comprising 17, and the most common type of nonfamily households are 1-person households, comprising 21.
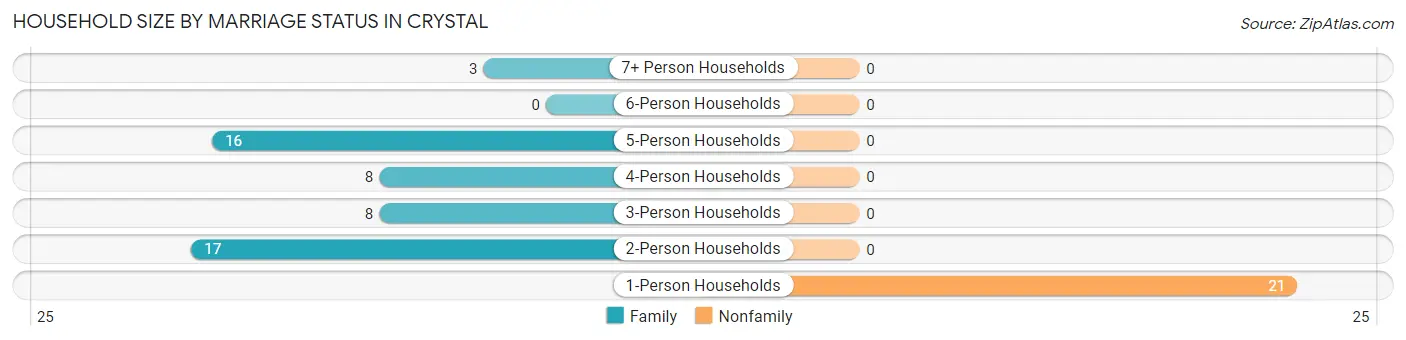
| Household Size | Family Households | Nonfamily Households |
| 1-Person Households | - | 21 (28.8%) |
| 2-Person Households | 17 (23.3%) | 0 (0.0%) |
| 3-Person Households | 8 (11.0%) | 0 (0.0%) |
| 4-Person Households | 8 (11.0%) | 0 (0.0%) |
| 5-Person Households | 16 (21.9%) | 0 (0.0%) |
| 6-Person Households | 0 (0.0%) | 0 (0.0%) |
| 7+ Person Households | 3 (4.1%) | 0 (0.0%) |
| Total | 52 (71.2%) | 21 (28.8%) |
Female Fertility in Crystal
Fertility by Age in Crystal
| Age Bracket | Women with Births | Births / 1,000 Women |
| 15 to 19 years | 0 (0.0%) | 0.0 |
| 20 to 34 years | 0 (0.0%) | 0.0 |
| 35 to 50 years | 0 (0.0%) | 0.0 |
| Total | 0 (0.0%) | 0.0 |
Fertility by Age by Marriage Status in Crystal
| Age Bracket | Married | Unmarried |
| 15 to 19 years | 0 (0.0%) | 0 (0.0%) |
| 20 to 34 years | 0 (0.0%) | 0 (0.0%) |
| 35 to 50 years | 0 (0.0%) | 0 (0.0%) |
| Total | 0 (0.0%) | 0 (0.0%) |
Fertility by Education in Crystal
| Educational Attainment | Women with Births | Births / 1,000 Women |
| Less than High School | 0 (0.0%) | 0.0 |
| High School Diploma | 0 (0.0%) | 0.0 |
| College or Associate's Degree | 0 (0.0%) | 0.0 |
| Bachelor's Degree | 0 (0.0%) | 0.0 |
| Graduate Degree | 0 (0.0%) | 0.0 |
| Total | 0 (0.0%) | 0.0 |
Fertility by Education by Marriage Status in Crystal
| Educational Attainment | Married | Unmarried |
| Less than High School | 0 (0.0%) | 0 (0.0%) |
| High School Diploma | 0 (0.0%) | 0 (0.0%) |
| College or Associate's Degree | 0 (0.0%) | 0 (0.0%) |
| Bachelor's Degree | 0 (0.0%) | 0 (0.0%) |
| Graduate Degree | 0 (0.0%) | 0 (0.0%) |
| Total | 0 (0.0%) | 0 (0.0%) |
Employment Characteristics in Crystal
Employment by Class of Employer in Crystal
Among the 100 employed individuals in Crystal, private company employees (56 | 56.0%), local government employees (27 | 27.0%), and state government employees (15 | 15.0%) make up the most common classes of employment.
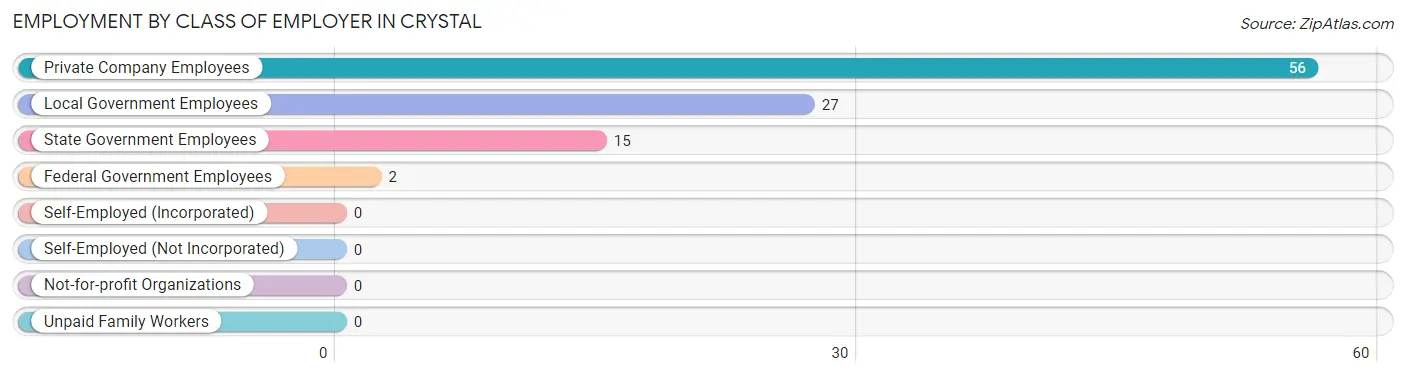
| Employer Class | # Employees | % Employees |
| Private Company Employees | 56 | 56.0% |
| Self-Employed (Incorporated) | 0 | 0.0% |
| Self-Employed (Not Incorporated) | 0 | 0.0% |
| Not-for-profit Organizations | 0 | 0.0% |
| Local Government Employees | 27 | 27.0% |
| State Government Employees | 15 | 15.0% |
| Federal Government Employees | 2 | 2.0% |
| Unpaid Family Workers | 0 | 0.0% |
| Total | 100 | 100.0% |
Employment Status by Age in Crystal
According to the labor force statistics for Crystal, out of the total population over 16 years of age (261), 39.8% or 104 individuals are in the labor force, with 3.8% or 4 of them unemployed. The age group with the highest labor force participation rate is 30 to 34 years, with 84.2% or 16 individuals in the labor force. Within the labor force, the 25 to 29 years age range has the highest percentage of unemployed individuals, with 30.8% or 4 of them being unemployed.
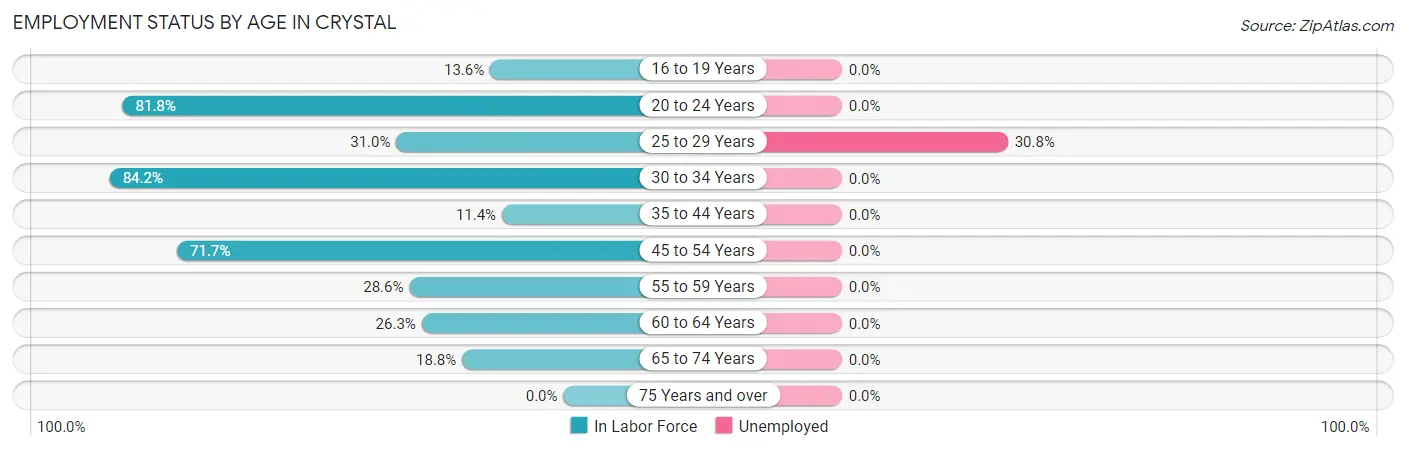
| Age Bracket | In Labor Force | Unemployed |
| 16 to 19 Years | 3 (13.6%) | 0 (0.0%) |
| 20 to 24 Years | 18 (81.8%) | 0 (0.0%) |
| 25 to 29 Years | 13 (31.0%) | 4 (30.8%) |
| 30 to 34 Years | 16 (84.2%) | 0 (0.0%) |
| 35 to 44 Years | 4 (11.4%) | 0 (0.0%) |
| 45 to 54 Years | 38 (71.7%) | 0 (0.0%) |
| 55 to 59 Years | 4 (28.6%) | 0 (0.0%) |
| 60 to 64 Years | 5 (26.3%) | 0 (0.0%) |
| 65 to 74 Years | 3 (18.8%) | 0 (0.0%) |
| 75 Years and over | 0 (0.0%) | 0 (0.0%) |
| Total | 104 (39.8%) | 4 (3.8%) |
Employment Status by Educational Attainment in Crystal
According to labor force statistics for Crystal, 44.0% of individuals (80) out of the total population between 25 and 64 years of age (182) are in the labor force, with 5.0% or 4 of them being unemployed. The group with the highest labor force participation rate are those with the educational attainment of bachelor's degree or higher, with 100.0% or 25 individuals in the labor force. Within the labor force, individuals with less than high school education have the highest percentage of unemployment, with 100.0% or 4 of them being unemployed.
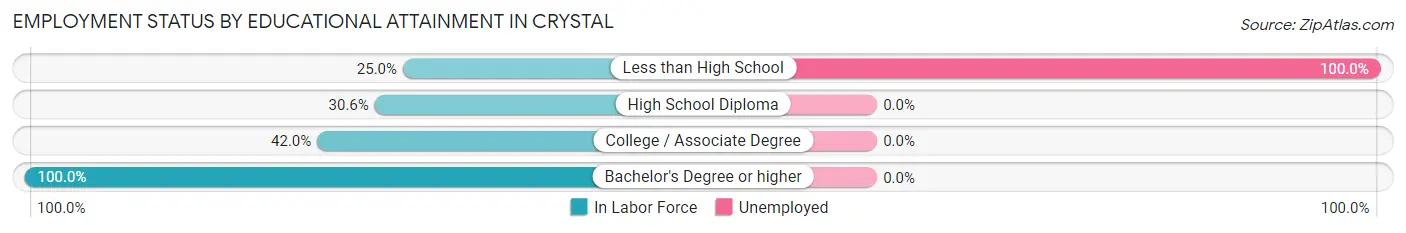
| Educational Attainment | In Labor Force | Unemployed |
| Less than High School | 4 (25.0%) | 16 (100.0%) |
| High School Diploma | 22 (30.6%) | 0 (0.0%) |
| College / Associate Degree | 29 (42.0%) | 0 (0.0%) |
| Bachelor's Degree or higher | 25 (100.0%) | 0 (0.0%) |
| Total | 80 (44.0%) | 9 (5.0%) |
Employment Occupations by Sex in Crystal
Management, Business, Science and Arts Occupations
The most common Management, Business, Science and Arts occupations in Crystal are Management (12 | 12.0%), Community & Social Service (8 | 8.0%), Education Instruction & Library (6 | 6.0%), Computers, Engineering & Science (5 | 5.0%), and Computers & Mathematics (5 | 5.0%).
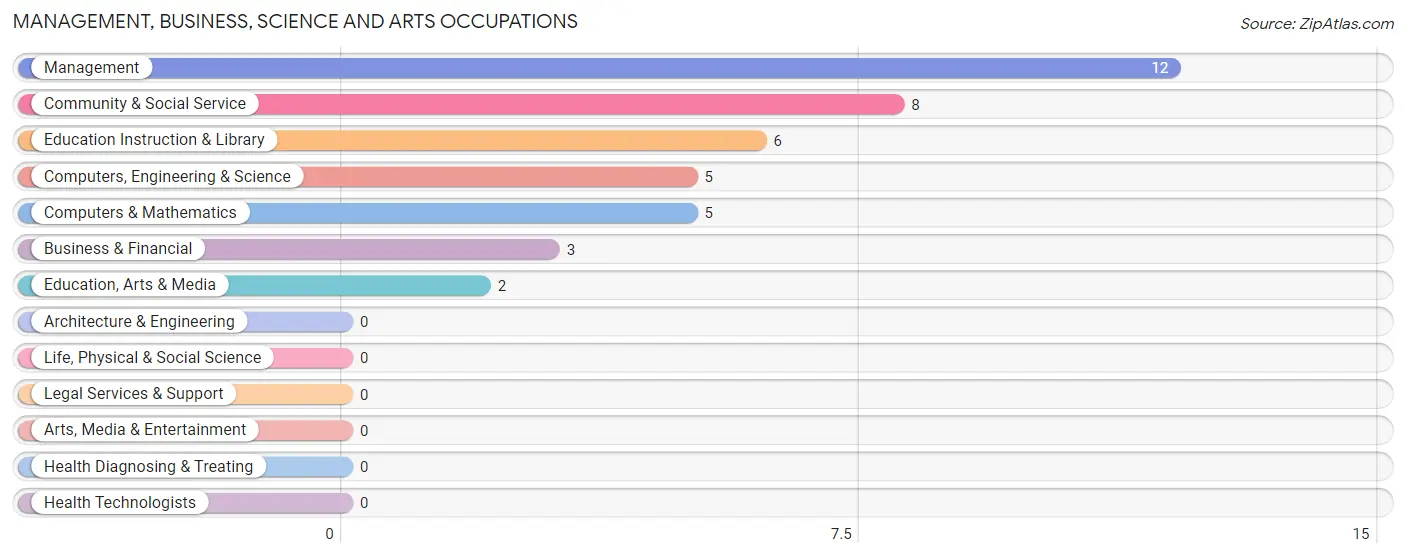
Management, Business, Science and Arts Occupations by Sex
Within the Management, Business, Science and Arts occupations in Crystal, the most male-oriented occupations are Computers, Engineering & Science (100.0%), Computers & Mathematics (100.0%), and Education Instruction & Library (100.0%), while the most female-oriented occupations are Business & Financial (100.0%), Education, Arts & Media (100.0%), and Management (58.3%).
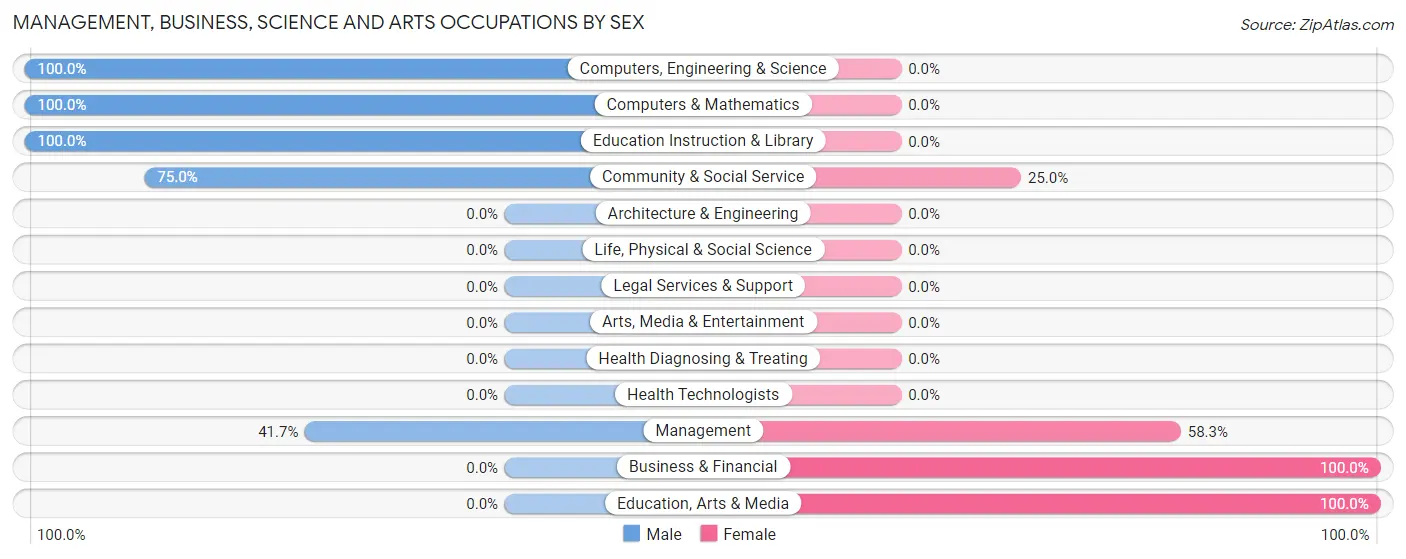
| Occupation | Male | Female |
| Management | 5 (41.7%) | 7 (58.3%) |
| Business & Financial | 0 (0.0%) | 3 (100.0%) |
| Computers, Engineering & Science | 5 (100.0%) | 0 (0.0%) |
| Computers & Mathematics | 5 (100.0%) | 0 (0.0%) |
| Architecture & Engineering | 0 (0.0%) | 0 (0.0%) |
| Life, Physical & Social Science | 0 (0.0%) | 0 (0.0%) |
| Community & Social Service | 6 (75.0%) | 2 (25.0%) |
| Education, Arts & Media | 0 (0.0%) | 2 (100.0%) |
| Legal Services & Support | 0 (0.0%) | 0 (0.0%) |
| Education Instruction & Library | 6 (100.0%) | 0 (0.0%) |
| Arts, Media & Entertainment | 0 (0.0%) | 0 (0.0%) |
| Health Diagnosing & Treating | 0 (0.0%) | 0 (0.0%) |
| Health Technologists | 0 (0.0%) | 0 (0.0%) |
| Total (Category) | 16 (57.1%) | 12 (42.9%) |
| Total (Overall) | 39 (39.0%) | 61 (61.0%) |
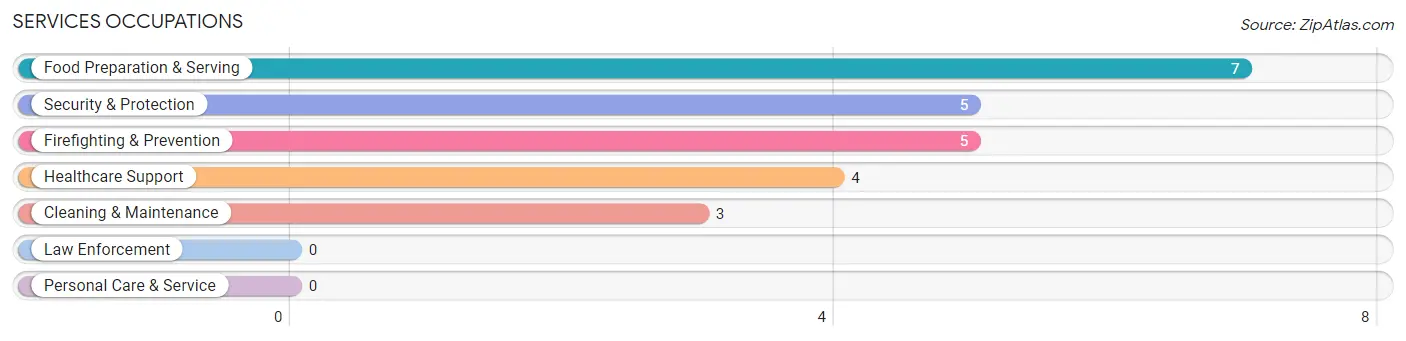
Services Occupations
The most common Services occupations in Crystal are Food Preparation & Serving (7 | 7.0%), Security & Protection (5 | 5.0%), Firefighting & Prevention (5 | 5.0%), Healthcare Support (4 | 4.0%), and Cleaning & Maintenance (3 | 3.0%).
Services Occupations by Sex
Within the Services occupations in Crystal, the most male-oriented occupations are Security & Protection (100.0%), Firefighting & Prevention (100.0%), and Cleaning & Maintenance (100.0%), while the most female-oriented occupations are Healthcare Support (100.0%), and Food Preparation & Serving (100.0%).
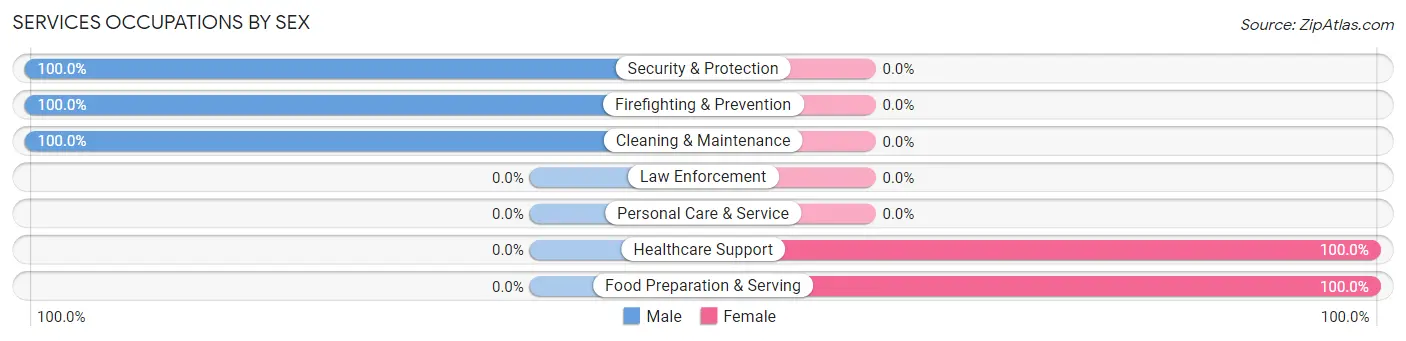
| Occupation | Male | Female |
| Healthcare Support | 0 (0.0%) | 4 (100.0%) |
| Security & Protection | 5 (100.0%) | 0 (0.0%) |
| Firefighting & Prevention | 5 (100.0%) | 0 (0.0%) |
| Law Enforcement | 0 (0.0%) | 0 (0.0%) |
| Food Preparation & Serving | 0 (0.0%) | 7 (100.0%) |
| Cleaning & Maintenance | 3 (100.0%) | 0 (0.0%) |
| Personal Care & Service | 0 (0.0%) | 0 (0.0%) |
| Total (Category) | 8 (42.1%) | 11 (57.9%) |
| Total (Overall) | 39 (39.0%) | 61 (61.0%) |
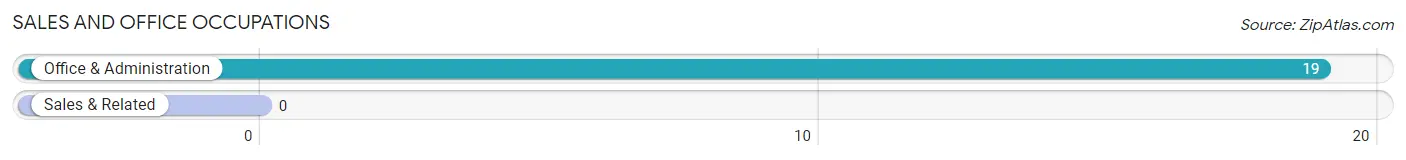
Sales and Office Occupations
The most common Sales and Office occupations in Crystal are , and Office & Administration (19 | 19.0%).
Sales and Office Occupations by Sex
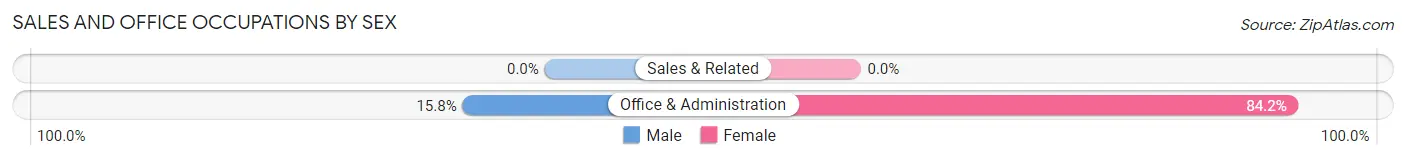
| Occupation | Male | Female |
| Sales & Related | 0 (0.0%) | 0 (0.0%) |
| Office & Administration | 3 (15.8%) | 16 (84.2%) |
| Total (Category) | 3 (15.8%) | 16 (84.2%) |
| Total (Overall) | 39 (39.0%) | 61 (61.0%) |
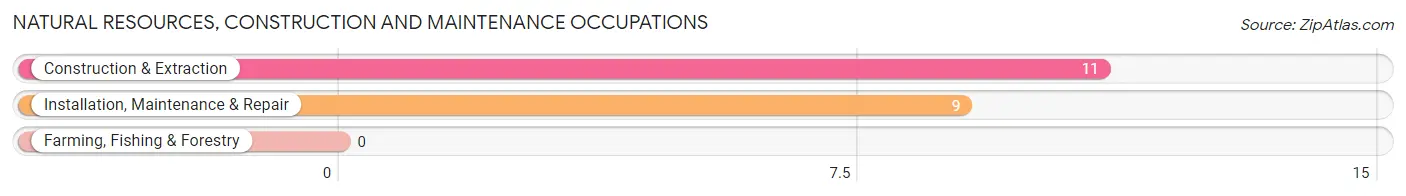
Natural Resources, Construction and Maintenance Occupations
The most common Natural Resources, Construction and Maintenance occupations in Crystal are Construction & Extraction (11 | 11.0%), and Installation, Maintenance & Repair (9 | 9.0%).
Natural Resources, Construction and Maintenance Occupations by Sex
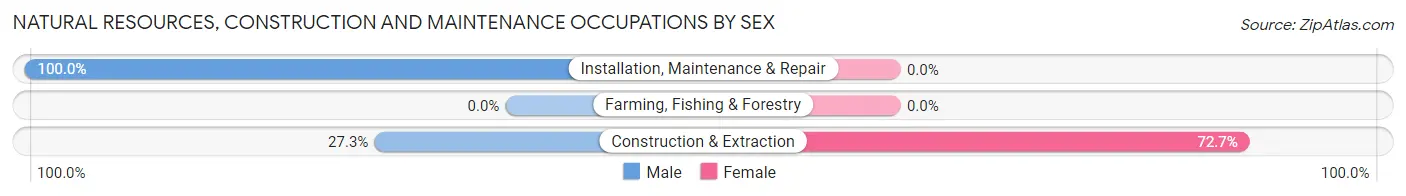
| Occupation | Male | Female |
| Farming, Fishing & Forestry | 0 (0.0%) | 0 (0.0%) |
| Construction & Extraction | 3 (27.3%) | 8 (72.7%) |
| Installation, Maintenance & Repair | 9 (100.0%) | 0 (0.0%) |
| Total (Category) | 12 (60.0%) | 8 (40.0%) |
| Total (Overall) | 39 (39.0%) | 61 (61.0%) |
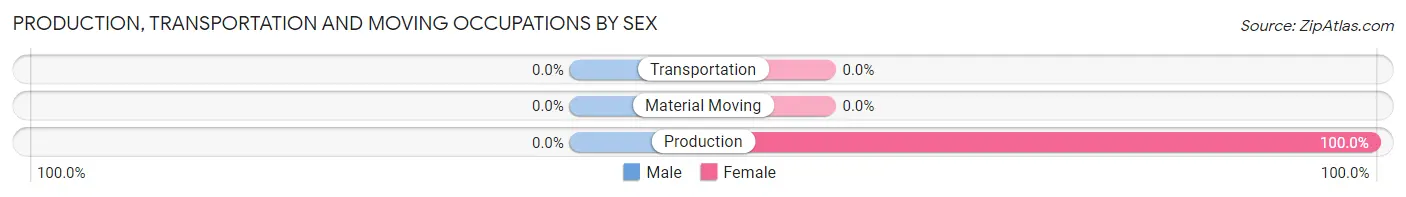
Production, Transportation and Moving Occupations
The most common Production, Transportation and Moving occupations in Crystal are , and Production (14 | 14.0%).
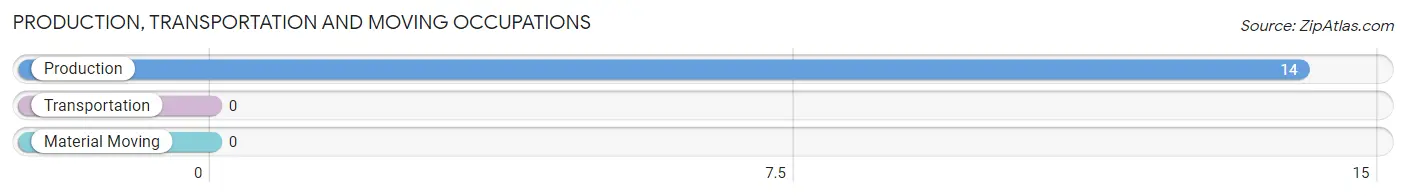
Production, Transportation and Moving Occupations by Sex
| Occupation | Male | Female |
| Production | 0 (0.0%) | 14 (100.0%) |
| Transportation | 0 (0.0%) | 0 (0.0%) |
| Material Moving | 0 (0.0%) | 0 (0.0%) |
| Total (Category) | 0 (0.0%) | 14 (100.0%) |
| Total (Overall) | 39 (39.0%) | 61 (61.0%) |
Employment Industries by Sex in Crystal
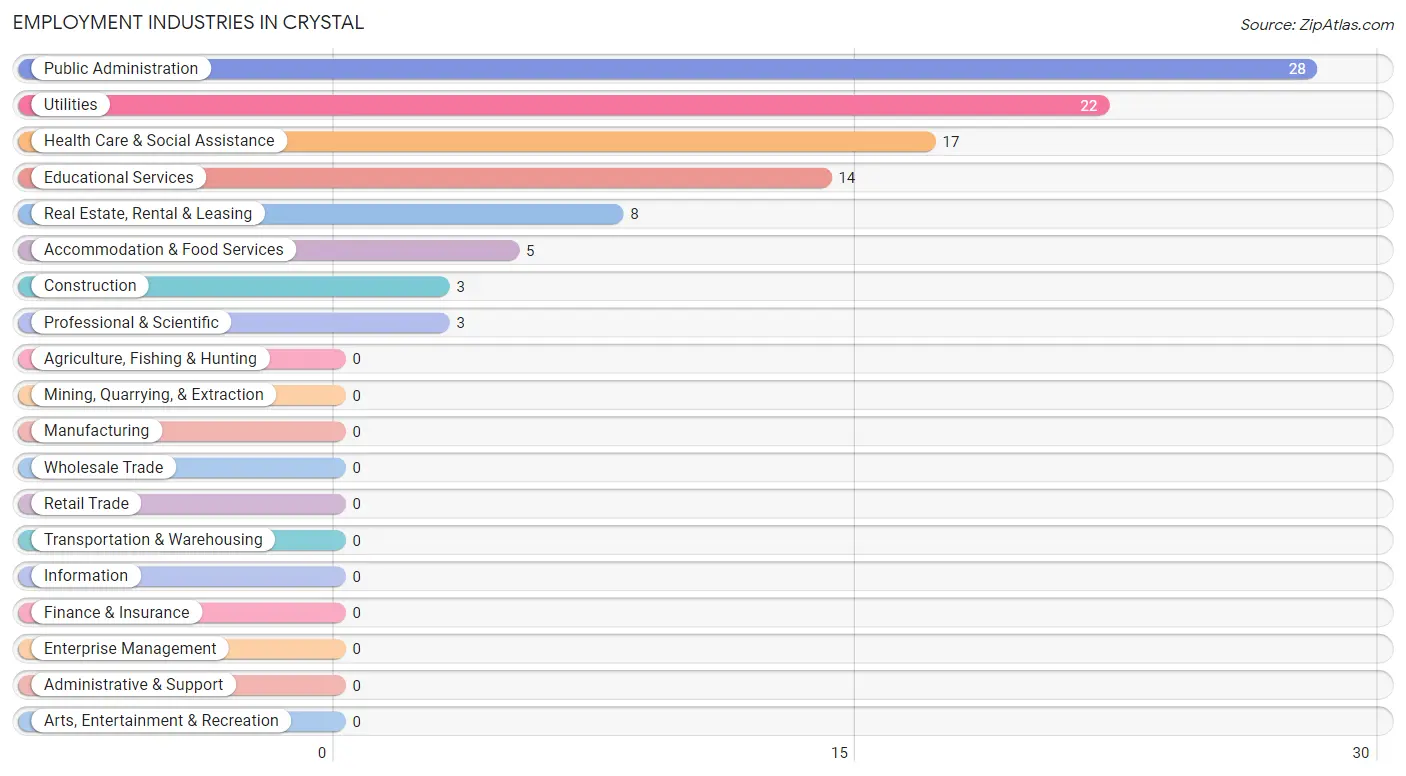
Employment Industries in Crystal
The major employment industries in Crystal include Public Administration (28 | 28.0%), Utilities (22 | 22.0%), Health Care & Social Assistance (17 | 17.0%), Educational Services (14 | 14.0%), and Real Estate, Rental & Leasing (8 | 8.0%).
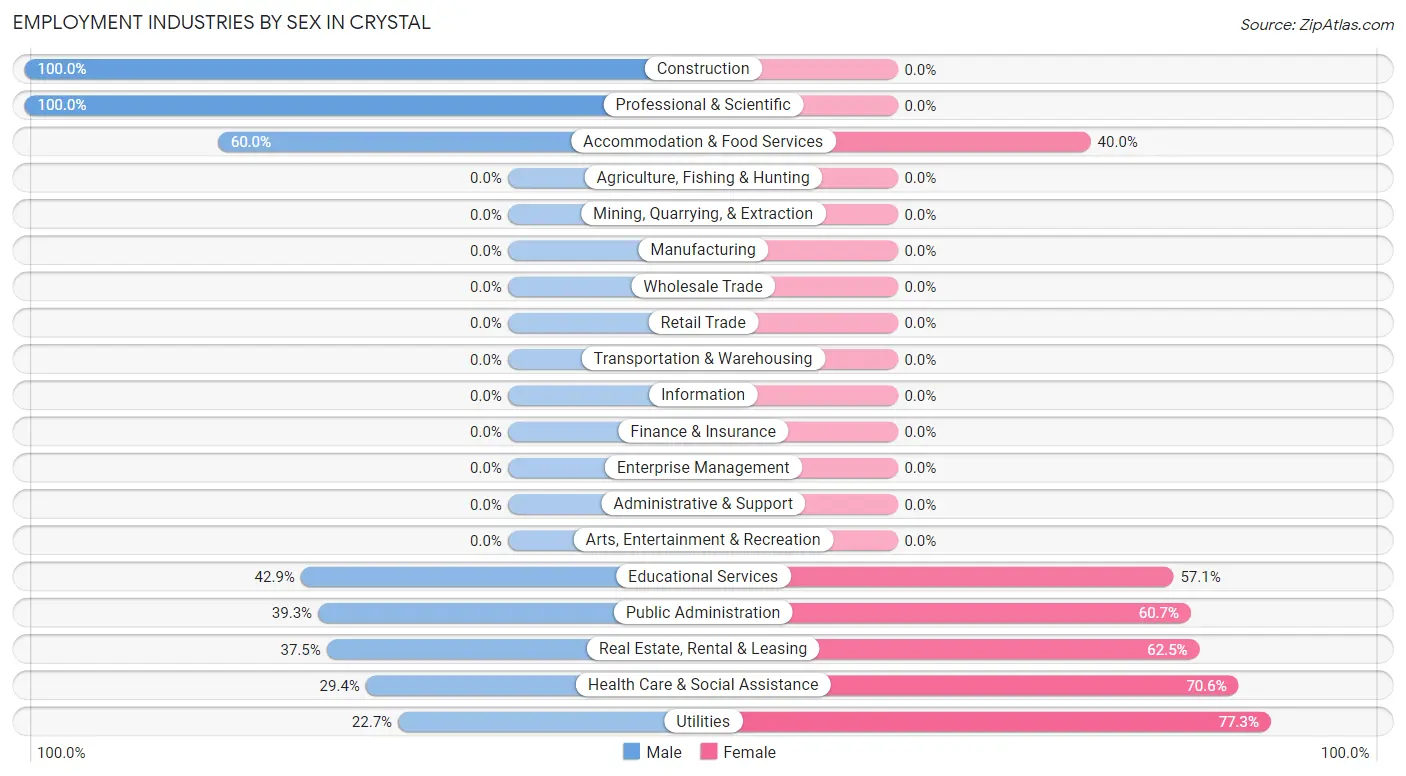
Employment Industries by Sex in Crystal
The Crystal industries that see more men than women are Construction (100.0%), Professional & Scientific (100.0%), and Accommodation & Food Services (60.0%), whereas the industries that tend to have a higher number of women are Utilities (77.3%), Health Care & Social Assistance (70.6%), and Real Estate, Rental & Leasing (62.5%).
| Industry | Male | Female |
| Agriculture, Fishing & Hunting | 0 (0.0%) | 0 (0.0%) |
| Mining, Quarrying, & Extraction | 0 (0.0%) | 0 (0.0%) |
| Construction | 3 (100.0%) | 0 (0.0%) |
| Manufacturing | 0 (0.0%) | 0 (0.0%) |
| Wholesale Trade | 0 (0.0%) | 0 (0.0%) |
| Retail Trade | 0 (0.0%) | 0 (0.0%) |
| Transportation & Warehousing | 0 (0.0%) | 0 (0.0%) |
| Utilities | 5 (22.7%) | 17 (77.3%) |
| Information | 0 (0.0%) | 0 (0.0%) |
| Finance & Insurance | 0 (0.0%) | 0 (0.0%) |
| Real Estate, Rental & Leasing | 3 (37.5%) | 5 (62.5%) |
| Professional & Scientific | 3 (100.0%) | 0 (0.0%) |
| Enterprise Management | 0 (0.0%) | 0 (0.0%) |
| Administrative & Support | 0 (0.0%) | 0 (0.0%) |
| Educational Services | 6 (42.9%) | 8 (57.1%) |
| Health Care & Social Assistance | 5 (29.4%) | 12 (70.6%) |
| Arts, Entertainment & Recreation | 0 (0.0%) | 0 (0.0%) |
| Accommodation & Food Services | 3 (60.0%) | 2 (40.0%) |
| Public Administration | 11 (39.3%) | 17 (60.7%) |
| Total | 39 (39.0%) | 61 (61.0%) |
Education in Crystal
School Enrollment in Crystal
The most common levels of schooling among the 51 students in Crystal are high school (27 | 52.9%), college / undergraduate (20 | 39.2%), and elementary school (4 | 7.8%).
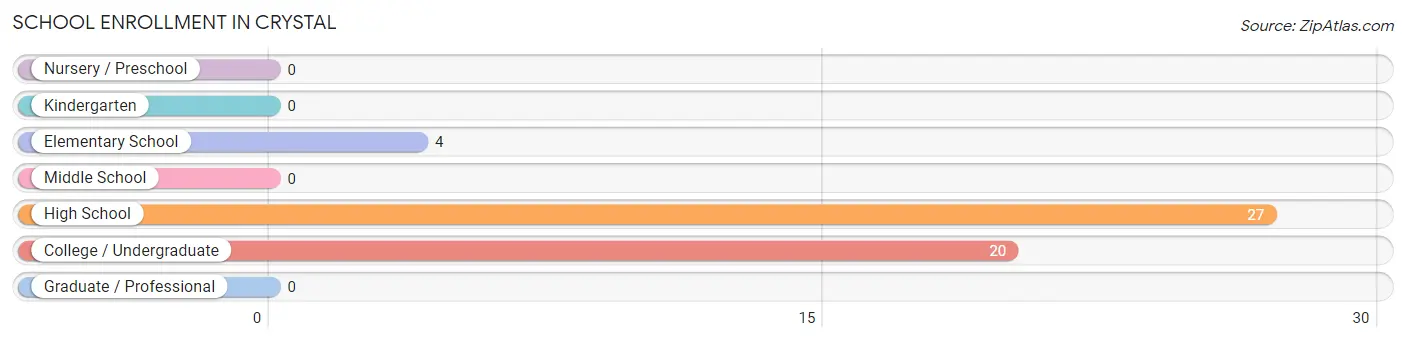
| School Level | # Students | % Students |
| Nursery / Preschool | 0 | 0.0% |
| Kindergarten | 0 | 0.0% |
| Elementary School | 4 | 7.8% |
| Middle School | 0 | 0.0% |
| High School | 27 | 52.9% |
| College / Undergraduate | 20 | 39.2% |
| Graduate / Professional | 0 | 0.0% |
| Total | 51 | 100.0% |
School Enrollment by Age by Funding Source in Crystal
Out of a total of 51 students who are enrolled in schools in Crystal, 5 (9.8%) attend a private institution, while the remaining 46 (90.2%) are enrolled in public schools. The age group of 15 to 17 year olds has the highest likelihood of being enrolled in private schools, with 5 (21.7% in the age bracket) enrolled. Conversely, the age group of 5 to 9 year old has the lowest likelihood of being enrolled in a private school, with 4 (100.0% in the age bracket) attending a public institution.
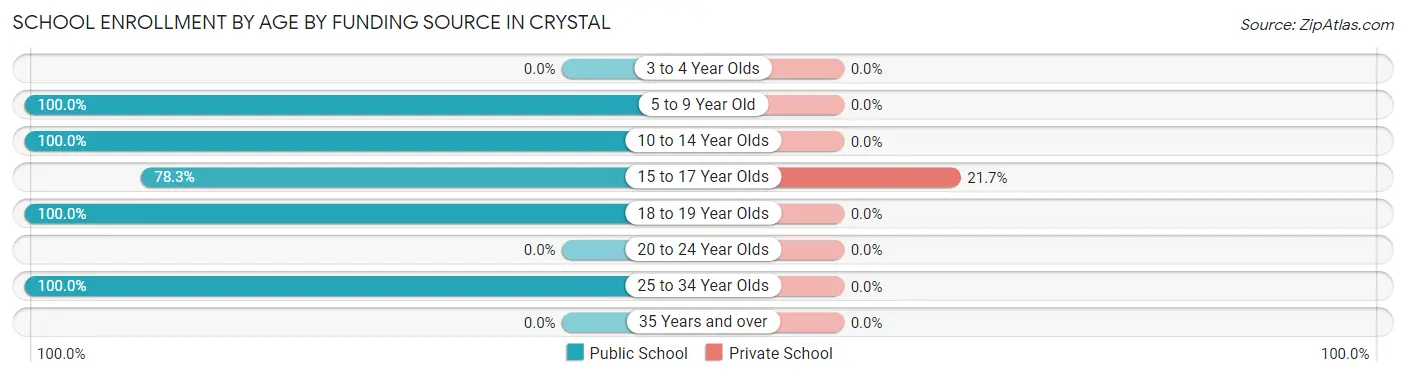
| Age Bracket | Public School | Private School |
| 3 to 4 Year Olds | 0 (0.0%) | 0 (0.0%) |
| 5 to 9 Year Old | 4 (100.0%) | 0 (0.0%) |
| 10 to 14 Year Olds | 4 (100.0%) | 0 (0.0%) |
| 15 to 17 Year Olds | 18 (78.3%) | 5 (21.7%) |
| 18 to 19 Year Olds | 3 (100.0%) | 0 (0.0%) |
| 20 to 24 Year Olds | 0 (0.0%) | 0 (0.0%) |
| 25 to 34 Year Olds | 17 (100.0%) | 0 (0.0%) |
| 35 Years and over | 0 (0.0%) | 0 (0.0%) |
| Total | 46 (90.2%) | 5 (9.8%) |
Educational Attainment by Field of Study in Crystal
Business (8 | 20.5%), visual & performing arts (8 | 20.5%), education (7 | 17.9%), science & technology (6 | 15.4%), and liberal arts & history (4 | 10.3%) are the most common fields of study among 39 individuals in Crystal who have obtained a bachelor's degree or higher.
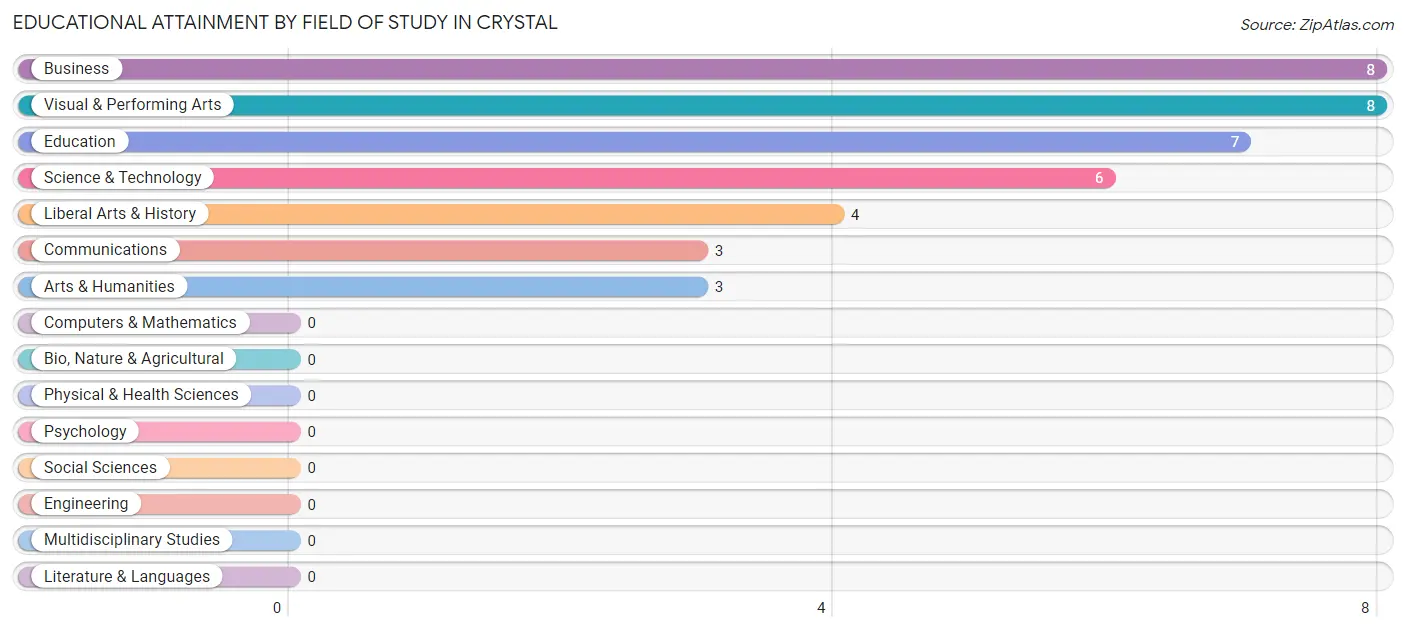
| Field of Study | # Graduates | % Graduates |
| Computers & Mathematics | 0 | 0.0% |
| Bio, Nature & Agricultural | 0 | 0.0% |
| Physical & Health Sciences | 0 | 0.0% |
| Psychology | 0 | 0.0% |
| Social Sciences | 0 | 0.0% |
| Engineering | 0 | 0.0% |
| Multidisciplinary Studies | 0 | 0.0% |
| Science & Technology | 6 | 15.4% |
| Business | 8 | 20.5% |
| Education | 7 | 17.9% |
| Literature & Languages | 0 | 0.0% |
| Liberal Arts & History | 4 | 10.3% |
| Visual & Performing Arts | 8 | 20.5% |
| Communications | 3 | 7.7% |
| Arts & Humanities | 3 | 7.7% |
| Total | 39 | 100.0% |
Transportation & Commute in Crystal
Vehicle Availability by Sex in Crystal
The most prevalent vehicle ownership categories in Crystal are males with 4 vehicles (18, accounting for 46.2%) and females with 4 vehicles (20, making up 29.5%).
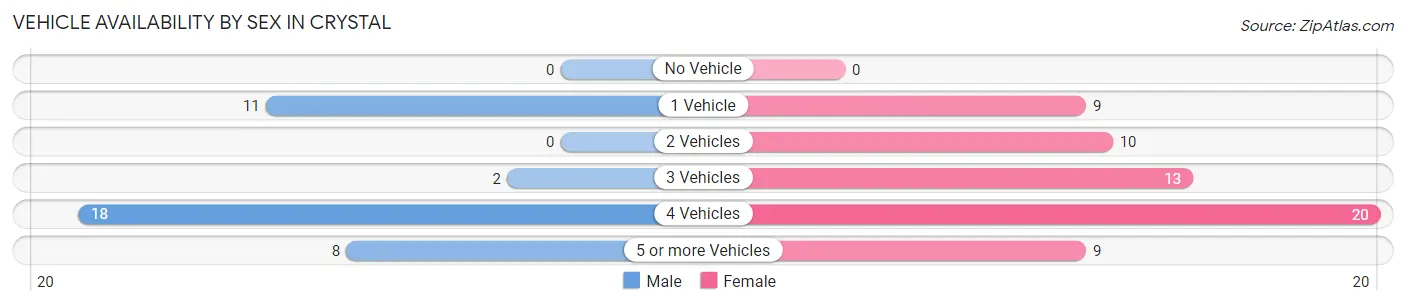
| Vehicles Available | Male | Female |
| No Vehicle | 0 (0.0%) | 0 (0.0%) |
| 1 Vehicle | 11 (28.2%) | 9 (14.7%) |
| 2 Vehicles | 0 (0.0%) | 10 (16.4%) |
| 3 Vehicles | 2 (5.1%) | 13 (21.3%) |
| 4 Vehicles | 18 (46.2%) | 20 (32.8%) |
| 5 or more Vehicles | 8 (20.5%) | 9 (14.7%) |
| Total | 39 (100.0%) | 61 (100.0%) |
Commute Time in Crystal
The most frequently occuring commute durations in Crystal are 15 to 19 minutes (28 commuters, 28.9%), 30 to 34 minutes (12 commuters, 12.4%), and 90 or more minutes (11 commuters, 11.3%).
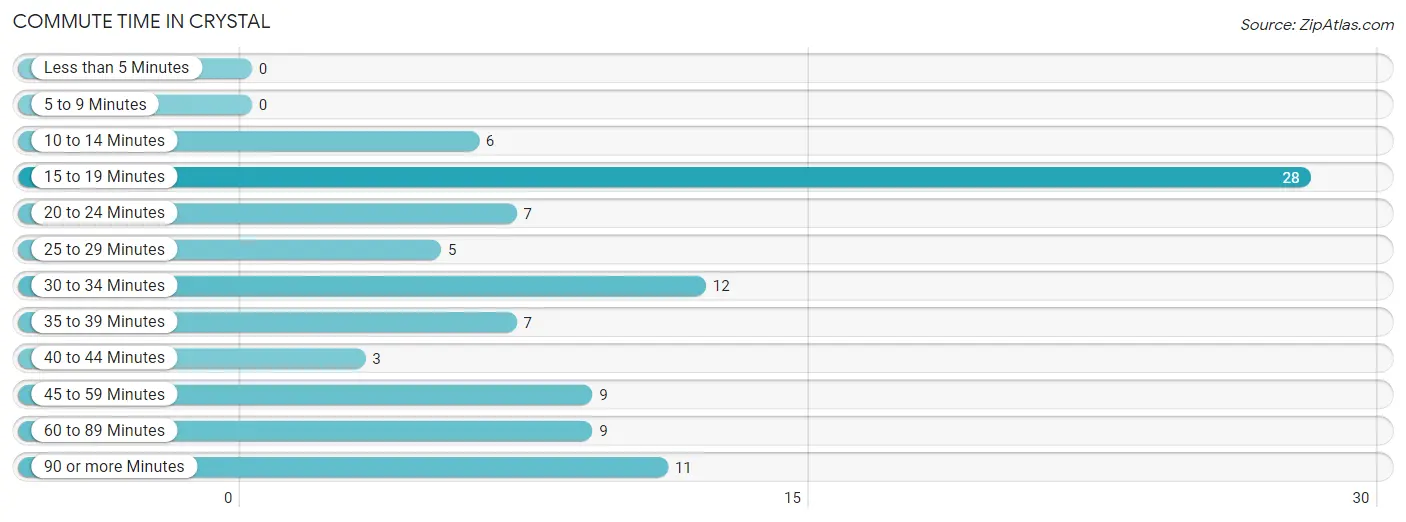
| Commute Time | # Commuters | % Commuters |
| Less than 5 Minutes | 0 | 0.0% |
| 5 to 9 Minutes | 0 | 0.0% |
| 10 to 14 Minutes | 6 | 6.2% |
| 15 to 19 Minutes | 28 | 28.9% |
| 20 to 24 Minutes | 7 | 7.2% |
| 25 to 29 Minutes | 5 | 5.1% |
| 30 to 34 Minutes | 12 | 12.4% |
| 35 to 39 Minutes | 7 | 7.2% |
| 40 to 44 Minutes | 3 | 3.1% |
| 45 to 59 Minutes | 9 | 9.3% |
| 60 to 89 Minutes | 9 | 9.3% |
| 90 or more Minutes | 11 | 11.3% |
Commute Time by Sex in Crystal
The most common commute times in Crystal are 45 to 59 minutes (9 commuters, 25.0%) for males and 15 to 19 minutes (28 commuters, 45.9%) for females.
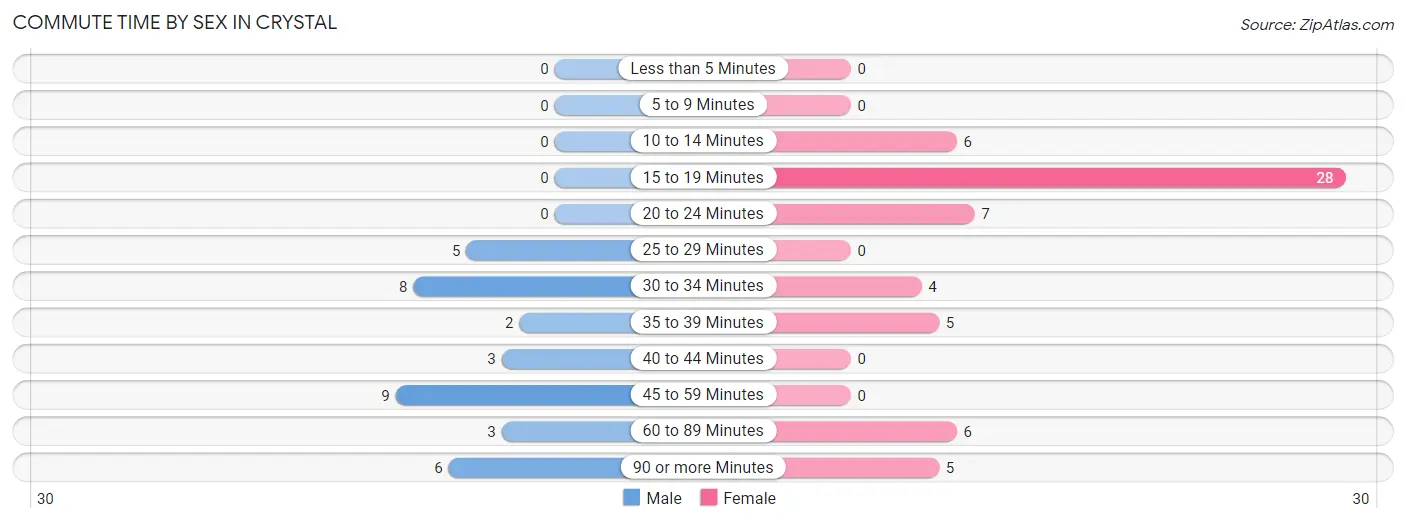
| Commute Time | Male | Female |
| Less than 5 Minutes | 0 (0.0%) | 0 (0.0%) |
| 5 to 9 Minutes | 0 (0.0%) | 0 (0.0%) |
| 10 to 14 Minutes | 0 (0.0%) | 6 (9.8%) |
| 15 to 19 Minutes | 0 (0.0%) | 28 (45.9%) |
| 20 to 24 Minutes | 0 (0.0%) | 7 (11.5%) |
| 25 to 29 Minutes | 5 (13.9%) | 0 (0.0%) |
| 30 to 34 Minutes | 8 (22.2%) | 4 (6.6%) |
| 35 to 39 Minutes | 2 (5.6%) | 5 (8.2%) |
| 40 to 44 Minutes | 3 (8.3%) | 0 (0.0%) |
| 45 to 59 Minutes | 9 (25.0%) | 0 (0.0%) |
| 60 to 89 Minutes | 3 (8.3%) | 6 (9.8%) |
| 90 or more Minutes | 6 (16.7%) | 5 (8.2%) |
Time of Departure to Work by Sex in Crystal
The most frequent times of departure to work in Crystal are 7:00 AM to 7:29 AM (17, 47.2%) for males and 7:30 AM to 7:59 AM (30, 49.2%) for females.
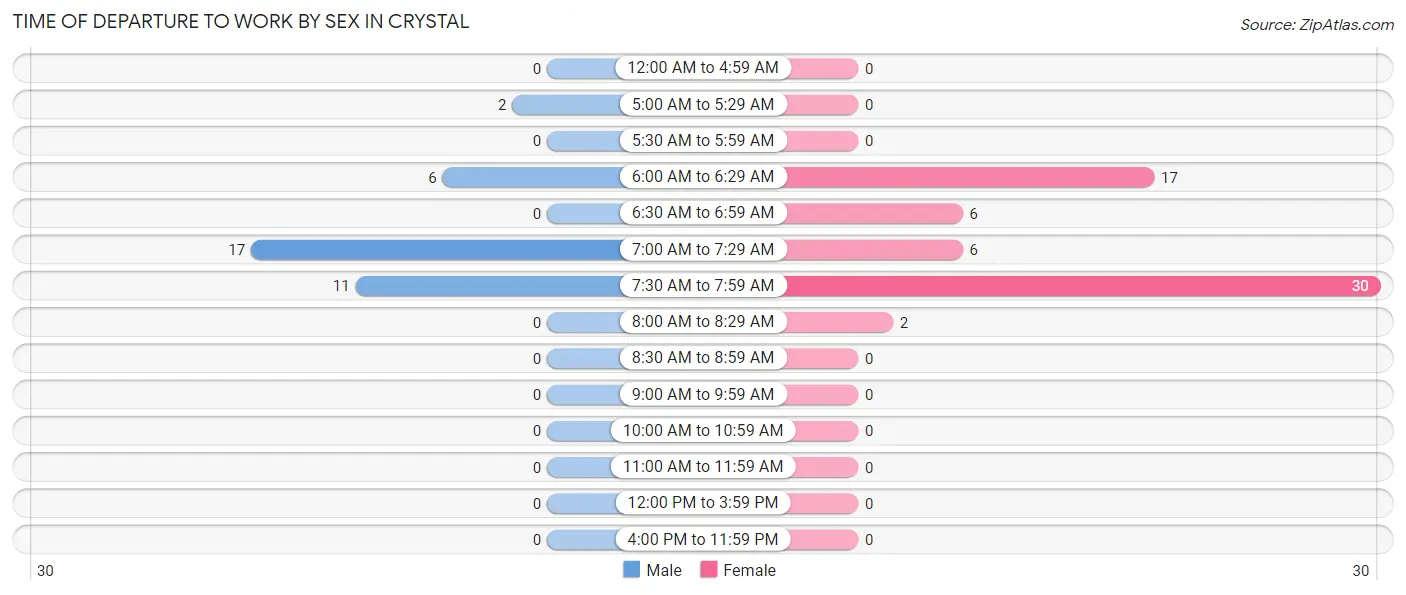
| Time of Departure | Male | Female |
| 12:00 AM to 4:59 AM | 0 (0.0%) | 0 (0.0%) |
| 5:00 AM to 5:29 AM | 2 (5.6%) | 0 (0.0%) |
| 5:30 AM to 5:59 AM | 0 (0.0%) | 0 (0.0%) |
| 6:00 AM to 6:29 AM | 6 (16.7%) | 17 (27.9%) |
| 6:30 AM to 6:59 AM | 0 (0.0%) | 6 (9.8%) |
| 7:00 AM to 7:29 AM | 17 (47.2%) | 6 (9.8%) |
| 7:30 AM to 7:59 AM | 11 (30.6%) | 30 (49.2%) |
| 8:00 AM to 8:29 AM | 0 (0.0%) | 2 (3.3%) |
| 8:30 AM to 8:59 AM | 0 (0.0%) | 0 (0.0%) |
| 9:00 AM to 9:59 AM | 0 (0.0%) | 0 (0.0%) |
| 10:00 AM to 10:59 AM | 0 (0.0%) | 0 (0.0%) |
| 11:00 AM to 11:59 AM | 0 (0.0%) | 0 (0.0%) |
| 12:00 PM to 3:59 PM | 0 (0.0%) | 0 (0.0%) |
| 4:00 PM to 11:59 PM | 0 (0.0%) | 0 (0.0%) |
| Total | 36 (100.0%) | 61 (100.0%) |
Housing Occupancy in Crystal
Occupancy by Ownership in Crystal
Of the total 73 dwellings in Crystal, owner-occupied units account for 67 (91.8%), while renter-occupied units make up 6 (8.2%).
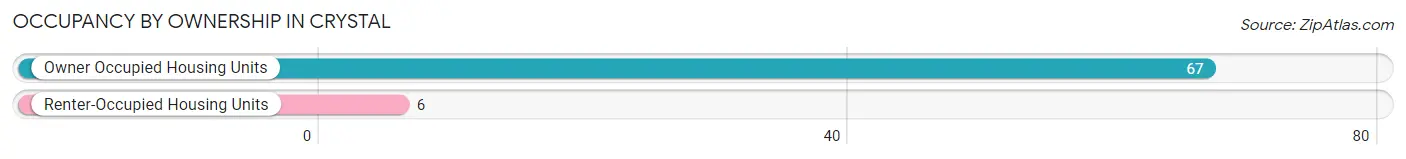
| Occupancy | # Housing Units | % Housing Units |
| Owner Occupied Housing Units | 67 | 91.8% |
| Renter-Occupied Housing Units | 6 | 8.2% |
| Total Occupied Housing Units | 73 | 100.0% |
Occupancy by Household Size in Crystal
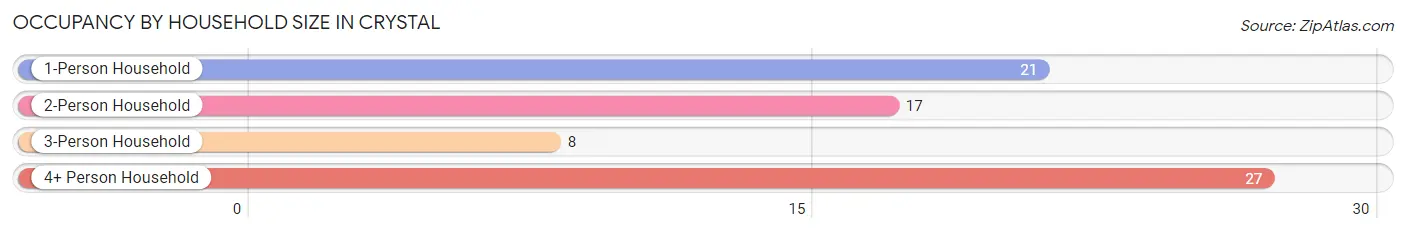
| Household Size | # Housing Units | % Housing Units |
| 1-Person Household | 21 | 28.8% |
| 2-Person Household | 17 | 23.3% |
| 3-Person Household | 8 | 11.0% |
| 4+ Person Household | 27 | 37.0% |
| Total Housing Units | 73 | 100.0% |
Occupancy by Ownership by Household Size in Crystal
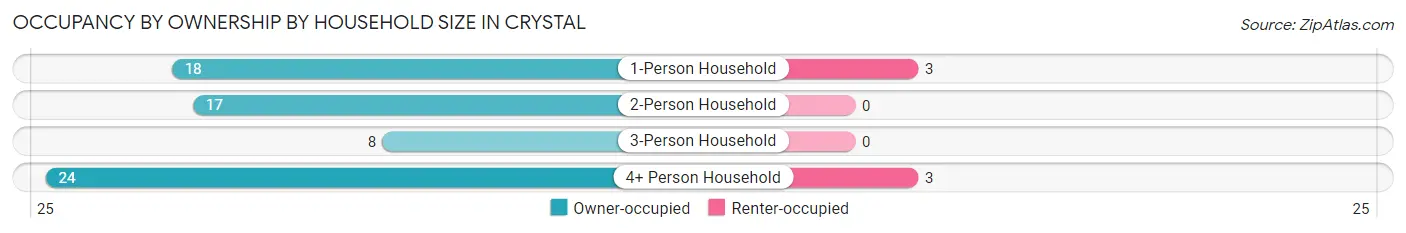
| Household Size | Owner-occupied | Renter-occupied |
| 1-Person Household | 18 (85.7%) | 3 (14.3%) |
| 2-Person Household | 17 (100.0%) | 0 (0.0%) |
| 3-Person Household | 8 (100.0%) | 0 (0.0%) |
| 4+ Person Household | 24 (88.9%) | 3 (11.1%) |
| Total Housing Units | 67 (91.8%) | 6 (8.2%) |
Occupancy by Educational Attainment in Crystal
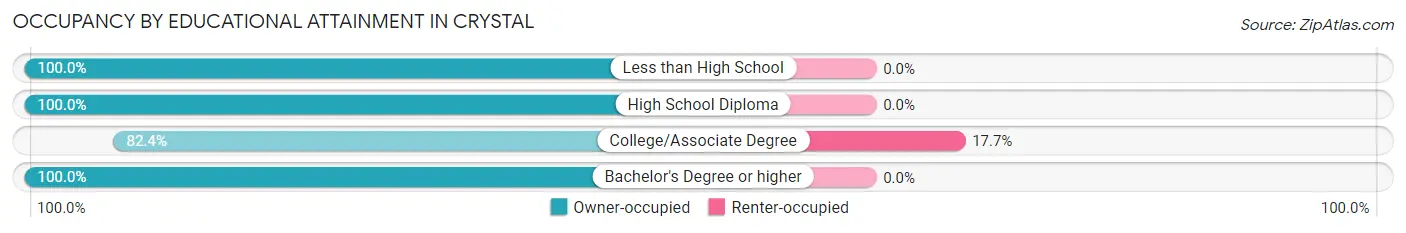
| Household Size | Owner-occupied | Renter-occupied |
| Less than High School | 11 (100.0%) | 0 (0.0%) |
| High School Diploma | 13 (100.0%) | 0 (0.0%) |
| College/Associate Degree | 28 (82.4%) | 6 (17.6%) |
| Bachelor's Degree or higher | 15 (100.0%) | 0 (0.0%) |
Occupancy by Age of Householder in Crystal
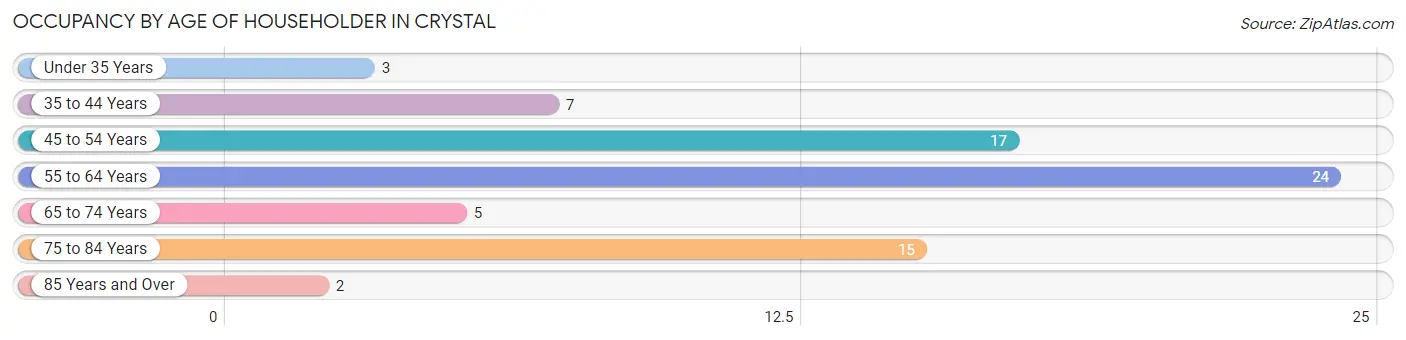
| Age Bracket | # Households | % Households |
| Under 35 Years | 3 | 4.1% |
| 35 to 44 Years | 7 | 9.6% |
| 45 to 54 Years | 17 | 23.3% |
| 55 to 64 Years | 24 | 32.9% |
| 65 to 74 Years | 5 | 6.9% |
| 75 to 84 Years | 15 | 20.5% |
| 85 Years and Over | 2 | 2.7% |
| Total | 73 | 100.0% |
Housing Finances in Crystal
Median Income by Occupancy in Crystal
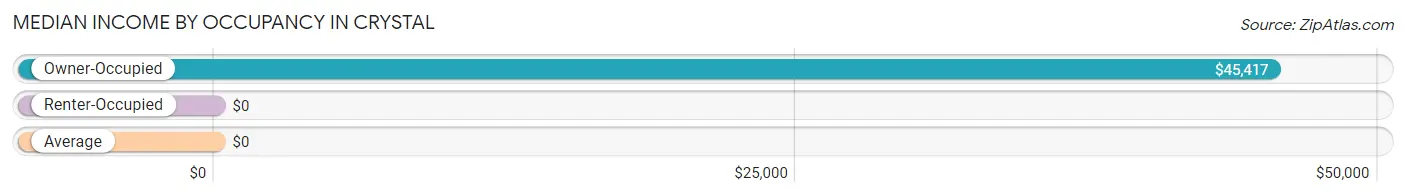
| Occupancy Type | # Households | Median Income |
| Owner-Occupied | 67 (91.8%) | $45,417 |
| Renter-Occupied | 6 (8.2%) | $0 |
| Average | 73 (100.0%) | $0 |
Occupancy by Householder Income Bracket in Crystal
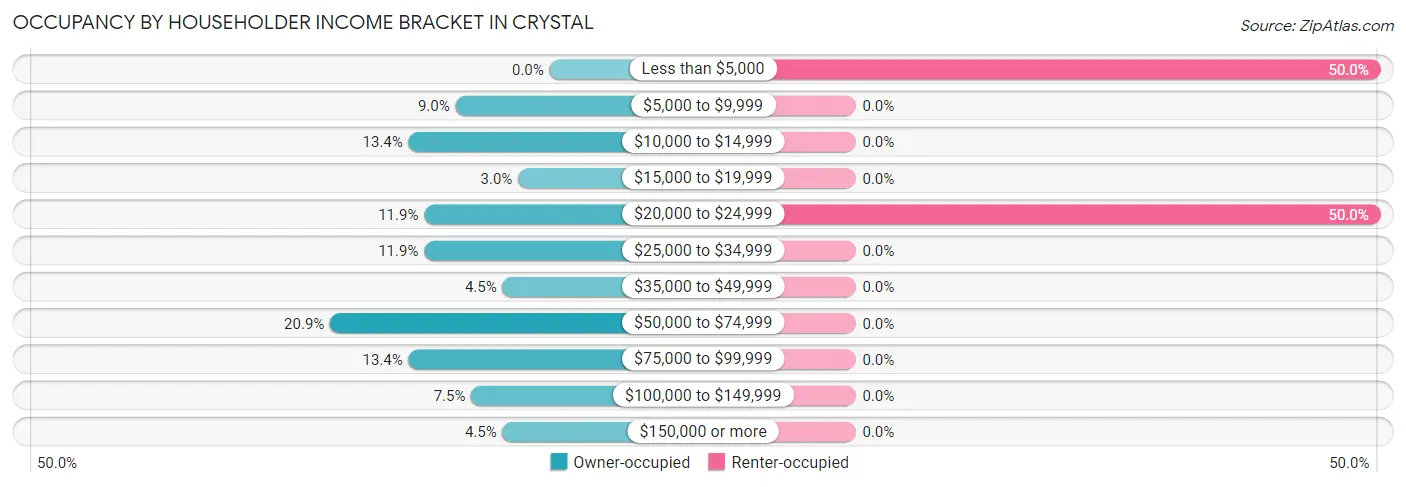
| Income Bracket | Owner-occupied | Renter-occupied |
| Less than $5,000 | 0 (0.0%) | 3 (50.0%) |
| $5,000 to $9,999 | 6 (9.0%) | 0 (0.0%) |
| $10,000 to $14,999 | 9 (13.4%) | 0 (0.0%) |
| $15,000 to $19,999 | 2 (3.0%) | 0 (0.0%) |
| $20,000 to $24,999 | 8 (11.9%) | 3 (50.0%) |
| $25,000 to $34,999 | 8 (11.9%) | 0 (0.0%) |
| $35,000 to $49,999 | 3 (4.5%) | 0 (0.0%) |
| $50,000 to $74,999 | 14 (20.9%) | 0 (0.0%) |
| $75,000 to $99,999 | 9 (13.4%) | 0 (0.0%) |
| $100,000 to $149,999 | 5 (7.5%) | 0 (0.0%) |
| $150,000 or more | 3 (4.5%) | 0 (0.0%) |
| Total | 67 (100.0%) | 6 (100.0%) |
Monthly Housing Cost Tiers in Crystal
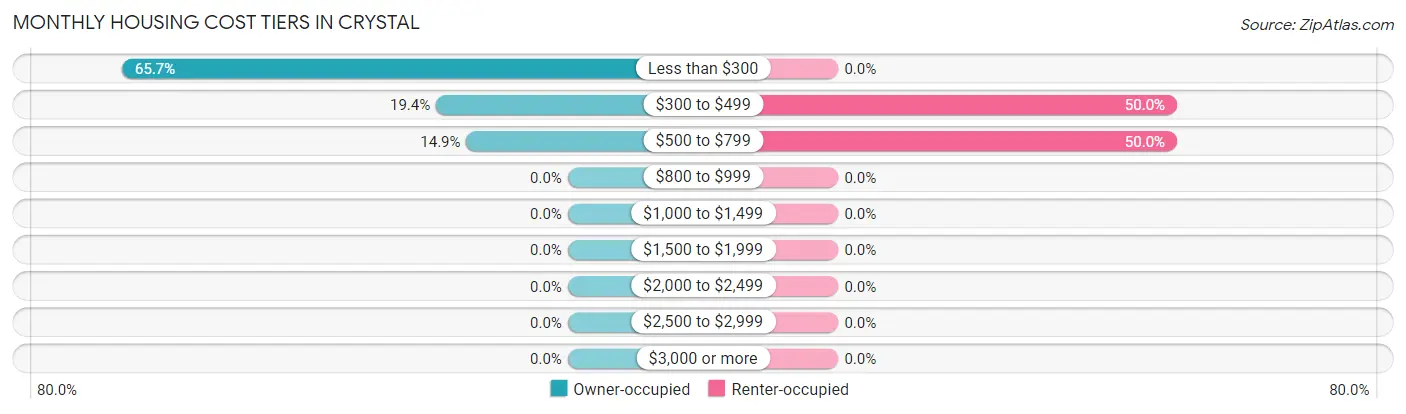
| Monthly Cost | Owner-occupied | Renter-occupied |
| Less than $300 | 44 (65.7%) | 0 (0.0%) |
| $300 to $499 | 13 (19.4%) | 3 (50.0%) |
| $500 to $799 | 10 (14.9%) | 3 (50.0%) |
| $800 to $999 | 0 (0.0%) | 0 (0.0%) |
| $1,000 to $1,499 | 0 (0.0%) | 0 (0.0%) |
| $1,500 to $1,999 | 0 (0.0%) | 0 (0.0%) |
| $2,000 to $2,499 | 0 (0.0%) | 0 (0.0%) |
| $2,500 to $2,999 | 0 (0.0%) | 0 (0.0%) |
| $3,000 or more | 0 (0.0%) | 0 (0.0%) |
| Total | 67 (100.0%) | 6 (100.0%) |
Physical Housing Characteristics in Crystal
Housing Structures in Crystal
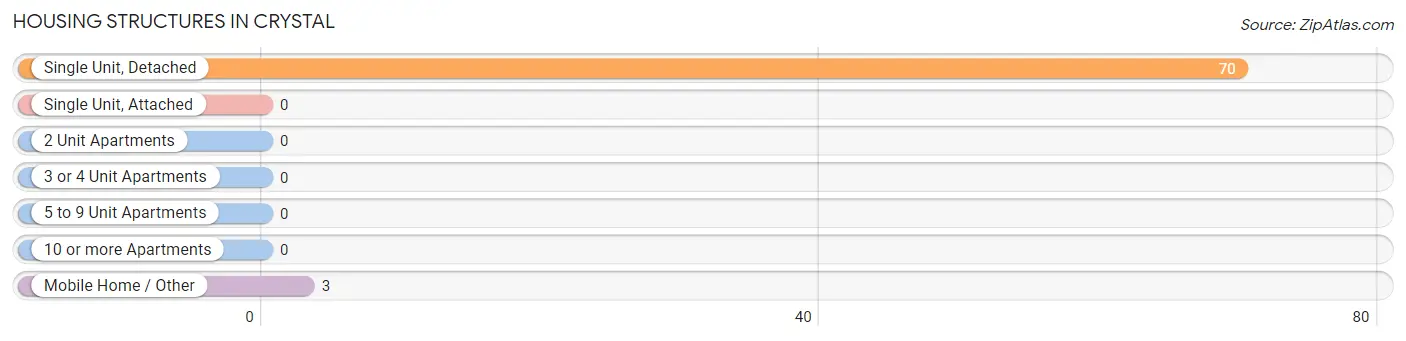
| Structure Type | # Housing Units | % Housing Units |
| Single Unit, Detached | 70 | 95.9% |
| Single Unit, Attached | 0 | 0.0% |
| 2 Unit Apartments | 0 | 0.0% |
| 3 or 4 Unit Apartments | 0 | 0.0% |
| 5 to 9 Unit Apartments | 0 | 0.0% |
| 10 or more Apartments | 0 | 0.0% |
| Mobile Home / Other | 3 | 4.1% |
| Total | 73 | 100.0% |
Housing Structures by Occupancy in Crystal
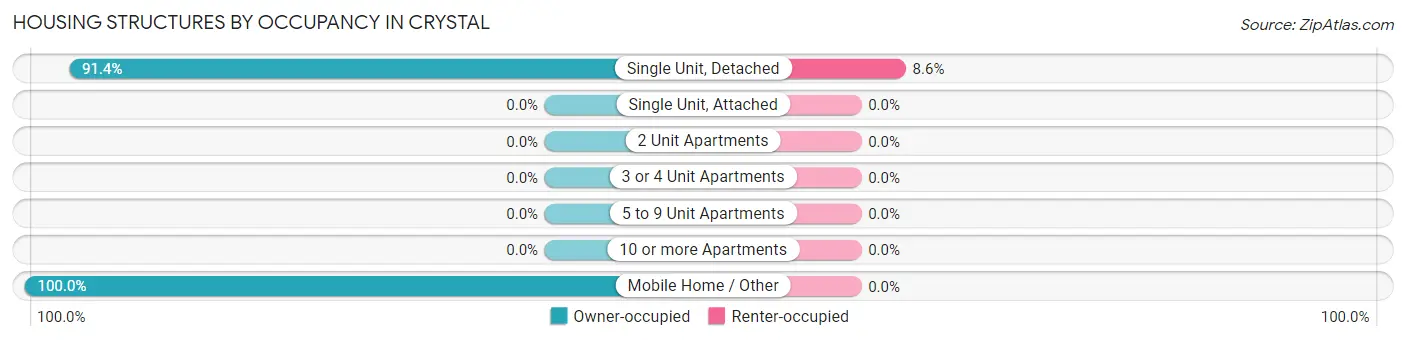
| Structure Type | Owner-occupied | Renter-occupied |
| Single Unit, Detached | 64 (91.4%) | 6 (8.6%) |
| Single Unit, Attached | 0 (0.0%) | 0 (0.0%) |
| 2 Unit Apartments | 0 (0.0%) | 0 (0.0%) |
| 3 or 4 Unit Apartments | 0 (0.0%) | 0 (0.0%) |
| 5 to 9 Unit Apartments | 0 (0.0%) | 0 (0.0%) |
| 10 or more Apartments | 0 (0.0%) | 0 (0.0%) |
| Mobile Home / Other | 3 (100.0%) | 0 (0.0%) |
| Total | 67 (91.8%) | 6 (8.2%) |
Housing Structures by Number of Rooms in Crystal
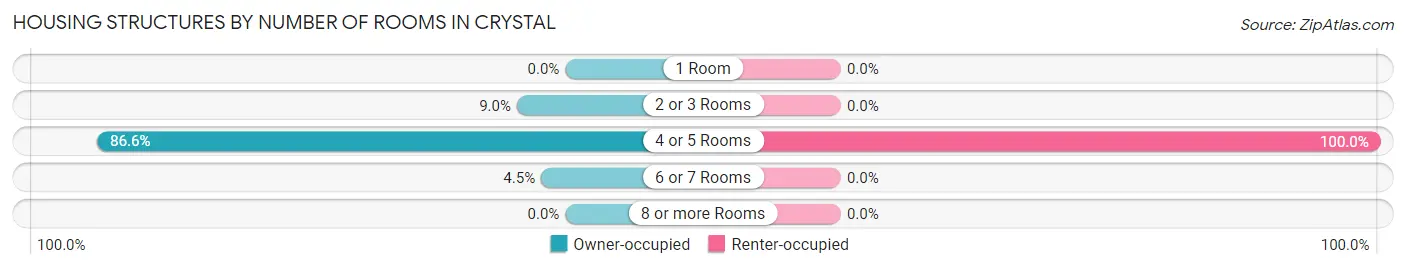
| Number of Rooms | Owner-occupied | Renter-occupied |
| 1 Room | 0 (0.0%) | 0 (0.0%) |
| 2 or 3 Rooms | 6 (9.0%) | 0 (0.0%) |
| 4 or 5 Rooms | 58 (86.6%) | 6 (100.0%) |
| 6 or 7 Rooms | 3 (4.5%) | 0 (0.0%) |
| 8 or more Rooms | 0 (0.0%) | 0 (0.0%) |
| Total | 67 (100.0%) | 6 (100.0%) |
Housing Structure by Heating Type in Crystal
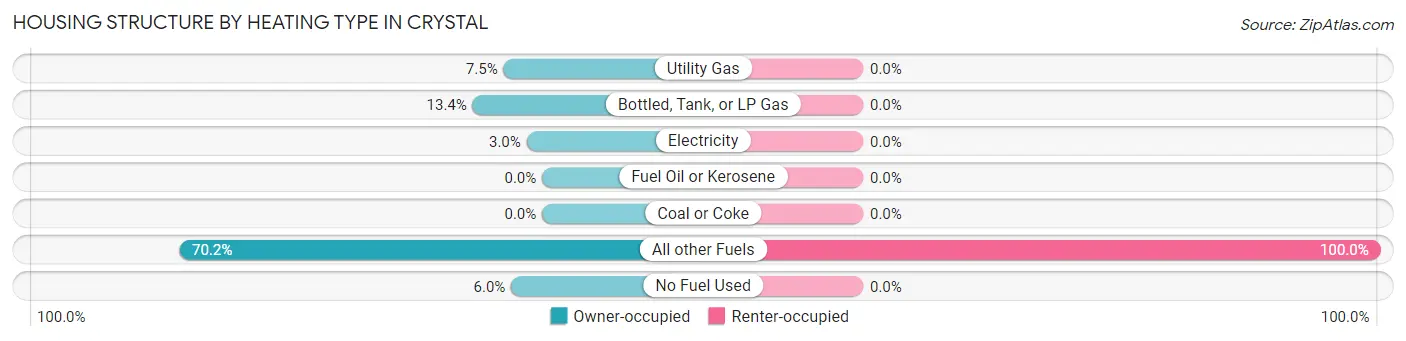
| Heating Type | Owner-occupied | Renter-occupied |
| Utility Gas | 5 (7.5%) | 0 (0.0%) |
| Bottled, Tank, or LP Gas | 9 (13.4%) | 0 (0.0%) |
| Electricity | 2 (3.0%) | 0 (0.0%) |
| Fuel Oil or Kerosene | 0 (0.0%) | 0 (0.0%) |
| Coal or Coke | 0 (0.0%) | 0 (0.0%) |
| All other Fuels | 47 (70.2%) | 6 (100.0%) |
| No Fuel Used | 4 (6.0%) | 0 (0.0%) |
| Total | 67 (100.0%) | 6 (100.0%) |
Household Vehicle Usage in Crystal
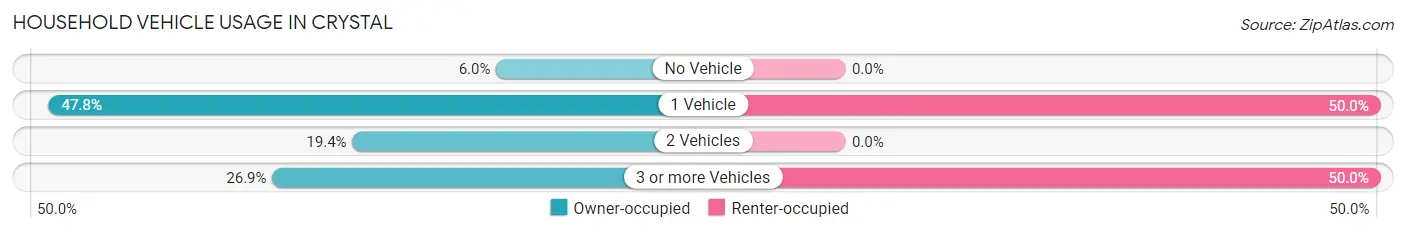
| Vehicles per Household | Owner-occupied | Renter-occupied |
| No Vehicle | 4 (6.0%) | 0 (0.0%) |
| 1 Vehicle | 32 (47.8%) | 3 (50.0%) |
| 2 Vehicles | 13 (19.4%) | 0 (0.0%) |
| 3 or more Vehicles | 18 (26.9%) | 3 (50.0%) |
| Total | 67 (100.0%) | 6 (100.0%) |
Real Estate & Mortgages in Crystal
Real Estate and Mortgage Overview in Crystal
| Characteristic | Without Mortgage | With Mortgage |
| Housing Units | 67 | 0 |
| Median Property Value | $62,100 | $0 |
| Median Household Income | $45,417 | $0 |
| Monthly Housing Costs | $238 | $0 |
| Real Estate Taxes | - | - |
Property Value by Mortgage Status in Crystal
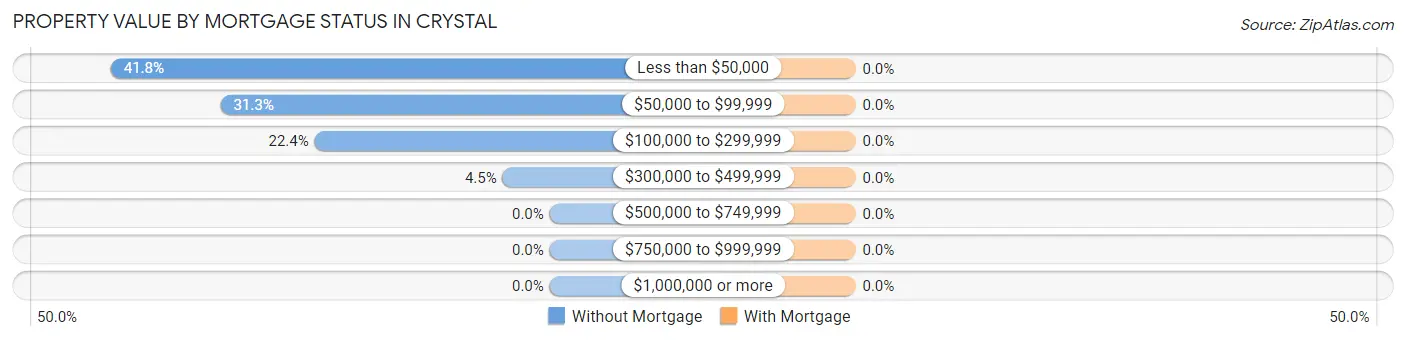
| Property Value | Without Mortgage | With Mortgage |
| Less than $50,000 | 28 (41.8%) | 0 (0.0%) |
| $50,000 to $99,999 | 21 (31.3%) | 0 (0.0%) |
| $100,000 to $299,999 | 15 (22.4%) | 0 (0.0%) |
| $300,000 to $499,999 | 3 (4.5%) | 0 (0.0%) |
| $500,000 to $749,999 | 0 (0.0%) | 0 (0.0%) |
| $750,000 to $999,999 | 0 (0.0%) | 0 (0.0%) |
| $1,000,000 or more | 0 (0.0%) | 0 (0.0%) |
| Total | 67 (100.0%) | 0 (0.0%) |
Household Income by Mortgage Status in Crystal
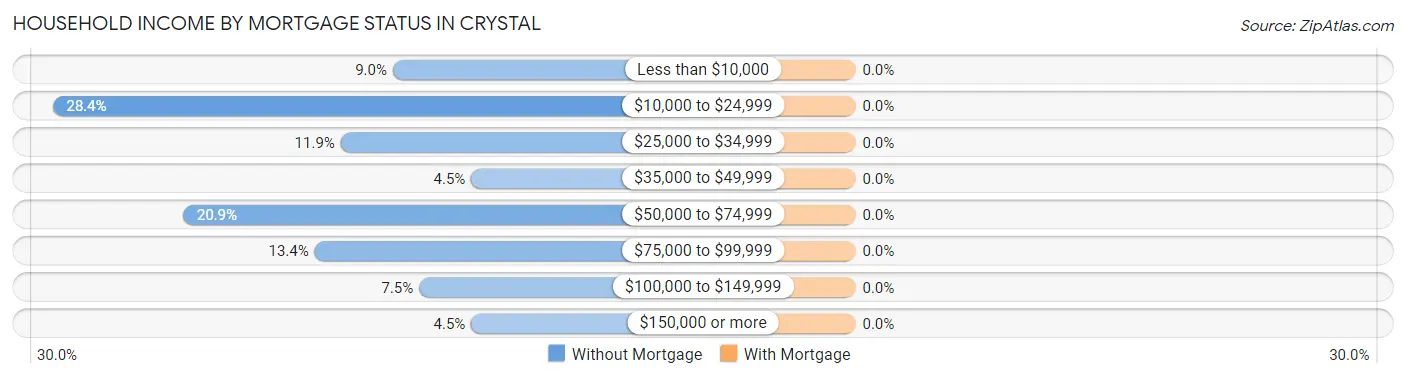
| Household Income | Without Mortgage | With Mortgage |
| Less than $10,000 | 6 (9.0%) | 0 (0.0%) |
| $10,000 to $24,999 | 19 (28.4%) | 0 (0.0%) |
| $25,000 to $34,999 | 8 (11.9%) | 0 (0.0%) |
| $35,000 to $49,999 | 3 (4.5%) | 0 (0.0%) |
| $50,000 to $74,999 | 14 (20.9%) | 0 (0.0%) |
| $75,000 to $99,999 | 9 (13.4%) | 0 (0.0%) |
| $100,000 to $149,999 | 5 (7.5%) | 0 (0.0%) |
| $150,000 or more | 3 (4.5%) | 0 (0.0%) |
| Total | 67 (100.0%) | 0 (0.0%) |
Property Value to Household Income Ratio in Crystal
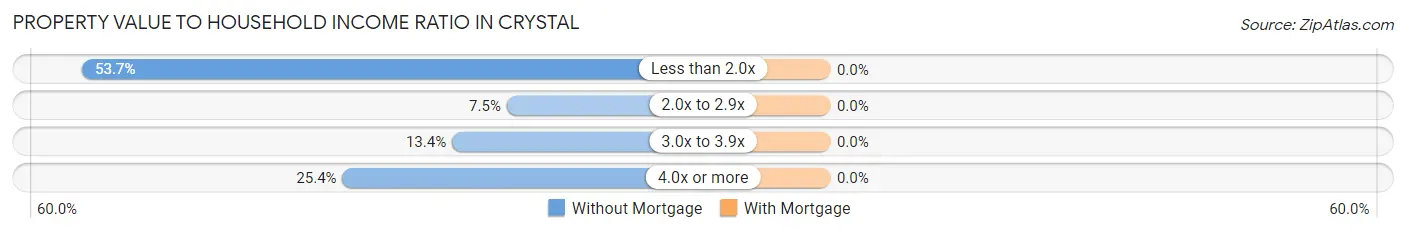
| Value-to-Income Ratio | Without Mortgage | With Mortgage |
| Less than 2.0x | 36 (53.7%) | 0 (0.0%) |
| 2.0x to 2.9x | 5 (7.5%) | 0 (0.0%) |
| 3.0x to 3.9x | 9 (13.4%) | 0 (0.0%) |
| 4.0x or more | 17 (25.4%) | 0 (0.0%) |
| Total | 67 (100.0%) | 0 (0.0%) |
Real Estate Taxes by Mortgage Status in Crystal
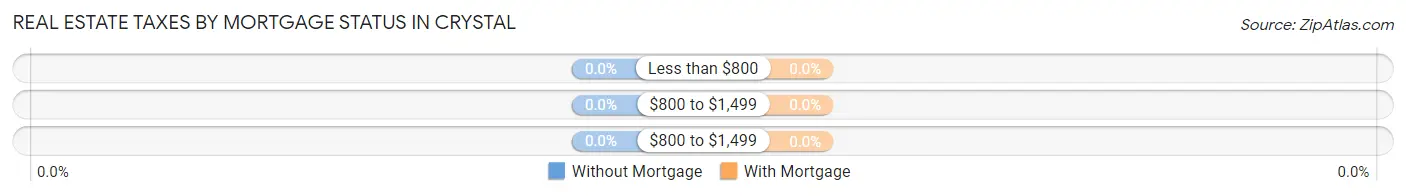
| Property Taxes | Without Mortgage | With Mortgage |
| Less than $800 | 0 (0.0%) | 0 (0.0%) |
| $800 to $1,499 | 0 (0.0%) | 0 (0.0%) |
| $800 to $1,499 | 0 (0.0%) | 0 (0.0%) |
| Total | 67 (100.0%) | 0 (0.0%) |
Health & Disability in Crystal
Health Insurance Coverage by Age in Crystal
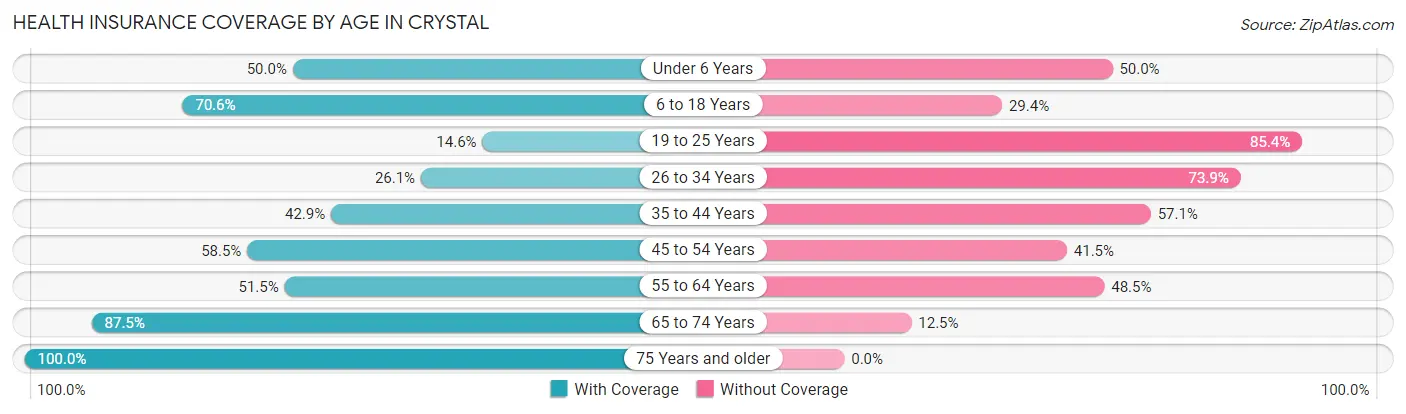
| Age Bracket | With Coverage | Without Coverage |
| Under 6 Years | 4 (50.0%) | 4 (50.0%) |
| 6 to 18 Years | 24 (70.6%) | 10 (29.4%) |
| 19 to 25 Years | 6 (14.6%) | 35 (85.4%) |
| 26 to 34 Years | 12 (26.1%) | 34 (73.9%) |
| 35 to 44 Years | 15 (42.9%) | 20 (57.1%) |
| 45 to 54 Years | 31 (58.5%) | 22 (41.5%) |
| 55 to 64 Years | 17 (51.5%) | 16 (48.5%) |
| 65 to 74 Years | 14 (87.5%) | 2 (12.5%) |
| 75 Years and older | 19 (100.0%) | 0 (0.0%) |
| Total | 142 (49.8%) | 143 (50.2%) |
Health Insurance Coverage by Citizenship Status in Crystal
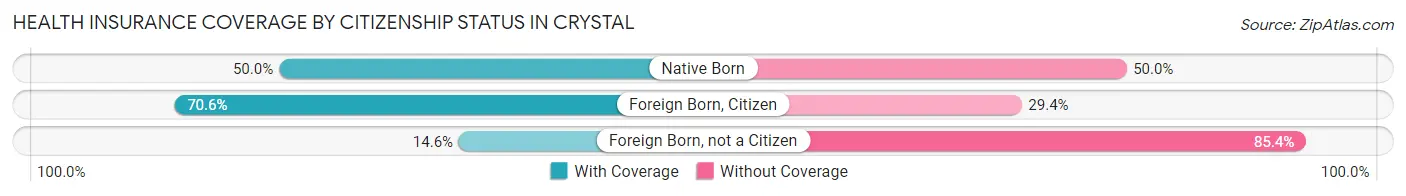
| Citizenship Status | With Coverage | Without Coverage |
| Native Born | 4 (50.0%) | 4 (50.0%) |
| Foreign Born, Citizen | 24 (70.6%) | 10 (29.4%) |
| Foreign Born, not a Citizen | 6 (14.6%) | 35 (85.4%) |
Health Insurance Coverage by Household Income in Crystal
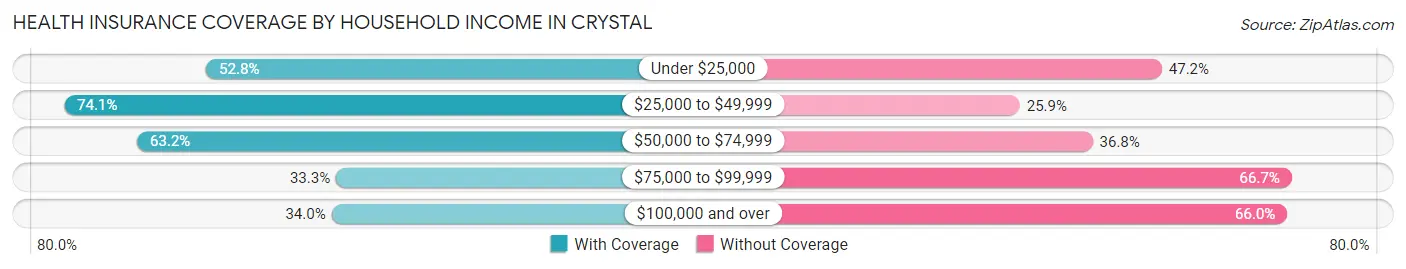
| Household Income | With Coverage | Without Coverage |
| Under $25,000 | 57 (52.8%) | 51 (47.2%) |
| $25,000 to $49,999 | 20 (74.1%) | 7 (25.9%) |
| $50,000 to $74,999 | 24 (63.2%) | 14 (36.8%) |
| $75,000 to $99,999 | 19 (33.3%) | 38 (66.7%) |
| $100,000 and over | 17 (34.0%) | 33 (66.0%) |
Public vs Private Health Insurance Coverage by Age in Crystal
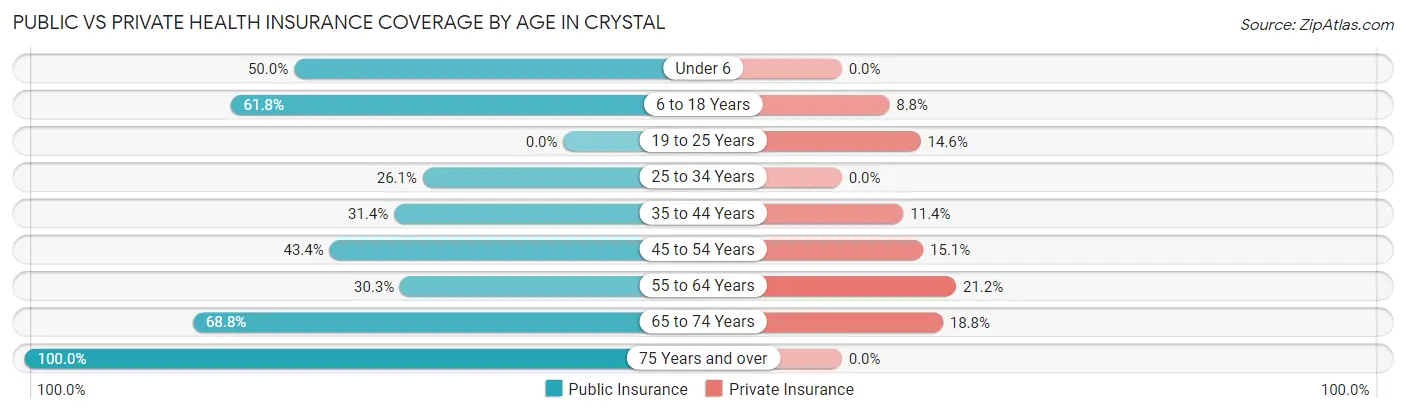
| Age Bracket | Public Insurance | Private Insurance |
| Under 6 | 4 (50.0%) | 0 (0.0%) |
| 6 to 18 Years | 21 (61.8%) | 3 (8.8%) |
| 19 to 25 Years | 0 (0.0%) | 6 (14.6%) |
| 25 to 34 Years | 12 (26.1%) | 0 (0.0%) |
| 35 to 44 Years | 11 (31.4%) | 4 (11.4%) |
| 45 to 54 Years | 23 (43.4%) | 8 (15.1%) |
| 55 to 64 Years | 10 (30.3%) | 7 (21.2%) |
| 65 to 74 Years | 11 (68.8%) | 3 (18.8%) |
| 75 Years and over | 19 (100.0%) | 0 (0.0%) |
| Total | 111 (39.0%) | 31 (10.9%) |
Disability Status by Sex by Age in Crystal
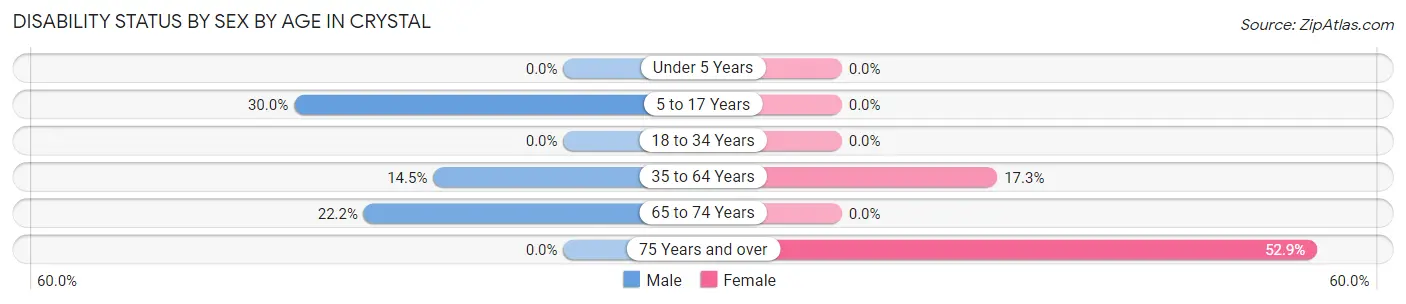
| Age Bracket | Male | Female |
| Under 5 Years | 0 (0.0%) | 0 (0.0%) |
| 5 to 17 Years | 3 (30.0%) | 0 (0.0%) |
| 18 to 34 Years | 0 (0.0%) | 0 (0.0%) |
| 35 to 64 Years | 10 (14.5%) | 9 (17.3%) |
| 65 to 74 Years | 2 (22.2%) | 0 (0.0%) |
| 75 Years and over | 0 (0.0%) | 9 (52.9%) |
Disability Class by Sex by Age in Crystal
Disability Class: Hearing Difficulty
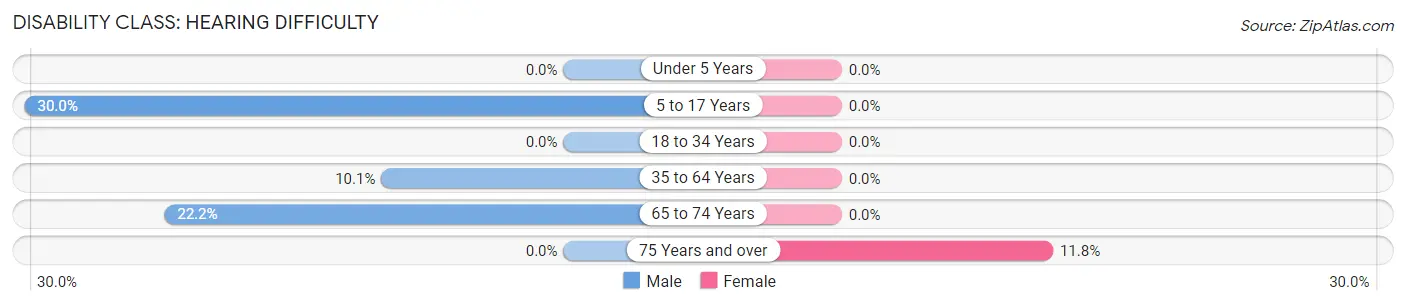
| Age Bracket | Male | Female |
| Under 5 Years | 0 (0.0%) | 0 (0.0%) |
| 5 to 17 Years | 3 (30.0%) | 0 (0.0%) |
| 18 to 34 Years | 0 (0.0%) | 0 (0.0%) |
| 35 to 64 Years | 7 (10.1%) | 0 (0.0%) |
| 65 to 74 Years | 2 (22.2%) | 0 (0.0%) |
| 75 Years and over | 0 (0.0%) | 2 (11.8%) |
Disability Class: Vision Difficulty
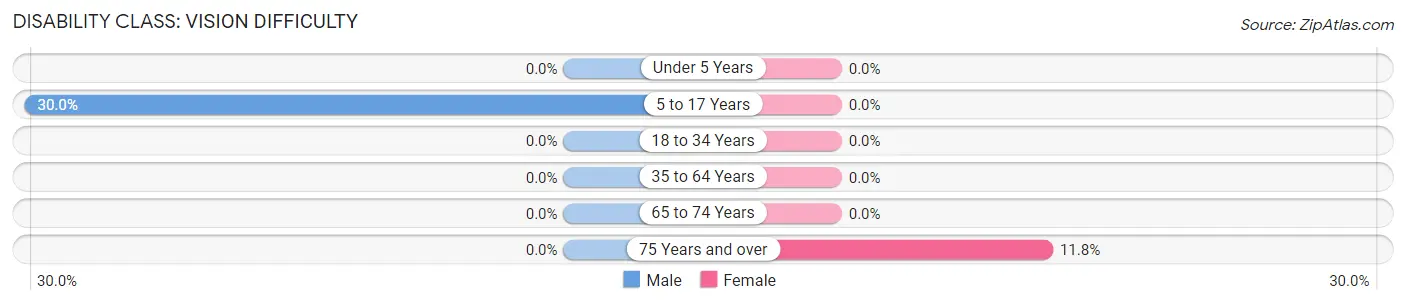
| Age Bracket | Male | Female |
| Under 5 Years | 0 (0.0%) | 0 (0.0%) |
| 5 to 17 Years | 3 (30.0%) | 0 (0.0%) |
| 18 to 34 Years | 0 (0.0%) | 0 (0.0%) |
| 35 to 64 Years | 0 (0.0%) | 0 (0.0%) |
| 65 to 74 Years | 0 (0.0%) | 0 (0.0%) |
| 75 Years and over | 0 (0.0%) | 2 (11.8%) |
Disability Class: Cognitive Difficulty
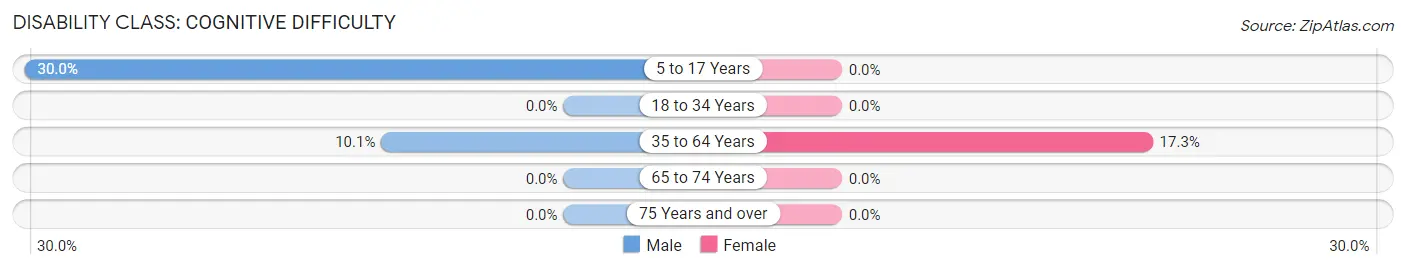
| Age Bracket | Male | Female |
| 5 to 17 Years | 3 (30.0%) | 0 (0.0%) |
| 18 to 34 Years | 0 (0.0%) | 0 (0.0%) |
| 35 to 64 Years | 7 (10.1%) | 9 (17.3%) |
| 65 to 74 Years | 0 (0.0%) | 0 (0.0%) |
| 75 Years and over | 0 (0.0%) | 0 (0.0%) |
Disability Class: Ambulatory Difficulty
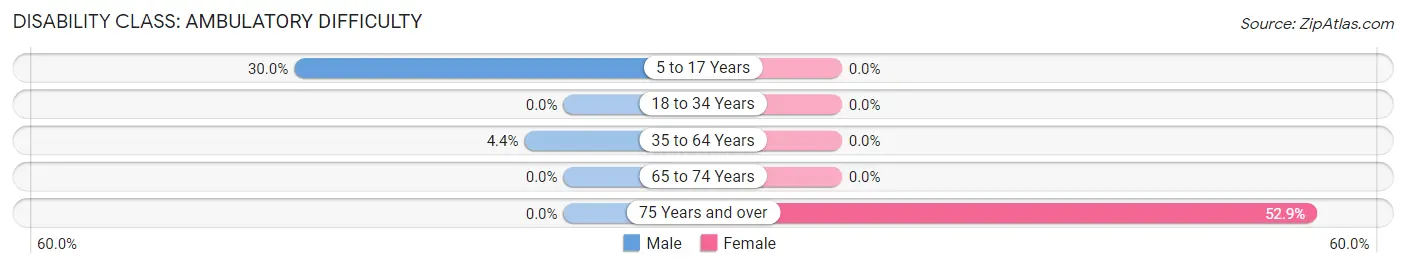
| Age Bracket | Male | Female |
| 5 to 17 Years | 3 (30.0%) | 0 (0.0%) |
| 18 to 34 Years | 0 (0.0%) | 0 (0.0%) |
| 35 to 64 Years | 3 (4.3%) | 0 (0.0%) |
| 65 to 74 Years | 0 (0.0%) | 0 (0.0%) |
| 75 Years and over | 0 (0.0%) | 9 (52.9%) |
Disability Class: Self-Care Difficulty
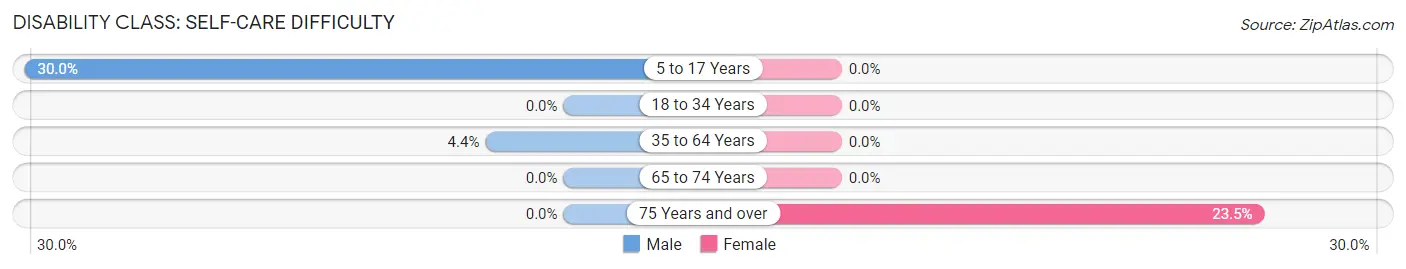
| Age Bracket | Male | Female |
| 5 to 17 Years | 3 (30.0%) | 0 (0.0%) |
| 18 to 34 Years | 0 (0.0%) | 0 (0.0%) |
| 35 to 64 Years | 3 (4.3%) | 0 (0.0%) |
| 65 to 74 Years | 0 (0.0%) | 0 (0.0%) |
| 75 Years and over | 0 (0.0%) | 4 (23.5%) |
Technology Access in Crystal
Computing Device Access in Crystal
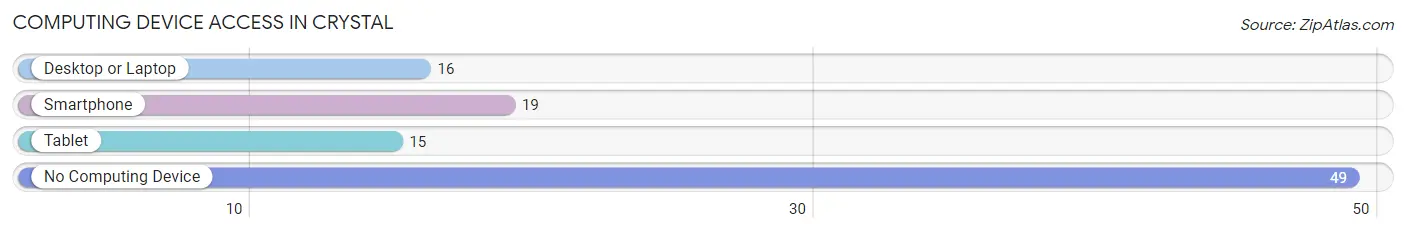
| Device Type | # Households | % Households |
| Desktop or Laptop | 16 | 21.9% |
| Smartphone | 19 | 26.0% |
| Tablet | 15 | 20.5% |
| No Computing Device | 49 | 67.1% |
| Total | 73 | 100.0% |
Internet Access in Crystal
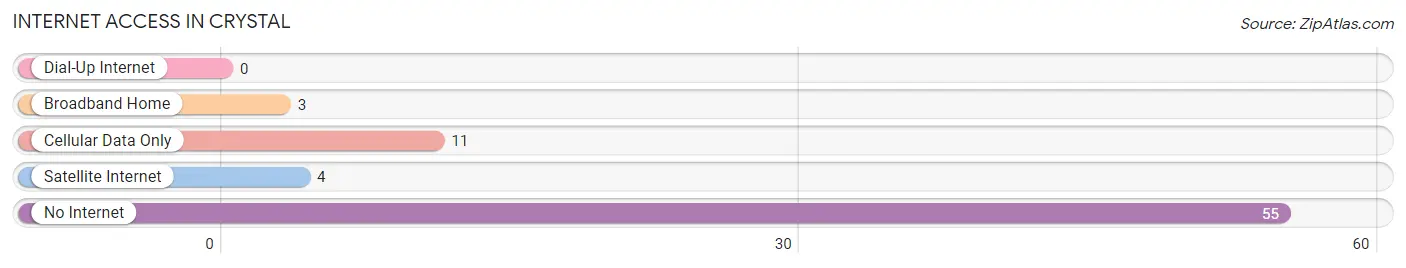
| Internet Type | # Households | % Households |
| Dial-Up Internet | 0 | 0.0% |
| Broadband Home | 3 | 4.1% |
| Cellular Data Only | 11 | 15.1% |
| Satellite Internet | 4 | 5.5% |
| No Internet | 55 | 75.3% |
| Total | 73 | 100.0% |
Crystal Summary
Crystal is a small unincorporated community located in the northwest corner of New Mexico. It is situated in the San Juan Basin, which is part of the larger Colorado Plateau. The area is known for its rugged terrain and stunning views of the surrounding mountains. Crystal is located in Rio Arriba County, and is approximately 25 miles north of the city of Farmington.
History
The area around Crystal has been inhabited for thousands of years. The first known inhabitants were the Ancestral Puebloans, who lived in the area from around 1000 AD to 1300 AD. The area was later inhabited by the Navajo, who still live in the area today.
The first European settlers arrived in the area in the late 1800s. The settlement was originally called “Crystal Springs”, after the nearby spring that provided water to the area. The settlement was later renamed “Crystal”.
Geography
Crystal is located in the northwest corner of New Mexico, in the San Juan Basin. The area is known for its rugged terrain and stunning views of the surrounding mountains. The area is mostly desert, with some grasslands and shrublands. The climate is semi-arid, with hot summers and cold winters.
The nearest major city is Farmington, which is located approximately 25 miles to the south. The nearest airport is the Four Corners Regional Airport, which is located approximately 40 miles to the east.
Economy
The economy of Crystal is largely based on agriculture and tourism. The area is known for its scenic beauty, and attracts many visitors each year. The area is also home to several ranches and farms, which produce a variety of crops and livestock.
Demographics
As of the 2010 census, the population of Crystal was 1,072. The population is mostly Native American, with a small Hispanic minority. The median household income is $30,000, and the median age is 37.
Conclusion
Crystal is a small unincorporated community located in the northwest corner of New Mexico. It is situated in the San Juan Basin, which is part of the larger Colorado Plateau. The area is known for its rugged terrain and stunning views of the surrounding mountains. The economy of Crystal is largely based on agriculture and tourism, and the population is mostly Native American, with a small Hispanic minority.
Common Questions
What is Per Capita Income in Crystal?
Per Capita income in Crystal is $16,482.
What is the Median Family Income in Crystal?
Median Family Income in Crystal is $53,333.
What is Income or Wage Gap in Crystal?
Income or Wage Gap in Crystal is 52.8%.
Women in Crystal earn 47.2 cents for every dollar earned by a man.
What is Inequality or Gini Index in Crystal?
Inequality or Gini Index in Crystal is 0.46.
What is the Total Population of Crystal?
Total Population of Crystal is 285.
What is the Total Male Population of Crystal?
Total Male Population of Crystal is 145.
What is the Total Female Population of Crystal?
Total Female Population of Crystal is 140.
What is the Ratio of Males per 100 Females in Crystal?
There are 103.57 Males per 100 Females in Crystal.
What is the Ratio of Females per 100 Males in Crystal?
There are 96.55 Females per 100 Males in Crystal.
What is the Median Population Age in Crystal?
Median Population Age in Crystal is 35.8 Years.
What is the Average Family Size in Crystal
Average Family Size in Crystal is 4.9 People.
What is the Average Household Size in Crystal
Average Household Size in Crystal is 3.8 People.
How Large is the Labor Force in Crystal?
There are 104 People in the Labor Forcein in Crystal.
What is the Percentage of People in the Labor Force in Crystal?
39.8% of People are in the Labor Force in Crystal.
What is the Unemployment Rate in Crystal?
Unemployment Rate in Crystal is 3.8%.