Zip Codes with the Highest Percentage of Population Employed in Security & Protection in Hobbs, NM
RELATED REPORTS & OPTIONS
Security & Protection
Hobbs
Compare Zip Codes
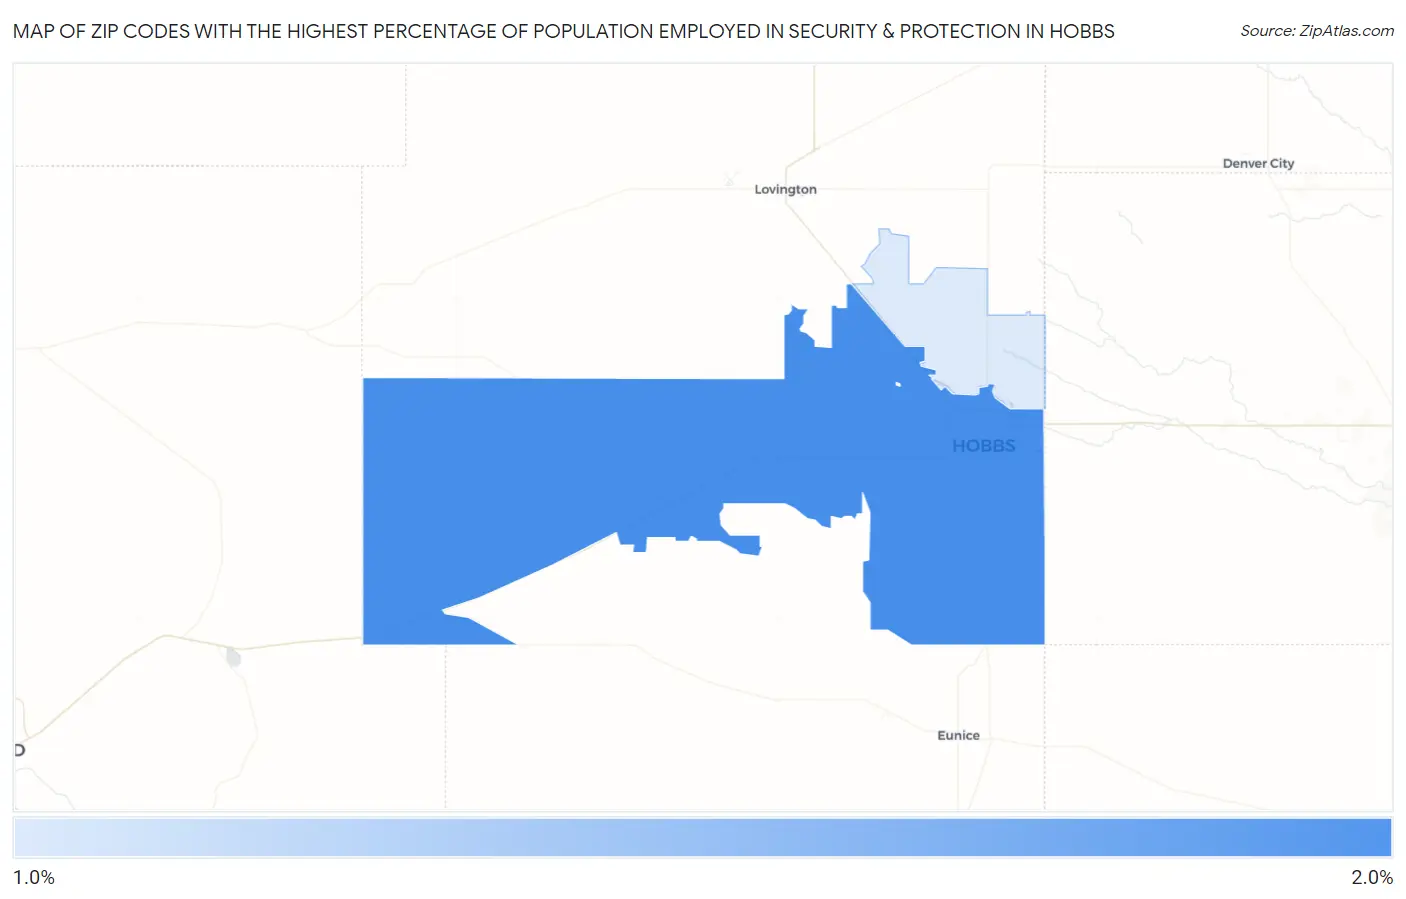
Map of Zip Codes with the Highest Percentage of Population Employed in Security & Protection in Hobbs
1.3%
1.5%
Zip Codes with the Highest Percentage of Population Employed in Security & Protection in Hobbs, NM
| Zip Code | % Employed | vs State | vs National | |
| 1. | 88240 | 1.5% | 2.8%(-1.23)#155 | 2.1%(-0.613)#15,907 |
| 2. | 88242 | 1.3% | 2.8%(-1.48)#165 | 2.1%(-0.866)#17,889 |
1
Common Questions
What are the Top Zip Codes with the Highest Percentage of Population Employed in Security & Protection in Hobbs, NM?
Top Zip Codes with the Highest Percentage of Population Employed in Security & Protection in Hobbs, NM are:
What zip code has the Highest Percentage of Population Employed in Security & Protection in Hobbs, NM?
88240 has the Highest Percentage of Population Employed in Security & Protection in Hobbs, NM with 1.5%.
What is the Percentage of Population Employed in Security & Protection in Hobbs, NM?
Percentage of Population Employed in Security & Protection in Hobbs is 1.6%.
What is the Percentage of Population Employed in Security & Protection in New Mexico?
Percentage of Population Employed in Security & Protection in New Mexico is 2.8%.
What is the Percentage of Population Employed in Security & Protection in the United States?
Percentage of Population Employed in Security & Protection in the United States is 2.1%.