Jemez Springs, NM Map & Demographics
Jemez Springs Map
Jemez Springs Overview
$43,546
PER CAPITA INCOME
$104,063
AVG FAMILY INCOME
$88,750
AVG HOUSEHOLD INCOME
0.39
INEQUALITY / GINI INDEX
352
TOTAL POPULATION
151
MALE POPULATION
201
FEMALE POPULATION
75.12
MALES / 100 FEMALES
133.11
FEMALES / 100 MALES
56.4
MEDIAN AGE
2.3
AVG FAMILY SIZE
2.0
AVG HOUSEHOLD SIZE
192
LABOR FORCE [ PEOPLE ]
55.7%
PERCENT IN LABOR FORCE
11.5%
UNEMPLOYMENT RATE
Jemez Springs Zip Codes
Jemez Springs Area Codes
Income in Jemez Springs
Income Overview in Jemez Springs
Per Capita Income in Jemez Springs is $43,546, while median incomes of families and households are $104,063 and $88,750 respectively.
| Characteristic | Number | Measure |
| Per Capita Income | 352 | $43,546 |
| Median Family Income | 97 | $104,063 |
| Mean Family Income | 97 | $119,262 |
| Median Household Income | 151 | $88,750 |
| Mean Household Income | 151 | $95,470 |
| Income Deficit | 97 | $0 |
| Wage / Income Gap (%) | 352 | 0.00% |
| Wage / Income Gap ($) | 352 | 100.00¢ per $1 |
| Gini / Inequality Index | 352 | 0.39 |
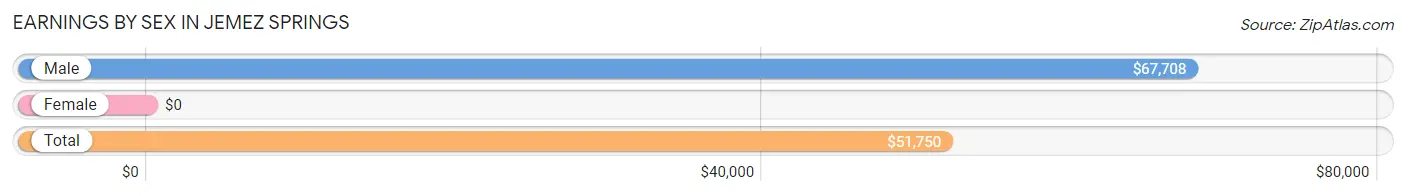
Earnings by Sex in Jemez Springs
| Sex | Number | Average Earnings |
| Male | 81 (38.9%) | $67,708 |
| Female | 127 (61.1%) | $0 |
| Total | 208 (100.0%) | $51,750 |
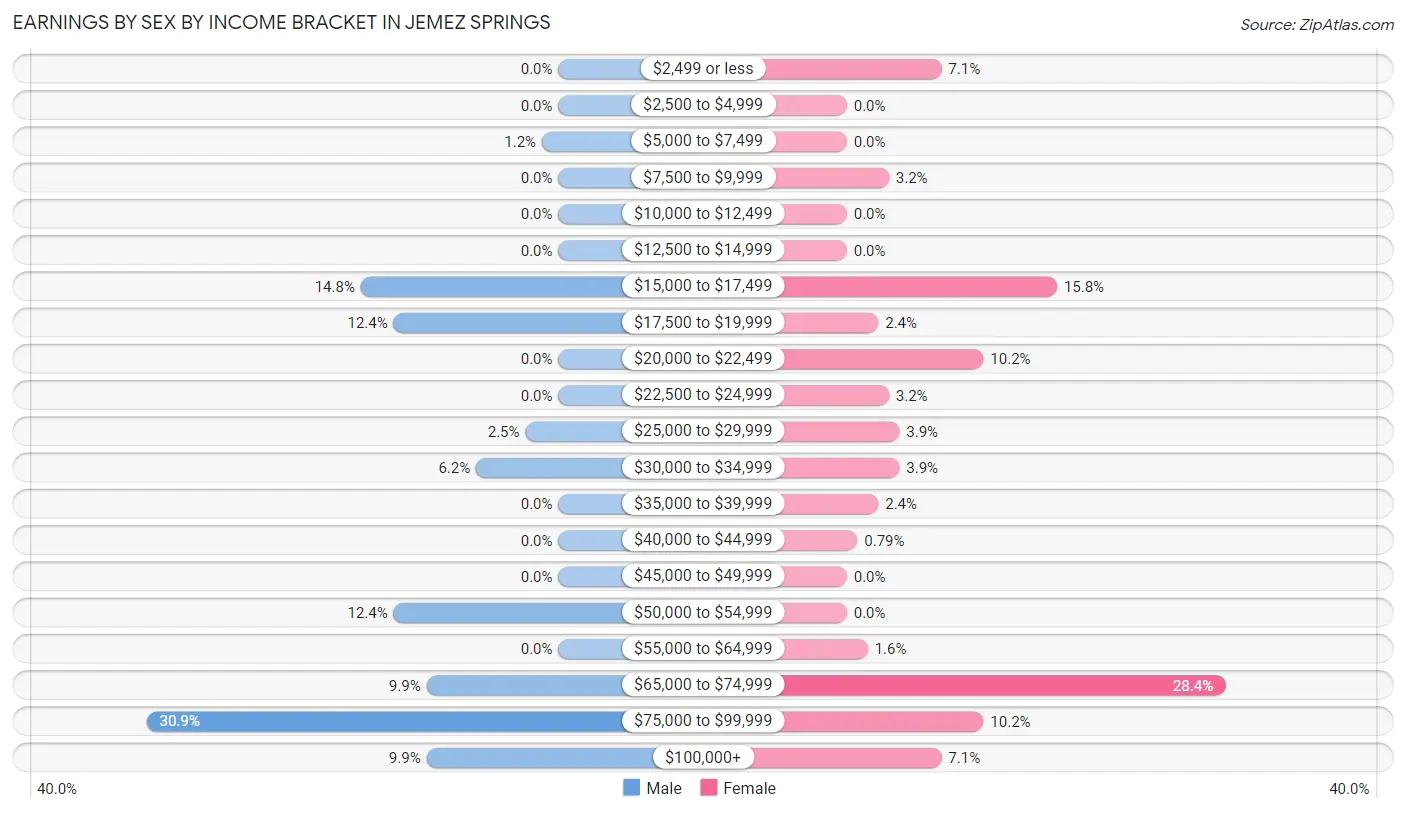
Earnings by Sex by Income Bracket in Jemez Springs
The most common earnings brackets in Jemez Springs are $75,000 to $99,999 for men (25 | 30.9%) and $65,000 to $74,999 for women (36 | 28.3%).
| Income | Male | Female |
| $2,499 or less | 0 (0.0%) | 9 (7.1%) |
| $2,500 to $4,999 | 0 (0.0%) | 0 (0.0%) |
| $5,000 to $7,499 | 1 (1.2%) | 0 (0.0%) |
| $7,500 to $9,999 | 0 (0.0%) | 4 (3.2%) |
| $10,000 to $12,499 | 0 (0.0%) | 0 (0.0%) |
| $12,500 to $14,999 | 0 (0.0%) | 0 (0.0%) |
| $15,000 to $17,499 | 12 (14.8%) | 20 (15.8%) |
| $17,500 to $19,999 | 10 (12.3%) | 3 (2.4%) |
| $20,000 to $22,499 | 0 (0.0%) | 13 (10.2%) |
| $22,500 to $24,999 | 0 (0.0%) | 4 (3.2%) |
| $25,000 to $29,999 | 2 (2.5%) | 5 (3.9%) |
| $30,000 to $34,999 | 5 (6.2%) | 5 (3.9%) |
| $35,000 to $39,999 | 0 (0.0%) | 3 (2.4%) |
| $40,000 to $44,999 | 0 (0.0%) | 1 (0.8%) |
| $45,000 to $49,999 | 0 (0.0%) | 0 (0.0%) |
| $50,000 to $54,999 | 10 (12.3%) | 0 (0.0%) |
| $55,000 to $64,999 | 0 (0.0%) | 2 (1.6%) |
| $65,000 to $74,999 | 8 (9.9%) | 36 (28.3%) |
| $75,000 to $99,999 | 25 (30.9%) | 13 (10.2%) |
| $100,000+ | 8 (9.9%) | 9 (7.1%) |
| Total | 81 (100.0%) | 127 (100.0%) |
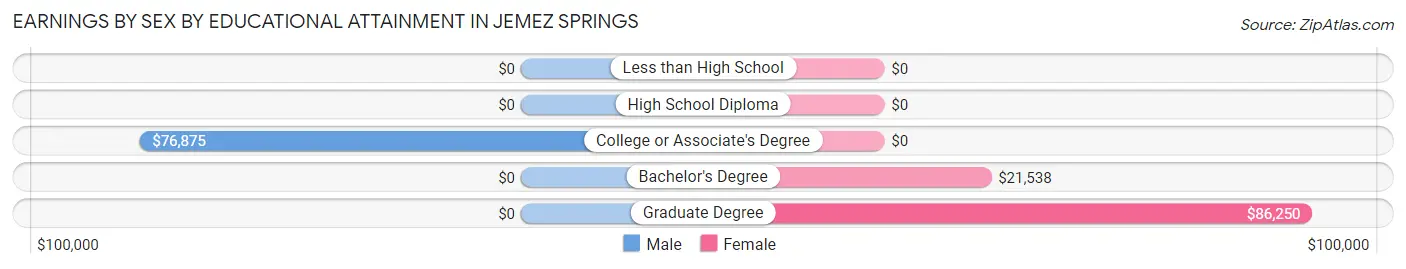
Earnings by Sex by Educational Attainment in Jemez Springs
| Educational Attainment | Male Income | Female Income |
| Less than High School | - | - |
| High School Diploma | - | - |
| College or Associate's Degree | $76,875 | $0 |
| Bachelor's Degree | - | - |
| Graduate Degree | - | - |
| Total | $73,750 | $0 |
Family Income in Jemez Springs
Family Income Brackets in Jemez Springs
According to the Jemez Springs family income data, there are 30 families falling into the $150,000 to $199,999 income range, which is the most common income bracket and makes up 30.9% of all families.
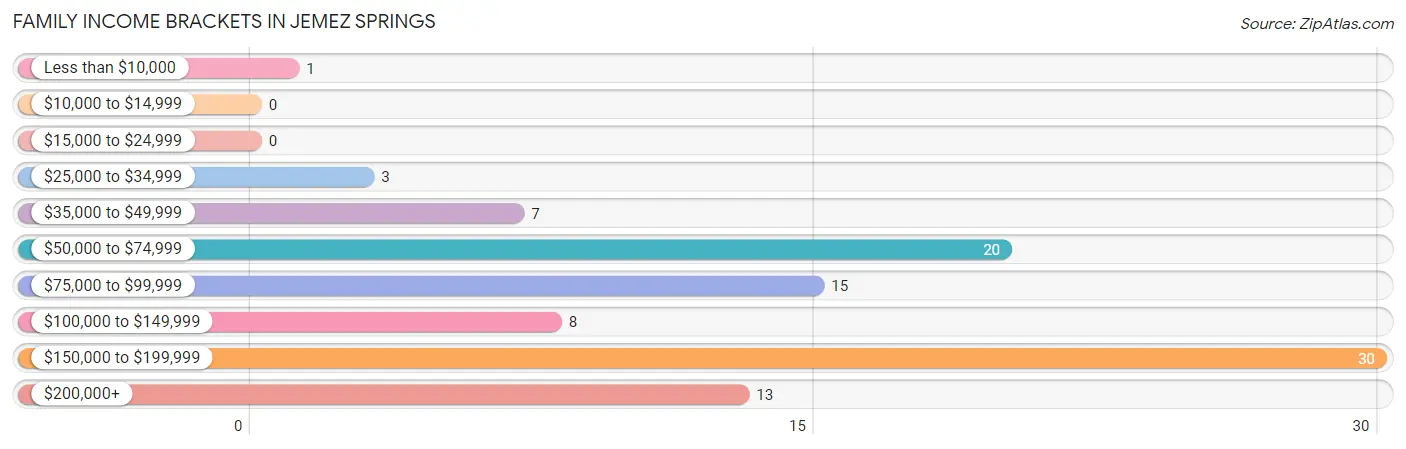
| Income Bracket | # Families | % Families |
| Less than $10,000 | 1 | 1.0% |
| $10,000 to $14,999 | 0 | 0.0% |
| $15,000 to $24,999 | 0 | 0.0% |
| $25,000 to $34,999 | 3 | 3.1% |
| $35,000 to $49,999 | 7 | 7.2% |
| $50,000 to $74,999 | 20 | 20.6% |
| $75,000 to $99,999 | 15 | 15.5% |
| $100,000 to $149,999 | 8 | 8.2% |
| $150,000 to $199,999 | 30 | 30.9% |
| $200,000+ | 13 | 13.4% |
Family Income by Famaliy Size in Jemez Springs
2-person families (80 | 82.5%) account for the highest median family income in Jemez Springs with $91,000 per family, while 2-person families (80 | 82.5%) have the highest median income of $45,500 per family member.
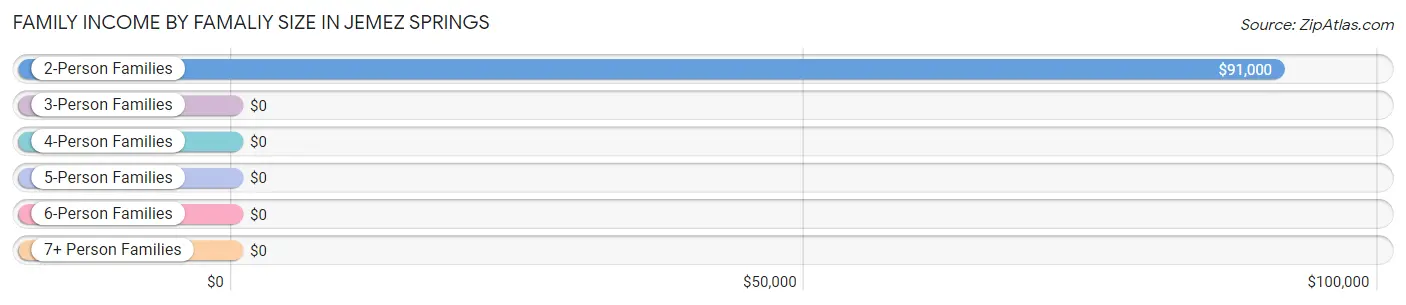
| Income Bracket | # Families | Median Income |
| 2-Person Families | 80 (82.5%) | $91,000 |
| 3-Person Families | 3 (3.1%) | $0 |
| 4-Person Families | 14 (14.4%) | $0 |
| 5-Person Families | 0 (0.0%) | $0 |
| 6-Person Families | 0 (0.0%) | $0 |
| 7+ Person Families | 0 (0.0%) | $0 |
| Total | 97 (100.0%) | $104,063 |
Family Income by Number of Earners in Jemez Springs
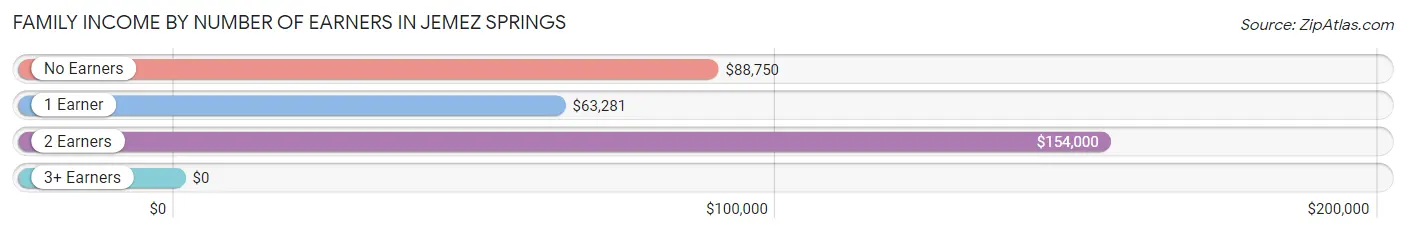
| Number of Earners | # Families | Median Income |
| No Earners | 21 (21.6%) | $88,750 |
| 1 Earner | 30 (30.9%) | $63,281 |
| 2 Earners | 32 (33.0%) | $154,000 |
| 3+ Earners | 14 (14.4%) | $0 |
| Total | 97 (100.0%) | $104,063 |
Household Income in Jemez Springs
Household Income Brackets in Jemez Springs
With 30 households falling in the category, the $150,000 to $199,999 income range is the most frequent in Jemez Springs, accounting for 19.9% of all households.
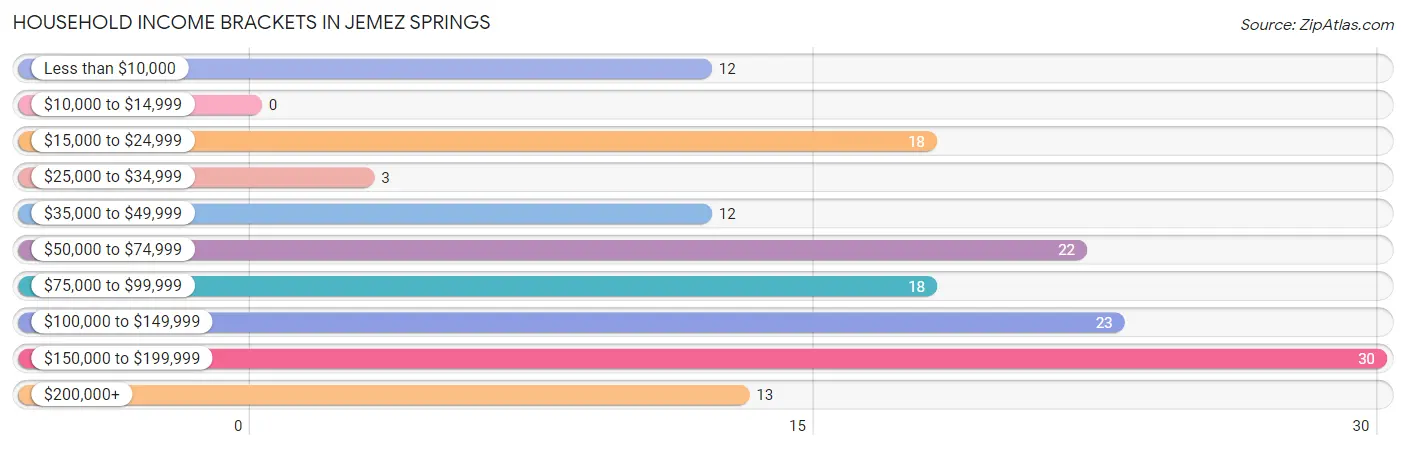
| Income Bracket | # Households | % Households |
| Less than $10,000 | 12 | 7.9% |
| $10,000 to $14,999 | 0 | 0.0% |
| $15,000 to $24,999 | 18 | 11.9% |
| $25,000 to $34,999 | 3 | 2.0% |
| $35,000 to $49,999 | 12 | 7.9% |
| $50,000 to $74,999 | 22 | 14.6% |
| $75,000 to $99,999 | 18 | 11.9% |
| $100,000 to $149,999 | 23 | 15.2% |
| $150,000 to $199,999 | 30 | 19.9% |
| $200,000+ | 13 | 8.6% |
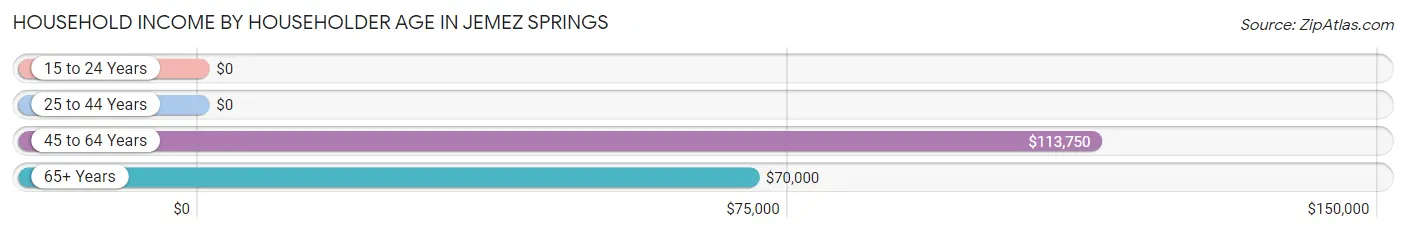
Household Income by Householder Age in Jemez Springs
The median household income in Jemez Springs is $88,750, with the highest median household income of $113,750 found in the 45 to 64 years age bracket for the primary householder. A total of 88 households (58.3%) fall into this category. Meanwhile, the 15 to 24 years age bracket for the primary householder has the lowest median household income of $0, with 3 households (2.0%) in this group.
| Income Bracket | # Households | Median Income |
| 15 to 24 Years | 3 (2.0%) | $0 |
| 25 to 44 Years | 14 (9.3%) | $0 |
| 45 to 64 Years | 88 (58.3%) | $113,750 |
| 65+ Years | 46 (30.5%) | $70,000 |
| Total | 151 (100.0%) | $88,750 |
Poverty in Jemez Springs
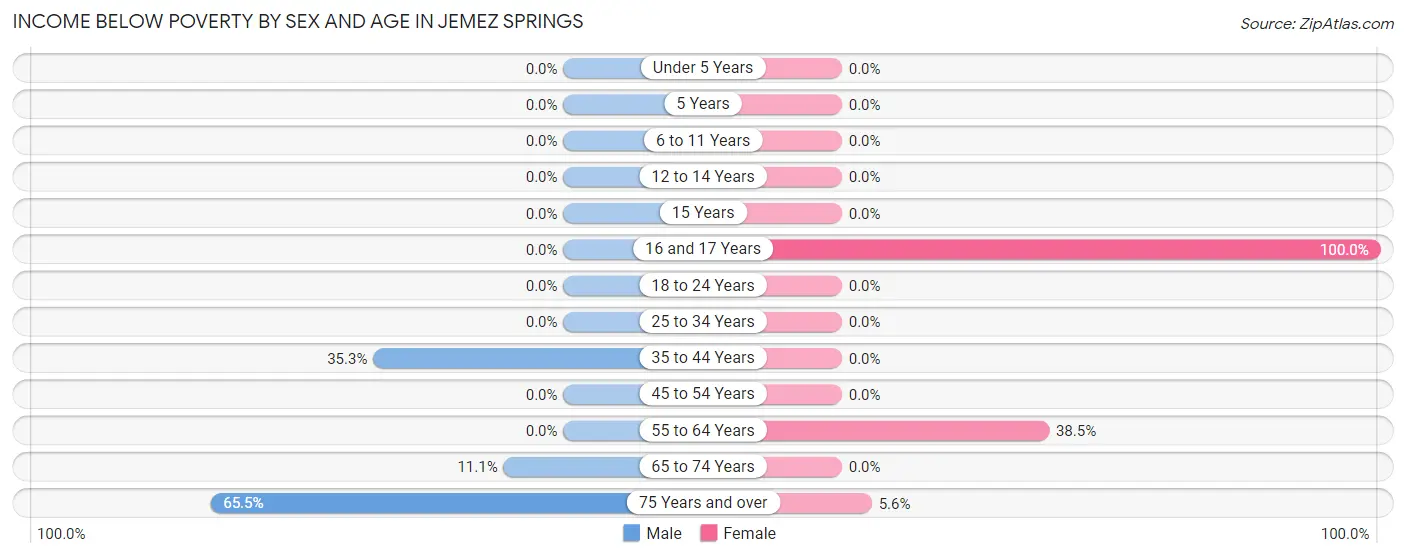
Income Below Poverty by Sex and Age in Jemez Springs
With 17.9% poverty level for males and 19.4% for females among the residents of Jemez Springs, 75 year old and over males and 16 and 17 year old females are the most vulnerable to poverty, with 19 males (65.5%) and 3 females (100.0%) in their respective age groups living below the poverty level.
| Age Bracket | Male | Female |
| Under 5 Years | 0 (0.0%) | 0 (0.0%) |
| 5 Years | 0 (0.0%) | 0 (0.0%) |
| 6 to 11 Years | 0 (0.0%) | 0 (0.0%) |
| 12 to 14 Years | 0 (0.0%) | 0 (0.0%) |
| 15 Years | 0 (0.0%) | 0 (0.0%) |
| 16 and 17 Years | 0 (0.0%) | 3 (100.0%) |
| 18 to 24 Years | 0 (0.0%) | 0 (0.0%) |
| 25 to 34 Years | 0 (0.0%) | 0 (0.0%) |
| 35 to 44 Years | 6 (35.3%) | 0 (0.0%) |
| 45 to 54 Years | 0 (0.0%) | 0 (0.0%) |
| 55 to 64 Years | 0 (0.0%) | 35 (38.5%) |
| 65 to 74 Years | 2 (11.1%) | 0 (0.0%) |
| 75 Years and over | 19 (65.5%) | 1 (5.6%) |
| Total | 27 (17.9%) | 39 (19.4%) |
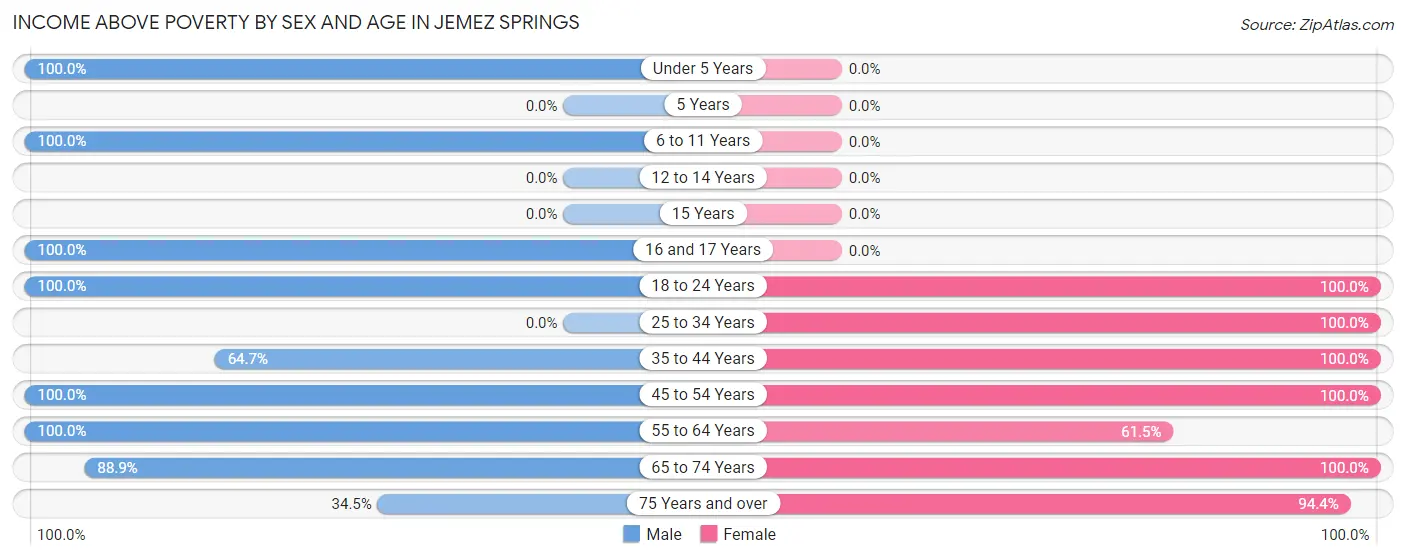
Income Above Poverty by Sex and Age in Jemez Springs
According to the poverty statistics in Jemez Springs, males aged under 5 years and females aged 18 to 24 years are the age groups that are most secure financially, with 100.0% of males and 100.0% of females in these age groups living above the poverty line.
| Age Bracket | Male | Female |
| Under 5 Years | 6 (100.0%) | 0 (0.0%) |
| 5 Years | 0 (0.0%) | 0 (0.0%) |
| 6 to 11 Years | 1 (100.0%) | 0 (0.0%) |
| 12 to 14 Years | 0 (0.0%) | 0 (0.0%) |
| 15 Years | 0 (0.0%) | 0 (0.0%) |
| 16 and 17 Years | 8 (100.0%) | 0 (0.0%) |
| 18 to 24 Years | 15 (100.0%) | 11 (100.0%) |
| 25 to 34 Years | 0 (0.0%) | 3 (100.0%) |
| 35 to 44 Years | 11 (64.7%) | 11 (100.0%) |
| 45 to 54 Years | 15 (100.0%) | 47 (100.0%) |
| 55 to 64 Years | 42 (100.0%) | 56 (61.5%) |
| 65 to 74 Years | 16 (88.9%) | 17 (100.0%) |
| 75 Years and over | 10 (34.5%) | 17 (94.4%) |
| Total | 124 (82.1%) | 162 (80.6%) |
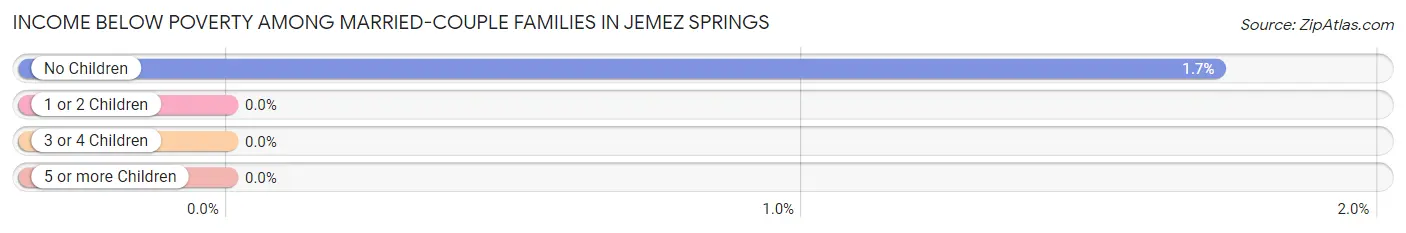
Income Below Poverty Among Married-Couple Families in Jemez Springs
The poverty statistics for married-couple families in Jemez Springs show that 1.3% or 1 of the total 75 families live below the poverty line. Families with no children have the highest poverty rate of 1.7%, comprising of 1 families. On the other hand, families with 1 or 2 children have the lowest poverty rate of 0.0%, which includes 0 families.
| Children | Above Poverty | Below Poverty |
| No Children | 57 (98.3%) | 1 (1.7%) |
| 1 or 2 Children | 17 (100.0%) | 0 (0.0%) |
| 3 or 4 Children | 0 (0.0%) | 0 (0.0%) |
| 5 or more Children | 0 (0.0%) | 0 (0.0%) |
| Total | 74 (98.7%) | 1 (1.3%) |
Income Below Poverty Among Single-Parent Households in Jemez Springs
| Children | Single Father | Single Mother |
| No Children | 0 (0.0%) | 0 (0.0%) |
| 1 or 2 Children | 0 (0.0%) | 0 (0.0%) |
| 3 or 4 Children | 0 (0.0%) | 0 (0.0%) |
| 5 or more Children | 0 (0.0%) | 0 (0.0%) |
| Total | 0 (0.0%) | 0 (0.0%) |
Income Below Poverty Among Married-Couple vs Single-Parent Households in Jemez Springs
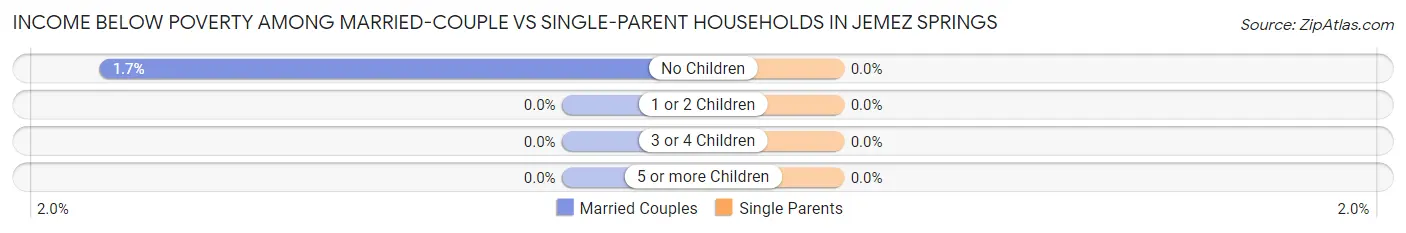
| Children | Married-Couple Families | Single-Parent Households |
| No Children | 1 (1.7%) | 0 (0.0%) |
| 1 or 2 Children | 0 (0.0%) | 0 (0.0%) |
| 3 or 4 Children | 0 (0.0%) | 0 (0.0%) |
| 5 or more Children | 0 (0.0%) | 0 (0.0%) |
| Total | 1 (1.3%) | 0 (0.0%) |
Race in Jemez Springs
The most populous races in Jemez Springs are White / Caucasian (227 | 64.5%), Hispanic or Latino (126 | 35.8%), and Two or more Races (70 | 19.9%).
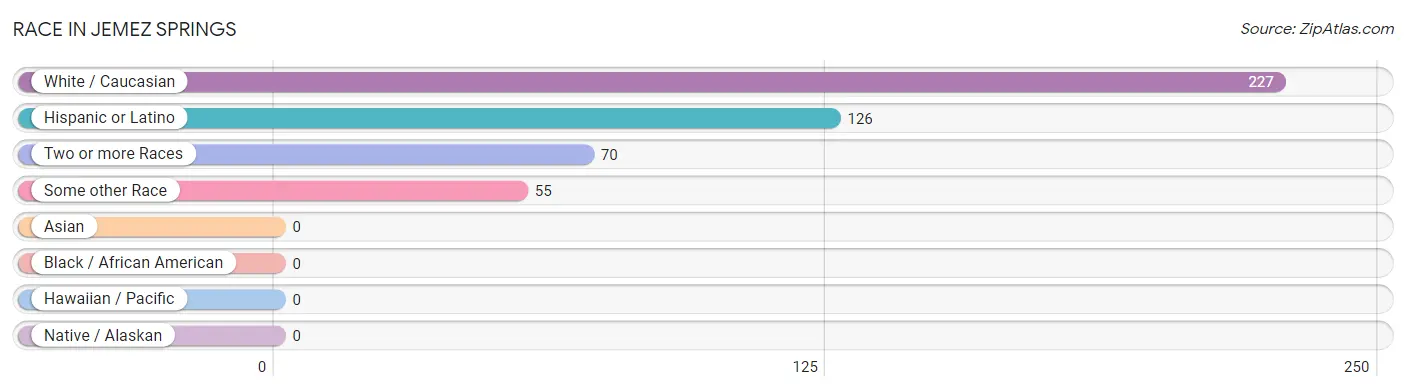
| Race | # Population | % Population |
| Asian | 0 | 0.0% |
| Black / African American | 0 | 0.0% |
| Hawaiian / Pacific | 0 | 0.0% |
| Hispanic or Latino | 126 | 35.8% |
| Native / Alaskan | 0 | 0.0% |
| White / Caucasian | 227 | 64.5% |
| Two or more Races | 70 | 19.9% |
| Some other Race | 55 | 15.6% |
| Total | 352 | 100.0% |
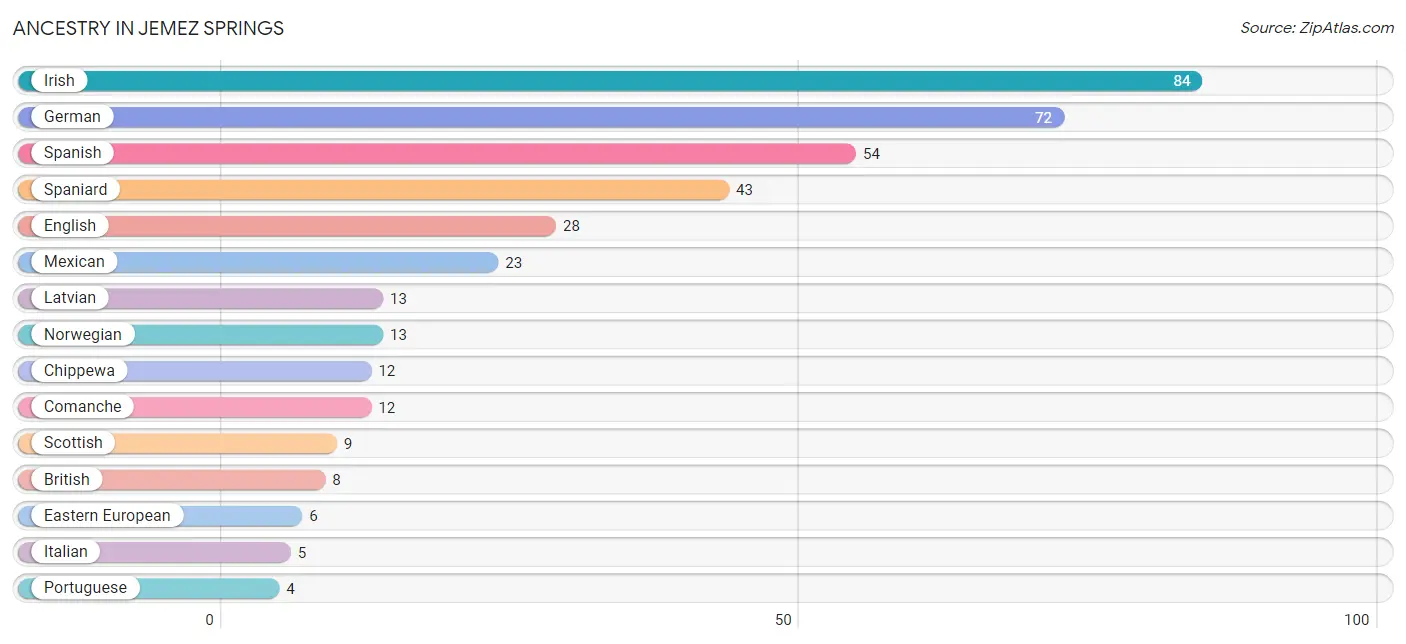
Ancestry in Jemez Springs
The most populous ancestries reported in Jemez Springs are Irish (84 | 23.9%), German (72 | 20.4%), Spanish (54 | 15.3%), Spaniard (43 | 12.2%), and English (28 | 8.0%), together accounting for 79.8% of all Jemez Springs residents.
| Ancestry | # Population | % Population |
| American | 1 | 0.3% |
| Austrian | 1 | 0.3% |
| Bhutanese | 1 | 0.3% |
| British | 8 | 2.3% |
| Chippewa | 12 | 3.4% |
| Comanche | 12 | 3.4% |
| Czech | 3 | 0.9% |
| Dutch | 2 | 0.6% |
| Eastern European | 6 | 1.7% |
| English | 28 | 8.0% |
| European | 1 | 0.3% |
| French | 2 | 0.6% |
| German | 72 | 20.4% |
| Greek | 3 | 0.9% |
| Irish | 84 | 23.9% |
| Italian | 5 | 1.4% |
| Latvian | 13 | 3.7% |
| Mexican | 23 | 6.5% |
| Norwegian | 13 | 3.7% |
| Polish | 3 | 0.9% |
| Portuguese | 4 | 1.1% |
| Scottish | 9 | 2.6% |
| Spaniard | 43 | 12.2% |
| Spanish | 54 | 15.3% |
| Swedish | 2 | 0.6% |
| Swiss | 4 | 1.1% | View All 26 Rows |
Immigrants in Jemez Springs
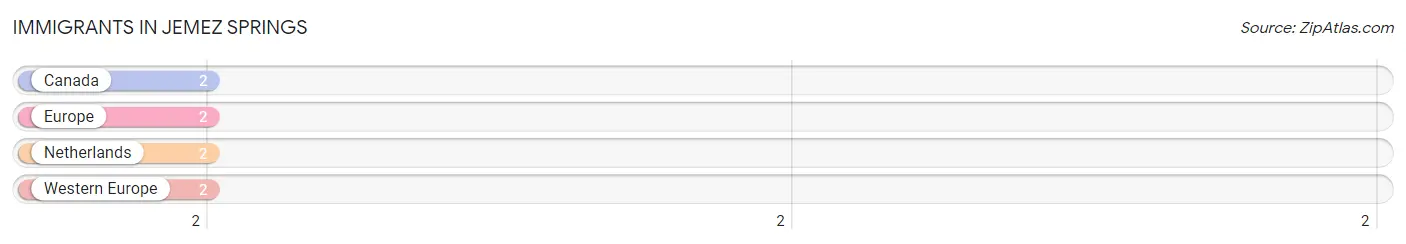
The most numerous immigrant groups reported in Jemez Springs came from Canada (2 | 0.6%), Europe (2 | 0.6%), Netherlands (2 | 0.6%), and Western Europe (2 | 0.6%), together accounting for 2.3% of all Jemez Springs residents.
| Immigration Origin | # Population | % Population |
| Canada | 2 | 0.6% |
| Europe | 2 | 0.6% |
| Netherlands | 2 | 0.6% |
| Western Europe | 2 | 0.6% | View All 4 Rows |
Sex and Age in Jemez Springs
Sex and Age in Jemez Springs
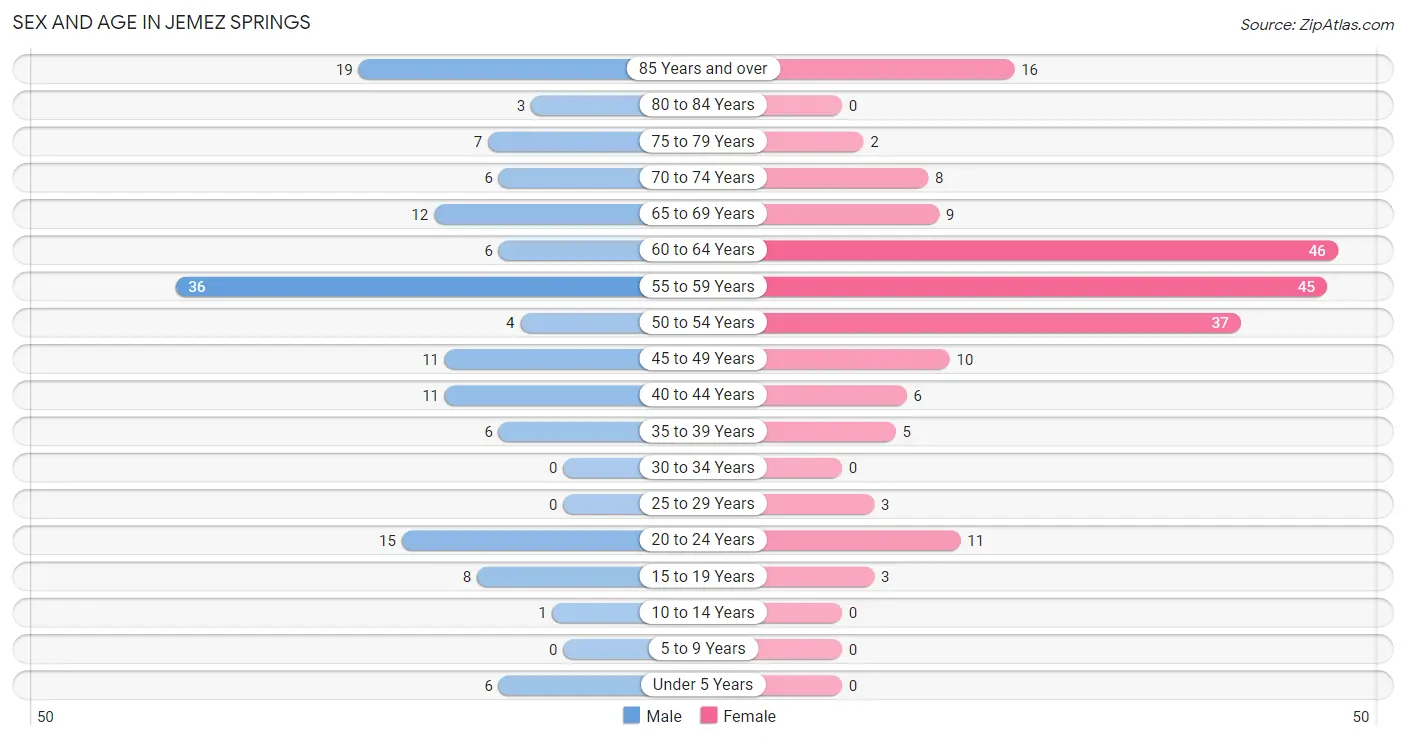
The most populous age groups in Jemez Springs are 55 to 59 Years (36 | 23.8%) for men and 60 to 64 Years (46 | 22.9%) for women.
| Age Bracket | Male | Female |
| Under 5 Years | 6 (4.0%) | 0 (0.0%) |
| 5 to 9 Years | 0 (0.0%) | 0 (0.0%) |
| 10 to 14 Years | 1 (0.7%) | 0 (0.0%) |
| 15 to 19 Years | 8 (5.3%) | 3 (1.5%) |
| 20 to 24 Years | 15 (9.9%) | 11 (5.5%) |
| 25 to 29 Years | 0 (0.0%) | 3 (1.5%) |
| 30 to 34 Years | 0 (0.0%) | 0 (0.0%) |
| 35 to 39 Years | 6 (4.0%) | 5 (2.5%) |
| 40 to 44 Years | 11 (7.3%) | 6 (3.0%) |
| 45 to 49 Years | 11 (7.3%) | 10 (5.0%) |
| 50 to 54 Years | 4 (2.6%) | 37 (18.4%) |
| 55 to 59 Years | 36 (23.8%) | 45 (22.4%) |
| 60 to 64 Years | 6 (4.0%) | 46 (22.9%) |
| 65 to 69 Years | 12 (8.0%) | 9 (4.5%) |
| 70 to 74 Years | 6 (4.0%) | 8 (4.0%) |
| 75 to 79 Years | 7 (4.6%) | 2 (1.0%) |
| 80 to 84 Years | 3 (2.0%) | 0 (0.0%) |
| 85 Years and over | 19 (12.6%) | 16 (8.0%) |
| Total | 151 (100.0%) | 201 (100.0%) |
Families and Households in Jemez Springs
Median Family Size in Jemez Springs
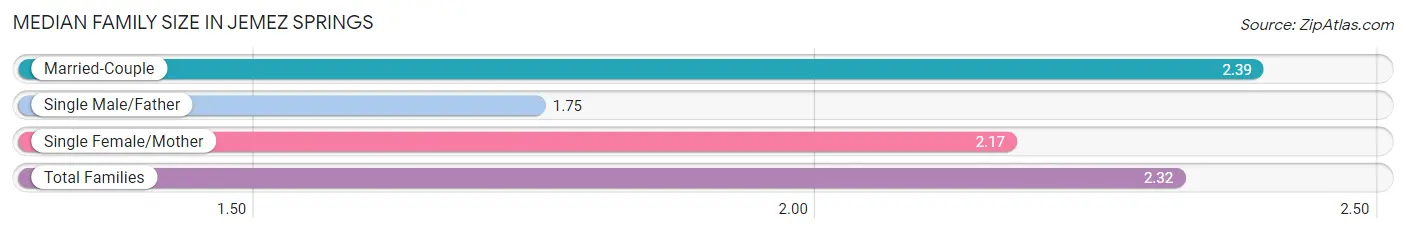
The median family size in Jemez Springs is 2.32 persons per family, with married-couple families (75 | 77.3%) accounting for the largest median family size of 2.39 persons per family. On the other hand, single male/father families (4 | 4.1%) represent the smallest median family size with 1.75 persons per family.
| Family Type | # Families | Family Size |
| Married-Couple | 75 (77.3%) | 2.39 |
| Single Male/Father | 4 (4.1%) | 1.75 |
| Single Female/Mother | 18 (18.6%) | 2.17 |
| Total Families | 97 (100.0%) | 2.32 |
Median Household Size in Jemez Springs
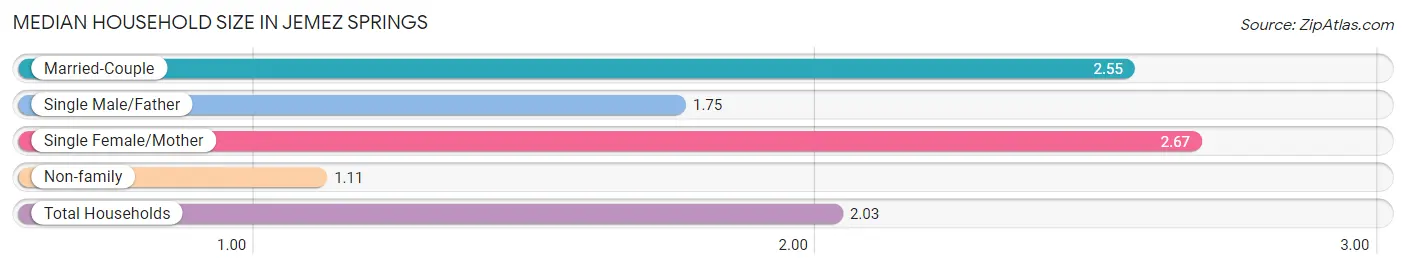
The median household size in Jemez Springs is 2.03 persons per household, with single female/mother households (18 | 11.9%) accounting for the largest median household size of 2.67 persons per household. non-family households (54 | 35.8%) represent the smallest median household size with 1.11 persons per household.
| Household Type | # Households | Household Size |
| Married-Couple | 75 (49.7%) | 2.55 |
| Single Male/Father | 4 (2.6%) | 1.75 |
| Single Female/Mother | 18 (11.9%) | 2.67 |
| Non-family | 54 (35.8%) | 1.11 |
| Total Households | 151 (100.0%) | 2.03 |
Household Size by Marriage Status in Jemez Springs
Out of a total of 151 households in Jemez Springs, 97 (64.2%) are family households, while 54 (35.8%) are nonfamily households. The most numerous type of family households are 2-person households, comprising 64, and the most common type of nonfamily households are 1-person households, comprising 48.
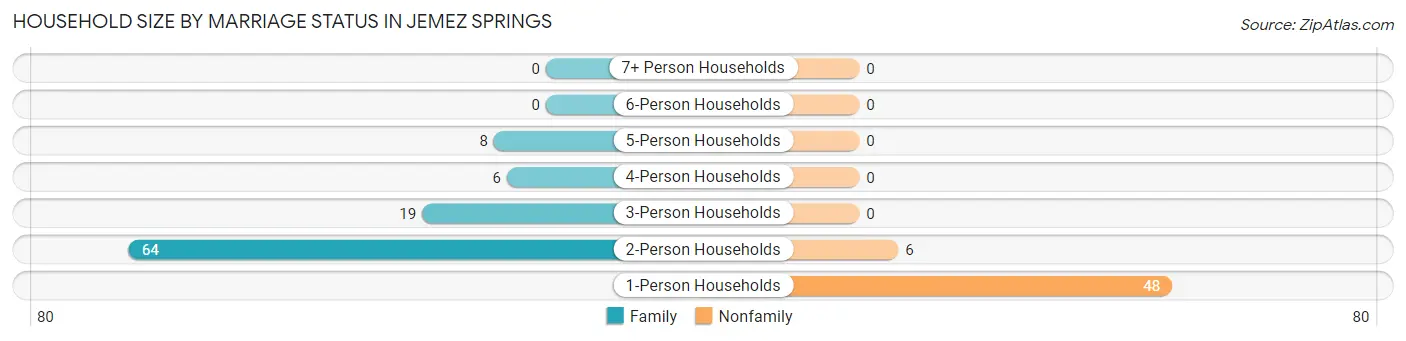
| Household Size | Family Households | Nonfamily Households |
| 1-Person Households | - | 48 (31.8%) |
| 2-Person Households | 64 (42.4%) | 6 (4.0%) |
| 3-Person Households | 19 (12.6%) | 0 (0.0%) |
| 4-Person Households | 6 (4.0%) | 0 (0.0%) |
| 5-Person Households | 8 (5.3%) | 0 (0.0%) |
| 6-Person Households | 0 (0.0%) | 0 (0.0%) |
| 7+ Person Households | 0 (0.0%) | 0 (0.0%) |
| Total | 97 (64.2%) | 54 (35.8%) |
Female Fertility in Jemez Springs
Fertility by Age in Jemez Springs
Average fertility rate in Jemez Springs is 105.0 births per 1,000 women. Women in the age bracket of 35 to 50 years have the highest fertility rate with 190.0 births per 1,000 women. Women in the age bracket of 35 to 50 years acount for 100.0% of all women with births.
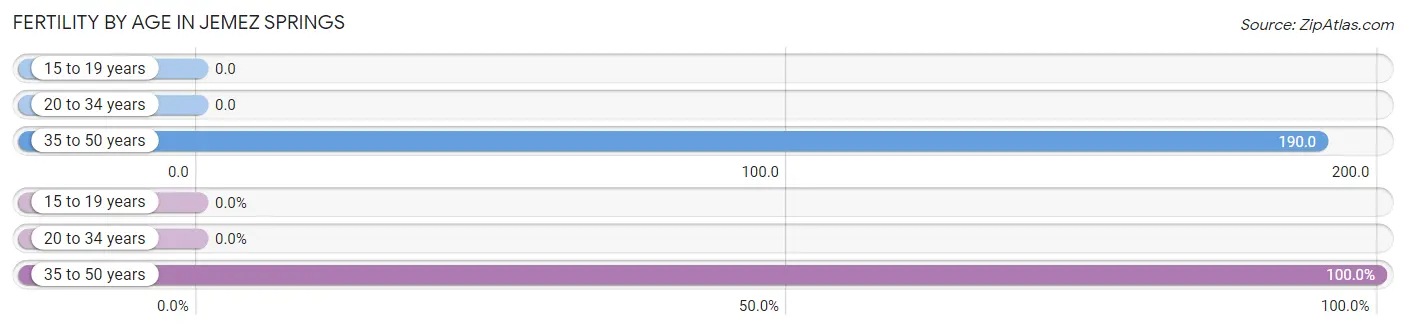
| Age Bracket | Women with Births | Births / 1,000 Women |
| 15 to 19 years | 0 (0.0%) | 0.0 |
| 20 to 34 years | 0 (0.0%) | 0.0 |
| 35 to 50 years | 4 (100.0%) | 190.0 |
| Total | 4 (100.0%) | 105.0 |
Fertility by Age by Marriage Status in Jemez Springs
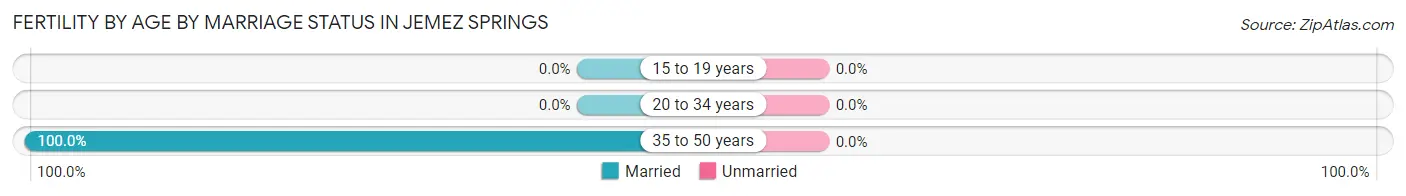
| Age Bracket | Married | Unmarried |
| 15 to 19 years | 0 (0.0%) | 0 (0.0%) |
| 20 to 34 years | 0 (0.0%) | 0 (0.0%) |
| 35 to 50 years | 4 (100.0%) | 0 (0.0%) |
| Total | 4 (100.0%) | 0 (0.0%) |
Fertility by Education in Jemez Springs
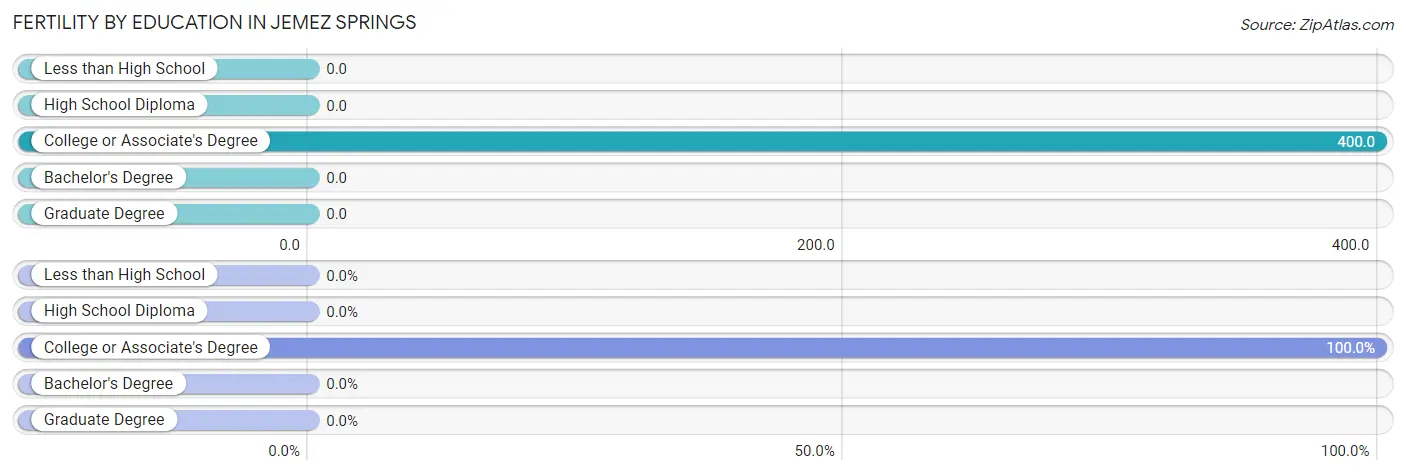
| Educational Attainment | Women with Births | Births / 1,000 Women |
| Less than High School | 0 (0.0%) | 0.0 |
| High School Diploma | 0 (0.0%) | 0.0 |
| College or Associate's Degree | 4 (100.0%) | 400.0 |
| Bachelor's Degree | 0 (0.0%) | 0.0 |
| Graduate Degree | 0 (0.0%) | 0.0 |
| Total | 4 (100.0%) | 105.0 |
Fertility by Education by Marriage Status in Jemez Springs
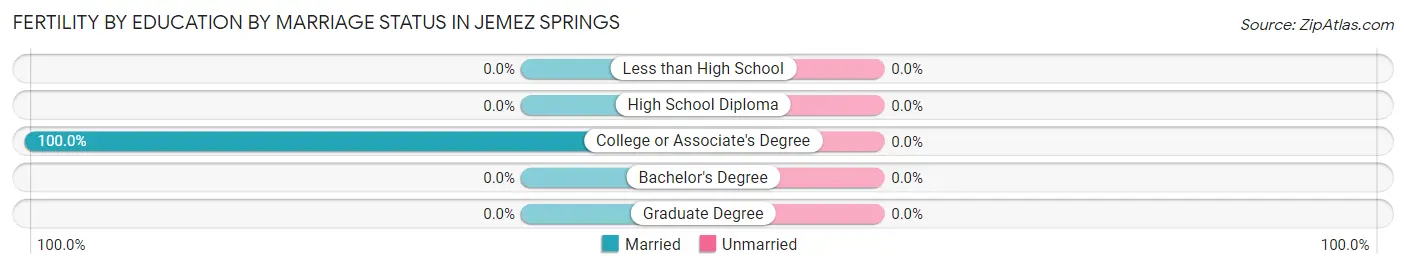
| Educational Attainment | Married | Unmarried |
| Less than High School | 0 (0.0%) | 0 (0.0%) |
| High School Diploma | 0 (0.0%) | 0 (0.0%) |
| College or Associate's Degree | 4 (100.0%) | 0 (0.0%) |
| Bachelor's Degree | 0 (0.0%) | 0 (0.0%) |
| Graduate Degree | 0 (0.0%) | 0 (0.0%) |
| Total | 4 (100.0%) | 0 (0.0%) |
Employment Characteristics in Jemez Springs
Employment by Class of Employer in Jemez Springs
Among the 170 employed individuals in Jemez Springs, private company employees (79 | 46.5%), federal government employees (35 | 20.6%), and self-employed (not incorporated) (30 | 17.6%) make up the most common classes of employment.
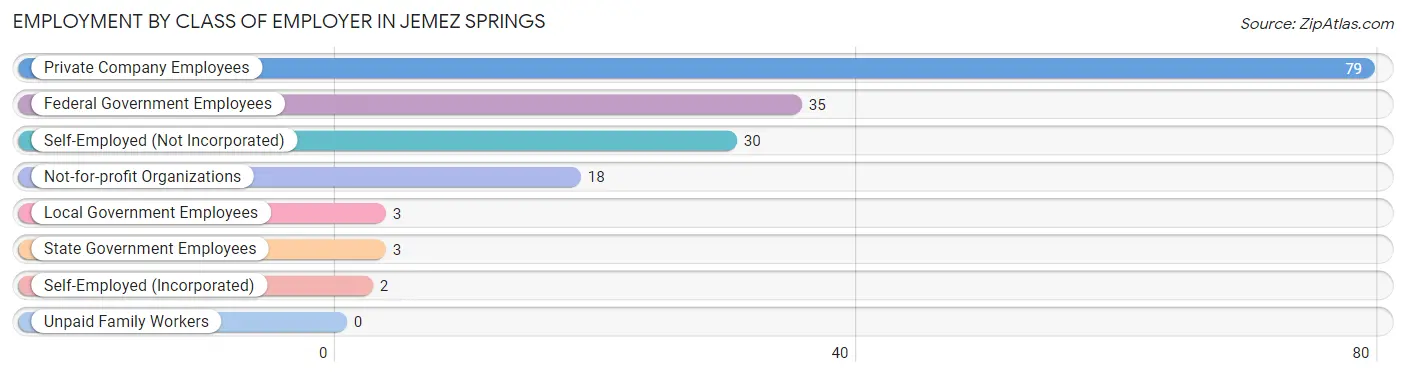
| Employer Class | # Employees | % Employees |
| Private Company Employees | 79 | 46.5% |
| Self-Employed (Incorporated) | 2 | 1.2% |
| Self-Employed (Not Incorporated) | 30 | 17.6% |
| Not-for-profit Organizations | 18 | 10.6% |
| Local Government Employees | 3 | 1.8% |
| State Government Employees | 3 | 1.8% |
| Federal Government Employees | 35 | 20.6% |
| Unpaid Family Workers | 0 | 0.0% |
| Total | 170 | 100.0% |
Employment Status by Age in Jemez Springs
According to the labor force statistics for Jemez Springs, out of the total population over 16 years of age (345), 55.7% or 192 individuals are in the labor force, with 11.5% or 22 of them unemployed. The age group with the highest labor force participation rate is 45 to 54 years, with 88.7% or 55 individuals in the labor force. Within the labor force, the 20 to 24 years age range has the highest percentage of unemployed individuals, with 73.9% or 17 of them being unemployed.
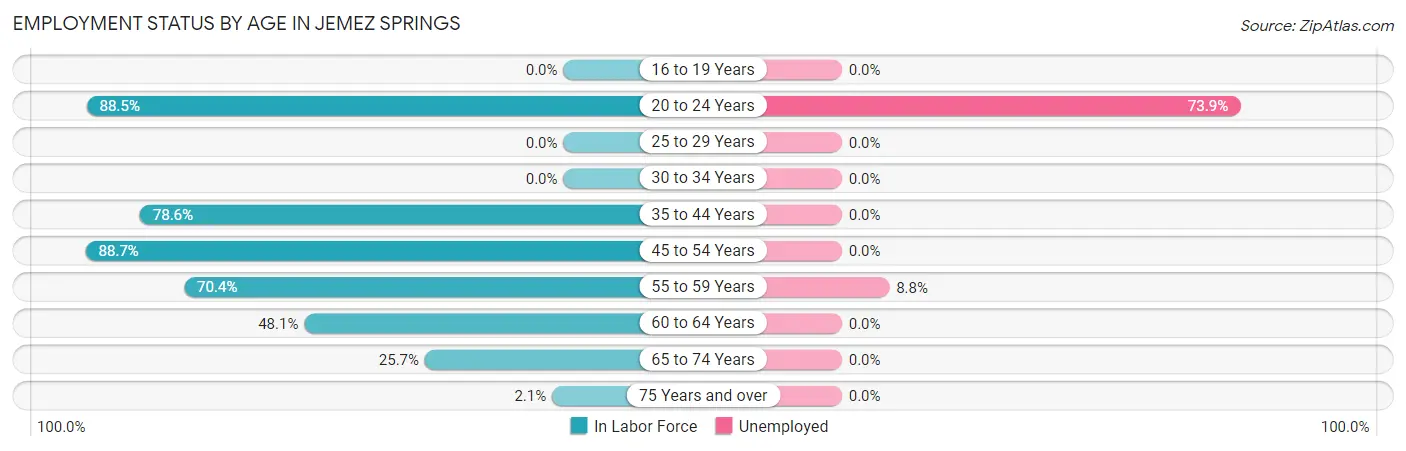
| Age Bracket | In Labor Force | Unemployed |
| 16 to 19 Years | 0 (0.0%) | 0 (0.0%) |
| 20 to 24 Years | 23 (88.5%) | 17 (73.9%) |
| 25 to 29 Years | 0 (0.0%) | 0 (0.0%) |
| 30 to 34 Years | 0 (0.0%) | 0 (0.0%) |
| 35 to 44 Years | 22 (78.6%) | 0 (0.0%) |
| 45 to 54 Years | 55 (88.7%) | 0 (0.0%) |
| 55 to 59 Years | 57 (70.4%) | 5 (8.8%) |
| 60 to 64 Years | 25 (48.1%) | 0 (0.0%) |
| 65 to 74 Years | 9 (25.7%) | 0 (0.0%) |
| 75 Years and over | 1 (2.1%) | 0 (0.0%) |
| Total | 192 (55.7%) | 22 (11.5%) |
Employment Status by Educational Attainment in Jemez Springs
According to labor force statistics for Jemez Springs, 70.4% of individuals (159) out of the total population between 25 and 64 years of age (226) are in the labor force, with 3.1% or 5 of them being unemployed. The group with the highest labor force participation rate are those with the educational attainment of less than high school, with 100.0% or 7 individuals in the labor force. Within the labor force, individuals with high school diploma education have the highest percentage of unemployment, with 15.2% or 5 of them being unemployed.
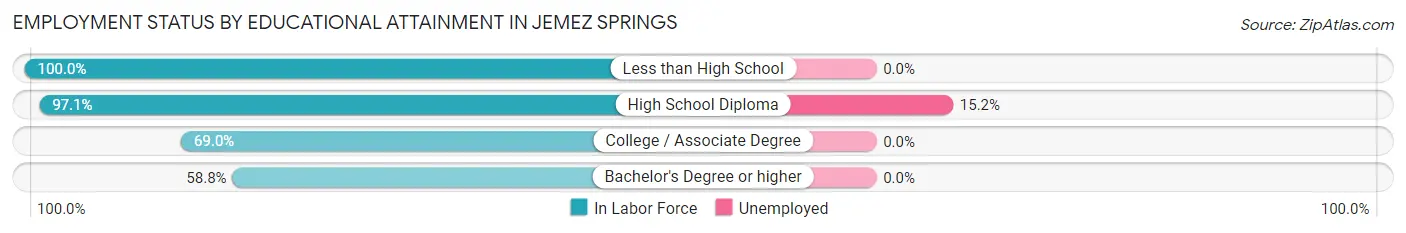
| Educational Attainment | In Labor Force | Unemployed |
| Less than High School | 7 (100.0%) | 0 (0.0%) |
| High School Diploma | 33 (97.1%) | 5 (15.2%) |
| College / Associate Degree | 69 (69.0%) | 0 (0.0%) |
| Bachelor's Degree or higher | 50 (58.8%) | 0 (0.0%) |
| Total | 159 (70.4%) | 7 (3.1%) |
Employment Occupations by Sex in Jemez Springs
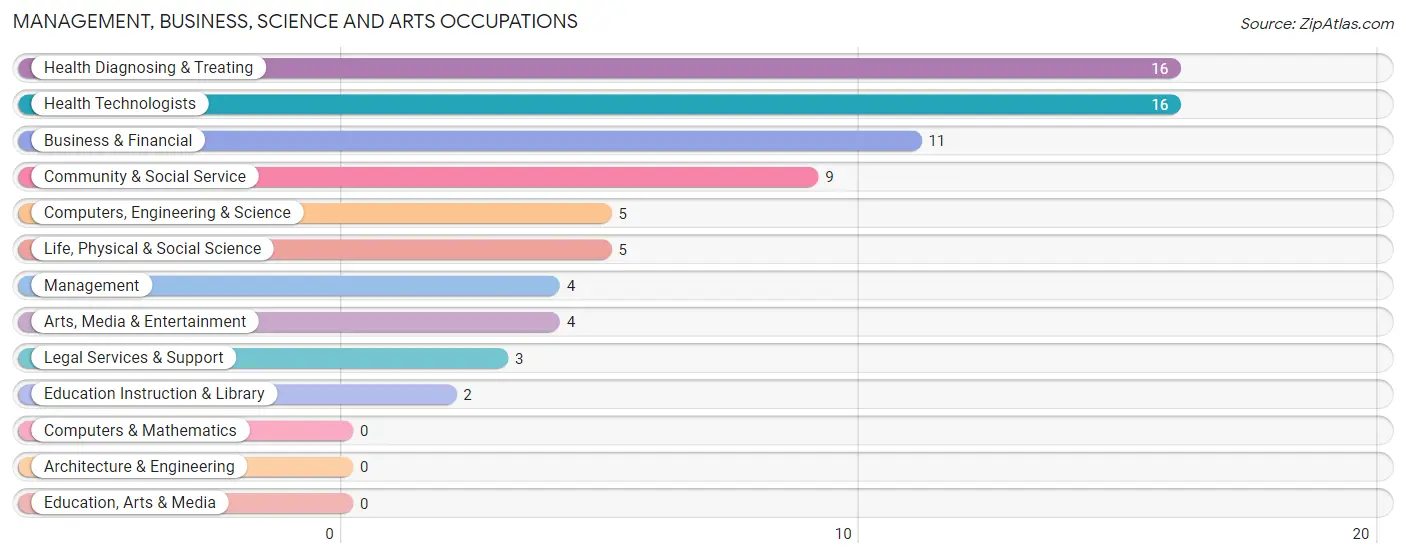
Management, Business, Science and Arts Occupations
The most common Management, Business, Science and Arts occupations in Jemez Springs are Health Diagnosing & Treating (16 | 9.4%), Health Technologists (16 | 9.4%), Business & Financial (11 | 6.5%), Community & Social Service (9 | 5.3%), and Computers, Engineering & Science (5 | 2.9%).
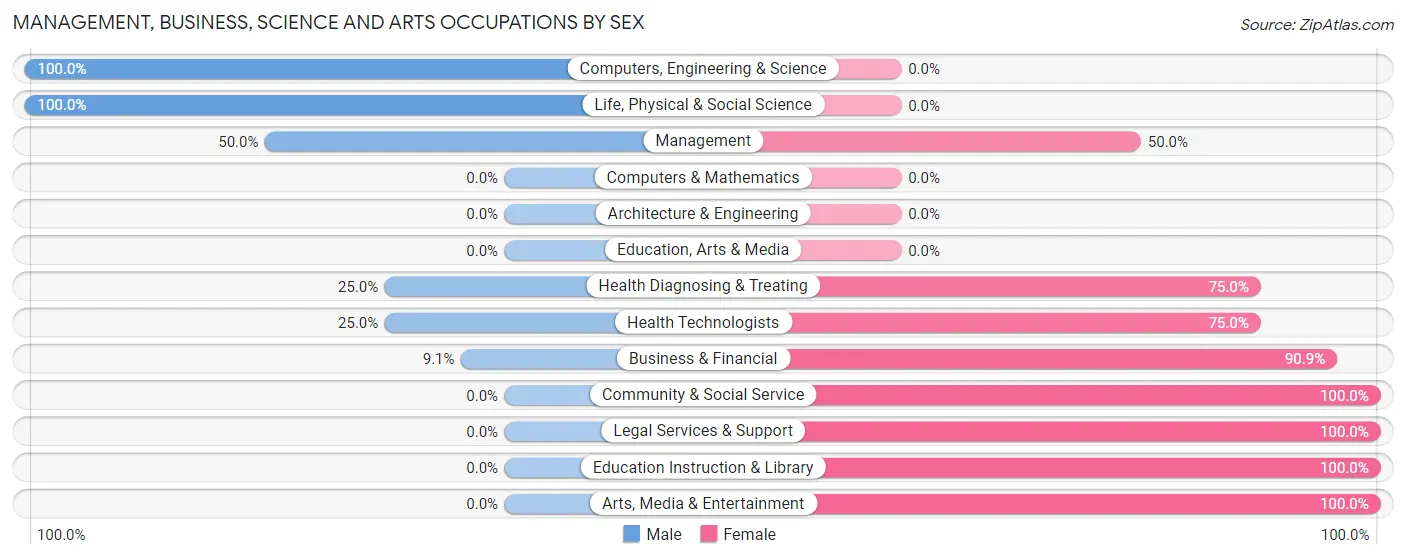
Management, Business, Science and Arts Occupations by Sex
Within the Management, Business, Science and Arts occupations in Jemez Springs, the most male-oriented occupations are Computers, Engineering & Science (100.0%), Life, Physical & Social Science (100.0%), and Management (50.0%), while the most female-oriented occupations are Community & Social Service (100.0%), Legal Services & Support (100.0%), and Education Instruction & Library (100.0%).
| Occupation | Male | Female |
| Management | 2 (50.0%) | 2 (50.0%) |
| Business & Financial | 1 (9.1%) | 10 (90.9%) |
| Computers, Engineering & Science | 5 (100.0%) | 0 (0.0%) |
| Computers & Mathematics | 0 (0.0%) | 0 (0.0%) |
| Architecture & Engineering | 0 (0.0%) | 0 (0.0%) |
| Life, Physical & Social Science | 5 (100.0%) | 0 (0.0%) |
| Community & Social Service | 0 (0.0%) | 9 (100.0%) |
| Education, Arts & Media | 0 (0.0%) | 0 (0.0%) |
| Legal Services & Support | 0 (0.0%) | 3 (100.0%) |
| Education Instruction & Library | 0 (0.0%) | 2 (100.0%) |
| Arts, Media & Entertainment | 0 (0.0%) | 4 (100.0%) |
| Health Diagnosing & Treating | 4 (25.0%) | 12 (75.0%) |
| Health Technologists | 4 (25.0%) | 12 (75.0%) |
| Total (Category) | 12 (26.7%) | 33 (73.3%) |
| Total (Overall) | 64 (37.7%) | 106 (62.4%) |
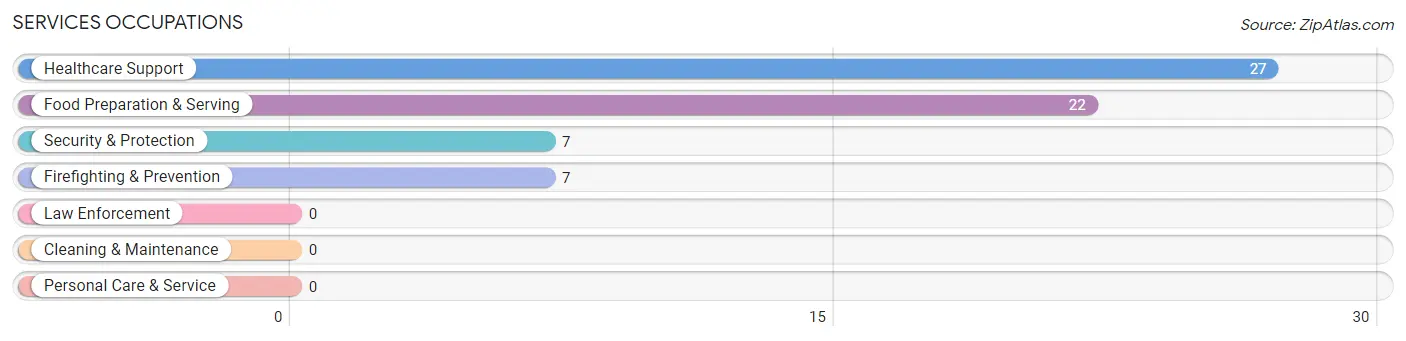
Services Occupations
The most common Services occupations in Jemez Springs are Healthcare Support (27 | 15.9%), Food Preparation & Serving (22 | 12.9%), Security & Protection (7 | 4.1%), and Firefighting & Prevention (7 | 4.1%).
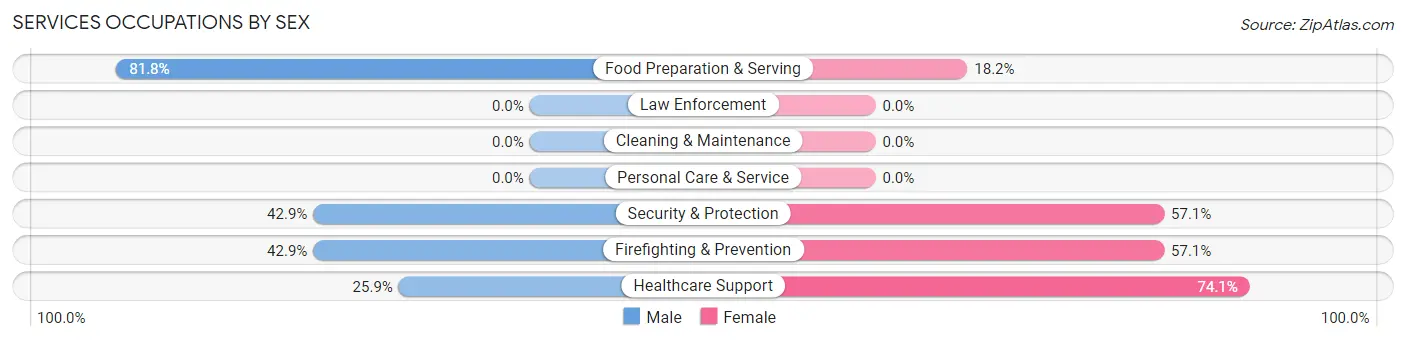
Services Occupations by Sex
Within the Services occupations in Jemez Springs, the most male-oriented occupations are Food Preparation & Serving (81.8%), Security & Protection (42.9%), and Firefighting & Prevention (42.9%), while the most female-oriented occupations are Healthcare Support (74.1%), Security & Protection (57.1%), and Firefighting & Prevention (57.1%).
| Occupation | Male | Female |
| Healthcare Support | 7 (25.9%) | 20 (74.1%) |
| Security & Protection | 3 (42.9%) | 4 (57.1%) |
| Firefighting & Prevention | 3 (42.9%) | 4 (57.1%) |
| Law Enforcement | 0 (0.0%) | 0 (0.0%) |
| Food Preparation & Serving | 18 (81.8%) | 4 (18.2%) |
| Cleaning & Maintenance | 0 (0.0%) | 0 (0.0%) |
| Personal Care & Service | 0 (0.0%) | 0 (0.0%) |
| Total (Category) | 28 (50.0%) | 28 (50.0%) |
| Total (Overall) | 64 (37.7%) | 106 (62.4%) |
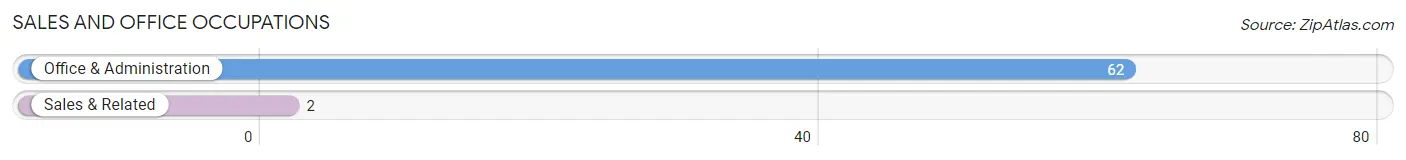
Sales and Office Occupations
The most common Sales and Office occupations in Jemez Springs are Office & Administration (62 | 36.5%), and Sales & Related (2 | 1.2%).
Sales and Office Occupations by Sex
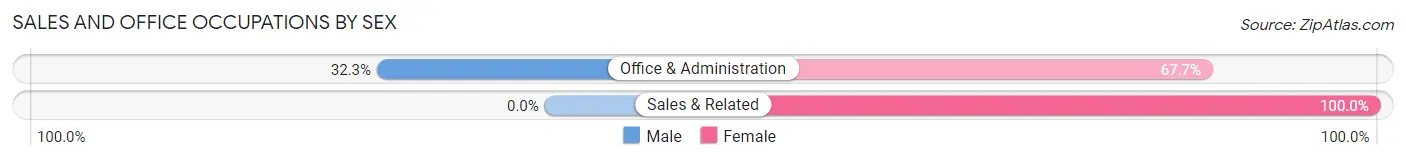
| Occupation | Male | Female |
| Sales & Related | 0 (0.0%) | 2 (100.0%) |
| Office & Administration | 20 (32.3%) | 42 (67.7%) |
| Total (Category) | 20 (31.2%) | 44 (68.8%) |
| Total (Overall) | 64 (37.7%) | 106 (62.4%) |
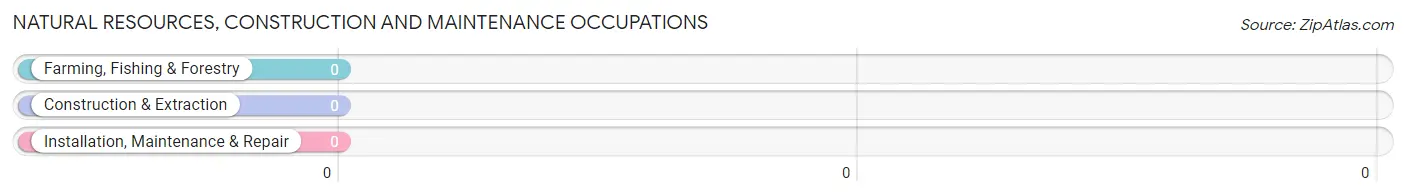
Natural Resources, Construction and Maintenance Occupations
Natural Resources, Construction and Maintenance Occupations by Sex
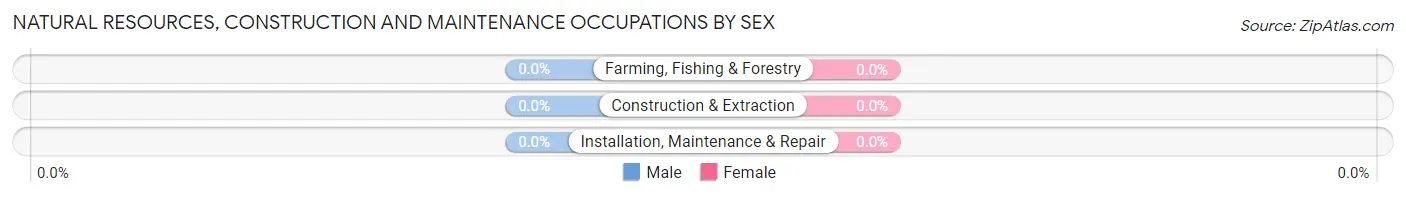
| Occupation | Male | Female |
| Farming, Fishing & Forestry | 0 (0.0%) | 0 (0.0%) |
| Construction & Extraction | 0 (0.0%) | 0 (0.0%) |
| Installation, Maintenance & Repair | 0 (0.0%) | 0 (0.0%) |
| Total (Category) | 0 (0.0%) | 0 (0.0%) |
| Total (Overall) | 64 (37.7%) | 106 (62.4%) |
Production, Transportation and Moving Occupations
The most common Production, Transportation and Moving occupations in Jemez Springs are , and Production (5 | 2.9%).
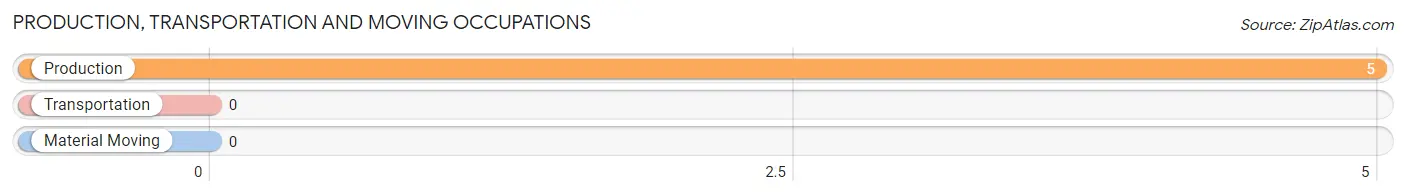
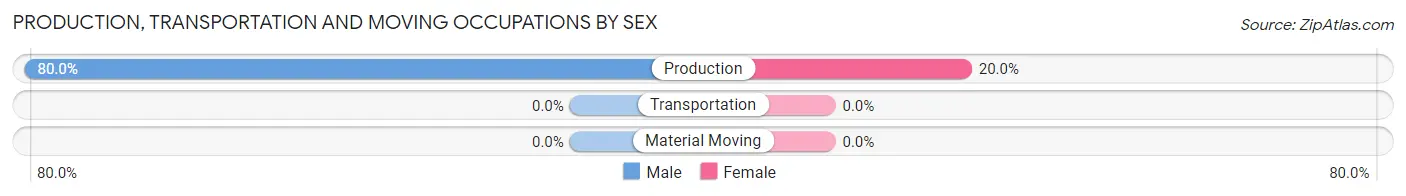
Production, Transportation and Moving Occupations by Sex
| Occupation | Male | Female |
| Production | 4 (80.0%) | 1 (20.0%) |
| Transportation | 0 (0.0%) | 0 (0.0%) |
| Material Moving | 0 (0.0%) | 0 (0.0%) |
| Total (Category) | 4 (80.0%) | 1 (20.0%) |
| Total (Overall) | 64 (37.7%) | 106 (62.4%) |
Employment Industries by Sex in Jemez Springs
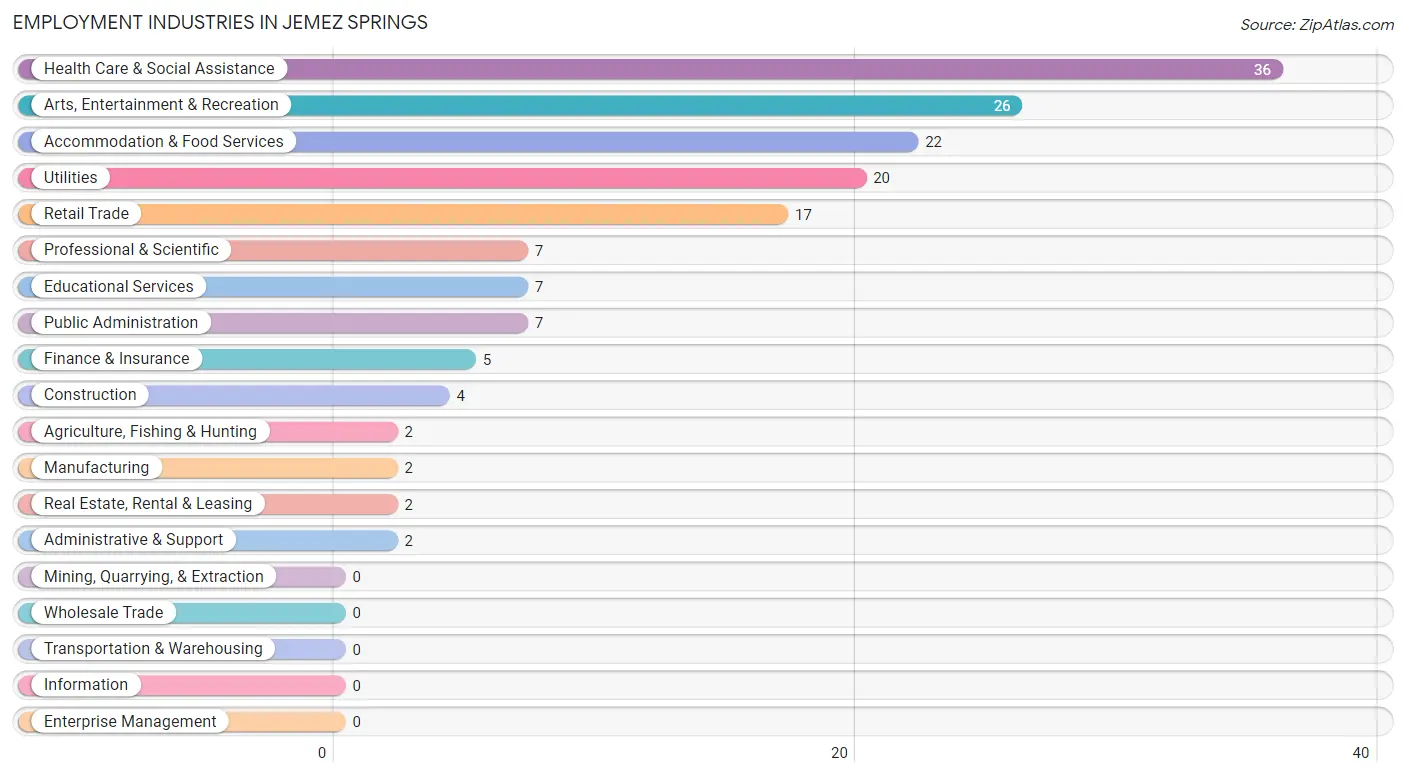
Employment Industries in Jemez Springs
The major employment industries in Jemez Springs include Health Care & Social Assistance (36 | 21.2%), Arts, Entertainment & Recreation (26 | 15.3%), Accommodation & Food Services (22 | 12.9%), Utilities (20 | 11.8%), and Retail Trade (17 | 10.0%).
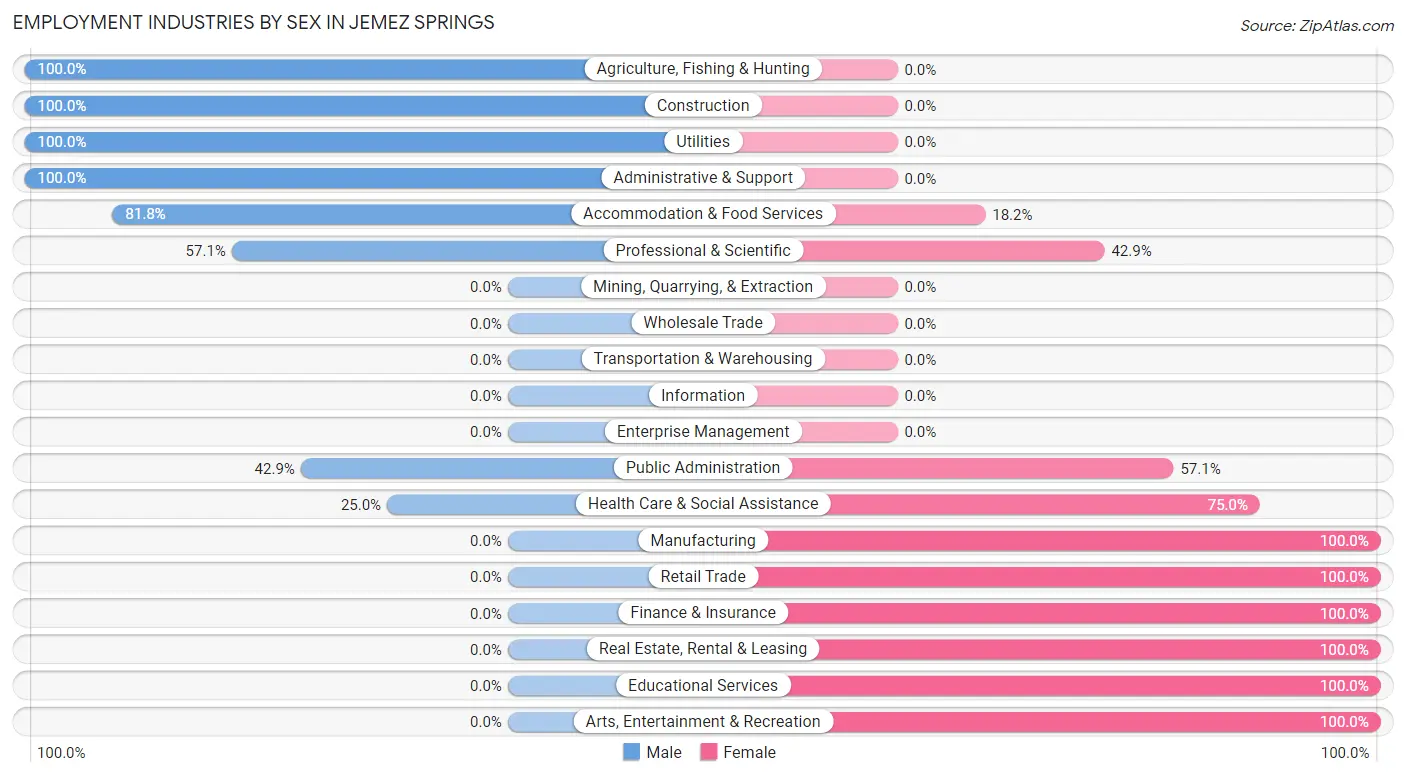
Employment Industries by Sex in Jemez Springs
The Jemez Springs industries that see more men than women are Agriculture, Fishing & Hunting (100.0%), Construction (100.0%), and Utilities (100.0%), whereas the industries that tend to have a higher number of women are Manufacturing (100.0%), Retail Trade (100.0%), and Finance & Insurance (100.0%).
| Industry | Male | Female |
| Agriculture, Fishing & Hunting | 2 (100.0%) | 0 (0.0%) |
| Mining, Quarrying, & Extraction | 0 (0.0%) | 0 (0.0%) |
| Construction | 4 (100.0%) | 0 (0.0%) |
| Manufacturing | 0 (0.0%) | 2 (100.0%) |
| Wholesale Trade | 0 (0.0%) | 0 (0.0%) |
| Retail Trade | 0 (0.0%) | 17 (100.0%) |
| Transportation & Warehousing | 0 (0.0%) | 0 (0.0%) |
| Utilities | 20 (100.0%) | 0 (0.0%) |
| Information | 0 (0.0%) | 0 (0.0%) |
| Finance & Insurance | 0 (0.0%) | 5 (100.0%) |
| Real Estate, Rental & Leasing | 0 (0.0%) | 2 (100.0%) |
| Professional & Scientific | 4 (57.1%) | 3 (42.9%) |
| Enterprise Management | 0 (0.0%) | 0 (0.0%) |
| Administrative & Support | 2 (100.0%) | 0 (0.0%) |
| Educational Services | 0 (0.0%) | 7 (100.0%) |
| Health Care & Social Assistance | 9 (25.0%) | 27 (75.0%) |
| Arts, Entertainment & Recreation | 0 (0.0%) | 26 (100.0%) |
| Accommodation & Food Services | 18 (81.8%) | 4 (18.2%) |
| Public Administration | 3 (42.9%) | 4 (57.1%) |
| Total | 64 (37.7%) | 106 (62.4%) |
Education in Jemez Springs
School Enrollment in Jemez Springs
The most common levels of schooling among the 14 students in Jemez Springs are high school (11 | 78.6%), college / undergraduate (2 | 14.3%), and middle school (1 | 7.1%).
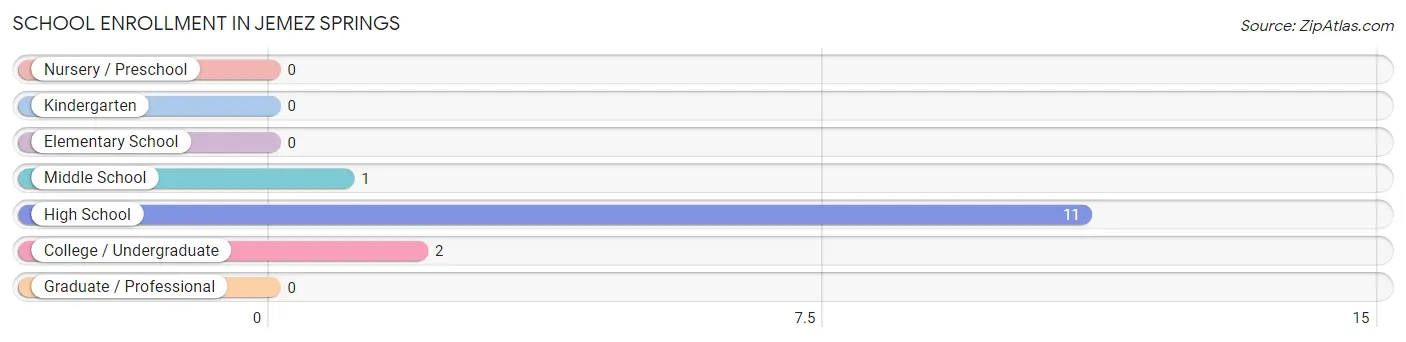
| School Level | # Students | % Students |
| Nursery / Preschool | 0 | 0.0% |
| Kindergarten | 0 | 0.0% |
| Elementary School | 0 | 0.0% |
| Middle School | 1 | 7.1% |
| High School | 11 | 78.6% |
| College / Undergraduate | 2 | 14.3% |
| Graduate / Professional | 0 | 0.0% |
| Total | 14 | 100.0% |
School Enrollment by Age by Funding Source in Jemez Springs
Out of a total of 14 students who are enrolled in schools in Jemez Springs, 4 (28.6%) attend a private institution, while the remaining 10 (71.4%) are enrolled in public schools. The age group of 10 to 14 year olds has the highest likelihood of being enrolled in private schools, with 1 (100.0% in the age bracket) enrolled. Conversely, the age group of 35 years and over has the lowest likelihood of being enrolled in a private school, with 2 (100.0% in the age bracket) attending a public institution.
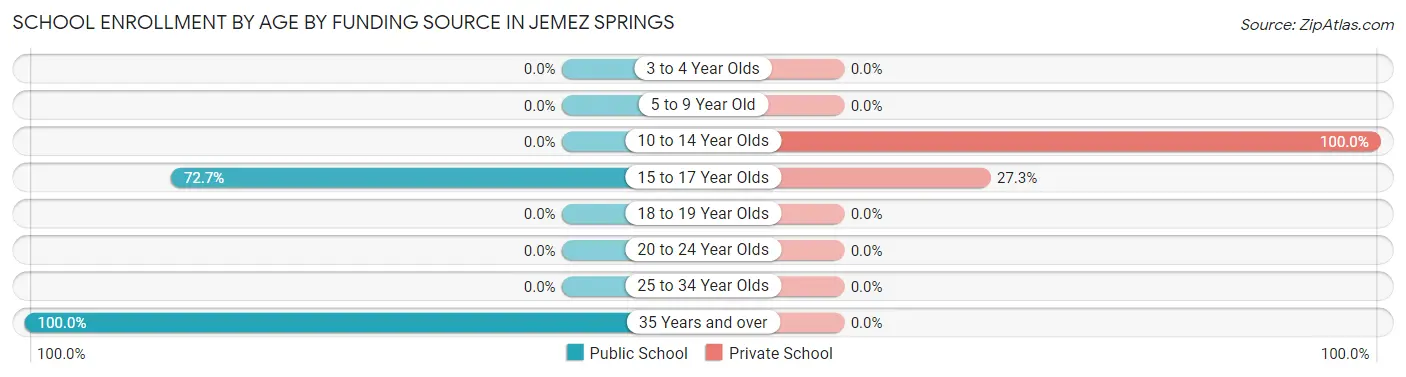
| Age Bracket | Public School | Private School |
| 3 to 4 Year Olds | 0 (0.0%) | 0 (0.0%) |
| 5 to 9 Year Old | 0 (0.0%) | 0 (0.0%) |
| 10 to 14 Year Olds | 0 (0.0%) | 1 (100.0%) |
| 15 to 17 Year Olds | 8 (72.7%) | 3 (27.3%) |
| 18 to 19 Year Olds | 0 (0.0%) | 0 (0.0%) |
| 20 to 24 Year Olds | 0 (0.0%) | 0 (0.0%) |
| 25 to 34 Year Olds | 0 (0.0%) | 0 (0.0%) |
| 35 Years and over | 2 (100.0%) | 0 (0.0%) |
| Total | 10 (71.4%) | 4 (28.6%) |
Educational Attainment by Field of Study in Jemez Springs
Liberal arts & history (30 | 21.3%), education (28 | 19.9%), literature & languages (19 | 13.5%), science & technology (15 | 10.6%), and bio, nature & agricultural (14 | 9.9%) are the most common fields of study among 141 individuals in Jemez Springs who have obtained a bachelor's degree or higher.
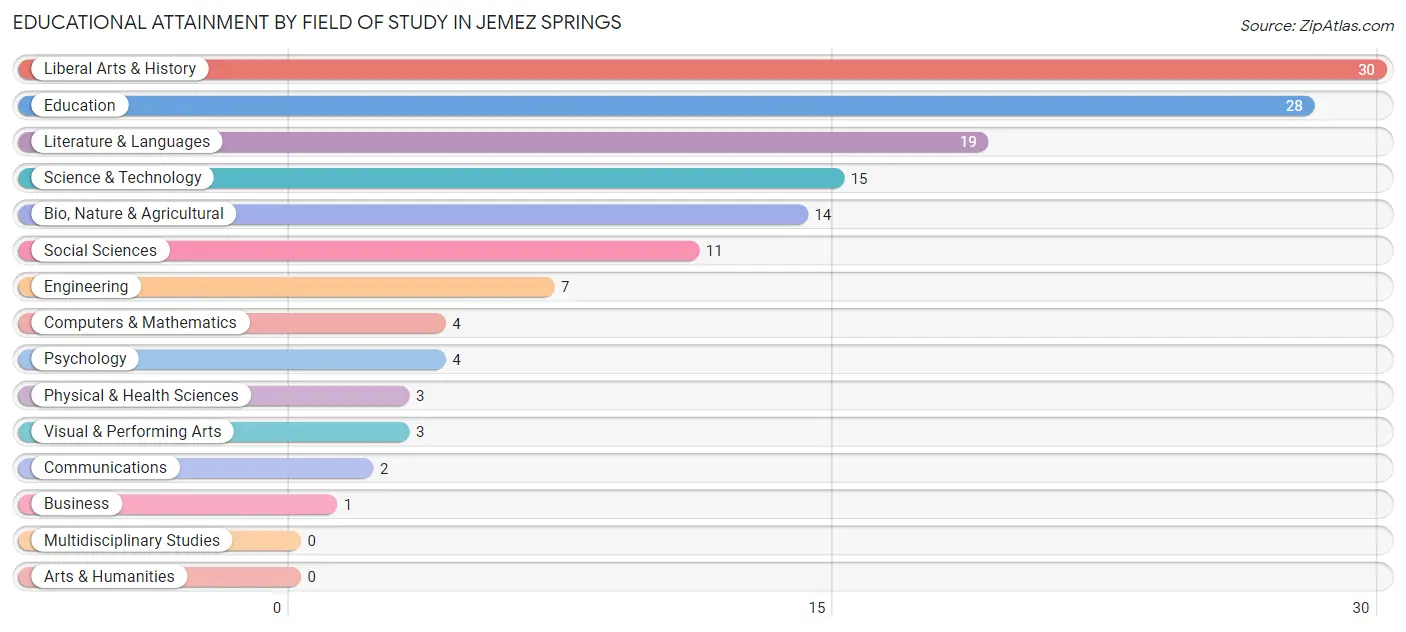
| Field of Study | # Graduates | % Graduates |
| Computers & Mathematics | 4 | 2.8% |
| Bio, Nature & Agricultural | 14 | 9.9% |
| Physical & Health Sciences | 3 | 2.1% |
| Psychology | 4 | 2.8% |
| Social Sciences | 11 | 7.8% |
| Engineering | 7 | 5.0% |
| Multidisciplinary Studies | 0 | 0.0% |
| Science & Technology | 15 | 10.6% |
| Business | 1 | 0.7% |
| Education | 28 | 19.9% |
| Literature & Languages | 19 | 13.5% |
| Liberal Arts & History | 30 | 21.3% |
| Visual & Performing Arts | 3 | 2.1% |
| Communications | 2 | 1.4% |
| Arts & Humanities | 0 | 0.0% |
| Total | 141 | 100.0% |
Transportation & Commute in Jemez Springs
Vehicle Availability by Sex in Jemez Springs
The most prevalent vehicle ownership categories in Jemez Springs are males with 5 or more vehicles (23, accounting for 35.9%) and females with 5 or more vehicles (30, making up 22.3%).
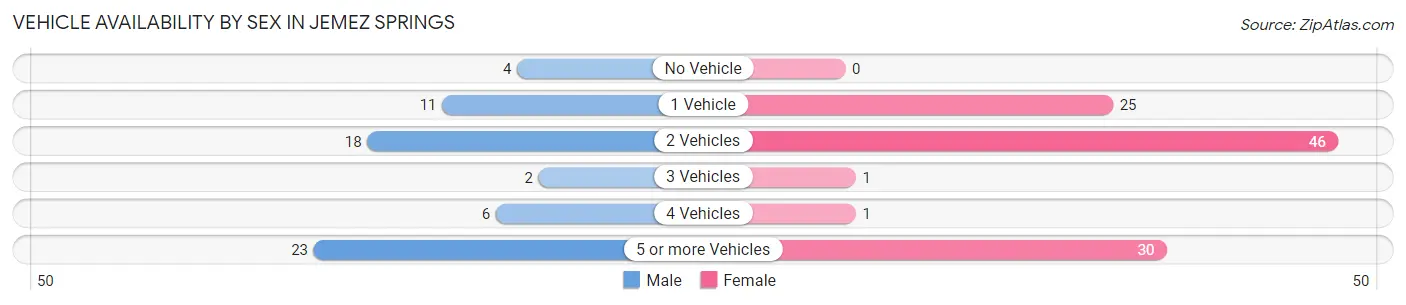
| Vehicles Available | Male | Female |
| No Vehicle | 4 (6.2%) | 0 (0.0%) |
| 1 Vehicle | 11 (17.2%) | 25 (24.3%) |
| 2 Vehicles | 18 (28.1%) | 46 (44.7%) |
| 3 Vehicles | 2 (3.1%) | 1 (1.0%) |
| 4 Vehicles | 6 (9.4%) | 1 (1.0%) |
| 5 or more Vehicles | 23 (35.9%) | 30 (29.1%) |
| Total | 64 (100.0%) | 103 (100.0%) |
Commute Time in Jemez Springs
The most frequently occuring commute durations in Jemez Springs are less than 5 minutes (45 commuters, 43.3%), 5 to 9 minutes (22 commuters, 21.1%), and 60 to 89 minutes (17 commuters, 16.4%).
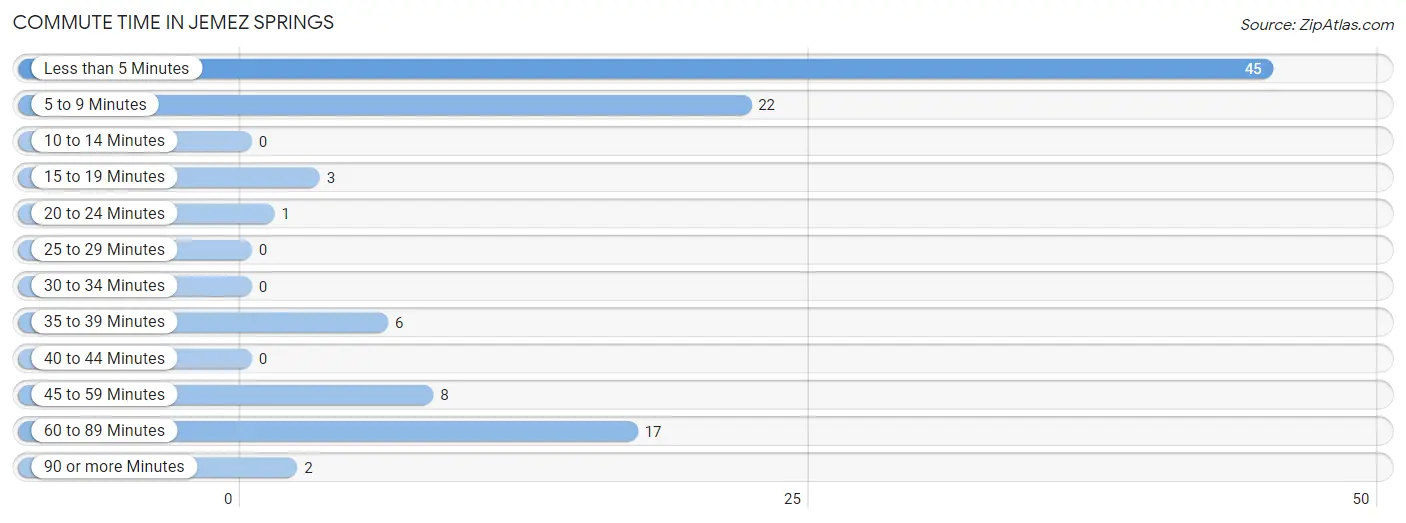
| Commute Time | # Commuters | % Commuters |
| Less than 5 Minutes | 45 | 43.3% |
| 5 to 9 Minutes | 22 | 21.1% |
| 10 to 14 Minutes | 0 | 0.0% |
| 15 to 19 Minutes | 3 | 2.9% |
| 20 to 24 Minutes | 1 | 1.0% |
| 25 to 29 Minutes | 0 | 0.0% |
| 30 to 34 Minutes | 0 | 0.0% |
| 35 to 39 Minutes | 6 | 5.8% |
| 40 to 44 Minutes | 0 | 0.0% |
| 45 to 59 Minutes | 8 | 7.7% |
| 60 to 89 Minutes | 17 | 16.4% |
| 90 or more Minutes | 2 | 1.9% |
Commute Time by Sex in Jemez Springs
The most common commute times in Jemez Springs are less than 5 minutes (20 commuters, 37.0%) for males and less than 5 minutes (25 commuters, 50.0%) for females.
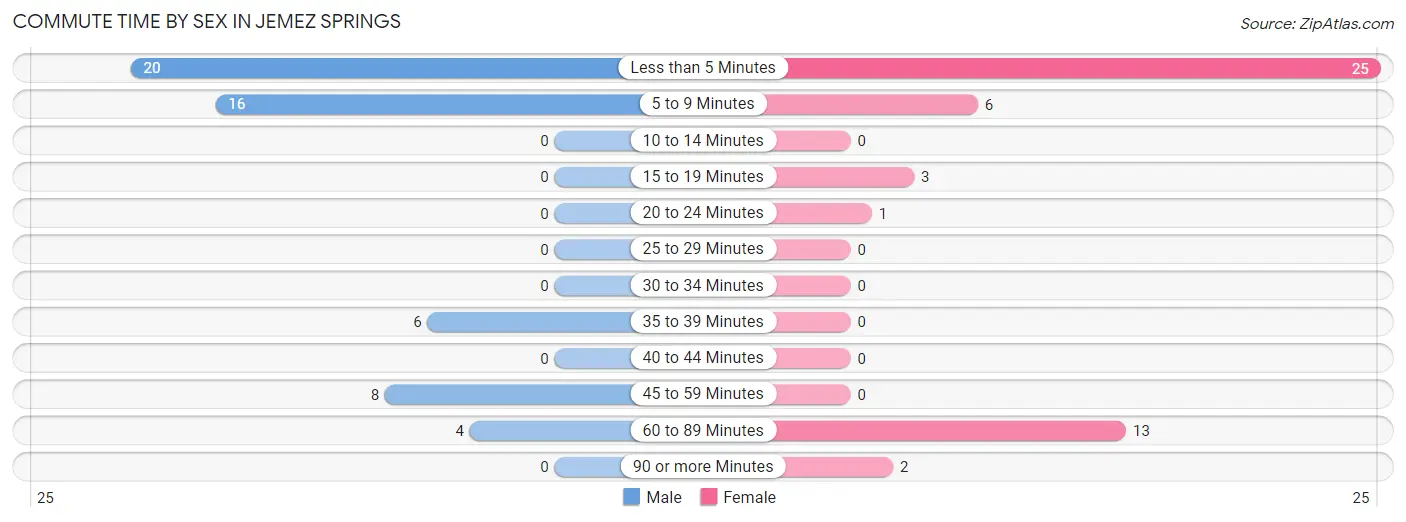
| Commute Time | Male | Female |
| Less than 5 Minutes | 20 (37.0%) | 25 (50.0%) |
| 5 to 9 Minutes | 16 (29.6%) | 6 (12.0%) |
| 10 to 14 Minutes | 0 (0.0%) | 0 (0.0%) |
| 15 to 19 Minutes | 0 (0.0%) | 3 (6.0%) |
| 20 to 24 Minutes | 0 (0.0%) | 1 (2.0%) |
| 25 to 29 Minutes | 0 (0.0%) | 0 (0.0%) |
| 30 to 34 Minutes | 0 (0.0%) | 0 (0.0%) |
| 35 to 39 Minutes | 6 (11.1%) | 0 (0.0%) |
| 40 to 44 Minutes | 0 (0.0%) | 0 (0.0%) |
| 45 to 59 Minutes | 8 (14.8%) | 0 (0.0%) |
| 60 to 89 Minutes | 4 (7.4%) | 13 (26.0%) |
| 90 or more Minutes | 0 (0.0%) | 2 (4.0%) |
Time of Departure to Work by Sex in Jemez Springs
The most frequent times of departure to work in Jemez Springs are 6:30 AM to 6:59 AM (20, 37.0%) for males and 9:00 AM to 9:59 AM (20, 40.0%) for females.
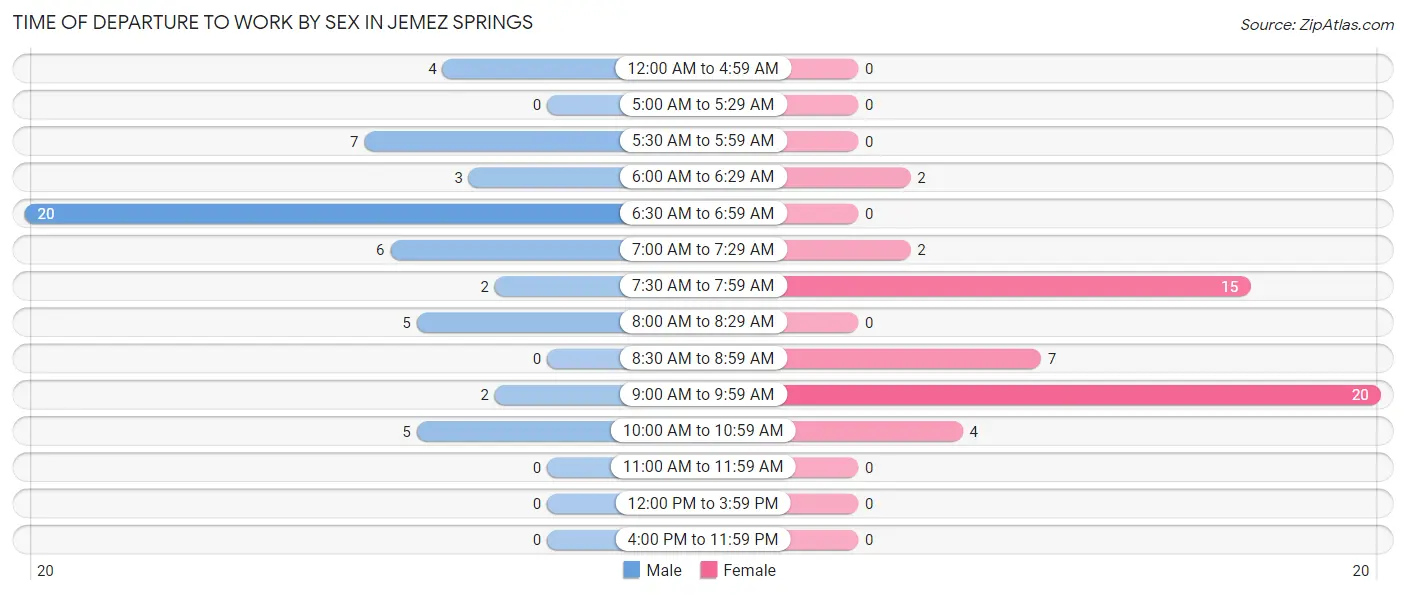
| Time of Departure | Male | Female |
| 12:00 AM to 4:59 AM | 4 (7.4%) | 0 (0.0%) |
| 5:00 AM to 5:29 AM | 0 (0.0%) | 0 (0.0%) |
| 5:30 AM to 5:59 AM | 7 (13.0%) | 0 (0.0%) |
| 6:00 AM to 6:29 AM | 3 (5.6%) | 2 (4.0%) |
| 6:30 AM to 6:59 AM | 20 (37.0%) | 0 (0.0%) |
| 7:00 AM to 7:29 AM | 6 (11.1%) | 2 (4.0%) |
| 7:30 AM to 7:59 AM | 2 (3.7%) | 15 (30.0%) |
| 8:00 AM to 8:29 AM | 5 (9.3%) | 0 (0.0%) |
| 8:30 AM to 8:59 AM | 0 (0.0%) | 7 (14.0%) |
| 9:00 AM to 9:59 AM | 2 (3.7%) | 20 (40.0%) |
| 10:00 AM to 10:59 AM | 5 (9.3%) | 4 (8.0%) |
| 11:00 AM to 11:59 AM | 0 (0.0%) | 0 (0.0%) |
| 12:00 PM to 3:59 PM | 0 (0.0%) | 0 (0.0%) |
| 4:00 PM to 11:59 PM | 0 (0.0%) | 0 (0.0%) |
| Total | 54 (100.0%) | 50 (100.0%) |
Housing Occupancy in Jemez Springs
Occupancy by Ownership in Jemez Springs
Of the total 151 dwellings in Jemez Springs, owner-occupied units account for 140 (92.7%), while renter-occupied units make up 11 (7.3%).
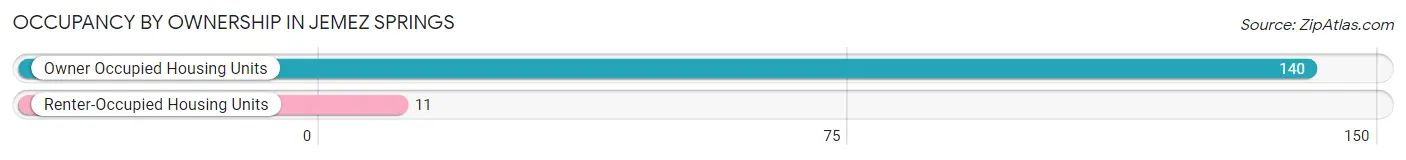
| Occupancy | # Housing Units | % Housing Units |
| Owner Occupied Housing Units | 140 | 92.7% |
| Renter-Occupied Housing Units | 11 | 7.3% |
| Total Occupied Housing Units | 151 | 100.0% |
Occupancy by Household Size in Jemez Springs
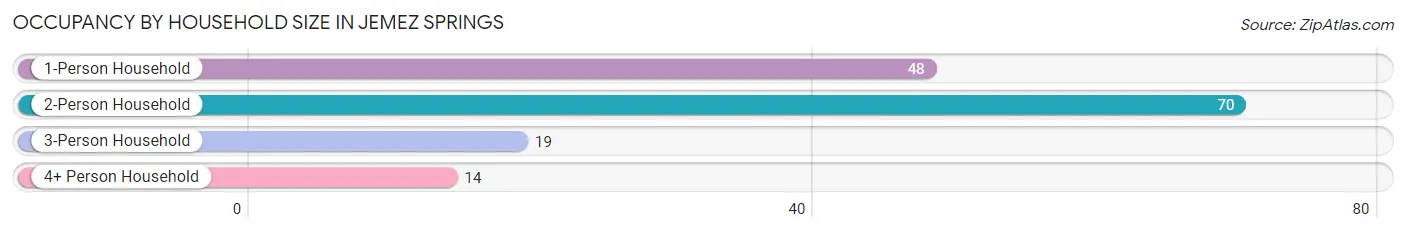
| Household Size | # Housing Units | % Housing Units |
| 1-Person Household | 48 | 31.8% |
| 2-Person Household | 70 | 46.4% |
| 3-Person Household | 19 | 12.6% |
| 4+ Person Household | 14 | 9.3% |
| Total Housing Units | 151 | 100.0% |
Occupancy by Ownership by Household Size in Jemez Springs
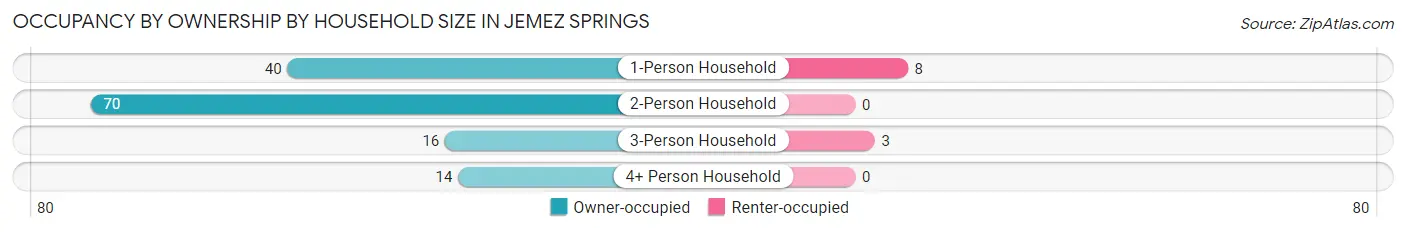
| Household Size | Owner-occupied | Renter-occupied |
| 1-Person Household | 40 (83.3%) | 8 (16.7%) |
| 2-Person Household | 70 (100.0%) | 0 (0.0%) |
| 3-Person Household | 16 (84.2%) | 3 (15.8%) |
| 4+ Person Household | 14 (100.0%) | 0 (0.0%) |
| Total Housing Units | 140 (92.7%) | 11 (7.3%) |
Occupancy by Educational Attainment in Jemez Springs

| Household Size | Owner-occupied | Renter-occupied |
| Less than High School | 0 (0.0%) | 2 (100.0%) |
| High School Diploma | 49 (94.2%) | 3 (5.8%) |
| College/Associate Degree | 30 (83.3%) | 6 (16.7%) |
| Bachelor's Degree or higher | 61 (100.0%) | 0 (0.0%) |
Occupancy by Age of Householder in Jemez Springs
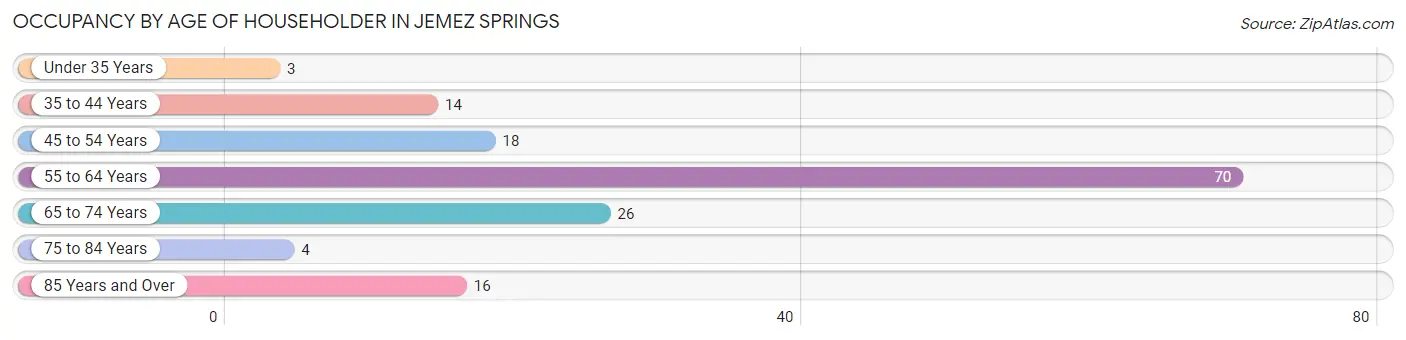
| Age Bracket | # Households | % Households |
| Under 35 Years | 3 | 2.0% |
| 35 to 44 Years | 14 | 9.3% |
| 45 to 54 Years | 18 | 11.9% |
| 55 to 64 Years | 70 | 46.4% |
| 65 to 74 Years | 26 | 17.2% |
| 75 to 84 Years | 4 | 2.6% |
| 85 Years and Over | 16 | 10.6% |
| Total | 151 | 100.0% |
Housing Finances in Jemez Springs
Median Income by Occupancy in Jemez Springs
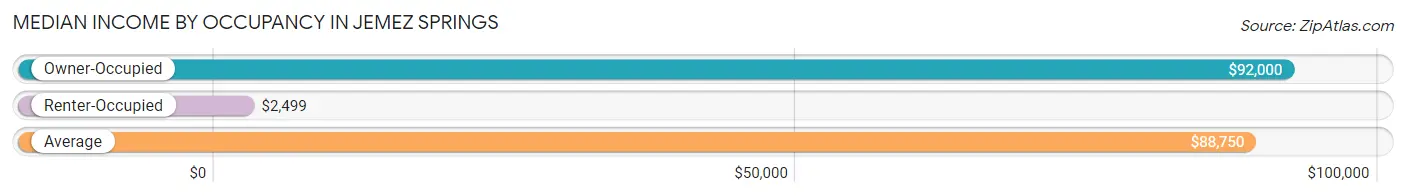
| Occupancy Type | # Households | Median Income |
| Owner-Occupied | 140 (92.7%) | $92,000 |
| Renter-Occupied | 11 (7.3%) | $2,499 |
| Average | 151 (100.0%) | $88,750 |
Occupancy by Householder Income Bracket in Jemez Springs
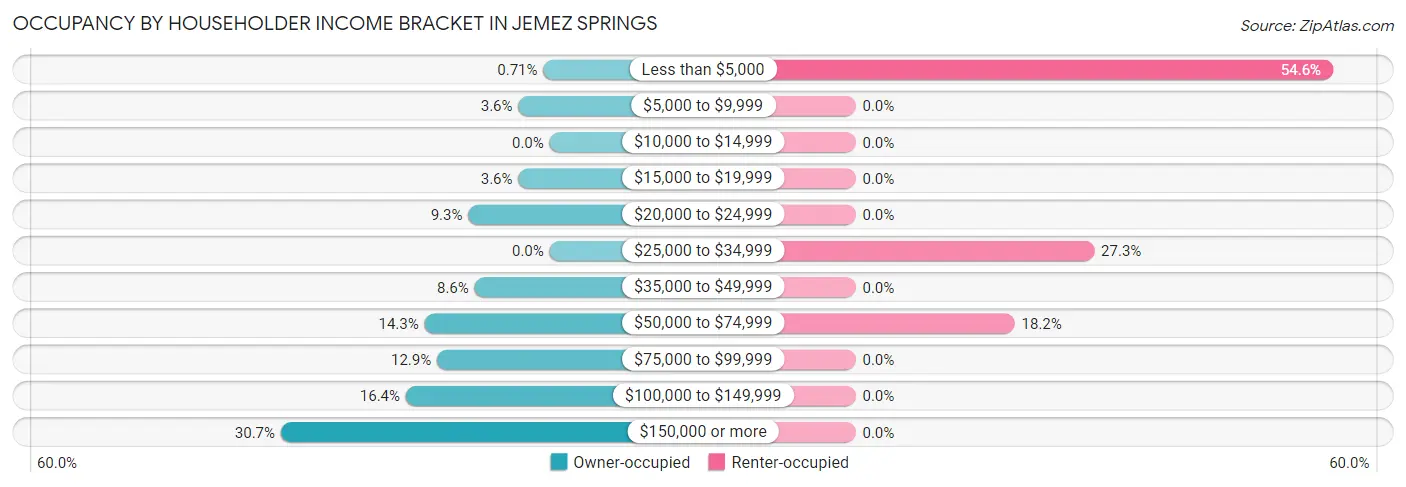
| Income Bracket | Owner-occupied | Renter-occupied |
| Less than $5,000 | 1 (0.7%) | 6 (54.5%) |
| $5,000 to $9,999 | 5 (3.6%) | 0 (0.0%) |
| $10,000 to $14,999 | 0 (0.0%) | 0 (0.0%) |
| $15,000 to $19,999 | 5 (3.6%) | 0 (0.0%) |
| $20,000 to $24,999 | 13 (9.3%) | 0 (0.0%) |
| $25,000 to $34,999 | 0 (0.0%) | 3 (27.3%) |
| $35,000 to $49,999 | 12 (8.6%) | 0 (0.0%) |
| $50,000 to $74,999 | 20 (14.3%) | 2 (18.2%) |
| $75,000 to $99,999 | 18 (12.9%) | 0 (0.0%) |
| $100,000 to $149,999 | 23 (16.4%) | 0 (0.0%) |
| $150,000 or more | 43 (30.7%) | 0 (0.0%) |
| Total | 140 (100.0%) | 11 (100.0%) |
Monthly Housing Cost Tiers in Jemez Springs
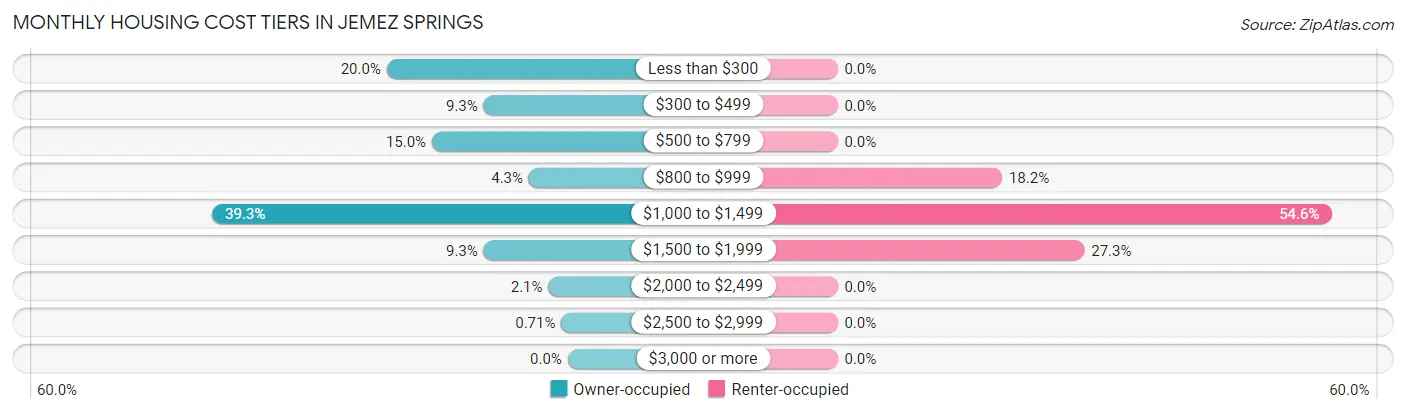
| Monthly Cost | Owner-occupied | Renter-occupied |
| Less than $300 | 28 (20.0%) | 0 (0.0%) |
| $300 to $499 | 13 (9.3%) | 0 (0.0%) |
| $500 to $799 | 21 (15.0%) | 0 (0.0%) |
| $800 to $999 | 6 (4.3%) | 2 (18.2%) |
| $1,000 to $1,499 | 55 (39.3%) | 6 (54.5%) |
| $1,500 to $1,999 | 13 (9.3%) | 3 (27.3%) |
| $2,000 to $2,499 | 3 (2.1%) | 0 (0.0%) |
| $2,500 to $2,999 | 1 (0.7%) | 0 (0.0%) |
| $3,000 or more | 0 (0.0%) | 0 (0.0%) |
| Total | 140 (100.0%) | 11 (100.0%) |
Physical Housing Characteristics in Jemez Springs
Housing Structures in Jemez Springs
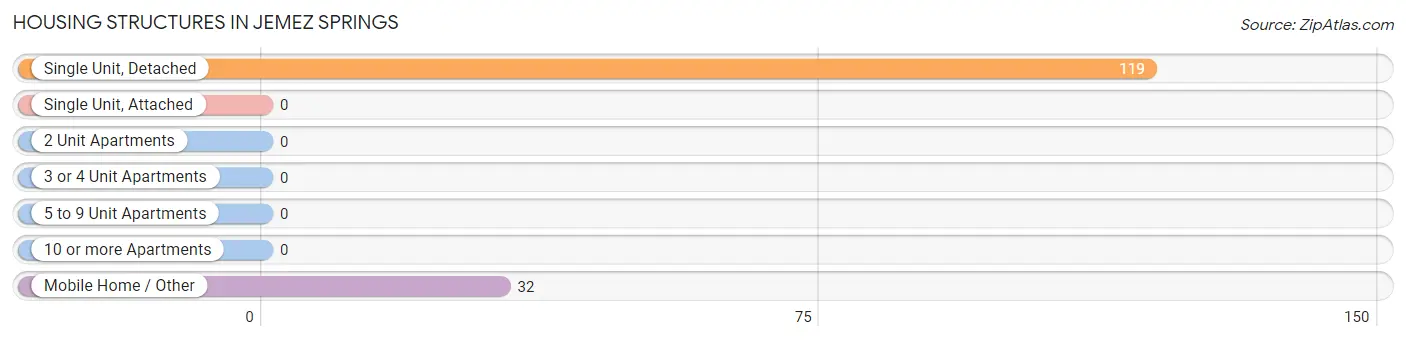
| Structure Type | # Housing Units | % Housing Units |
| Single Unit, Detached | 119 | 78.8% |
| Single Unit, Attached | 0 | 0.0% |
| 2 Unit Apartments | 0 | 0.0% |
| 3 or 4 Unit Apartments | 0 | 0.0% |
| 5 to 9 Unit Apartments | 0 | 0.0% |
| 10 or more Apartments | 0 | 0.0% |
| Mobile Home / Other | 32 | 21.2% |
| Total | 151 | 100.0% |
Housing Structures by Occupancy in Jemez Springs
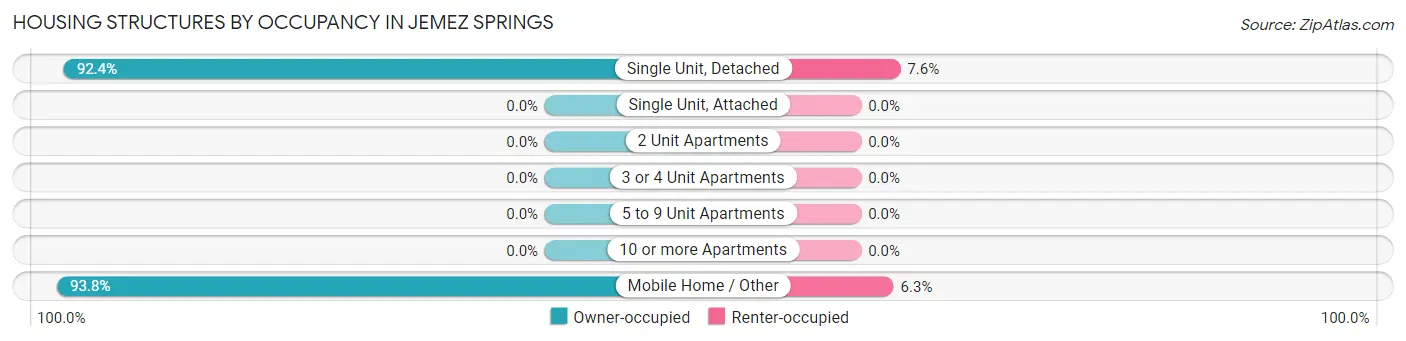
| Structure Type | Owner-occupied | Renter-occupied |
| Single Unit, Detached | 110 (92.4%) | 9 (7.6%) |
| Single Unit, Attached | 0 (0.0%) | 0 (0.0%) |
| 2 Unit Apartments | 0 (0.0%) | 0 (0.0%) |
| 3 or 4 Unit Apartments | 0 (0.0%) | 0 (0.0%) |
| 5 to 9 Unit Apartments | 0 (0.0%) | 0 (0.0%) |
| 10 or more Apartments | 0 (0.0%) | 0 (0.0%) |
| Mobile Home / Other | 30 (93.8%) | 2 (6.2%) |
| Total | 140 (92.7%) | 11 (7.3%) |
Housing Structures by Number of Rooms in Jemez Springs
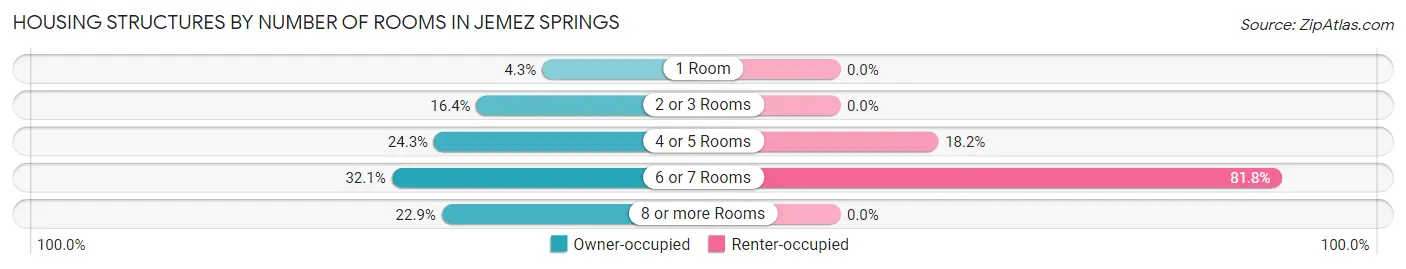
| Number of Rooms | Owner-occupied | Renter-occupied |
| 1 Room | 6 (4.3%) | 0 (0.0%) |
| 2 or 3 Rooms | 23 (16.4%) | 0 (0.0%) |
| 4 or 5 Rooms | 34 (24.3%) | 2 (18.2%) |
| 6 or 7 Rooms | 45 (32.1%) | 9 (81.8%) |
| 8 or more Rooms | 32 (22.9%) | 0 (0.0%) |
| Total | 140 (100.0%) | 11 (100.0%) |
Housing Structure by Heating Type in Jemez Springs
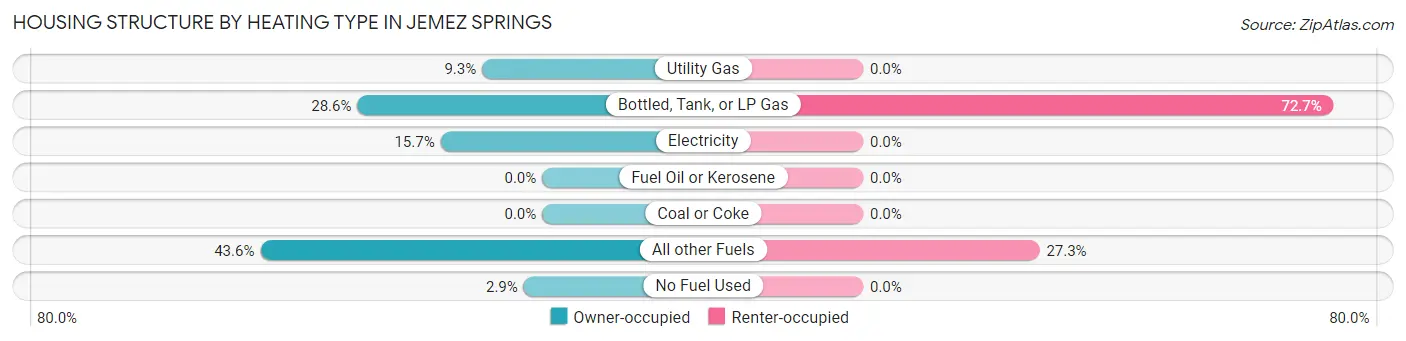
| Heating Type | Owner-occupied | Renter-occupied |
| Utility Gas | 13 (9.3%) | 0 (0.0%) |
| Bottled, Tank, or LP Gas | 40 (28.6%) | 8 (72.7%) |
| Electricity | 22 (15.7%) | 0 (0.0%) |
| Fuel Oil or Kerosene | 0 (0.0%) | 0 (0.0%) |
| Coal or Coke | 0 (0.0%) | 0 (0.0%) |
| All other Fuels | 61 (43.6%) | 3 (27.3%) |
| No Fuel Used | 4 (2.9%) | 0 (0.0%) |
| Total | 140 (100.0%) | 11 (100.0%) |
Household Vehicle Usage in Jemez Springs
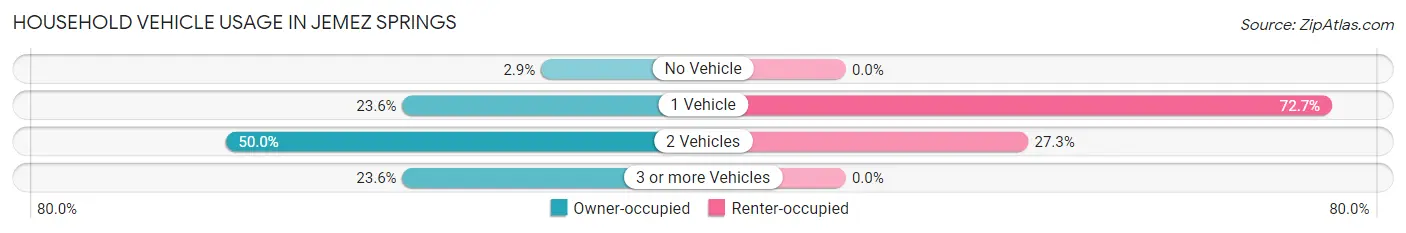
| Vehicles per Household | Owner-occupied | Renter-occupied |
| No Vehicle | 4 (2.9%) | 0 (0.0%) |
| 1 Vehicle | 33 (23.6%) | 8 (72.7%) |
| 2 Vehicles | 70 (50.0%) | 3 (27.3%) |
| 3 or more Vehicles | 33 (23.6%) | 0 (0.0%) |
| Total | 140 (100.0%) | 11 (100.0%) |
Real Estate & Mortgages in Jemez Springs
Real Estate and Mortgage Overview in Jemez Springs
| Characteristic | Without Mortgage | With Mortgage |
| Housing Units | 85 | 55 |
| Median Property Value | $258,900 | $280,600 |
| Median Household Income | $63,828 | $34 |
| Monthly Housing Costs | $535 | $0 |
| Real Estate Taxes | $2,250 | $0 |
Property Value by Mortgage Status in Jemez Springs
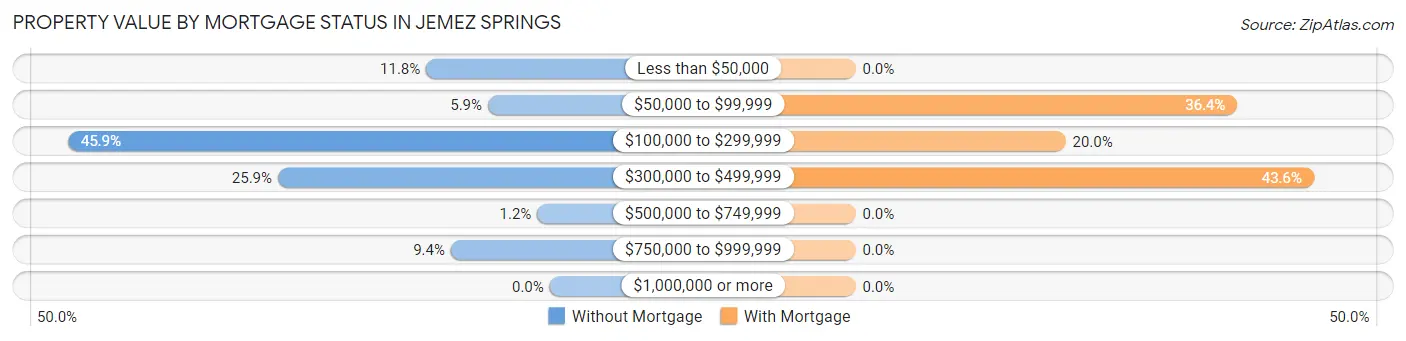
| Property Value | Without Mortgage | With Mortgage |
| Less than $50,000 | 10 (11.8%) | 0 (0.0%) |
| $50,000 to $99,999 | 5 (5.9%) | 20 (36.4%) |
| $100,000 to $299,999 | 39 (45.9%) | 11 (20.0%) |
| $300,000 to $499,999 | 22 (25.9%) | 24 (43.6%) |
| $500,000 to $749,999 | 1 (1.2%) | 0 (0.0%) |
| $750,000 to $999,999 | 8 (9.4%) | 0 (0.0%) |
| $1,000,000 or more | 0 (0.0%) | 0 (0.0%) |
| Total | 85 (100.0%) | 55 (100.0%) |
Household Income by Mortgage Status in Jemez Springs
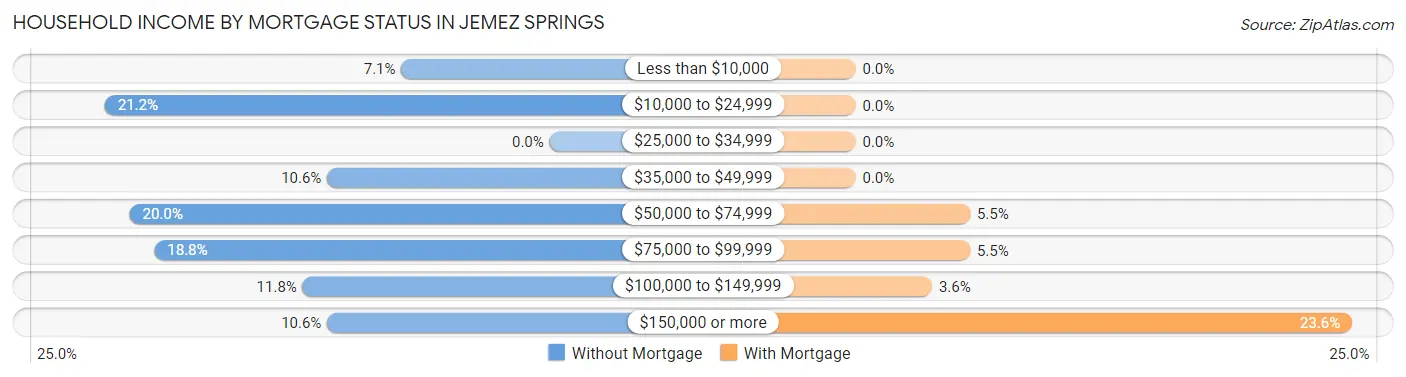
| Household Income | Without Mortgage | With Mortgage |
| Less than $10,000 | 6 (7.1%) | 0 (0.0%) |
| $10,000 to $24,999 | 18 (21.2%) | 0 (0.0%) |
| $25,000 to $34,999 | 0 (0.0%) | 0 (0.0%) |
| $35,000 to $49,999 | 9 (10.6%) | 0 (0.0%) |
| $50,000 to $74,999 | 17 (20.0%) | 3 (5.4%) |
| $75,000 to $99,999 | 16 (18.8%) | 3 (5.4%) |
| $100,000 to $149,999 | 10 (11.8%) | 2 (3.6%) |
| $150,000 or more | 9 (10.6%) | 13 (23.6%) |
| Total | 85 (100.0%) | 55 (100.0%) |
Property Value to Household Income Ratio in Jemez Springs
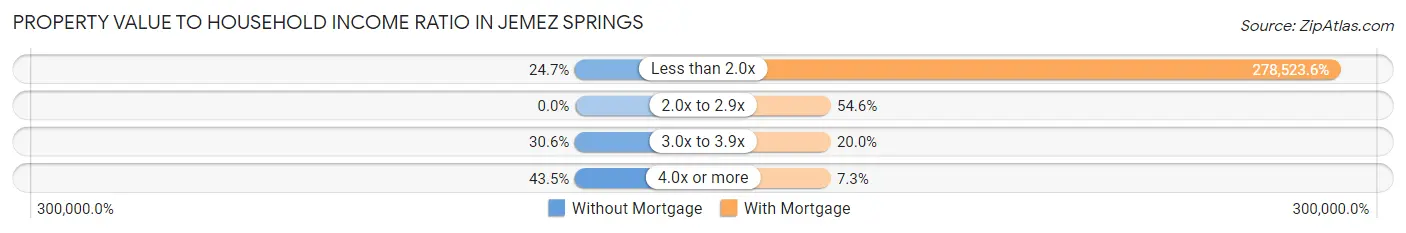
| Value-to-Income Ratio | Without Mortgage | With Mortgage |
| Less than 2.0x | 21 (24.7%) | 153,188 (278,523.6%) |
| 2.0x to 2.9x | 0 (0.0%) | 30 (54.5%) |
| 3.0x to 3.9x | 26 (30.6%) | 11 (20.0%) |
| 4.0x or more | 37 (43.5%) | 4 (7.3%) |
| Total | 85 (100.0%) | 55 (100.0%) |
Real Estate Taxes by Mortgage Status in Jemez Springs
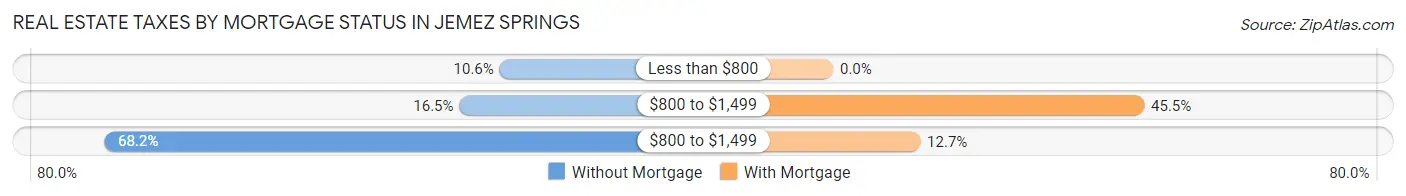
| Property Taxes | Without Mortgage | With Mortgage |
| Less than $800 | 9 (10.6%) | 0 (0.0%) |
| $800 to $1,499 | 14 (16.5%) | 25 (45.5%) |
| $800 to $1,499 | 58 (68.2%) | 7 (12.7%) |
| Total | 85 (100.0%) | 55 (100.0%) |
Health & Disability in Jemez Springs
Health Insurance Coverage by Age in Jemez Springs
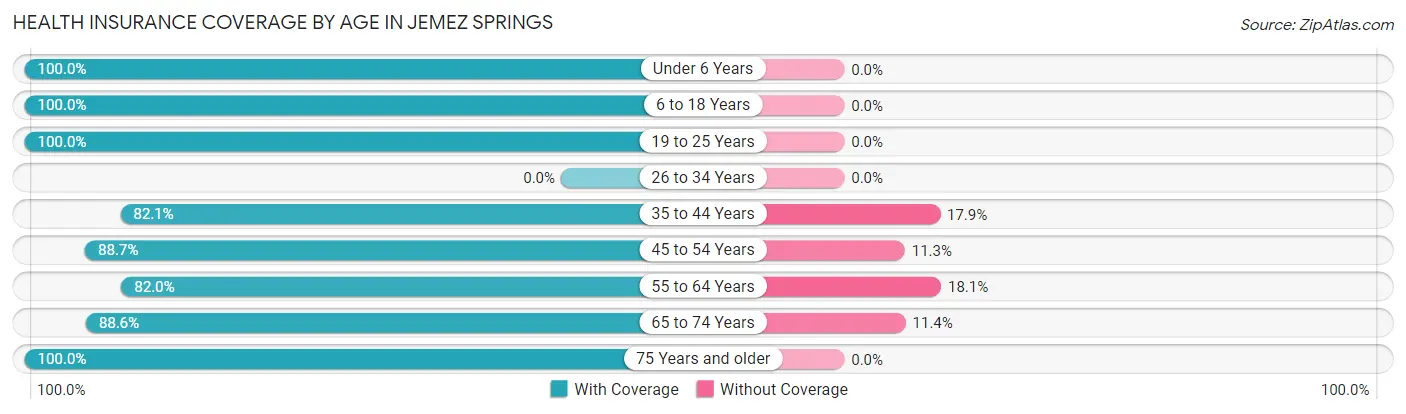
| Age Bracket | With Coverage | Without Coverage |
| Under 6 Years | 6 (100.0%) | 0 (0.0%) |
| 6 to 18 Years | 12 (100.0%) | 0 (0.0%) |
| 19 to 25 Years | 29 (100.0%) | 0 (0.0%) |
| 26 to 34 Years | 0 (0.0%) | 0 (0.0%) |
| 35 to 44 Years | 23 (82.1%) | 5 (17.9%) |
| 45 to 54 Years | 55 (88.7%) | 7 (11.3%) |
| 55 to 64 Years | 109 (82.0%) | 24 (18.0%) |
| 65 to 74 Years | 31 (88.6%) | 4 (11.4%) |
| 75 Years and older | 47 (100.0%) | 0 (0.0%) |
| Total | 312 (88.6%) | 40 (11.4%) |
Health Insurance Coverage by Citizenship Status in Jemez Springs
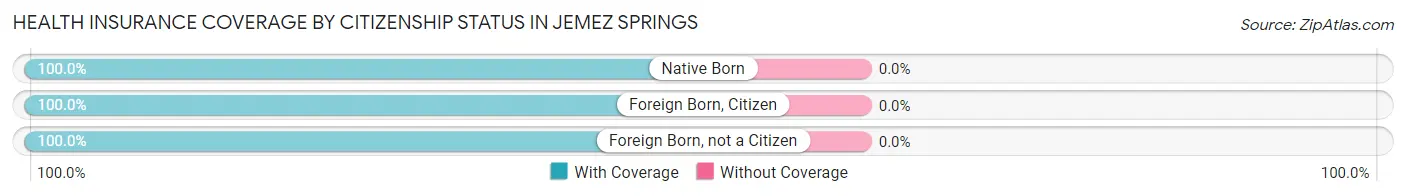
| Citizenship Status | With Coverage | Without Coverage |
| Native Born | 6 (100.0%) | 0 (0.0%) |
| Foreign Born, Citizen | 12 (100.0%) | 0 (0.0%) |
| Foreign Born, not a Citizen | 29 (100.0%) | 0 (0.0%) |
Health Insurance Coverage by Household Income in Jemez Springs
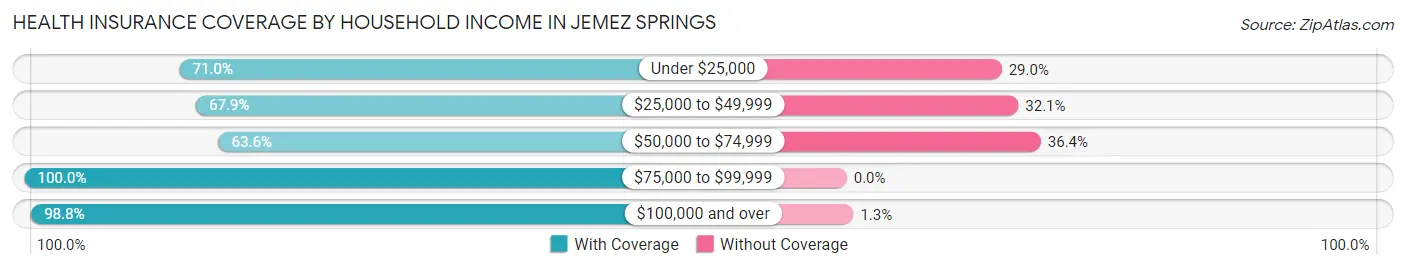
| Household Income | With Coverage | Without Coverage |
| Under $25,000 | 22 (71.0%) | 9 (29.0%) |
| $25,000 to $49,999 | 19 (67.9%) | 9 (32.1%) |
| $50,000 to $74,999 | 35 (63.6%) | 20 (36.4%) |
| $75,000 to $99,999 | 32 (100.0%) | 0 (0.0%) |
| $100,000 and over | 158 (98.8%) | 2 (1.3%) |
Public vs Private Health Insurance Coverage by Age in Jemez Springs
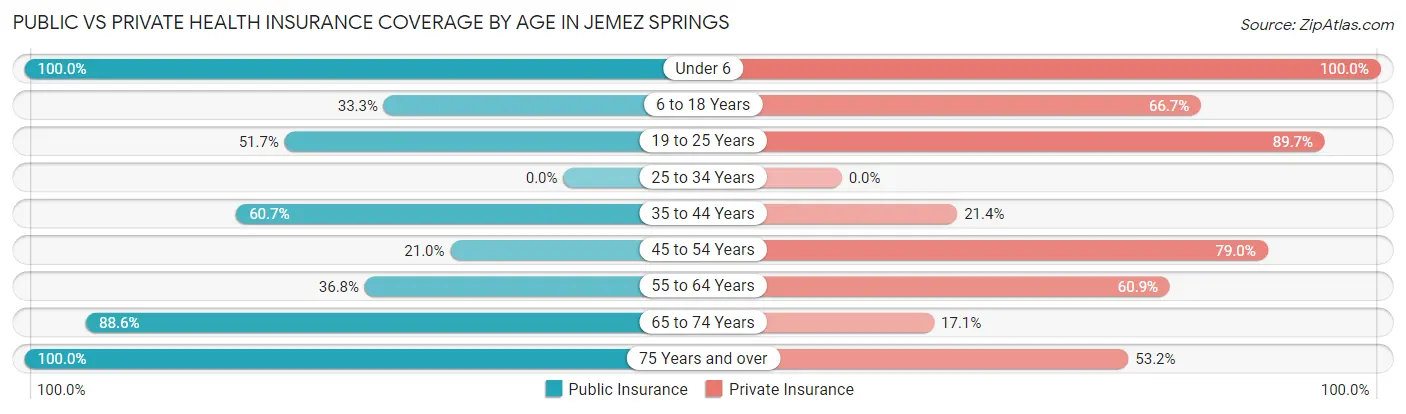
| Age Bracket | Public Insurance | Private Insurance |
| Under 6 | 6 (100.0%) | 6 (100.0%) |
| 6 to 18 Years | 4 (33.3%) | 8 (66.7%) |
| 19 to 25 Years | 15 (51.7%) | 26 (89.7%) |
| 25 to 34 Years | 0 (0.0%) | 0 (0.0%) |
| 35 to 44 Years | 17 (60.7%) | 6 (21.4%) |
| 45 to 54 Years | 13 (21.0%) | 49 (79.0%) |
| 55 to 64 Years | 49 (36.8%) | 81 (60.9%) |
| 65 to 74 Years | 31 (88.6%) | 6 (17.1%) |
| 75 Years and over | 47 (100.0%) | 25 (53.2%) |
| Total | 182 (51.7%) | 207 (58.8%) |
Disability Status by Sex by Age in Jemez Springs
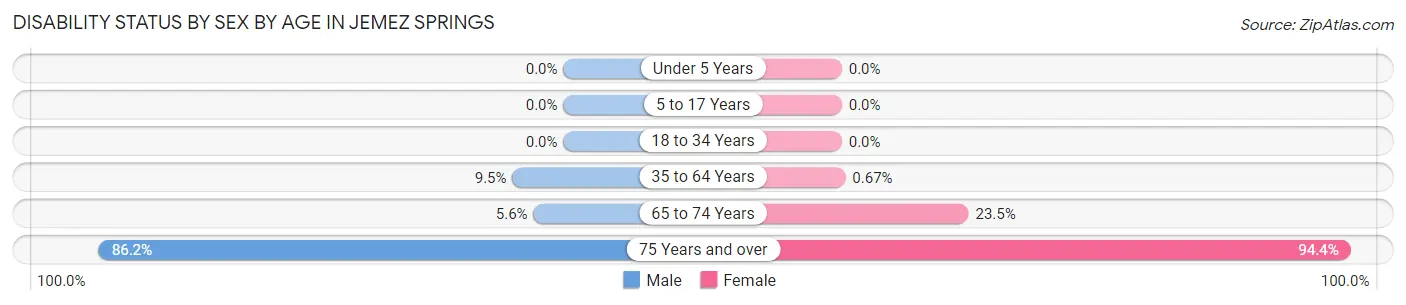
| Age Bracket | Male | Female |
| Under 5 Years | 0 (0.0%) | 0 (0.0%) |
| 5 to 17 Years | 0 (0.0%) | 0 (0.0%) |
| 18 to 34 Years | 0 (0.0%) | 0 (0.0%) |
| 35 to 64 Years | 7 (9.5%) | 1 (0.7%) |
| 65 to 74 Years | 1 (5.6%) | 4 (23.5%) |
| 75 Years and over | 25 (86.2%) | 17 (94.4%) |
Disability Class by Sex by Age in Jemez Springs
Disability Class: Hearing Difficulty
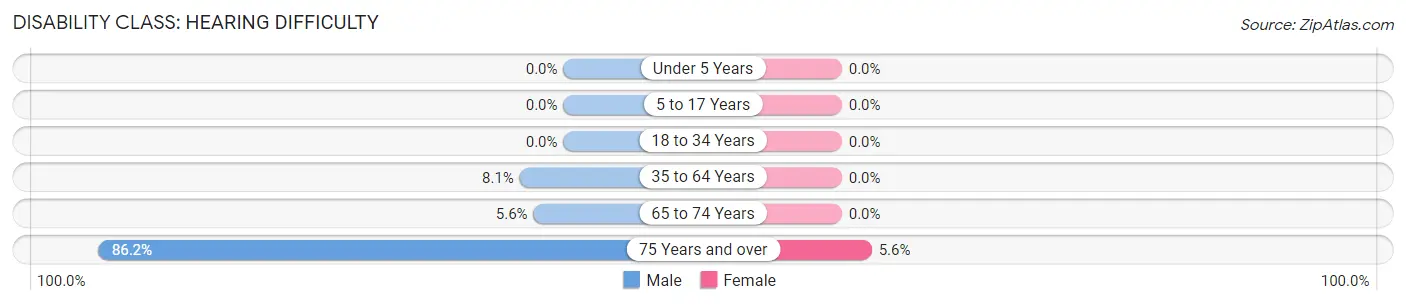
| Age Bracket | Male | Female |
| Under 5 Years | 0 (0.0%) | 0 (0.0%) |
| 5 to 17 Years | 0 (0.0%) | 0 (0.0%) |
| 18 to 34 Years | 0 (0.0%) | 0 (0.0%) |
| 35 to 64 Years | 6 (8.1%) | 0 (0.0%) |
| 65 to 74 Years | 1 (5.6%) | 0 (0.0%) |
| 75 Years and over | 25 (86.2%) | 1 (5.6%) |
Disability Class: Vision Difficulty
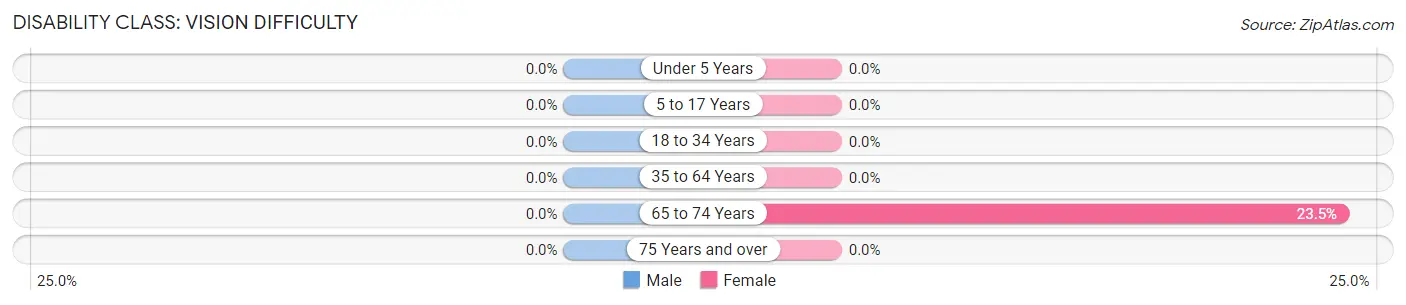
| Age Bracket | Male | Female |
| Under 5 Years | 0 (0.0%) | 0 (0.0%) |
| 5 to 17 Years | 0 (0.0%) | 0 (0.0%) |
| 18 to 34 Years | 0 (0.0%) | 0 (0.0%) |
| 35 to 64 Years | 0 (0.0%) | 0 (0.0%) |
| 65 to 74 Years | 0 (0.0%) | 4 (23.5%) |
| 75 Years and over | 0 (0.0%) | 0 (0.0%) |
Disability Class: Cognitive Difficulty
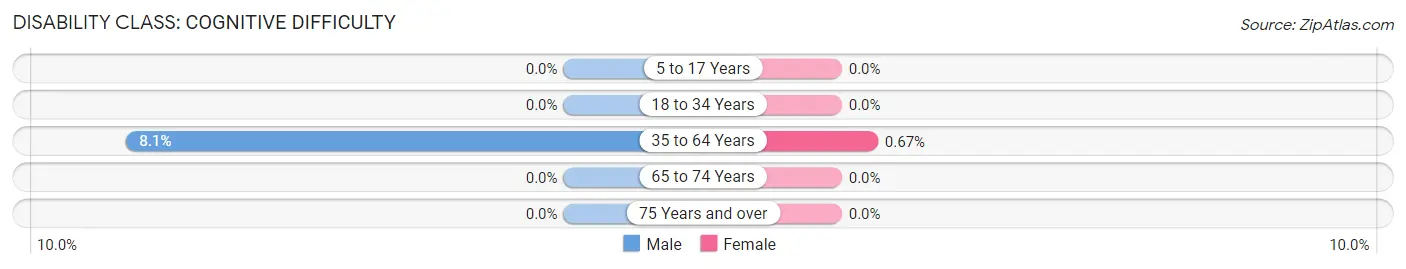
| Age Bracket | Male | Female |
| 5 to 17 Years | 0 (0.0%) | 0 (0.0%) |
| 18 to 34 Years | 0 (0.0%) | 0 (0.0%) |
| 35 to 64 Years | 6 (8.1%) | 1 (0.7%) |
| 65 to 74 Years | 0 (0.0%) | 0 (0.0%) |
| 75 Years and over | 0 (0.0%) | 0 (0.0%) |
Disability Class: Ambulatory Difficulty
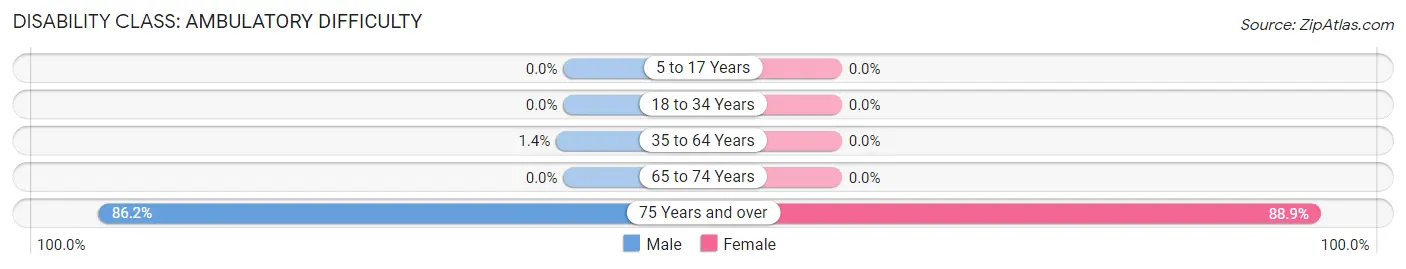
| Age Bracket | Male | Female |
| 5 to 17 Years | 0 (0.0%) | 0 (0.0%) |
| 18 to 34 Years | 0 (0.0%) | 0 (0.0%) |
| 35 to 64 Years | 1 (1.3%) | 0 (0.0%) |
| 65 to 74 Years | 0 (0.0%) | 0 (0.0%) |
| 75 Years and over | 25 (86.2%) | 16 (88.9%) |
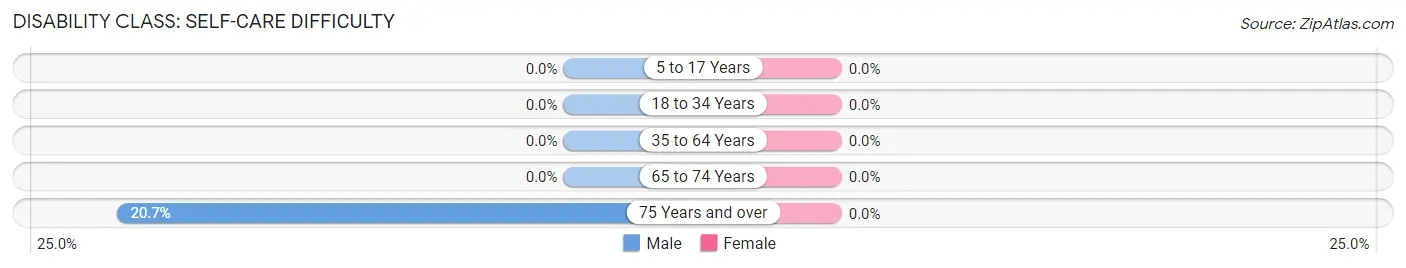
Disability Class: Self-Care Difficulty
| Age Bracket | Male | Female |
| 5 to 17 Years | 0 (0.0%) | 0 (0.0%) |
| 18 to 34 Years | 0 (0.0%) | 0 (0.0%) |
| 35 to 64 Years | 0 (0.0%) | 0 (0.0%) |
| 65 to 74 Years | 0 (0.0%) | 0 (0.0%) |
| 75 Years and over | 6 (20.7%) | 0 (0.0%) |
Technology Access in Jemez Springs
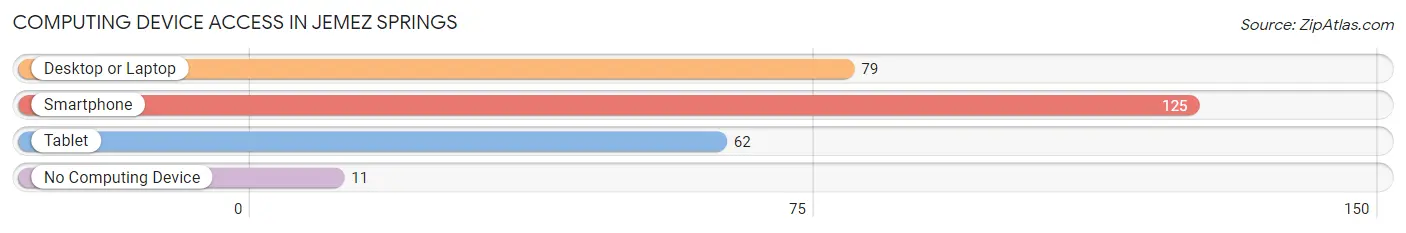
Computing Device Access in Jemez Springs
| Device Type | # Households | % Households |
| Desktop or Laptop | 79 | 52.3% |
| Smartphone | 125 | 82.8% |
| Tablet | 62 | 41.1% |
| No Computing Device | 11 | 7.3% |
| Total | 151 | 100.0% |
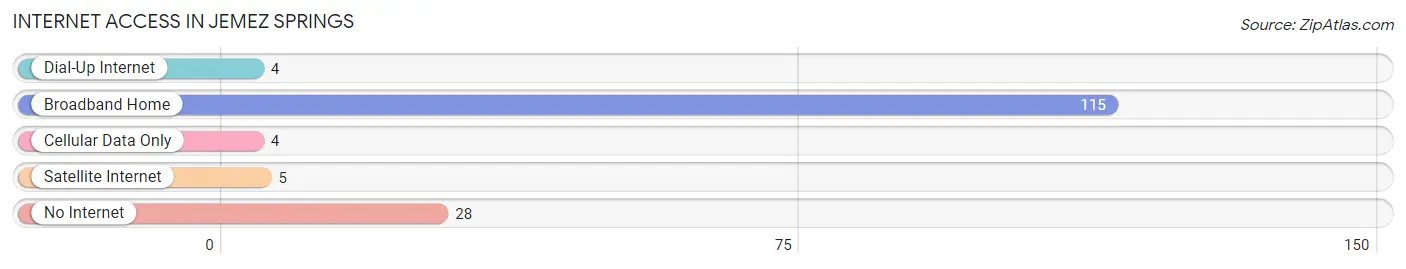
Internet Access in Jemez Springs
| Internet Type | # Households | % Households |
| Dial-Up Internet | 4 | 2.6% |
| Broadband Home | 115 | 76.2% |
| Cellular Data Only | 4 | 2.6% |
| Satellite Internet | 5 | 3.3% |
| No Internet | 28 | 18.5% |
| Total | 151 | 100.0% |
Jemez Springs Summary
Jemez Springs is a small village located in the Jemez Mountains of Sandoval County, New Mexico. It is situated in the Jemez Valley, which is surrounded by the Jemez Mountains and the Valles Caldera National Preserve. The village is located about 60 miles northwest of Albuquerque and is part of the Albuquerque Metropolitan Statistical Area.
Geography
Jemez Springs is located in the Jemez Mountains of Sandoval County, New Mexico. It is situated in the Jemez Valley, which is surrounded by the Jemez Mountains and the Valles Caldera National Preserve. The village is located about 60 miles northwest of Albuquerque and is part of the Albuquerque Metropolitan Statistical Area. The village is located at an elevation of 6,890 feet and has a total area of 0.9 square miles. The village is located in a temperate climate with hot summers and cold winters.
History
Jemez Springs has a long and rich history. The area was first inhabited by the Jemez people, who were part of the Pueblo culture. The Jemez people lived in the area for centuries before the arrival of the Spanish in the 16th century. The Spanish established a mission in the area in 1621, which was later abandoned in 1680. The area was then settled by the Spanish in the late 1700s and early 1800s. The village was officially established in 1821 and was named after the Jemez people.
Economy
The economy of Jemez Springs is largely based on tourism. The village is a popular destination for outdoor recreation, such as hiking, camping, fishing, and skiing. The village is also home to several hot springs, which attract visitors from around the world. The village is also home to several art galleries, restaurants, and shops.
Demographics
As of the 2010 census, the population of Jemez Springs was 811. The population is largely Hispanic, with a majority of the population being of Mexican descent. The median household income in the village is $37,500 and the median home value is $179,000. The village has a poverty rate of 16.3%.
Conclusion
Jemez Springs is a small village located in the Jemez Mountains of Sandoval County, New Mexico. It is situated in the Jemez Valley, which is surrounded by the Jemez Mountains and the Valles Caldera National Preserve. The village has a long and rich history and is a popular destination for outdoor recreation and hot springs. The economy of the village is largely based on tourism and the population is largely Hispanic. The median household income in the village is $37,500 and the median home value is $179,000.
Common Questions
What is Per Capita Income in Jemez Springs?
Per Capita income in Jemez Springs is $43,546.
What is the Median Family Income in Jemez Springs?
Median Family Income in Jemez Springs is $104,063.
What is the Median Household income in Jemez Springs?
Median Household Income in Jemez Springs is $88,750.
What is Inequality or Gini Index in Jemez Springs?
Inequality or Gini Index in Jemez Springs is 0.39.
What is the Total Population of Jemez Springs?
Total Population of Jemez Springs is 352.
What is the Total Male Population of Jemez Springs?
Total Male Population of Jemez Springs is 151.
What is the Total Female Population of Jemez Springs?
Total Female Population of Jemez Springs is 201.
What is the Ratio of Males per 100 Females in Jemez Springs?
There are 75.12 Males per 100 Females in Jemez Springs.
What is the Ratio of Females per 100 Males in Jemez Springs?
There are 133.11 Females per 100 Males in Jemez Springs.
What is the Median Population Age in Jemez Springs?
Median Population Age in Jemez Springs is 56.4 Years.
What is the Average Family Size in Jemez Springs
Average Family Size in Jemez Springs is 2.3 People.
What is the Average Household Size in Jemez Springs
Average Household Size in Jemez Springs is 2.0 People.
How Large is the Labor Force in Jemez Springs?
There are 192 People in the Labor Forcein in Jemez Springs.
What is the Percentage of People in the Labor Force in Jemez Springs?
55.7% of People are in the Labor Force in Jemez Springs.
What is the Unemployment Rate in Jemez Springs?
Unemployment Rate in Jemez Springs is 11.5%.