Hernandez, NM Map & Demographics
Hernandez Map
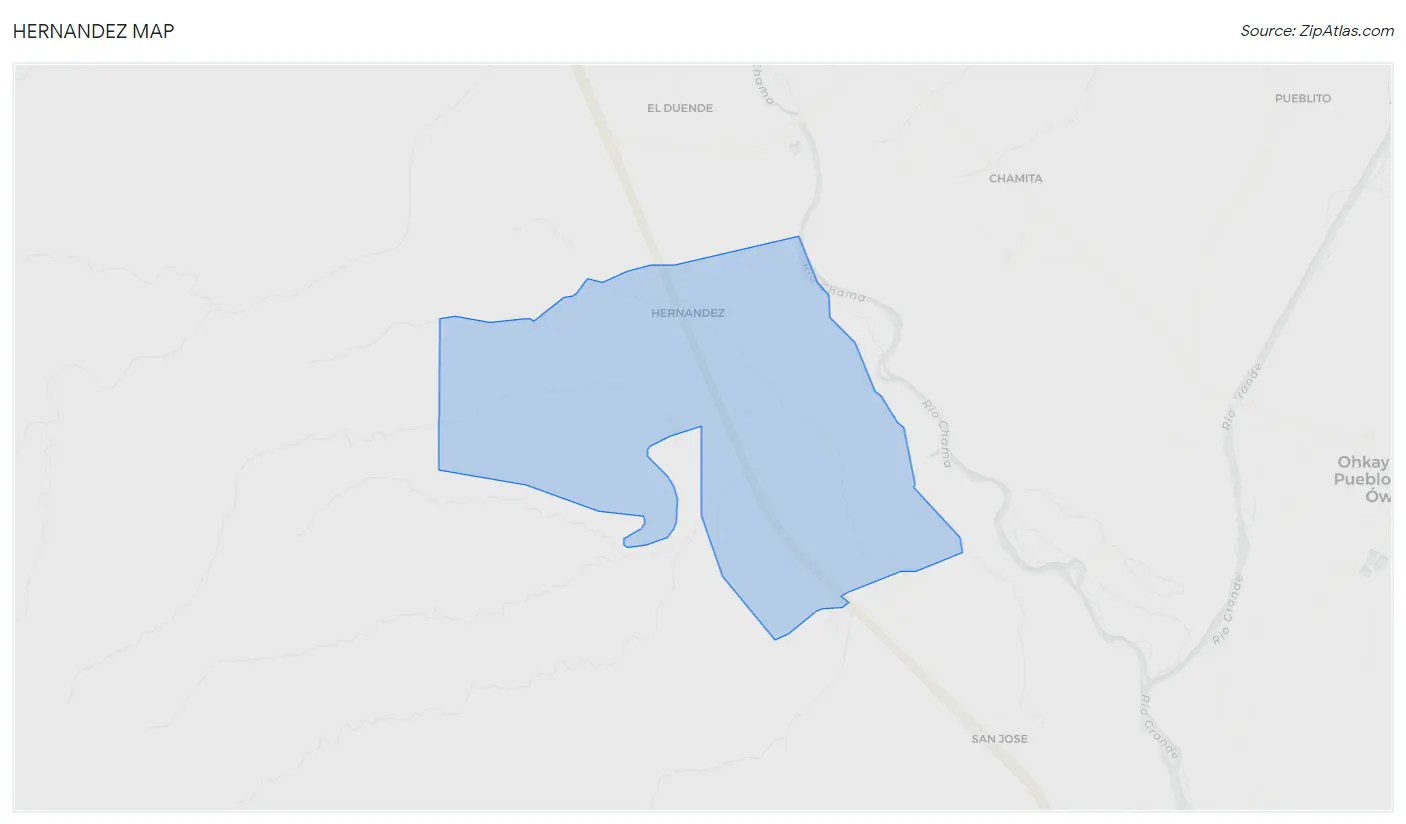
Hernandez Overview
$31,710
PER CAPITA INCOME
$52,917
AVG FAMILY INCOME
$19,429
AVG HOUSEHOLD INCOME
43.8%
WAGE / INCOME GAP [ % ]
56.2¢/ $1
WAGE / INCOME GAP [ $ ]
0.64
INEQUALITY / GINI INDEX
902
TOTAL POPULATION
379
MALE POPULATION
523
FEMALE POPULATION
72.47
MALES / 100 FEMALES
137.99
FEMALES / 100 MALES
50.6
MEDIAN AGE
3.4
AVG FAMILY SIZE
2.2
AVG HOUSEHOLD SIZE
295
LABOR FORCE [ PEOPLE ]
39.2%
PERCENT IN LABOR FORCE
11.5%
UNEMPLOYMENT RATE
Hernandez Zip Codes
Hernandez Area Codes
Income in Hernandez
Income Overview in Hernandez
Per Capita Income in Hernandez is $31,710, while median incomes of families and households are $52,917 and $19,429 respectively.
| Characteristic | Number | Measure |
| Per Capita Income | 902 | $31,710 |
| Median Family Income | 183 | $52,917 |
| Mean Family Income | 183 | $113,688 |
| Median Household Income | 411 | $19,429 |
| Mean Household Income | 411 | $62,928 |
| Income Deficit | 183 | $0 |
| Wage / Income Gap (%) | 902 | 43.83% |
| Wage / Income Gap ($) | 902 | 56.17¢ per $1 |
| Gini / Inequality Index | 902 | 0.64 |
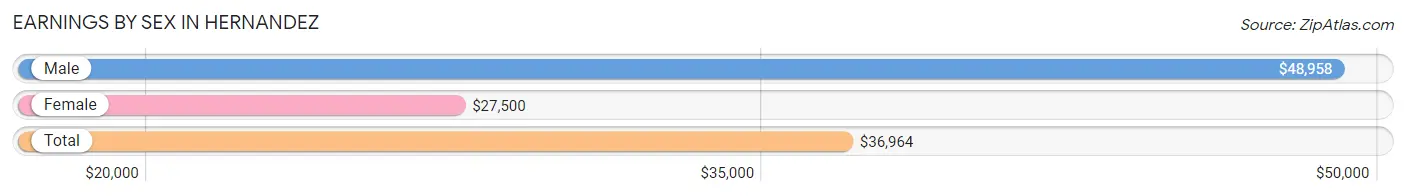
Earnings by Sex in Hernandez
Average Earnings in Hernandez are $36,964, $48,958 for men and $27,500 for women, a difference of 43.8%.
| Sex | Number | Average Earnings |
| Male | 155 (55.6%) | $48,958 |
| Female | 124 (44.4%) | $27,500 |
| Total | 279 (100.0%) | $36,964 |
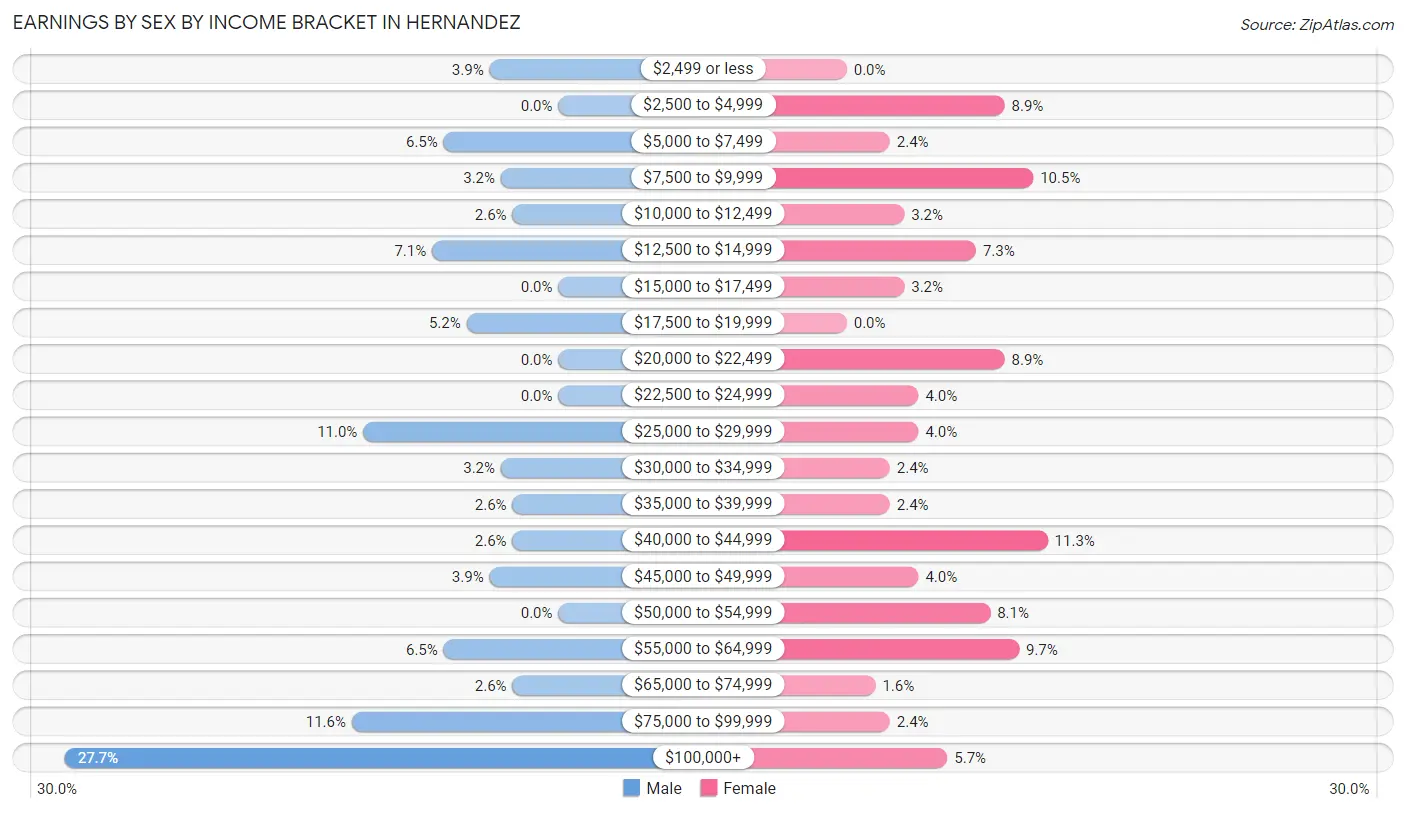
Earnings by Sex by Income Bracket in Hernandez
The most common earnings brackets in Hernandez are $100,000+ for men (43 | 27.7%) and $40,000 to $44,999 for women (14 | 11.3%).
| Income | Male | Female |
| $2,499 or less | 6 (3.9%) | 0 (0.0%) |
| $2,500 to $4,999 | 0 (0.0%) | 11 (8.9%) |
| $5,000 to $7,499 | 10 (6.5%) | 3 (2.4%) |
| $7,500 to $9,999 | 5 (3.2%) | 13 (10.5%) |
| $10,000 to $12,499 | 4 (2.6%) | 4 (3.2%) |
| $12,500 to $14,999 | 11 (7.1%) | 9 (7.3%) |
| $15,000 to $17,499 | 0 (0.0%) | 4 (3.2%) |
| $17,500 to $19,999 | 8 (5.2%) | 0 (0.0%) |
| $20,000 to $22,499 | 0 (0.0%) | 11 (8.9%) |
| $22,500 to $24,999 | 0 (0.0%) | 5 (4.0%) |
| $25,000 to $29,999 | 17 (11.0%) | 5 (4.0%) |
| $30,000 to $34,999 | 5 (3.2%) | 3 (2.4%) |
| $35,000 to $39,999 | 4 (2.6%) | 3 (2.4%) |
| $40,000 to $44,999 | 4 (2.6%) | 14 (11.3%) |
| $45,000 to $49,999 | 6 (3.9%) | 5 (4.0%) |
| $50,000 to $54,999 | 0 (0.0%) | 10 (8.1%) |
| $55,000 to $64,999 | 10 (6.5%) | 12 (9.7%) |
| $65,000 to $74,999 | 4 (2.6%) | 2 (1.6%) |
| $75,000 to $99,999 | 18 (11.6%) | 3 (2.4%) |
| $100,000+ | 43 (27.7%) | 7 (5.7%) |
| Total | 155 (100.0%) | 124 (100.0%) |
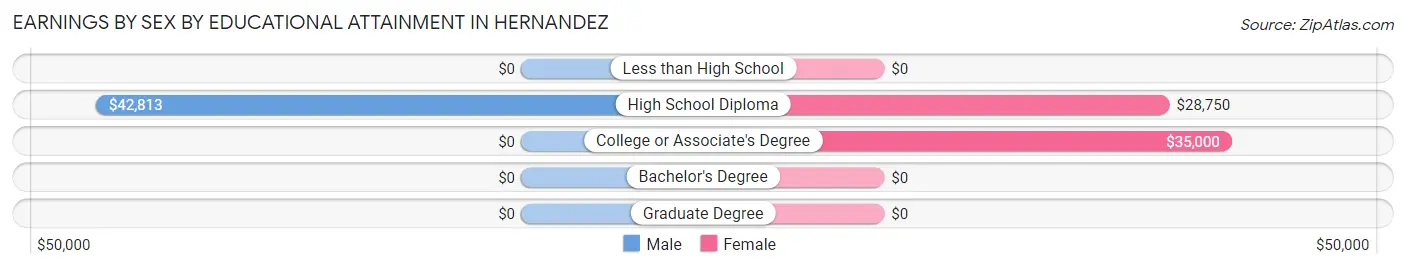
Earnings by Sex by Educational Attainment in Hernandez
Average earnings in Hernandez are $62,750 for men and $45,000 for women, a difference of 28.3%. Men with an educational attainment of high school diploma enjoy the highest average annual earnings of $42,813, while those with high school diploma education earn the least with $42,813. Women with an educational attainment of college or associate's degree earn the most with the average annual earnings of $35,000, while those with high school diploma education have the smallest earnings of $28,750.
| Educational Attainment | Male Income | Female Income |
| Less than High School | - | - |
| High School Diploma | $42,813 | $28,750 |
| College or Associate's Degree | - | - |
| Bachelor's Degree | - | - |
| Graduate Degree | - | - |
| Total | $62,750 | $45,000 |
Family Income in Hernandez
Family Income Brackets in Hernandez
According to the Hernandez family income data, there are 34 families falling into the $15,000 to $24,999 income range, which is the most common income bracket and makes up 18.6% of all families.
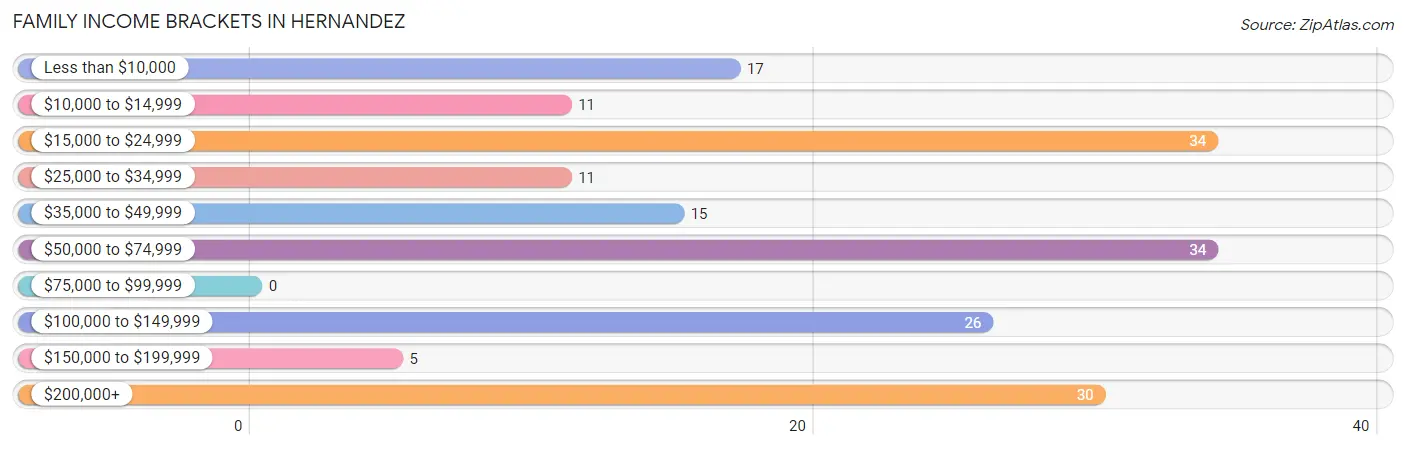
| Income Bracket | # Families | % Families |
| Less than $10,000 | 17 | 9.3% |
| $10,000 to $14,999 | 11 | 6.0% |
| $15,000 to $24,999 | 34 | 18.6% |
| $25,000 to $34,999 | 11 | 6.0% |
| $35,000 to $49,999 | 15 | 8.2% |
| $50,000 to $74,999 | 34 | 18.6% |
| $75,000 to $99,999 | 0 | 0.0% |
| $100,000 to $149,999 | 26 | 14.2% |
| $150,000 to $199,999 | 5 | 2.7% |
| $200,000+ | 30 | 16.4% |
Family Income by Famaliy Size in Hernandez
4-person families (9 | 4.9%) account for the highest median family income in Hernandez with $122,750 per family, while 4-person families (9 | 4.9%) have the highest median income of $30,688 per family member.
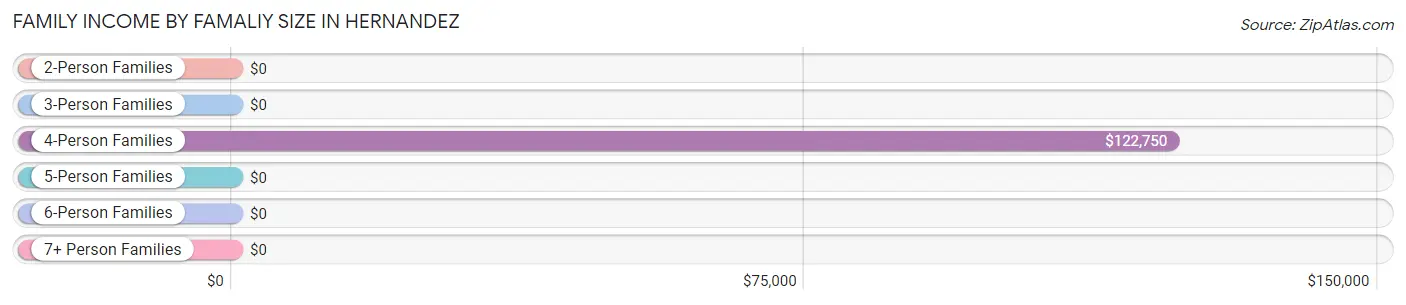
| Income Bracket | # Families | Median Income |
| 2-Person Families | 96 (52.5%) | $0 |
| 3-Person Families | 71 (38.8%) | $0 |
| 4-Person Families | 9 (4.9%) | $122,750 |
| 5-Person Families | 4 (2.2%) | $0 |
| 6-Person Families | 3 (1.6%) | $0 |
| 7+ Person Families | 0 (0.0%) | $0 |
| Total | 183 (100.0%) | $52,917 |
Family Income by Number of Earners in Hernandez
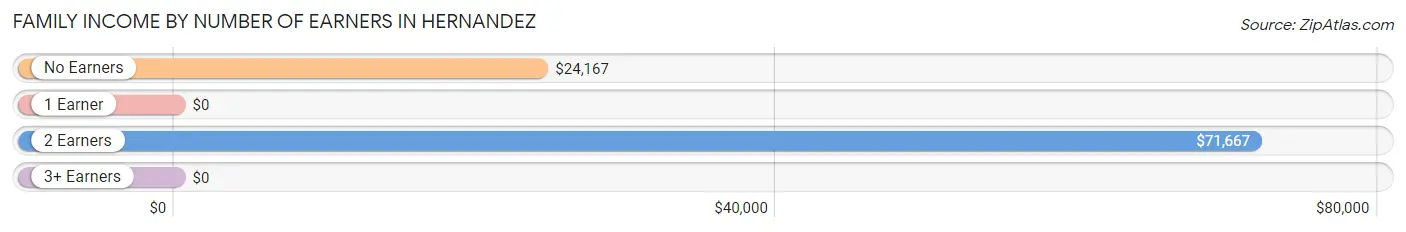
| Number of Earners | # Families | Median Income |
| No Earners | 64 (35.0%) | $24,167 |
| 1 Earner | 80 (43.7%) | $0 |
| 2 Earners | 36 (19.7%) | $71,667 |
| 3+ Earners | 3 (1.6%) | $0 |
| Total | 183 (100.0%) | $52,917 |
Household Income in Hernandez
Household Income Brackets in Hernandez
With 134 households falling in the category, the $10,000 to $14,999 income range is the most frequent in Hernandez, accounting for 32.6% of all households. In contrast, only 1 households (0.2%) fall into the $75,000 to $99,999 income bracket, making it the least populous group.
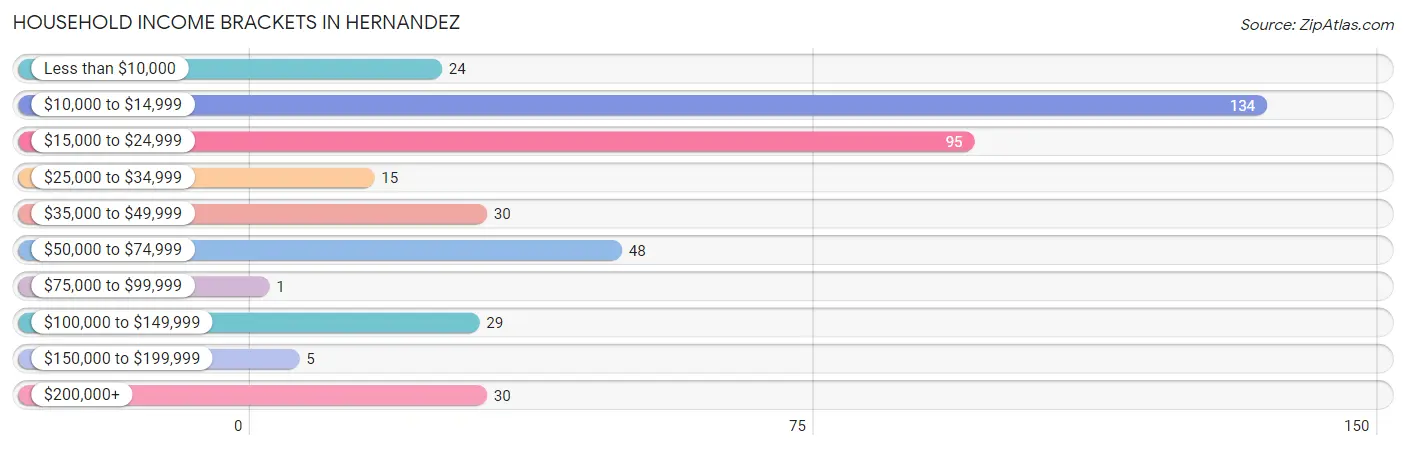
| Income Bracket | # Households | % Households |
| Less than $10,000 | 24 | 5.8% |
| $10,000 to $14,999 | 134 | 32.6% |
| $15,000 to $24,999 | 95 | 23.1% |
| $25,000 to $34,999 | 15 | 3.6% |
| $35,000 to $49,999 | 30 | 7.3% |
| $50,000 to $74,999 | 48 | 11.7% |
| $75,000 to $99,999 | 1 | 0.2% |
| $100,000 to $149,999 | 29 | 7.1% |
| $150,000 to $199,999 | 5 | 1.2% |
| $200,000+ | 30 | 7.3% |
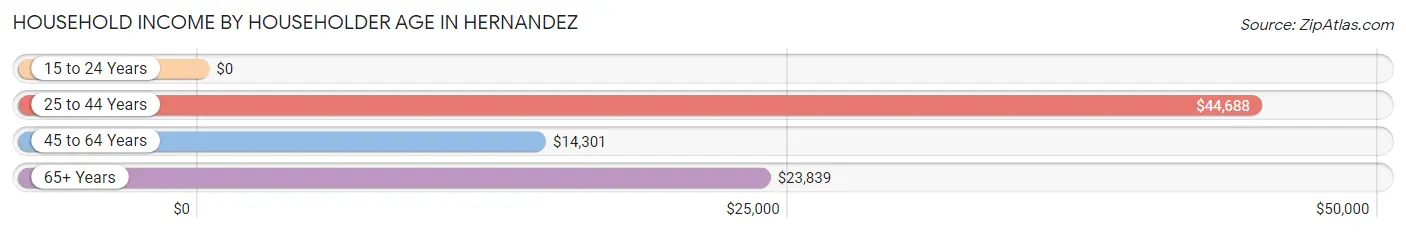
Household Income by Householder Age in Hernandez
The median household income in Hernandez is $19,429, with the highest median household income of $44,688 found in the 25 to 44 years age bracket for the primary householder. A total of 59 households (14.4%) fall into this category.
| Income Bracket | # Households | Median Income |
| 15 to 24 Years | 0 (0.0%) | $0 |
| 25 to 44 Years | 59 (14.4%) | $44,688 |
| 45 to 64 Years | 208 (50.6%) | $14,301 |
| 65+ Years | 144 (35.0%) | $23,839 |
| Total | 411 (100.0%) | $19,429 |
Poverty in Hernandez
Income Below Poverty by Sex and Age in Hernandez
With 27.2% poverty level for males and 35.4% for females among the residents of Hernandez, under 5 year old males and 45 to 54 year old females are the most vulnerable to poverty, with 19 males (50.0%) and 110 females (71.9%) in their respective age groups living below the poverty level.
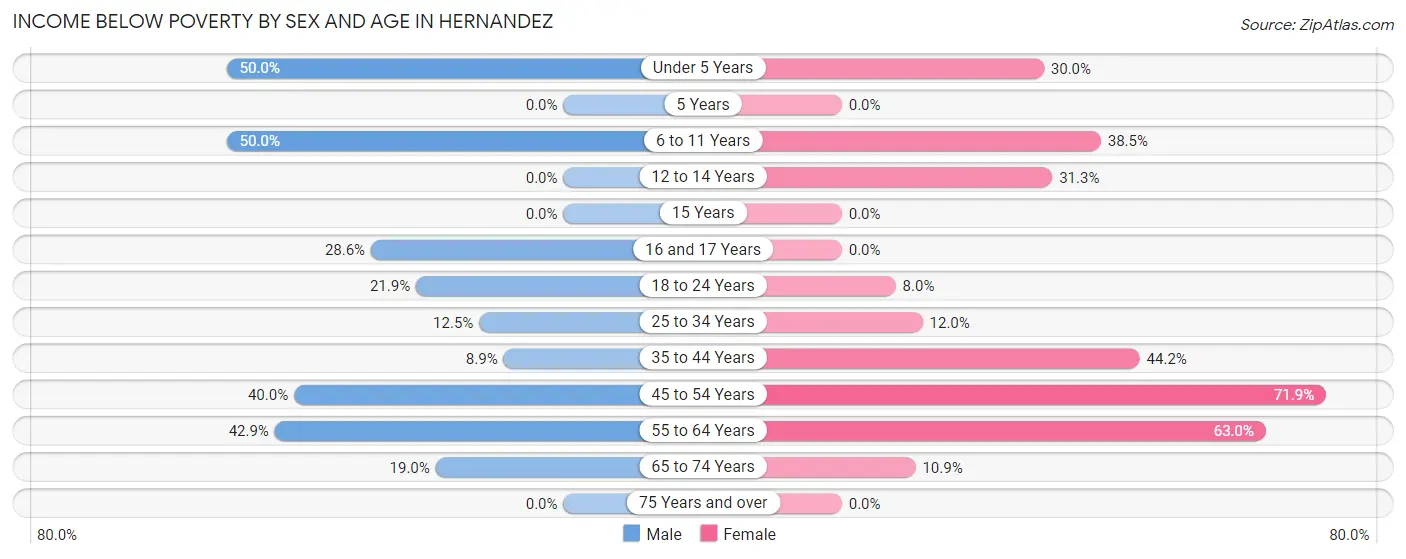
| Age Bracket | Male | Female |
| Under 5 Years | 19 (50.0%) | 6 (30.0%) |
| 5 Years | 0 (0.0%) | 0 (0.0%) |
| 6 to 11 Years | 11 (50.0%) | 10 (38.5%) |
| 12 to 14 Years | 0 (0.0%) | 5 (31.2%) |
| 15 Years | 0 (0.0%) | 0 (0.0%) |
| 16 and 17 Years | 4 (28.6%) | 0 (0.0%) |
| 18 to 24 Years | 7 (21.9%) | 4 (8.0%) |
| 25 to 34 Years | 4 (12.5%) | 3 (12.0%) |
| 35 to 44 Years | 4 (8.9%) | 23 (44.2%) |
| 45 to 54 Years | 16 (40.0%) | 110 (71.9%) |
| 55 to 64 Years | 27 (42.9%) | 17 (63.0%) |
| 65 to 74 Years | 11 (19.0%) | 7 (10.9%) |
| 75 Years and over | 0 (0.0%) | 0 (0.0%) |
| Total | 103 (27.2%) | 185 (35.4%) |
Income Above Poverty by Sex and Age in Hernandez
According to the poverty statistics in Hernandez, males aged 12 to 14 years and females aged 15 years are the age groups that are most secure financially, with 100.0% of males and 100.0% of females in these age groups living above the poverty line.
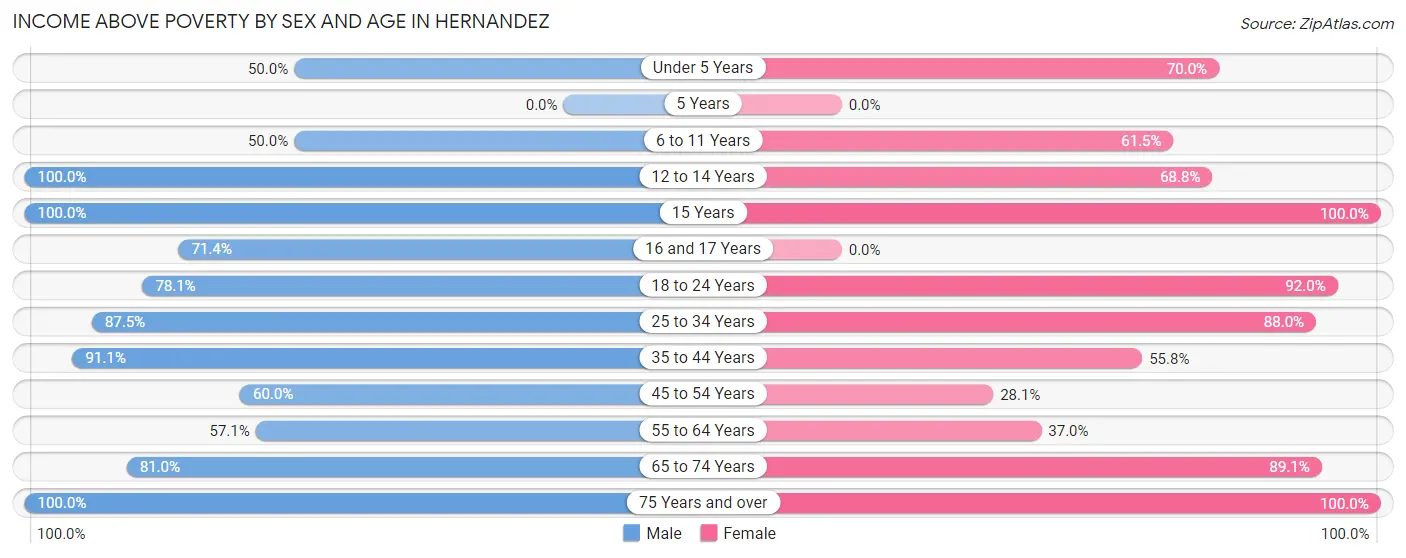
| Age Bracket | Male | Female |
| Under 5 Years | 19 (50.0%) | 14 (70.0%) |
| 5 Years | 0 (0.0%) | 0 (0.0%) |
| 6 to 11 Years | 11 (50.0%) | 16 (61.5%) |
| 12 to 14 Years | 10 (100.0%) | 11 (68.8%) |
| 15 Years | 4 (100.0%) | 13 (100.0%) |
| 16 and 17 Years | 10 (71.4%) | 0 (0.0%) |
| 18 to 24 Years | 25 (78.1%) | 46 (92.0%) |
| 25 to 34 Years | 28 (87.5%) | 22 (88.0%) |
| 35 to 44 Years | 41 (91.1%) | 29 (55.8%) |
| 45 to 54 Years | 24 (60.0%) | 43 (28.1%) |
| 55 to 64 Years | 36 (57.1%) | 10 (37.0%) |
| 65 to 74 Years | 47 (81.0%) | 57 (89.1%) |
| 75 Years and over | 21 (100.0%) | 77 (100.0%) |
| Total | 276 (72.8%) | 338 (64.6%) |
Income Below Poverty Among Married-Couple Families in Hernandez
The poverty statistics for married-couple families in Hernandez show that 19.4% or 21 of the total 108 families live below the poverty line. Families with 1 or 2 children have the highest poverty rate of 22.2%, comprising of 6 families. On the other hand, families with no children have the lowest poverty rate of 18.5%, which includes 15 families.
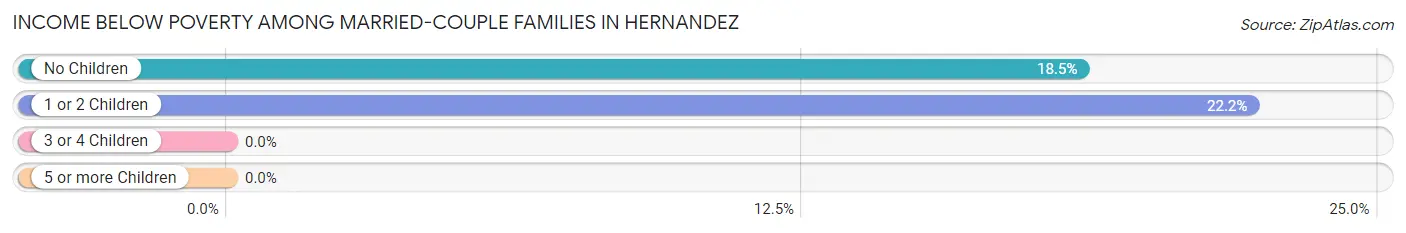
| Children | Above Poverty | Below Poverty |
| No Children | 66 (81.5%) | 15 (18.5%) |
| 1 or 2 Children | 21 (77.8%) | 6 (22.2%) |
| 3 or 4 Children | 0 (0.0%) | 0 (0.0%) |
| 5 or more Children | 0 (0.0%) | 0 (0.0%) |
| Total | 87 (80.6%) | 21 (19.4%) |
Income Below Poverty Among Single-Parent Households in Hernandez
According to the poverty data in Hernandez, 23.5% or 4 single-father households and 19.0% or 11 single-mother households are living below the poverty line. Among single-father households, those with 1 or 2 children have the highest poverty rate, with 4 households (33.3%) experiencing poverty. Likewise, among single-mother households, those with 3 or 4 children have the highest poverty rate, with 4 households (100.0%) falling below the poverty line.
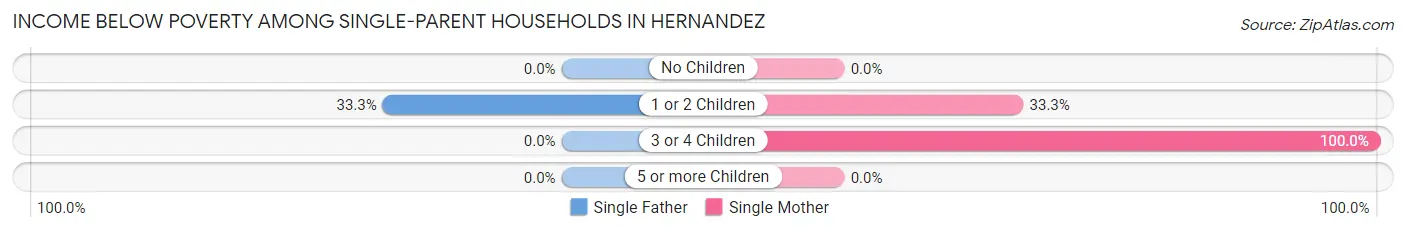
| Children | Single Father | Single Mother |
| No Children | 0 (0.0%) | 0 (0.0%) |
| 1 or 2 Children | 4 (33.3%) | 7 (33.3%) |
| 3 or 4 Children | 0 (0.0%) | 4 (100.0%) |
| 5 or more Children | 0 (0.0%) | 0 (0.0%) |
| Total | 4 (23.5%) | 11 (19.0%) |
Income Below Poverty Among Married-Couple vs Single-Parent Households in Hernandez
The poverty data for Hernandez shows that 21 of the married-couple family households (19.4%) and 15 of the single-parent households (20.0%) are living below the poverty level. Within the married-couple family households, those with 1 or 2 children have the highest poverty rate, with 6 households (22.2%) falling below the poverty line. Among the single-parent households, those with 3 or 4 children have the highest poverty rate, with 4 household (100.0%) living below poverty.
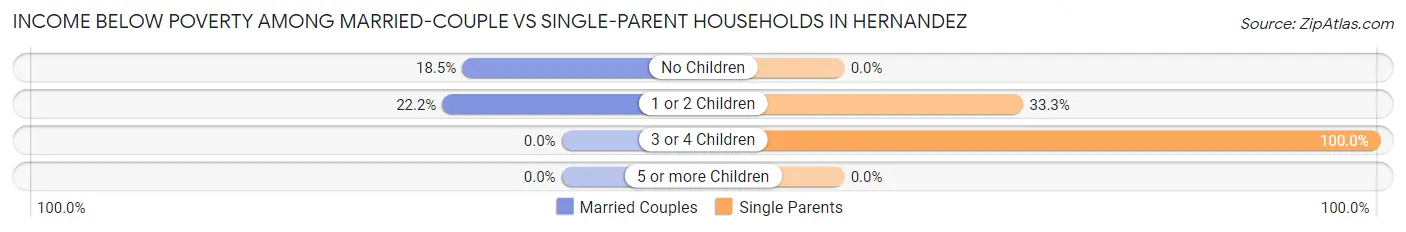
| Children | Married-Couple Families | Single-Parent Households |
| No Children | 15 (18.5%) | 0 (0.0%) |
| 1 or 2 Children | 6 (22.2%) | 11 (33.3%) |
| 3 or 4 Children | 0 (0.0%) | 4 (100.0%) |
| 5 or more Children | 0 (0.0%) | 0 (0.0%) |
| Total | 21 (19.4%) | 15 (20.0%) |
Race in Hernandez
The most populous races in Hernandez are Hispanic or Latino (787 | 87.3%), White / Caucasian (430 | 47.7%), and Some other Race (413 | 45.8%).
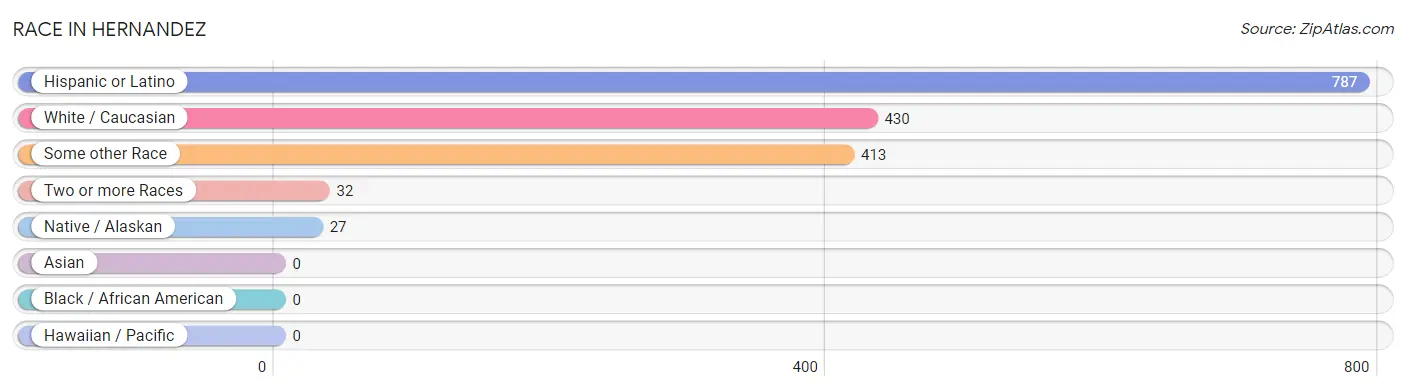
| Race | # Population | % Population |
| Asian | 0 | 0.0% |
| Black / African American | 0 | 0.0% |
| Hawaiian / Pacific | 0 | 0.0% |
| Hispanic or Latino | 787 | 87.3% |
| Native / Alaskan | 27 | 3.0% |
| White / Caucasian | 430 | 47.7% |
| Two or more Races | 32 | 3.5% |
| Some other Race | 413 | 45.8% |
| Total | 902 | 100.0% |
Ancestry in Hernandez
The most populous ancestries reported in Hernandez are Mexican (230 | 25.5%), Spanish (141 | 15.6%), Spaniard (110 | 12.2%), Spanish American (43 | 4.8%), and Irish (35 | 3.9%), together accounting for 62.0% of all Hernandez residents.
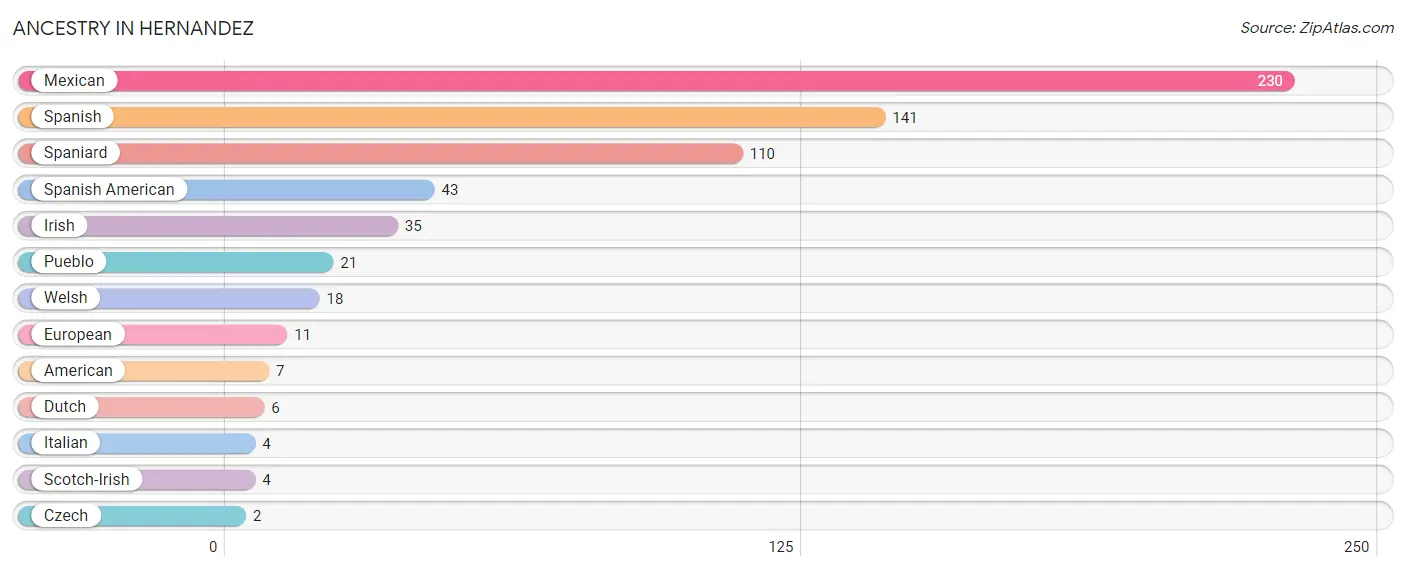
| Ancestry | # Population | % Population |
| American | 7 | 0.8% |
| Czech | 2 | 0.2% |
| Dutch | 6 | 0.7% |
| European | 11 | 1.2% |
| Irish | 35 | 3.9% |
| Italian | 4 | 0.4% |
| Mexican | 230 | 25.5% |
| Pueblo | 21 | 2.3% |
| Scotch-Irish | 4 | 0.4% |
| Spaniard | 110 | 12.2% |
| Spanish | 141 | 15.6% |
| Spanish American | 43 | 4.8% |
| Welsh | 18 | 2.0% | View All 13 Rows |
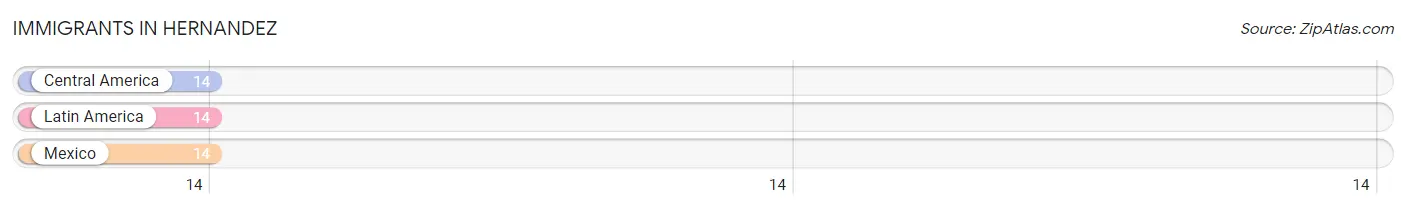
Immigrants in Hernandez
The most numerous immigrant groups reported in Hernandez came from Central America (14 | 1.5%), Latin America (14 | 1.5%), and Mexico (14 | 1.5%), together accounting for 4.6% of all Hernandez residents.
| Immigration Origin | # Population | % Population |
| Central America | 14 | 1.5% |
| Latin America | 14 | 1.5% |
| Mexico | 14 | 1.5% | View All 3 Rows |
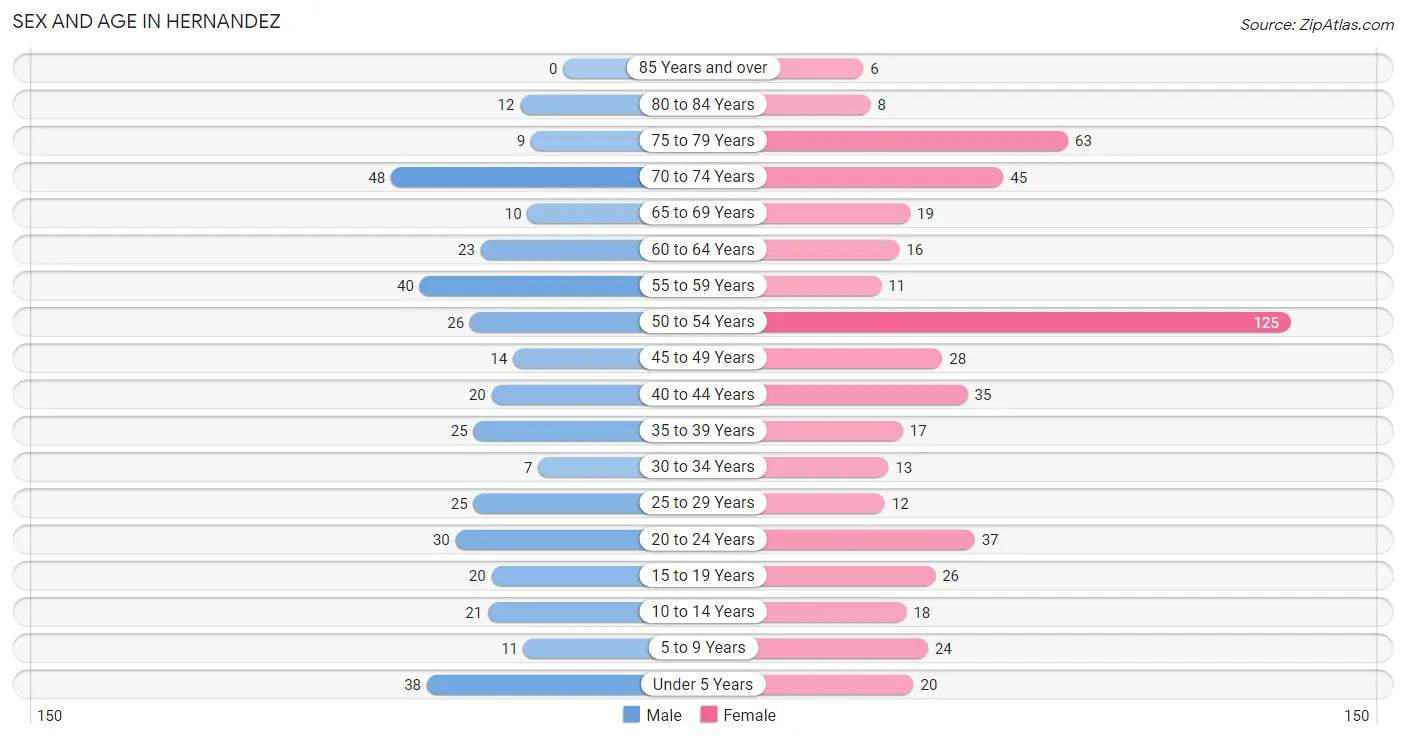
Sex and Age in Hernandez
Sex and Age in Hernandez
The most populous age groups in Hernandez are 70 to 74 Years (48 | 12.7%) for men and 50 to 54 Years (125 | 23.9%) for women.
| Age Bracket | Male | Female |
| Under 5 Years | 38 (10.0%) | 20 (3.8%) |
| 5 to 9 Years | 11 (2.9%) | 24 (4.6%) |
| 10 to 14 Years | 21 (5.5%) | 18 (3.4%) |
| 15 to 19 Years | 20 (5.3%) | 26 (5.0%) |
| 20 to 24 Years | 30 (7.9%) | 37 (7.1%) |
| 25 to 29 Years | 25 (6.6%) | 12 (2.3%) |
| 30 to 34 Years | 7 (1.8%) | 13 (2.5%) |
| 35 to 39 Years | 25 (6.6%) | 17 (3.3%) |
| 40 to 44 Years | 20 (5.3%) | 35 (6.7%) |
| 45 to 49 Years | 14 (3.7%) | 28 (5.3%) |
| 50 to 54 Years | 26 (6.9%) | 125 (23.9%) |
| 55 to 59 Years | 40 (10.5%) | 11 (2.1%) |
| 60 to 64 Years | 23 (6.1%) | 16 (3.1%) |
| 65 to 69 Years | 10 (2.6%) | 19 (3.6%) |
| 70 to 74 Years | 48 (12.7%) | 45 (8.6%) |
| 75 to 79 Years | 9 (2.4%) | 63 (12.0%) |
| 80 to 84 Years | 12 (3.2%) | 8 (1.5%) |
| 85 Years and over | 0 (0.0%) | 6 (1.1%) |
| Total | 379 (100.0%) | 523 (100.0%) |
Families and Households in Hernandez
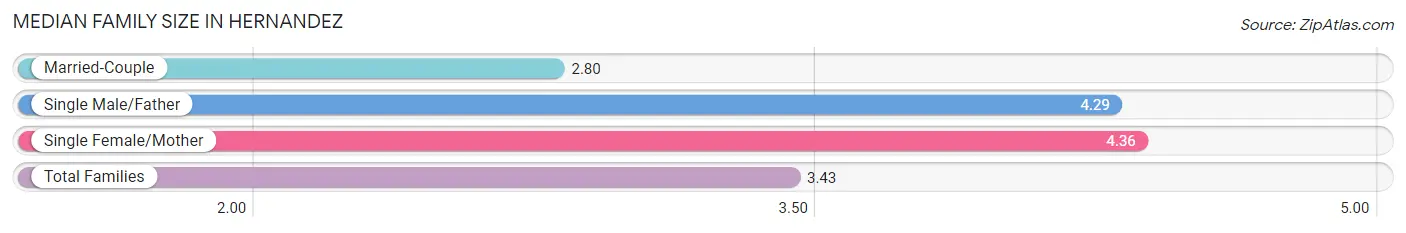
Median Family Size in Hernandez
The median family size in Hernandez is 3.43 persons per family, with single female/mother families (58 | 31.7%) accounting for the largest median family size of 4.36 persons per family. On the other hand, married-couple families (108 | 59.0%) represent the smallest median family size with 2.80 persons per family.
| Family Type | # Families | Family Size |
| Married-Couple | 108 (59.0%) | 2.80 |
| Single Male/Father | 17 (9.3%) | 4.29 |
| Single Female/Mother | 58 (31.7%) | 4.36 |
| Total Families | 183 (100.0%) | 3.43 |
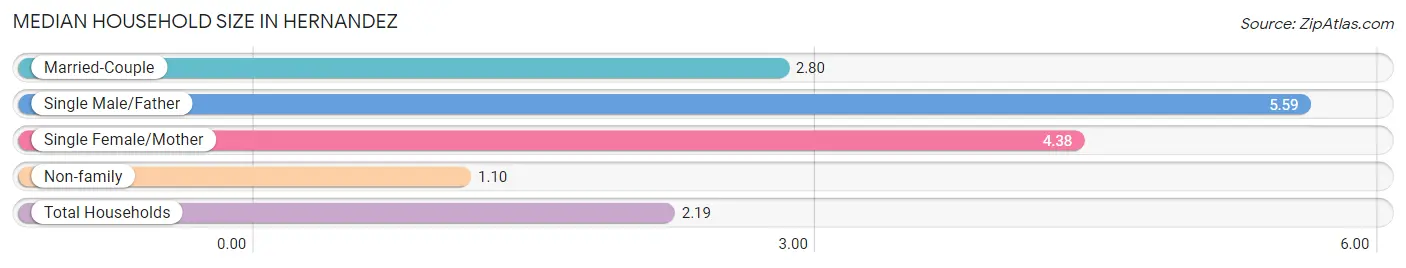
Median Household Size in Hernandez
The median household size in Hernandez is 2.19 persons per household, with single male/father households (17 | 4.1%) accounting for the largest median household size of 5.59 persons per household. non-family households (228 | 55.5%) represent the smallest median household size with 1.10 persons per household.
| Household Type | # Households | Household Size |
| Married-Couple | 108 (26.3%) | 2.80 |
| Single Male/Father | 17 (4.1%) | 5.59 |
| Single Female/Mother | 58 (14.1%) | 4.38 |
| Non-family | 228 (55.5%) | 1.10 |
| Total Households | 411 (100.0%) | 2.19 |
Household Size by Marriage Status in Hernandez
Out of a total of 411 households in Hernandez, 183 (44.5%) are family households, while 228 (55.5%) are nonfamily households. The most numerous type of family households are 2-person households, comprising 90, and the most common type of nonfamily households are 1-person households, comprising 221.
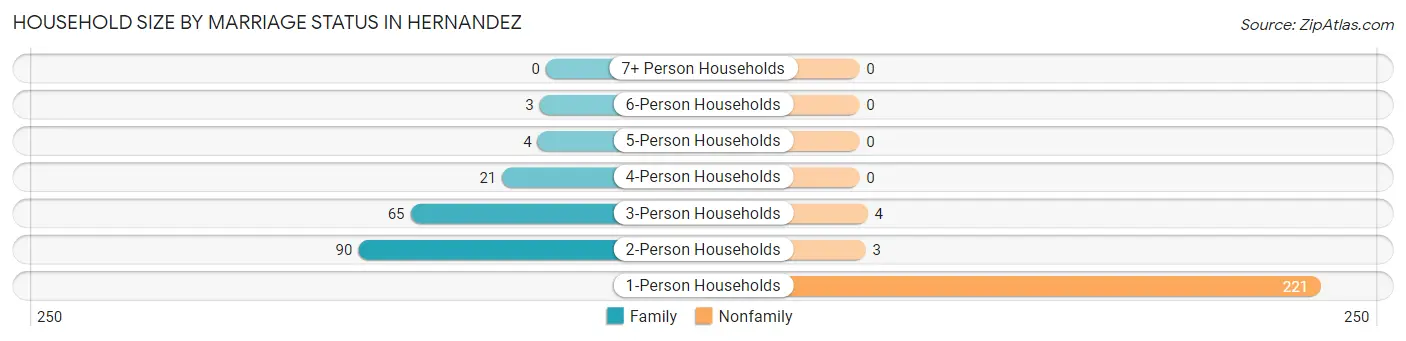
| Household Size | Family Households | Nonfamily Households |
| 1-Person Households | - | 221 (53.8%) |
| 2-Person Households | 90 (21.9%) | 3 (0.7%) |
| 3-Person Households | 65 (15.8%) | 4 (1.0%) |
| 4-Person Households | 21 (5.1%) | 0 (0.0%) |
| 5-Person Households | 4 (1.0%) | 0 (0.0%) |
| 6-Person Households | 3 (0.7%) | 0 (0.0%) |
| 7+ Person Households | 0 (0.0%) | 0 (0.0%) |
| Total | 183 (44.5%) | 228 (55.5%) |
Female Fertility in Hernandez
Fertility by Age in Hernandez
| Age Bracket | Women with Births | Births / 1,000 Women |
| 15 to 19 years | 0 (0.0%) | 0.0 |
| 20 to 34 years | 0 (0.0%) | 0.0 |
| 35 to 50 years | 0 (0.0%) | 0.0 |
| Total | 0 (0.0%) | 0.0 |
Fertility by Age by Marriage Status in Hernandez
| Age Bracket | Married | Unmarried |
| 15 to 19 years | 0 (0.0%) | 0 (0.0%) |
| 20 to 34 years | 0 (0.0%) | 0 (0.0%) |
| 35 to 50 years | 0 (0.0%) | 0 (0.0%) |
| Total | 0 (0.0%) | 0 (0.0%) |
Fertility by Education in Hernandez
| Educational Attainment | Women with Births | Births / 1,000 Women |
| Less than High School | 0 (0.0%) | 0.0 |
| High School Diploma | 0 (0.0%) | 0.0 |
| College or Associate's Degree | 0 (0.0%) | 0.0 |
| Bachelor's Degree | 0 (0.0%) | 0.0 |
| Graduate Degree | 0 (0.0%) | 0.0 |
| Total | 0 (0.0%) | 0.0 |
Fertility by Education by Marriage Status in Hernandez
| Educational Attainment | Married | Unmarried |
| Less than High School | 0 (0.0%) | 0 (0.0%) |
| High School Diploma | 0 (0.0%) | 0 (0.0%) |
| College or Associate's Degree | 0 (0.0%) | 0 (0.0%) |
| Bachelor's Degree | 0 (0.0%) | 0 (0.0%) |
| Graduate Degree | 0 (0.0%) | 0 (0.0%) |
| Total | 0 (0.0%) | 0 (0.0%) |
Employment Characteristics in Hernandez
Employment by Class of Employer in Hernandez
Among the 249 employed individuals in Hernandez, private company employees (147 | 59.0%), federal government employees (56 | 22.5%), and local government employees (14 | 5.6%) make up the most common classes of employment.
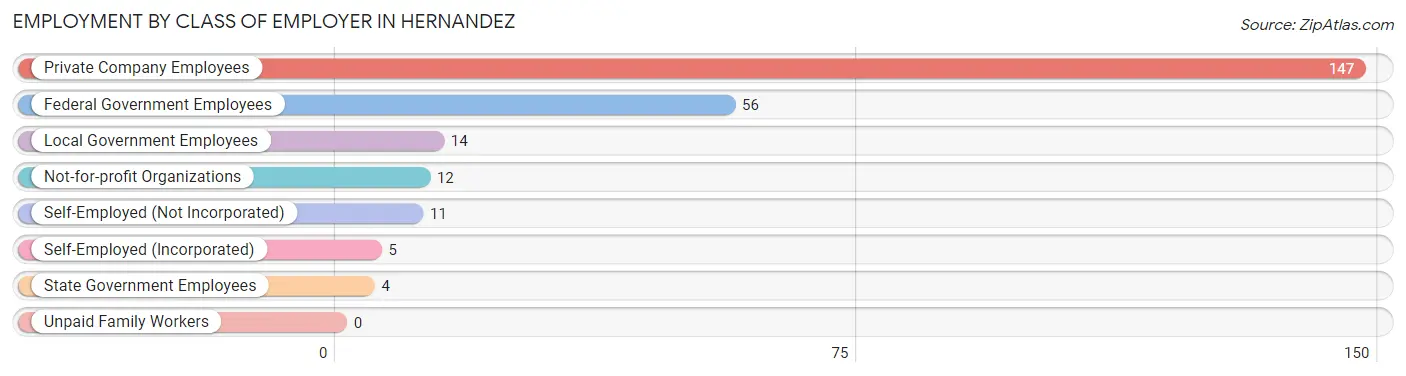
| Employer Class | # Employees | % Employees |
| Private Company Employees | 147 | 59.0% |
| Self-Employed (Incorporated) | 5 | 2.0% |
| Self-Employed (Not Incorporated) | 11 | 4.4% |
| Not-for-profit Organizations | 12 | 4.8% |
| Local Government Employees | 14 | 5.6% |
| State Government Employees | 4 | 1.6% |
| Federal Government Employees | 56 | 22.5% |
| Unpaid Family Workers | 0 | 0.0% |
| Total | 249 | 100.0% |
Employment Status by Age in Hernandez
According to the labor force statistics for Hernandez, out of the total population over 16 years of age (753), 39.2% or 295 individuals are in the labor force, with 11.5% or 34 of them unemployed. The age group with the highest labor force participation rate is 30 to 34 years, with 100.0% or 20 individuals in the labor force. Within the labor force, the 45 to 54 years age range has the highest percentage of unemployed individuals, with 29.5% or 18 of them being unemployed.
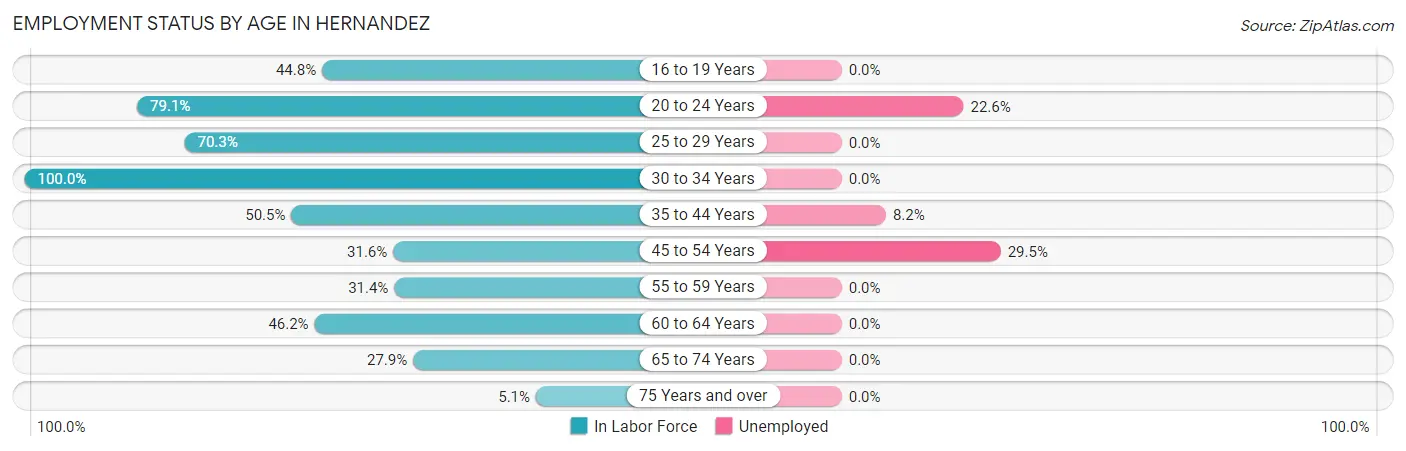
| Age Bracket | In Labor Force | Unemployed |
| 16 to 19 Years | 13 (44.8%) | 0 (0.0%) |
| 20 to 24 Years | 53 (79.1%) | 12 (22.6%) |
| 25 to 29 Years | 26 (70.3%) | 0 (0.0%) |
| 30 to 34 Years | 20 (100.0%) | 0 (0.0%) |
| 35 to 44 Years | 49 (50.5%) | 4 (8.2%) |
| 45 to 54 Years | 61 (31.6%) | 18 (29.5%) |
| 55 to 59 Years | 16 (31.4%) | 0 (0.0%) |
| 60 to 64 Years | 18 (46.2%) | 0 (0.0%) |
| 65 to 74 Years | 34 (27.9%) | 0 (0.0%) |
| 75 Years and over | 5 (5.1%) | 0 (0.0%) |
| Total | 295 (39.2%) | 34 (11.5%) |
Employment Status by Educational Attainment in Hernandez
According to labor force statistics for Hernandez, 43.5% of individuals (190) out of the total population between 25 and 64 years of age (437) are in the labor force, with 11.6% or 22 of them being unemployed. The group with the highest labor force participation rate are those with the educational attainment of bachelor's degree or higher, with 78.1% or 25 individuals in the labor force. Within the labor force, individuals with high school diploma education have the highest percentage of unemployment, with 32.8% or 22 of them being unemployed.
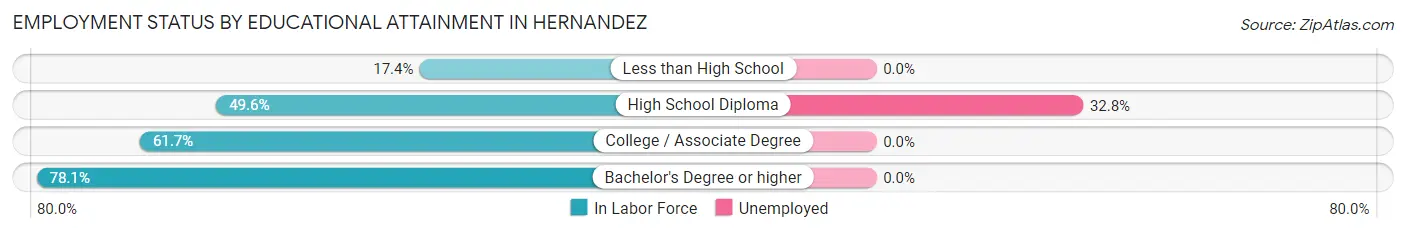
| Educational Attainment | In Labor Force | Unemployed |
| Less than High School | 27 (17.4%) | 0 (0.0%) |
| High School Diploma | 67 (49.6%) | 44 (32.8%) |
| College / Associate Degree | 71 (61.7%) | 0 (0.0%) |
| Bachelor's Degree or higher | 25 (78.1%) | 0 (0.0%) |
| Total | 190 (43.5%) | 51 (11.6%) |
Employment Occupations by Sex in Hernandez
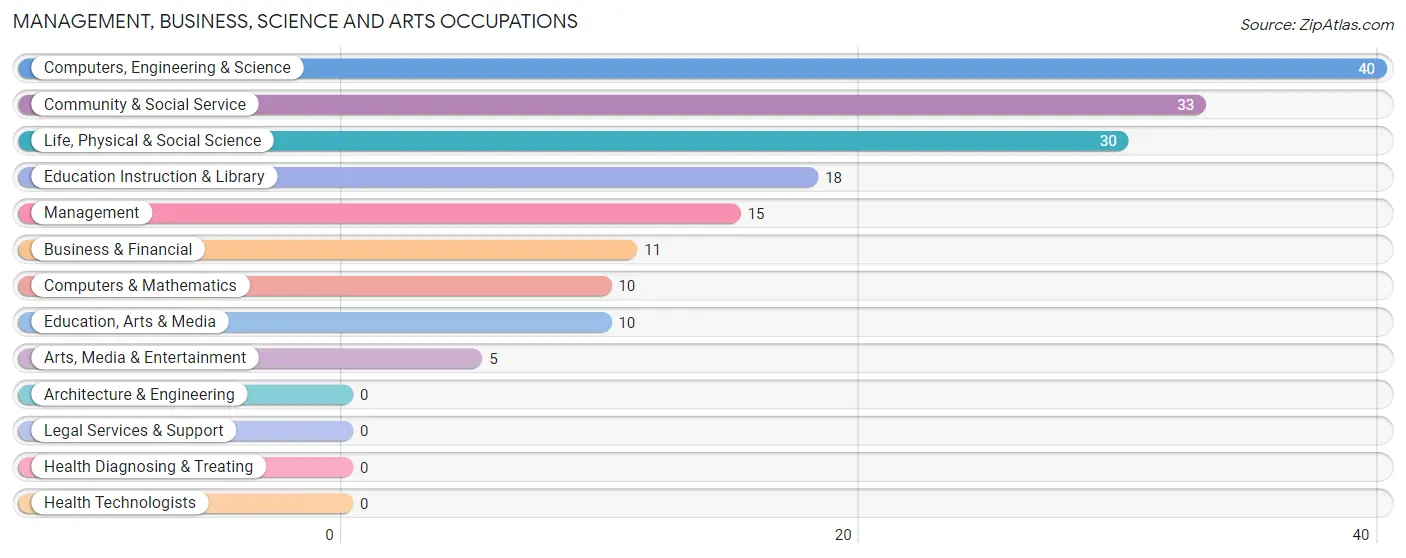
Management, Business, Science and Arts Occupations
The most common Management, Business, Science and Arts occupations in Hernandez are Computers, Engineering & Science (40 | 15.3%), Community & Social Service (33 | 12.6%), Life, Physical & Social Science (30 | 11.5%), Education Instruction & Library (18 | 6.9%), and Management (15 | 5.8%).
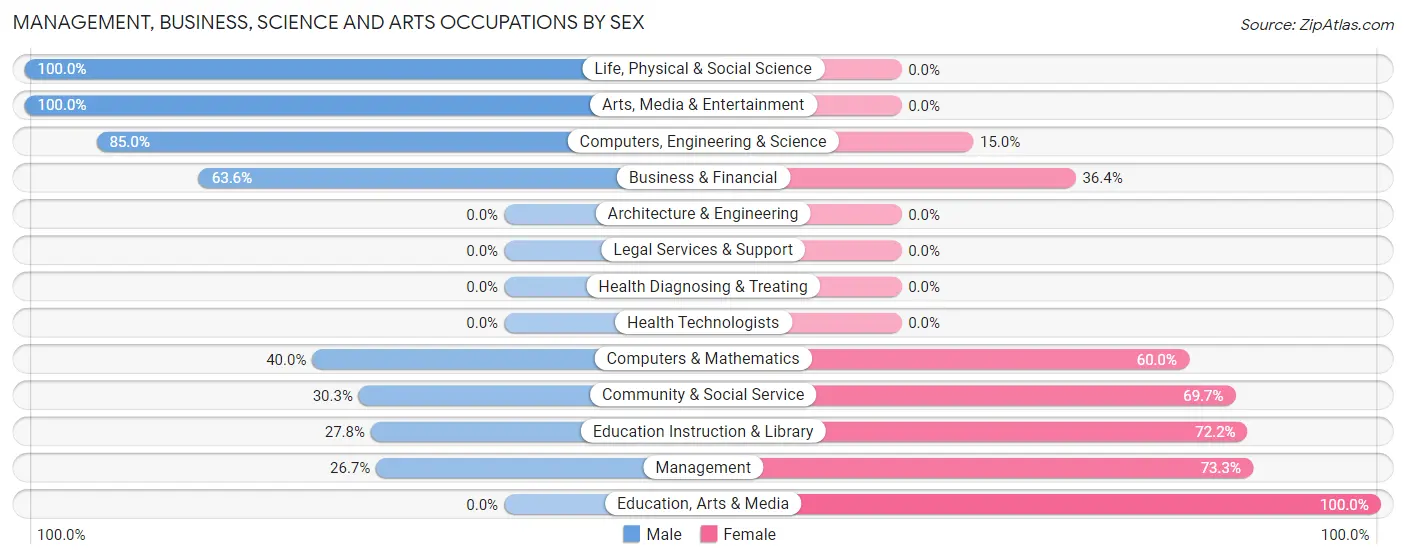
Management, Business, Science and Arts Occupations by Sex
Within the Management, Business, Science and Arts occupations in Hernandez, the most male-oriented occupations are Life, Physical & Social Science (100.0%), Arts, Media & Entertainment (100.0%), and Computers, Engineering & Science (85.0%), while the most female-oriented occupations are Education, Arts & Media (100.0%), Management (73.3%), and Education Instruction & Library (72.2%).
| Occupation | Male | Female |
| Management | 4 (26.7%) | 11 (73.3%) |
| Business & Financial | 7 (63.6%) | 4 (36.4%) |
| Computers, Engineering & Science | 34 (85.0%) | 6 (15.0%) |
| Computers & Mathematics | 4 (40.0%) | 6 (60.0%) |
| Architecture & Engineering | 0 (0.0%) | 0 (0.0%) |
| Life, Physical & Social Science | 30 (100.0%) | 0 (0.0%) |
| Community & Social Service | 10 (30.3%) | 23 (69.7%) |
| Education, Arts & Media | 0 (0.0%) | 10 (100.0%) |
| Legal Services & Support | 0 (0.0%) | 0 (0.0%) |
| Education Instruction & Library | 5 (27.8%) | 13 (72.2%) |
| Arts, Media & Entertainment | 5 (100.0%) | 0 (0.0%) |
| Health Diagnosing & Treating | 0 (0.0%) | 0 (0.0%) |
| Health Technologists | 0 (0.0%) | 0 (0.0%) |
| Total (Category) | 55 (55.6%) | 44 (44.4%) |
| Total (Overall) | 137 (52.5%) | 124 (47.5%) |
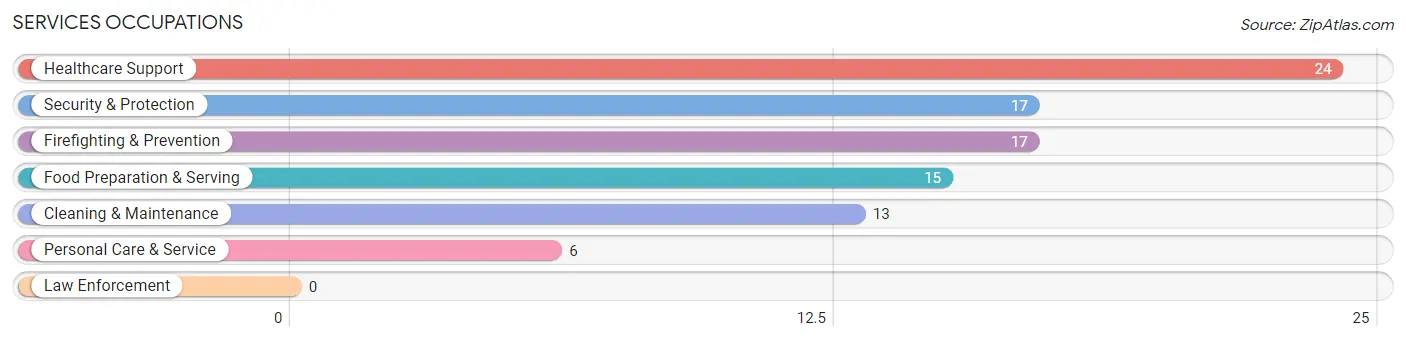
Services Occupations
The most common Services occupations in Hernandez are Healthcare Support (24 | 9.2%), Security & Protection (17 | 6.5%), Firefighting & Prevention (17 | 6.5%), Food Preparation & Serving (15 | 5.8%), and Cleaning & Maintenance (13 | 5.0%).
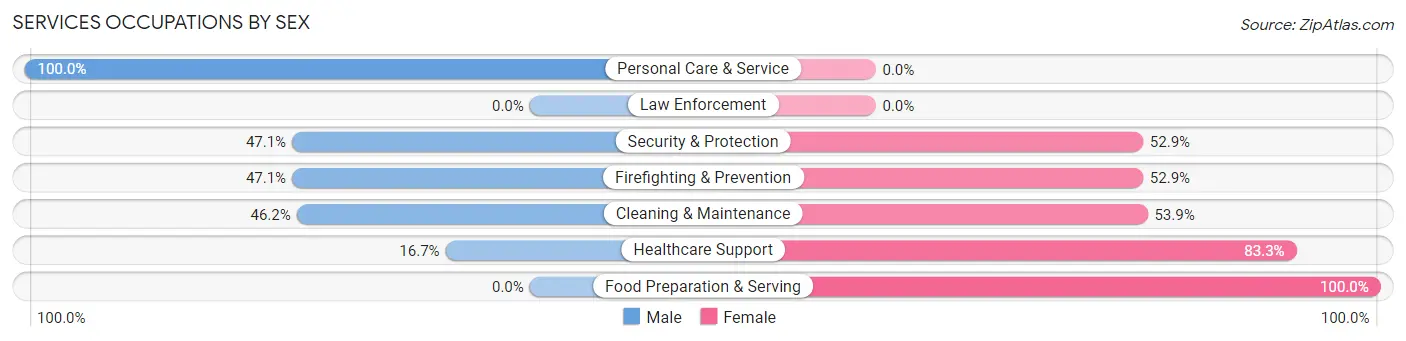
Services Occupations by Sex
Within the Services occupations in Hernandez, the most male-oriented occupations are Personal Care & Service (100.0%), Security & Protection (47.1%), and Firefighting & Prevention (47.1%), while the most female-oriented occupations are Food Preparation & Serving (100.0%), Healthcare Support (83.3%), and Cleaning & Maintenance (53.8%).
| Occupation | Male | Female |
| Healthcare Support | 4 (16.7%) | 20 (83.3%) |
| Security & Protection | 8 (47.1%) | 9 (52.9%) |
| Firefighting & Prevention | 8 (47.1%) | 9 (52.9%) |
| Law Enforcement | 0 (0.0%) | 0 (0.0%) |
| Food Preparation & Serving | 0 (0.0%) | 15 (100.0%) |
| Cleaning & Maintenance | 6 (46.2%) | 7 (53.8%) |
| Personal Care & Service | 6 (100.0%) | 0 (0.0%) |
| Total (Category) | 24 (32.0%) | 51 (68.0%) |
| Total (Overall) | 137 (52.5%) | 124 (47.5%) |
Sales and Office Occupations
The most common Sales and Office occupations in Hernandez are Office & Administration (34 | 13.0%), and Sales & Related (4 | 1.5%).
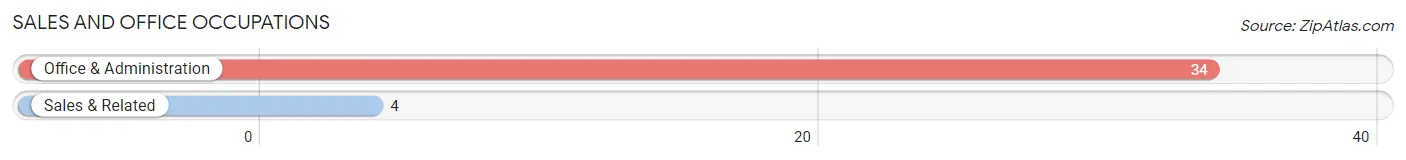
Sales and Office Occupations by Sex

| Occupation | Male | Female |
| Sales & Related | 4 (100.0%) | 0 (0.0%) |
| Office & Administration | 14 (41.2%) | 20 (58.8%) |
| Total (Category) | 18 (47.4%) | 20 (52.6%) |
| Total (Overall) | 137 (52.5%) | 124 (47.5%) |
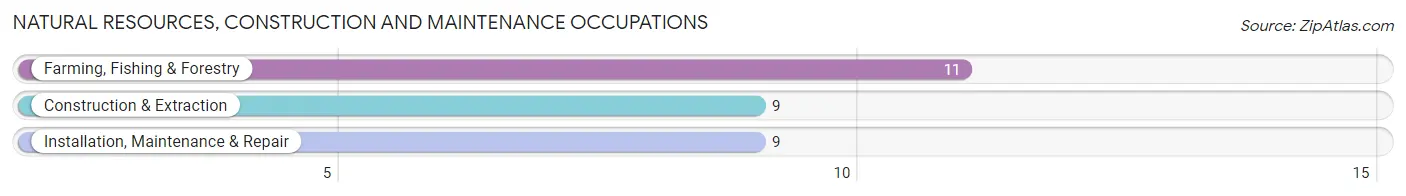
Natural Resources, Construction and Maintenance Occupations
The most common Natural Resources, Construction and Maintenance occupations in Hernandez are Farming, Fishing & Forestry (11 | 4.2%), Construction & Extraction (9 | 3.5%), and Installation, Maintenance & Repair (9 | 3.5%).
Natural Resources, Construction and Maintenance Occupations by Sex
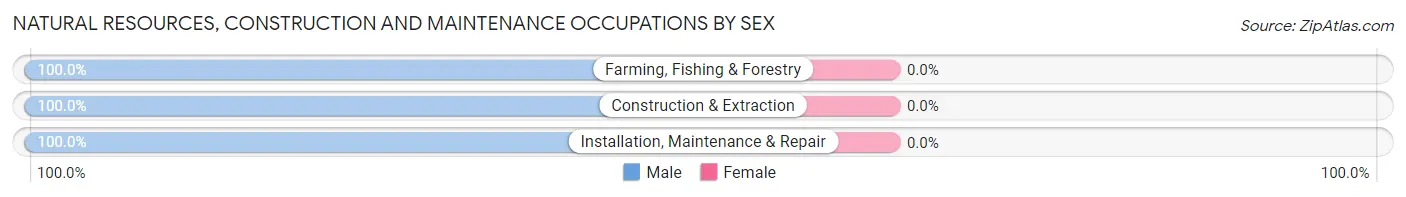
| Occupation | Male | Female |
| Farming, Fishing & Forestry | 11 (100.0%) | 0 (0.0%) |
| Construction & Extraction | 9 (100.0%) | 0 (0.0%) |
| Installation, Maintenance & Repair | 9 (100.0%) | 0 (0.0%) |
| Total (Category) | 29 (100.0%) | 0 (0.0%) |
| Total (Overall) | 137 (52.5%) | 124 (47.5%) |
Production, Transportation and Moving Occupations
The most common Production, Transportation and Moving occupations in Hernandez are Production (8 | 3.1%), Material Moving (7 | 2.7%), and Transportation (5 | 1.9%).
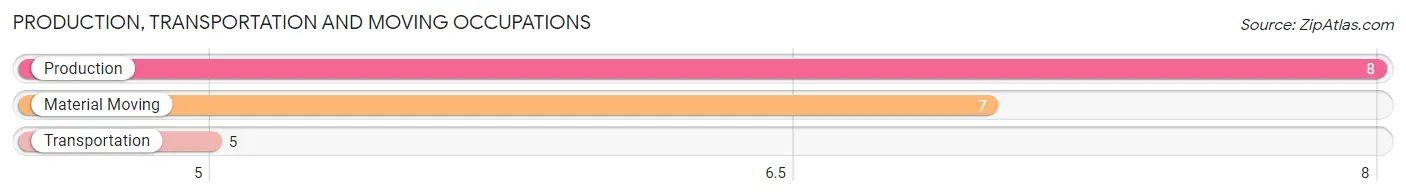
Production, Transportation and Moving Occupations by Sex
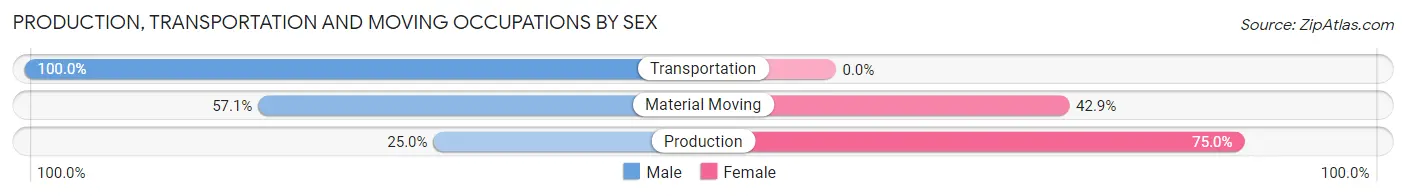
| Occupation | Male | Female |
| Production | 2 (25.0%) | 6 (75.0%) |
| Transportation | 5 (100.0%) | 0 (0.0%) |
| Material Moving | 4 (57.1%) | 3 (42.9%) |
| Total (Category) | 11 (55.0%) | 9 (45.0%) |
| Total (Overall) | 137 (52.5%) | 124 (47.5%) |
Employment Industries by Sex in Hernandez
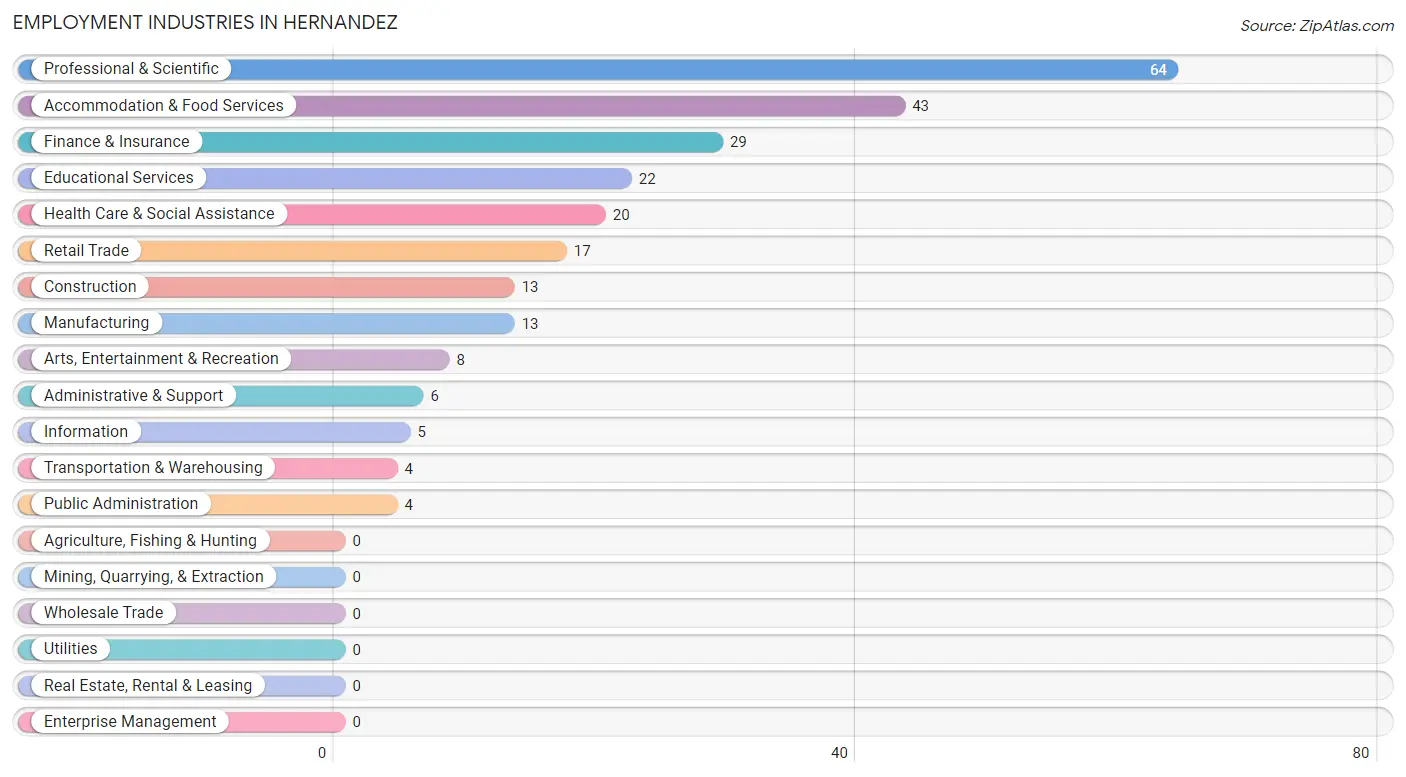
Employment Industries in Hernandez
The major employment industries in Hernandez include Professional & Scientific (64 | 24.5%), Accommodation & Food Services (43 | 16.5%), Finance & Insurance (29 | 11.1%), Educational Services (22 | 8.4%), and Health Care & Social Assistance (20 | 7.7%).
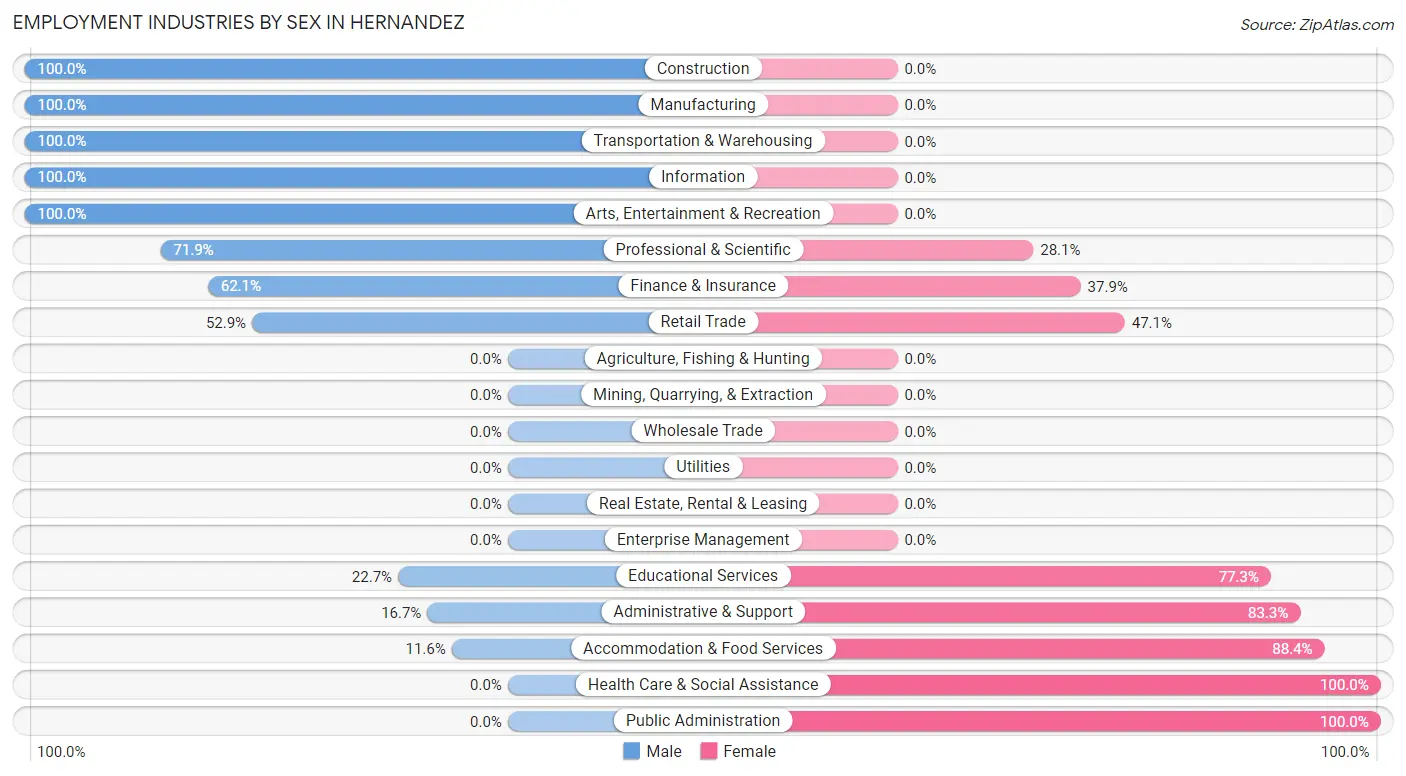
Employment Industries by Sex in Hernandez
The Hernandez industries that see more men than women are Construction (100.0%), Manufacturing (100.0%), and Transportation & Warehousing (100.0%), whereas the industries that tend to have a higher number of women are Health Care & Social Assistance (100.0%), Public Administration (100.0%), and Accommodation & Food Services (88.4%).
| Industry | Male | Female |
| Agriculture, Fishing & Hunting | 0 (0.0%) | 0 (0.0%) |
| Mining, Quarrying, & Extraction | 0 (0.0%) | 0 (0.0%) |
| Construction | 13 (100.0%) | 0 (0.0%) |
| Manufacturing | 13 (100.0%) | 0 (0.0%) |
| Wholesale Trade | 0 (0.0%) | 0 (0.0%) |
| Retail Trade | 9 (52.9%) | 8 (47.1%) |
| Transportation & Warehousing | 4 (100.0%) | 0 (0.0%) |
| Utilities | 0 (0.0%) | 0 (0.0%) |
| Information | 5 (100.0%) | 0 (0.0%) |
| Finance & Insurance | 18 (62.1%) | 11 (37.9%) |
| Real Estate, Rental & Leasing | 0 (0.0%) | 0 (0.0%) |
| Professional & Scientific | 46 (71.9%) | 18 (28.1%) |
| Enterprise Management | 0 (0.0%) | 0 (0.0%) |
| Administrative & Support | 1 (16.7%) | 5 (83.3%) |
| Educational Services | 5 (22.7%) | 17 (77.3%) |
| Health Care & Social Assistance | 0 (0.0%) | 20 (100.0%) |
| Arts, Entertainment & Recreation | 8 (100.0%) | 0 (0.0%) |
| Accommodation & Food Services | 5 (11.6%) | 38 (88.4%) |
| Public Administration | 0 (0.0%) | 4 (100.0%) |
| Total | 137 (52.5%) | 124 (47.5%) |
Education in Hernandez
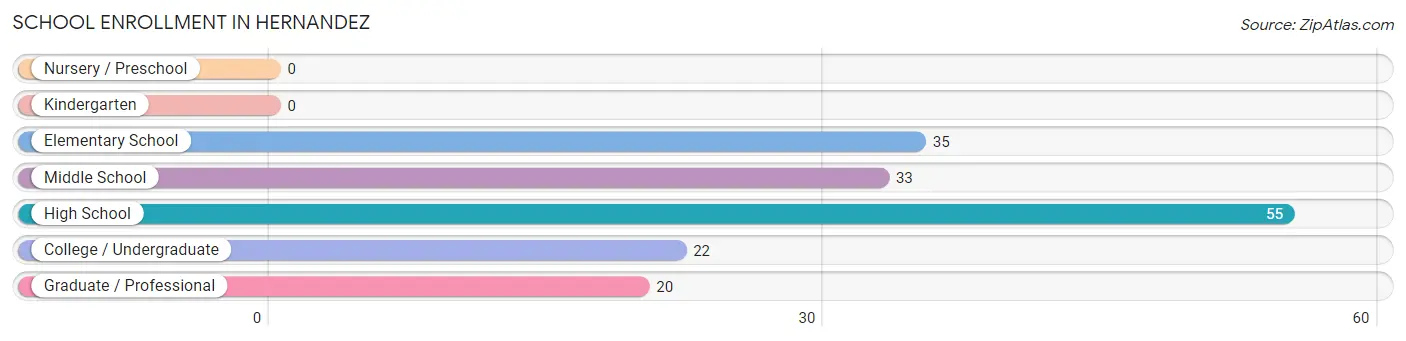
School Enrollment in Hernandez
The most common levels of schooling among the 165 students in Hernandez are high school (55 | 33.3%), elementary school (35 | 21.2%), and middle school (33 | 20.0%).
| School Level | # Students | % Students |
| Nursery / Preschool | 0 | 0.0% |
| Kindergarten | 0 | 0.0% |
| Elementary School | 35 | 21.2% |
| Middle School | 33 | 20.0% |
| High School | 55 | 33.3% |
| College / Undergraduate | 22 | 13.3% |
| Graduate / Professional | 20 | 12.1% |
| Total | 165 | 100.0% |
School Enrollment by Age by Funding Source in Hernandez
Out of a total of 165 students who are enrolled in schools in Hernandez, 4 (2.4%) attend a private institution, while the remaining 161 (97.6%) are enrolled in public schools. The age group of 35 years and over has the highest likelihood of being enrolled in private schools, with 4 (26.7% in the age bracket) enrolled. Conversely, the age group of 5 to 9 year old has the lowest likelihood of being enrolled in a private school, with 35 (100.0% in the age bracket) attending a public institution.
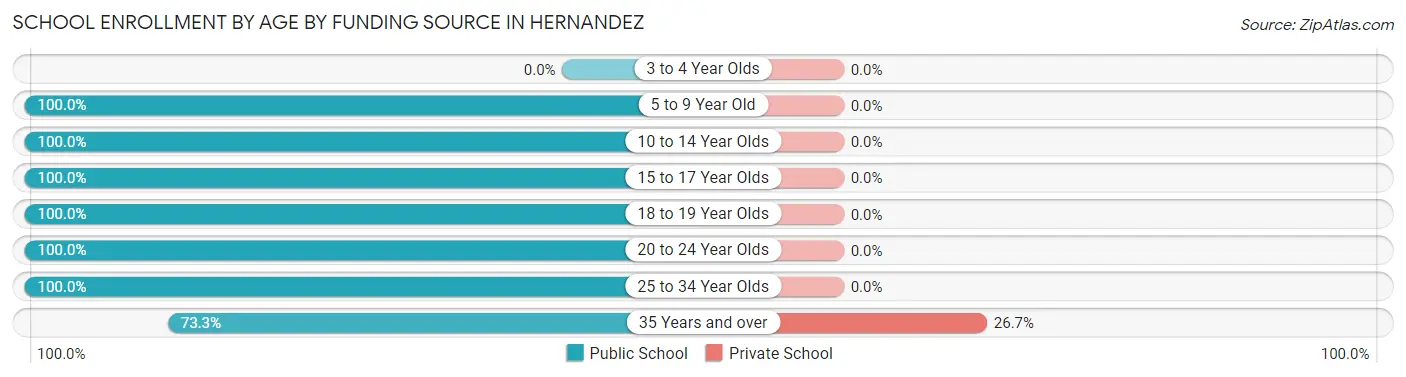
| Age Bracket | Public School | Private School |
| 3 to 4 Year Olds | 0 (0.0%) | 0 (0.0%) |
| 5 to 9 Year Old | 35 (100.0%) | 0 (0.0%) |
| 10 to 14 Year Olds | 39 (100.0%) | 0 (0.0%) |
| 15 to 17 Year Olds | 31 (100.0%) | 0 (0.0%) |
| 18 to 19 Year Olds | 15 (100.0%) | 0 (0.0%) |
| 20 to 24 Year Olds | 18 (100.0%) | 0 (0.0%) |
| 25 to 34 Year Olds | 12 (100.0%) | 0 (0.0%) |
| 35 Years and over | 11 (73.3%) | 4 (26.7%) |
| Total | 161 (97.6%) | 4 (2.4%) |
Educational Attainment by Field of Study in Hernandez
Education (34 | 44.2%), business (14 | 18.2%), arts & humanities (14 | 18.2%), computers & mathematics (8 | 10.4%), and psychology (7 | 9.1%) are the most common fields of study among 77 individuals in Hernandez who have obtained a bachelor's degree or higher.
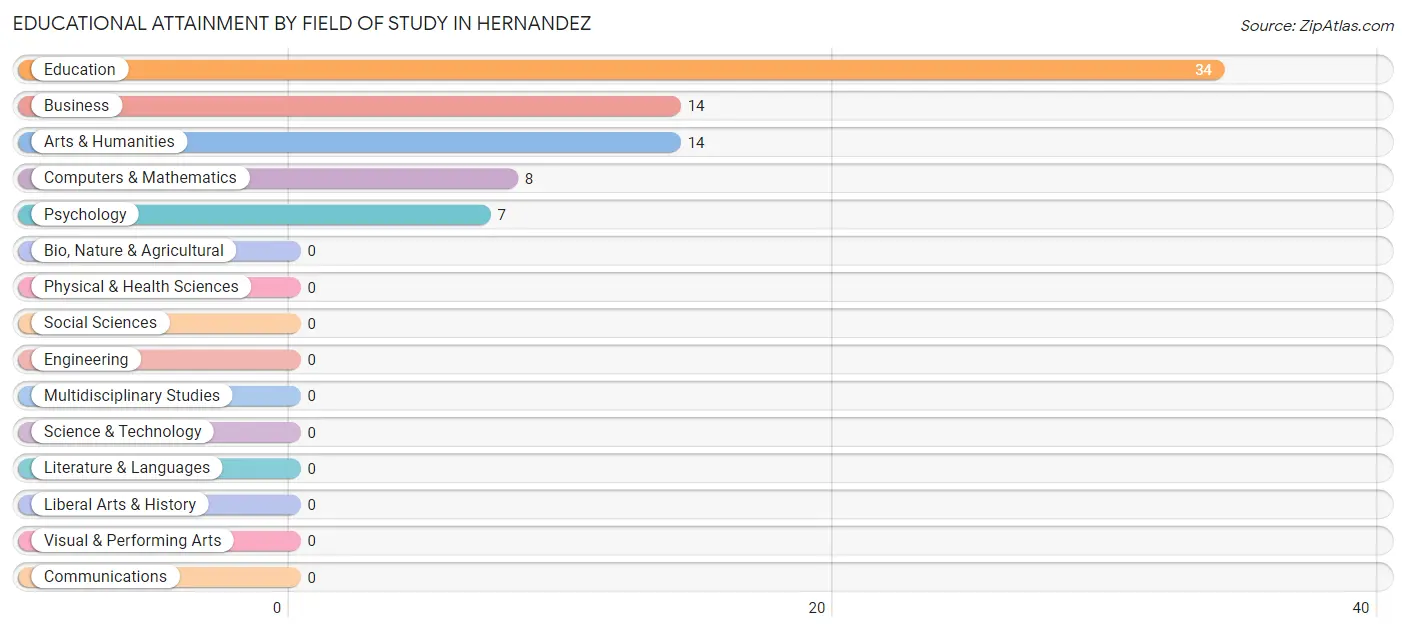
| Field of Study | # Graduates | % Graduates |
| Computers & Mathematics | 8 | 10.4% |
| Bio, Nature & Agricultural | 0 | 0.0% |
| Physical & Health Sciences | 0 | 0.0% |
| Psychology | 7 | 9.1% |
| Social Sciences | 0 | 0.0% |
| Engineering | 0 | 0.0% |
| Multidisciplinary Studies | 0 | 0.0% |
| Science & Technology | 0 | 0.0% |
| Business | 14 | 18.2% |
| Education | 34 | 44.2% |
| Literature & Languages | 0 | 0.0% |
| Liberal Arts & History | 0 | 0.0% |
| Visual & Performing Arts | 0 | 0.0% |
| Communications | 0 | 0.0% |
| Arts & Humanities | 14 | 18.2% |
| Total | 77 | 100.0% |
Transportation & Commute in Hernandez
Vehicle Availability by Sex in Hernandez
The most prevalent vehicle ownership categories in Hernandez are males with 5 or more vehicles (41, accounting for 31.1%) and females with 5 or more vehicles (6, making up 35.0%).
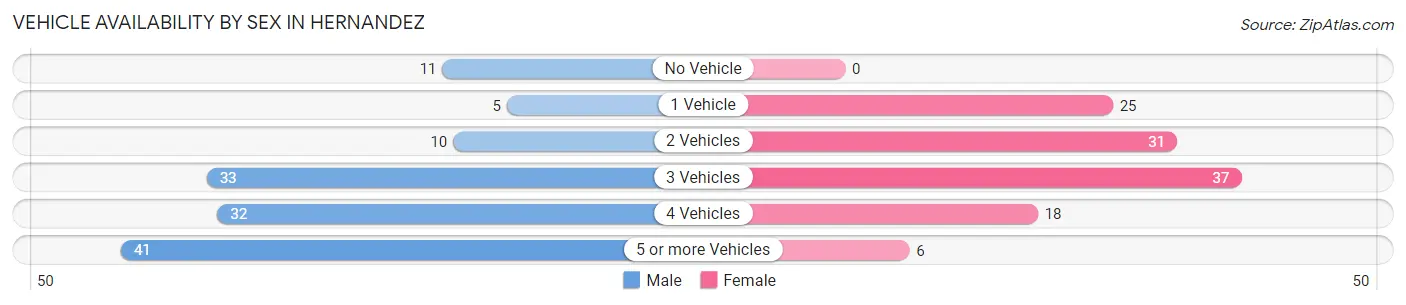
| Vehicles Available | Male | Female |
| No Vehicle | 11 (8.3%) | 0 (0.0%) |
| 1 Vehicle | 5 (3.8%) | 25 (21.4%) |
| 2 Vehicles | 10 (7.6%) | 31 (26.5%) |
| 3 Vehicles | 33 (25.0%) | 37 (31.6%) |
| 4 Vehicles | 32 (24.2%) | 18 (15.4%) |
| 5 or more Vehicles | 41 (31.1%) | 6 (5.1%) |
| Total | 132 (100.0%) | 117 (100.0%) |
Commute Time in Hernandez
The most frequently occuring commute durations in Hernandez are 10 to 14 minutes (53 commuters, 22.0%), 5 to 9 minutes (44 commuters, 18.3%), and 15 to 19 minutes (42 commuters, 17.4%).
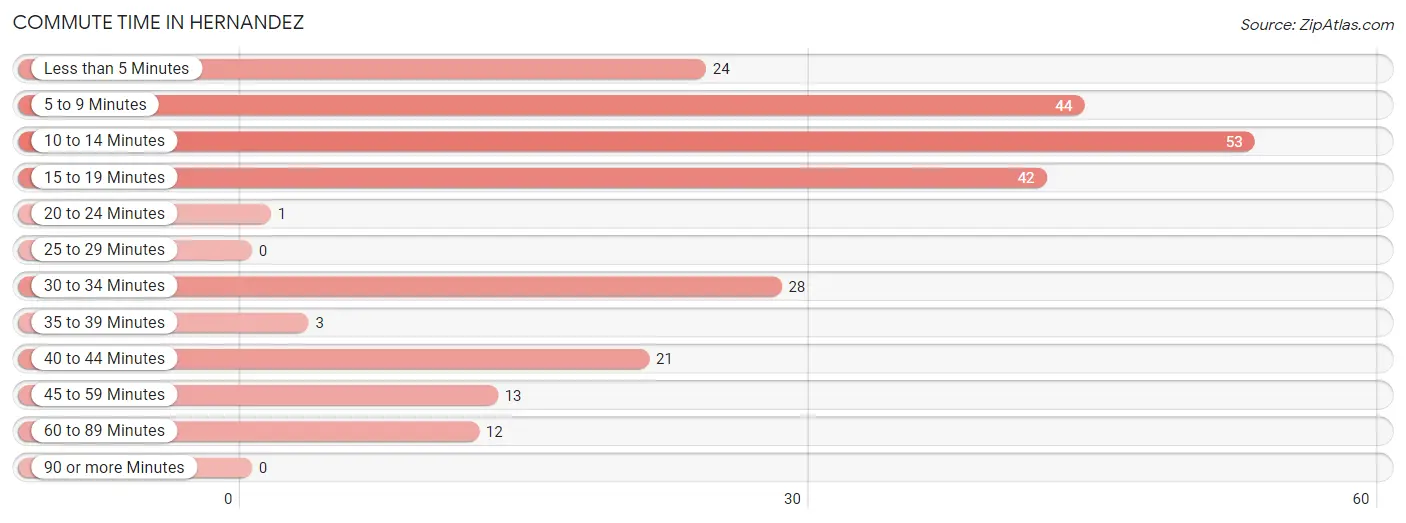
| Commute Time | # Commuters | % Commuters |
| Less than 5 Minutes | 24 | 10.0% |
| 5 to 9 Minutes | 44 | 18.3% |
| 10 to 14 Minutes | 53 | 22.0% |
| 15 to 19 Minutes | 42 | 17.4% |
| 20 to 24 Minutes | 1 | 0.4% |
| 25 to 29 Minutes | 0 | 0.0% |
| 30 to 34 Minutes | 28 | 11.6% |
| 35 to 39 Minutes | 3 | 1.2% |
| 40 to 44 Minutes | 21 | 8.7% |
| 45 to 59 Minutes | 13 | 5.4% |
| 60 to 89 Minutes | 12 | 5.0% |
| 90 or more Minutes | 0 | 0.0% |
Commute Time by Sex in Hernandez
The most common commute times in Hernandez are 5 to 9 minutes (41 commuters, 32.0%) for males and 15 to 19 minutes (32 commuters, 28.3%) for females.
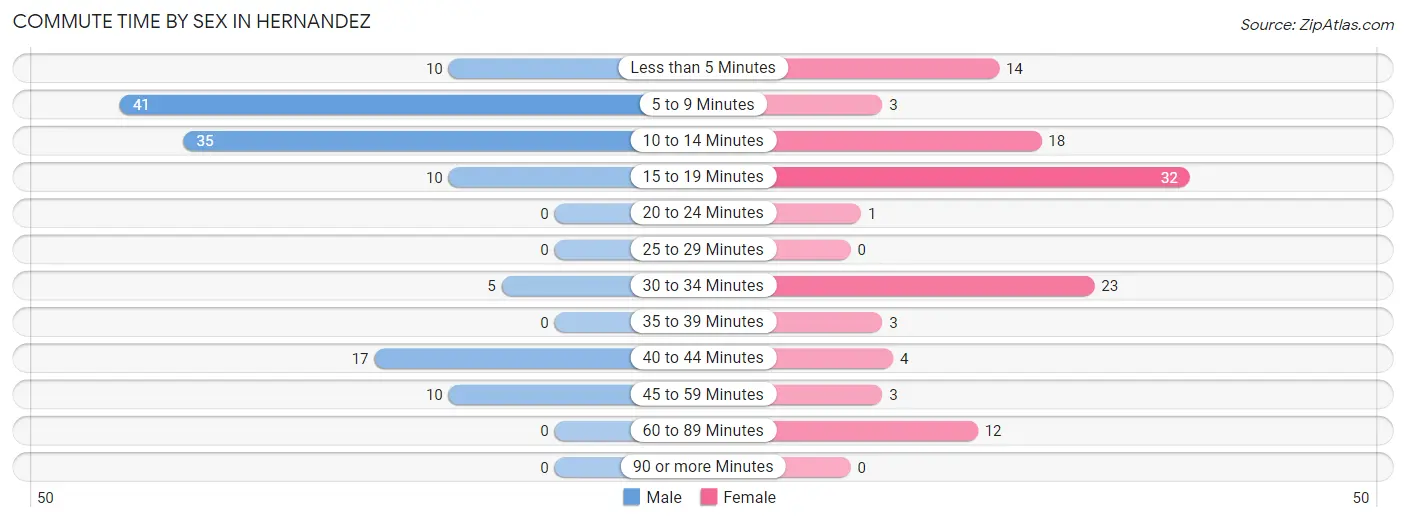
| Commute Time | Male | Female |
| Less than 5 Minutes | 10 (7.8%) | 14 (12.4%) |
| 5 to 9 Minutes | 41 (32.0%) | 3 (2.6%) |
| 10 to 14 Minutes | 35 (27.3%) | 18 (15.9%) |
| 15 to 19 Minutes | 10 (7.8%) | 32 (28.3%) |
| 20 to 24 Minutes | 0 (0.0%) | 1 (0.9%) |
| 25 to 29 Minutes | 0 (0.0%) | 0 (0.0%) |
| 30 to 34 Minutes | 5 (3.9%) | 23 (20.3%) |
| 35 to 39 Minutes | 0 (0.0%) | 3 (2.6%) |
| 40 to 44 Minutes | 17 (13.3%) | 4 (3.5%) |
| 45 to 59 Minutes | 10 (7.8%) | 3 (2.6%) |
| 60 to 89 Minutes | 0 (0.0%) | 12 (10.6%) |
| 90 or more Minutes | 0 (0.0%) | 0 (0.0%) |
Time of Departure to Work by Sex in Hernandez
The most frequent times of departure to work in Hernandez are 9:00 AM to 9:59 AM (32, 25.0%) for males and 7:30 AM to 7:59 AM (49, 43.4%) for females.
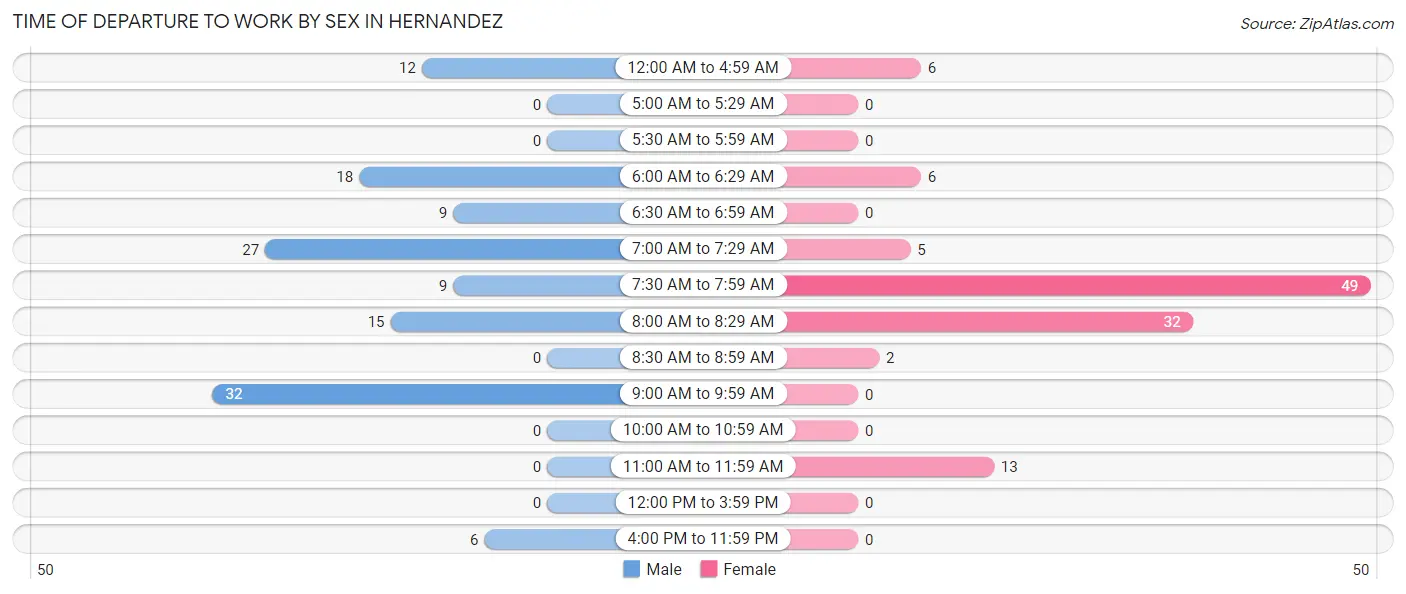
| Time of Departure | Male | Female |
| 12:00 AM to 4:59 AM | 12 (9.4%) | 6 (5.3%) |
| 5:00 AM to 5:29 AM | 0 (0.0%) | 0 (0.0%) |
| 5:30 AM to 5:59 AM | 0 (0.0%) | 0 (0.0%) |
| 6:00 AM to 6:29 AM | 18 (14.1%) | 6 (5.3%) |
| 6:30 AM to 6:59 AM | 9 (7.0%) | 0 (0.0%) |
| 7:00 AM to 7:29 AM | 27 (21.1%) | 5 (4.4%) |
| 7:30 AM to 7:59 AM | 9 (7.0%) | 49 (43.4%) |
| 8:00 AM to 8:29 AM | 15 (11.7%) | 32 (28.3%) |
| 8:30 AM to 8:59 AM | 0 (0.0%) | 2 (1.8%) |
| 9:00 AM to 9:59 AM | 32 (25.0%) | 0 (0.0%) |
| 10:00 AM to 10:59 AM | 0 (0.0%) | 0 (0.0%) |
| 11:00 AM to 11:59 AM | 0 (0.0%) | 13 (11.5%) |
| 12:00 PM to 3:59 PM | 0 (0.0%) | 0 (0.0%) |
| 4:00 PM to 11:59 PM | 6 (4.7%) | 0 (0.0%) |
| Total | 128 (100.0%) | 113 (100.0%) |
Housing Occupancy in Hernandez
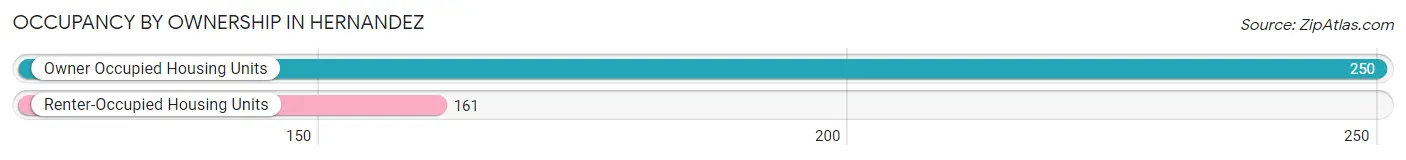
Occupancy by Ownership in Hernandez
Of the total 411 dwellings in Hernandez, owner-occupied units account for 250 (60.8%), while renter-occupied units make up 161 (39.2%).
| Occupancy | # Housing Units | % Housing Units |
| Owner Occupied Housing Units | 250 | 60.8% |
| Renter-Occupied Housing Units | 161 | 39.2% |
| Total Occupied Housing Units | 411 | 100.0% |
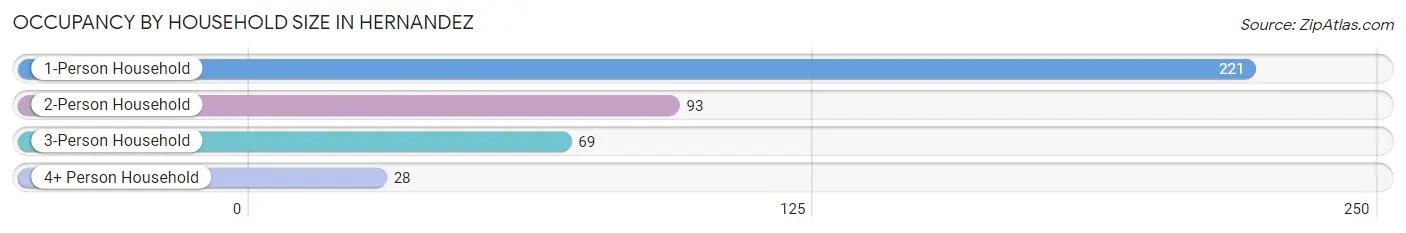
Occupancy by Household Size in Hernandez
| Household Size | # Housing Units | % Housing Units |
| 1-Person Household | 221 | 53.8% |
| 2-Person Household | 93 | 22.6% |
| 3-Person Household | 69 | 16.8% |
| 4+ Person Household | 28 | 6.8% |
| Total Housing Units | 411 | 100.0% |
Occupancy by Ownership by Household Size in Hernandez
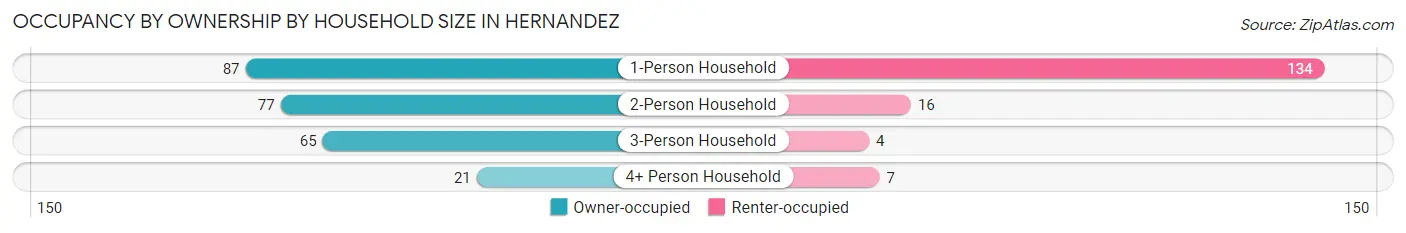
| Household Size | Owner-occupied | Renter-occupied |
| 1-Person Household | 87 (39.4%) | 134 (60.6%) |
| 2-Person Household | 77 (82.8%) | 16 (17.2%) |
| 3-Person Household | 65 (94.2%) | 4 (5.8%) |
| 4+ Person Household | 21 (75.0%) | 7 (25.0%) |
| Total Housing Units | 250 (60.8%) | 161 (39.2%) |
Occupancy by Educational Attainment in Hernandez
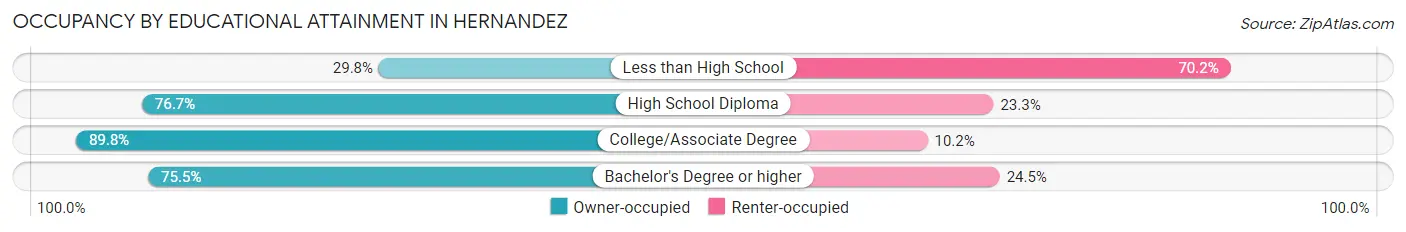
| Household Size | Owner-occupied | Renter-occupied |
| Less than High School | 50 (29.8%) | 118 (70.2%) |
| High School Diploma | 66 (76.7%) | 20 (23.3%) |
| College/Associate Degree | 97 (89.8%) | 11 (10.2%) |
| Bachelor's Degree or higher | 37 (75.5%) | 12 (24.5%) |
Occupancy by Age of Householder in Hernandez
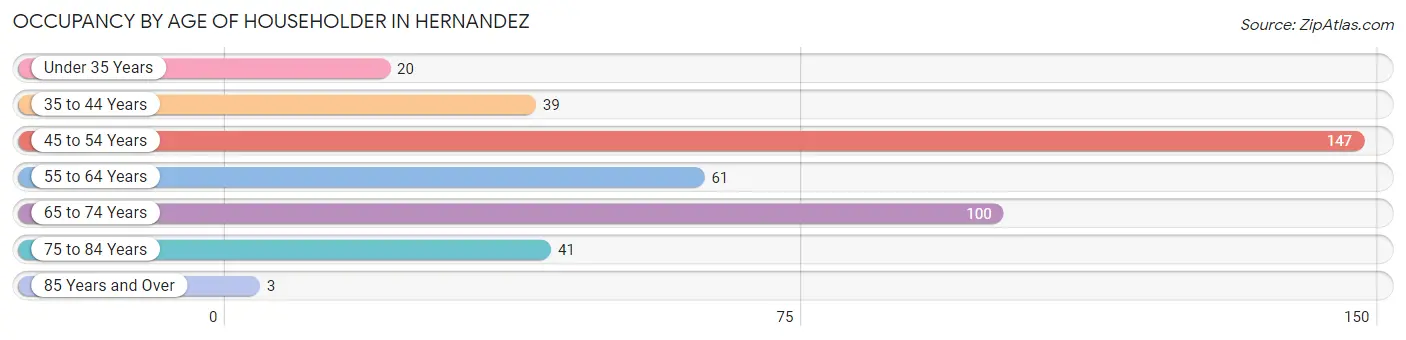
| Age Bracket | # Households | % Households |
| Under 35 Years | 20 | 4.9% |
| 35 to 44 Years | 39 | 9.5% |
| 45 to 54 Years | 147 | 35.8% |
| 55 to 64 Years | 61 | 14.8% |
| 65 to 74 Years | 100 | 24.3% |
| 75 to 84 Years | 41 | 10.0% |
| 85 Years and Over | 3 | 0.7% |
| Total | 411 | 100.0% |
Housing Finances in Hernandez
Median Income by Occupancy in Hernandez
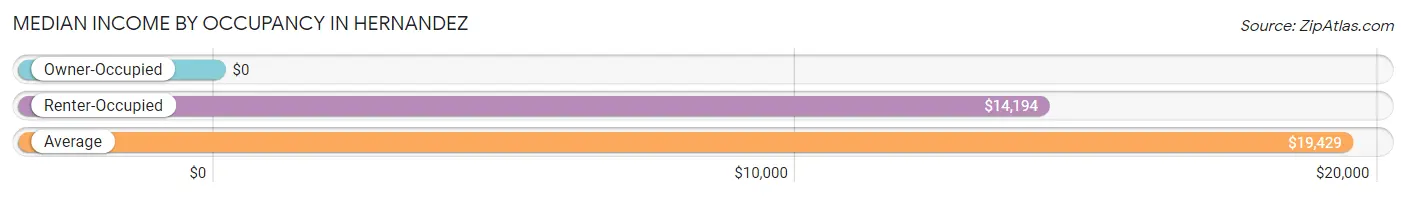
| Occupancy Type | # Households | Median Income |
| Owner-Occupied | 250 (60.8%) | $0 |
| Renter-Occupied | 161 (39.2%) | $14,194 |
| Average | 411 (100.0%) | $19,429 |
Occupancy by Householder Income Bracket in Hernandez
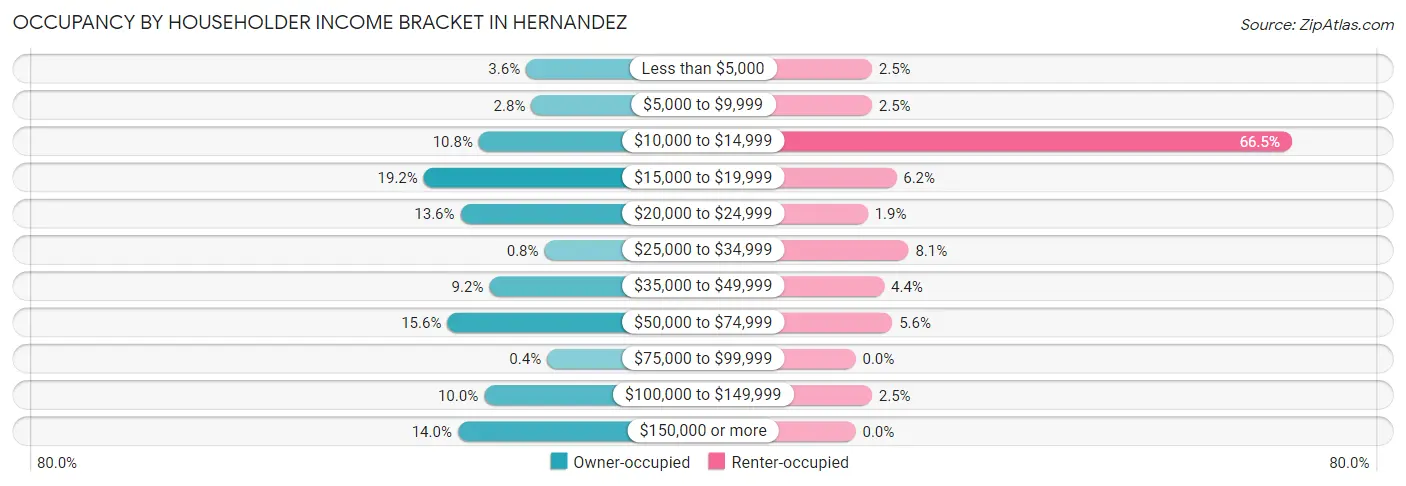
| Income Bracket | Owner-occupied | Renter-occupied |
| Less than $5,000 | 9 (3.6%) | 4 (2.5%) |
| $5,000 to $9,999 | 7 (2.8%) | 4 (2.5%) |
| $10,000 to $14,999 | 27 (10.8%) | 107 (66.5%) |
| $15,000 to $19,999 | 48 (19.2%) | 10 (6.2%) |
| $20,000 to $24,999 | 34 (13.6%) | 3 (1.9%) |
| $25,000 to $34,999 | 2 (0.8%) | 13 (8.1%) |
| $35,000 to $49,999 | 23 (9.2%) | 7 (4.3%) |
| $50,000 to $74,999 | 39 (15.6%) | 9 (5.6%) |
| $75,000 to $99,999 | 1 (0.4%) | 0 (0.0%) |
| $100,000 to $149,999 | 25 (10.0%) | 4 (2.5%) |
| $150,000 or more | 35 (14.0%) | 0 (0.0%) |
| Total | 250 (100.0%) | 161 (100.0%) |
Monthly Housing Cost Tiers in Hernandez
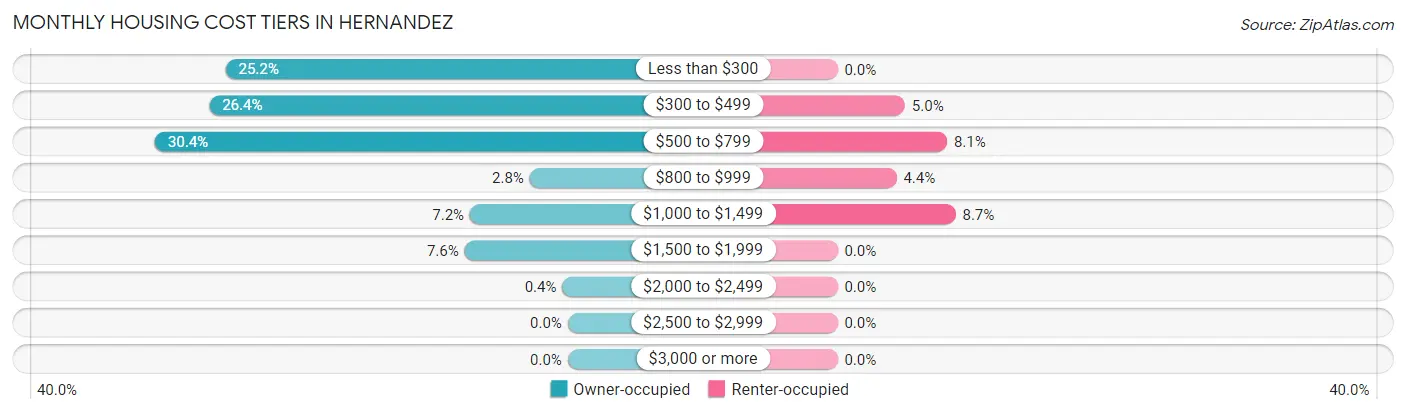
| Monthly Cost | Owner-occupied | Renter-occupied |
| Less than $300 | 63 (25.2%) | 0 (0.0%) |
| $300 to $499 | 66 (26.4%) | 8 (5.0%) |
| $500 to $799 | 76 (30.4%) | 13 (8.1%) |
| $800 to $999 | 7 (2.8%) | 7 (4.3%) |
| $1,000 to $1,499 | 18 (7.2%) | 14 (8.7%) |
| $1,500 to $1,999 | 19 (7.6%) | 0 (0.0%) |
| $2,000 to $2,499 | 1 (0.4%) | 0 (0.0%) |
| $2,500 to $2,999 | 0 (0.0%) | 0 (0.0%) |
| $3,000 or more | 0 (0.0%) | 0 (0.0%) |
| Total | 250 (100.0%) | 161 (100.0%) |
Physical Housing Characteristics in Hernandez
Housing Structures in Hernandez
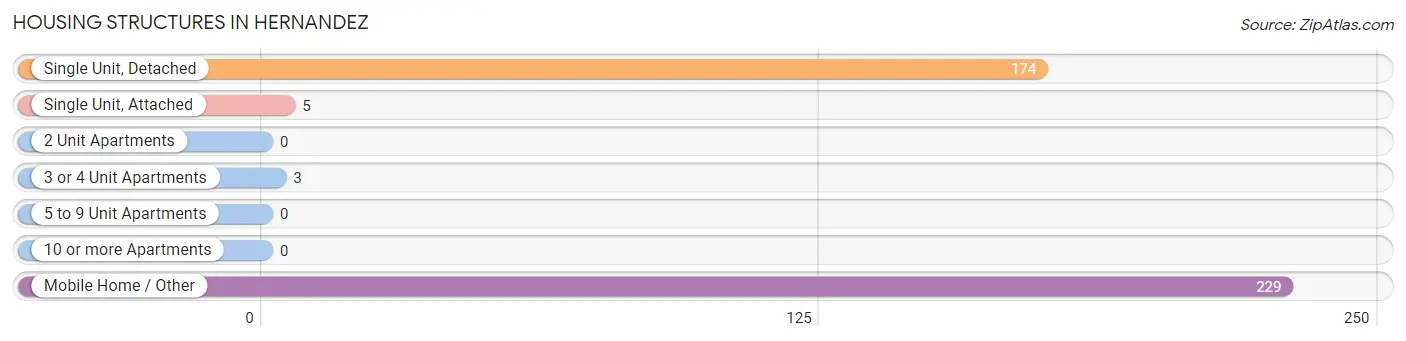
| Structure Type | # Housing Units | % Housing Units |
| Single Unit, Detached | 174 | 42.3% |
| Single Unit, Attached | 5 | 1.2% |
| 2 Unit Apartments | 0 | 0.0% |
| 3 or 4 Unit Apartments | 3 | 0.7% |
| 5 to 9 Unit Apartments | 0 | 0.0% |
| 10 or more Apartments | 0 | 0.0% |
| Mobile Home / Other | 229 | 55.7% |
| Total | 411 | 100.0% |
Housing Structures by Occupancy in Hernandez
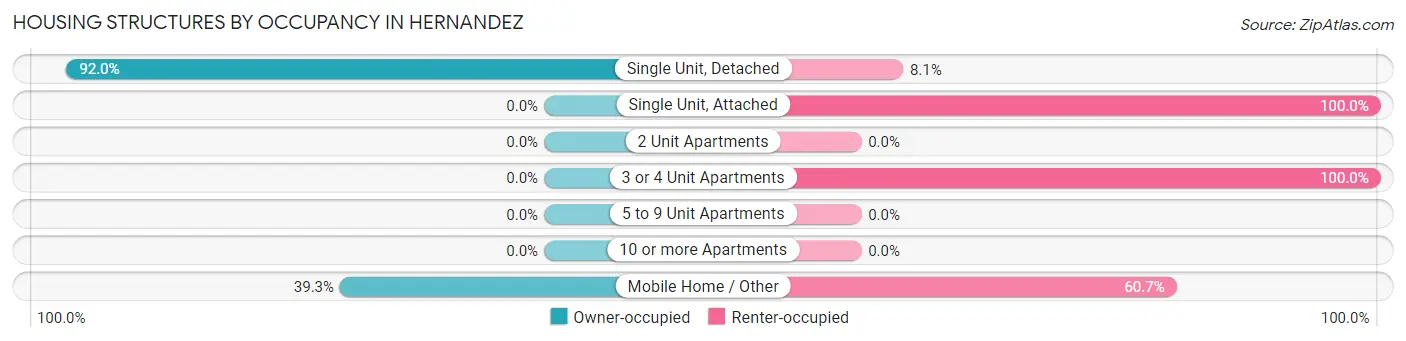
| Structure Type | Owner-occupied | Renter-occupied |
| Single Unit, Detached | 160 (91.9%) | 14 (8.1%) |
| Single Unit, Attached | 0 (0.0%) | 5 (100.0%) |
| 2 Unit Apartments | 0 (0.0%) | 0 (0.0%) |
| 3 or 4 Unit Apartments | 0 (0.0%) | 3 (100.0%) |
| 5 to 9 Unit Apartments | 0 (0.0%) | 0 (0.0%) |
| 10 or more Apartments | 0 (0.0%) | 0 (0.0%) |
| Mobile Home / Other | 90 (39.3%) | 139 (60.7%) |
| Total | 250 (60.8%) | 161 (39.2%) |
Housing Structures by Number of Rooms in Hernandez
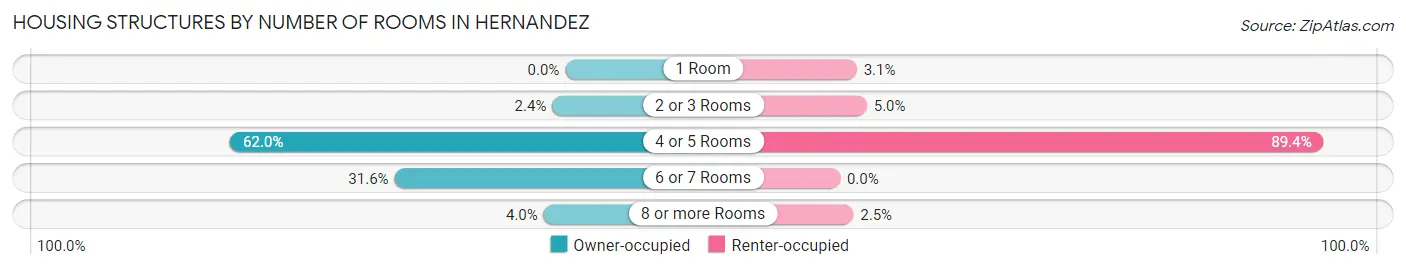
| Number of Rooms | Owner-occupied | Renter-occupied |
| 1 Room | 0 (0.0%) | 5 (3.1%) |
| 2 or 3 Rooms | 6 (2.4%) | 8 (5.0%) |
| 4 or 5 Rooms | 155 (62.0%) | 144 (89.4%) |
| 6 or 7 Rooms | 79 (31.6%) | 0 (0.0%) |
| 8 or more Rooms | 10 (4.0%) | 4 (2.5%) |
| Total | 250 (100.0%) | 161 (100.0%) |
Housing Structure by Heating Type in Hernandez
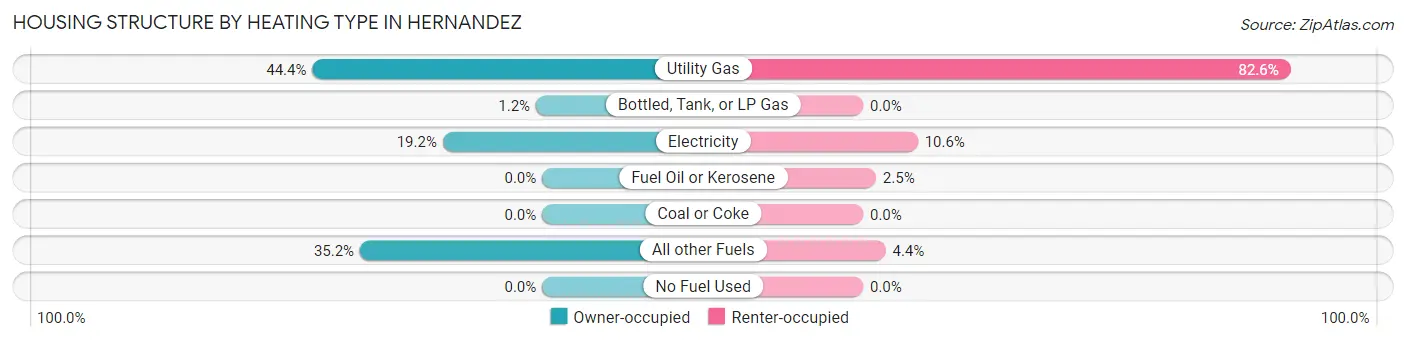
| Heating Type | Owner-occupied | Renter-occupied |
| Utility Gas | 111 (44.4%) | 133 (82.6%) |
| Bottled, Tank, or LP Gas | 3 (1.2%) | 0 (0.0%) |
| Electricity | 48 (19.2%) | 17 (10.6%) |
| Fuel Oil or Kerosene | 0 (0.0%) | 4 (2.5%) |
| Coal or Coke | 0 (0.0%) | 0 (0.0%) |
| All other Fuels | 88 (35.2%) | 7 (4.3%) |
| No Fuel Used | 0 (0.0%) | 0 (0.0%) |
| Total | 250 (100.0%) | 161 (100.0%) |
Household Vehicle Usage in Hernandez
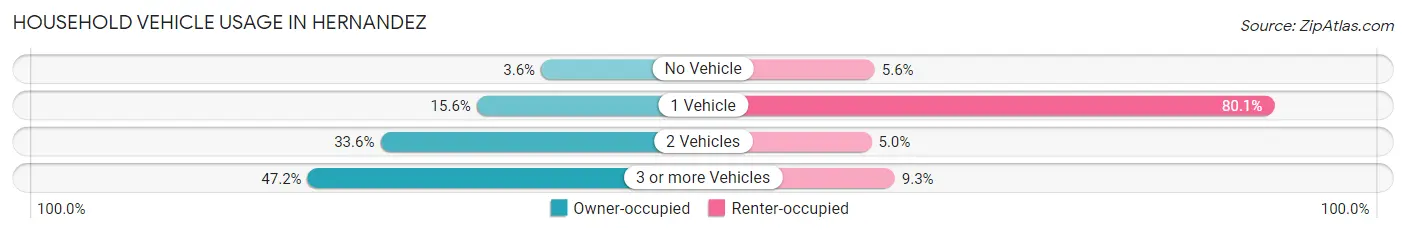
| Vehicles per Household | Owner-occupied | Renter-occupied |
| No Vehicle | 9 (3.6%) | 9 (5.6%) |
| 1 Vehicle | 39 (15.6%) | 129 (80.1%) |
| 2 Vehicles | 84 (33.6%) | 8 (5.0%) |
| 3 or more Vehicles | 118 (47.2%) | 15 (9.3%) |
| Total | 250 (100.0%) | 161 (100.0%) |
Real Estate & Mortgages in Hernandez
Real Estate and Mortgage Overview in Hernandez
| Characteristic | Without Mortgage | With Mortgage |
| Housing Units | 205 | 45 |
| Median Property Value | $192,000 | $215,300 |
| Median Household Income | $23,616 | $5 |
| Monthly Housing Costs | $360 | $0 |
| Real Estate Taxes | $800 | $1 |
Property Value by Mortgage Status in Hernandez
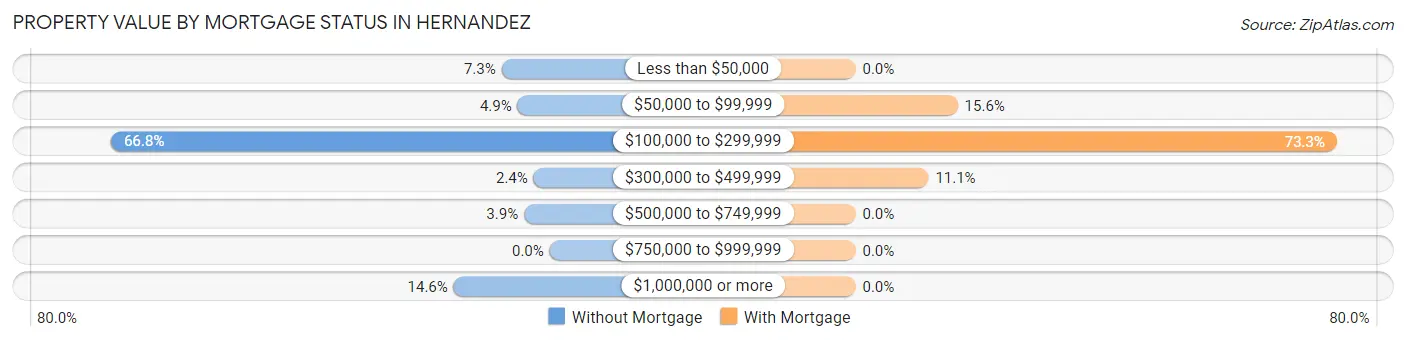
| Property Value | Without Mortgage | With Mortgage |
| Less than $50,000 | 15 (7.3%) | 0 (0.0%) |
| $50,000 to $99,999 | 10 (4.9%) | 7 (15.6%) |
| $100,000 to $299,999 | 137 (66.8%) | 33 (73.3%) |
| $300,000 to $499,999 | 5 (2.4%) | 5 (11.1%) |
| $500,000 to $749,999 | 8 (3.9%) | 0 (0.0%) |
| $750,000 to $999,999 | 0 (0.0%) | 0 (0.0%) |
| $1,000,000 or more | 30 (14.6%) | 0 (0.0%) |
| Total | 205 (100.0%) | 45 (100.0%) |
Household Income by Mortgage Status in Hernandez
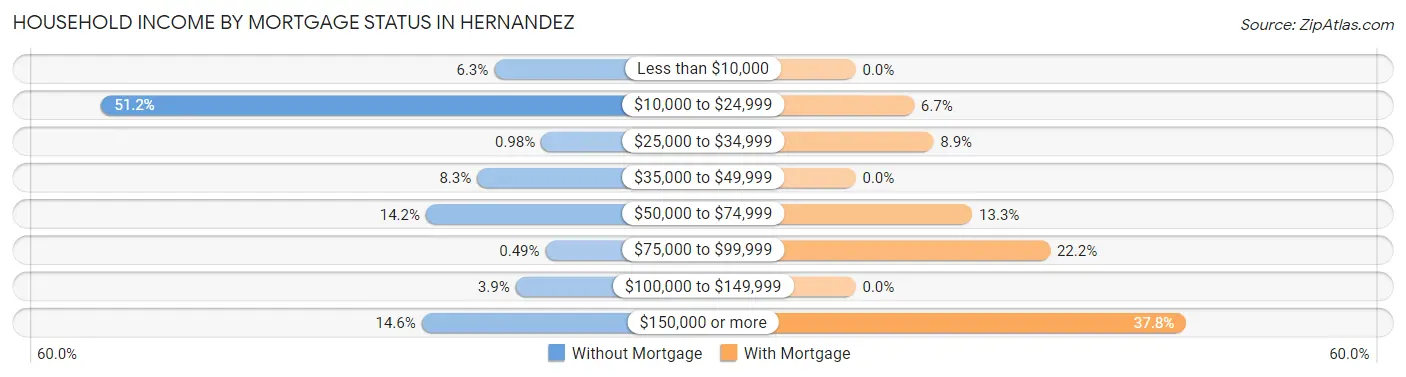
| Household Income | Without Mortgage | With Mortgage |
| Less than $10,000 | 13 (6.3%) | 0 (0.0%) |
| $10,000 to $24,999 | 105 (51.2%) | 3 (6.7%) |
| $25,000 to $34,999 | 2 (1.0%) | 4 (8.9%) |
| $35,000 to $49,999 | 17 (8.3%) | 0 (0.0%) |
| $50,000 to $74,999 | 29 (14.1%) | 6 (13.3%) |
| $75,000 to $99,999 | 1 (0.5%) | 10 (22.2%) |
| $100,000 to $149,999 | 8 (3.9%) | 0 (0.0%) |
| $150,000 or more | 30 (14.6%) | 17 (37.8%) |
| Total | 205 (100.0%) | 45 (100.0%) |
Property Value to Household Income Ratio in Hernandez
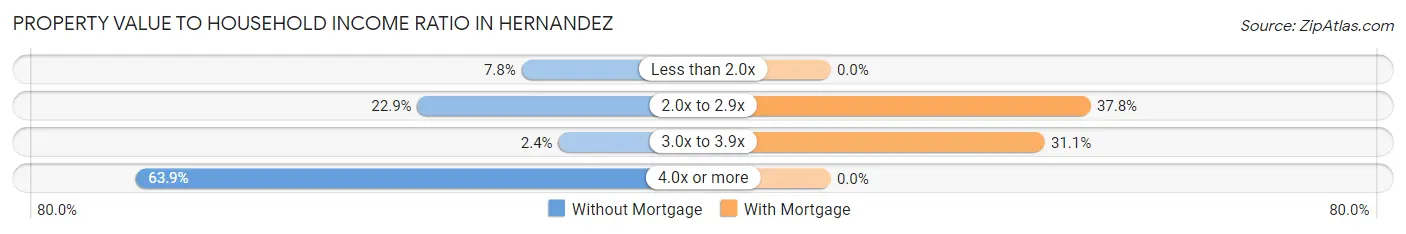
| Value-to-Income Ratio | Without Mortgage | With Mortgage |
| Less than 2.0x | 16 (7.8%) | 0 (0.0%) |
| 2.0x to 2.9x | 47 (22.9%) | 17 (37.8%) |
| 3.0x to 3.9x | 5 (2.4%) | 14 (31.1%) |
| 4.0x or more | 131 (63.9%) | 0 (0.0%) |
| Total | 205 (100.0%) | 45 (100.0%) |
Real Estate Taxes by Mortgage Status in Hernandez
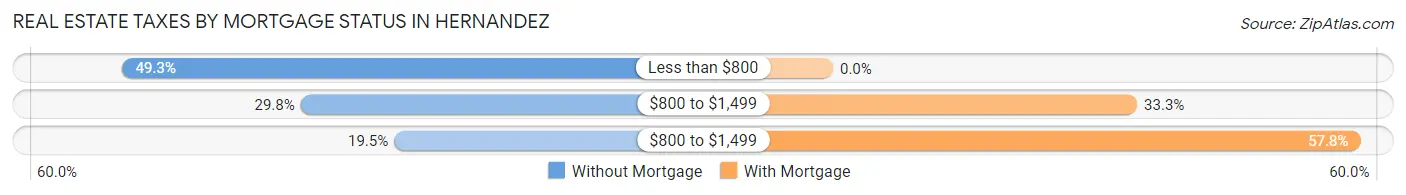
| Property Taxes | Without Mortgage | With Mortgage |
| Less than $800 | 101 (49.3%) | 0 (0.0%) |
| $800 to $1,499 | 61 (29.8%) | 15 (33.3%) |
| $800 to $1,499 | 40 (19.5%) | 26 (57.8%) |
| Total | 205 (100.0%) | 45 (100.0%) |
Health & Disability in Hernandez
Health Insurance Coverage by Age in Hernandez
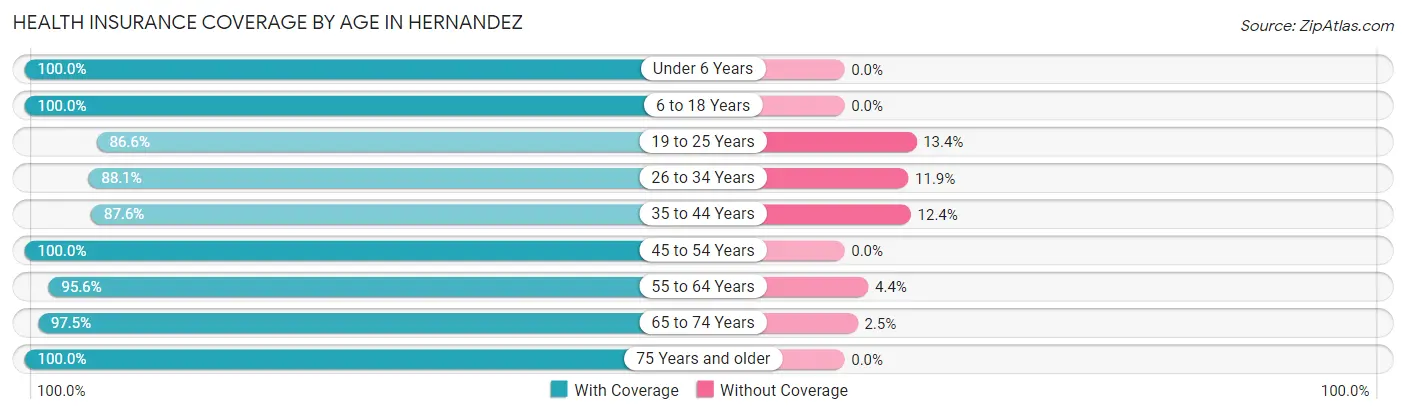
| Age Bracket | With Coverage | Without Coverage |
| Under 6 Years | 58 (100.0%) | 0 (0.0%) |
| 6 to 18 Years | 120 (100.0%) | 0 (0.0%) |
| 19 to 25 Years | 71 (86.6%) | 11 (13.4%) |
| 26 to 34 Years | 37 (88.1%) | 5 (11.9%) |
| 35 to 44 Years | 85 (87.6%) | 12 (12.4%) |
| 45 to 54 Years | 193 (100.0%) | 0 (0.0%) |
| 55 to 64 Years | 86 (95.6%) | 4 (4.4%) |
| 65 to 74 Years | 119 (97.5%) | 3 (2.5%) |
| 75 Years and older | 98 (100.0%) | 0 (0.0%) |
| Total | 867 (96.1%) | 35 (3.9%) |
Health Insurance Coverage by Citizenship Status in Hernandez
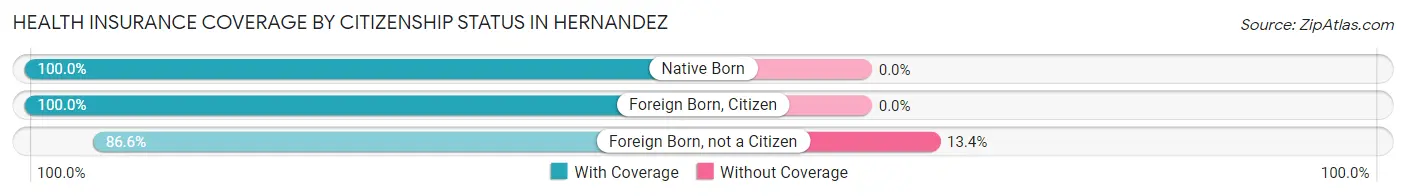
| Citizenship Status | With Coverage | Without Coverage |
| Native Born | 58 (100.0%) | 0 (0.0%) |
| Foreign Born, Citizen | 120 (100.0%) | 0 (0.0%) |
| Foreign Born, not a Citizen | 71 (86.6%) | 11 (13.4%) |
Health Insurance Coverage by Household Income in Hernandez
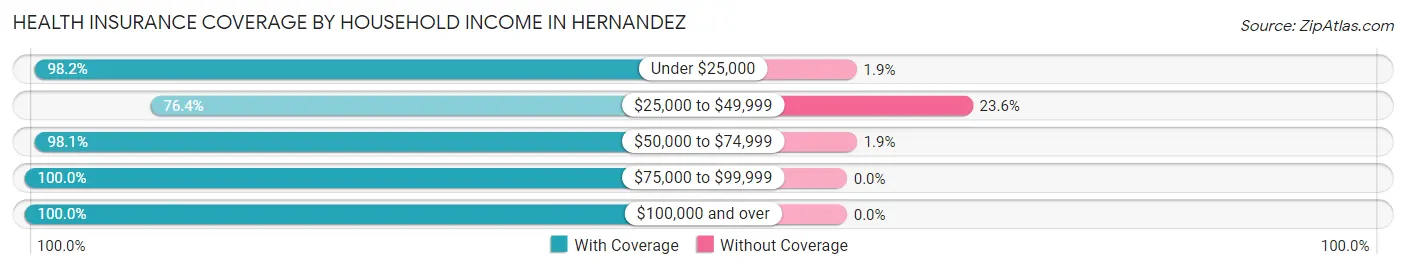
| Household Income | With Coverage | Without Coverage |
| Under $25,000 | 372 (98.2%) | 7 (1.8%) |
| $25,000 to $49,999 | 81 (76.4%) | 25 (23.6%) |
| $50,000 to $74,999 | 158 (98.1%) | 3 (1.9%) |
| $75,000 to $99,999 | 6 (100.0%) | 0 (0.0%) |
| $100,000 and over | 250 (100.0%) | 0 (0.0%) |
Public vs Private Health Insurance Coverage by Age in Hernandez
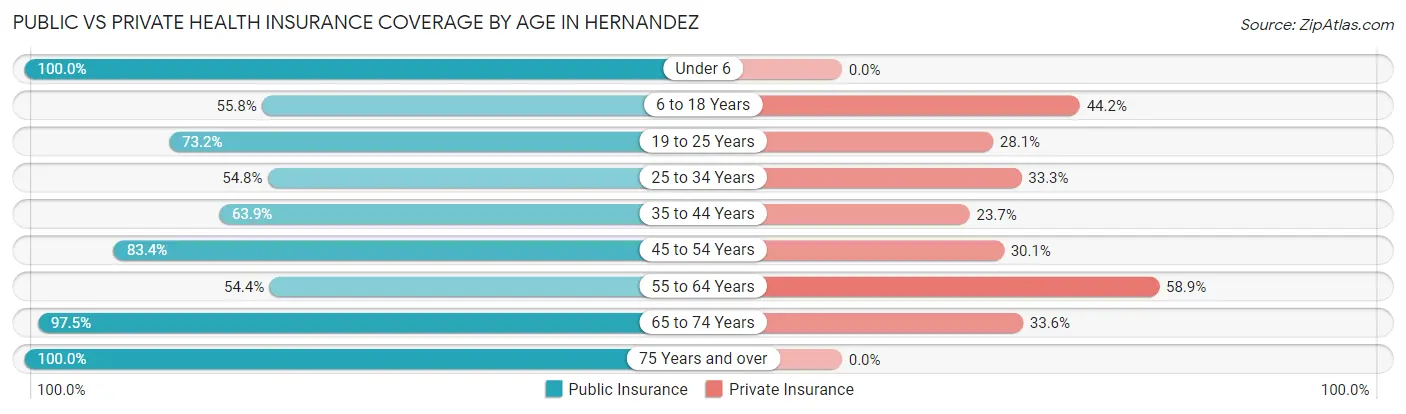
| Age Bracket | Public Insurance | Private Insurance |
| Under 6 | 58 (100.0%) | 0 (0.0%) |
| 6 to 18 Years | 67 (55.8%) | 53 (44.2%) |
| 19 to 25 Years | 60 (73.2%) | 23 (28.1%) |
| 25 to 34 Years | 23 (54.8%) | 14 (33.3%) |
| 35 to 44 Years | 62 (63.9%) | 23 (23.7%) |
| 45 to 54 Years | 161 (83.4%) | 58 (30.0%) |
| 55 to 64 Years | 49 (54.4%) | 53 (58.9%) |
| 65 to 74 Years | 119 (97.5%) | 41 (33.6%) |
| 75 Years and over | 98 (100.0%) | 0 (0.0%) |
| Total | 697 (77.3%) | 265 (29.4%) |
Disability Status by Sex by Age in Hernandez
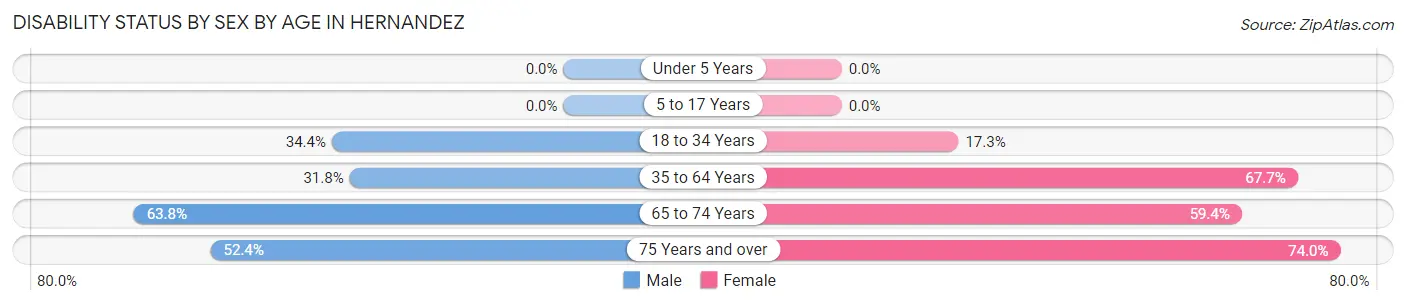
| Age Bracket | Male | Female |
| Under 5 Years | 0 (0.0%) | 0 (0.0%) |
| 5 to 17 Years | 0 (0.0%) | 0 (0.0%) |
| 18 to 34 Years | 22 (34.4%) | 13 (17.3%) |
| 35 to 64 Years | 47 (31.8%) | 157 (67.7%) |
| 65 to 74 Years | 37 (63.8%) | 38 (59.4%) |
| 75 Years and over | 11 (52.4%) | 57 (74.0%) |
Disability Class by Sex by Age in Hernandez
Disability Class: Hearing Difficulty
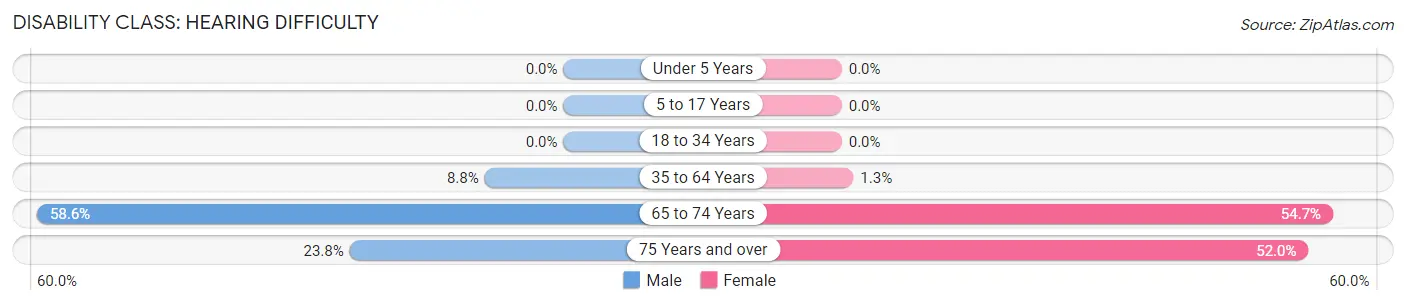
| Age Bracket | Male | Female |
| Under 5 Years | 0 (0.0%) | 0 (0.0%) |
| 5 to 17 Years | 0 (0.0%) | 0 (0.0%) |
| 18 to 34 Years | 0 (0.0%) | 0 (0.0%) |
| 35 to 64 Years | 13 (8.8%) | 3 (1.3%) |
| 65 to 74 Years | 34 (58.6%) | 35 (54.7%) |
| 75 Years and over | 5 (23.8%) | 40 (51.9%) |
Disability Class: Vision Difficulty
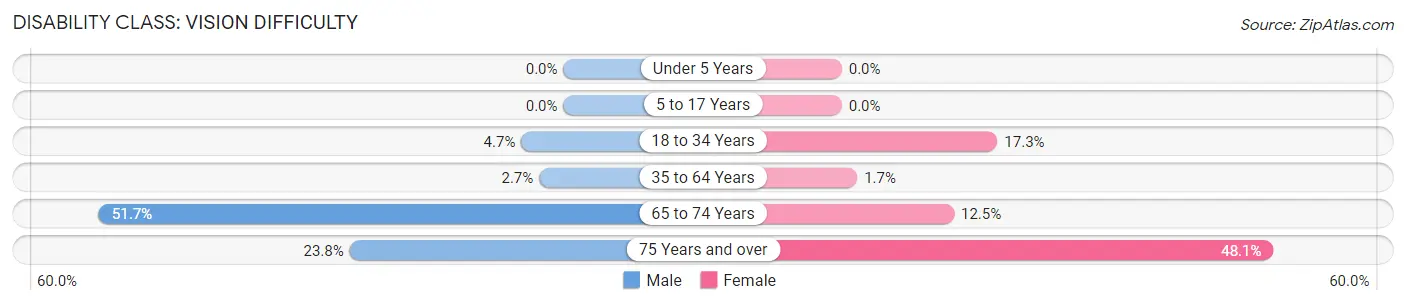
| Age Bracket | Male | Female |
| Under 5 Years | 0 (0.0%) | 0 (0.0%) |
| 5 to 17 Years | 0 (0.0%) | 0 (0.0%) |
| 18 to 34 Years | 3 (4.7%) | 13 (17.3%) |
| 35 to 64 Years | 4 (2.7%) | 4 (1.7%) |
| 65 to 74 Years | 30 (51.7%) | 8 (12.5%) |
| 75 Years and over | 5 (23.8%) | 37 (48.0%) |
Disability Class: Cognitive Difficulty
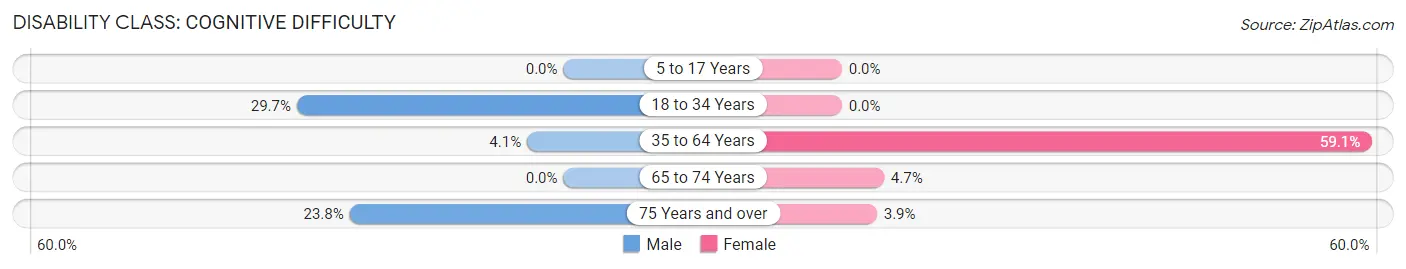
| Age Bracket | Male | Female |
| 5 to 17 Years | 0 (0.0%) | 0 (0.0%) |
| 18 to 34 Years | 19 (29.7%) | 0 (0.0%) |
| 35 to 64 Years | 6 (4.1%) | 137 (59.1%) |
| 65 to 74 Years | 0 (0.0%) | 3 (4.7%) |
| 75 Years and over | 5 (23.8%) | 3 (3.9%) |
Disability Class: Ambulatory Difficulty
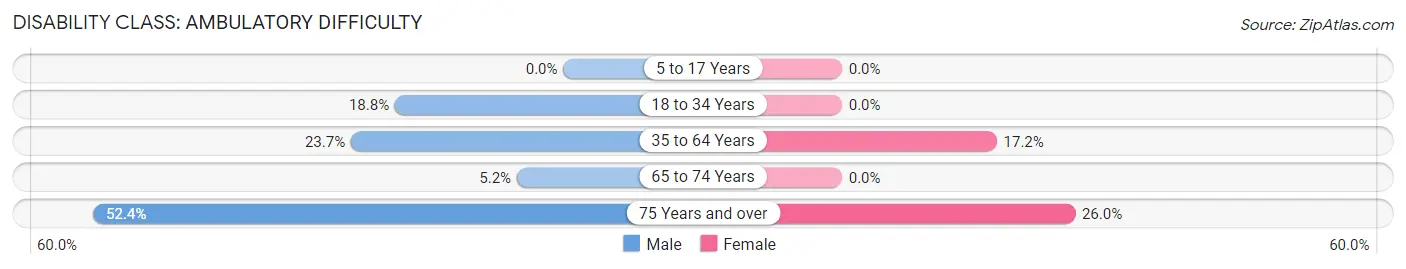
| Age Bracket | Male | Female |
| 5 to 17 Years | 0 (0.0%) | 0 (0.0%) |
| 18 to 34 Years | 12 (18.8%) | 0 (0.0%) |
| 35 to 64 Years | 35 (23.6%) | 40 (17.2%) |
| 65 to 74 Years | 3 (5.2%) | 0 (0.0%) |
| 75 Years and over | 11 (52.4%) | 20 (26.0%) |
Disability Class: Self-Care Difficulty
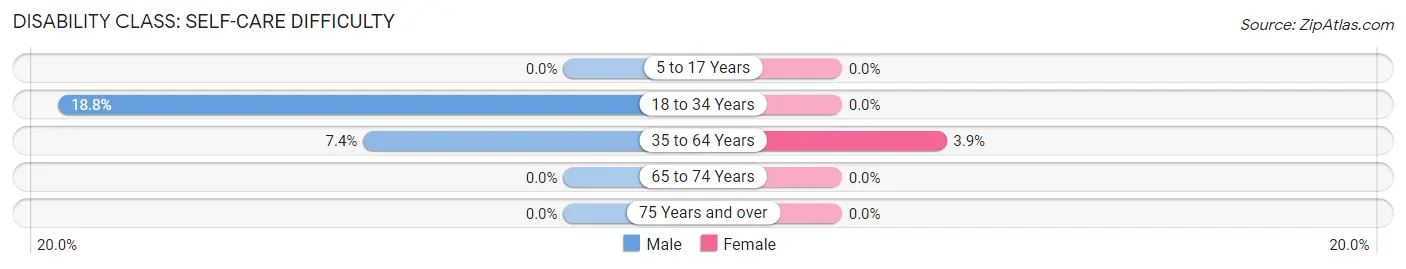
| Age Bracket | Male | Female |
| 5 to 17 Years | 0 (0.0%) | 0 (0.0%) |
| 18 to 34 Years | 12 (18.8%) | 0 (0.0%) |
| 35 to 64 Years | 11 (7.4%) | 9 (3.9%) |
| 65 to 74 Years | 0 (0.0%) | 0 (0.0%) |
| 75 Years and over | 0 (0.0%) | 0 (0.0%) |
Technology Access in Hernandez
Computing Device Access in Hernandez
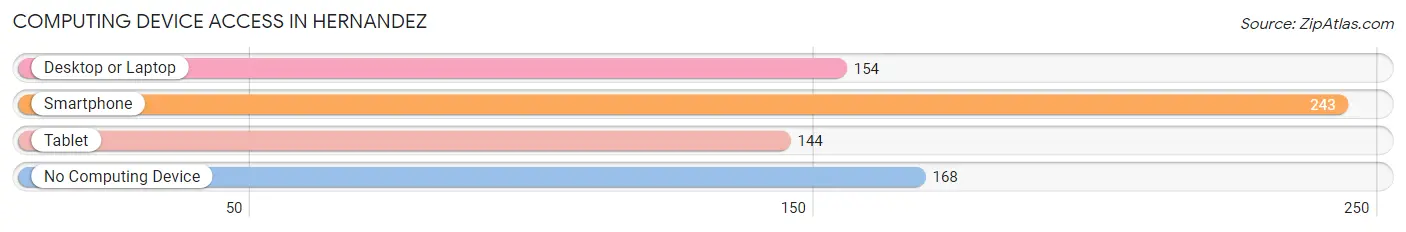
| Device Type | # Households | % Households |
| Desktop or Laptop | 154 | 37.5% |
| Smartphone | 243 | 59.1% |
| Tablet | 144 | 35.0% |
| No Computing Device | 168 | 40.9% |
| Total | 411 | 100.0% |
Internet Access in Hernandez
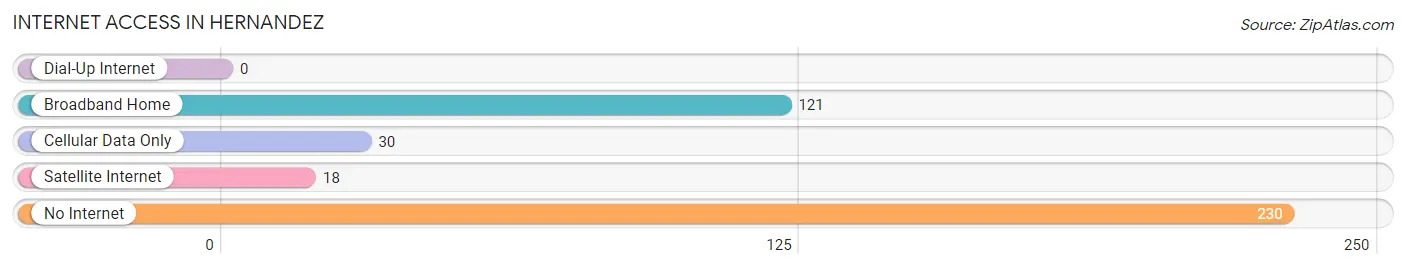
| Internet Type | # Households | % Households |
| Dial-Up Internet | 0 | 0.0% |
| Broadband Home | 121 | 29.4% |
| Cellular Data Only | 30 | 7.3% |
| Satellite Internet | 18 | 4.4% |
| No Internet | 230 | 56.0% |
| Total | 411 | 100.0% |
Hernandez Summary
NM History
New Mexico is a state located in the southwestern region of the United States. It is the fifth-largest state in the country and the 36th most populous. The state was admitted to the Union in 1912 as the 47th state. The area has a long and rich history, with evidence of human habitation dating back to 12,000 years ago. The first inhabitants of the area were Native American tribes, including the Pueblo, Apache, and Navajo.
The Spanish arrived in the area in the 16th century, and by the 17th century, the Spanish had established a number of settlements in the region. The Spanish were followed by the Mexicans, who gained control of the area in 1821. The area was ceded to the United States in 1848 as part of the Treaty of Guadalupe Hidalgo, which ended the Mexican-American War.
In the late 19th century, the area was settled by Anglo-Americans, who established ranches and farms. The area was also home to a number of mining operations, which brought in a large influx of people. The area was also home to a number of military installations, including Fort Bliss and White Sands Missile Range.
In 1912, New Mexico became the 47th state in the Union. The state has since become known for its diverse culture, with a mix of Native American, Spanish, Mexican, and Anglo-American influences. The state has also become known for its unique cuisine, which is a blend of traditional Native American, Spanish, and Mexican dishes.
Geography
New Mexico is located in the southwestern region of the United States. It is bordered by Arizona to the west, Colorado to the north, Oklahoma to the northeast, and Texas to the east. The state has a total area of 121,590 square miles, making it the fifth-largest state in the country.
The state is divided into four distinct geographic regions. The northwest region is known as the High Plains, and is characterized by flat, arid terrain. The central region is known as the Rio Grande Valley, and is characterized by rolling hills and valleys. The eastern region is known as the Great Plains, and is characterized by flat, grassy plains. The southern region is known as the Chihuahuan Desert, and is characterized by dry, desert terrain.
The state is home to a number of mountain ranges, including the Sangre de Cristo Mountains, the Sandia Mountains, and the Sacramento Mountains. The highest point in the state is Wheeler Peak, which has an elevation of 13,161 feet. The state also has a number of rivers, including the Rio Grande, the Pecos River, and the Canadian River.
Economy
New Mexico has a diverse economy, with a mix of industries including agriculture, mining, manufacturing, and tourism. The state is the largest producer of chile peppers in the United States, and is also a major producer of pecans, onions, and other agricultural products.
The state is also home to a number of mining operations, including copper, uranium, and potash. The state is also home to a number of manufacturing operations, including electronics, food processing, and aerospace.
Tourism is also an important part of the state’s economy, with a number of popular attractions, including Carlsbad Caverns National Park, White Sands National Monument, and the Gila National Forest.
Demographics
As of 2019, the population of New Mexico was estimated to be 2,095,428. The state has a population density of 17.3 people per square mile, making it the 36th most populous state in the country.
The largest racial group in the state is White, making up 57.2% of the population. The second-largest racial group is Hispanic or Latino, making up 42.1% of the population. Other racial groups include Native American (9.2%), African American (2.7%), Asian (1.3%), and Pacific Islander (0.2%).
The median household income in the state is $48,945, and the median home value is $179,400. The state has a poverty rate of 19.2%, and the unemployment rate is 4.7%.
Common Questions
What is Per Capita Income in Hernandez?
Per Capita income in Hernandez is $31,710.
What is the Median Family Income in Hernandez?
Median Family Income in Hernandez is $52,917.
What is the Median Household income in Hernandez?
Median Household Income in Hernandez is $19,429.
What is Income or Wage Gap in Hernandez?
Income or Wage Gap in Hernandez is 43.8%.
Women in Hernandez earn 56.2 cents for every dollar earned by a man.
What is Inequality or Gini Index in Hernandez?
Inequality or Gini Index in Hernandez is 0.64.
What is the Total Population of Hernandez?
Total Population of Hernandez is 902.
What is the Total Male Population of Hernandez?
Total Male Population of Hernandez is 379.
What is the Total Female Population of Hernandez?
Total Female Population of Hernandez is 523.
What is the Ratio of Males per 100 Females in Hernandez?
There are 72.47 Males per 100 Females in Hernandez.
What is the Ratio of Females per 100 Males in Hernandez?
There are 137.99 Females per 100 Males in Hernandez.
What is the Median Population Age in Hernandez?
Median Population Age in Hernandez is 50.6 Years.
What is the Average Family Size in Hernandez
Average Family Size in Hernandez is 3.4 People.
What is the Average Household Size in Hernandez
Average Household Size in Hernandez is 2.2 People.
How Large is the Labor Force in Hernandez?
There are 295 People in the Labor Forcein in Hernandez.
What is the Percentage of People in the Labor Force in Hernandez?
39.2% of People are in the Labor Force in Hernandez.
What is the Unemployment Rate in Hernandez?
Unemployment Rate in Hernandez is 11.5%.