Laguna, NM Map & Demographics
Laguna Map
Laguna Overview
$16,368
PER CAPITA INCOME
$47,037
AVG FAMILY INCOME
$41,905
AVG HOUSEHOLD INCOME
0.25
INEQUALITY / GINI INDEX
655
TOTAL POPULATION
254
MALE POPULATION
401
FEMALE POPULATION
63.34
MALES / 100 FEMALES
157.87
FEMALES / 100 MALES
43.7
MEDIAN AGE
4.9
AVG FAMILY SIZE
3.7
AVG HOUSEHOLD SIZE
212
LABOR FORCE [ PEOPLE ]
44.0%
PERCENT IN LABOR FORCE
13.7%
UNEMPLOYMENT RATE
Laguna Zip Codes
Laguna Area Codes
Income in Laguna
Income Overview in Laguna
Per Capita Income in Laguna is $16,368, while median incomes of families and households are $47,037 and $41,905 respectively.
| Characteristic | Number | Measure |
| Per Capita Income | 655 | $16,368 |
| Median Family Income | 120 | $47,037 |
| Mean Family Income | 120 | $54,897 |
| Median Household Income | 174 | $41,905 |
| Mean Household Income | 174 | $49,215 |
| Income Deficit | 120 | $0 |
| Wage / Income Gap (%) | 655 | 0.00% |
| Wage / Income Gap ($) | 655 | 100.00¢ per $1 |
| Gini / Inequality Index | 655 | 0.25 |
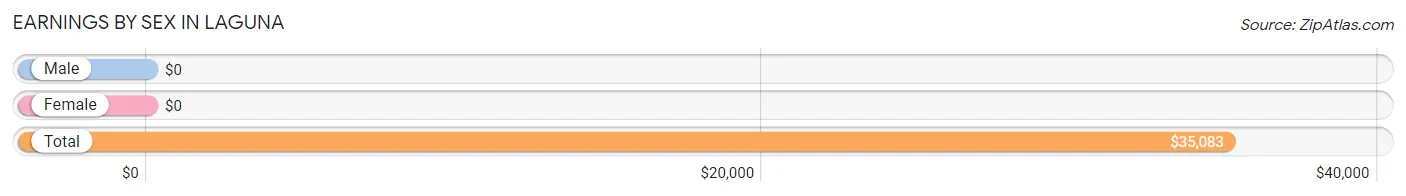
Earnings by Sex in Laguna
| Sex | Number | Average Earnings |
| Male | 72 (38.7%) | $0 |
| Female | 114 (61.3%) | $0 |
| Total | 186 (100.0%) | $35,083 |
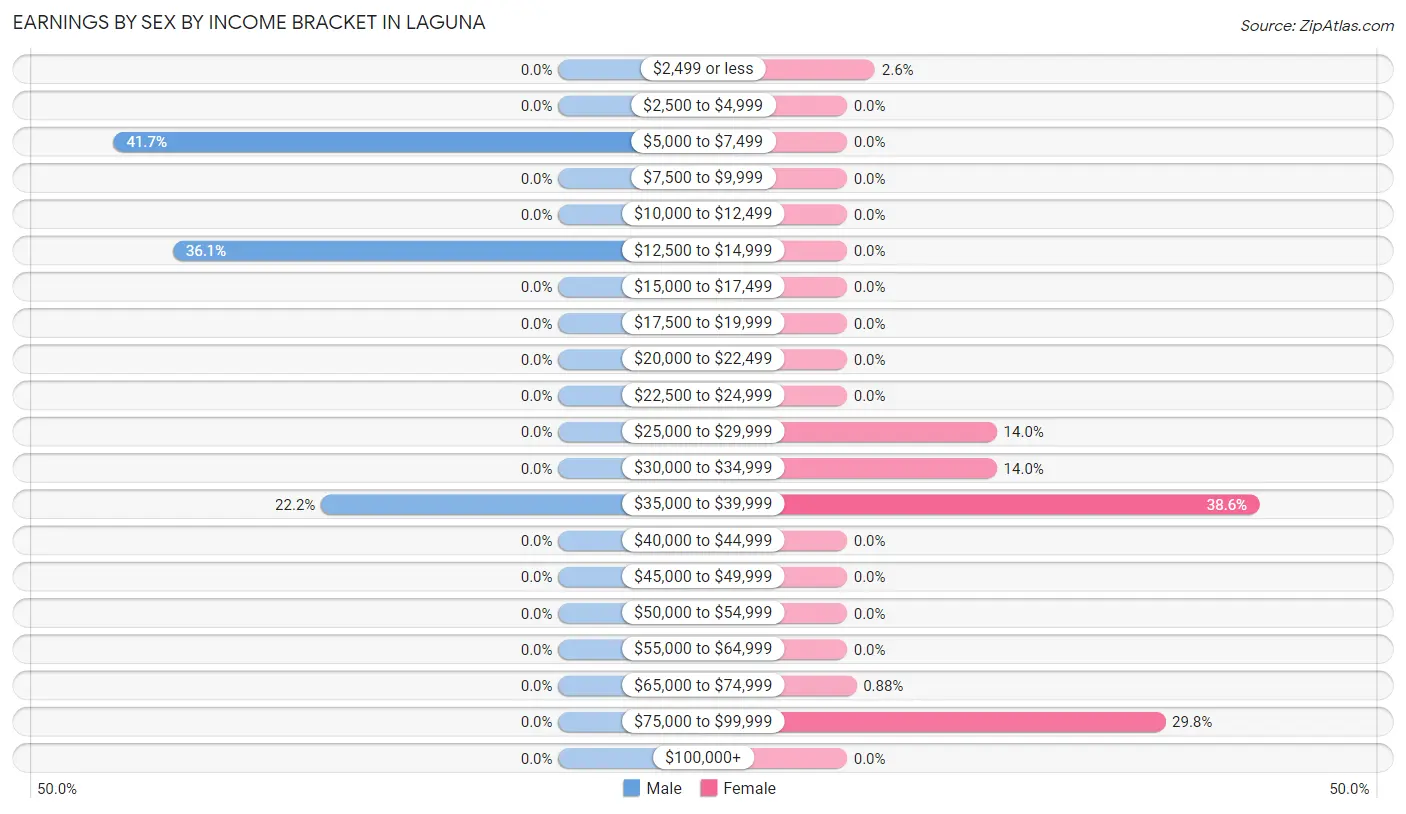
Earnings by Sex by Income Bracket in Laguna
The most common earnings brackets in Laguna are $5,000 to $7,499 for men (30 | 41.7%) and $35,000 to $39,999 for women (44 | 38.6%).
| Income | Male | Female |
| $2,499 or less | 0 (0.0%) | 3 (2.6%) |
| $2,500 to $4,999 | 0 (0.0%) | 0 (0.0%) |
| $5,000 to $7,499 | 30 (41.7%) | 0 (0.0%) |
| $7,500 to $9,999 | 0 (0.0%) | 0 (0.0%) |
| $10,000 to $12,499 | 0 (0.0%) | 0 (0.0%) |
| $12,500 to $14,999 | 26 (36.1%) | 0 (0.0%) |
| $15,000 to $17,499 | 0 (0.0%) | 0 (0.0%) |
| $17,500 to $19,999 | 0 (0.0%) | 0 (0.0%) |
| $20,000 to $22,499 | 0 (0.0%) | 0 (0.0%) |
| $22,500 to $24,999 | 0 (0.0%) | 0 (0.0%) |
| $25,000 to $29,999 | 0 (0.0%) | 16 (14.0%) |
| $30,000 to $34,999 | 0 (0.0%) | 16 (14.0%) |
| $35,000 to $39,999 | 16 (22.2%) | 44 (38.6%) |
| $40,000 to $44,999 | 0 (0.0%) | 0 (0.0%) |
| $45,000 to $49,999 | 0 (0.0%) | 0 (0.0%) |
| $50,000 to $54,999 | 0 (0.0%) | 0 (0.0%) |
| $55,000 to $64,999 | 0 (0.0%) | 0 (0.0%) |
| $65,000 to $74,999 | 0 (0.0%) | 1 (0.9%) |
| $75,000 to $99,999 | 0 (0.0%) | 34 (29.8%) |
| $100,000+ | 0 (0.0%) | 0 (0.0%) |
| Total | 72 (100.0%) | 114 (100.0%) |
Earnings by Sex by Educational Attainment in Laguna
| Educational Attainment | Male Income | Female Income |
| Less than High School | - | - |
| High School Diploma | - | - |
| College or Associate's Degree | - | - |
| Bachelor's Degree | - | - |
| Graduate Degree | - | - |
| Total | - | - |
Family Income in Laguna
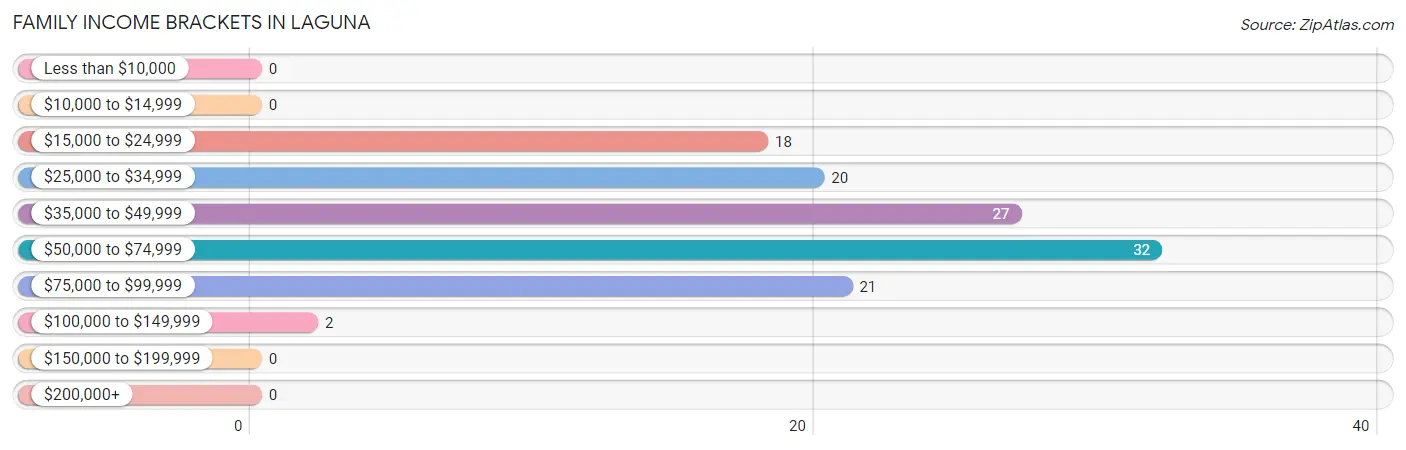
Family Income Brackets in Laguna
According to the Laguna family income data, there are 32 families falling into the $50,000 to $74,999 income range, which is the most common income bracket and makes up 26.7% of all families.
| Income Bracket | # Families | % Families |
| Less than $10,000 | 0 | 0.0% |
| $10,000 to $14,999 | 0 | 0.0% |
| $15,000 to $24,999 | 18 | 15.0% |
| $25,000 to $34,999 | 20 | 16.7% |
| $35,000 to $49,999 | 27 | 22.5% |
| $50,000 to $74,999 | 32 | 26.7% |
| $75,000 to $99,999 | 21 | 17.5% |
| $100,000 to $149,999 | 2 | 1.7% |
| $150,000 to $199,999 | 0 | 0.0% |
| $200,000+ | 0 | 0.0% |
Family Income by Famaliy Size in Laguna
| Income Bracket | # Families | Median Income |
| 2-Person Families | 39 (32.5%) | $0 |
| 3-Person Families | 29 (24.2%) | $0 |
| 4-Person Families | 16 (13.3%) | $0 |
| 5-Person Families | 36 (30.0%) | $0 |
| 6-Person Families | 0 (0.0%) | $0 |
| 7+ Person Families | 0 (0.0%) | $0 |
| Total | 120 (100.0%) | $47,037 |
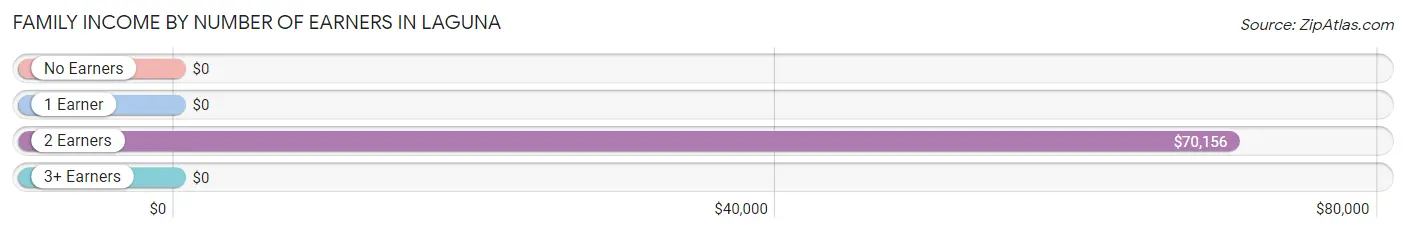
Family Income by Number of Earners in Laguna
| Number of Earners | # Families | Median Income |
| No Earners | 18 (15.0%) | $0 |
| 1 Earner | 68 (56.7%) | $0 |
| 2 Earners | 34 (28.3%) | $70,156 |
| 3+ Earners | 0 (0.0%) | $0 |
| Total | 120 (100.0%) | $47,037 |
Household Income in Laguna
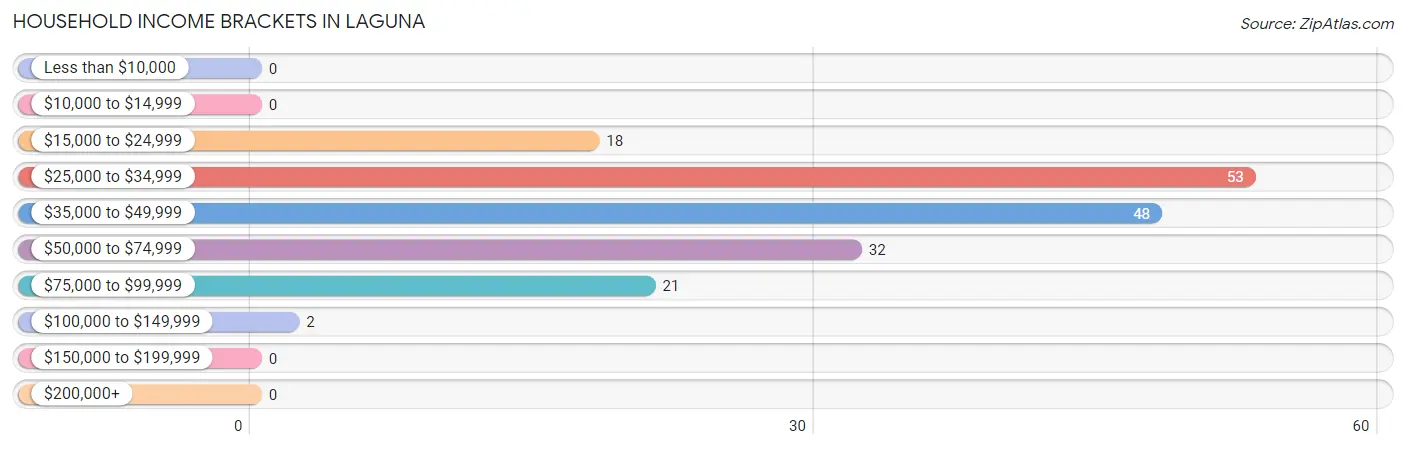
Household Income Brackets in Laguna
With 53 households falling in the category, the $25,000 to $34,999 income range is the most frequent in Laguna, accounting for 30.5% of all households.
| Income Bracket | # Households | % Households |
| Less than $10,000 | 0 | 0.0% |
| $10,000 to $14,999 | 0 | 0.0% |
| $15,000 to $24,999 | 18 | 10.3% |
| $25,000 to $34,999 | 53 | 30.5% |
| $35,000 to $49,999 | 48 | 27.6% |
| $50,000 to $74,999 | 32 | 18.4% |
| $75,000 to $99,999 | 21 | 12.1% |
| $100,000 to $149,999 | 2 | 1.1% |
| $150,000 to $199,999 | 0 | 0.0% |
| $200,000+ | 0 | 0.0% |
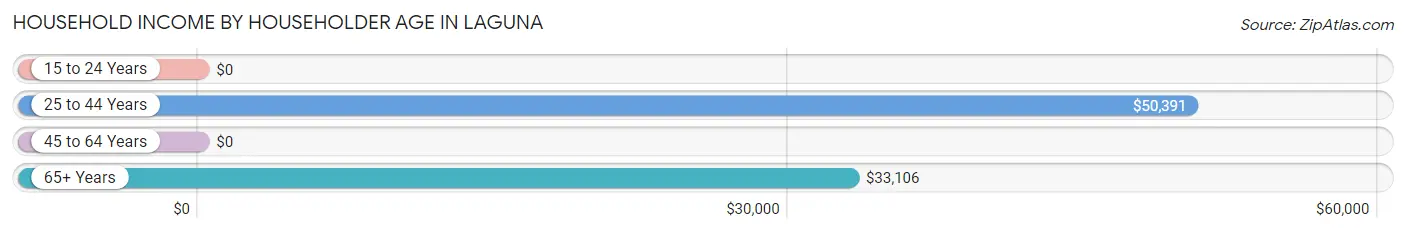
Household Income by Householder Age in Laguna
The median household income in Laguna is $41,905, with the highest median household income of $50,391 found in the 25 to 44 years age bracket for the primary householder. A total of 59 households (33.9%) fall into this category.
| Income Bracket | # Households | Median Income |
| 15 to 24 Years | 0 (0.0%) | $0 |
| 25 to 44 Years | 59 (33.9%) | $50,391 |
| 45 to 64 Years | 23 (13.2%) | $0 |
| 65+ Years | 92 (52.9%) | $33,106 |
| Total | 174 (100.0%) | $41,905 |
Poverty in Laguna
Income Below Poverty by Sex and Age in Laguna
With 29.0% poverty level for males and 21.7% for females among the residents of Laguna, 18 to 24 year old males and 12 to 14 year old females are the most vulnerable to poverty, with 26 males (100.0%) and 23 females (100.0%) in their respective age groups living below the poverty level.
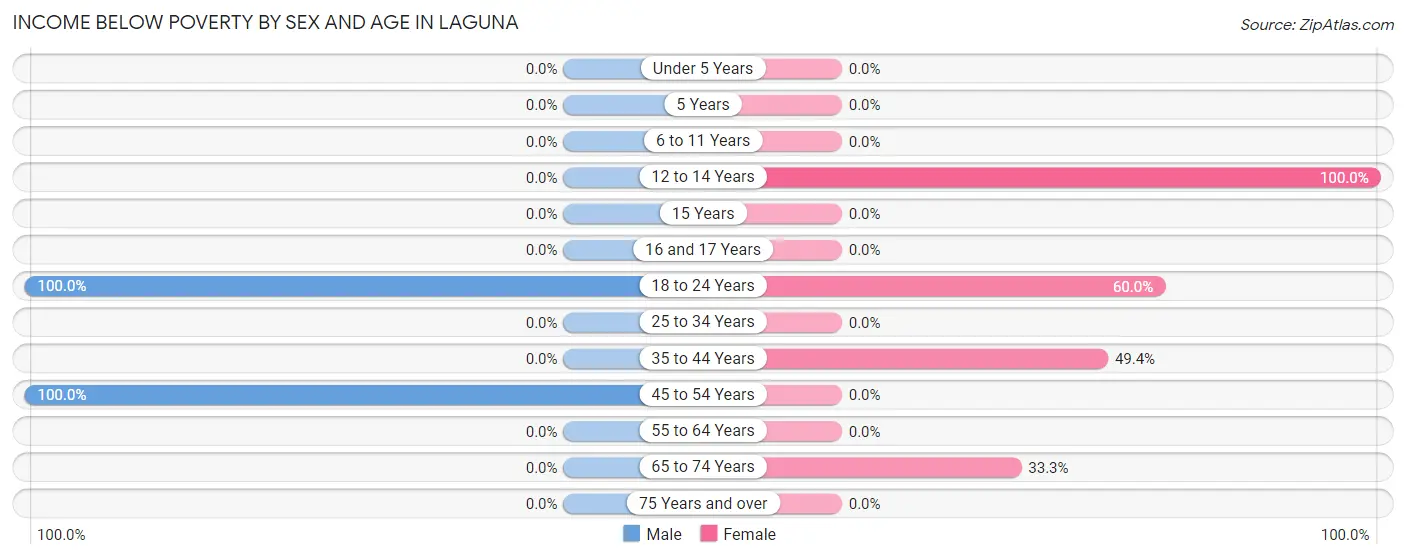
| Age Bracket | Male | Female |
| Under 5 Years | 0 (0.0%) | 0 (0.0%) |
| 5 Years | 0 (0.0%) | 0 (0.0%) |
| 6 to 11 Years | 0 (0.0%) | 0 (0.0%) |
| 12 to 14 Years | 0 (0.0%) | 23 (100.0%) |
| 15 Years | 0 (0.0%) | 0 (0.0%) |
| 16 and 17 Years | 0 (0.0%) | 0 (0.0%) |
| 18 to 24 Years | 26 (100.0%) | 3 (60.0%) |
| 25 to 34 Years | 0 (0.0%) | 0 (0.0%) |
| 35 to 44 Years | 0 (0.0%) | 41 (49.4%) |
| 45 to 54 Years | 44 (100.0%) | 0 (0.0%) |
| 55 to 64 Years | 0 (0.0%) | 0 (0.0%) |
| 65 to 74 Years | 0 (0.0%) | 20 (33.3%) |
| 75 Years and over | 0 (0.0%) | 0 (0.0%) |
| Total | 70 (29.0%) | 87 (21.7%) |
Income Above Poverty by Sex and Age in Laguna
According to the poverty statistics in Laguna, males aged 6 to 11 years and females aged under 5 years are the age groups that are most secure financially, with 100.0% of males and 100.0% of females in these age groups living above the poverty line.
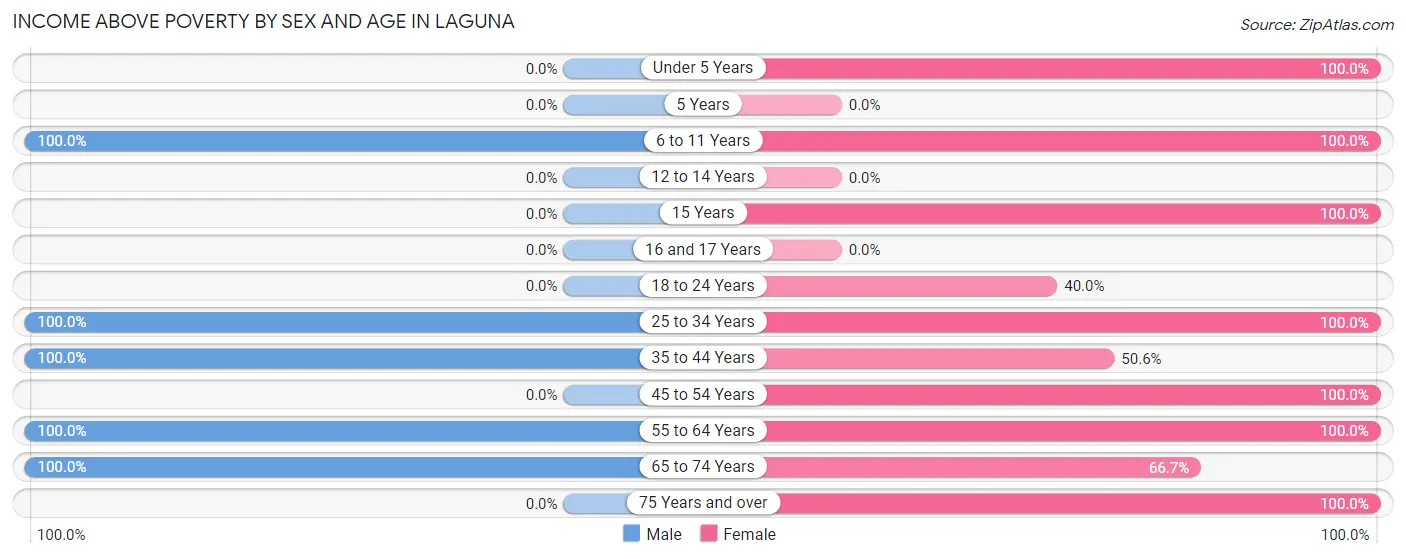
| Age Bracket | Male | Female |
| Under 5 Years | 0 (0.0%) | 24 (100.0%) |
| 5 Years | 0 (0.0%) | 0 (0.0%) |
| 6 to 11 Years | 22 (100.0%) | 86 (100.0%) |
| 12 to 14 Years | 0 (0.0%) | 0 (0.0%) |
| 15 Years | 0 (0.0%) | 18 (100.0%) |
| 16 and 17 Years | 0 (0.0%) | 0 (0.0%) |
| 18 to 24 Years | 0 (0.0%) | 2 (40.0%) |
| 25 to 34 Years | 27 (100.0%) | 33 (100.0%) |
| 35 to 44 Years | 46 (100.0%) | 42 (50.6%) |
| 45 to 54 Years | 0 (0.0%) | 2 (100.0%) |
| 55 to 64 Years | 21 (100.0%) | 34 (100.0%) |
| 65 to 74 Years | 55 (100.0%) | 40 (66.7%) |
| 75 Years and over | 0 (0.0%) | 33 (100.0%) |
| Total | 171 (71.0%) | 314 (78.3%) |
Income Below Poverty Among Married-Couple Families in Laguna
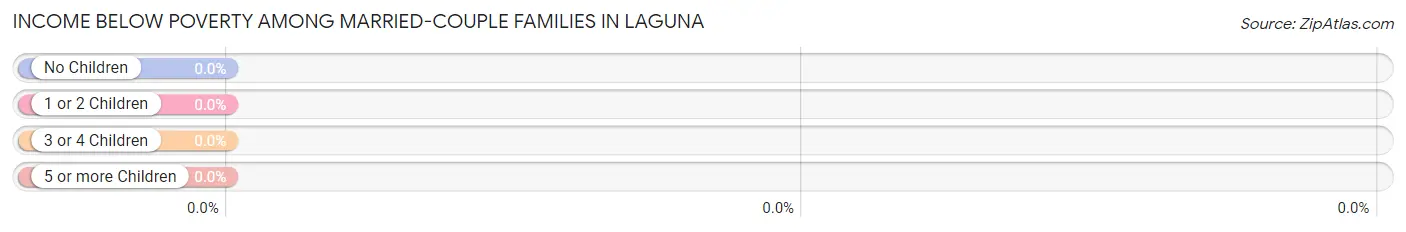
| Children | Above Poverty | Below Poverty |
| No Children | 39 (100.0%) | 0 (0.0%) |
| 1 or 2 Children | 43 (100.0%) | 0 (0.0%) |
| 3 or 4 Children | 0 (0.0%) | 0 (0.0%) |
| 5 or more Children | 0 (0.0%) | 0 (0.0%) |
| Total | 82 (100.0%) | 0 (0.0%) |
Income Below Poverty Among Single-Parent Households in Laguna
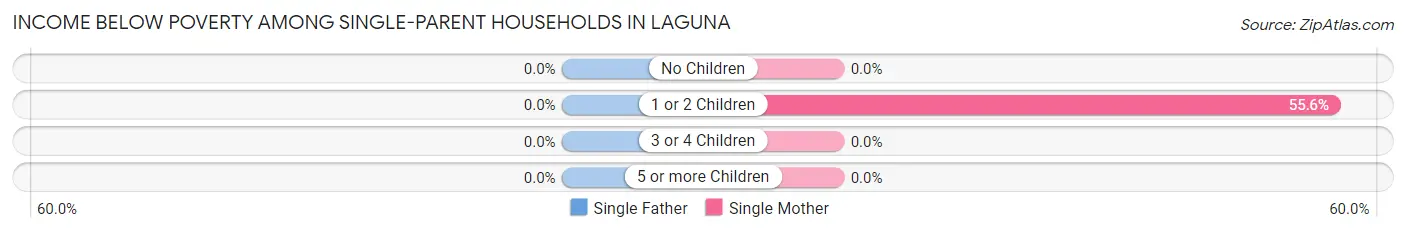
| Children | Single Father | Single Mother |
| No Children | 0 (0.0%) | 0 (0.0%) |
| 1 or 2 Children | 0 (0.0%) | 20 (55.6%) |
| 3 or 4 Children | 0 (0.0%) | 0 (0.0%) |
| 5 or more Children | 0 (0.0%) | 0 (0.0%) |
| Total | 0 (0.0%) | 20 (52.6%) |
Income Below Poverty Among Married-Couple vs Single-Parent Households in Laguna
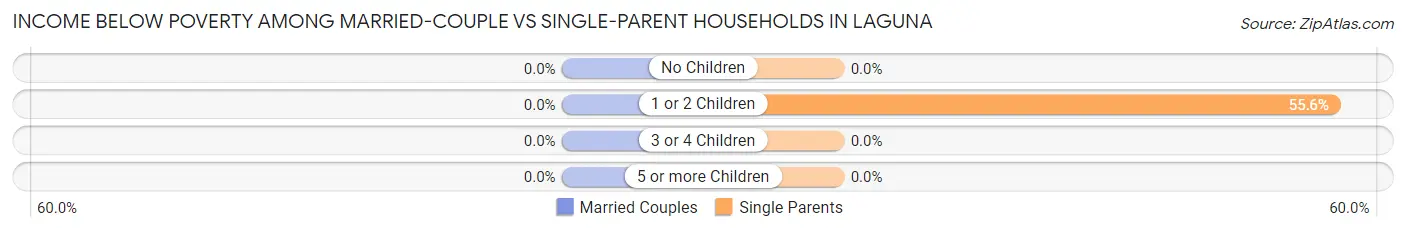
| Children | Married-Couple Families | Single-Parent Households |
| No Children | 0 (0.0%) | 0 (0.0%) |
| 1 or 2 Children | 0 (0.0%) | 20 (55.6%) |
| 3 or 4 Children | 0 (0.0%) | 0 (0.0%) |
| 5 or more Children | 0 (0.0%) | 0 (0.0%) |
| Total | 0 (0.0%) | 20 (52.6%) |
Race in Laguna
The most populous races in Laguna are Native / Alaskan (563 | 86.0%), Hispanic or Latino (128 | 19.5%), and Two or more Races (49 | 7.5%).
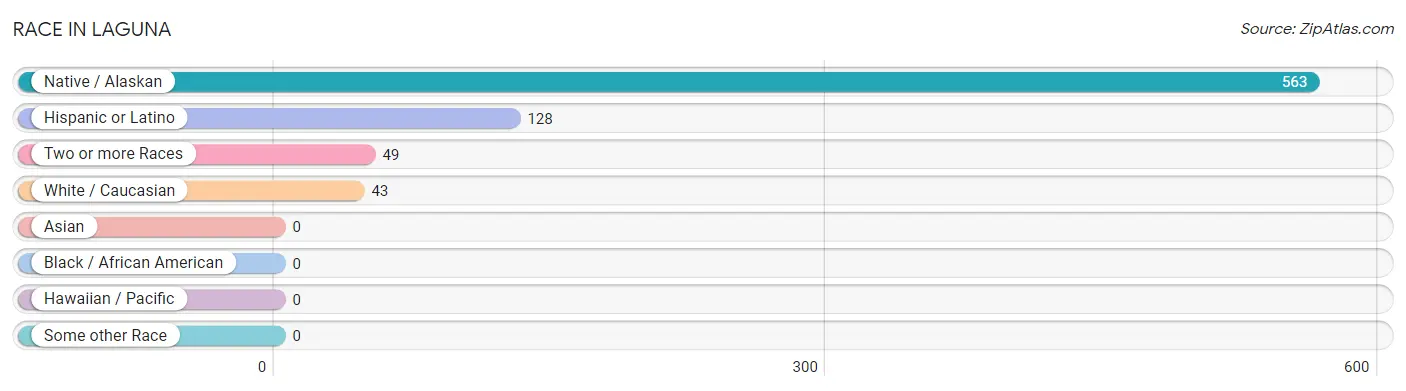
| Race | # Population | % Population |
| Asian | 0 | 0.0% |
| Black / African American | 0 | 0.0% |
| Hawaiian / Pacific | 0 | 0.0% |
| Hispanic or Latino | 128 | 19.5% |
| Native / Alaskan | 563 | 86.0% |
| White / Caucasian | 43 | 6.6% |
| Two or more Races | 49 | 7.5% |
| Some other Race | 0 | 0.0% |
| Total | 655 | 100.0% |
Ancestry in Laguna
The most populous ancestries reported in Laguna are Pueblo (612 | 93.4%), Mexican (128 | 19.5%), English (13 | 2.0%), and Italian (3 | 0.5%), together accounting for 115.4% of all Laguna residents.
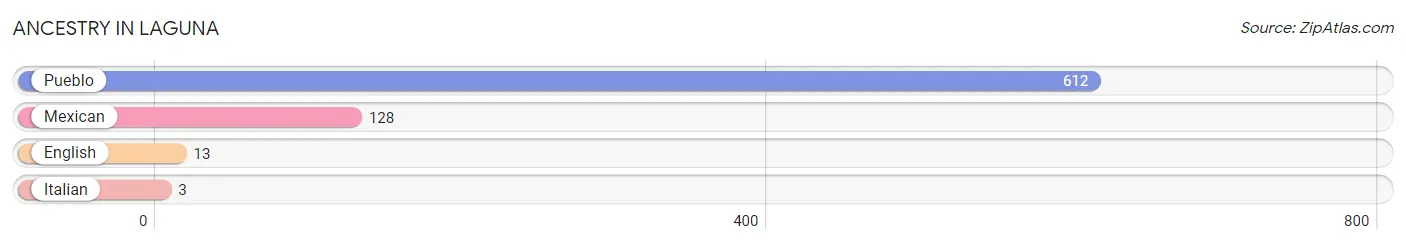
| Ancestry | # Population | % Population |
| English | 13 | 2.0% |
| Italian | 3 | 0.5% |
| Mexican | 128 | 19.5% |
| Pueblo | 612 | 93.4% | View All 4 Rows |
Immigrants in Laguna

| Immigration Origin | # Population | % Population | View All 0 Rows |
Sex and Age in Laguna
Sex and Age in Laguna
The most populous age groups in Laguna are 45 to 49 Years (57 | 22.4%) for men and 10 to 14 Years (109 | 27.2%) for women.
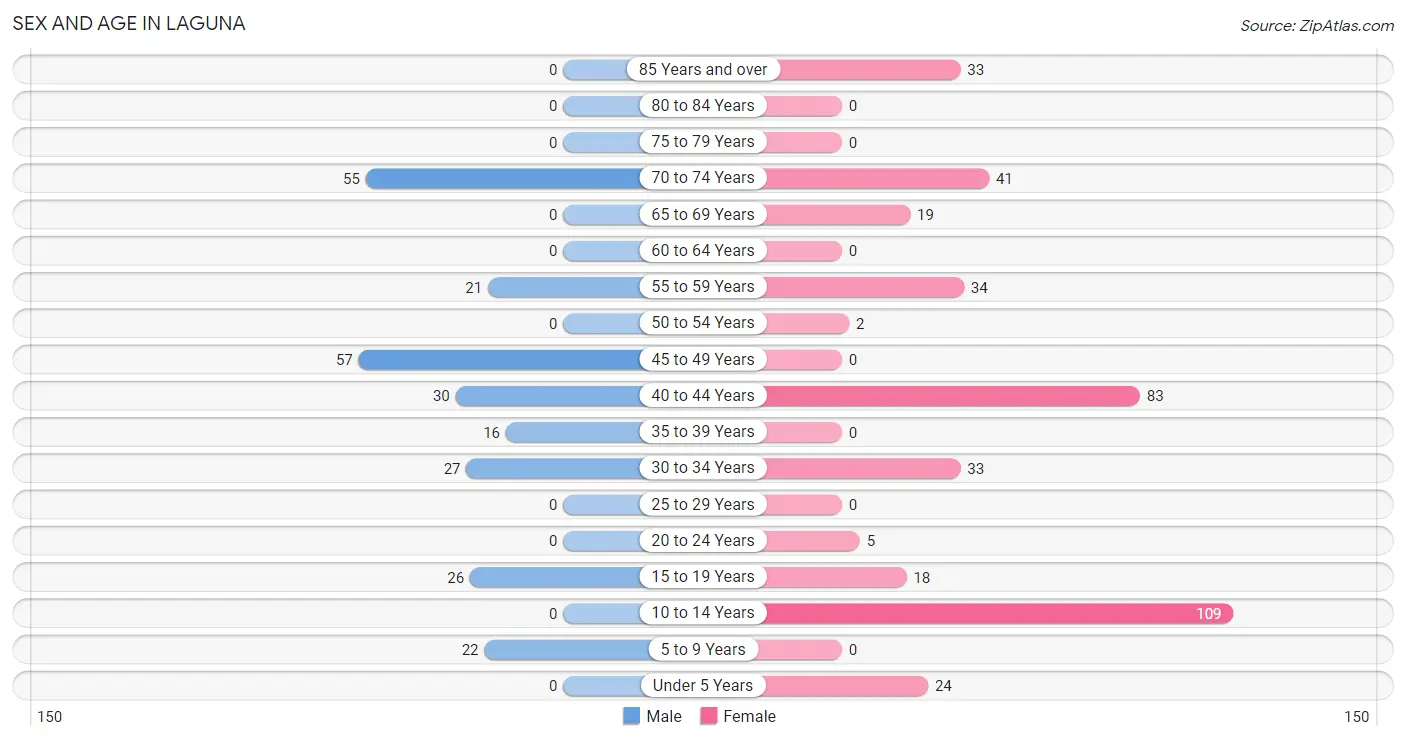
| Age Bracket | Male | Female |
| Under 5 Years | 0 (0.0%) | 24 (6.0%) |
| 5 to 9 Years | 22 (8.7%) | 0 (0.0%) |
| 10 to 14 Years | 0 (0.0%) | 109 (27.2%) |
| 15 to 19 Years | 26 (10.2%) | 18 (4.5%) |
| 20 to 24 Years | 0 (0.0%) | 5 (1.3%) |
| 25 to 29 Years | 0 (0.0%) | 0 (0.0%) |
| 30 to 34 Years | 27 (10.6%) | 33 (8.2%) |
| 35 to 39 Years | 16 (6.3%) | 0 (0.0%) |
| 40 to 44 Years | 30 (11.8%) | 83 (20.7%) |
| 45 to 49 Years | 57 (22.4%) | 0 (0.0%) |
| 50 to 54 Years | 0 (0.0%) | 2 (0.5%) |
| 55 to 59 Years | 21 (8.3%) | 34 (8.5%) |
| 60 to 64 Years | 0 (0.0%) | 0 (0.0%) |
| 65 to 69 Years | 0 (0.0%) | 19 (4.7%) |
| 70 to 74 Years | 55 (21.6%) | 41 (10.2%) |
| 75 to 79 Years | 0 (0.0%) | 0 (0.0%) |
| 80 to 84 Years | 0 (0.0%) | 0 (0.0%) |
| 85 Years and over | 0 (0.0%) | 33 (8.2%) |
| Total | 254 (100.0%) | 401 (100.0%) |
Families and Households in Laguna
Median Family Size in Laguna
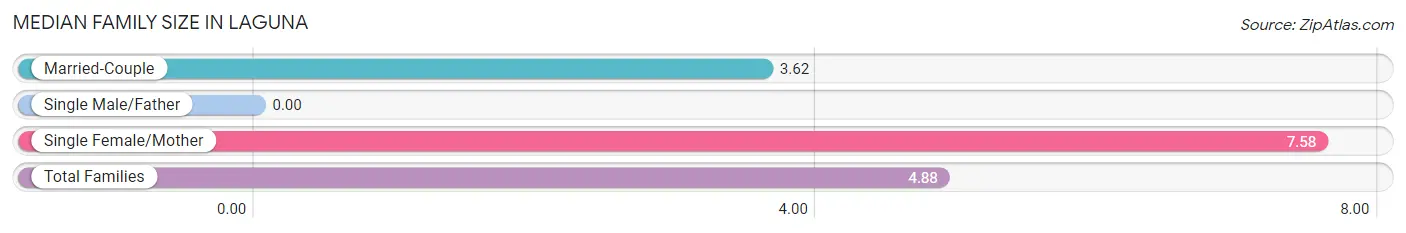
| Family Type | # Families | Family Size |
| Married-Couple | 82 (68.3%) | 3.62 |
| Single Male/Father | 0 (0.0%) | - |
| Single Female/Mother | 38 (31.7%) | 7.58 |
| Total Families | 120 (100.0%) | 4.88 |
Median Household Size in Laguna
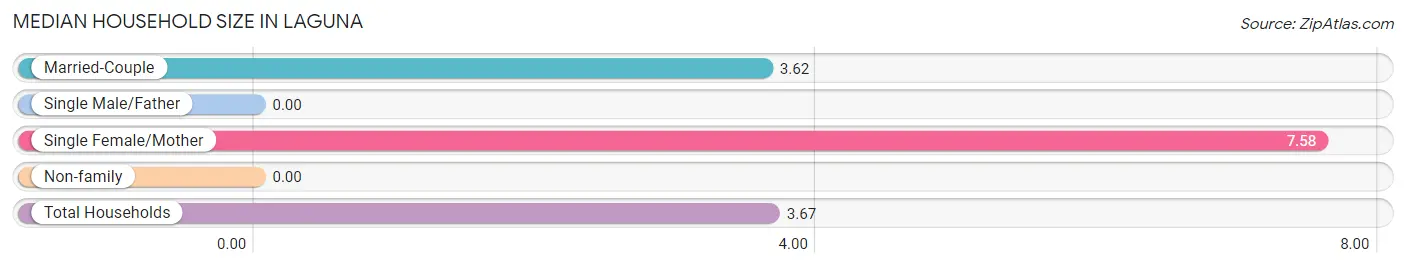
| Household Type | # Households | Household Size |
| Married-Couple | 82 (47.1%) | 3.62 |
| Single Male/Father | 0 (0.0%) | - |
| Single Female/Mother | 38 (21.8%) | 7.58 |
| Non-family | 54 (31.0%) | - |
| Total Households | 174 (100.0%) | 3.67 |
Household Size by Marriage Status in Laguna
Out of a total of 174 households in Laguna, 120 (69.0%) are family households, while 54 (31.0%) are nonfamily households. The most numerous type of family households are 2-person households, comprising 39, and the most common type of nonfamily households are 1-person households, comprising 54.
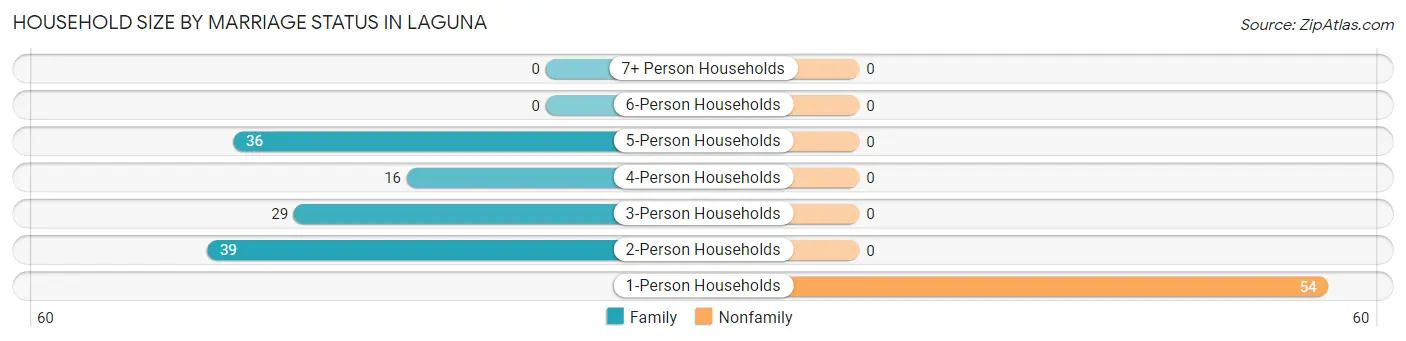
| Household Size | Family Households | Nonfamily Households |
| 1-Person Households | - | 54 (31.0%) |
| 2-Person Households | 39 (22.4%) | 0 (0.0%) |
| 3-Person Households | 29 (16.7%) | 0 (0.0%) |
| 4-Person Households | 16 (9.2%) | 0 (0.0%) |
| 5-Person Households | 36 (20.7%) | 0 (0.0%) |
| 6-Person Households | 0 (0.0%) | 0 (0.0%) |
| 7+ Person Households | 0 (0.0%) | 0 (0.0%) |
| Total | 120 (69.0%) | 54 (31.0%) |
Female Fertility in Laguna
Fertility by Age in Laguna
| Age Bracket | Women with Births | Births / 1,000 Women |
| 15 to 19 years | 0 (0.0%) | 0.0 |
| 20 to 34 years | 0 (0.0%) | 0.0 |
| 35 to 50 years | 0 (0.0%) | 0.0 |
| Total | 0 (0.0%) | 0.0 |
Fertility by Age by Marriage Status in Laguna
| Age Bracket | Married | Unmarried |
| 15 to 19 years | 0 (0.0%) | 0 (0.0%) |
| 20 to 34 years | 0 (0.0%) | 0 (0.0%) |
| 35 to 50 years | 0 (0.0%) | 0 (0.0%) |
| Total | 0 (0.0%) | 0 (0.0%) |
Fertility by Education in Laguna
| Educational Attainment | Women with Births | Births / 1,000 Women |
| Less than High School | 0 (0.0%) | 0.0 |
| High School Diploma | 0 (0.0%) | 0.0 |
| College or Associate's Degree | 0 (0.0%) | 0.0 |
| Bachelor's Degree | 0 (0.0%) | 0.0 |
| Graduate Degree | 0 (0.0%) | 0.0 |
| Total | 0 (0.0%) | 0.0 |
Fertility by Education by Marriage Status in Laguna
| Educational Attainment | Married | Unmarried |
| Less than High School | 0 (0.0%) | 0 (0.0%) |
| High School Diploma | 0 (0.0%) | 0 (0.0%) |
| College or Associate's Degree | 0 (0.0%) | 0 (0.0%) |
| Bachelor's Degree | 0 (0.0%) | 0 (0.0%) |
| Graduate Degree | 0 (0.0%) | 0 (0.0%) |
| Total | 0 (0.0%) | 0 (0.0%) |
Employment Characteristics in Laguna
Employment by Class of Employer in Laguna
Among the 167 employed individuals in Laguna, local government employees (93 | 55.7%), private company employees (46 | 27.5%), and not-for-profit organizations (26 | 15.6%) make up the most common classes of employment.
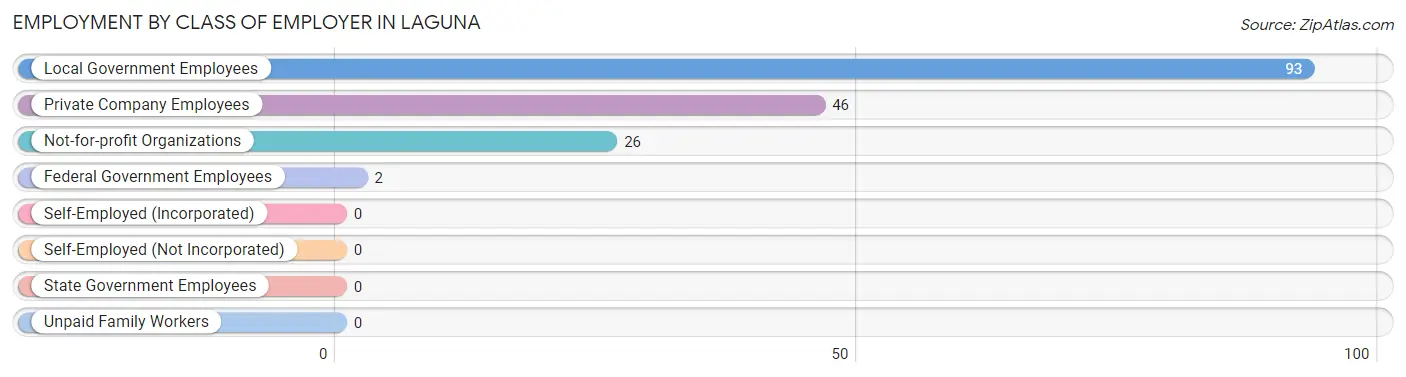
| Employer Class | # Employees | % Employees |
| Private Company Employees | 46 | 27.5% |
| Self-Employed (Incorporated) | 0 | 0.0% |
| Self-Employed (Not Incorporated) | 0 | 0.0% |
| Not-for-profit Organizations | 26 | 15.6% |
| Local Government Employees | 93 | 55.7% |
| State Government Employees | 0 | 0.0% |
| Federal Government Employees | 2 | 1.2% |
| Unpaid Family Workers | 0 | 0.0% |
| Total | 167 | 100.0% |
Employment Status by Age in Laguna
According to the labor force statistics for Laguna, out of the total population over 16 years of age (482), 44.0% or 212 individuals are in the labor force, with 13.7% or 29 of them unemployed. The age group with the highest labor force participation rate is 16 to 19 years, with 100.0% or 26 individuals in the labor force. Within the labor force, the 20 to 24 years age range has the highest percentage of unemployed individuals, with 100.0% or 2 of them being unemployed.
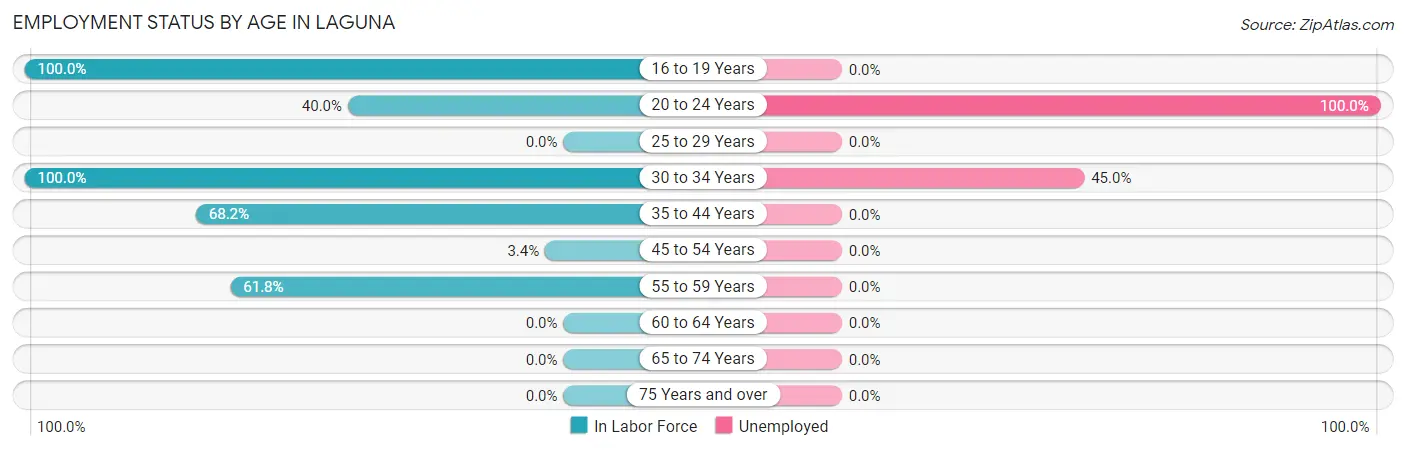
| Age Bracket | In Labor Force | Unemployed |
| 16 to 19 Years | 26 (100.0%) | 0 (0.0%) |
| 20 to 24 Years | 2 (40.0%) | 2 (100.0%) |
| 25 to 29 Years | 0 (0.0%) | 0 (0.0%) |
| 30 to 34 Years | 60 (100.0%) | 27 (45.0%) |
| 35 to 44 Years | 88 (68.2%) | 0 (0.0%) |
| 45 to 54 Years | 2 (3.4%) | 0 (0.0%) |
| 55 to 59 Years | 34 (61.8%) | 0 (0.0%) |
| 60 to 64 Years | 0 (0.0%) | 0 (0.0%) |
| 65 to 74 Years | 0 (0.0%) | 0 (0.0%) |
| 75 Years and over | 0 (0.0%) | 0 (0.0%) |
| Total | 212 (44.0%) | 29 (13.7%) |
Employment Status by Educational Attainment in Laguna
According to labor force statistics for Laguna, 60.7% of individuals (184) out of the total population between 25 and 64 years of age (303) are in the labor force, with 14.7% or 27 of them being unemployed. The group with the highest labor force participation rate are those with the educational attainment of bachelor's degree or higher, with 100.0% or 1 individuals in the labor force. Within the labor force, individuals with college / associate degree education have the highest percentage of unemployment, with 14.8% or 27 of them being unemployed.
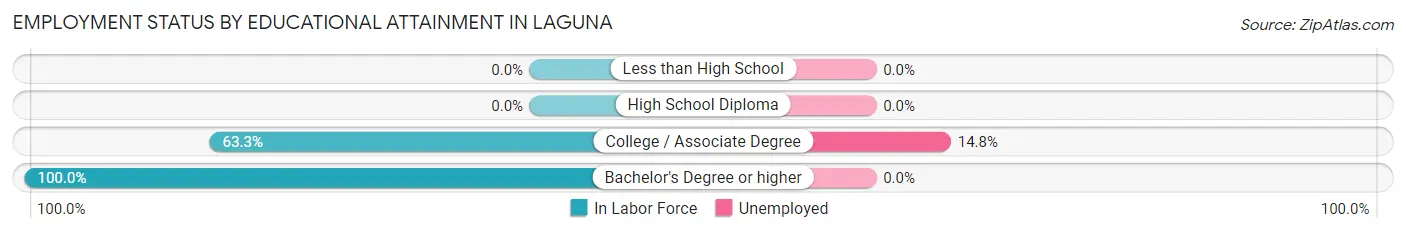
| Educational Attainment | In Labor Force | Unemployed |
| Less than High School | 0 (0.0%) | 0 (0.0%) |
| High School Diploma | 0 (0.0%) | 0 (0.0%) |
| College / Associate Degree | 183 (63.3%) | 43 (14.8%) |
| Bachelor's Degree or higher | 1 (100.0%) | 0 (0.0%) |
| Total | 184 (60.7%) | 45 (14.7%) |
Employment Occupations by Sex in Laguna
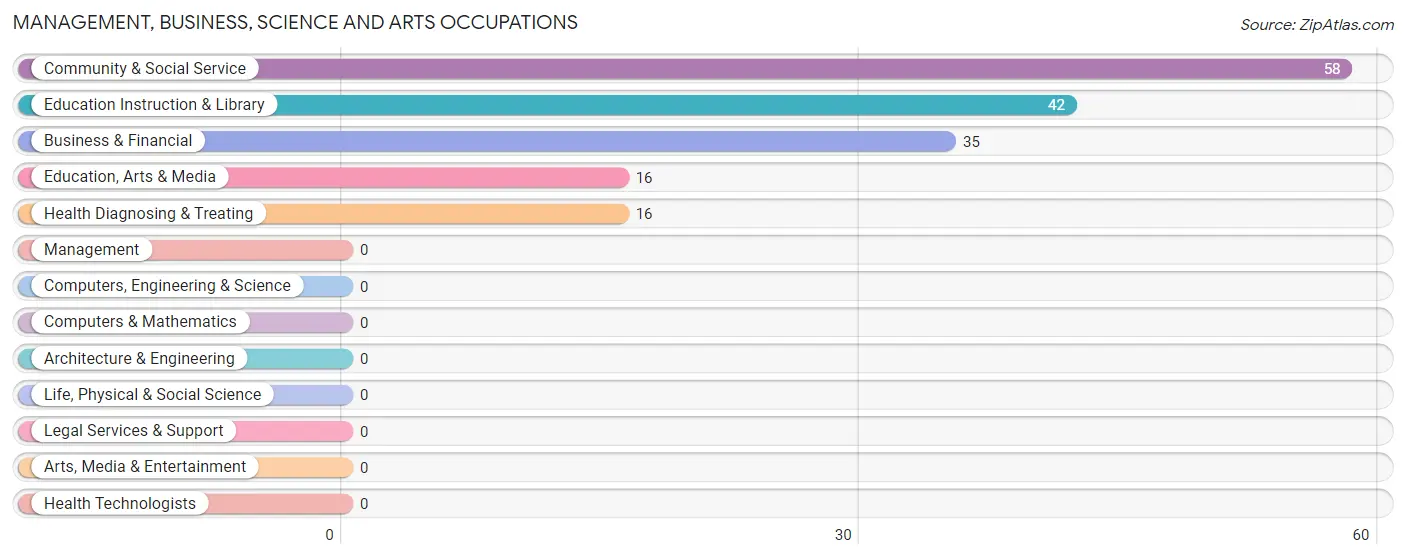
Management, Business, Science and Arts Occupations
The most common Management, Business, Science and Arts occupations in Laguna are Community & Social Service (58 | 31.7%), Education Instruction & Library (42 | 23.0%), Business & Financial (35 | 19.1%), Education, Arts & Media (16 | 8.7%), and Health Diagnosing & Treating (16 | 8.7%).
Management, Business, Science and Arts Occupations by Sex
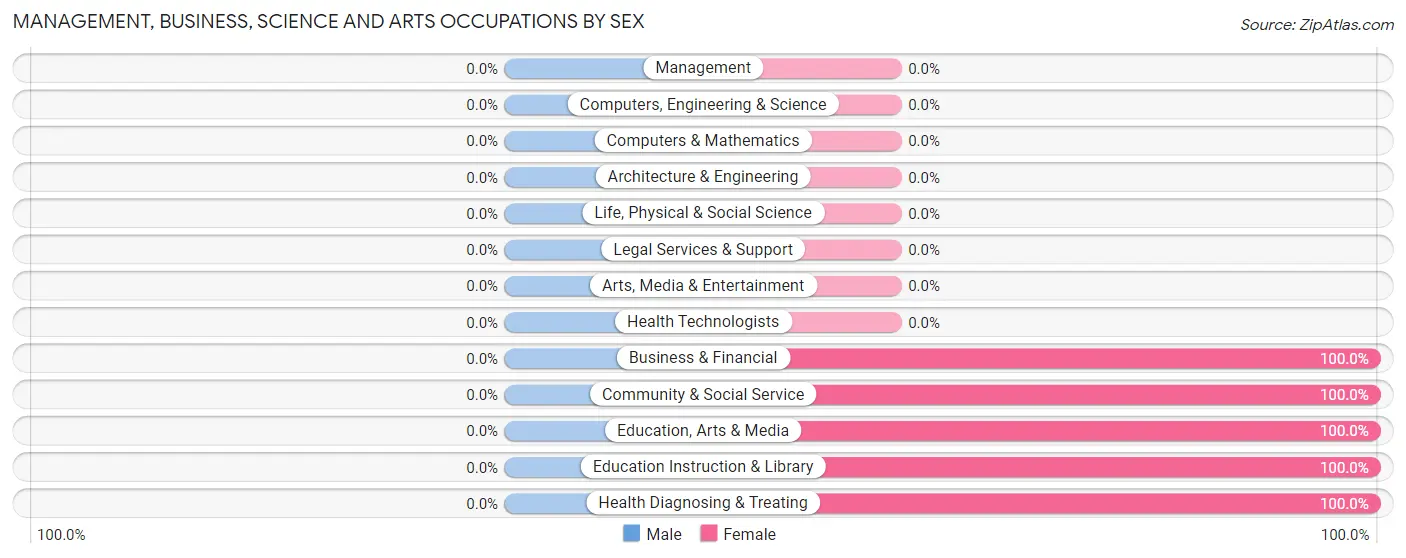
| Occupation | Male | Female |
| Management | 0 (0.0%) | 0 (0.0%) |
| Business & Financial | 0 (0.0%) | 35 (100.0%) |
| Computers, Engineering & Science | 0 (0.0%) | 0 (0.0%) |
| Computers & Mathematics | 0 (0.0%) | 0 (0.0%) |
| Architecture & Engineering | 0 (0.0%) | 0 (0.0%) |
| Life, Physical & Social Science | 0 (0.0%) | 0 (0.0%) |
| Community & Social Service | 0 (0.0%) | 58 (100.0%) |
| Education, Arts & Media | 0 (0.0%) | 16 (100.0%) |
| Legal Services & Support | 0 (0.0%) | 0 (0.0%) |
| Education Instruction & Library | 0 (0.0%) | 42 (100.0%) |
| Arts, Media & Entertainment | 0 (0.0%) | 0 (0.0%) |
| Health Diagnosing & Treating | 0 (0.0%) | 16 (100.0%) |
| Health Technologists | 0 (0.0%) | 0 (0.0%) |
| Total (Category) | 0 (0.0%) | 109 (100.0%) |
| Total (Overall) | 72 (39.3%) | 111 (60.7%) |
Services Occupations
The most common Services occupations in Laguna are Security & Protection (30 | 16.4%), Firefighting & Prevention (30 | 16.4%), and Personal Care & Service (26 | 14.2%).
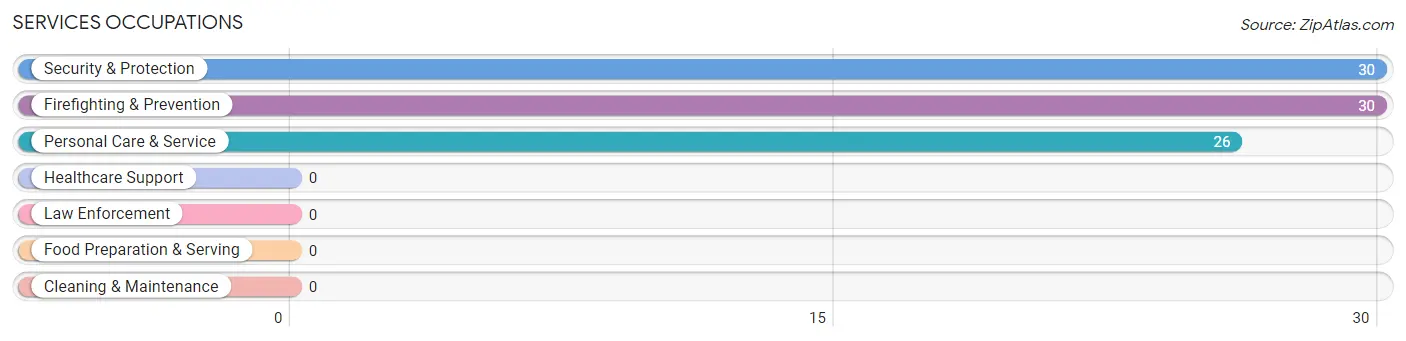
Services Occupations by Sex
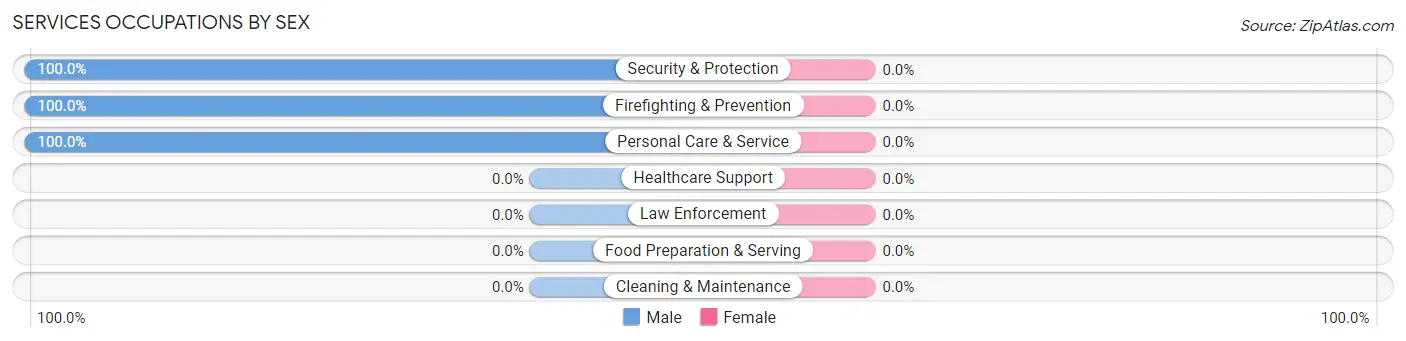
| Occupation | Male | Female |
| Healthcare Support | 0 (0.0%) | 0 (0.0%) |
| Security & Protection | 30 (100.0%) | 0 (0.0%) |
| Firefighting & Prevention | 30 (100.0%) | 0 (0.0%) |
| Law Enforcement | 0 (0.0%) | 0 (0.0%) |
| Food Preparation & Serving | 0 (0.0%) | 0 (0.0%) |
| Cleaning & Maintenance | 0 (0.0%) | 0 (0.0%) |
| Personal Care & Service | 26 (100.0%) | 0 (0.0%) |
| Total (Category) | 56 (100.0%) | 0 (0.0%) |
| Total (Overall) | 72 (39.3%) | 111 (60.7%) |
Sales and Office Occupations
The most common Sales and Office occupations in Laguna are , and Office & Administration (2 | 1.1%).
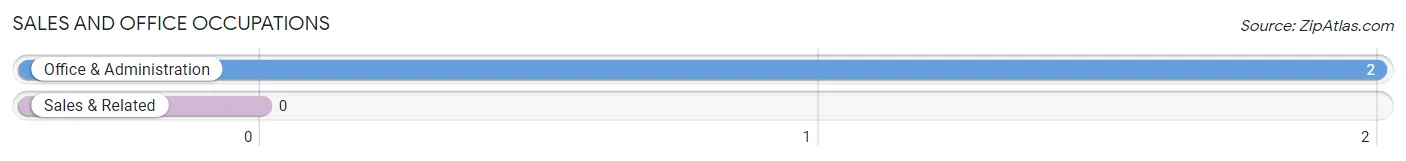
Sales and Office Occupations by Sex
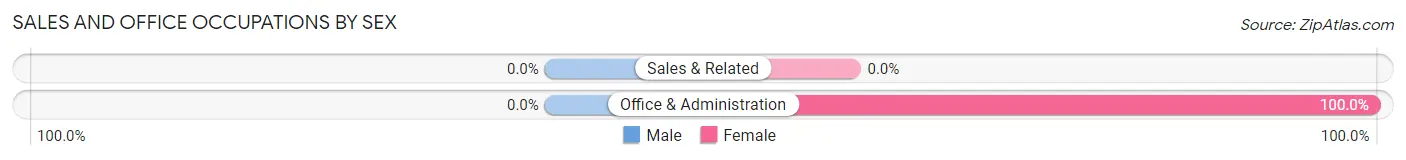
| Occupation | Male | Female |
| Sales & Related | 0 (0.0%) | 0 (0.0%) |
| Office & Administration | 0 (0.0%) | 2 (100.0%) |
| Total (Category) | 0 (0.0%) | 2 (100.0%) |
| Total (Overall) | 72 (39.3%) | 111 (60.7%) |
Natural Resources, Construction and Maintenance Occupations
The most common Natural Resources, Construction and Maintenance occupations in Laguna are , and Construction & Extraction (16 | 8.7%).
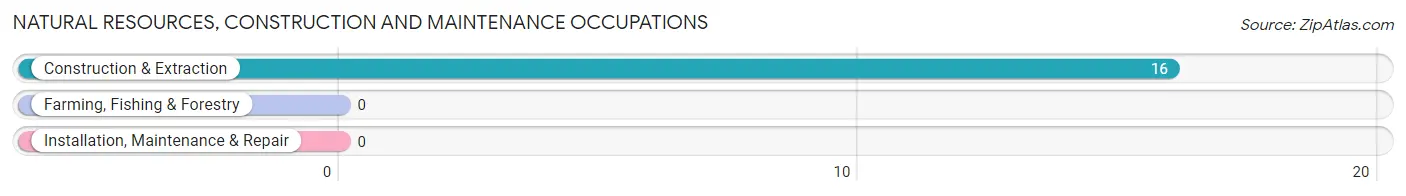
Natural Resources, Construction and Maintenance Occupations by Sex
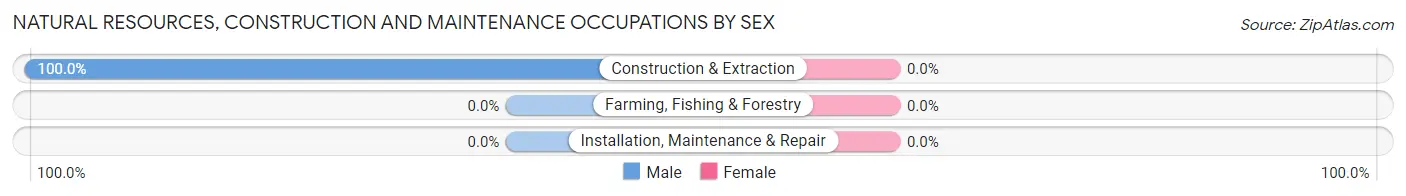
| Occupation | Male | Female |
| Farming, Fishing & Forestry | 0 (0.0%) | 0 (0.0%) |
| Construction & Extraction | 16 (100.0%) | 0 (0.0%) |
| Installation, Maintenance & Repair | 0 (0.0%) | 0 (0.0%) |
| Total (Category) | 16 (100.0%) | 0 (0.0%) |
| Total (Overall) | 72 (39.3%) | 111 (60.7%) |
Production, Transportation and Moving Occupations
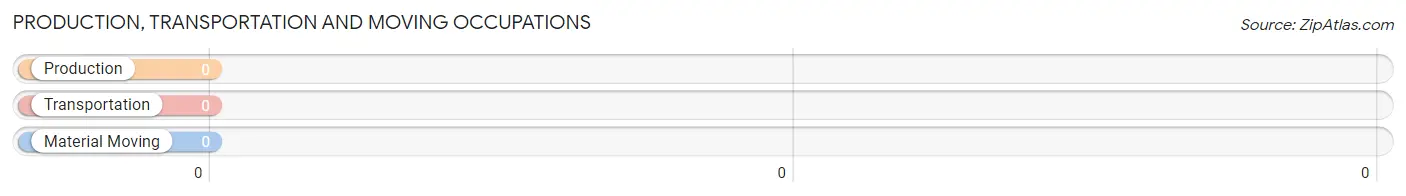
Production, Transportation and Moving Occupations by Sex
| Occupation | Male | Female |
| Production | 0 (0.0%) | 0 (0.0%) |
| Transportation | 0 (0.0%) | 0 (0.0%) |
| Material Moving | 0 (0.0%) | 0 (0.0%) |
| Total (Category) | 0 (0.0%) | 0 (0.0%) |
| Total (Overall) | 72 (39.3%) | 111 (60.7%) |
Employment Industries by Sex in Laguna
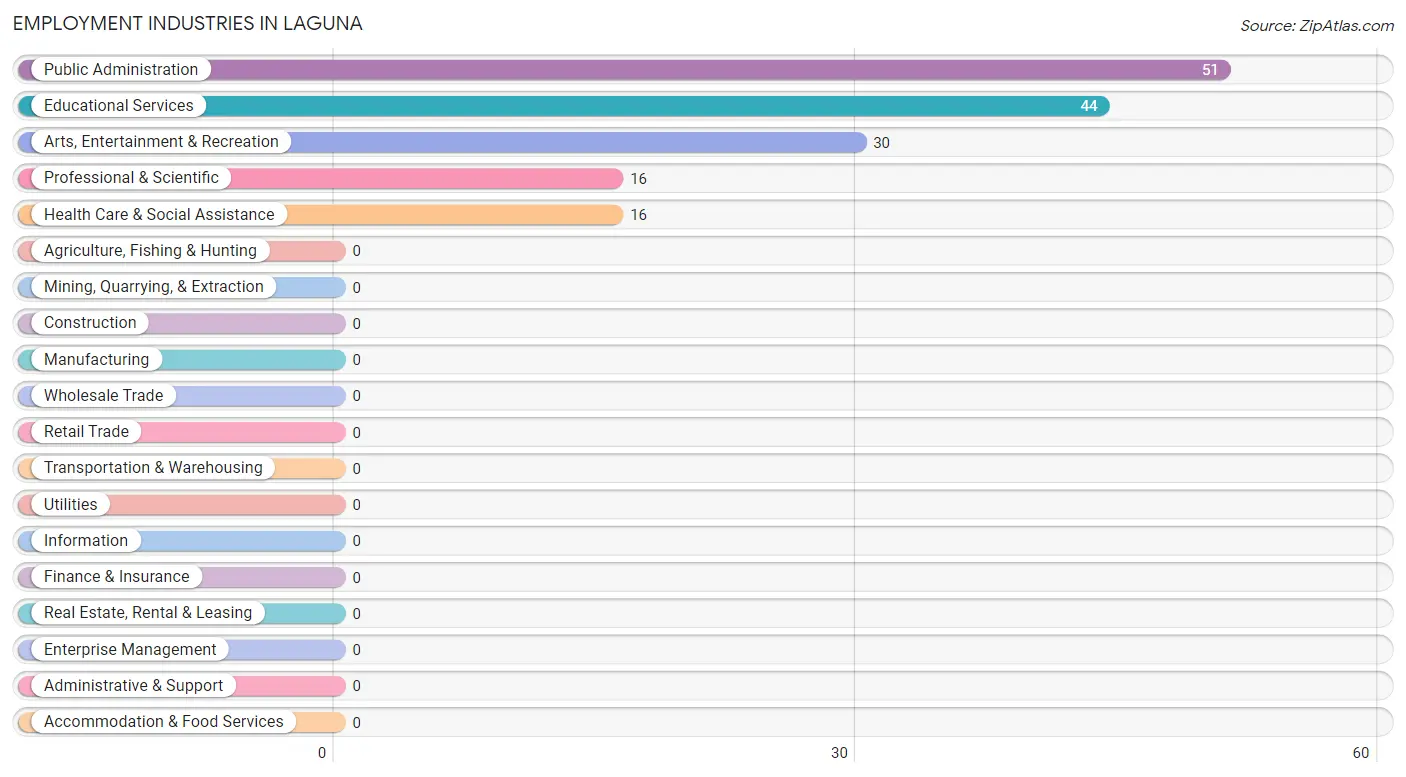
Employment Industries in Laguna
The major employment industries in Laguna include Public Administration (51 | 27.9%), Educational Services (44 | 24.0%), Arts, Entertainment & Recreation (30 | 16.4%), Professional & Scientific (16 | 8.7%), and Health Care & Social Assistance (16 | 8.7%).
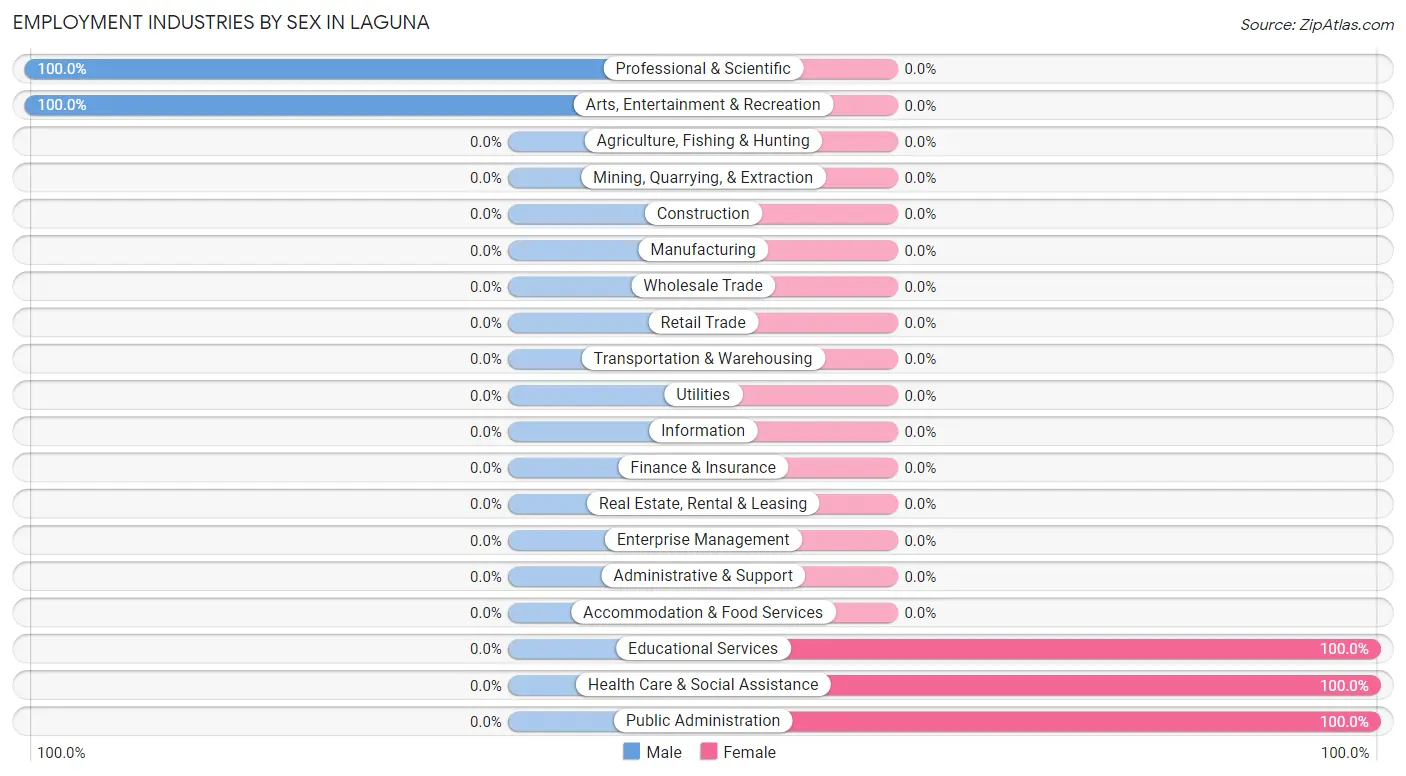
Employment Industries by Sex in Laguna
The Laguna industries that see more men than women are Professional & Scientific (100.0%), and Arts, Entertainment & Recreation (100.0%), whereas the industries that tend to have a higher number of women are Educational Services (100.0%), Health Care & Social Assistance (100.0%), and Public Administration (100.0%).
| Industry | Male | Female |
| Agriculture, Fishing & Hunting | 0 (0.0%) | 0 (0.0%) |
| Mining, Quarrying, & Extraction | 0 (0.0%) | 0 (0.0%) |
| Construction | 0 (0.0%) | 0 (0.0%) |
| Manufacturing | 0 (0.0%) | 0 (0.0%) |
| Wholesale Trade | 0 (0.0%) | 0 (0.0%) |
| Retail Trade | 0 (0.0%) | 0 (0.0%) |
| Transportation & Warehousing | 0 (0.0%) | 0 (0.0%) |
| Utilities | 0 (0.0%) | 0 (0.0%) |
| Information | 0 (0.0%) | 0 (0.0%) |
| Finance & Insurance | 0 (0.0%) | 0 (0.0%) |
| Real Estate, Rental & Leasing | 0 (0.0%) | 0 (0.0%) |
| Professional & Scientific | 16 (100.0%) | 0 (0.0%) |
| Enterprise Management | 0 (0.0%) | 0 (0.0%) |
| Administrative & Support | 0 (0.0%) | 0 (0.0%) |
| Educational Services | 0 (0.0%) | 44 (100.0%) |
| Health Care & Social Assistance | 0 (0.0%) | 16 (100.0%) |
| Arts, Entertainment & Recreation | 30 (100.0%) | 0 (0.0%) |
| Accommodation & Food Services | 0 (0.0%) | 0 (0.0%) |
| Public Administration | 0 (0.0%) | 51 (100.0%) |
| Total | 72 (39.3%) | 111 (60.7%) |
Education in Laguna
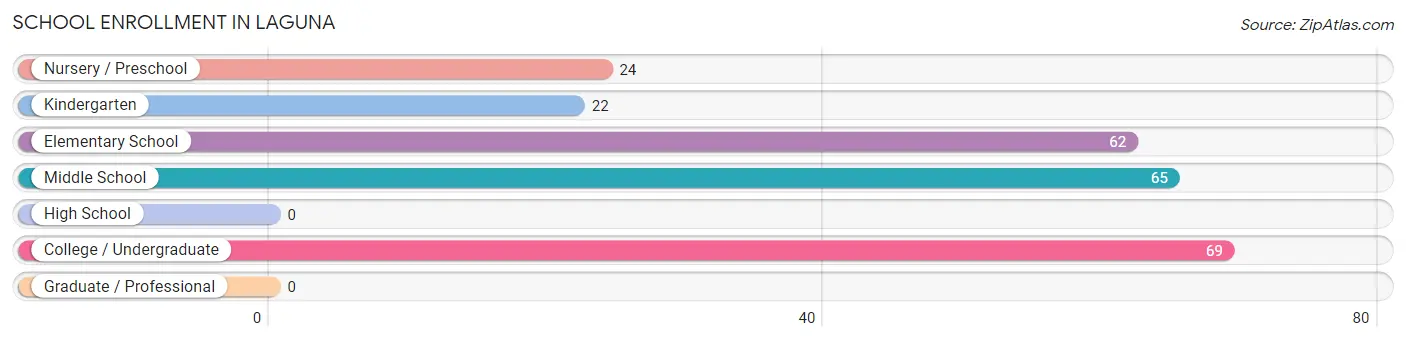
School Enrollment in Laguna
The most common levels of schooling among the 242 students in Laguna are college / undergraduate (69 | 28.5%), middle school (65 | 26.9%), and elementary school (62 | 25.6%).
| School Level | # Students | % Students |
| Nursery / Preschool | 24 | 9.9% |
| Kindergarten | 22 | 9.1% |
| Elementary School | 62 | 25.6% |
| Middle School | 65 | 26.9% |
| High School | 0 | 0.0% |
| College / Undergraduate | 69 | 28.5% |
| Graduate / Professional | 0 | 0.0% |
| Total | 242 | 100.0% |
School Enrollment by Age by Funding Source in Laguna
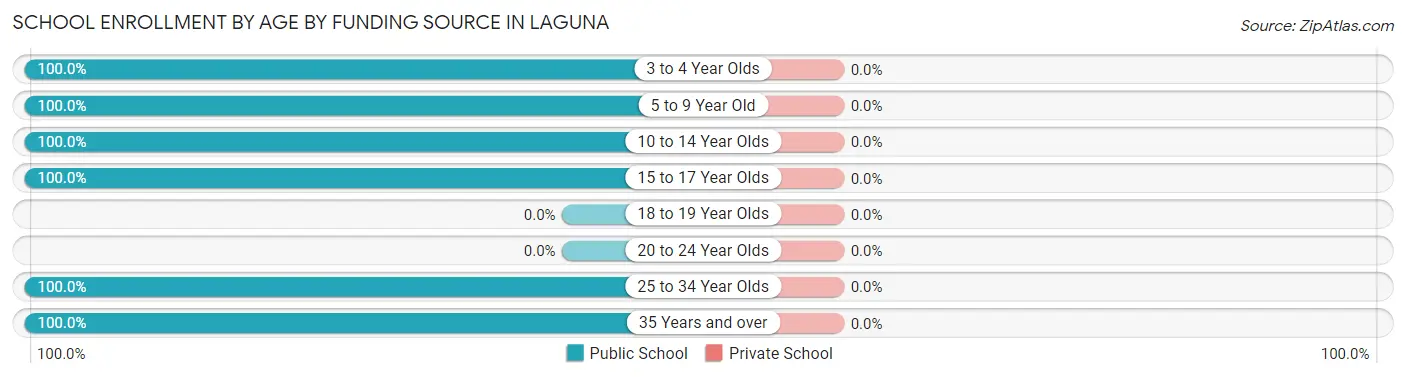
| Age Bracket | Public School | Private School |
| 3 to 4 Year Olds | 24 (100.0%) | 0 (0.0%) |
| 5 to 9 Year Old | 22 (100.0%) | 0 (0.0%) |
| 10 to 14 Year Olds | 109 (100.0%) | 0 (0.0%) |
| 15 to 17 Year Olds | 18 (100.0%) | 0 (0.0%) |
| 18 to 19 Year Olds | 0 (0.0%) | 0 (0.0%) |
| 20 to 24 Year Olds | 0 (0.0%) | 0 (0.0%) |
| 25 to 34 Year Olds | 27 (100.0%) | 0 (0.0%) |
| 35 Years and over | 42 (100.0%) | 0 (0.0%) |
| Total | 242 (100.0%) | 0 (0.0%) |
Educational Attainment by Field of Study in Laguna
, and business (1 | 100.0%) are the most common fields of study among 1 individuals in Laguna who have obtained a bachelor's degree or higher.
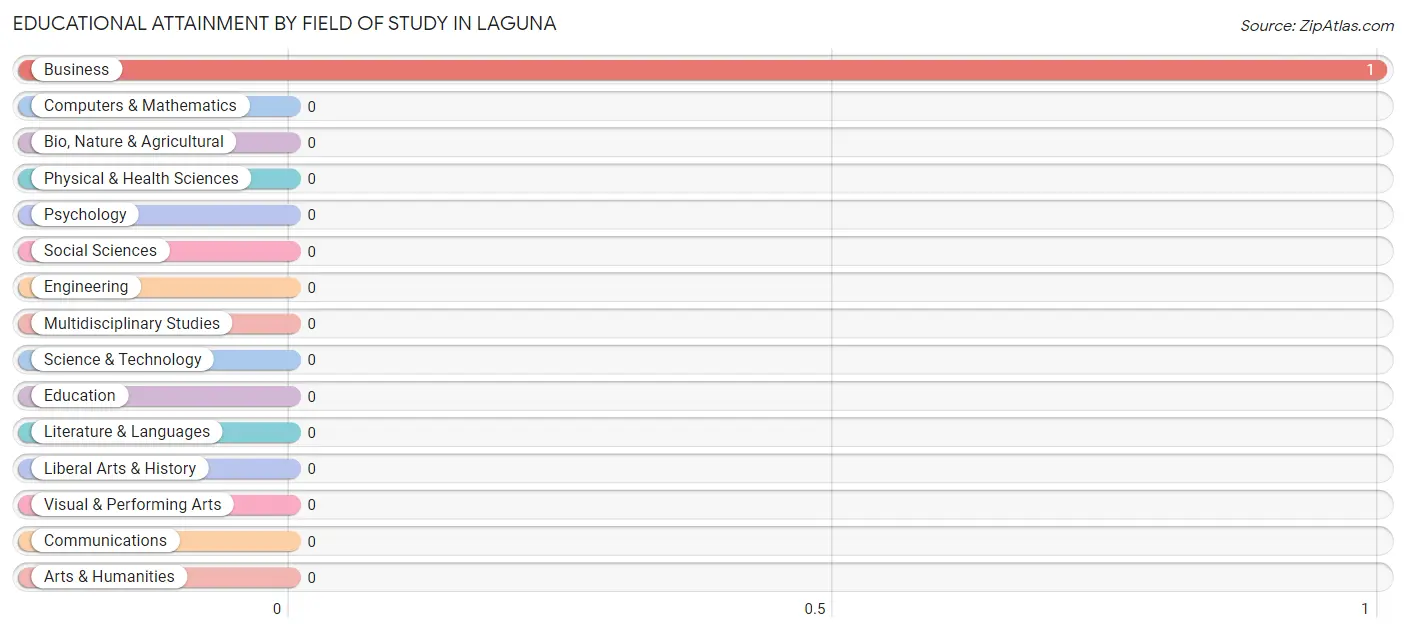
| Field of Study | # Graduates | % Graduates |
| Computers & Mathematics | 0 | 0.0% |
| Bio, Nature & Agricultural | 0 | 0.0% |
| Physical & Health Sciences | 0 | 0.0% |
| Psychology | 0 | 0.0% |
| Social Sciences | 0 | 0.0% |
| Engineering | 0 | 0.0% |
| Multidisciplinary Studies | 0 | 0.0% |
| Science & Technology | 0 | 0.0% |
| Business | 1 | 100.0% |
| Education | 0 | 0.0% |
| Literature & Languages | 0 | 0.0% |
| Liberal Arts & History | 0 | 0.0% |
| Visual & Performing Arts | 0 | 0.0% |
| Communications | 0 | 0.0% |
| Arts & Humanities | 0 | 0.0% |
| Total | 1 | 100.0% |
Transportation & Commute in Laguna
Vehicle Availability by Sex in Laguna
The most prevalent vehicle ownership categories in Laguna are males with 3 vehicles (30, accounting for 53.6%) and females with 3 vehicles (32, making up 27.0%).
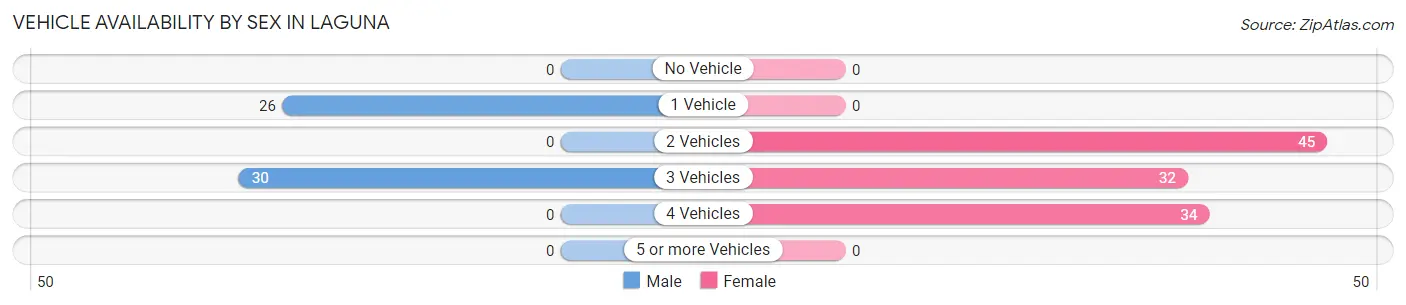
| Vehicles Available | Male | Female |
| No Vehicle | 0 (0.0%) | 0 (0.0%) |
| 1 Vehicle | 26 (46.4%) | 0 (0.0%) |
| 2 Vehicles | 0 (0.0%) | 45 (40.5%) |
| 3 Vehicles | 30 (53.6%) | 32 (28.8%) |
| 4 Vehicles | 0 (0.0%) | 34 (30.6%) |
| 5 or more Vehicles | 0 (0.0%) | 0 (0.0%) |
| Total | 56 (100.0%) | 111 (100.0%) |
Commute Time in Laguna
The most frequently occuring commute durations in Laguna are 30 to 34 minutes (64 commuters, 38.3%), less than 5 minutes (42 commuters, 25.2%), and 45 to 59 minutes (42 commuters, 25.2%).
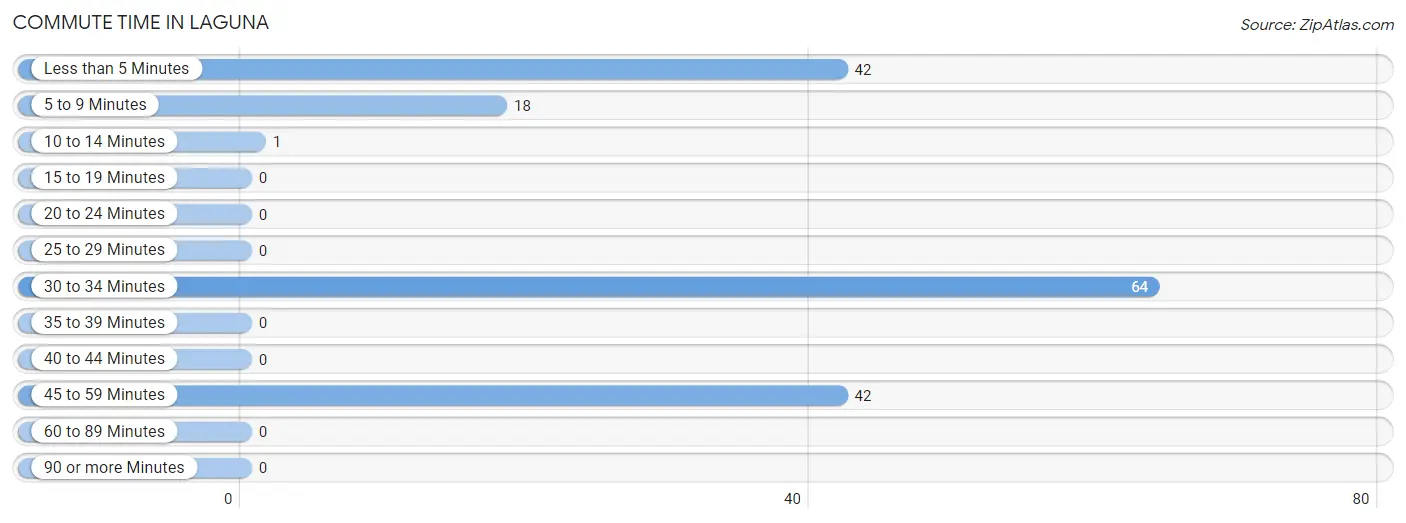
| Commute Time | # Commuters | % Commuters |
| Less than 5 Minutes | 42 | 25.2% |
| 5 to 9 Minutes | 18 | 10.8% |
| 10 to 14 Minutes | 1 | 0.6% |
| 15 to 19 Minutes | 0 | 0.0% |
| 20 to 24 Minutes | 0 | 0.0% |
| 25 to 29 Minutes | 0 | 0.0% |
| 30 to 34 Minutes | 64 | 38.3% |
| 35 to 39 Minutes | 0 | 0.0% |
| 40 to 44 Minutes | 0 | 0.0% |
| 45 to 59 Minutes | 42 | 25.2% |
| 60 to 89 Minutes | 0 | 0.0% |
| 90 or more Minutes | 0 | 0.0% |
Commute Time by Sex in Laguna
The most common commute times in Laguna are 30 to 34 minutes (30 commuters, 53.6%) for males and less than 5 minutes (42 commuters, 37.8%) for females.
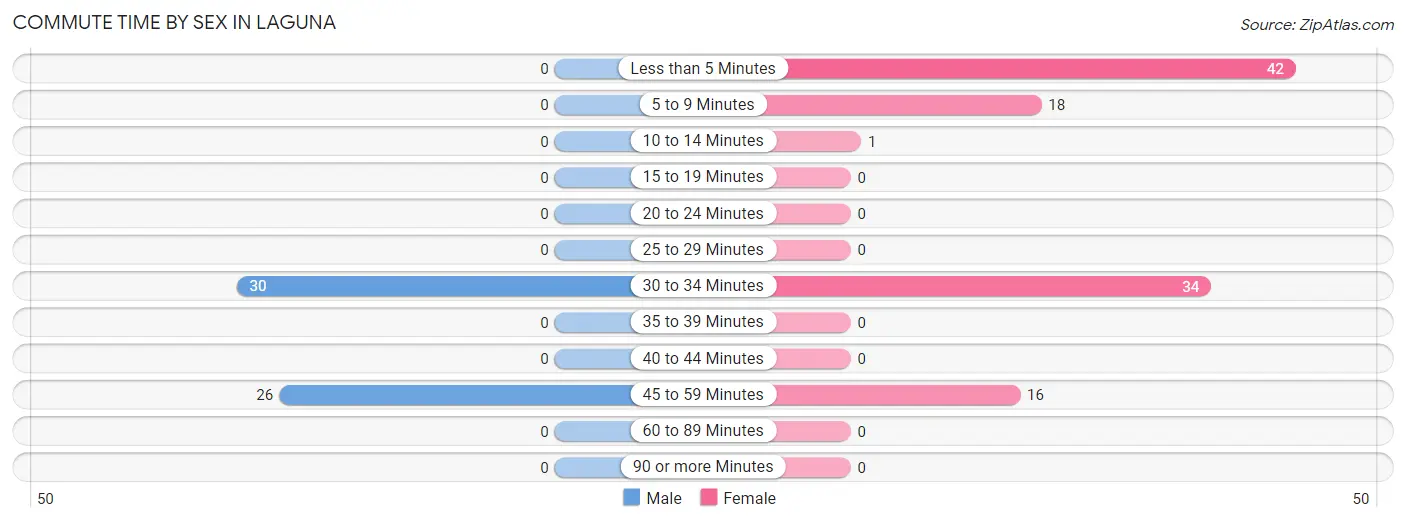
| Commute Time | Male | Female |
| Less than 5 Minutes | 0 (0.0%) | 42 (37.8%) |
| 5 to 9 Minutes | 0 (0.0%) | 18 (16.2%) |
| 10 to 14 Minutes | 0 (0.0%) | 1 (0.9%) |
| 15 to 19 Minutes | 0 (0.0%) | 0 (0.0%) |
| 20 to 24 Minutes | 0 (0.0%) | 0 (0.0%) |
| 25 to 29 Minutes | 0 (0.0%) | 0 (0.0%) |
| 30 to 34 Minutes | 30 (53.6%) | 34 (30.6%) |
| 35 to 39 Minutes | 0 (0.0%) | 0 (0.0%) |
| 40 to 44 Minutes | 0 (0.0%) | 0 (0.0%) |
| 45 to 59 Minutes | 26 (46.4%) | 16 (14.4%) |
| 60 to 89 Minutes | 0 (0.0%) | 0 (0.0%) |
| 90 or more Minutes | 0 (0.0%) | 0 (0.0%) |
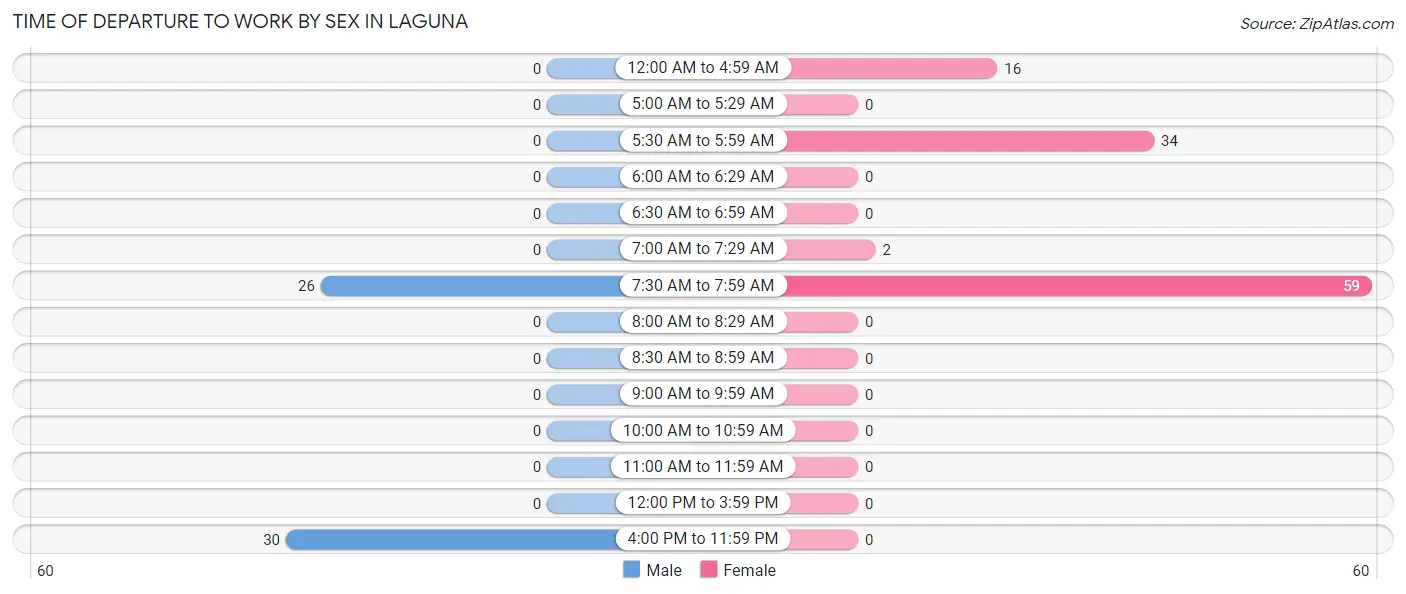
Time of Departure to Work by Sex in Laguna
The most frequent times of departure to work in Laguna are 4:00 PM to 11:59 PM (30, 53.6%) for males and 7:30 AM to 7:59 AM (59, 53.1%) for females.
| Time of Departure | Male | Female |
| 12:00 AM to 4:59 AM | 0 (0.0%) | 16 (14.4%) |
| 5:00 AM to 5:29 AM | 0 (0.0%) | 0 (0.0%) |
| 5:30 AM to 5:59 AM | 0 (0.0%) | 34 (30.6%) |
| 6:00 AM to 6:29 AM | 0 (0.0%) | 0 (0.0%) |
| 6:30 AM to 6:59 AM | 0 (0.0%) | 0 (0.0%) |
| 7:00 AM to 7:29 AM | 0 (0.0%) | 2 (1.8%) |
| 7:30 AM to 7:59 AM | 26 (46.4%) | 59 (53.1%) |
| 8:00 AM to 8:29 AM | 0 (0.0%) | 0 (0.0%) |
| 8:30 AM to 8:59 AM | 0 (0.0%) | 0 (0.0%) |
| 9:00 AM to 9:59 AM | 0 (0.0%) | 0 (0.0%) |
| 10:00 AM to 10:59 AM | 0 (0.0%) | 0 (0.0%) |
| 11:00 AM to 11:59 AM | 0 (0.0%) | 0 (0.0%) |
| 12:00 PM to 3:59 PM | 0 (0.0%) | 0 (0.0%) |
| 4:00 PM to 11:59 PM | 30 (53.6%) | 0 (0.0%) |
| Total | 56 (100.0%) | 111 (100.0%) |
Housing Occupancy in Laguna
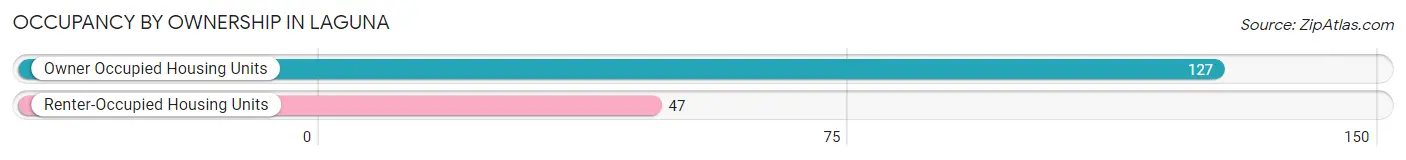
Occupancy by Ownership in Laguna
Of the total 174 dwellings in Laguna, owner-occupied units account for 127 (73.0%), while renter-occupied units make up 47 (27.0%).
| Occupancy | # Housing Units | % Housing Units |
| Owner Occupied Housing Units | 127 | 73.0% |
| Renter-Occupied Housing Units | 47 | 27.0% |
| Total Occupied Housing Units | 174 | 100.0% |
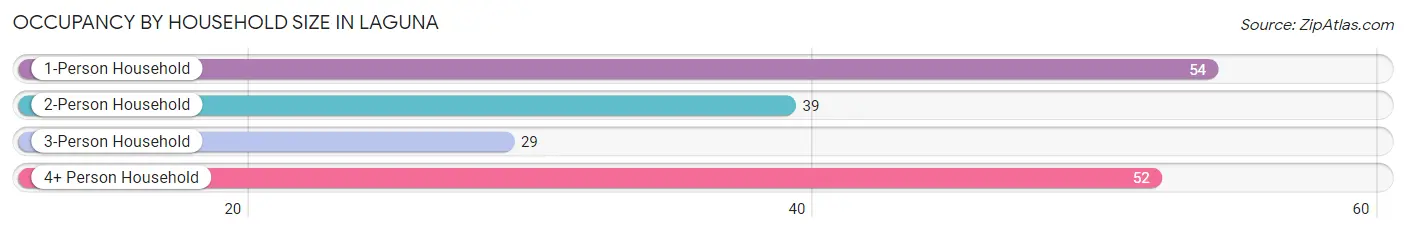
Occupancy by Household Size in Laguna
| Household Size | # Housing Units | % Housing Units |
| 1-Person Household | 54 | 31.0% |
| 2-Person Household | 39 | 22.4% |
| 3-Person Household | 29 | 16.7% |
| 4+ Person Household | 52 | 29.9% |
| Total Housing Units | 174 | 100.0% |
Occupancy by Ownership by Household Size in Laguna
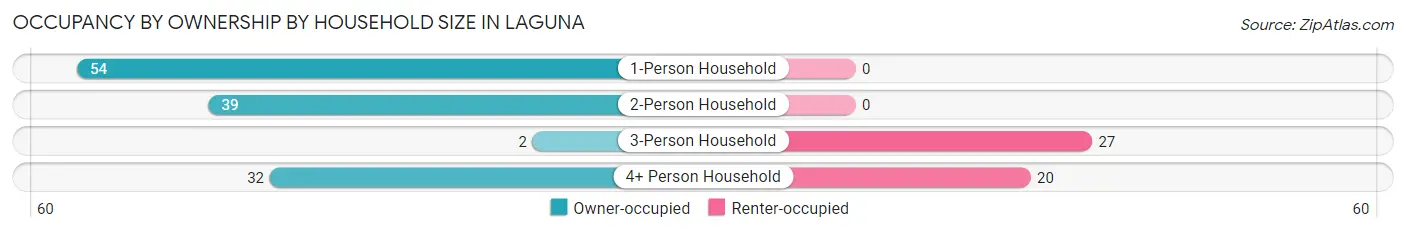
| Household Size | Owner-occupied | Renter-occupied |
| 1-Person Household | 54 (100.0%) | 0 (0.0%) |
| 2-Person Household | 39 (100.0%) | 0 (0.0%) |
| 3-Person Household | 2 (6.9%) | 27 (93.1%) |
| 4+ Person Household | 32 (61.5%) | 20 (38.5%) |
| Total Housing Units | 127 (73.0%) | 47 (27.0%) |
Occupancy by Educational Attainment in Laguna
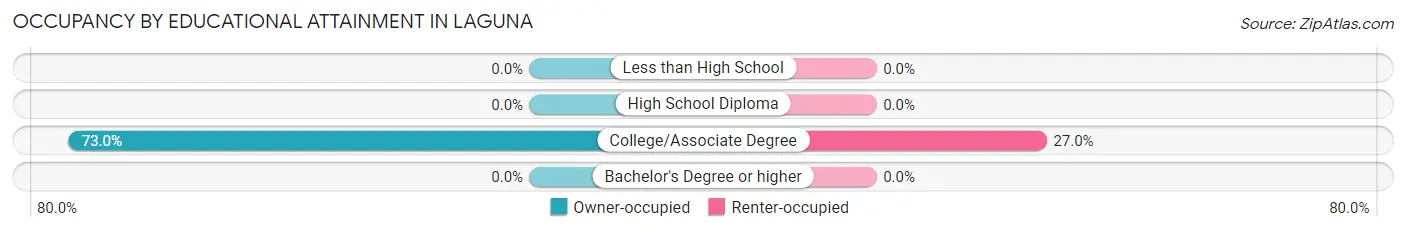
| Household Size | Owner-occupied | Renter-occupied |
| Less than High School | 0 (0.0%) | 0 (0.0%) |
| High School Diploma | 0 (0.0%) | 0 (0.0%) |
| College/Associate Degree | 127 (73.0%) | 47 (27.0%) |
| Bachelor's Degree or higher | 0 (0.0%) | 0 (0.0%) |
Occupancy by Age of Householder in Laguna
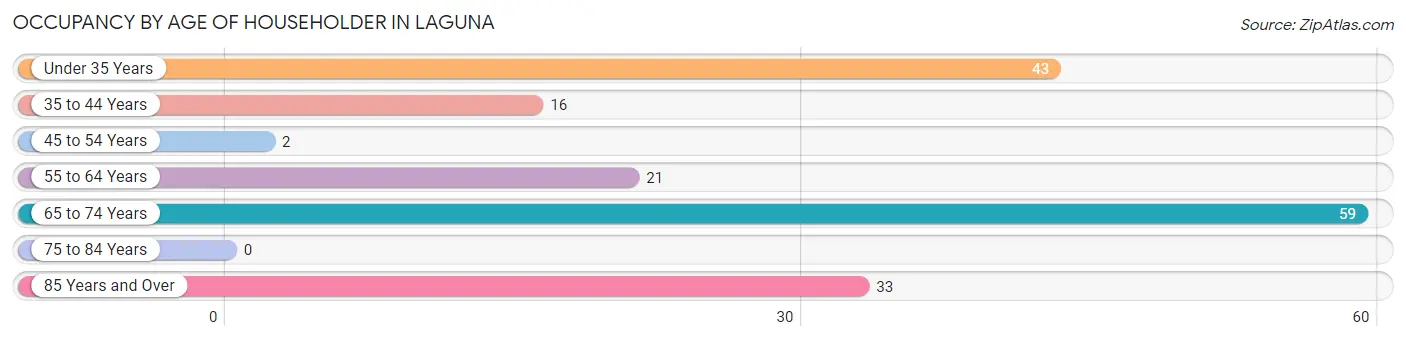
| Age Bracket | # Households | % Households |
| Under 35 Years | 43 | 24.7% |
| 35 to 44 Years | 16 | 9.2% |
| 45 to 54 Years | 2 | 1.1% |
| 55 to 64 Years | 21 | 12.1% |
| 65 to 74 Years | 59 | 33.9% |
| 75 to 84 Years | 0 | 0.0% |
| 85 Years and Over | 33 | 19.0% |
| Total | 174 | 100.0% |
Housing Finances in Laguna
Median Income by Occupancy in Laguna
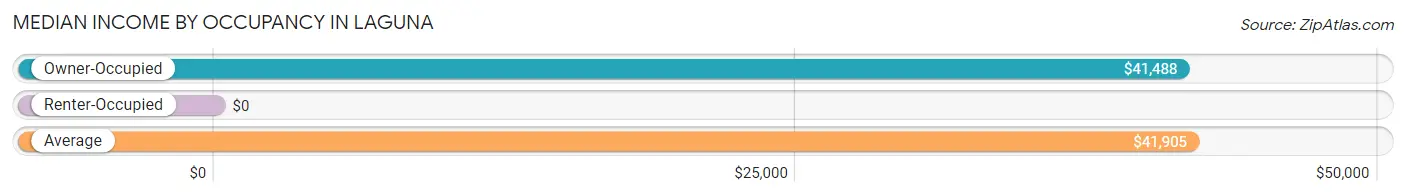
| Occupancy Type | # Households | Median Income |
| Owner-Occupied | 127 (73.0%) | $41,488 |
| Renter-Occupied | 47 (27.0%) | $0 |
| Average | 174 (100.0%) | $41,905 |
Occupancy by Householder Income Bracket in Laguna
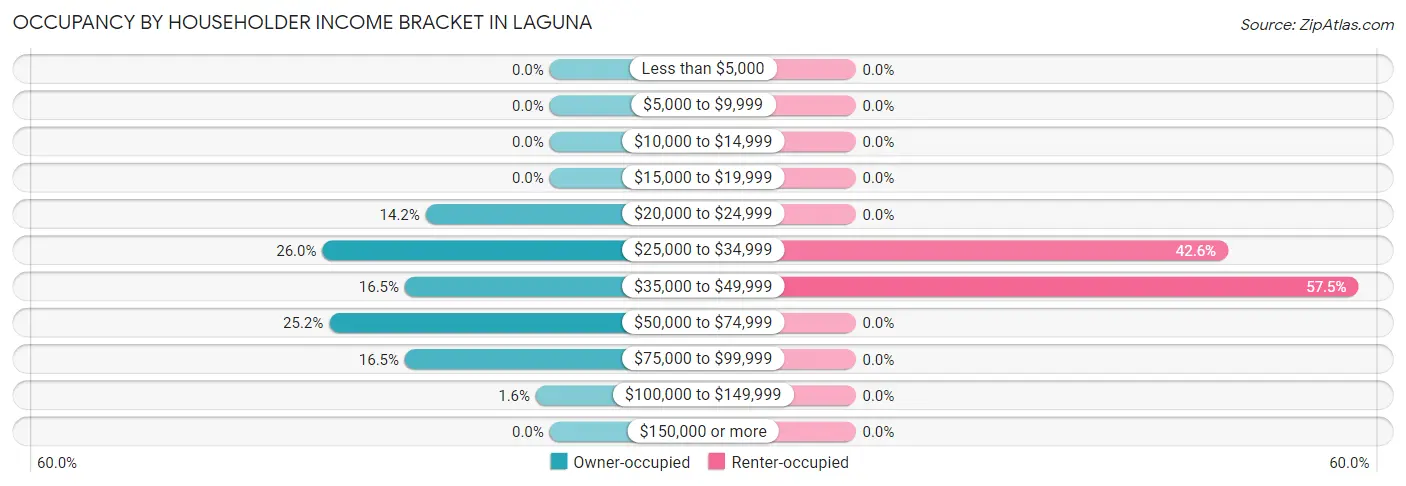
| Income Bracket | Owner-occupied | Renter-occupied |
| Less than $5,000 | 0 (0.0%) | 0 (0.0%) |
| $5,000 to $9,999 | 0 (0.0%) | 0 (0.0%) |
| $10,000 to $14,999 | 0 (0.0%) | 0 (0.0%) |
| $15,000 to $19,999 | 0 (0.0%) | 0 (0.0%) |
| $20,000 to $24,999 | 18 (14.2%) | 0 (0.0%) |
| $25,000 to $34,999 | 33 (26.0%) | 20 (42.5%) |
| $35,000 to $49,999 | 21 (16.5%) | 27 (57.5%) |
| $50,000 to $74,999 | 32 (25.2%) | 0 (0.0%) |
| $75,000 to $99,999 | 21 (16.5%) | 0 (0.0%) |
| $100,000 to $149,999 | 2 (1.6%) | 0 (0.0%) |
| $150,000 or more | 0 (0.0%) | 0 (0.0%) |
| Total | 127 (100.0%) | 47 (100.0%) |
Monthly Housing Cost Tiers in Laguna
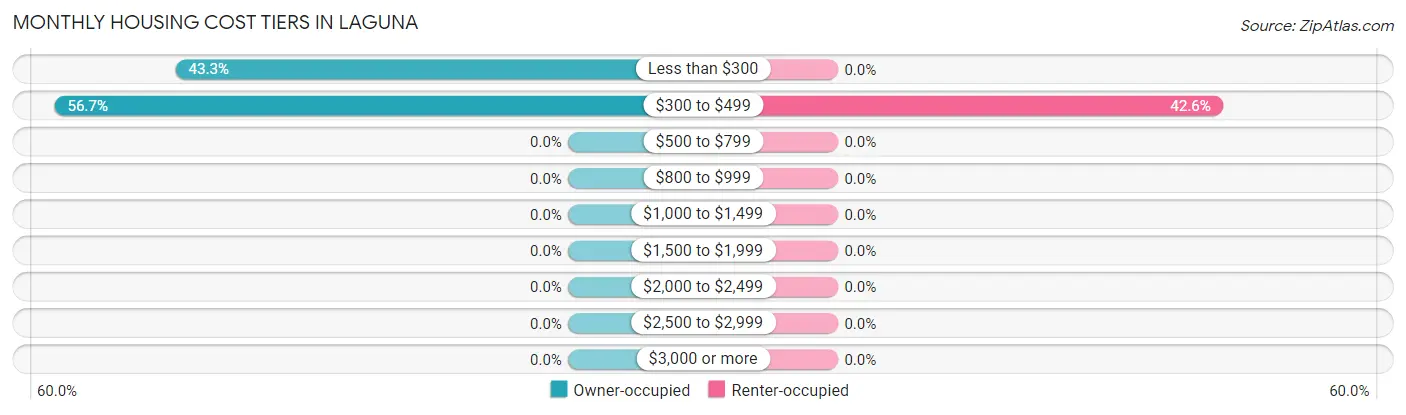
| Monthly Cost | Owner-occupied | Renter-occupied |
| Less than $300 | 55 (43.3%) | 0 (0.0%) |
| $300 to $499 | 72 (56.7%) | 20 (42.5%) |
| $500 to $799 | 0 (0.0%) | 0 (0.0%) |
| $800 to $999 | 0 (0.0%) | 0 (0.0%) |
| $1,000 to $1,499 | 0 (0.0%) | 0 (0.0%) |
| $1,500 to $1,999 | 0 (0.0%) | 0 (0.0%) |
| $2,000 to $2,499 | 0 (0.0%) | 0 (0.0%) |
| $2,500 to $2,999 | 0 (0.0%) | 0 (0.0%) |
| $3,000 or more | 0 (0.0%) | 0 (0.0%) |
| Total | 127 (100.0%) | 47 (100.0%) |
Physical Housing Characteristics in Laguna
Housing Structures in Laguna
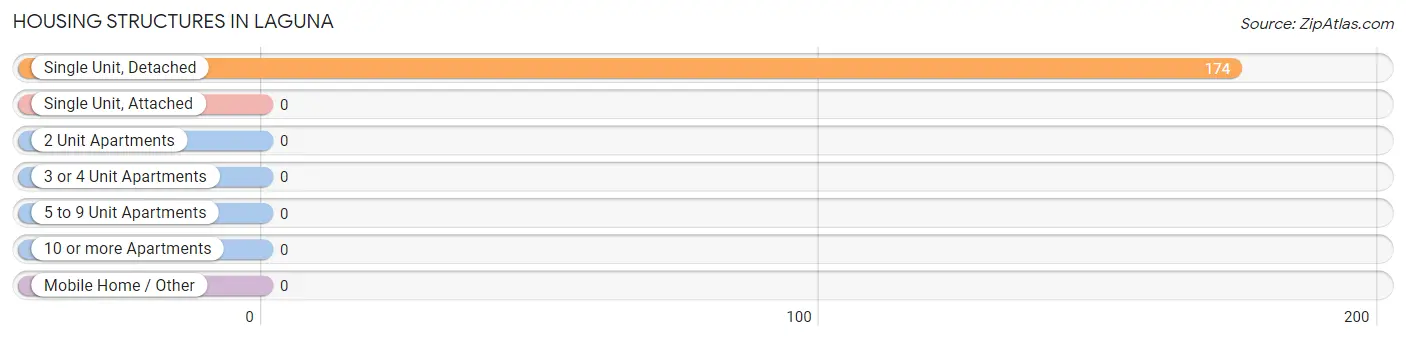
| Structure Type | # Housing Units | % Housing Units |
| Single Unit, Detached | 174 | 100.0% |
| Single Unit, Attached | 0 | 0.0% |
| 2 Unit Apartments | 0 | 0.0% |
| 3 or 4 Unit Apartments | 0 | 0.0% |
| 5 to 9 Unit Apartments | 0 | 0.0% |
| 10 or more Apartments | 0 | 0.0% |
| Mobile Home / Other | 0 | 0.0% |
| Total | 174 | 100.0% |
Housing Structures by Occupancy in Laguna
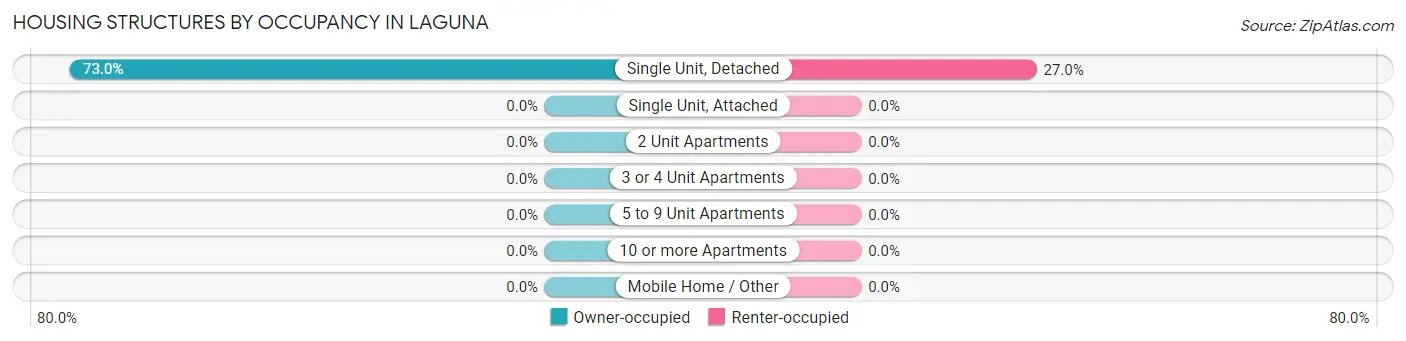
| Structure Type | Owner-occupied | Renter-occupied |
| Single Unit, Detached | 127 (73.0%) | 47 (27.0%) |
| Single Unit, Attached | 0 (0.0%) | 0 (0.0%) |
| 2 Unit Apartments | 0 (0.0%) | 0 (0.0%) |
| 3 or 4 Unit Apartments | 0 (0.0%) | 0 (0.0%) |
| 5 to 9 Unit Apartments | 0 (0.0%) | 0 (0.0%) |
| 10 or more Apartments | 0 (0.0%) | 0 (0.0%) |
| Mobile Home / Other | 0 (0.0%) | 0 (0.0%) |
| Total | 127 (73.0%) | 47 (27.0%) |
Housing Structures by Number of Rooms in Laguna
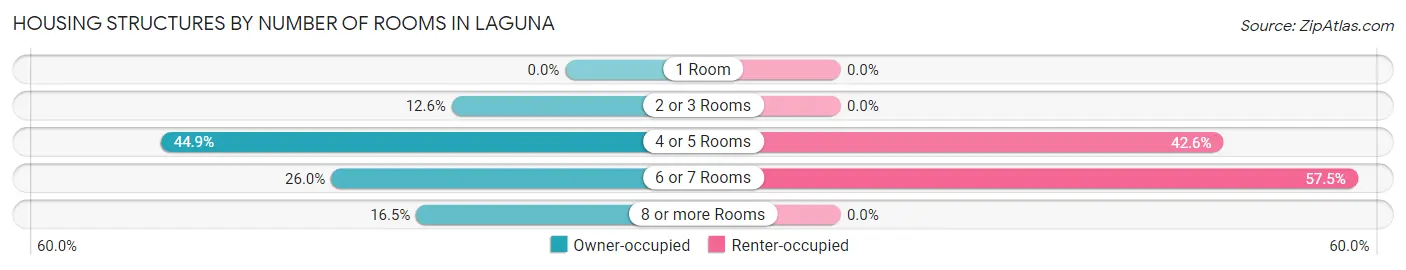
| Number of Rooms | Owner-occupied | Renter-occupied |
| 1 Room | 0 (0.0%) | 0 (0.0%) |
| 2 or 3 Rooms | 16 (12.6%) | 0 (0.0%) |
| 4 or 5 Rooms | 57 (44.9%) | 20 (42.5%) |
| 6 or 7 Rooms | 33 (26.0%) | 27 (57.5%) |
| 8 or more Rooms | 21 (16.5%) | 0 (0.0%) |
| Total | 127 (100.0%) | 47 (100.0%) |
Housing Structure by Heating Type in Laguna
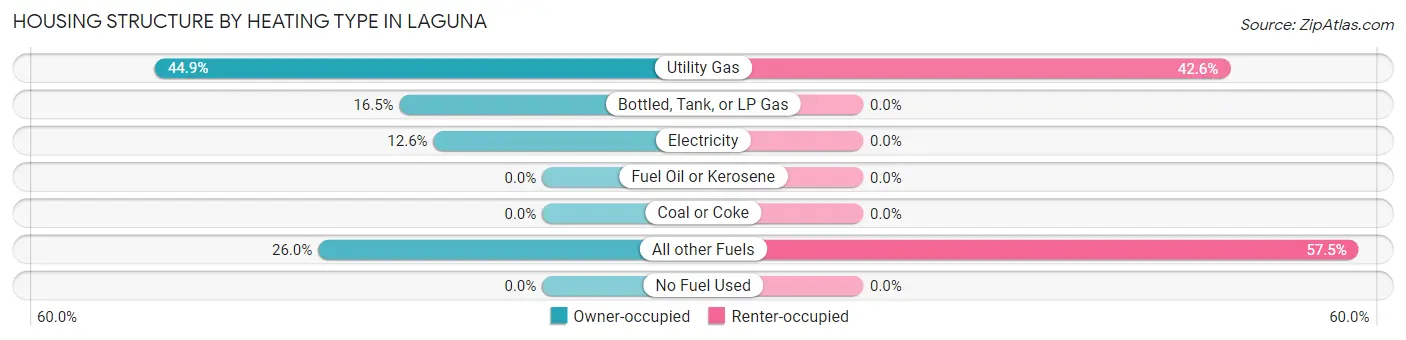
| Heating Type | Owner-occupied | Renter-occupied |
| Utility Gas | 57 (44.9%) | 20 (42.5%) |
| Bottled, Tank, or LP Gas | 21 (16.5%) | 0 (0.0%) |
| Electricity | 16 (12.6%) | 0 (0.0%) |
| Fuel Oil or Kerosene | 0 (0.0%) | 0 (0.0%) |
| Coal or Coke | 0 (0.0%) | 0 (0.0%) |
| All other Fuels | 33 (26.0%) | 27 (57.5%) |
| No Fuel Used | 0 (0.0%) | 0 (0.0%) |
| Total | 127 (100.0%) | 47 (100.0%) |
Household Vehicle Usage in Laguna
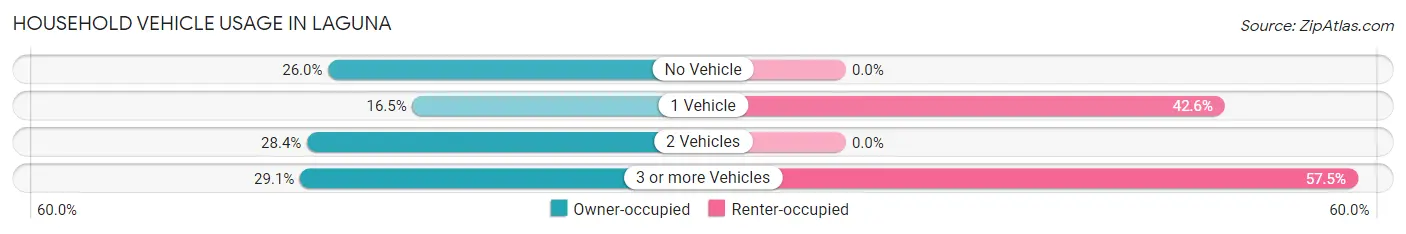
| Vehicles per Household | Owner-occupied | Renter-occupied |
| No Vehicle | 33 (26.0%) | 0 (0.0%) |
| 1 Vehicle | 21 (16.5%) | 20 (42.5%) |
| 2 Vehicles | 36 (28.3%) | 0 (0.0%) |
| 3 or more Vehicles | 37 (29.1%) | 27 (57.5%) |
| Total | 127 (100.0%) | 47 (100.0%) |
Real Estate & Mortgages in Laguna
Real Estate and Mortgage Overview in Laguna
| Characteristic | Without Mortgage | With Mortgage |
| Housing Units | 109 | 18 |
| Median Property Value | - | - |
| Median Household Income | $40,417 | $0 |
| Monthly Housing Costs | $249 | $0 |
| Real Estate Taxes | - | - |
Property Value by Mortgage Status in Laguna
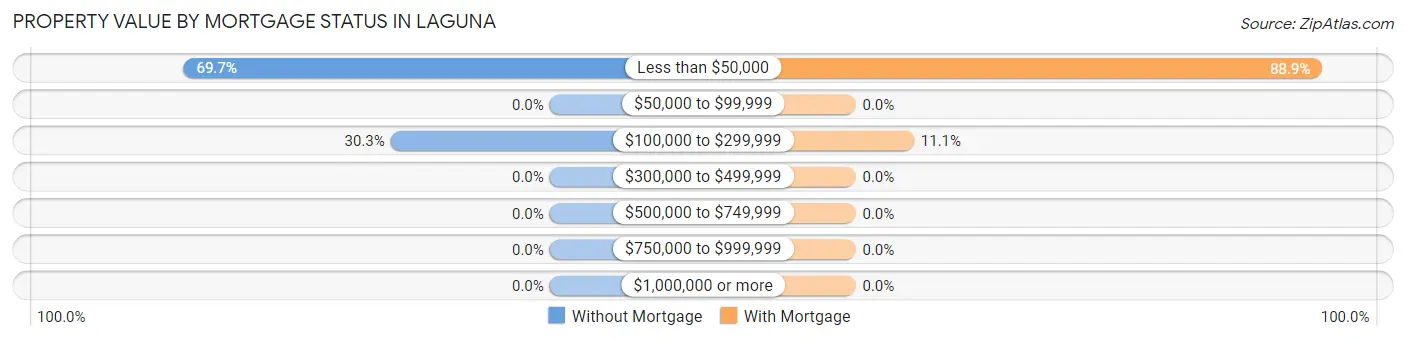
| Property Value | Without Mortgage | With Mortgage |
| Less than $50,000 | 76 (69.7%) | 16 (88.9%) |
| $50,000 to $99,999 | 0 (0.0%) | 0 (0.0%) |
| $100,000 to $299,999 | 33 (30.3%) | 2 (11.1%) |
| $300,000 to $499,999 | 0 (0.0%) | 0 (0.0%) |
| $500,000 to $749,999 | 0 (0.0%) | 0 (0.0%) |
| $750,000 to $999,999 | 0 (0.0%) | 0 (0.0%) |
| $1,000,000 or more | 0 (0.0%) | 0 (0.0%) |
| Total | 109 (100.0%) | 18 (100.0%) |
Household Income by Mortgage Status in Laguna
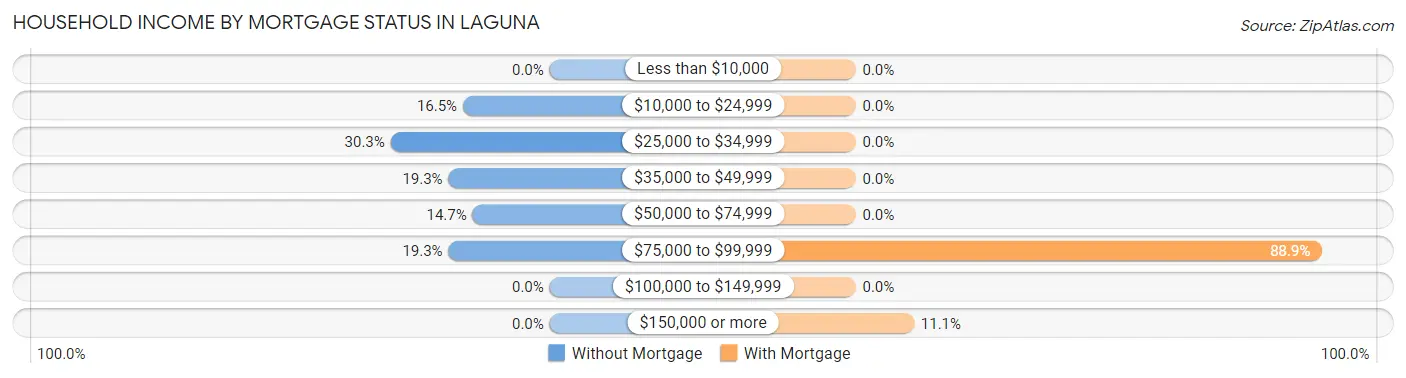
| Household Income | Without Mortgage | With Mortgage |
| Less than $10,000 | 0 (0.0%) | 0 (0.0%) |
| $10,000 to $24,999 | 18 (16.5%) | 0 (0.0%) |
| $25,000 to $34,999 | 33 (30.3%) | 0 (0.0%) |
| $35,000 to $49,999 | 21 (19.3%) | 0 (0.0%) |
| $50,000 to $74,999 | 16 (14.7%) | 0 (0.0%) |
| $75,000 to $99,999 | 21 (19.3%) | 16 (88.9%) |
| $100,000 to $149,999 | 0 (0.0%) | 0 (0.0%) |
| $150,000 or more | 0 (0.0%) | 2 (11.1%) |
| Total | 109 (100.0%) | 18 (100.0%) |
Property Value to Household Income Ratio in Laguna
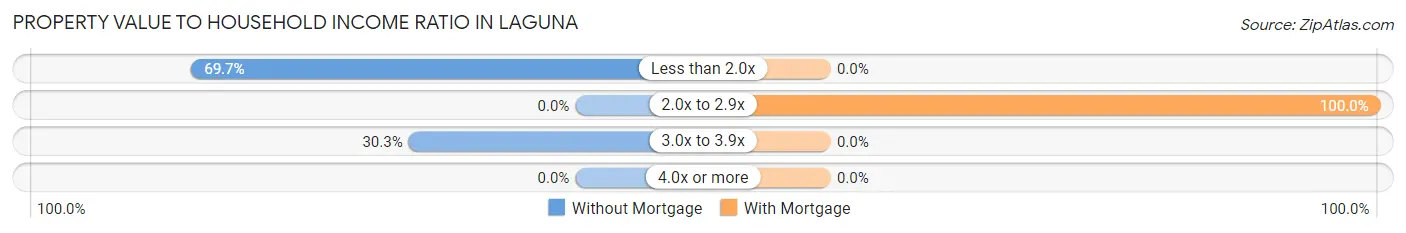
| Value-to-Income Ratio | Without Mortgage | With Mortgage |
| Less than 2.0x | 76 (69.7%) | 0 (0.0%) |
| 2.0x to 2.9x | 0 (0.0%) | 18 (100.0%) |
| 3.0x to 3.9x | 33 (30.3%) | 0 (0.0%) |
| 4.0x or more | 0 (0.0%) | 0 (0.0%) |
| Total | 109 (100.0%) | 18 (100.0%) |
Real Estate Taxes by Mortgage Status in Laguna
| Property Taxes | Without Mortgage | With Mortgage |
| Less than $800 | 0 (0.0%) | 0 (0.0%) |
| $800 to $1,499 | 0 (0.0%) | 0 (0.0%) |
| $800 to $1,499 | 0 (0.0%) | 0 (0.0%) |
| Total | 109 (100.0%) | 18 (100.0%) |
Health & Disability in Laguna
Health Insurance Coverage by Age in Laguna
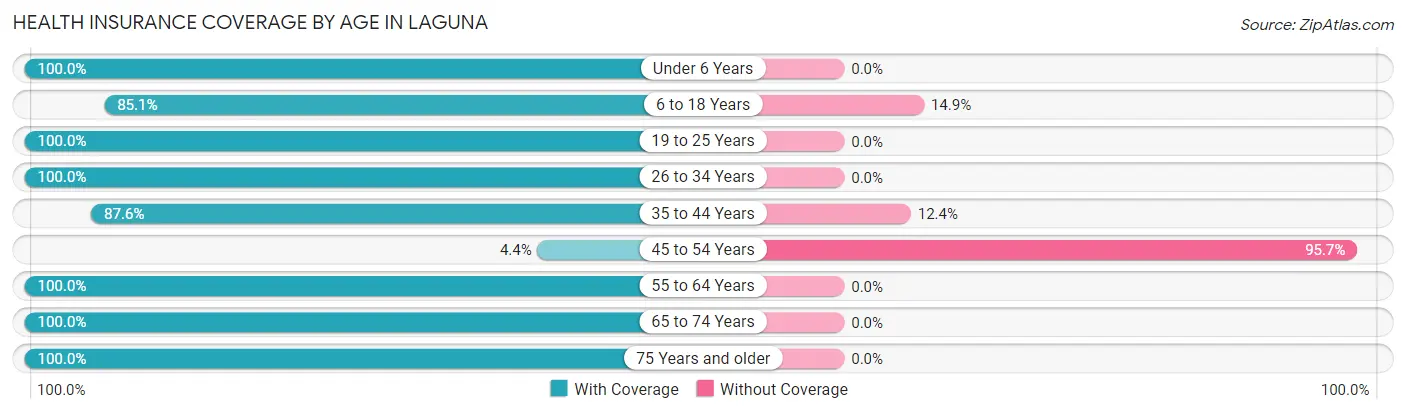
| Age Bracket | With Coverage | Without Coverage |
| Under 6 Years | 24 (100.0%) | 0 (0.0%) |
| 6 to 18 Years | 149 (85.1%) | 26 (14.9%) |
| 19 to 25 Years | 5 (100.0%) | 0 (0.0%) |
| 26 to 34 Years | 60 (100.0%) | 0 (0.0%) |
| 35 to 44 Years | 113 (87.6%) | 16 (12.4%) |
| 45 to 54 Years | 2 (4.3%) | 44 (95.7%) |
| 55 to 64 Years | 55 (100.0%) | 0 (0.0%) |
| 65 to 74 Years | 115 (100.0%) | 0 (0.0%) |
| 75 Years and older | 33 (100.0%) | 0 (0.0%) |
| Total | 556 (86.6%) | 86 (13.4%) |
Health Insurance Coverage by Citizenship Status in Laguna
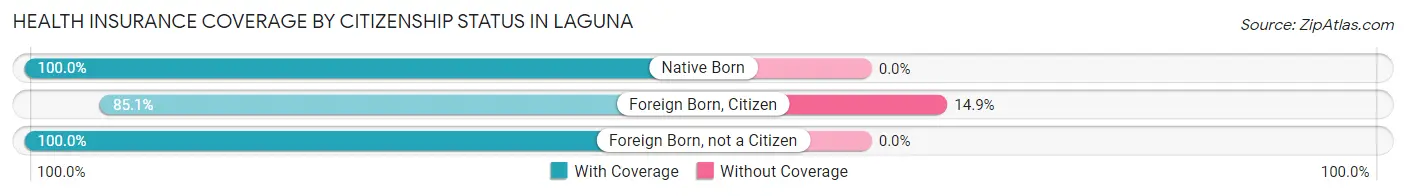
| Citizenship Status | With Coverage | Without Coverage |
| Native Born | 24 (100.0%) | 0 (0.0%) |
| Foreign Born, Citizen | 149 (85.1%) | 26 (14.9%) |
| Foreign Born, not a Citizen | 5 (100.0%) | 0 (0.0%) |
Health Insurance Coverage by Household Income in Laguna
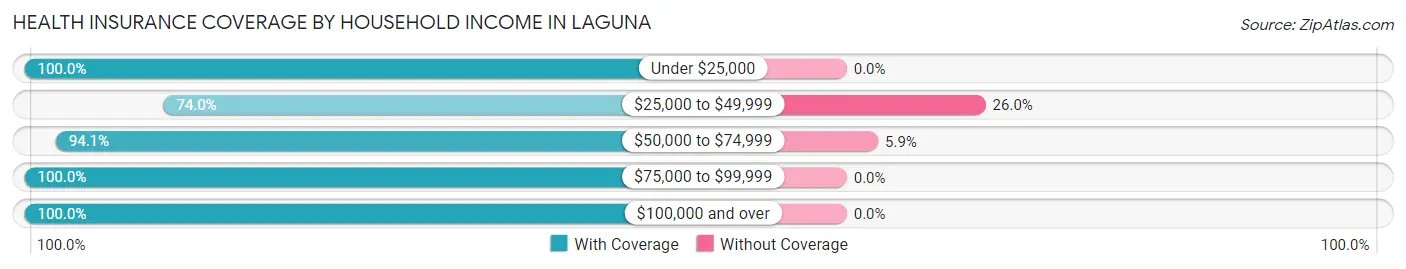
| Household Income | With Coverage | Without Coverage |
| Under $25,000 | 37 (100.0%) | 0 (0.0%) |
| $25,000 to $49,999 | 199 (74.0%) | 70 (26.0%) |
| $50,000 to $74,999 | 257 (94.1%) | 16 (5.9%) |
| $75,000 to $99,999 | 55 (100.0%) | 0 (0.0%) |
| $100,000 and over | 5 (100.0%) | 0 (0.0%) |
Public vs Private Health Insurance Coverage by Age in Laguna
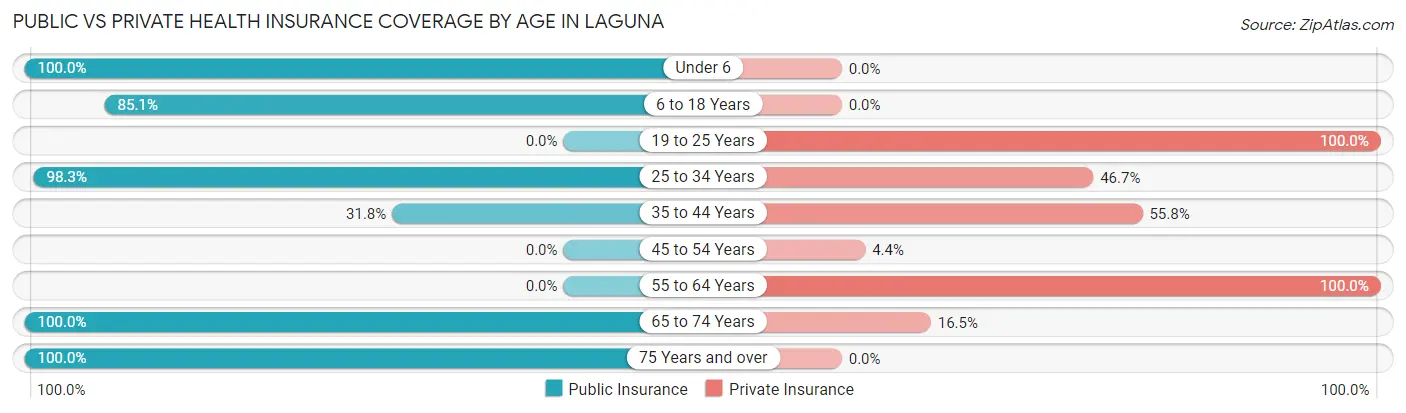
| Age Bracket | Public Insurance | Private Insurance |
| Under 6 | 24 (100.0%) | 0 (0.0%) |
| 6 to 18 Years | 149 (85.1%) | 0 (0.0%) |
| 19 to 25 Years | 0 (0.0%) | 5 (100.0%) |
| 25 to 34 Years | 59 (98.3%) | 28 (46.7%) |
| 35 to 44 Years | 41 (31.8%) | 72 (55.8%) |
| 45 to 54 Years | 0 (0.0%) | 2 (4.3%) |
| 55 to 64 Years | 0 (0.0%) | 55 (100.0%) |
| 65 to 74 Years | 115 (100.0%) | 19 (16.5%) |
| 75 Years and over | 33 (100.0%) | 0 (0.0%) |
| Total | 421 (65.6%) | 181 (28.2%) |
Disability Status by Sex by Age in Laguna
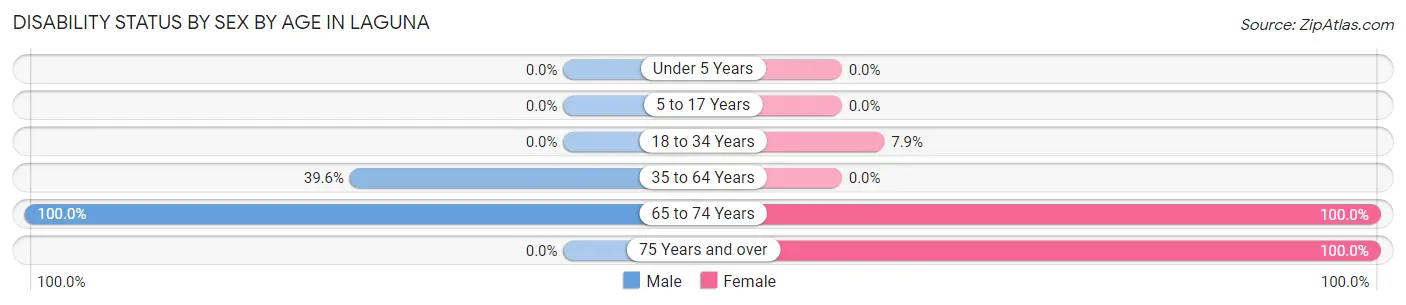
| Age Bracket | Male | Female |
| Under 5 Years | 0 (0.0%) | 0 (0.0%) |
| 5 to 17 Years | 0 (0.0%) | 0 (0.0%) |
| 18 to 34 Years | 0 (0.0%) | 3 (7.9%) |
| 35 to 64 Years | 44 (39.6%) | 0 (0.0%) |
| 65 to 74 Years | 55 (100.0%) | 60 (100.0%) |
| 75 Years and over | 0 (0.0%) | 33 (100.0%) |
Disability Class by Sex by Age in Laguna
Disability Class: Hearing Difficulty
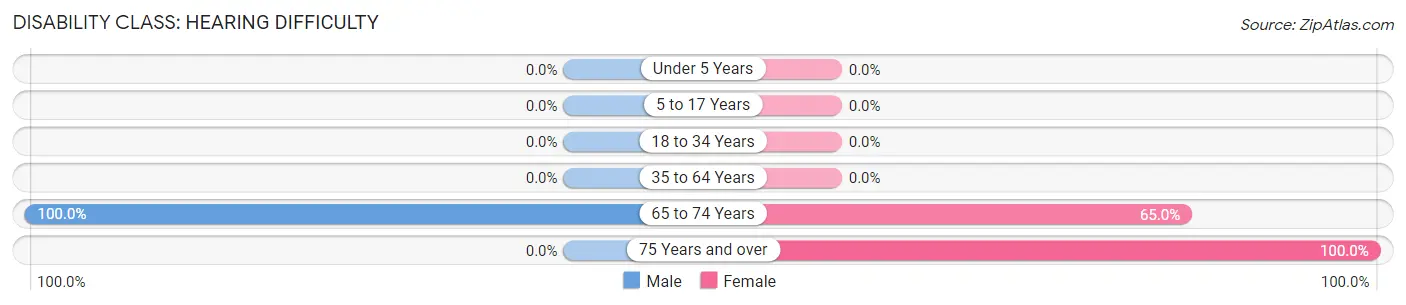
| Age Bracket | Male | Female |
| Under 5 Years | 0 (0.0%) | 0 (0.0%) |
| 5 to 17 Years | 0 (0.0%) | 0 (0.0%) |
| 18 to 34 Years | 0 (0.0%) | 0 (0.0%) |
| 35 to 64 Years | 0 (0.0%) | 0 (0.0%) |
| 65 to 74 Years | 55 (100.0%) | 39 (65.0%) |
| 75 Years and over | 0 (0.0%) | 33 (100.0%) |
Disability Class: Vision Difficulty
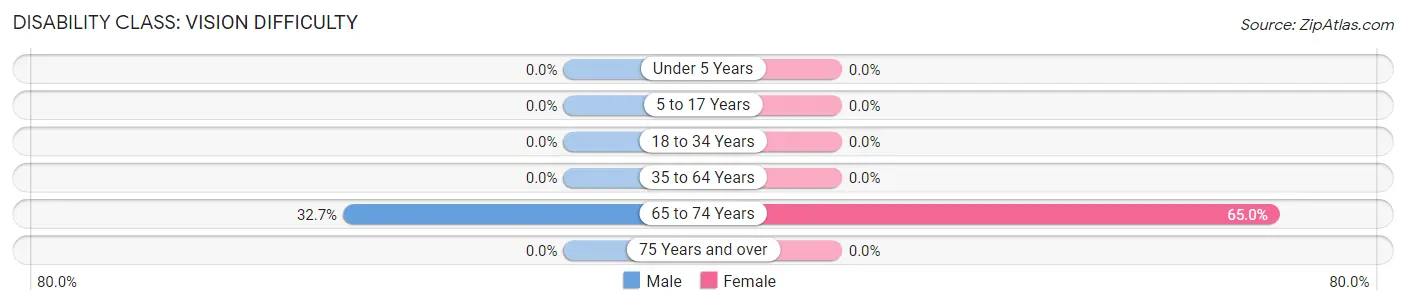
| Age Bracket | Male | Female |
| Under 5 Years | 0 (0.0%) | 0 (0.0%) |
| 5 to 17 Years | 0 (0.0%) | 0 (0.0%) |
| 18 to 34 Years | 0 (0.0%) | 0 (0.0%) |
| 35 to 64 Years | 0 (0.0%) | 0 (0.0%) |
| 65 to 74 Years | 18 (32.7%) | 39 (65.0%) |
| 75 Years and over | 0 (0.0%) | 0 (0.0%) |
Disability Class: Cognitive Difficulty
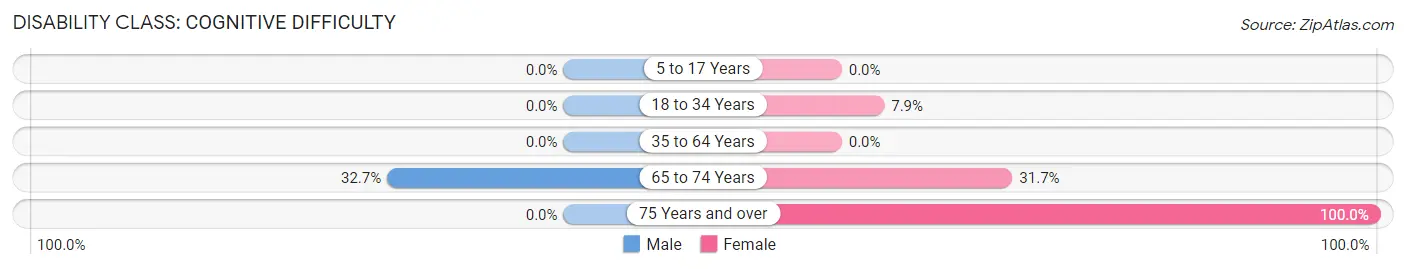
| Age Bracket | Male | Female |
| 5 to 17 Years | 0 (0.0%) | 0 (0.0%) |
| 18 to 34 Years | 0 (0.0%) | 3 (7.9%) |
| 35 to 64 Years | 0 (0.0%) | 0 (0.0%) |
| 65 to 74 Years | 18 (32.7%) | 19 (31.7%) |
| 75 Years and over | 0 (0.0%) | 33 (100.0%) |
Disability Class: Ambulatory Difficulty
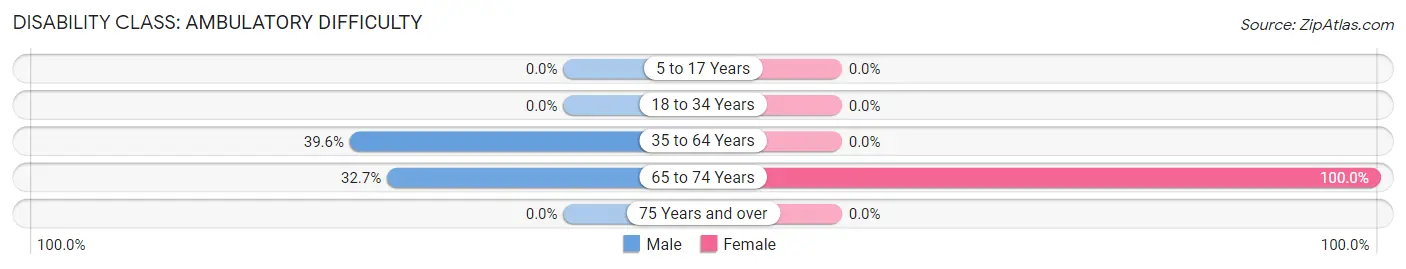
| Age Bracket | Male | Female |
| 5 to 17 Years | 0 (0.0%) | 0 (0.0%) |
| 18 to 34 Years | 0 (0.0%) | 0 (0.0%) |
| 35 to 64 Years | 44 (39.6%) | 0 (0.0%) |
| 65 to 74 Years | 18 (32.7%) | 60 (100.0%) |
| 75 Years and over | 0 (0.0%) | 0 (0.0%) |
Disability Class: Self-Care Difficulty
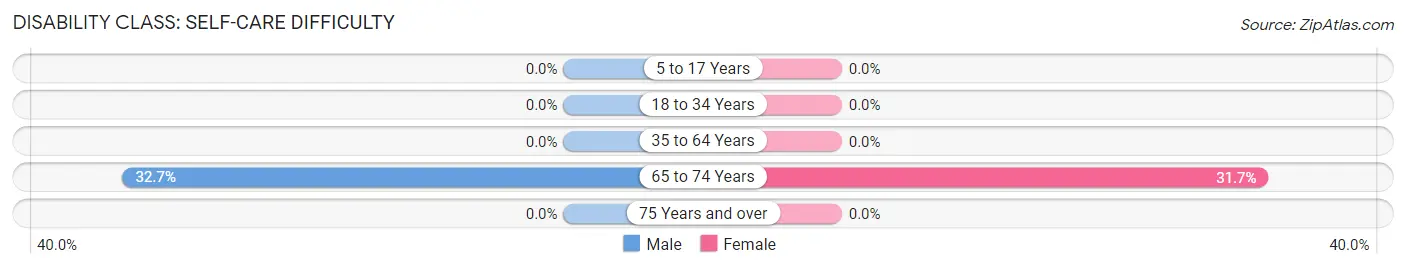
| Age Bracket | Male | Female |
| 5 to 17 Years | 0 (0.0%) | 0 (0.0%) |
| 18 to 34 Years | 0 (0.0%) | 0 (0.0%) |
| 35 to 64 Years | 0 (0.0%) | 0 (0.0%) |
| 65 to 74 Years | 18 (32.7%) | 19 (31.7%) |
| 75 Years and over | 0 (0.0%) | 0 (0.0%) |
Technology Access in Laguna
Computing Device Access in Laguna
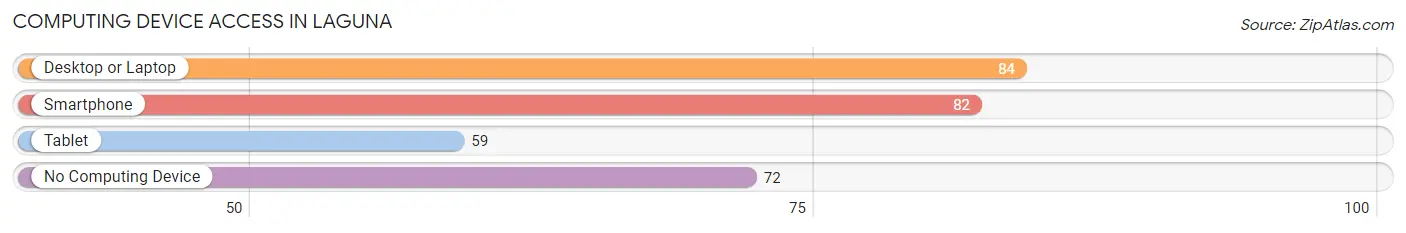
| Device Type | # Households | % Households |
| Desktop or Laptop | 84 | 48.3% |
| Smartphone | 82 | 47.1% |
| Tablet | 59 | 33.9% |
| No Computing Device | 72 | 41.4% |
| Total | 174 | 100.0% |
Internet Access in Laguna
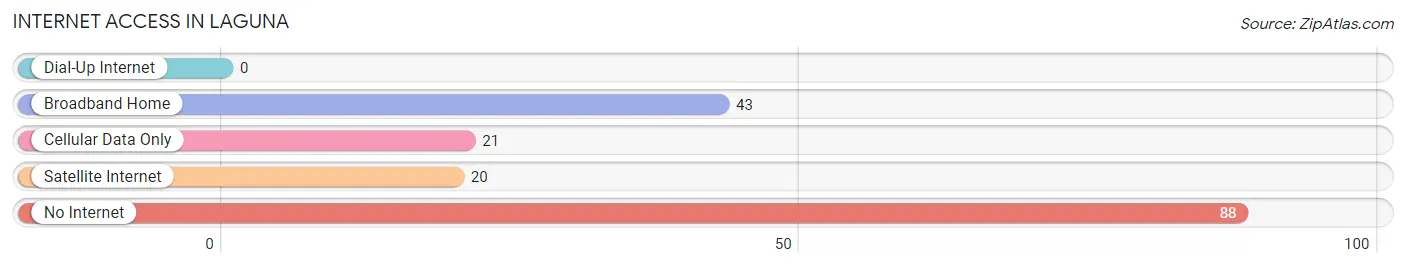
| Internet Type | # Households | % Households |
| Dial-Up Internet | 0 | 0.0% |
| Broadband Home | 43 | 24.7% |
| Cellular Data Only | 21 | 12.1% |
| Satellite Internet | 20 | 11.5% |
| No Internet | 88 | 50.6% |
| Total | 174 | 100.0% |
Laguna Summary
Laguna, New Mexico is a small town located in the western part of the state, about 40 miles west of Albuquerque. It is part of the Cibola County and is home to about 1,000 people. The town is located in the Laguna Indian Reservation, which is home to the Pueblo of Laguna, a federally recognized tribe.
Geography
Laguna is located in the western part of New Mexico, about 40 miles west of Albuquerque. It is part of the Cibola County and is home to about 1,000 people. The town is located in the Laguna Indian Reservation, which is home to the Pueblo of Laguna, a federally recognized tribe. The town is situated in the Rio Puerco Valley, which is surrounded by the Sandia Mountains to the east and the Manzano Mountains to the west. The town is located at an elevation of 5,400 feet and has a semi-arid climate with hot summers and cold winters.
History
The Pueblo of Laguna has been inhabited for centuries by the Pueblo people. The Pueblo of Laguna was established in 1699 and is one of the oldest continuously inhabited communities in the United States. The town of Laguna was founded in 1876 and was originally called San Jose de la Laguna. The town was established as a trading post for the Pueblo people and was a major stop on the Santa Fe Trail. The town was incorporated in 1901 and has remained relatively unchanged since then.
Economy
The economy of Laguna is largely based on tourism and agriculture. The town is home to several tourist attractions, including the Laguna Pueblo Cultural Center, the Laguna Mission Church, and the Laguna Speedway. The town is also home to several agricultural businesses, including a dairy farm, a winery, and a pecan farm. The town is also home to several small businesses, including restaurants, shops, and a hotel.
Demographics
As of the 2010 census, the population of Laguna was 1,037. The racial makeup of the town was 94.3% Native American, 2.2% White, 0.3% African American, 0.2% Asian, 0.1% Pacific Islander, and 2.9% from other races. The median household income was $20,972 and the median family income was $25,000. The per capita income was $10,972. The town has a poverty rate of 33.3%.
Conclusion
Laguna, New Mexico is a small town located in the western part of the state, about 40 miles west of Albuquerque. It is part of the Cibola County and is home to about 1,000 people. The town is located in the Laguna Indian Reservation, which is home to the Pueblo of Laguna, a federally recognized tribe. The town has a long history and is home to several tourist attractions and agricultural businesses. The population of Laguna is largely Native American and the median household income is $20,972.
Common Questions
What is Per Capita Income in Laguna?
Per Capita income in Laguna is $16,368.
What is the Median Family Income in Laguna?
Median Family Income in Laguna is $47,037.
What is the Median Household income in Laguna?
Median Household Income in Laguna is $41,905.
What is Inequality or Gini Index in Laguna?
Inequality or Gini Index in Laguna is 0.25.
What is the Total Population of Laguna?
Total Population of Laguna is 655.
What is the Total Male Population of Laguna?
Total Male Population of Laguna is 254.
What is the Total Female Population of Laguna?
Total Female Population of Laguna is 401.
What is the Ratio of Males per 100 Females in Laguna?
There are 63.34 Males per 100 Females in Laguna.
What is the Ratio of Females per 100 Males in Laguna?
There are 157.87 Females per 100 Males in Laguna.
What is the Median Population Age in Laguna?
Median Population Age in Laguna is 43.7 Years.
What is the Average Family Size in Laguna
Average Family Size in Laguna is 4.9 People.
What is the Average Household Size in Laguna
Average Household Size in Laguna is 3.7 People.
How Large is the Labor Force in Laguna?
There are 212 People in the Labor Forcein in Laguna.
What is the Percentage of People in the Labor Force in Laguna?
44.0% of People are in the Labor Force in Laguna.
What is the Unemployment Rate in Laguna?
Unemployment Rate in Laguna is 13.7%.