San Jose CDP Rio Arriba County, NM Map & Demographics
San Jose CDP Rio Arriba County Overview
$27,580
PER CAPITA INCOME
$85,625
AVG FAMILY INCOME
$54,107
AVG HOUSEHOLD INCOME
34.4%
WAGE / INCOME GAP [ % ]
65.6¢/ $1
WAGE / INCOME GAP [ $ ]
0.50
INEQUALITY / GINI INDEX
845
TOTAL POPULATION
532
MALE POPULATION
313
FEMALE POPULATION
169.97
MALES / 100 FEMALES
58.83
FEMALES / 100 MALES
35.6
MEDIAN AGE
4.7
AVG FAMILY SIZE
3.4
AVG HOUSEHOLD SIZE
353
LABOR FORCE [ PEOPLE ]
52.1%
PERCENT IN LABOR FORCE
7.4%
UNEMPLOYMENT RATE
Income in San Jose CDP Rio Arriba County
Income Overview in San Jose CDP Rio Arriba County
Per Capita Income in San Jose CDP Rio Arriba County is $27,580, while median incomes of families and households are $85,625 and $54,107 respectively.
| Characteristic | Number | Measure |
| Per Capita Income | 845 | $27,580 |
| Median Family Income | 148 | $85,625 |
| Mean Family Income | 148 | $99,672 |
| Median Household Income | 252 | $54,107 |
| Mean Household Income | 252 | $73,960 |
| Income Deficit | 148 | $0 |
| Wage / Income Gap (%) | 845 | 34.42% |
| Wage / Income Gap ($) | 845 | 65.58¢ per $1 |
| Gini / Inequality Index | 845 | 0.50 |
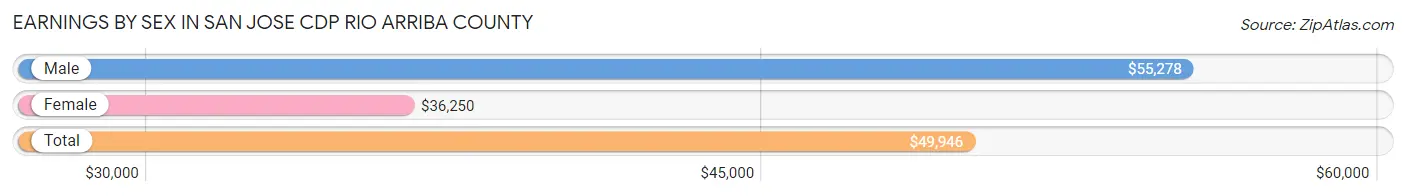
Earnings by Sex in San Jose CDP Rio Arriba County
Average Earnings in San Jose CDP Rio Arriba County are $49,946, $55,278 for men and $36,250 for women, a difference of 34.4%.
| Sex | Number | Average Earnings |
| Male | 240 (68.4%) | $55,278 |
| Female | 111 (31.6%) | $36,250 |
| Total | 351 (100.0%) | $49,946 |
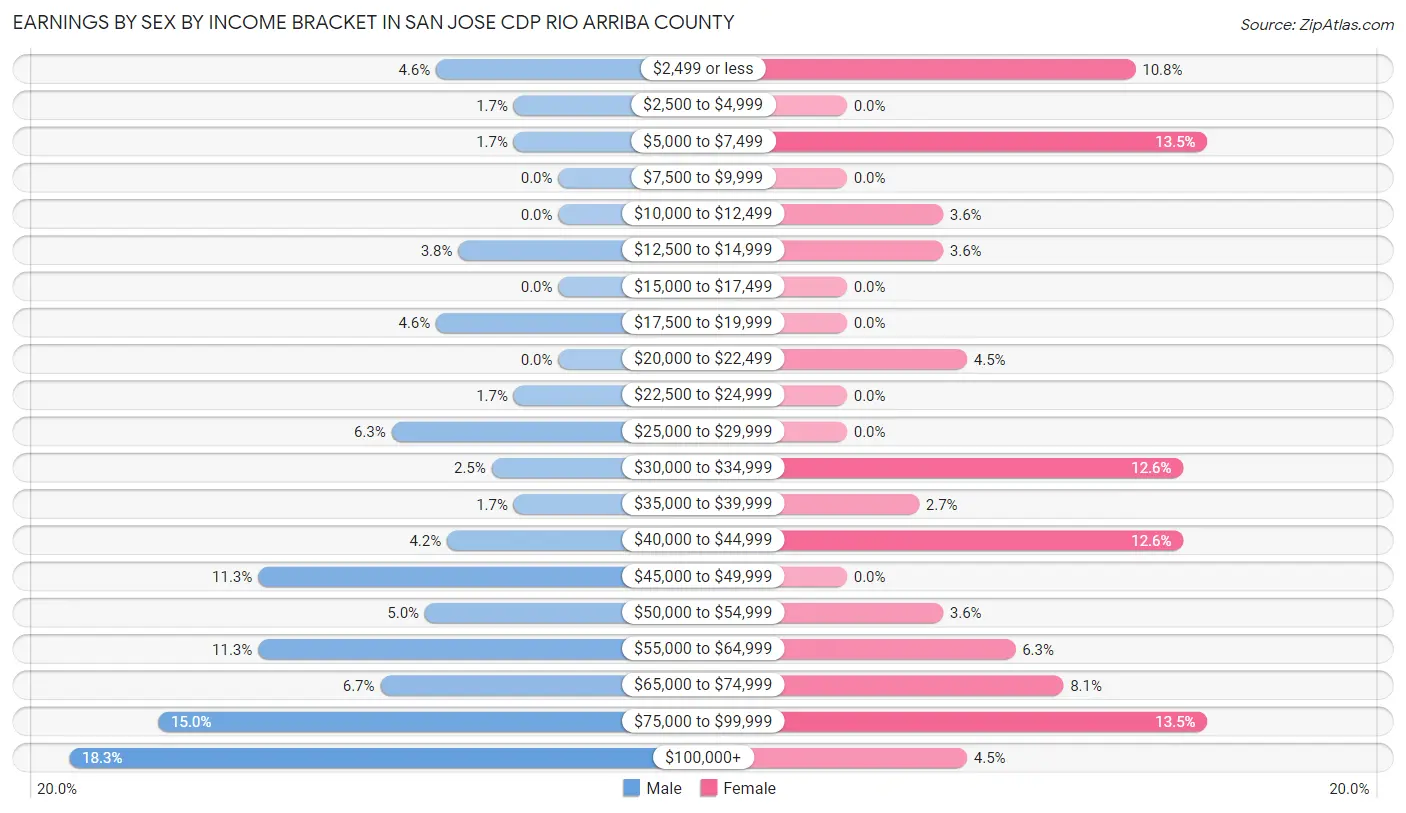
Earnings by Sex by Income Bracket in San Jose CDP Rio Arriba County
The most common earnings brackets in San Jose CDP Rio Arriba County are $100,000+ for men (44 | 18.3%) and $5,000 to $7,499 for women (15 | 13.5%).
| Income | Male | Female |
| $2,499 or less | 11 (4.6%) | 12 (10.8%) |
| $2,500 to $4,999 | 4 (1.7%) | 0 (0.0%) |
| $5,000 to $7,499 | 4 (1.7%) | 15 (13.5%) |
| $7,500 to $9,999 | 0 (0.0%) | 0 (0.0%) |
| $10,000 to $12,499 | 0 (0.0%) | 4 (3.6%) |
| $12,500 to $14,999 | 9 (3.7%) | 4 (3.6%) |
| $15,000 to $17,499 | 0 (0.0%) | 0 (0.0%) |
| $17,500 to $19,999 | 11 (4.6%) | 0 (0.0%) |
| $20,000 to $22,499 | 0 (0.0%) | 5 (4.5%) |
| $22,500 to $24,999 | 4 (1.7%) | 0 (0.0%) |
| $25,000 to $29,999 | 15 (6.2%) | 0 (0.0%) |
| $30,000 to $34,999 | 6 (2.5%) | 14 (12.6%) |
| $35,000 to $39,999 | 4 (1.7%) | 3 (2.7%) |
| $40,000 to $44,999 | 10 (4.2%) | 14 (12.6%) |
| $45,000 to $49,999 | 27 (11.3%) | 0 (0.0%) |
| $50,000 to $54,999 | 12 (5.0%) | 4 (3.6%) |
| $55,000 to $64,999 | 27 (11.3%) | 7 (6.3%) |
| $65,000 to $74,999 | 16 (6.7%) | 9 (8.1%) |
| $75,000 to $99,999 | 36 (15.0%) | 15 (13.5%) |
| $100,000+ | 44 (18.3%) | 5 (4.5%) |
| Total | 240 (100.0%) | 111 (100.0%) |
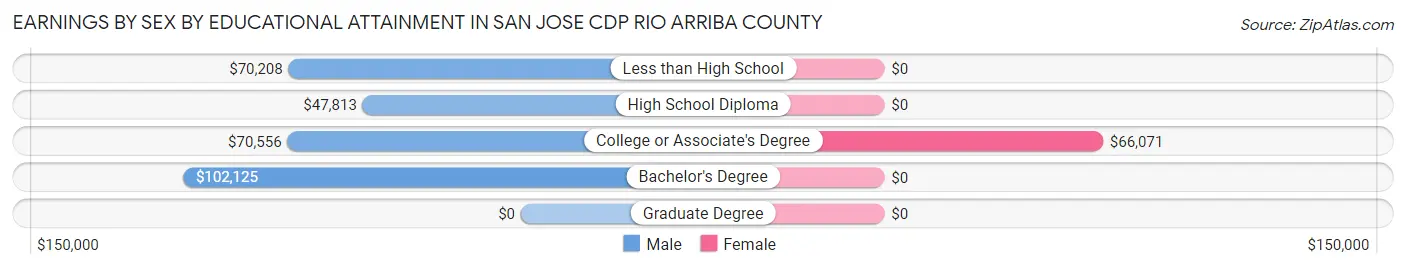
Earnings by Sex by Educational Attainment in San Jose CDP Rio Arriba County
Average earnings in San Jose CDP Rio Arriba County are $56,389 for men and $43,194 for women, a difference of 23.4%. Men with an educational attainment of bachelor's degree enjoy the highest average annual earnings of $102,125, while those with high school diploma education earn the least with $47,813. Women with an educational attainment of college or associate's degree earn the most with the average annual earnings of $66,071, while those with college or associate's degree education have the smallest earnings of $66,071.
| Educational Attainment | Male Income | Female Income |
| Less than High School | $70,208 | $0 |
| High School Diploma | $47,813 | $0 |
| College or Associate's Degree | $70,556 | $66,071 |
| Bachelor's Degree | $102,125 | $0 |
| Graduate Degree | - | - |
| Total | $56,389 | $43,194 |
Family Income in San Jose CDP Rio Arriba County
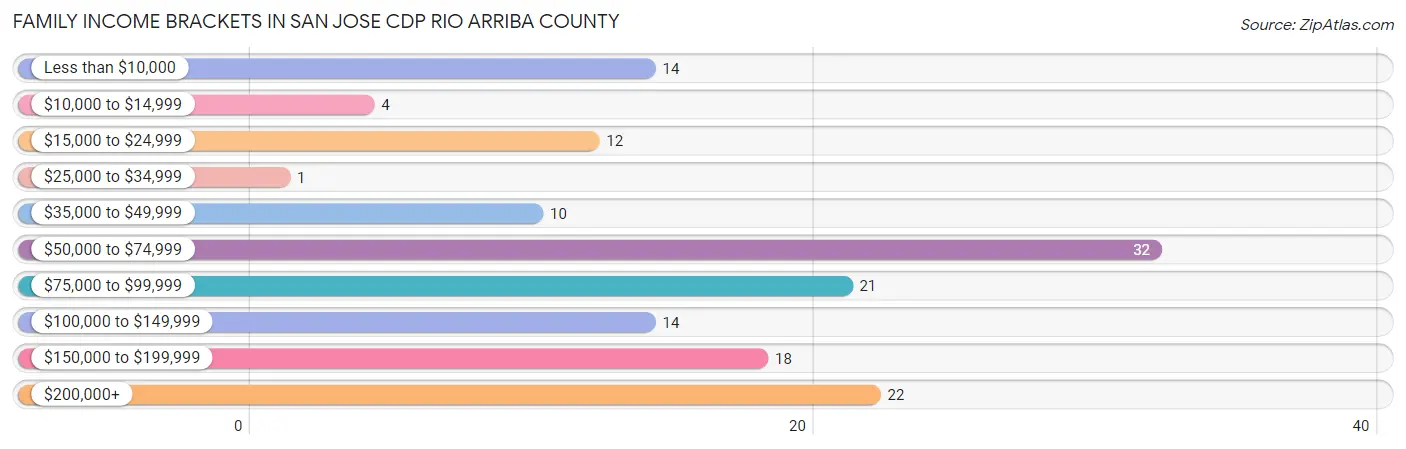
Family Income Brackets in San Jose CDP Rio Arriba County
According to the San Jose CDP Rio Arriba County family income data, there are 32 families falling into the $50,000 to $74,999 income range, which is the most common income bracket and makes up 21.6% of all families. Conversely, the $25,000 to $34,999 income bracket is the least frequent group with only 1 families (0.7%) belonging to this category.
| Income Bracket | # Families | % Families |
| Less than $10,000 | 14 | 9.5% |
| $10,000 to $14,999 | 4 | 2.7% |
| $15,000 to $24,999 | 12 | 8.1% |
| $25,000 to $34,999 | 1 | 0.7% |
| $35,000 to $49,999 | 10 | 6.8% |
| $50,000 to $74,999 | 32 | 21.6% |
| $75,000 to $99,999 | 21 | 14.2% |
| $100,000 to $149,999 | 14 | 9.5% |
| $150,000 to $199,999 | 18 | 12.2% |
| $200,000+ | 22 | 14.9% |
Family Income by Famaliy Size in San Jose CDP Rio Arriba County
4-person families (8 | 5.4%) account for the highest median family income in San Jose CDP Rio Arriba County with $150,000 per family, while 4-person families (8 | 5.4%) have the highest median income of $37,500 per family member.
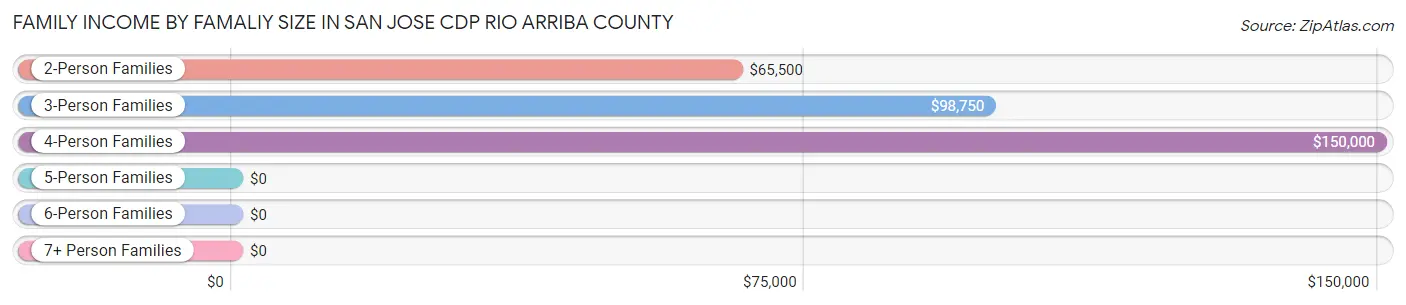
| Income Bracket | # Families | Median Income |
| 2-Person Families | 74 (50.0%) | $65,500 |
| 3-Person Families | 46 (31.1%) | $98,750 |
| 4-Person Families | 8 (5.4%) | $150,000 |
| 5-Person Families | 3 (2.0%) | $0 |
| 6-Person Families | 12 (8.1%) | $0 |
| 7+ Person Families | 5 (3.4%) | $0 |
| Total | 148 (100.0%) | $85,625 |
Family Income by Number of Earners in San Jose CDP Rio Arriba County
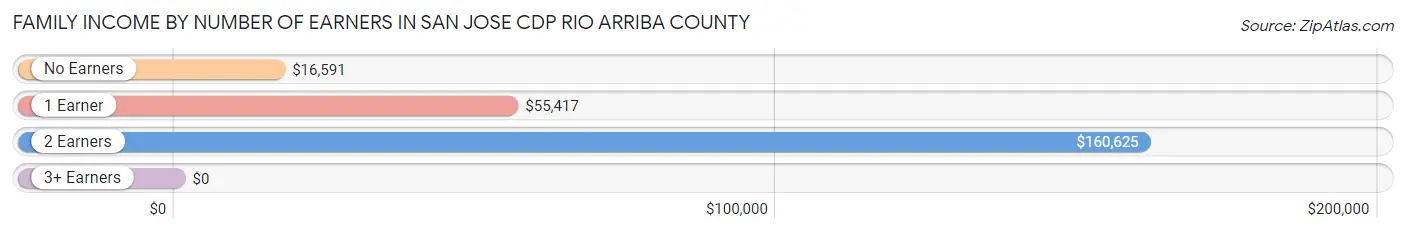
| Number of Earners | # Families | Median Income |
| No Earners | 30 (20.3%) | $16,591 |
| 1 Earner | 48 (32.4%) | $55,417 |
| 2 Earners | 62 (41.9%) | $160,625 |
| 3+ Earners | 8 (5.4%) | $0 |
| Total | 148 (100.0%) | $85,625 |
Household Income in San Jose CDP Rio Arriba County
Household Income Brackets in San Jose CDP Rio Arriba County
With 50 households falling in the category, the $50,000 to $74,999 income range is the most frequent in San Jose CDP Rio Arriba County, accounting for 19.8% of all households. In contrast, only 7 households (2.8%) fall into the $25,000 to $34,999 income bracket, making it the least populous group.
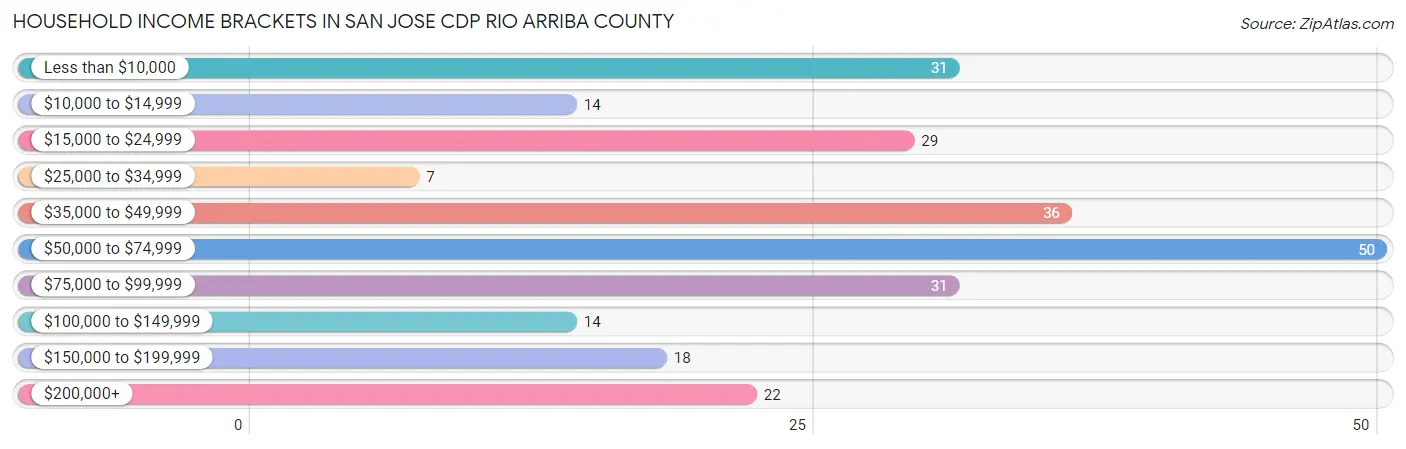
| Income Bracket | # Households | % Households |
| Less than $10,000 | 31 | 12.3% |
| $10,000 to $14,999 | 14 | 5.6% |
| $15,000 to $24,999 | 29 | 11.5% |
| $25,000 to $34,999 | 7 | 2.8% |
| $35,000 to $49,999 | 36 | 14.3% |
| $50,000 to $74,999 | 50 | 19.8% |
| $75,000 to $99,999 | 31 | 12.3% |
| $100,000 to $149,999 | 14 | 5.6% |
| $150,000 to $199,999 | 18 | 7.1% |
| $200,000+ | 22 | 8.7% |
Household Income by Householder Age in San Jose CDP Rio Arriba County
The median household income in San Jose CDP Rio Arriba County is $54,107, with the highest median household income of $90,089 found in the 25 to 44 years age bracket for the primary householder. A total of 51 households (20.2%) fall into this category. Meanwhile, the 15 to 24 years age bracket for the primary householder has the lowest median household income of $0, with 3 households (1.2%) in this group.
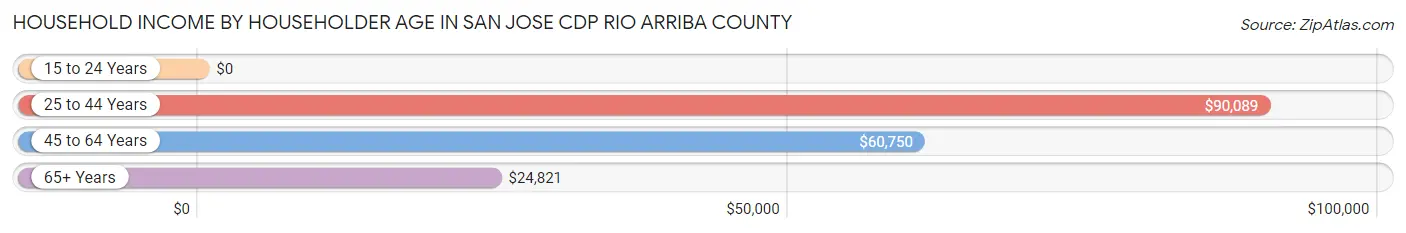
| Income Bracket | # Households | Median Income |
| 15 to 24 Years | 3 (1.2%) | $0 |
| 25 to 44 Years | 51 (20.2%) | $90,089 |
| 45 to 64 Years | 123 (48.8%) | $60,750 |
| 65+ Years | 75 (29.8%) | $24,821 |
| Total | 252 (100.0%) | $54,107 |
Poverty in San Jose CDP Rio Arriba County
Income Below Poverty by Sex and Age in San Jose CDP Rio Arriba County
With 22.1% poverty level for males and 48.6% for females among the residents of San Jose CDP Rio Arriba County, 5 year old males and 12 to 14 year old females are the most vulnerable to poverty, with 13 males (100.0%) and 20 females (100.0%) in their respective age groups living below the poverty level.
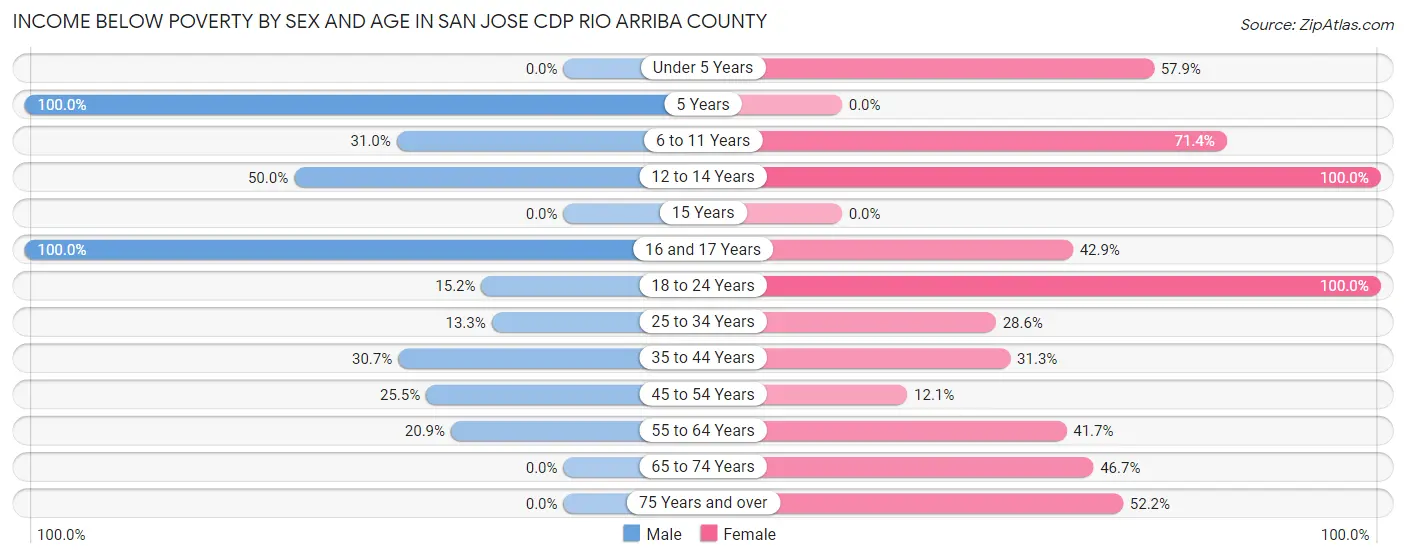
| Age Bracket | Male | Female |
| Under 5 Years | 0 (0.0%) | 22 (57.9%) |
| 5 Years | 13 (100.0%) | 0 (0.0%) |
| 6 to 11 Years | 13 (30.9%) | 5 (71.4%) |
| 12 to 14 Years | 5 (50.0%) | 20 (100.0%) |
| 15 Years | 0 (0.0%) | 0 (0.0%) |
| 16 and 17 Years | 5 (100.0%) | 6 (42.9%) |
| 18 to 24 Years | 7 (15.2%) | 29 (100.0%) |
| 25 to 34 Years | 14 (13.3%) | 10 (28.6%) |
| 35 to 44 Years | 27 (30.7%) | 15 (31.2%) |
| 45 to 54 Years | 13 (25.5%) | 4 (12.1%) |
| 55 to 64 Years | 19 (20.9%) | 15 (41.7%) |
| 65 to 74 Years | 0 (0.0%) | 14 (46.7%) |
| 75 Years and over | 0 (0.0%) | 12 (52.2%) |
| Total | 116 (22.1%) | 152 (48.6%) |
Income Above Poverty by Sex and Age in San Jose CDP Rio Arriba County
According to the poverty statistics in San Jose CDP Rio Arriba County, males aged under 5 years and females aged 45 to 54 years are the age groups that are most secure financially, with 100.0% of males and 87.9% of females in these age groups living above the poverty line.
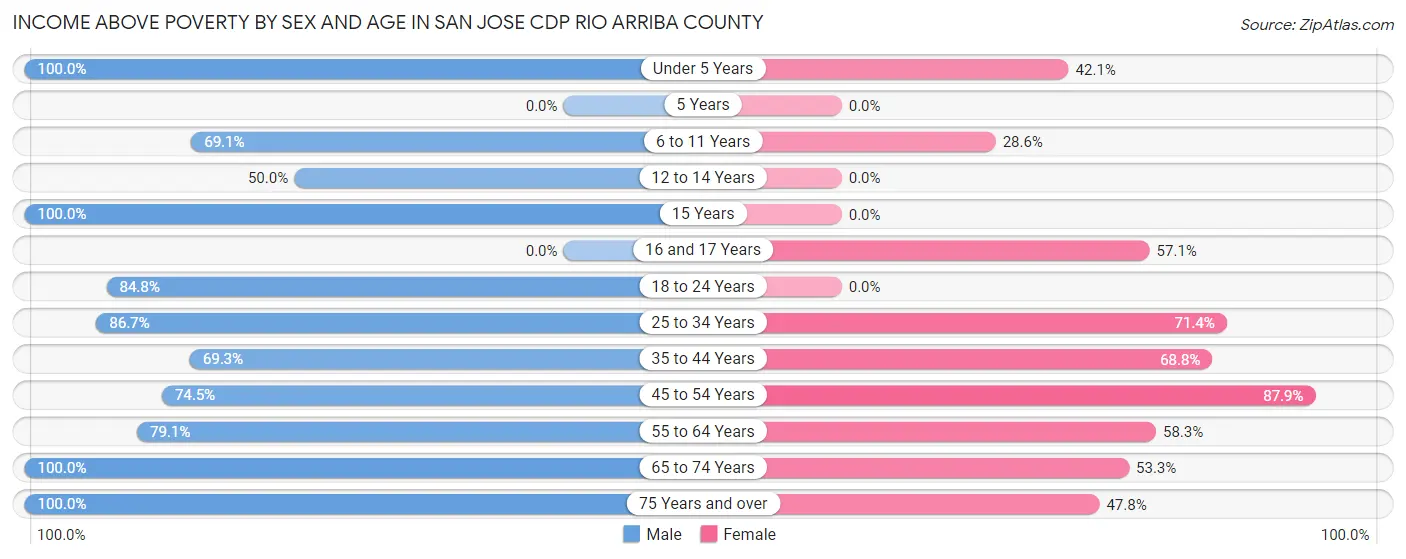
| Age Bracket | Male | Female |
| Under 5 Years | 22 (100.0%) | 16 (42.1%) |
| 5 Years | 0 (0.0%) | 0 (0.0%) |
| 6 to 11 Years | 29 (69.1%) | 2 (28.6%) |
| 12 to 14 Years | 5 (50.0%) | 0 (0.0%) |
| 15 Years | 8 (100.0%) | 0 (0.0%) |
| 16 and 17 Years | 0 (0.0%) | 8 (57.1%) |
| 18 to 24 Years | 39 (84.8%) | 0 (0.0%) |
| 25 to 34 Years | 91 (86.7%) | 25 (71.4%) |
| 35 to 44 Years | 61 (69.3%) | 33 (68.8%) |
| 45 to 54 Years | 38 (74.5%) | 29 (87.9%) |
| 55 to 64 Years | 72 (79.1%) | 21 (58.3%) |
| 65 to 74 Years | 21 (100.0%) | 16 (53.3%) |
| 75 Years and over | 23 (100.0%) | 11 (47.8%) |
| Total | 409 (77.9%) | 161 (51.4%) |
Income Below Poverty Among Married-Couple Families in San Jose CDP Rio Arriba County
The poverty statistics for married-couple families in San Jose CDP Rio Arriba County show that 13.0% or 12 of the total 92 families live below the poverty line. Families with 3 or 4 children have the highest poverty rate of 100.0%, comprising of 3 families. On the other hand, families with 1 or 2 children have the lowest poverty rate of 0.0%, which includes 0 families.
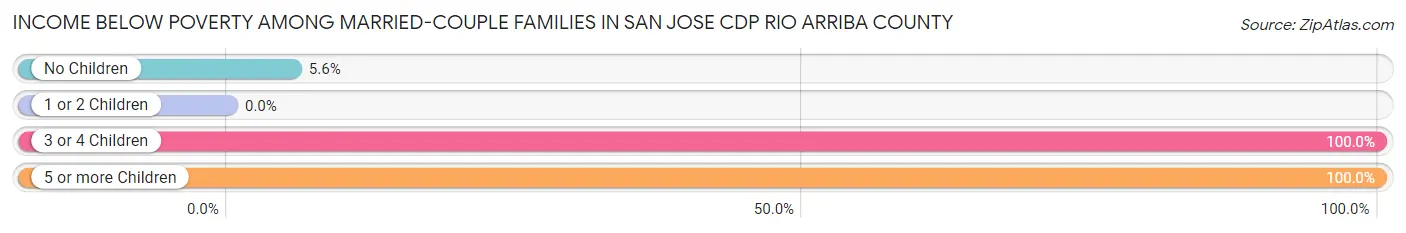
| Children | Above Poverty | Below Poverty |
| No Children | 68 (94.4%) | 4 (5.6%) |
| 1 or 2 Children | 12 (100.0%) | 0 (0.0%) |
| 3 or 4 Children | 0 (0.0%) | 3 (100.0%) |
| 5 or more Children | 0 (0.0%) | 5 (100.0%) |
| Total | 80 (87.0%) | 12 (13.0%) |
Income Below Poverty Among Single-Parent Households in San Jose CDP Rio Arriba County
According to the poverty data in San Jose CDP Rio Arriba County, 19.1% or 4 single-father households and 51.4% or 18 single-mother households are living below the poverty line. Among single-father households, those with 1 or 2 children have the highest poverty rate, with 4 households (19.1%) experiencing poverty. Likewise, among single-mother households, those with 1 or 2 children have the highest poverty rate, with 7 households (70.0%) falling below the poverty line.
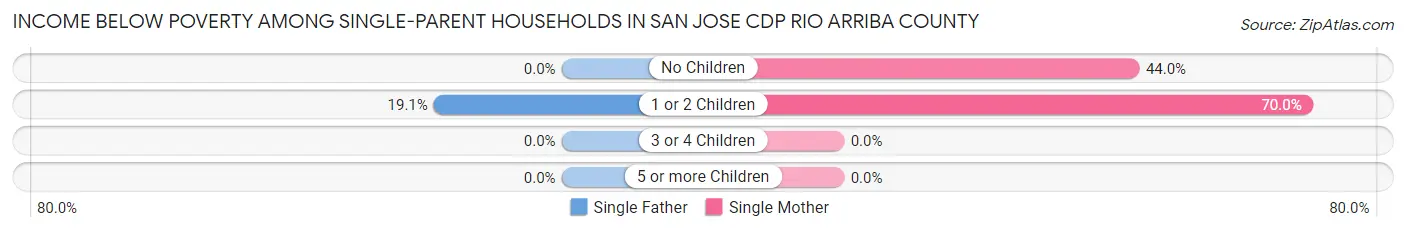
| Children | Single Father | Single Mother |
| No Children | 0 (0.0%) | 11 (44.0%) |
| 1 or 2 Children | 4 (19.1%) | 7 (70.0%) |
| 3 or 4 Children | 0 (0.0%) | 0 (0.0%) |
| 5 or more Children | 0 (0.0%) | 0 (0.0%) |
| Total | 4 (19.1%) | 18 (51.4%) |
Income Below Poverty Among Married-Couple vs Single-Parent Households in San Jose CDP Rio Arriba County
The poverty data for San Jose CDP Rio Arriba County shows that 12 of the married-couple family households (13.0%) and 22 of the single-parent households (39.3%) are living below the poverty level. Within the married-couple family households, those with 3 or 4 children have the highest poverty rate, with 3 households (100.0%) falling below the poverty line. Among the single-parent households, those with no children have the highest poverty rate, with 11 household (44.0%) living below poverty.
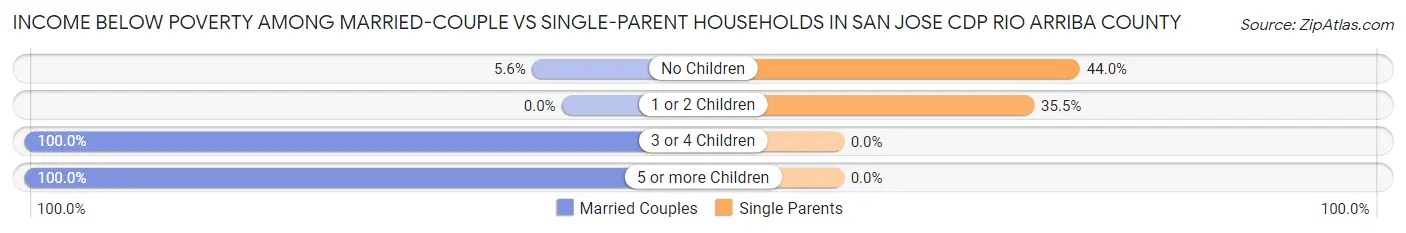
| Children | Married-Couple Families | Single-Parent Households |
| No Children | 4 (5.6%) | 11 (44.0%) |
| 1 or 2 Children | 0 (0.0%) | 11 (35.5%) |
| 3 or 4 Children | 3 (100.0%) | 0 (0.0%) |
| 5 or more Children | 5 (100.0%) | 0 (0.0%) |
| Total | 12 (13.0%) | 22 (39.3%) |
Race in San Jose CDP Rio Arriba County
The most populous races in San Jose CDP Rio Arriba County are Hispanic or Latino (786 | 93.0%), Some other Race (498 | 58.9%), and White / Caucasian (260 | 30.8%).
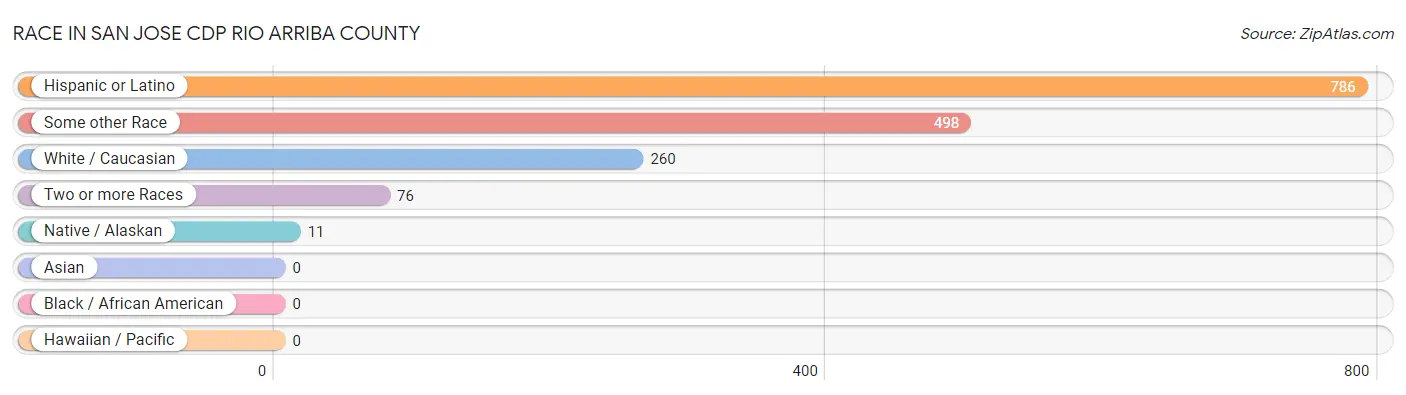
| Race | # Population | % Population |
| Asian | 0 | 0.0% |
| Black / African American | 0 | 0.0% |
| Hawaiian / Pacific | 0 | 0.0% |
| Hispanic or Latino | 786 | 93.0% |
| Native / Alaskan | 11 | 1.3% |
| White / Caucasian | 260 | 30.8% |
| Two or more Races | 76 | 9.0% |
| Some other Race | 498 | 58.9% |
| Total | 845 | 100.0% |
Ancestry in San Jose CDP Rio Arriba County
The most populous ancestries reported in San Jose CDP Rio Arriba County are Mexican (193 | 22.8%), Spanish (190 | 22.5%), Spaniard (153 | 18.1%), Irish (26 | 3.1%), and Italian (26 | 3.1%), together accounting for 69.6% of all San Jose CDP Rio Arriba County residents.
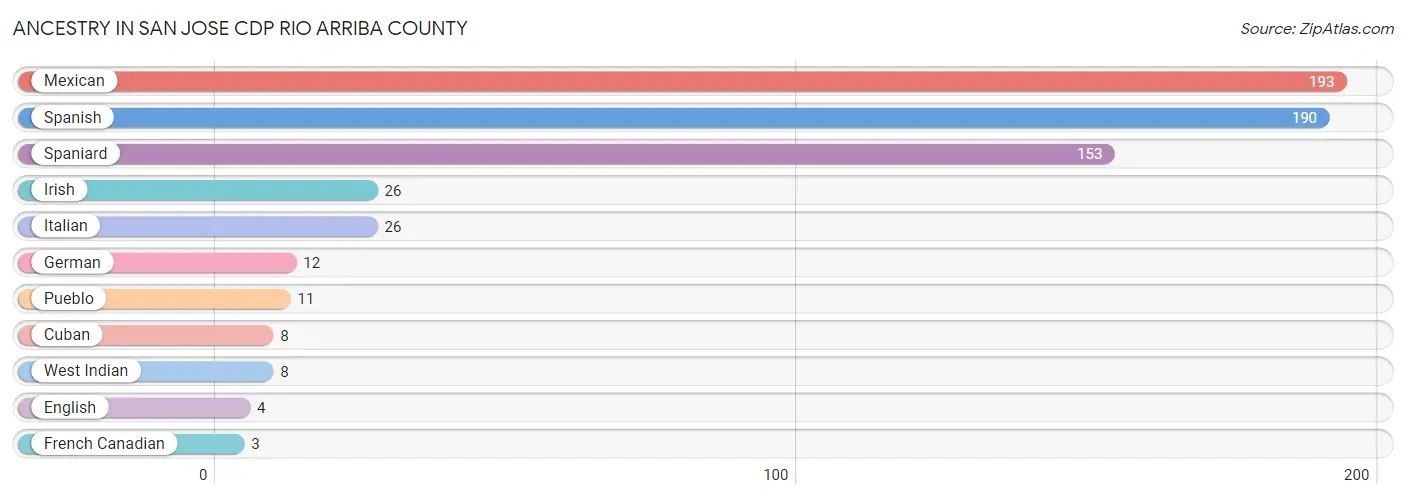
| Ancestry | # Population | % Population |
| Cuban | 8 | 0.9% |
| English | 4 | 0.5% |
| French Canadian | 3 | 0.4% |
| German | 12 | 1.4% |
| Irish | 26 | 3.1% |
| Italian | 26 | 3.1% |
| Mexican | 193 | 22.8% |
| Pueblo | 11 | 1.3% |
| Spaniard | 153 | 18.1% |
| Spanish | 190 | 22.5% |
| West Indian | 8 | 0.9% | View All 11 Rows |
Immigrants in San Jose CDP Rio Arriba County
The most numerous immigrant groups reported in San Jose CDP Rio Arriba County came from Central America (34 | 4.0%), Latin America (34 | 4.0%), and Mexico (34 | 4.0%), together accounting for 12.1% of all San Jose CDP Rio Arriba County residents.
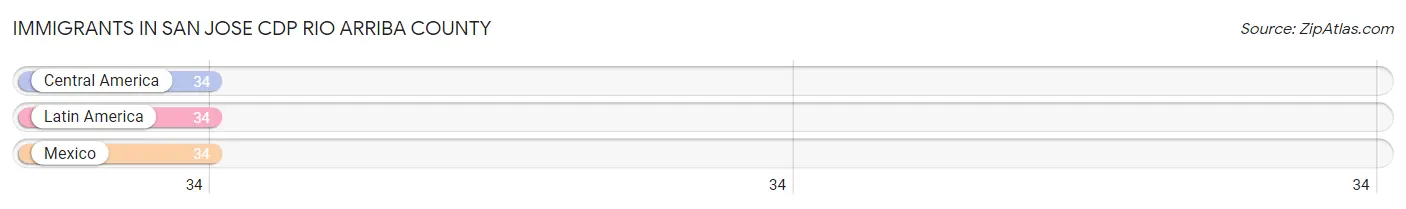
| Immigration Origin | # Population | % Population |
| Central America | 34 | 4.0% |
| Latin America | 34 | 4.0% |
| Mexico | 34 | 4.0% | View All 3 Rows |
Sex and Age in San Jose CDP Rio Arriba County
Sex and Age in San Jose CDP Rio Arriba County
The most populous age groups in San Jose CDP Rio Arriba County are 25 to 29 Years (68 | 12.8%) for men and Under 5 Years (38 | 12.1%) for women.
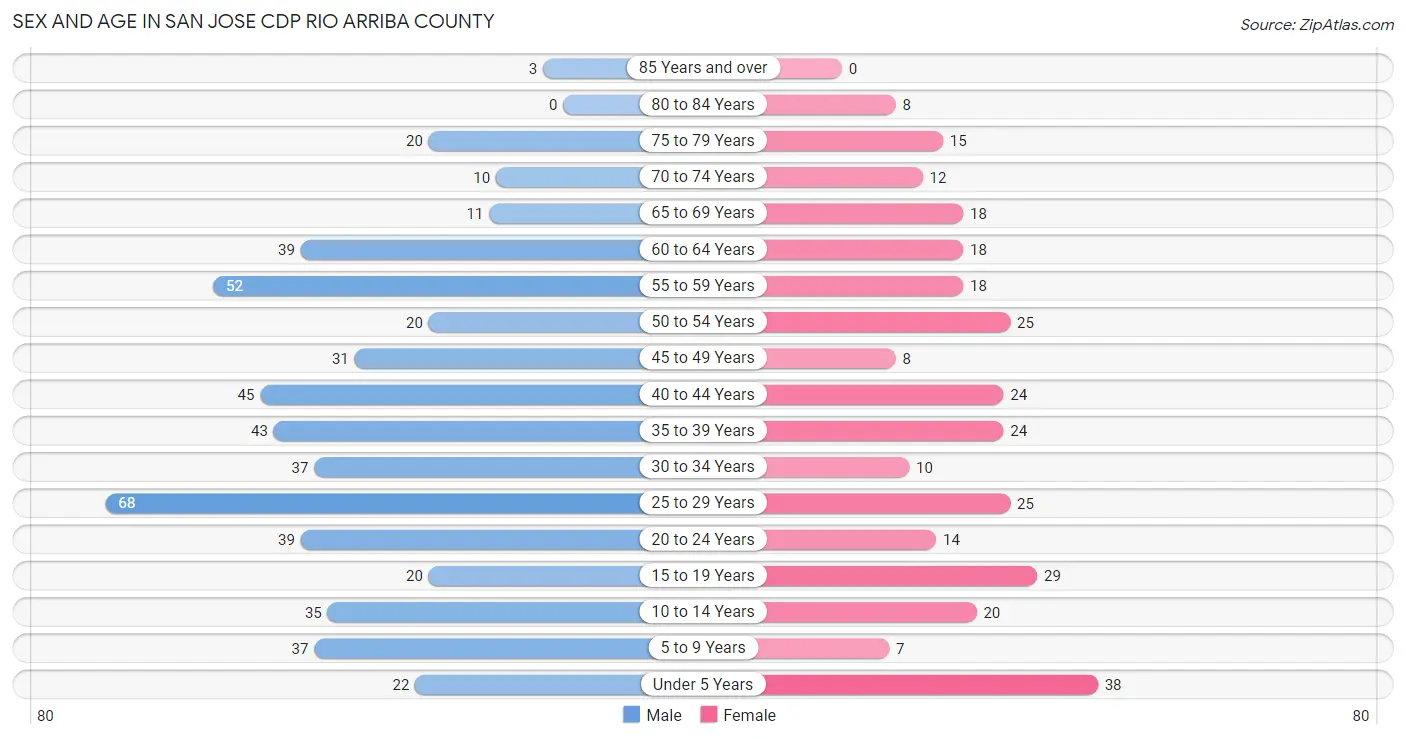
| Age Bracket | Male | Female |
| Under 5 Years | 22 (4.1%) | 38 (12.1%) |
| 5 to 9 Years | 37 (7.0%) | 7 (2.2%) |
| 10 to 14 Years | 35 (6.6%) | 20 (6.4%) |
| 15 to 19 Years | 20 (3.8%) | 29 (9.3%) |
| 20 to 24 Years | 39 (7.3%) | 14 (4.5%) |
| 25 to 29 Years | 68 (12.8%) | 25 (8.0%) |
| 30 to 34 Years | 37 (7.0%) | 10 (3.2%) |
| 35 to 39 Years | 43 (8.1%) | 24 (7.7%) |
| 40 to 44 Years | 45 (8.5%) | 24 (7.7%) |
| 45 to 49 Years | 31 (5.8%) | 8 (2.6%) |
| 50 to 54 Years | 20 (3.8%) | 25 (8.0%) |
| 55 to 59 Years | 52 (9.8%) | 18 (5.8%) |
| 60 to 64 Years | 39 (7.3%) | 18 (5.8%) |
| 65 to 69 Years | 11 (2.1%) | 18 (5.8%) |
| 70 to 74 Years | 10 (1.9%) | 12 (3.8%) |
| 75 to 79 Years | 20 (3.8%) | 15 (4.8%) |
| 80 to 84 Years | 0 (0.0%) | 8 (2.6%) |
| 85 Years and over | 3 (0.6%) | 0 (0.0%) |
| Total | 532 (100.0%) | 313 (100.0%) |
Families and Households in San Jose CDP Rio Arriba County
Median Family Size in San Jose CDP Rio Arriba County
The median family size in San Jose CDP Rio Arriba County is 4.68 persons per family, with single male/father families (21 | 14.2%) accounting for the largest median family size of 5.86 persons per family. On the other hand, single female/mother families (35 | 23.6%) represent the smallest median family size with 4.34 persons per family.
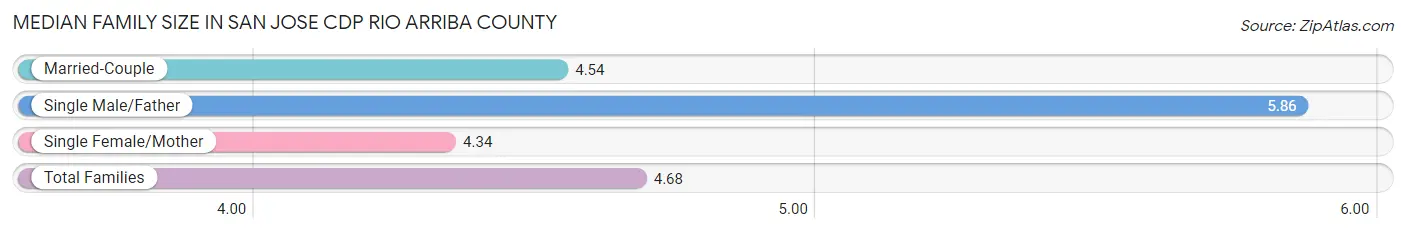
| Family Type | # Families | Family Size |
| Married-Couple | 92 (62.2%) | 4.54 |
| Single Male/Father | 21 (14.2%) | 5.86 |
| Single Female/Mother | 35 (23.6%) | 4.34 |
| Total Families | 148 (100.0%) | 4.68 |
Median Household Size in San Jose CDP Rio Arriba County
The median household size in San Jose CDP Rio Arriba County is 3.35 persons per household, with single male/father households (21 | 8.3%) accounting for the largest median household size of 5.9 persons per household. non-family households (104 | 41.3%) represent the smallest median household size with 1.18 persons per household.
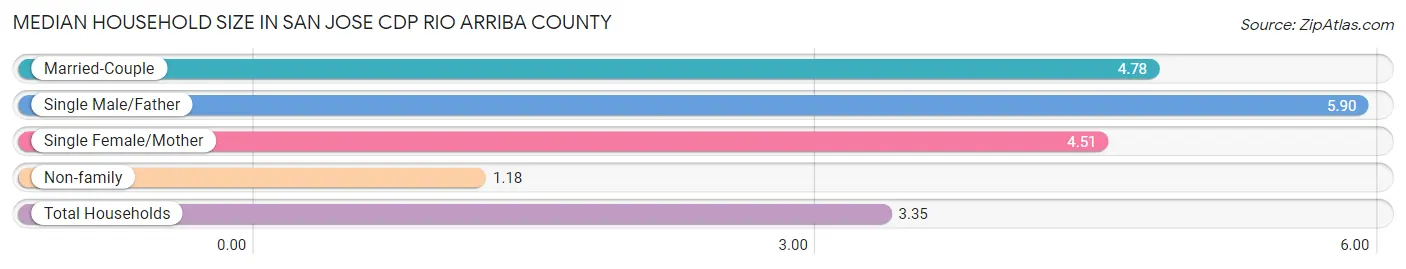
| Household Type | # Households | Household Size |
| Married-Couple | 92 (36.5%) | 4.78 |
| Single Male/Father | 21 (8.3%) | 5.90 |
| Single Female/Mother | 35 (13.9%) | 4.51 |
| Non-family | 104 (41.3%) | 1.18 |
| Total Households | 252 (100.0%) | 3.35 |
Household Size by Marriage Status in San Jose CDP Rio Arriba County
Out of a total of 252 households in San Jose CDP Rio Arriba County, 148 (58.7%) are family households, while 104 (41.3%) are nonfamily households. The most numerous type of family households are 2-person households, comprising 68, and the most common type of nonfamily households are 1-person households, comprising 85.
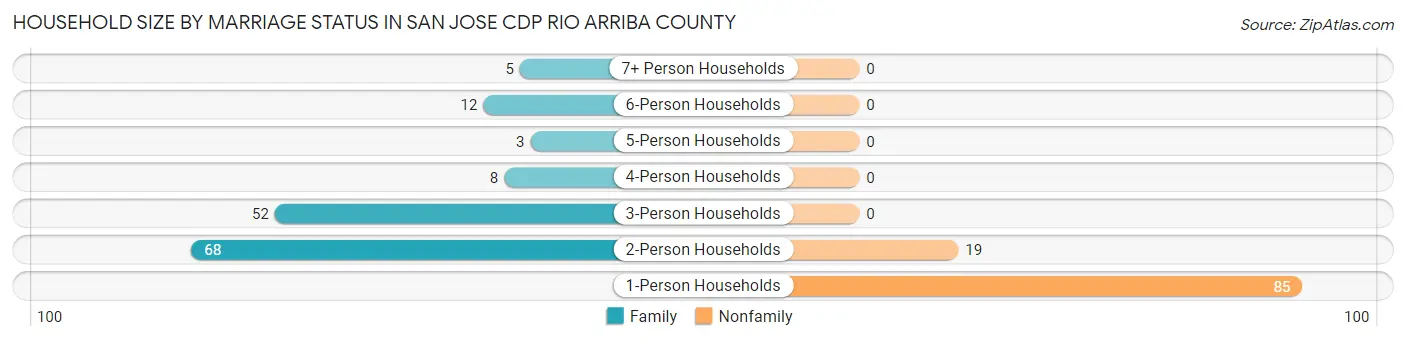
| Household Size | Family Households | Nonfamily Households |
| 1-Person Households | - | 85 (33.7%) |
| 2-Person Households | 68 (27.0%) | 19 (7.5%) |
| 3-Person Households | 52 (20.6%) | 0 (0.0%) |
| 4-Person Households | 8 (3.2%) | 0 (0.0%) |
| 5-Person Households | 3 (1.2%) | 0 (0.0%) |
| 6-Person Households | 12 (4.8%) | 0 (0.0%) |
| 7+ Person Households | 5 (2.0%) | 0 (0.0%) |
| Total | 148 (58.7%) | 104 (41.3%) |
Female Fertility in San Jose CDP Rio Arriba County
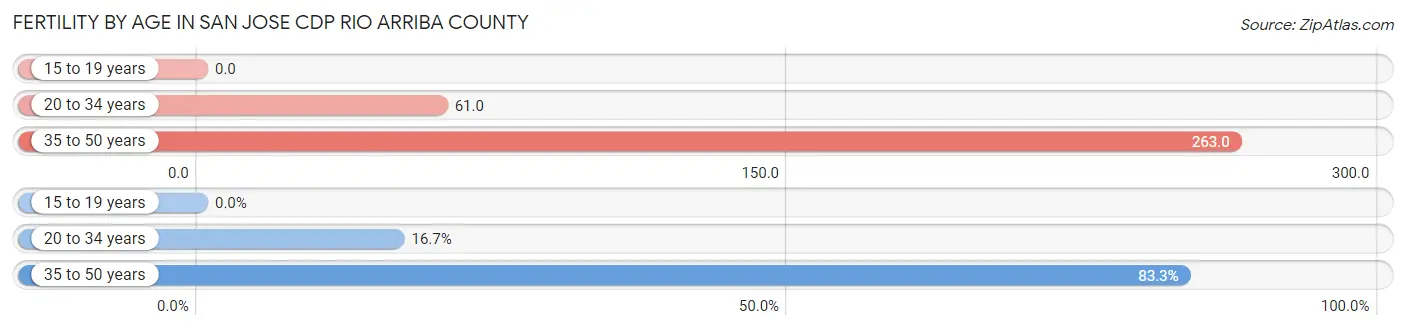
Fertility by Age in San Jose CDP Rio Arriba County
Average fertility rate in San Jose CDP Rio Arriba County is 133.0 births per 1,000 women. Women in the age bracket of 35 to 50 years have the highest fertility rate with 263.0 births per 1,000 women. Women in the age bracket of 35 to 50 years acount for 83.3% of all women with births.
| Age Bracket | Women with Births | Births / 1,000 Women |
| 15 to 19 years | 0 (0.0%) | 0.0 |
| 20 to 34 years | 3 (16.7%) | 61.0 |
| 35 to 50 years | 15 (83.3%) | 263.0 |
| Total | 18 (100.0%) | 133.0 |
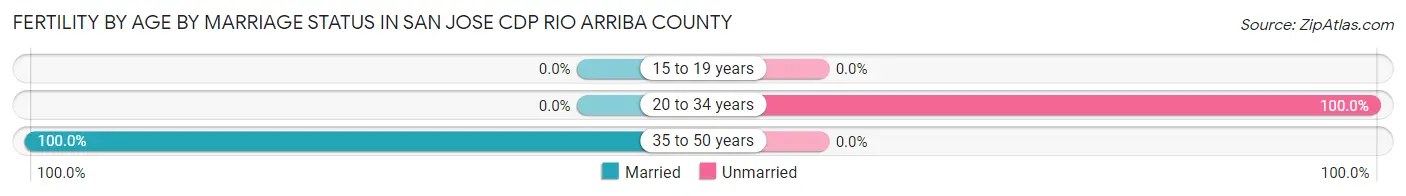
Fertility by Age by Marriage Status in San Jose CDP Rio Arriba County
83.3% of women with births (18) in San Jose CDP Rio Arriba County are married. The highest percentage of unmarried women with births falls into 20 to 34 years age bracket with 100.0% of them unmarried at the time of birth, while the lowest percentage of unmarried women with births belong to 35 to 50 years age bracket with 0.0% of them unmarried.
| Age Bracket | Married | Unmarried |
| 15 to 19 years | 0 (0.0%) | 0 (0.0%) |
| 20 to 34 years | 0 (0.0%) | 3 (100.0%) |
| 35 to 50 years | 15 (100.0%) | 0 (0.0%) |
| Total | 15 (83.3%) | 3 (16.7%) |
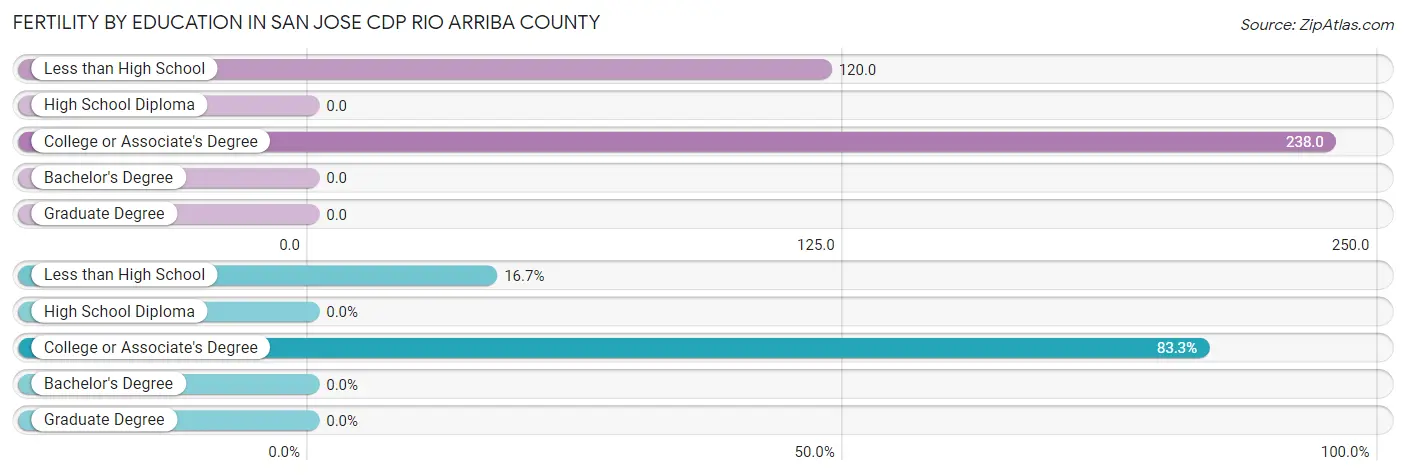
Fertility by Education in San Jose CDP Rio Arriba County
| Educational Attainment | Women with Births | Births / 1,000 Women |
| Less than High School | 3 (16.7%) | 120.0 |
| High School Diploma | 0 (0.0%) | 0.0 |
| College or Associate's Degree | 15 (83.3%) | 238.0 |
| Bachelor's Degree | 0 (0.0%) | 0.0 |
| Graduate Degree | 0 (0.0%) | 0.0 |
| Total | 18 (100.0%) | 133.0 |
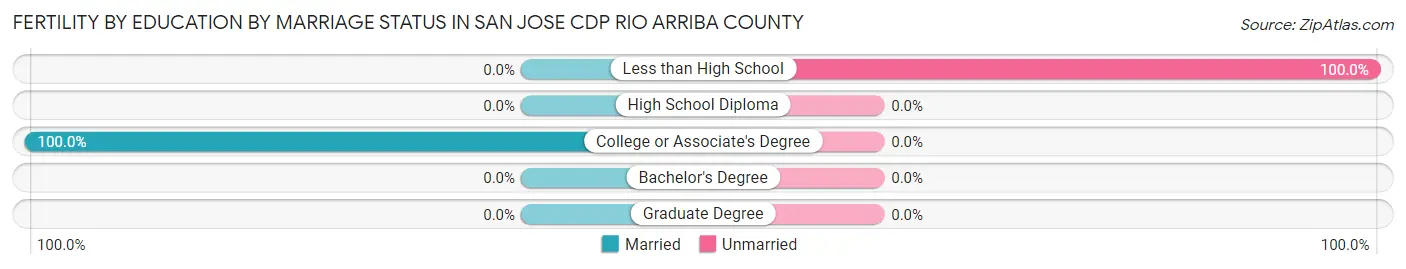
Fertility by Education by Marriage Status in San Jose CDP Rio Arriba County
16.7% of women with births in San Jose CDP Rio Arriba County are unmarried. Women with the educational attainment of college or associate's degree are most likely to be married with 100.0% of them married at childbirth, while women with the educational attainment of less than high school are least likely to be married with 100.0% of them unmarried at childbirth.
| Educational Attainment | Married | Unmarried |
| Less than High School | 0 (0.0%) | 3 (100.0%) |
| High School Diploma | 0 (0.0%) | 0 (0.0%) |
| College or Associate's Degree | 15 (100.0%) | 0 (0.0%) |
| Bachelor's Degree | 0 (0.0%) | 0 (0.0%) |
| Graduate Degree | 0 (0.0%) | 0 (0.0%) |
| Total | 15 (83.3%) | 3 (16.7%) |
Employment Characteristics in San Jose CDP Rio Arriba County
Employment by Class of Employer in San Jose CDP Rio Arriba County
Among the 327 employed individuals in San Jose CDP Rio Arriba County, private company employees (142 | 43.4%), federal government employees (108 | 33.0%), and state government employees (49 | 15.0%) make up the most common classes of employment.
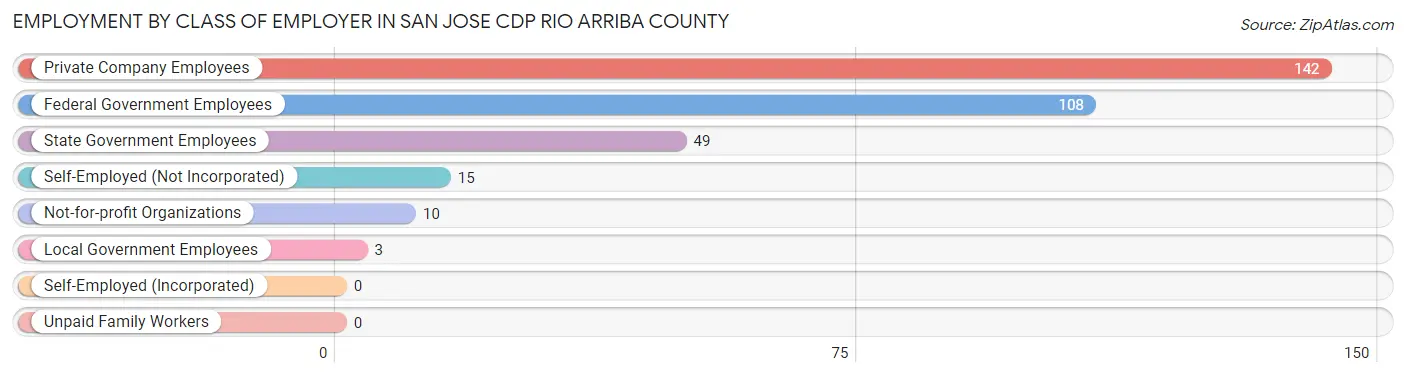
| Employer Class | # Employees | % Employees |
| Private Company Employees | 142 | 43.4% |
| Self-Employed (Incorporated) | 0 | 0.0% |
| Self-Employed (Not Incorporated) | 15 | 4.6% |
| Not-for-profit Organizations | 10 | 3.1% |
| Local Government Employees | 3 | 0.9% |
| State Government Employees | 49 | 15.0% |
| Federal Government Employees | 108 | 33.0% |
| Unpaid Family Workers | 0 | 0.0% |
| Total | 327 | 100.0% |
Employment Status by Age in San Jose CDP Rio Arriba County
According to the labor force statistics for San Jose CDP Rio Arriba County, out of the total population over 16 years of age (678), 52.1% or 353 individuals are in the labor force, with 7.4% or 26 of them unemployed. The age group with the highest labor force participation rate is 45 to 54 years, with 91.7% or 77 individuals in the labor force. Within the labor force, the 45 to 54 years age range has the highest percentage of unemployed individuals, with 24.7% or 19 of them being unemployed.
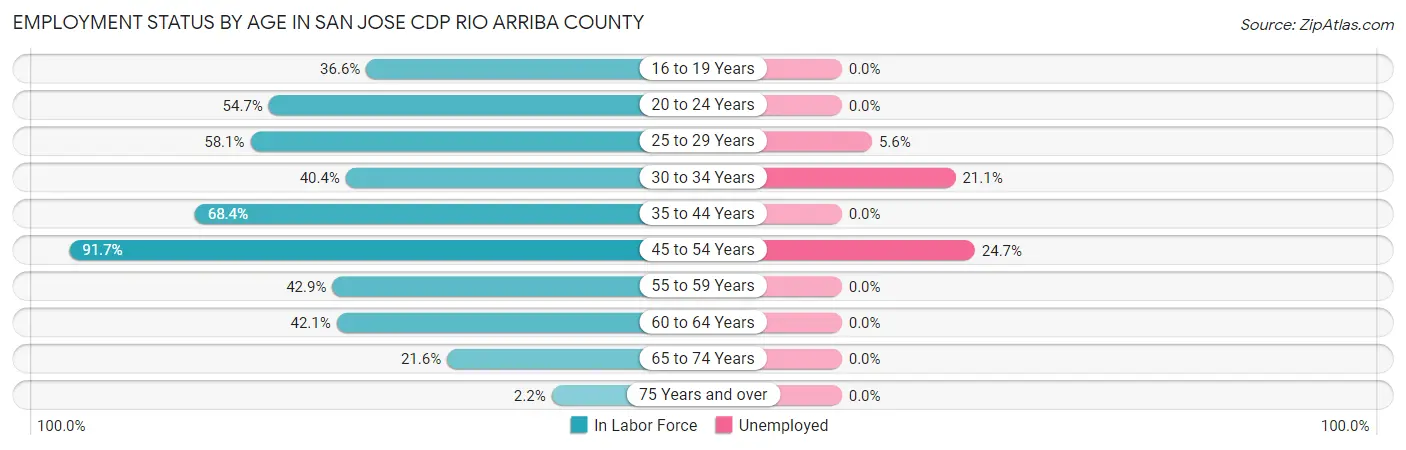
| Age Bracket | In Labor Force | Unemployed |
| 16 to 19 Years | 15 (36.6%) | 0 (0.0%) |
| 20 to 24 Years | 29 (54.7%) | 0 (0.0%) |
| 25 to 29 Years | 54 (58.1%) | 3 (5.6%) |
| 30 to 34 Years | 19 (40.4%) | 4 (21.1%) |
| 35 to 44 Years | 93 (68.4%) | 0 (0.0%) |
| 45 to 54 Years | 77 (91.7%) | 19 (24.7%) |
| 55 to 59 Years | 30 (42.9%) | 0 (0.0%) |
| 60 to 64 Years | 24 (42.1%) | 0 (0.0%) |
| 65 to 74 Years | 11 (21.6%) | 0 (0.0%) |
| 75 Years and over | 1 (2.2%) | 0 (0.0%) |
| Total | 353 (52.1%) | 26 (7.4%) |
Employment Status by Educational Attainment in San Jose CDP Rio Arriba County
According to labor force statistics for San Jose CDP Rio Arriba County, 61.0% of individuals (297) out of the total population between 25 and 64 years of age (487) are in the labor force, with 8.8% or 26 of them being unemployed. The group with the highest labor force participation rate are those with the educational attainment of bachelor's degree or higher, with 68.0% or 68 individuals in the labor force. Within the labor force, individuals with less than high school education have the highest percentage of unemployment, with 21.2% or 7 of them being unemployed.
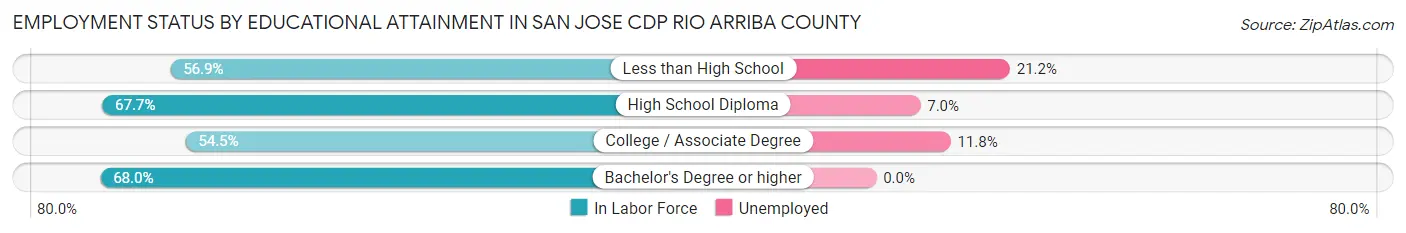
| Educational Attainment | In Labor Force | Unemployed |
| Less than High School | 33 (56.9%) | 12 (21.2%) |
| High School Diploma | 86 (67.7%) | 9 (7.0%) |
| College / Associate Degree | 110 (54.5%) | 24 (11.8%) |
| Bachelor's Degree or higher | 68 (68.0%) | 0 (0.0%) |
| Total | 297 (61.0%) | 43 (8.8%) |
Employment Occupations by Sex in San Jose CDP Rio Arriba County
Management, Business, Science and Arts Occupations
The most common Management, Business, Science and Arts occupations in San Jose CDP Rio Arriba County are Management (20 | 6.1%), Computers, Engineering & Science (20 | 6.1%), Community & Social Service (18 | 5.5%), Business & Financial (14 | 4.3%), and Education Instruction & Library (14 | 4.3%).
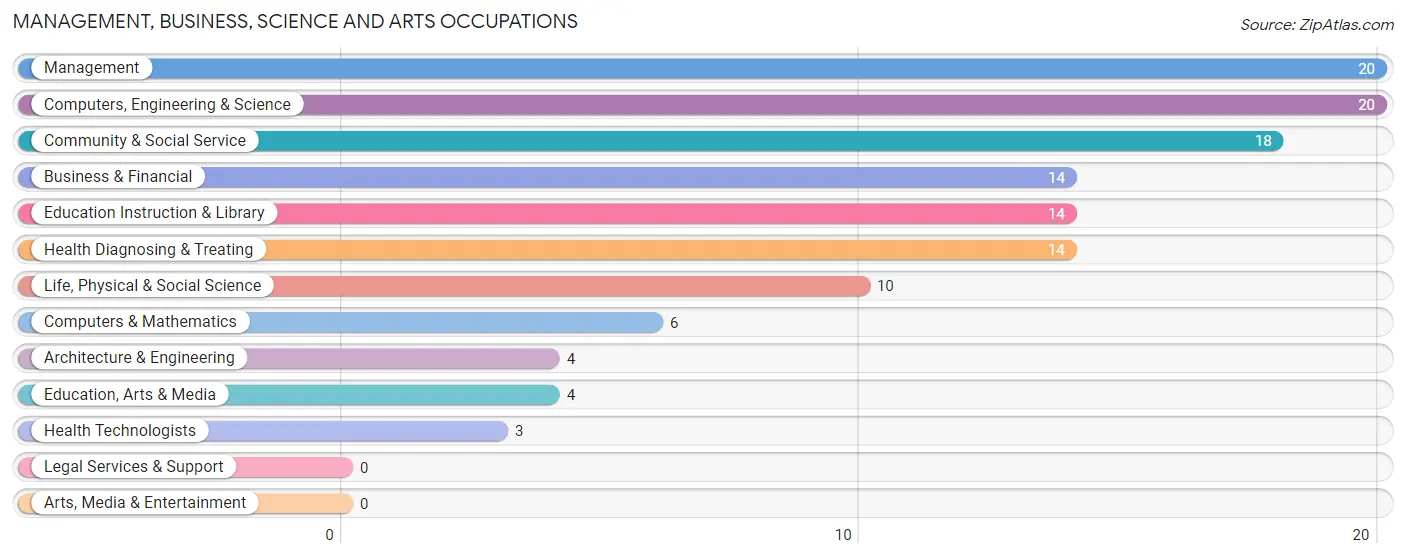
Management, Business, Science and Arts Occupations by Sex
Within the Management, Business, Science and Arts occupations in San Jose CDP Rio Arriba County, the most male-oriented occupations are Computers, Engineering & Science (100.0%), Computers & Mathematics (100.0%), and Architecture & Engineering (100.0%), while the most female-oriented occupations are Health Technologists (100.0%), Management (70.0%), and Business & Financial (35.7%).
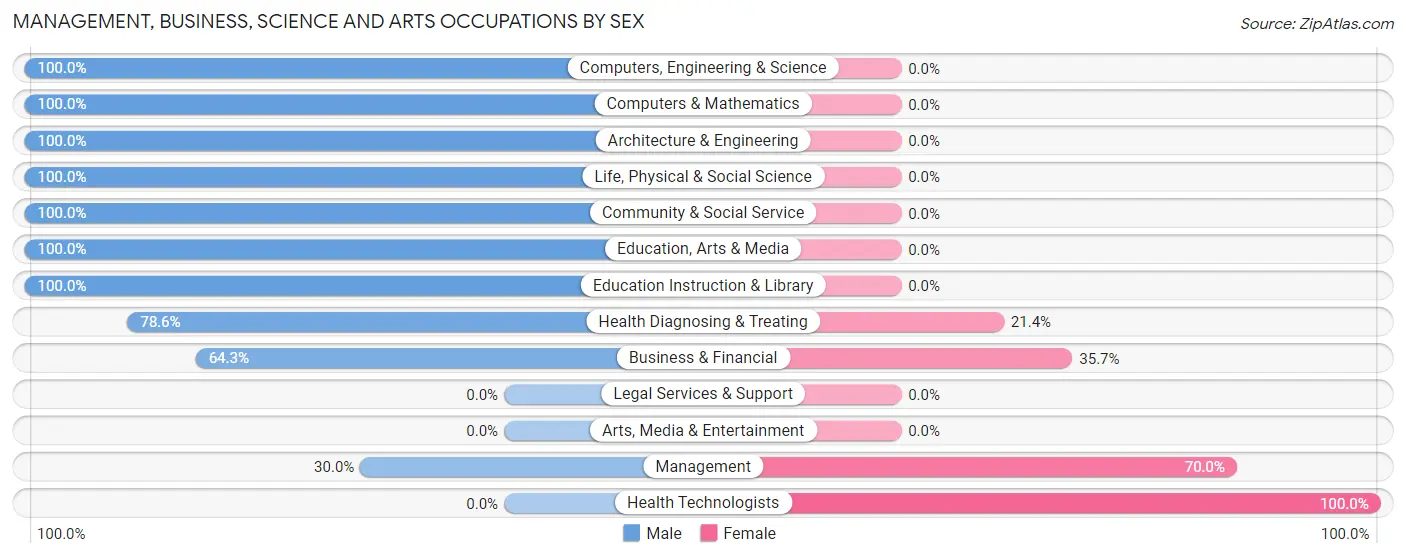
| Occupation | Male | Female |
| Management | 6 (30.0%) | 14 (70.0%) |
| Business & Financial | 9 (64.3%) | 5 (35.7%) |
| Computers, Engineering & Science | 20 (100.0%) | 0 (0.0%) |
| Computers & Mathematics | 6 (100.0%) | 0 (0.0%) |
| Architecture & Engineering | 4 (100.0%) | 0 (0.0%) |
| Life, Physical & Social Science | 10 (100.0%) | 0 (0.0%) |
| Community & Social Service | 18 (100.0%) | 0 (0.0%) |
| Education, Arts & Media | 4 (100.0%) | 0 (0.0%) |
| Legal Services & Support | 0 (0.0%) | 0 (0.0%) |
| Education Instruction & Library | 14 (100.0%) | 0 (0.0%) |
| Arts, Media & Entertainment | 0 (0.0%) | 0 (0.0%) |
| Health Diagnosing & Treating | 11 (78.6%) | 3 (21.4%) |
| Health Technologists | 0 (0.0%) | 3 (100.0%) |
| Total (Category) | 64 (74.4%) | 22 (25.6%) |
| Total (Overall) | 225 (68.8%) | 102 (31.2%) |
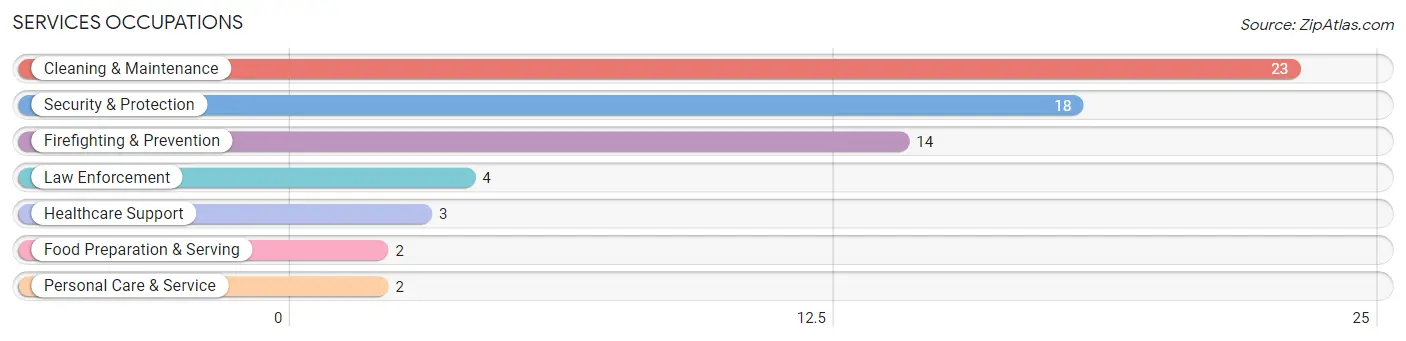
Services Occupations
The most common Services occupations in San Jose CDP Rio Arriba County are Cleaning & Maintenance (23 | 7.0%), Security & Protection (18 | 5.5%), Firefighting & Prevention (14 | 4.3%), Law Enforcement (4 | 1.2%), and Healthcare Support (3 | 0.9%).
Services Occupations by Sex
Within the Services occupations in San Jose CDP Rio Arriba County, the most male-oriented occupations are Security & Protection (100.0%), Firefighting & Prevention (100.0%), and Law Enforcement (100.0%), while the most female-oriented occupations are Healthcare Support (100.0%), Personal Care & Service (100.0%), and Cleaning & Maintenance (21.7%).
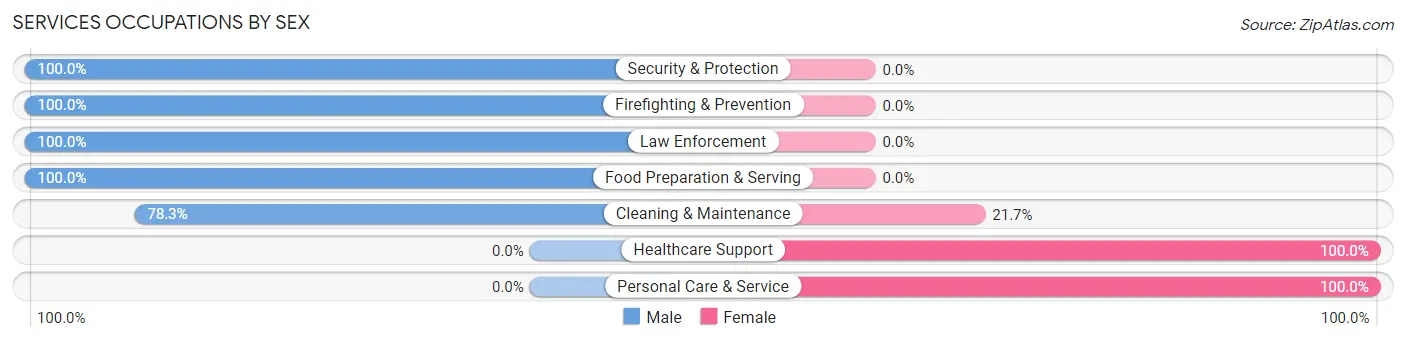
| Occupation | Male | Female |
| Healthcare Support | 0 (0.0%) | 3 (100.0%) |
| Security & Protection | 18 (100.0%) | 0 (0.0%) |
| Firefighting & Prevention | 14 (100.0%) | 0 (0.0%) |
| Law Enforcement | 4 (100.0%) | 0 (0.0%) |
| Food Preparation & Serving | 2 (100.0%) | 0 (0.0%) |
| Cleaning & Maintenance | 18 (78.3%) | 5 (21.7%) |
| Personal Care & Service | 0 (0.0%) | 2 (100.0%) |
| Total (Category) | 38 (79.2%) | 10 (20.8%) |
| Total (Overall) | 225 (68.8%) | 102 (31.2%) |
Sales and Office Occupations
The most common Sales and Office occupations in San Jose CDP Rio Arriba County are Office & Administration (51 | 15.6%), and Sales & Related (45 | 13.8%).
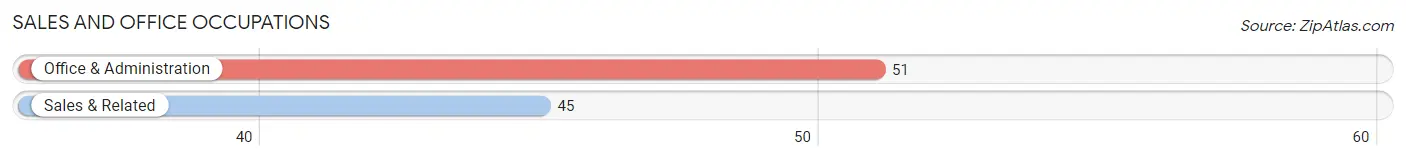
Sales and Office Occupations by Sex
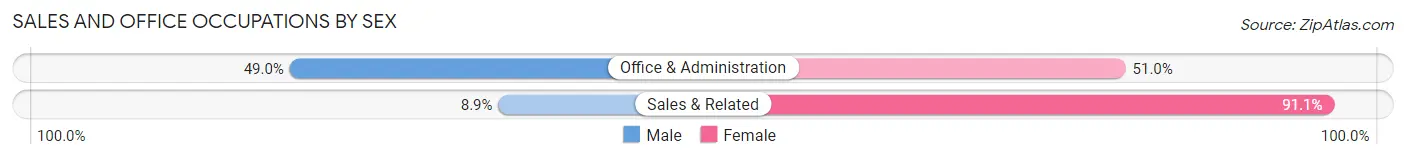
| Occupation | Male | Female |
| Sales & Related | 4 (8.9%) | 41 (91.1%) |
| Office & Administration | 25 (49.0%) | 26 (51.0%) |
| Total (Category) | 29 (30.2%) | 67 (69.8%) |
| Total (Overall) | 225 (68.8%) | 102 (31.2%) |
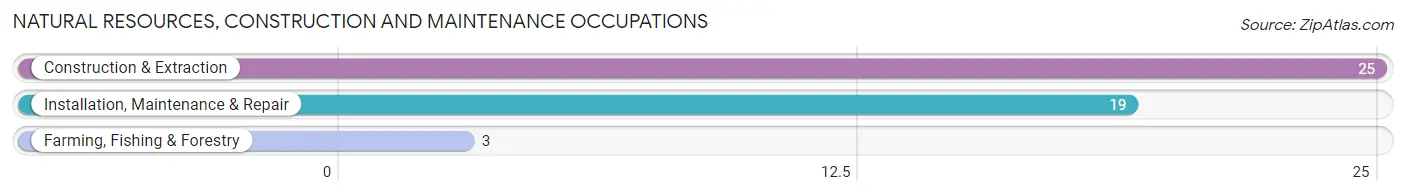
Natural Resources, Construction and Maintenance Occupations
The most common Natural Resources, Construction and Maintenance occupations in San Jose CDP Rio Arriba County are Construction & Extraction (25 | 7.6%), Installation, Maintenance & Repair (19 | 5.8%), and Farming, Fishing & Forestry (3 | 0.9%).
Natural Resources, Construction and Maintenance Occupations by Sex
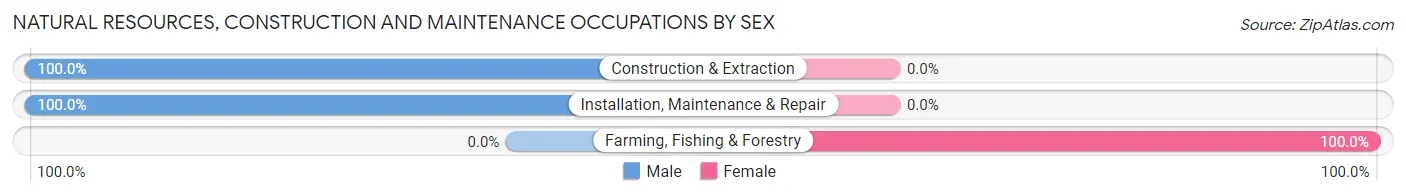
| Occupation | Male | Female |
| Farming, Fishing & Forestry | 0 (0.0%) | 3 (100.0%) |
| Construction & Extraction | 25 (100.0%) | 0 (0.0%) |
| Installation, Maintenance & Repair | 19 (100.0%) | 0 (0.0%) |
| Total (Category) | 44 (93.6%) | 3 (6.4%) |
| Total (Overall) | 225 (68.8%) | 102 (31.2%) |
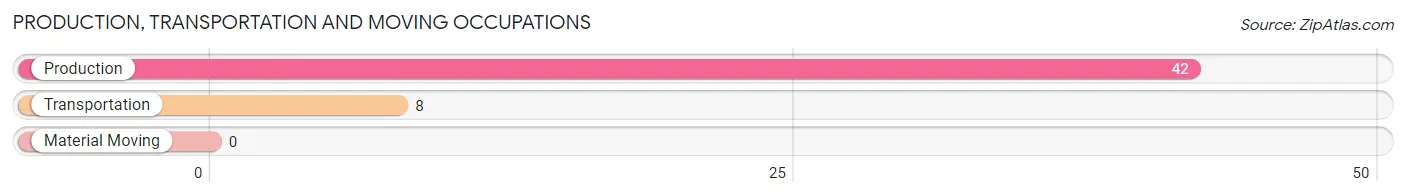
Production, Transportation and Moving Occupations
The most common Production, Transportation and Moving occupations in San Jose CDP Rio Arriba County are Production (42 | 12.8%), and Transportation (8 | 2.5%).
Production, Transportation and Moving Occupations by Sex
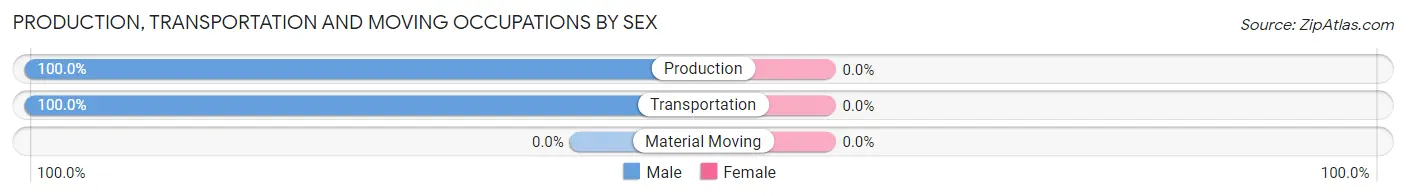
| Occupation | Male | Female |
| Production | 42 (100.0%) | 0 (0.0%) |
| Transportation | 8 (100.0%) | 0 (0.0%) |
| Material Moving | 0 (0.0%) | 0 (0.0%) |
| Total (Category) | 50 (100.0%) | 0 (0.0%) |
| Total (Overall) | 225 (68.8%) | 102 (31.2%) |
Employment Industries by Sex in San Jose CDP Rio Arriba County
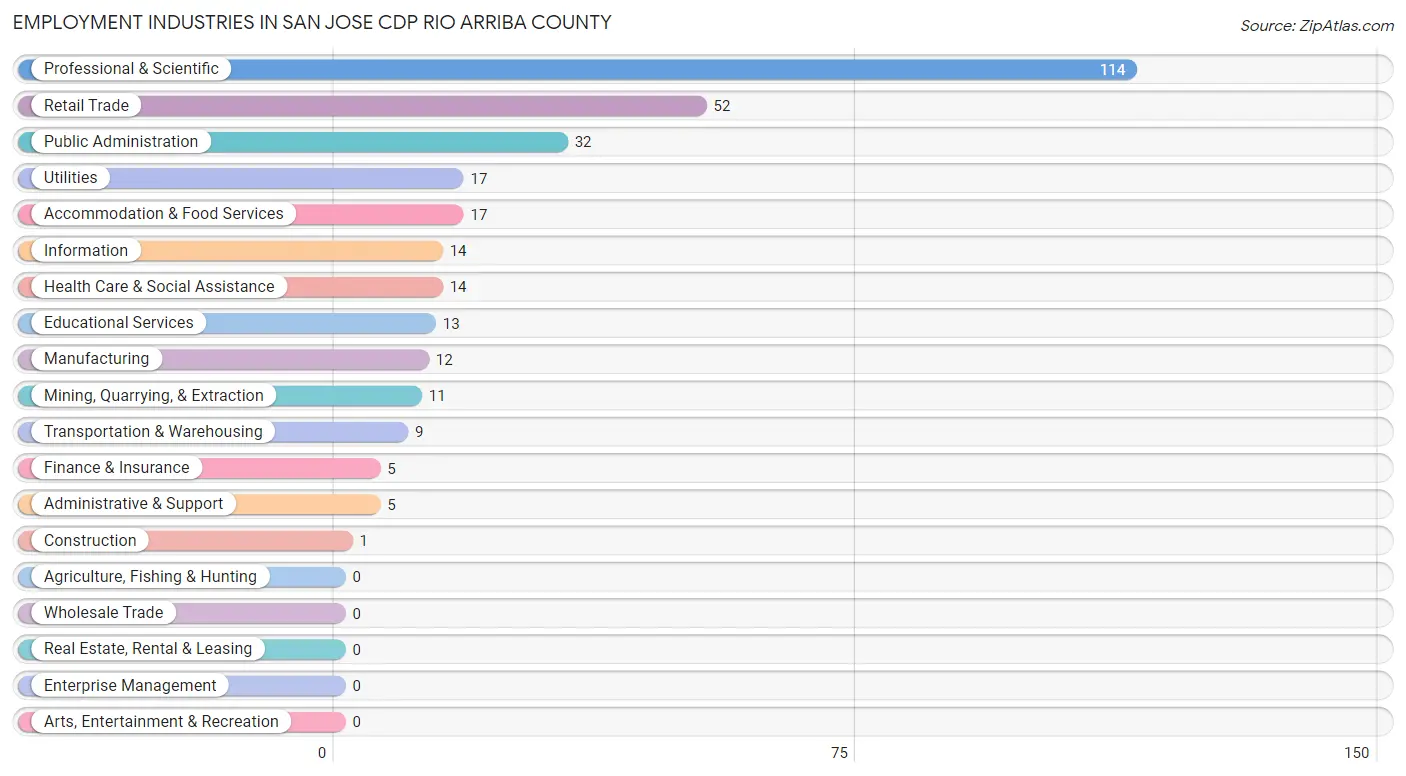
Employment Industries in San Jose CDP Rio Arriba County
The major employment industries in San Jose CDP Rio Arriba County include Professional & Scientific (114 | 34.9%), Retail Trade (52 | 15.9%), Public Administration (32 | 9.8%), Utilities (17 | 5.2%), and Accommodation & Food Services (17 | 5.2%).
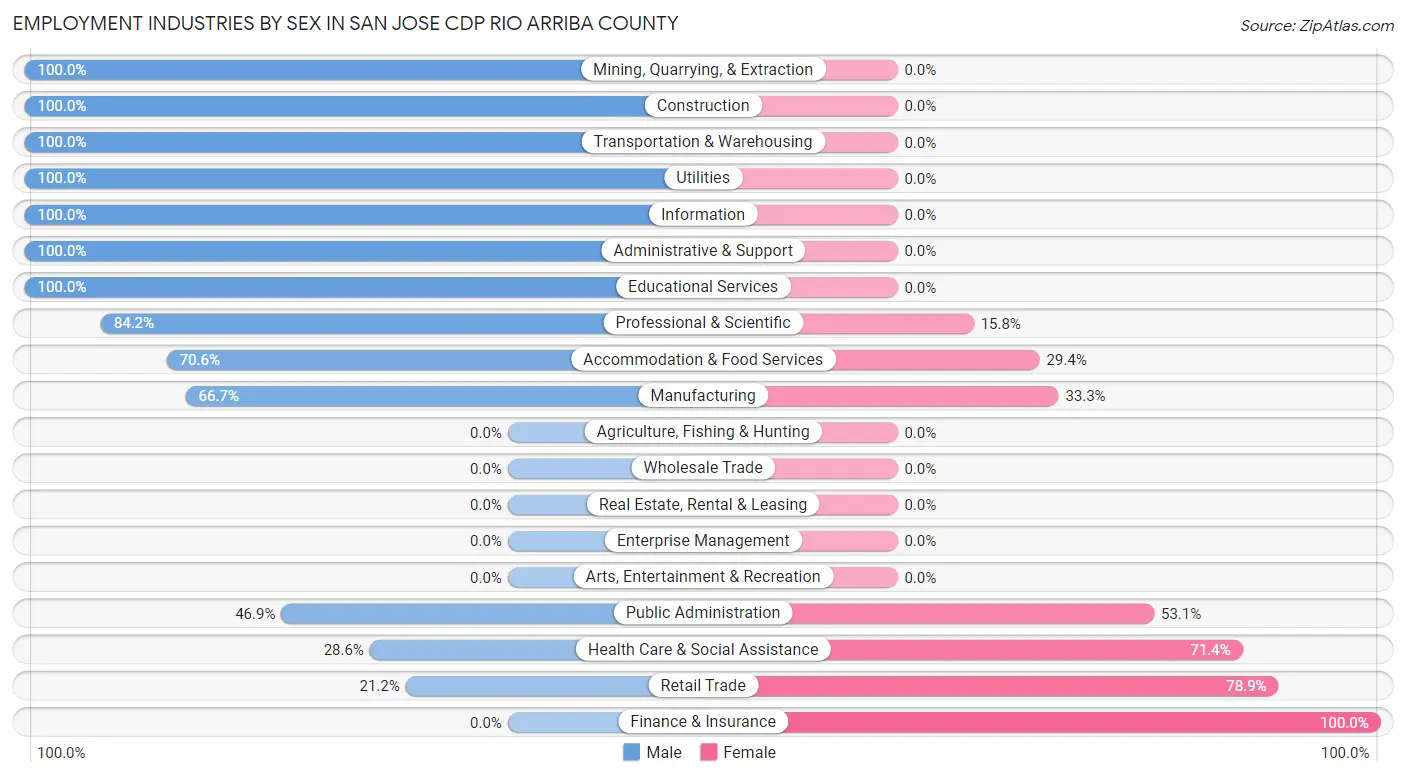
Employment Industries by Sex in San Jose CDP Rio Arriba County
The San Jose CDP Rio Arriba County industries that see more men than women are Mining, Quarrying, & Extraction (100.0%), Construction (100.0%), and Transportation & Warehousing (100.0%), whereas the industries that tend to have a higher number of women are Finance & Insurance (100.0%), Retail Trade (78.8%), and Health Care & Social Assistance (71.4%).
| Industry | Male | Female |
| Agriculture, Fishing & Hunting | 0 (0.0%) | 0 (0.0%) |
| Mining, Quarrying, & Extraction | 11 (100.0%) | 0 (0.0%) |
| Construction | 1 (100.0%) | 0 (0.0%) |
| Manufacturing | 8 (66.7%) | 4 (33.3%) |
| Wholesale Trade | 0 (0.0%) | 0 (0.0%) |
| Retail Trade | 11 (21.1%) | 41 (78.8%) |
| Transportation & Warehousing | 9 (100.0%) | 0 (0.0%) |
| Utilities | 17 (100.0%) | 0 (0.0%) |
| Information | 14 (100.0%) | 0 (0.0%) |
| Finance & Insurance | 0 (0.0%) | 5 (100.0%) |
| Real Estate, Rental & Leasing | 0 (0.0%) | 0 (0.0%) |
| Professional & Scientific | 96 (84.2%) | 18 (15.8%) |
| Enterprise Management | 0 (0.0%) | 0 (0.0%) |
| Administrative & Support | 5 (100.0%) | 0 (0.0%) |
| Educational Services | 13 (100.0%) | 0 (0.0%) |
| Health Care & Social Assistance | 4 (28.6%) | 10 (71.4%) |
| Arts, Entertainment & Recreation | 0 (0.0%) | 0 (0.0%) |
| Accommodation & Food Services | 12 (70.6%) | 5 (29.4%) |
| Public Administration | 15 (46.9%) | 17 (53.1%) |
| Total | 225 (68.8%) | 102 (31.2%) |
Education in San Jose CDP Rio Arriba County
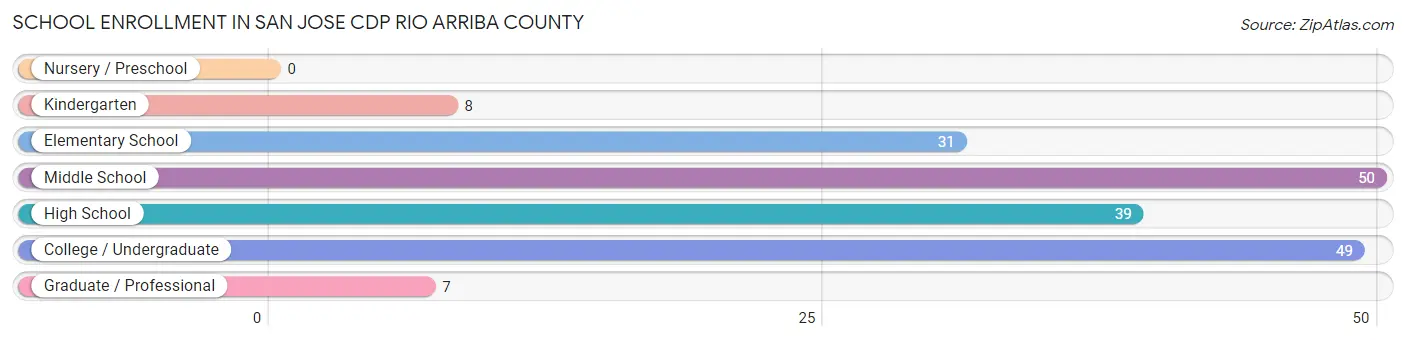
School Enrollment in San Jose CDP Rio Arriba County
The most common levels of schooling among the 184 students in San Jose CDP Rio Arriba County are middle school (50 | 27.2%), college / undergraduate (49 | 26.6%), and high school (39 | 21.2%).
| School Level | # Students | % Students |
| Nursery / Preschool | 0 | 0.0% |
| Kindergarten | 8 | 4.3% |
| Elementary School | 31 | 16.9% |
| Middle School | 50 | 27.2% |
| High School | 39 | 21.2% |
| College / Undergraduate | 49 | 26.6% |
| Graduate / Professional | 7 | 3.8% |
| Total | 184 | 100.0% |
School Enrollment by Age by Funding Source in San Jose CDP Rio Arriba County
Out of a total of 184 students who are enrolled in schools in San Jose CDP Rio Arriba County, 7 (3.8%) attend a private institution, while the remaining 177 (96.2%) are enrolled in public schools. The age group of 18 to 19 year olds has the highest likelihood of being enrolled in private schools, with 7 (31.8% in the age bracket) enrolled. Conversely, the age group of 5 to 9 year old has the lowest likelihood of being enrolled in a private school, with 39 (100.0% in the age bracket) attending a public institution.
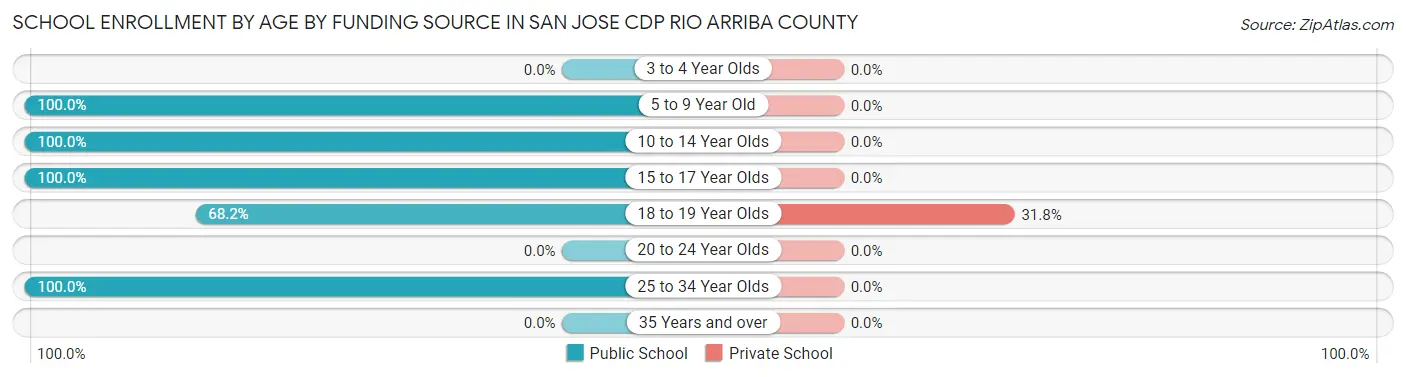
| Age Bracket | Public School | Private School |
| 3 to 4 Year Olds | 0 (0.0%) | 0 (0.0%) |
| 5 to 9 Year Old | 39 (100.0%) | 0 (0.0%) |
| 10 to 14 Year Olds | 55 (100.0%) | 0 (0.0%) |
| 15 to 17 Year Olds | 27 (100.0%) | 0 (0.0%) |
| 18 to 19 Year Olds | 15 (68.2%) | 7 (31.8%) |
| 20 to 24 Year Olds | 0 (0.0%) | 0 (0.0%) |
| 25 to 34 Year Olds | 41 (100.0%) | 0 (0.0%) |
| 35 Years and over | 0 (0.0%) | 0 (0.0%) |
| Total | 177 (96.2%) | 7 (3.8%) |
Educational Attainment by Field of Study in San Jose CDP Rio Arriba County
Business (36 | 32.4%), bio, nature & agricultural (23 | 20.7%), engineering (23 | 20.7%), visual & performing arts (18 | 16.2%), and computers & mathematics (6 | 5.4%) are the most common fields of study among 111 individuals in San Jose CDP Rio Arriba County who have obtained a bachelor's degree or higher.
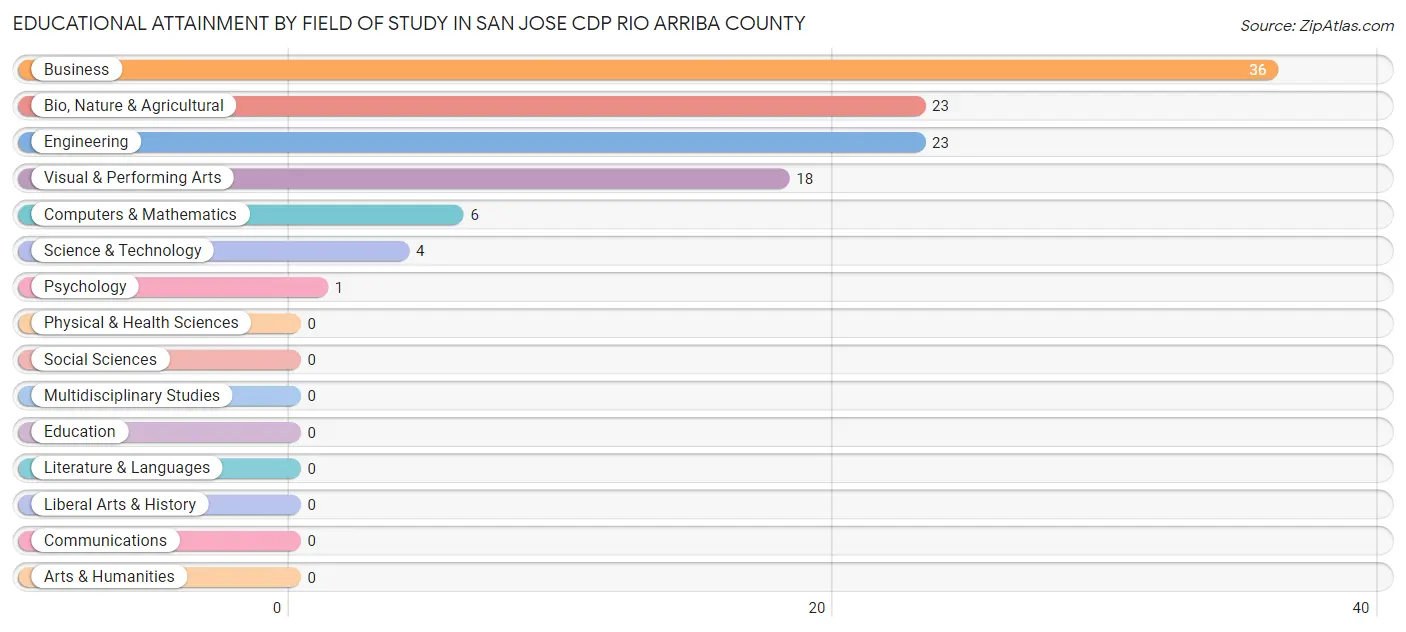
| Field of Study | # Graduates | % Graduates |
| Computers & Mathematics | 6 | 5.4% |
| Bio, Nature & Agricultural | 23 | 20.7% |
| Physical & Health Sciences | 0 | 0.0% |
| Psychology | 1 | 0.9% |
| Social Sciences | 0 | 0.0% |
| Engineering | 23 | 20.7% |
| Multidisciplinary Studies | 0 | 0.0% |
| Science & Technology | 4 | 3.6% |
| Business | 36 | 32.4% |
| Education | 0 | 0.0% |
| Literature & Languages | 0 | 0.0% |
| Liberal Arts & History | 0 | 0.0% |
| Visual & Performing Arts | 18 | 16.2% |
| Communications | 0 | 0.0% |
| Arts & Humanities | 0 | 0.0% |
| Total | 111 | 100.0% |
Transportation & Commute in San Jose CDP Rio Arriba County
Vehicle Availability by Sex in San Jose CDP Rio Arriba County
The most prevalent vehicle ownership categories in San Jose CDP Rio Arriba County are males with 5 or more vehicles (92, accounting for 40.9%) and females with 5 or more vehicles (40, making up 90.2%).
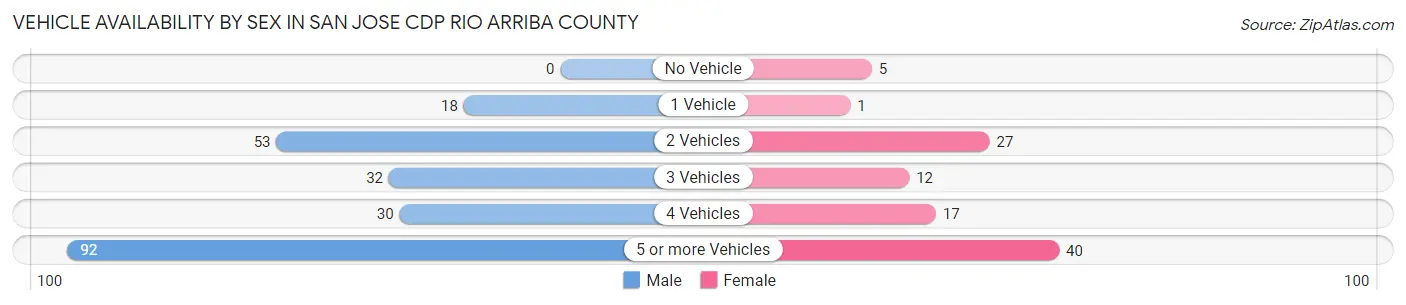
| Vehicles Available | Male | Female |
| No Vehicle | 0 (0.0%) | 5 (4.9%) |
| 1 Vehicle | 18 (8.0%) | 1 (1.0%) |
| 2 Vehicles | 53 (23.6%) | 27 (26.5%) |
| 3 Vehicles | 32 (14.2%) | 12 (11.8%) |
| 4 Vehicles | 30 (13.3%) | 17 (16.7%) |
| 5 or more Vehicles | 92 (40.9%) | 40 (39.2%) |
| Total | 225 (100.0%) | 102 (100.0%) |
Commute Time in San Jose CDP Rio Arriba County
The most frequently occuring commute durations in San Jose CDP Rio Arriba County are 40 to 44 minutes (64 commuters, 20.4%), 10 to 14 minutes (52 commuters, 16.6%), and 45 to 59 minutes (47 commuters, 15.0%).
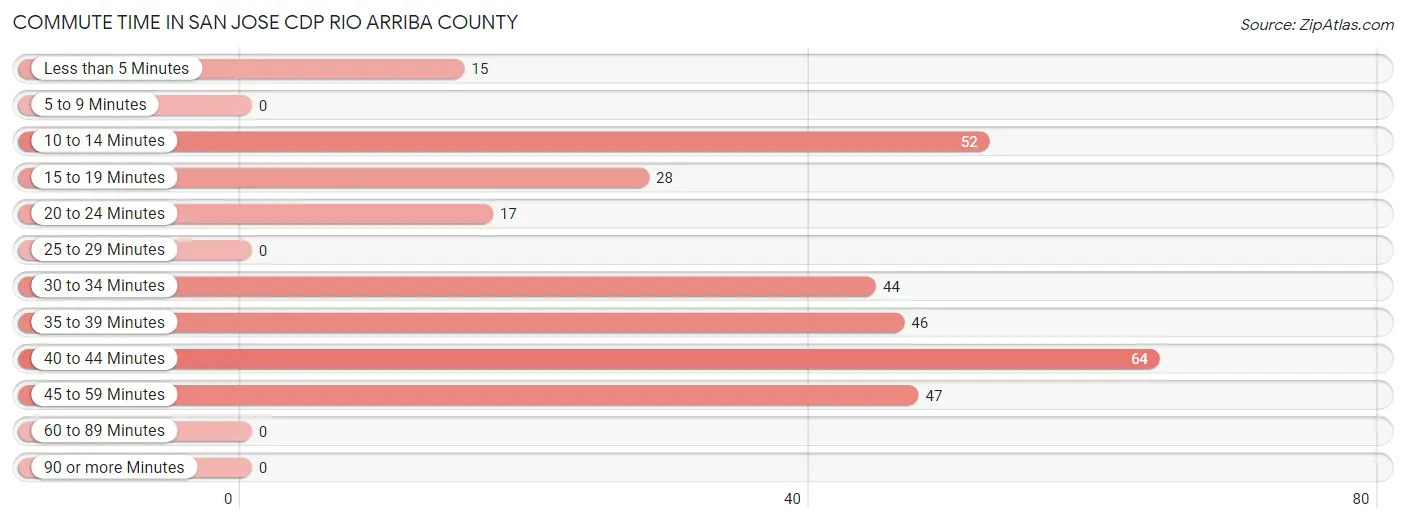
| Commute Time | # Commuters | % Commuters |
| Less than 5 Minutes | 15 | 4.8% |
| 5 to 9 Minutes | 0 | 0.0% |
| 10 to 14 Minutes | 52 | 16.6% |
| 15 to 19 Minutes | 28 | 8.9% |
| 20 to 24 Minutes | 17 | 5.4% |
| 25 to 29 Minutes | 0 | 0.0% |
| 30 to 34 Minutes | 44 | 14.1% |
| 35 to 39 Minutes | 46 | 14.7% |
| 40 to 44 Minutes | 64 | 20.4% |
| 45 to 59 Minutes | 47 | 15.0% |
| 60 to 89 Minutes | 0 | 0.0% |
| 90 or more Minutes | 0 | 0.0% |
Commute Time by Sex in San Jose CDP Rio Arriba County
The most common commute times in San Jose CDP Rio Arriba County are 40 to 44 minutes (52 commuters, 24.1%) for males and 10 to 14 minutes (29 commuters, 29.9%) for females.
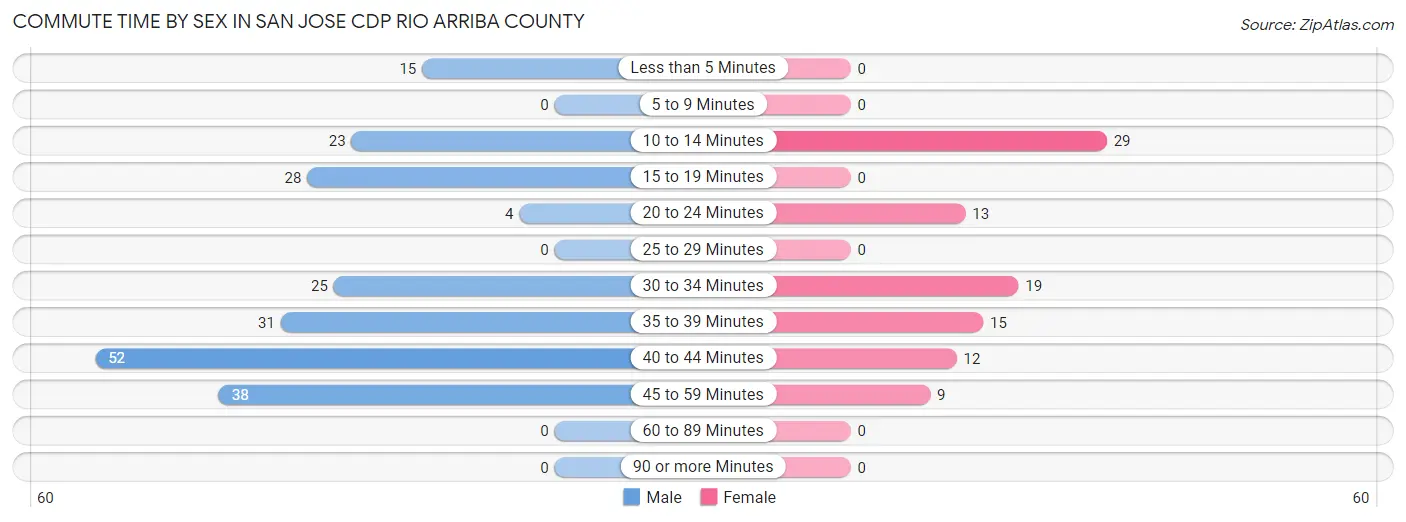
| Commute Time | Male | Female |
| Less than 5 Minutes | 15 (6.9%) | 0 (0.0%) |
| 5 to 9 Minutes | 0 (0.0%) | 0 (0.0%) |
| 10 to 14 Minutes | 23 (10.6%) | 29 (29.9%) |
| 15 to 19 Minutes | 28 (13.0%) | 0 (0.0%) |
| 20 to 24 Minutes | 4 (1.8%) | 13 (13.4%) |
| 25 to 29 Minutes | 0 (0.0%) | 0 (0.0%) |
| 30 to 34 Minutes | 25 (11.6%) | 19 (19.6%) |
| 35 to 39 Minutes | 31 (14.3%) | 15 (15.5%) |
| 40 to 44 Minutes | 52 (24.1%) | 12 (12.4%) |
| 45 to 59 Minutes | 38 (17.6%) | 9 (9.3%) |
| 60 to 89 Minutes | 0 (0.0%) | 0 (0.0%) |
| 90 or more Minutes | 0 (0.0%) | 0 (0.0%) |
Time of Departure to Work by Sex in San Jose CDP Rio Arriba County
The most frequent times of departure to work in San Jose CDP Rio Arriba County are 6:30 AM to 6:59 AM (58, 26.9%) for males and 8:00 AM to 8:29 AM (24, 24.7%) for females.
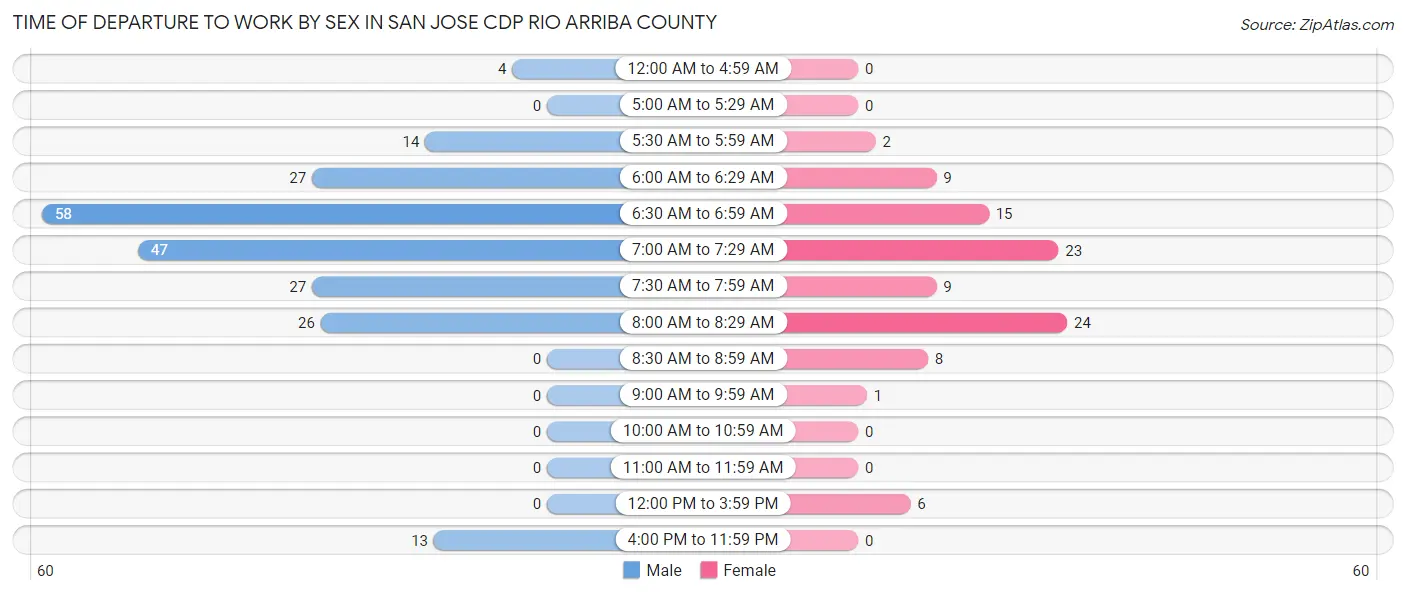
| Time of Departure | Male | Female |
| 12:00 AM to 4:59 AM | 4 (1.8%) | 0 (0.0%) |
| 5:00 AM to 5:29 AM | 0 (0.0%) | 0 (0.0%) |
| 5:30 AM to 5:59 AM | 14 (6.5%) | 2 (2.1%) |
| 6:00 AM to 6:29 AM | 27 (12.5%) | 9 (9.3%) |
| 6:30 AM to 6:59 AM | 58 (26.9%) | 15 (15.5%) |
| 7:00 AM to 7:29 AM | 47 (21.8%) | 23 (23.7%) |
| 7:30 AM to 7:59 AM | 27 (12.5%) | 9 (9.3%) |
| 8:00 AM to 8:29 AM | 26 (12.0%) | 24 (24.7%) |
| 8:30 AM to 8:59 AM | 0 (0.0%) | 8 (8.3%) |
| 9:00 AM to 9:59 AM | 0 (0.0%) | 1 (1.0%) |
| 10:00 AM to 10:59 AM | 0 (0.0%) | 0 (0.0%) |
| 11:00 AM to 11:59 AM | 0 (0.0%) | 0 (0.0%) |
| 12:00 PM to 3:59 PM | 0 (0.0%) | 6 (6.2%) |
| 4:00 PM to 11:59 PM | 13 (6.0%) | 0 (0.0%) |
| Total | 216 (100.0%) | 97 (100.0%) |
Housing Occupancy in San Jose CDP Rio Arriba County
Occupancy by Ownership in San Jose CDP Rio Arriba County
Of the total 252 dwellings in San Jose CDP Rio Arriba County, owner-occupied units account for 193 (76.6%), while renter-occupied units make up 59 (23.4%).
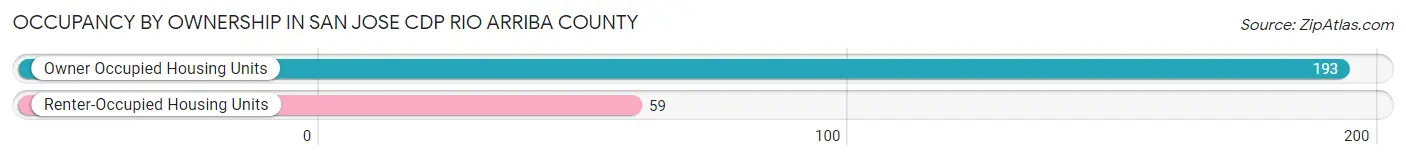
| Occupancy | # Housing Units | % Housing Units |
| Owner Occupied Housing Units | 193 | 76.6% |
| Renter-Occupied Housing Units | 59 | 23.4% |
| Total Occupied Housing Units | 252 | 100.0% |
Occupancy by Household Size in San Jose CDP Rio Arriba County
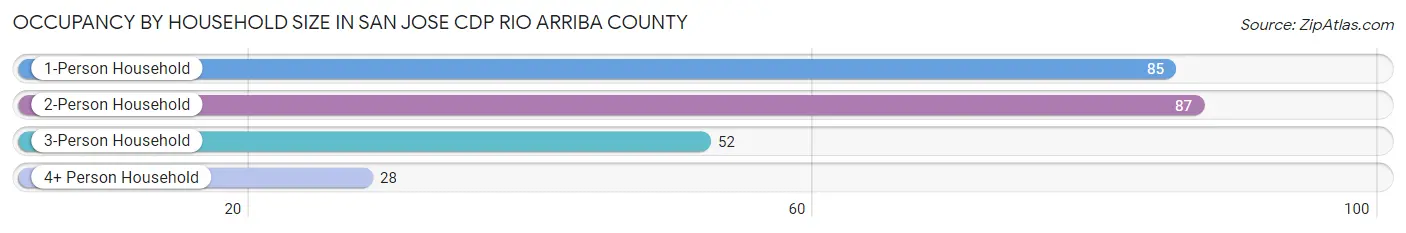
| Household Size | # Housing Units | % Housing Units |
| 1-Person Household | 85 | 33.7% |
| 2-Person Household | 87 | 34.5% |
| 3-Person Household | 52 | 20.6% |
| 4+ Person Household | 28 | 11.1% |
| Total Housing Units | 252 | 100.0% |
Occupancy by Ownership by Household Size in San Jose CDP Rio Arriba County
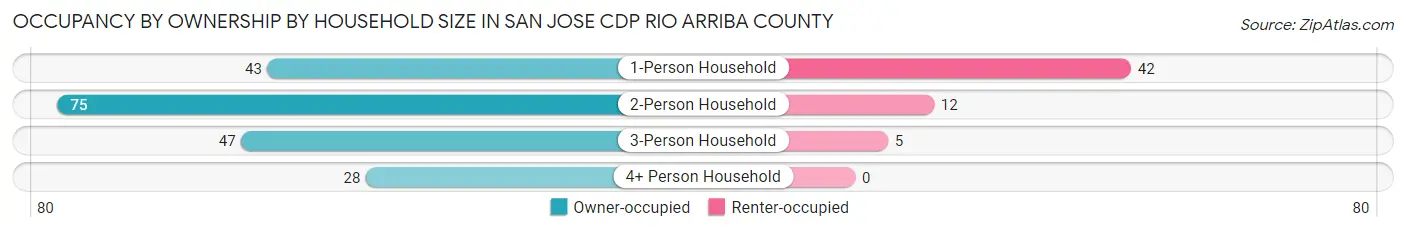
| Household Size | Owner-occupied | Renter-occupied |
| 1-Person Household | 43 (50.6%) | 42 (49.4%) |
| 2-Person Household | 75 (86.2%) | 12 (13.8%) |
| 3-Person Household | 47 (90.4%) | 5 (9.6%) |
| 4+ Person Household | 28 (100.0%) | 0 (0.0%) |
| Total Housing Units | 193 (76.6%) | 59 (23.4%) |
Occupancy by Educational Attainment in San Jose CDP Rio Arriba County
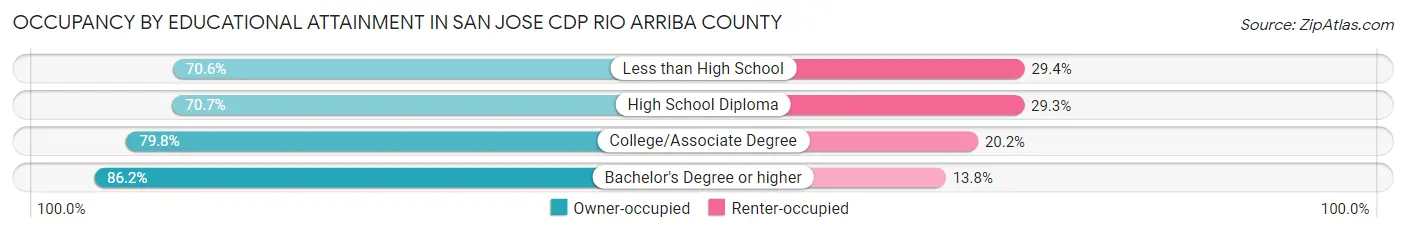
| Household Size | Owner-occupied | Renter-occupied |
| Less than High School | 36 (70.6%) | 15 (29.4%) |
| High School Diploma | 41 (70.7%) | 17 (29.3%) |
| College/Associate Degree | 91 (79.8%) | 23 (20.2%) |
| Bachelor's Degree or higher | 25 (86.2%) | 4 (13.8%) |
Occupancy by Age of Householder in San Jose CDP Rio Arriba County
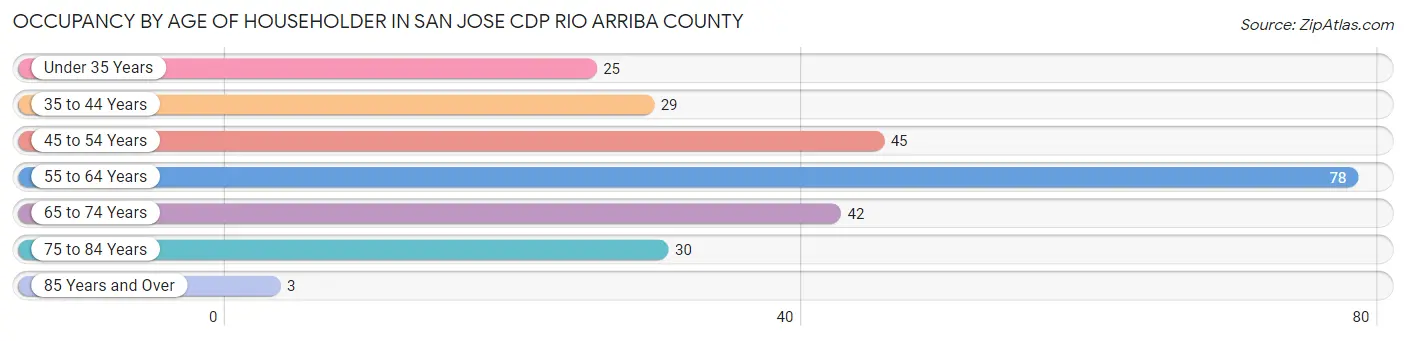
| Age Bracket | # Households | % Households |
| Under 35 Years | 25 | 9.9% |
| 35 to 44 Years | 29 | 11.5% |
| 45 to 54 Years | 45 | 17.9% |
| 55 to 64 Years | 78 | 30.9% |
| 65 to 74 Years | 42 | 16.7% |
| 75 to 84 Years | 30 | 11.9% |
| 85 Years and Over | 3 | 1.2% |
| Total | 252 | 100.0% |
Housing Finances in San Jose CDP Rio Arriba County
Median Income by Occupancy in San Jose CDP Rio Arriba County
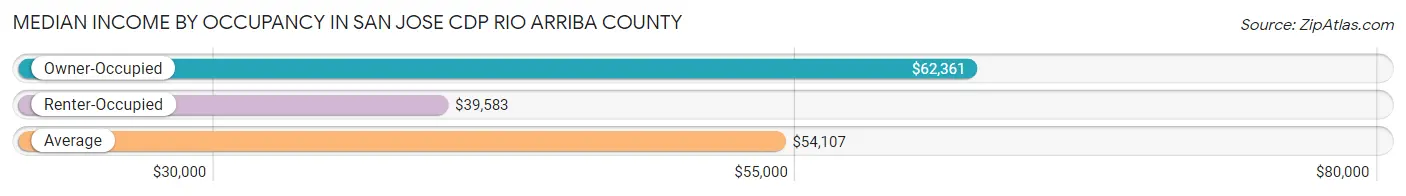
| Occupancy Type | # Households | Median Income |
| Owner-Occupied | 193 (76.6%) | $62,361 |
| Renter-Occupied | 59 (23.4%) | $39,583 |
| Average | 252 (100.0%) | $54,107 |
Occupancy by Householder Income Bracket in San Jose CDP Rio Arriba County
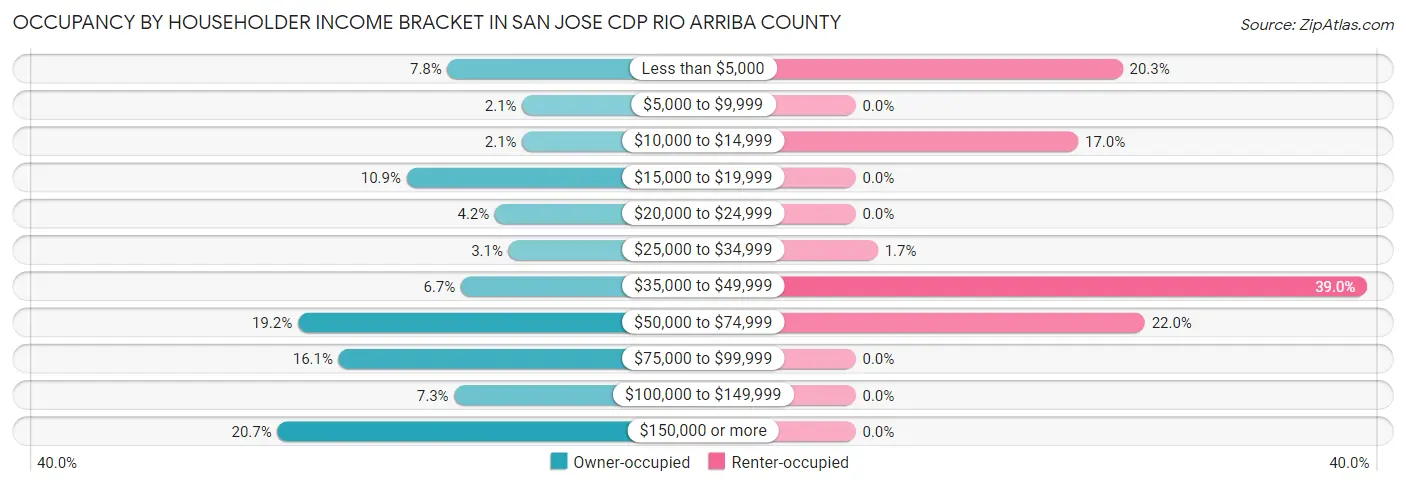
| Income Bracket | Owner-occupied | Renter-occupied |
| Less than $5,000 | 15 (7.8%) | 12 (20.3%) |
| $5,000 to $9,999 | 4 (2.1%) | 0 (0.0%) |
| $10,000 to $14,999 | 4 (2.1%) | 10 (17.0%) |
| $15,000 to $19,999 | 21 (10.9%) | 0 (0.0%) |
| $20,000 to $24,999 | 8 (4.2%) | 0 (0.0%) |
| $25,000 to $34,999 | 6 (3.1%) | 1 (1.7%) |
| $35,000 to $49,999 | 13 (6.7%) | 23 (39.0%) |
| $50,000 to $74,999 | 37 (19.2%) | 13 (22.0%) |
| $75,000 to $99,999 | 31 (16.1%) | 0 (0.0%) |
| $100,000 to $149,999 | 14 (7.2%) | 0 (0.0%) |
| $150,000 or more | 40 (20.7%) | 0 (0.0%) |
| Total | 193 (100.0%) | 59 (100.0%) |
Monthly Housing Cost Tiers in San Jose CDP Rio Arriba County

| Monthly Cost | Owner-occupied | Renter-occupied |
| Less than $300 | 65 (33.7%) | 3 (5.1%) |
| $300 to $499 | 47 (24.3%) | 0 (0.0%) |
| $500 to $799 | 16 (8.3%) | 22 (37.3%) |
| $800 to $999 | 0 (0.0%) | 16 (27.1%) |
| $1,000 to $1,499 | 39 (20.2%) | 14 (23.7%) |
| $1,500 to $1,999 | 14 (7.2%) | 0 (0.0%) |
| $2,000 to $2,499 | 10 (5.2%) | 0 (0.0%) |
| $2,500 to $2,999 | 2 (1.0%) | 0 (0.0%) |
| $3,000 or more | 0 (0.0%) | 0 (0.0%) |
| Total | 193 (100.0%) | 59 (100.0%) |
Physical Housing Characteristics in San Jose CDP Rio Arriba County
Housing Structures in San Jose CDP Rio Arriba County
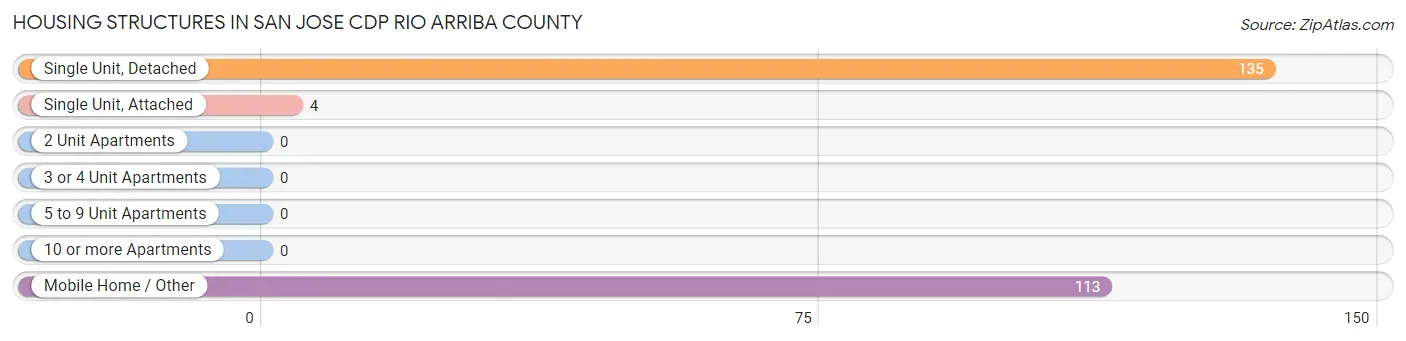
| Structure Type | # Housing Units | % Housing Units |
| Single Unit, Detached | 135 | 53.6% |
| Single Unit, Attached | 4 | 1.6% |
| 2 Unit Apartments | 0 | 0.0% |
| 3 or 4 Unit Apartments | 0 | 0.0% |
| 5 to 9 Unit Apartments | 0 | 0.0% |
| 10 or more Apartments | 0 | 0.0% |
| Mobile Home / Other | 113 | 44.8% |
| Total | 252 | 100.0% |
Housing Structures by Occupancy in San Jose CDP Rio Arriba County
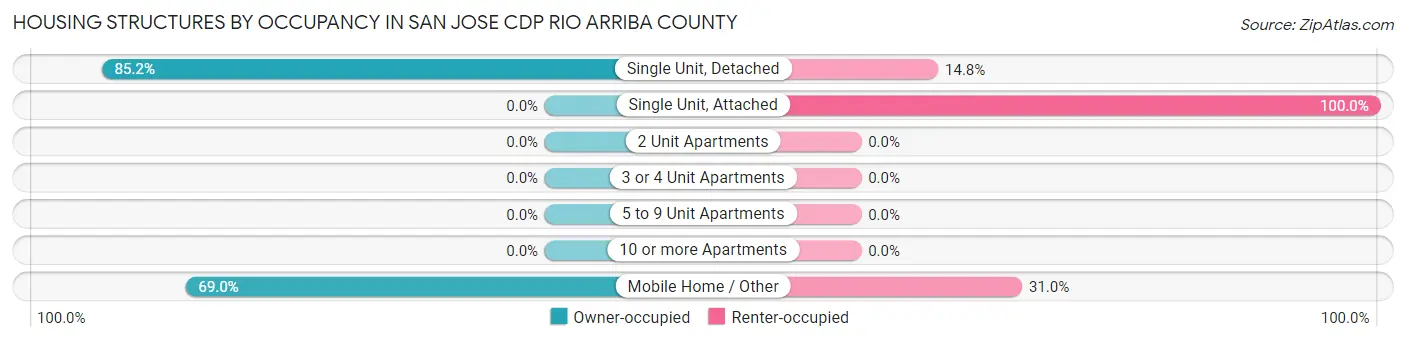
| Structure Type | Owner-occupied | Renter-occupied |
| Single Unit, Detached | 115 (85.2%) | 20 (14.8%) |
| Single Unit, Attached | 0 (0.0%) | 4 (100.0%) |
| 2 Unit Apartments | 0 (0.0%) | 0 (0.0%) |
| 3 or 4 Unit Apartments | 0 (0.0%) | 0 (0.0%) |
| 5 to 9 Unit Apartments | 0 (0.0%) | 0 (0.0%) |
| 10 or more Apartments | 0 (0.0%) | 0 (0.0%) |
| Mobile Home / Other | 78 (69.0%) | 35 (31.0%) |
| Total | 193 (76.6%) | 59 (23.4%) |
Housing Structures by Number of Rooms in San Jose CDP Rio Arriba County
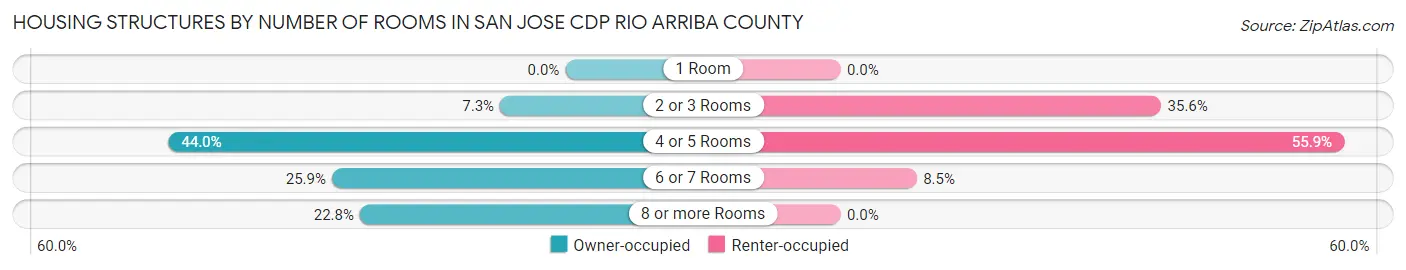
| Number of Rooms | Owner-occupied | Renter-occupied |
| 1 Room | 0 (0.0%) | 0 (0.0%) |
| 2 or 3 Rooms | 14 (7.2%) | 21 (35.6%) |
| 4 or 5 Rooms | 85 (44.0%) | 33 (55.9%) |
| 6 or 7 Rooms | 50 (25.9%) | 5 (8.5%) |
| 8 or more Rooms | 44 (22.8%) | 0 (0.0%) |
| Total | 193 (100.0%) | 59 (100.0%) |
Housing Structure by Heating Type in San Jose CDP Rio Arriba County
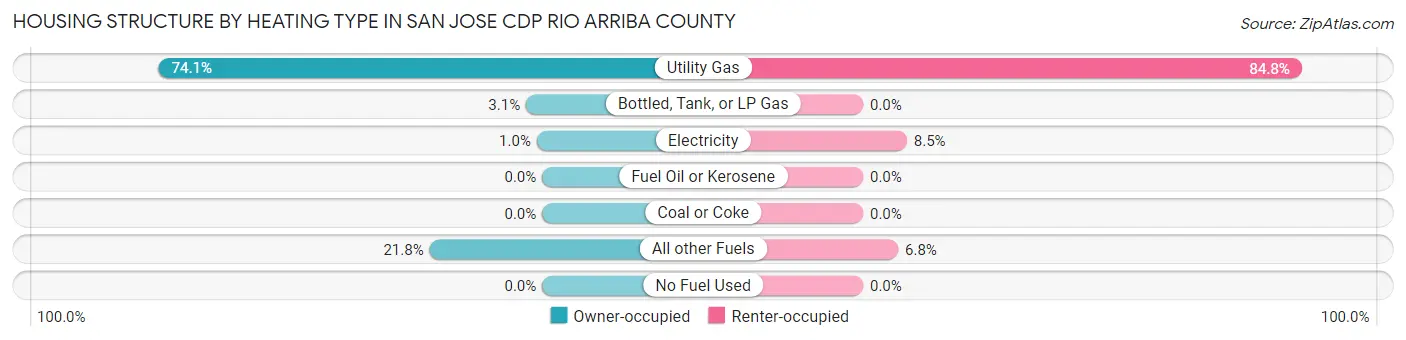
| Heating Type | Owner-occupied | Renter-occupied |
| Utility Gas | 143 (74.1%) | 50 (84.8%) |
| Bottled, Tank, or LP Gas | 6 (3.1%) | 0 (0.0%) |
| Electricity | 2 (1.0%) | 5 (8.5%) |
| Fuel Oil or Kerosene | 0 (0.0%) | 0 (0.0%) |
| Coal or Coke | 0 (0.0%) | 0 (0.0%) |
| All other Fuels | 42 (21.8%) | 4 (6.8%) |
| No Fuel Used | 0 (0.0%) | 0 (0.0%) |
| Total | 193 (100.0%) | 59 (100.0%) |
Household Vehicle Usage in San Jose CDP Rio Arriba County
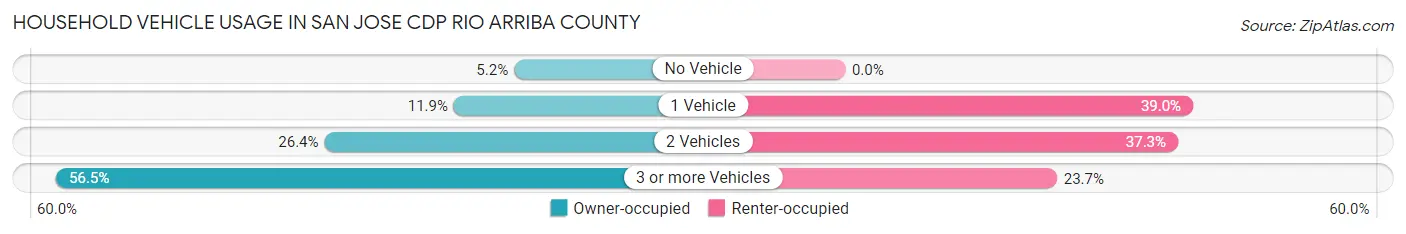
| Vehicles per Household | Owner-occupied | Renter-occupied |
| No Vehicle | 10 (5.2%) | 0 (0.0%) |
| 1 Vehicle | 23 (11.9%) | 23 (39.0%) |
| 2 Vehicles | 51 (26.4%) | 22 (37.3%) |
| 3 or more Vehicles | 109 (56.5%) | 14 (23.7%) |
| Total | 193 (100.0%) | 59 (100.0%) |
Real Estate & Mortgages in San Jose CDP Rio Arriba County
Real Estate and Mortgage Overview in San Jose CDP Rio Arriba County
| Characteristic | Without Mortgage | With Mortgage |
| Housing Units | 125 | 68 |
| Median Property Value | $243,800 | $208,900 |
| Median Household Income | $55,179 | $10 |
| Monthly Housing Costs | $293 | $0 |
| Real Estate Taxes | $762 | $9 |
Property Value by Mortgage Status in San Jose CDP Rio Arriba County
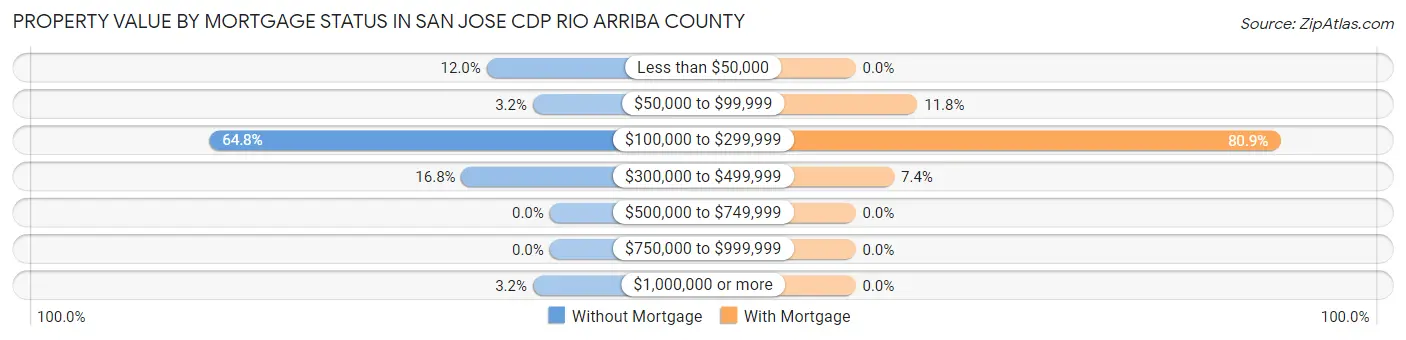
| Property Value | Without Mortgage | With Mortgage |
| Less than $50,000 | 15 (12.0%) | 0 (0.0%) |
| $50,000 to $99,999 | 4 (3.2%) | 8 (11.8%) |
| $100,000 to $299,999 | 81 (64.8%) | 55 (80.9%) |
| $300,000 to $499,999 | 21 (16.8%) | 5 (7.3%) |
| $500,000 to $749,999 | 0 (0.0%) | 0 (0.0%) |
| $750,000 to $999,999 | 0 (0.0%) | 0 (0.0%) |
| $1,000,000 or more | 4 (3.2%) | 0 (0.0%) |
| Total | 125 (100.0%) | 68 (100.0%) |
Household Income by Mortgage Status in San Jose CDP Rio Arriba County
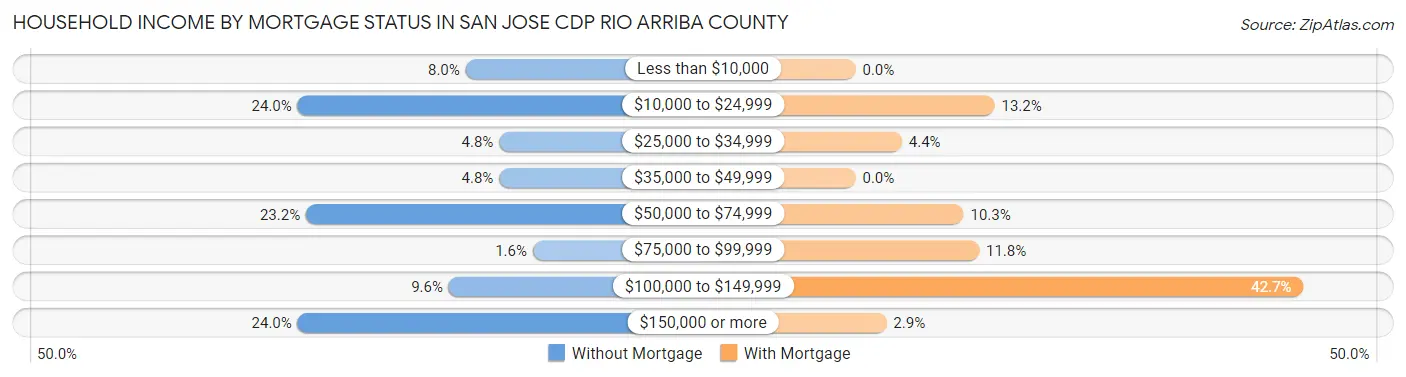
| Household Income | Without Mortgage | With Mortgage |
| Less than $10,000 | 10 (8.0%) | 0 (0.0%) |
| $10,000 to $24,999 | 30 (24.0%) | 9 (13.2%) |
| $25,000 to $34,999 | 6 (4.8%) | 3 (4.4%) |
| $35,000 to $49,999 | 6 (4.8%) | 0 (0.0%) |
| $50,000 to $74,999 | 29 (23.2%) | 7 (10.3%) |
| $75,000 to $99,999 | 2 (1.6%) | 8 (11.8%) |
| $100,000 to $149,999 | 12 (9.6%) | 29 (42.6%) |
| $150,000 or more | 30 (24.0%) | 2 (2.9%) |
| Total | 125 (100.0%) | 68 (100.0%) |
Property Value to Household Income Ratio in San Jose CDP Rio Arriba County
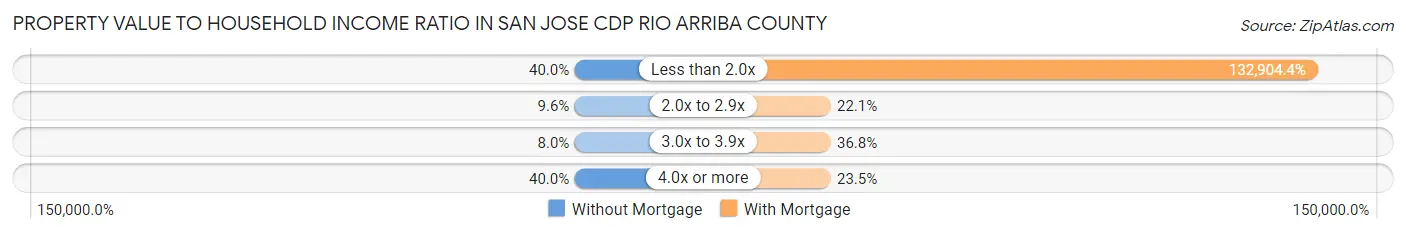
| Value-to-Income Ratio | Without Mortgage | With Mortgage |
| Less than 2.0x | 50 (40.0%) | 90,375 (132,904.4%) |
| 2.0x to 2.9x | 12 (9.6%) | 15 (22.1%) |
| 3.0x to 3.9x | 10 (8.0%) | 25 (36.8%) |
| 4.0x or more | 50 (40.0%) | 16 (23.5%) |
| Total | 125 (100.0%) | 68 (100.0%) |
Real Estate Taxes by Mortgage Status in San Jose CDP Rio Arriba County
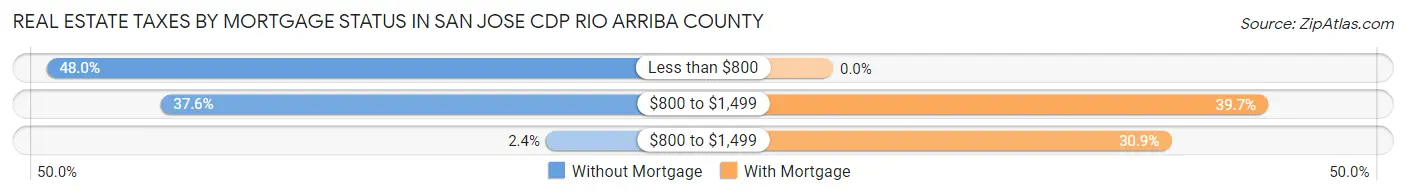
| Property Taxes | Without Mortgage | With Mortgage |
| Less than $800 | 60 (48.0%) | 0 (0.0%) |
| $800 to $1,499 | 47 (37.6%) | 27 (39.7%) |
| $800 to $1,499 | 3 (2.4%) | 21 (30.9%) |
| Total | 125 (100.0%) | 68 (100.0%) |
Health & Disability in San Jose CDP Rio Arriba County
Health Insurance Coverage by Age in San Jose CDP Rio Arriba County
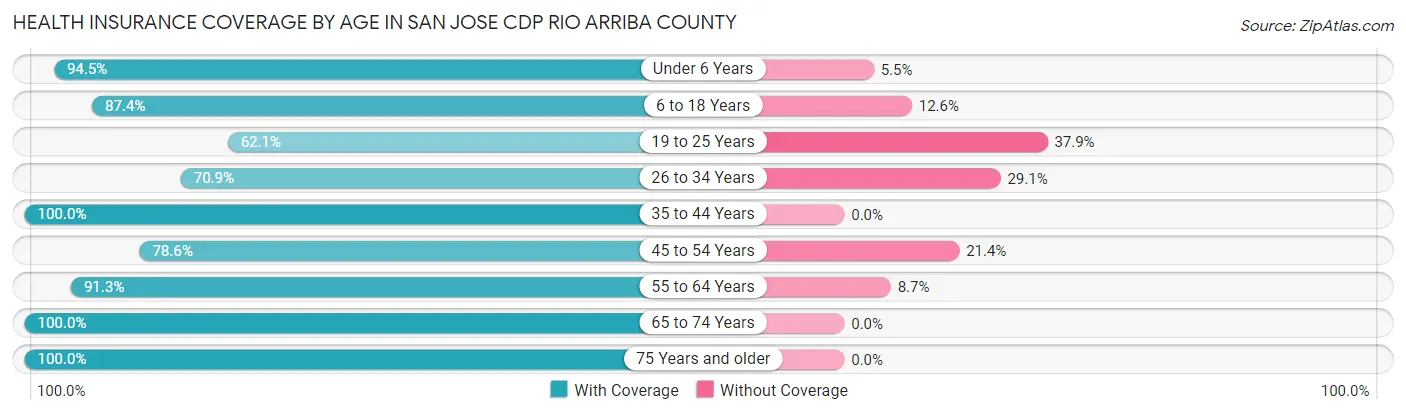
| Age Bracket | With Coverage | Without Coverage |
| Under 6 Years | 69 (94.5%) | 4 (5.5%) |
| 6 to 18 Years | 118 (87.4%) | 17 (12.6%) |
| 19 to 25 Years | 41 (62.1%) | 25 (37.9%) |
| 26 to 34 Years | 90 (70.9%) | 37 (29.1%) |
| 35 to 44 Years | 136 (100.0%) | 0 (0.0%) |
| 45 to 54 Years | 66 (78.6%) | 18 (21.4%) |
| 55 to 64 Years | 116 (91.3%) | 11 (8.7%) |
| 65 to 74 Years | 51 (100.0%) | 0 (0.0%) |
| 75 Years and older | 46 (100.0%) | 0 (0.0%) |
| Total | 733 (86.8%) | 112 (13.3%) |
Health Insurance Coverage by Citizenship Status in San Jose CDP Rio Arriba County
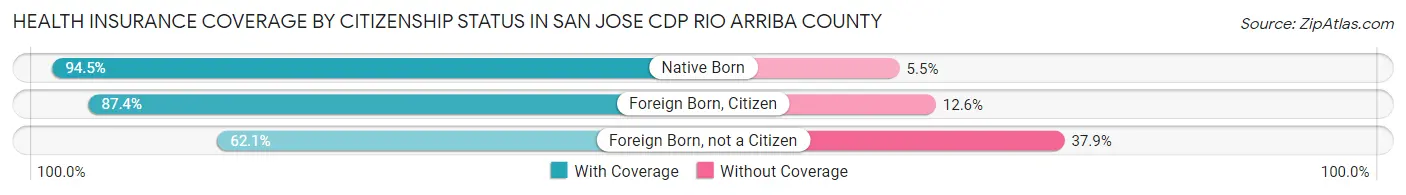
| Citizenship Status | With Coverage | Without Coverage |
| Native Born | 69 (94.5%) | 4 (5.5%) |
| Foreign Born, Citizen | 118 (87.4%) | 17 (12.6%) |
| Foreign Born, not a Citizen | 41 (62.1%) | 25 (37.9%) |
Health Insurance Coverage by Household Income in San Jose CDP Rio Arriba County
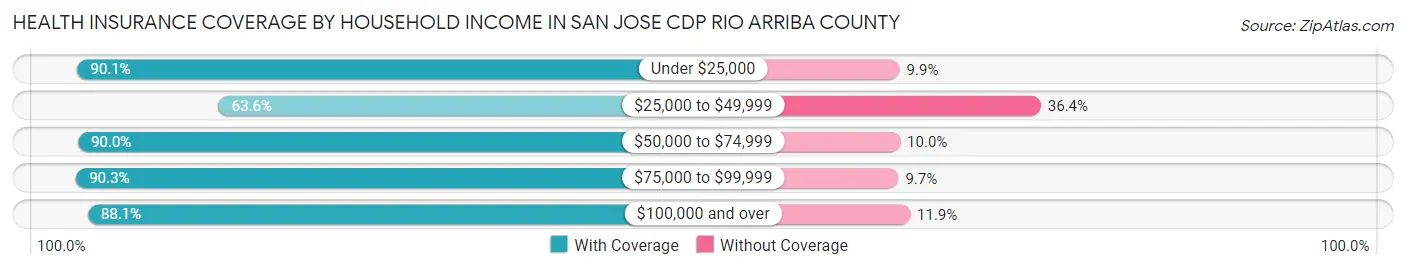
| Household Income | With Coverage | Without Coverage |
| Under $25,000 | 173 (90.1%) | 19 (9.9%) |
| $25,000 to $49,999 | 56 (63.6%) | 32 (36.4%) |
| $50,000 to $74,999 | 225 (90.0%) | 25 (10.0%) |
| $75,000 to $99,999 | 56 (90.3%) | 6 (9.7%) |
| $100,000 and over | 223 (88.1%) | 30 (11.9%) |
Public vs Private Health Insurance Coverage by Age in San Jose CDP Rio Arriba County
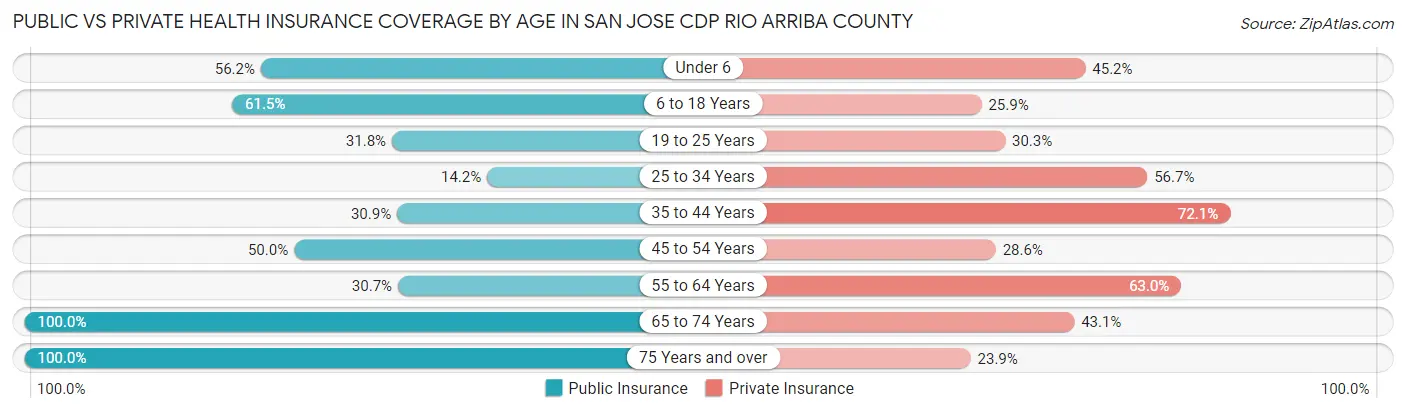
| Age Bracket | Public Insurance | Private Insurance |
| Under 6 | 41 (56.2%) | 33 (45.2%) |
| 6 to 18 Years | 83 (61.5%) | 35 (25.9%) |
| 19 to 25 Years | 21 (31.8%) | 20 (30.3%) |
| 25 to 34 Years | 18 (14.2%) | 72 (56.7%) |
| 35 to 44 Years | 42 (30.9%) | 98 (72.1%) |
| 45 to 54 Years | 42 (50.0%) | 24 (28.6%) |
| 55 to 64 Years | 39 (30.7%) | 80 (63.0%) |
| 65 to 74 Years | 51 (100.0%) | 22 (43.1%) |
| 75 Years and over | 46 (100.0%) | 11 (23.9%) |
| Total | 383 (45.3%) | 395 (46.8%) |
Disability Status by Sex by Age in San Jose CDP Rio Arriba County
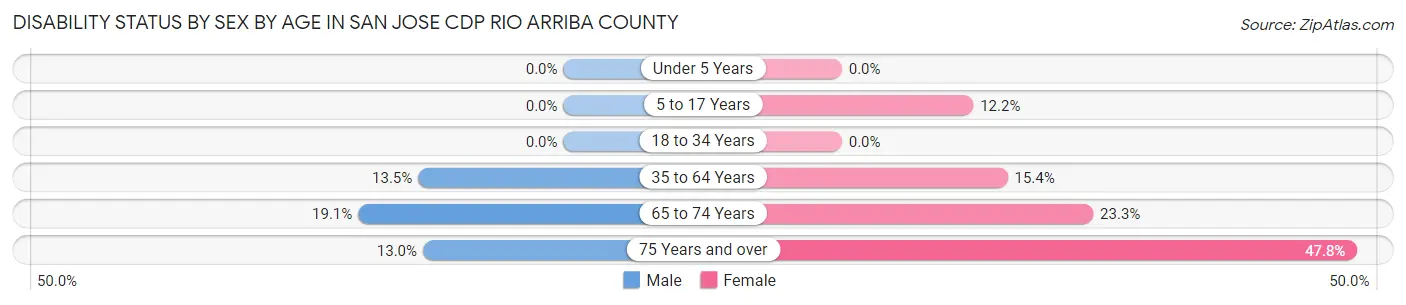
| Age Bracket | Male | Female |
| Under 5 Years | 0 (0.0%) | 0 (0.0%) |
| 5 to 17 Years | 0 (0.0%) | 5 (12.2%) |
| 18 to 34 Years | 0 (0.0%) | 0 (0.0%) |
| 35 to 64 Years | 31 (13.5%) | 18 (15.4%) |
| 65 to 74 Years | 4 (19.1%) | 7 (23.3%) |
| 75 Years and over | 3 (13.0%) | 11 (47.8%) |
Disability Class by Sex by Age in San Jose CDP Rio Arriba County
Disability Class: Hearing Difficulty
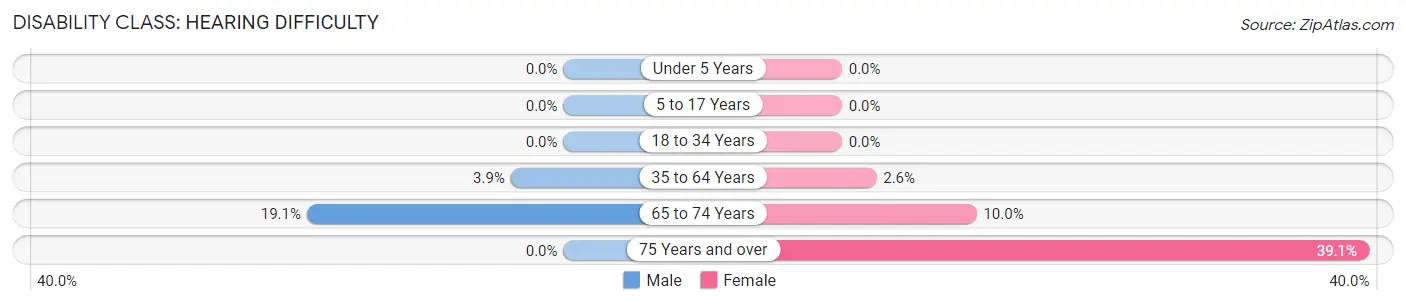
| Age Bracket | Male | Female |
| Under 5 Years | 0 (0.0%) | 0 (0.0%) |
| 5 to 17 Years | 0 (0.0%) | 0 (0.0%) |
| 18 to 34 Years | 0 (0.0%) | 0 (0.0%) |
| 35 to 64 Years | 9 (3.9%) | 3 (2.6%) |
| 65 to 74 Years | 4 (19.1%) | 3 (10.0%) |
| 75 Years and over | 0 (0.0%) | 9 (39.1%) |
Disability Class: Vision Difficulty
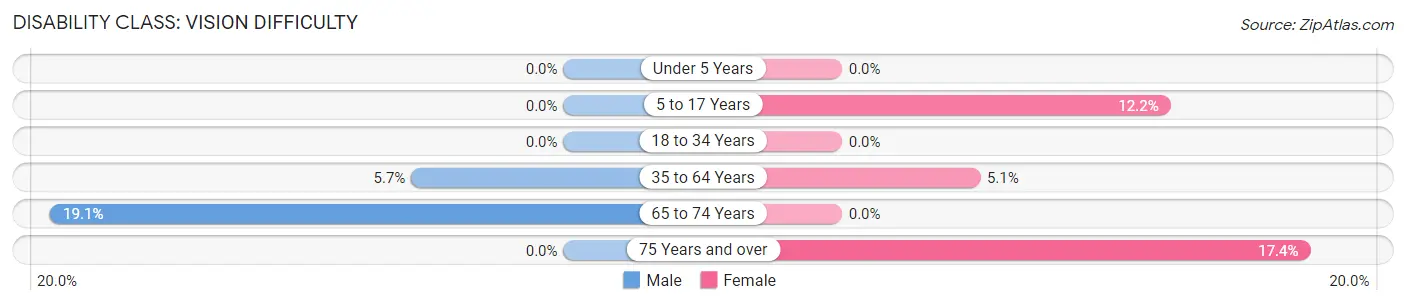
| Age Bracket | Male | Female |
| Under 5 Years | 0 (0.0%) | 0 (0.0%) |
| 5 to 17 Years | 0 (0.0%) | 5 (12.2%) |
| 18 to 34 Years | 0 (0.0%) | 0 (0.0%) |
| 35 to 64 Years | 13 (5.7%) | 6 (5.1%) |
| 65 to 74 Years | 4 (19.1%) | 0 (0.0%) |
| 75 Years and over | 0 (0.0%) | 4 (17.4%) |
Disability Class: Cognitive Difficulty
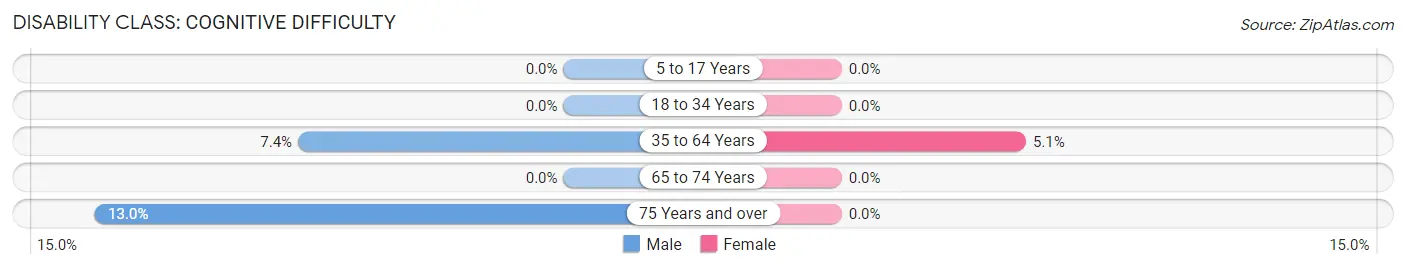
| Age Bracket | Male | Female |
| 5 to 17 Years | 0 (0.0%) | 0 (0.0%) |
| 18 to 34 Years | 0 (0.0%) | 0 (0.0%) |
| 35 to 64 Years | 17 (7.4%) | 6 (5.1%) |
| 65 to 74 Years | 0 (0.0%) | 0 (0.0%) |
| 75 Years and over | 3 (13.0%) | 0 (0.0%) |
Disability Class: Ambulatory Difficulty
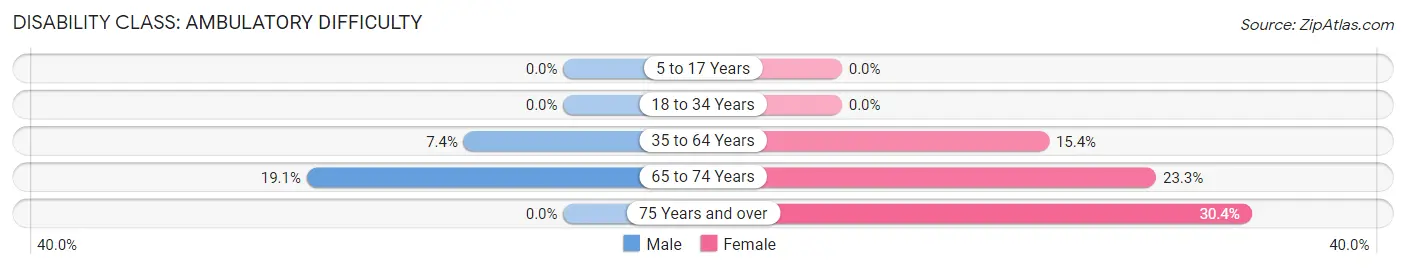
| Age Bracket | Male | Female |
| 5 to 17 Years | 0 (0.0%) | 0 (0.0%) |
| 18 to 34 Years | 0 (0.0%) | 0 (0.0%) |
| 35 to 64 Years | 17 (7.4%) | 18 (15.4%) |
| 65 to 74 Years | 4 (19.1%) | 7 (23.3%) |
| 75 Years and over | 0 (0.0%) | 7 (30.4%) |
Disability Class: Self-Care Difficulty
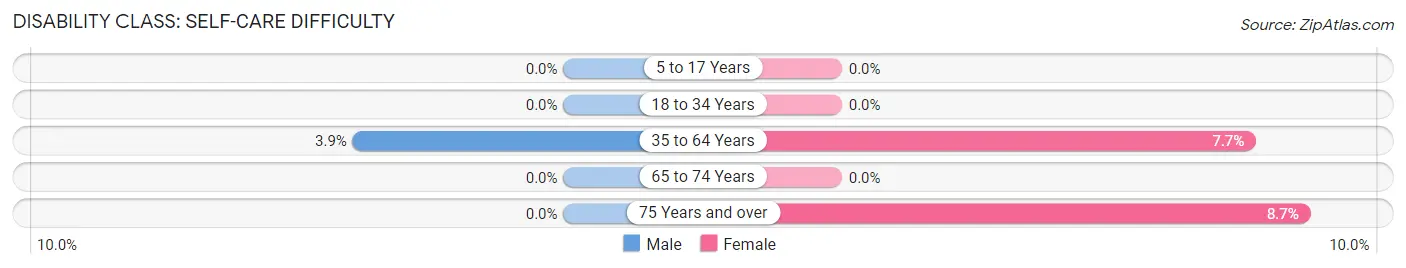
| Age Bracket | Male | Female |
| 5 to 17 Years | 0 (0.0%) | 0 (0.0%) |
| 18 to 34 Years | 0 (0.0%) | 0 (0.0%) |
| 35 to 64 Years | 9 (3.9%) | 9 (7.7%) |
| 65 to 74 Years | 0 (0.0%) | 0 (0.0%) |
| 75 Years and over | 0 (0.0%) | 2 (8.7%) |
Technology Access in San Jose CDP Rio Arriba County
Computing Device Access in San Jose CDP Rio Arriba County
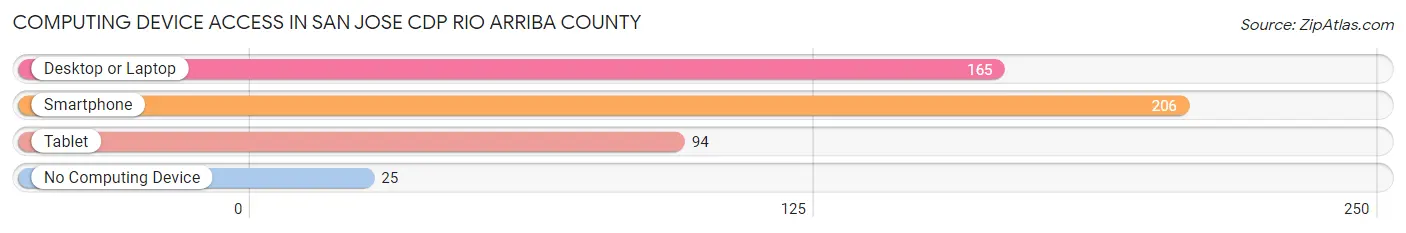
| Device Type | # Households | % Households |
| Desktop or Laptop | 165 | 65.5% |
| Smartphone | 206 | 81.8% |
| Tablet | 94 | 37.3% |
| No Computing Device | 25 | 9.9% |
| Total | 252 | 100.0% |
Internet Access in San Jose CDP Rio Arriba County
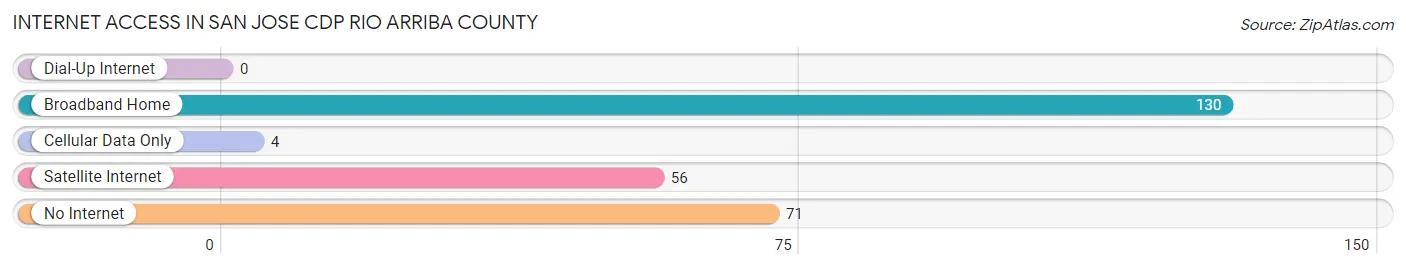
| Internet Type | # Households | % Households |
| Dial-Up Internet | 0 | 0.0% |
| Broadband Home | 130 | 51.6% |
| Cellular Data Only | 4 | 1.6% |
| Satellite Internet | 56 | 22.2% |
| No Internet | 71 | 28.2% |
| Total | 252 | 100.0% |
San Jose CDP Rio Arriba County Summary
San Jose Cdp is a census-designated place (CDP) located in Rio Arriba County, New Mexico. It is situated in the northern part of the state, approximately 25 miles north of Santa Fe. The CDP has a total area of 0.7 square miles, all of which is land. As of the 2010 census, the population of San Jose Cdp was 1,845.
Geography
San Jose Cdp is located in the northern part of Rio Arriba County, New Mexico. It is situated at an elevation of 6,845 feet above sea level. The CDP is located approximately 25 miles north of Santa Fe and is bordered by the towns of Abiquiu and Ojo Caliente. The CDP is situated in a semi-arid climate, with hot summers and cold winters. The average annual precipitation is approximately 12 inches.
The terrain of San Jose Cdp is mostly flat, with some rolling hills. The CDP is located in the Rio Chama Valley, which is part of the Rio Grande Basin. The Rio Chama River runs through the CDP, providing a source of water for the area.
History
San Jose Cdp was first settled in the late 1800s by Spanish settlers. The area was originally part of the Spanish land grant of Abiquiu. The CDP was named after San Jose de Abiquiu, a nearby mission established by the Spanish in 1760.
The CDP was officially established in 1910, when the U.S. Census Bureau designated it as a census-designated place. The population of San Jose Cdp has remained relatively stable since then, with a slight increase in the 2000s.
Economy
The economy of San Jose Cdp is largely based on agriculture and tourism. The CDP is home to several farms and ranches, which produce a variety of crops, including alfalfa, hay, and corn. The CDP is also home to several tourist attractions, including the Abiquiu Lake, the Rio Chama River, and the nearby Ghost Ranch.
The CDP is also home to several small businesses, including restaurants, convenience stores, and gas stations. The CDP is served by the Abiquiu Post Office and is located on the main highway between Santa Fe and Taos.
Demographics
As of the 2010 census, the population of San Jose Cdp was 1,845. The racial makeup of the CDP was 94.3% White, 0.3% African American, 0.7% Native American, 0.2% Asian, 0.1% Pacific Islander, 2.7% from other races, and 1.9% from two or more races. Hispanic or Latino of any race were 8.3% of the population.
The median household income in San Jose Cdp was $30,938, and the median family income was $35,625. The per capita income for the CDP was $14,945. About 17.3% of the population was below the poverty line.
The CDP is served by the Abiquiu Post Office and is located in the Abiquiu School District. The CDP is also home to several churches, including the San Jose de Abiquiu Catholic Church.
Common Questions
What is Per Capita Income in San Jose CDP Rio Arriba County?
Per Capita income in San Jose CDP Rio Arriba County is $27,580.
What is the Median Family Income in San Jose CDP Rio Arriba County?
Median Family Income in San Jose CDP Rio Arriba County is $85,625.
What is the Median Household income in San Jose CDP Rio Arriba County?
Median Household Income in San Jose CDP Rio Arriba County is $54,107.
What is Income or Wage Gap in San Jose CDP Rio Arriba County?
Income or Wage Gap in San Jose CDP Rio Arriba County is 34.4%.
Women in San Jose CDP Rio Arriba County earn 65.6 cents for every dollar earned by a man.
What is Inequality or Gini Index in San Jose CDP Rio Arriba County?
Inequality or Gini Index in San Jose CDP Rio Arriba County is 0.50.
What is the Total Population of San Jose CDP Rio Arriba County?
Total Population of San Jose CDP Rio Arriba County is 845.
What is the Total Male Population of San Jose CDP Rio Arriba County?
Total Male Population of San Jose CDP Rio Arriba County is 532.
What is the Total Female Population of San Jose CDP Rio Arriba County?
Total Female Population of San Jose CDP Rio Arriba County is 313.
What is the Ratio of Males per 100 Females in San Jose CDP Rio Arriba County?
There are 169.97 Males per 100 Females in San Jose CDP Rio Arriba County.
What is the Ratio of Females per 100 Males in San Jose CDP Rio Arriba County?
There are 58.83 Females per 100 Males in San Jose CDP Rio Arriba County.
What is the Median Population Age in San Jose CDP Rio Arriba County?
Median Population Age in San Jose CDP Rio Arriba County is 35.6 Years.
What is the Average Family Size in San Jose CDP Rio Arriba County
Average Family Size in San Jose CDP Rio Arriba County is 4.7 People.
What is the Average Household Size in San Jose CDP Rio Arriba County
Average Household Size in San Jose CDP Rio Arriba County is 3.4 People.
How Large is the Labor Force in San Jose CDP Rio Arriba County?
There are 353 People in the Labor Forcein in San Jose CDP Rio Arriba County.
What is the Percentage of People in the Labor Force in San Jose CDP Rio Arriba County?
52.1% of People are in the Labor Force in San Jose CDP Rio Arriba County.
What is the Unemployment Rate in San Jose CDP Rio Arriba County?
Unemployment Rate in San Jose CDP Rio Arriba County is 7.4%.