Taunton, MN Map & Demographics
Taunton Map
Taunton Overview
$29,685
PER CAPITA INCOME
$66,250
AVG FAMILY INCOME
$50,893
AVG HOUSEHOLD INCOME
1.8%
WAGE / INCOME GAP [ % ]
98.2¢/ $1
WAGE / INCOME GAP [ $ ]
0.40
INEQUALITY / GINI INDEX
169
TOTAL POPULATION
87
MALE POPULATION
82
FEMALE POPULATION
106.10
MALES / 100 FEMALES
94.25
FEMALES / 100 MALES
42.6
MEDIAN AGE
3.0
AVG FAMILY SIZE
2.1
AVG HOUSEHOLD SIZE
115
LABOR FORCE [ PEOPLE ]
79.9%
PERCENT IN LABOR FORCE
0.9%
UNEMPLOYMENT RATE
Taunton Zip Codes
Taunton Area Codes
Income in Taunton
Income Overview in Taunton
Per Capita Income in Taunton is $29,685, while median incomes of families and households are $66,250 and $50,893 respectively.
| Characteristic | Number | Measure |
| Per Capita Income | 169 | $29,685 |
| Median Family Income | 42 | $66,250 |
| Mean Family Income | 42 | $81,490 |
| Median Household Income | 81 | $50,893 |
| Mean Household Income | 81 | $62,126 |
| Income Deficit | 42 | $0 |
| Wage / Income Gap (%) | 169 | 1.83% |
| Wage / Income Gap ($) | 169 | 98.17¢ per $1 |
| Gini / Inequality Index | 169 | 0.40 |
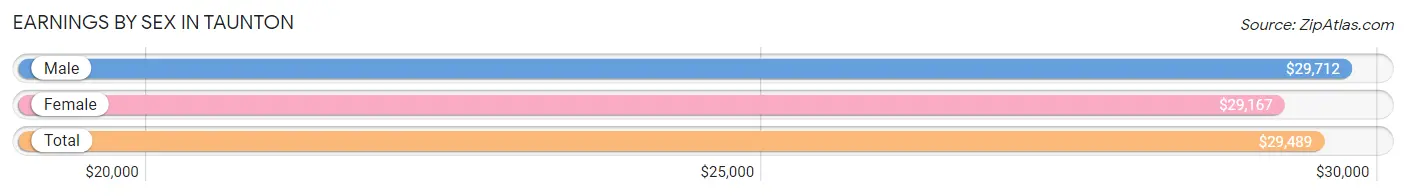
Earnings by Sex in Taunton
Average Earnings in Taunton are $29,489, $29,712 for men and $29,167 for women, a difference of 1.8%.
| Sex | Number | Average Earnings |
| Male | 73 (60.3%) | $29,712 |
| Female | 48 (39.7%) | $29,167 |
| Total | 121 (100.0%) | $29,489 |
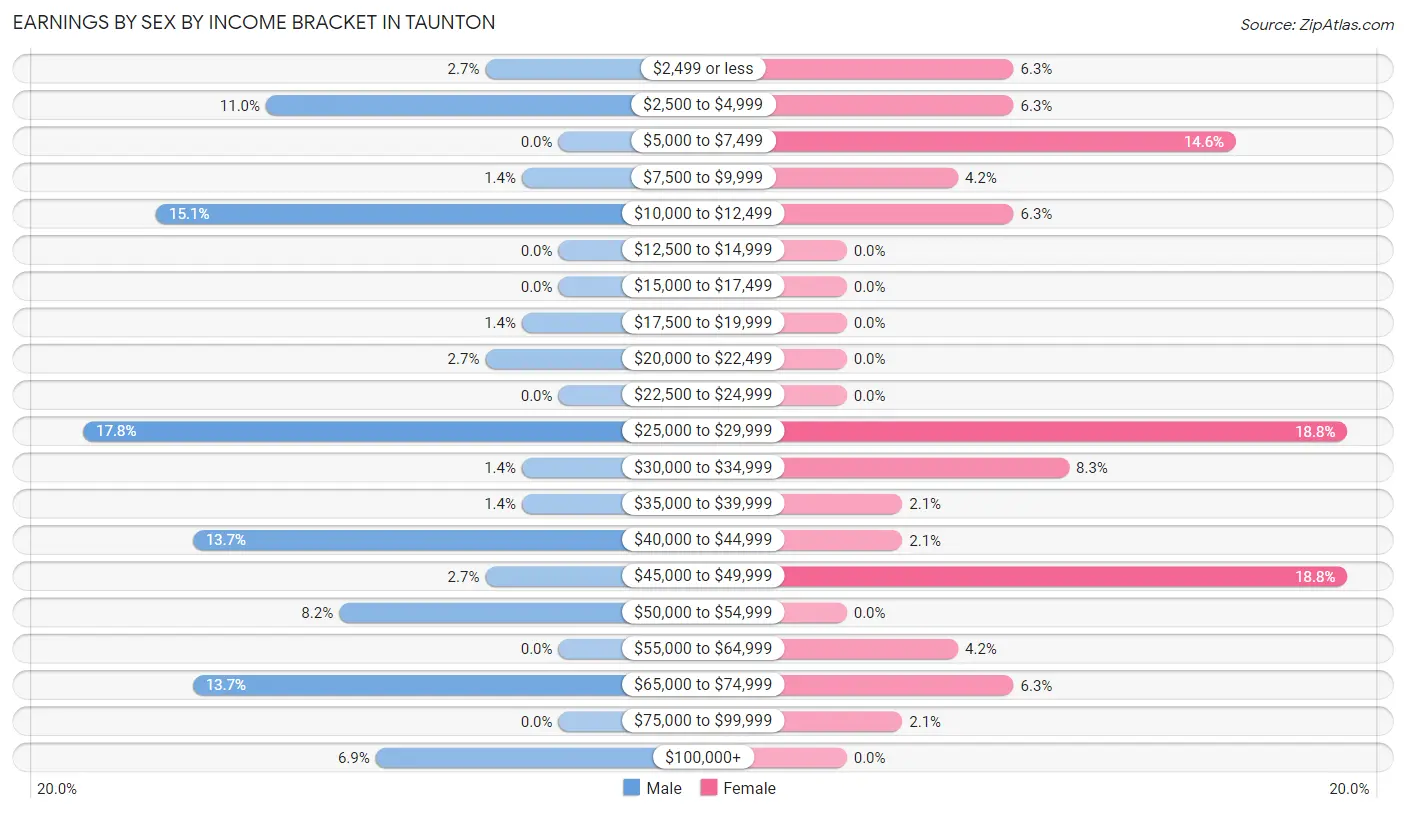
Earnings by Sex by Income Bracket in Taunton
The most common earnings brackets in Taunton are $25,000 to $29,999 for men (13 | 17.8%) and $25,000 to $29,999 for women (9 | 18.8%).
| Income | Male | Female |
| $2,499 or less | 2 (2.7%) | 3 (6.2%) |
| $2,500 to $4,999 | 8 (11.0%) | 3 (6.2%) |
| $5,000 to $7,499 | 0 (0.0%) | 7 (14.6%) |
| $7,500 to $9,999 | 1 (1.4%) | 2 (4.2%) |
| $10,000 to $12,499 | 11 (15.1%) | 3 (6.2%) |
| $12,500 to $14,999 | 0 (0.0%) | 0 (0.0%) |
| $15,000 to $17,499 | 0 (0.0%) | 0 (0.0%) |
| $17,500 to $19,999 | 1 (1.4%) | 0 (0.0%) |
| $20,000 to $22,499 | 2 (2.7%) | 0 (0.0%) |
| $22,500 to $24,999 | 0 (0.0%) | 0 (0.0%) |
| $25,000 to $29,999 | 13 (17.8%) | 9 (18.8%) |
| $30,000 to $34,999 | 1 (1.4%) | 4 (8.3%) |
| $35,000 to $39,999 | 1 (1.4%) | 1 (2.1%) |
| $40,000 to $44,999 | 10 (13.7%) | 1 (2.1%) |
| $45,000 to $49,999 | 2 (2.7%) | 9 (18.8%) |
| $50,000 to $54,999 | 6 (8.2%) | 0 (0.0%) |
| $55,000 to $64,999 | 0 (0.0%) | 2 (4.2%) |
| $65,000 to $74,999 | 10 (13.7%) | 3 (6.2%) |
| $75,000 to $99,999 | 0 (0.0%) | 1 (2.1%) |
| $100,000+ | 5 (6.9%) | 0 (0.0%) |
| Total | 73 (100.0%) | 48 (100.0%) |
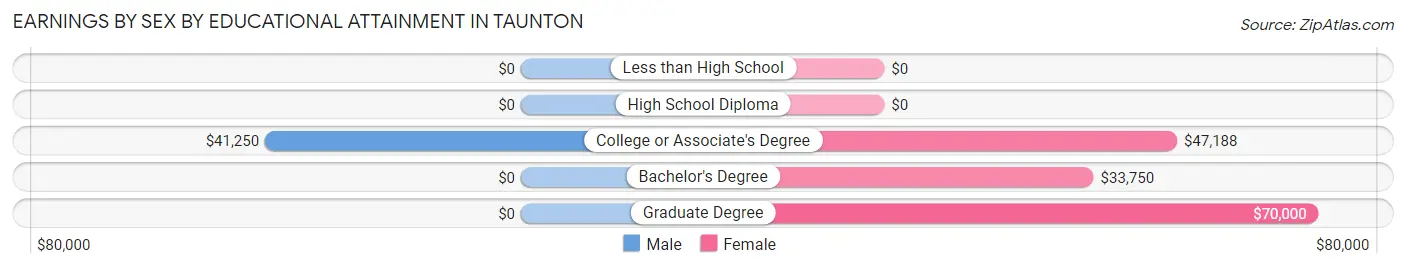
Earnings by Sex by Educational Attainment in Taunton
Average earnings in Taunton are $43,214 for men and $36,250 for women, a difference of 16.1%. Men with an educational attainment of college or associate's degree enjoy the highest average annual earnings of $41,250, while those with college or associate's degree education earn the least with $41,250. Women with an educational attainment of graduate degree earn the most with the average annual earnings of $70,000, while those with bachelor's degree education have the smallest earnings of $33,750.
| Educational Attainment | Male Income | Female Income |
| Less than High School | - | - |
| High School Diploma | - | - |
| College or Associate's Degree | $41,250 | $47,188 |
| Bachelor's Degree | - | - |
| Graduate Degree | - | - |
| Total | $43,214 | $36,250 |
Family Income in Taunton
Family Income Brackets in Taunton
According to the Taunton family income data, there are 8 families falling into the $75,000 to $99,999 income range, which is the most common income bracket and makes up 19.1% of all families.
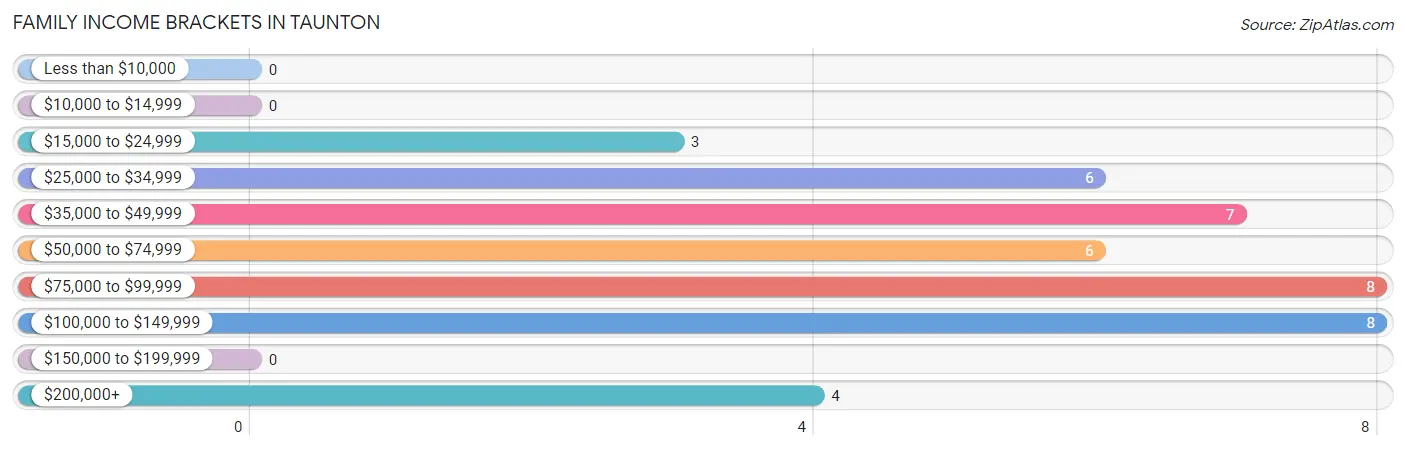
| Income Bracket | # Families | % Families |
| Less than $10,000 | 0 | 0.0% |
| $10,000 to $14,999 | 0 | 0.0% |
| $15,000 to $24,999 | 3 | 7.1% |
| $25,000 to $34,999 | 6 | 14.3% |
| $35,000 to $49,999 | 7 | 16.7% |
| $50,000 to $74,999 | 6 | 14.3% |
| $75,000 to $99,999 | 8 | 19.0% |
| $100,000 to $149,999 | 8 | 19.0% |
| $150,000 to $199,999 | 0 | 0.0% |
| $200,000+ | 4 | 9.5% |
Family Income by Famaliy Size in Taunton
3-person families (14 | 33.3%) account for the highest median family income in Taunton with $68,750 per family, while 3-person families (14 | 33.3%) have the highest median income of $22,917 per family member.
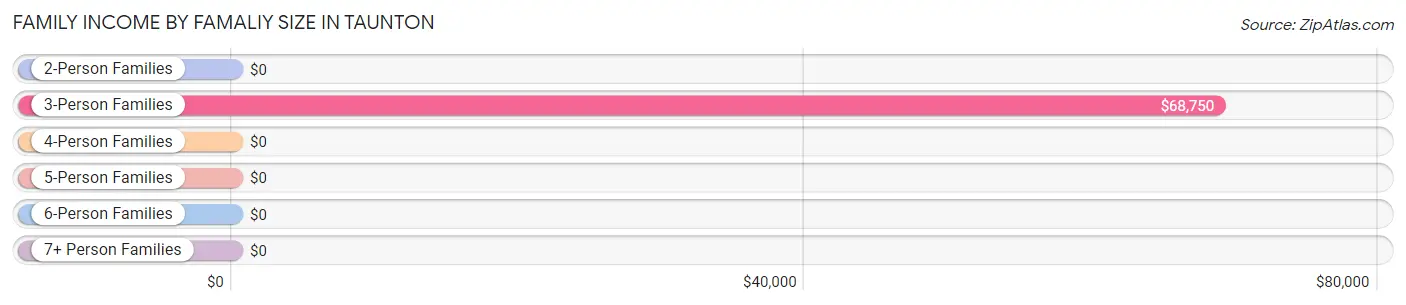
| Income Bracket | # Families | Median Income |
| 2-Person Families | 20 (47.6%) | $0 |
| 3-Person Families | 14 (33.3%) | $68,750 |
| 4-Person Families | 0 (0.0%) | $0 |
| 5-Person Families | 2 (4.8%) | $0 |
| 6-Person Families | 6 (14.3%) | $0 |
| 7+ Person Families | 0 (0.0%) | $0 |
| Total | 42 (100.0%) | $66,250 |
Family Income by Number of Earners in Taunton
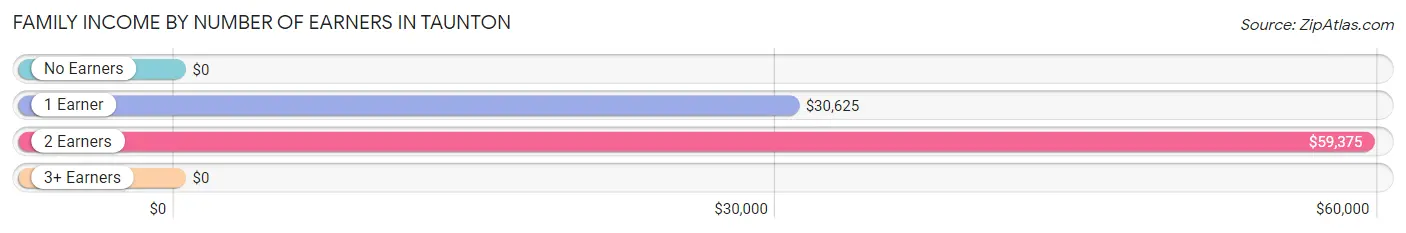
| Number of Earners | # Families | Median Income |
| No Earners | 2 (4.8%) | $0 |
| 1 Earner | 5 (11.9%) | $30,625 |
| 2 Earners | 28 (66.7%) | $59,375 |
| 3+ Earners | 7 (16.7%) | $0 |
| Total | 42 (100.0%) | $66,250 |
Household Income in Taunton
Household Income Brackets in Taunton
With 18 households falling in the category, the $50,000 to $74,999 income range is the most frequent in Taunton, accounting for 22.2% of all households.
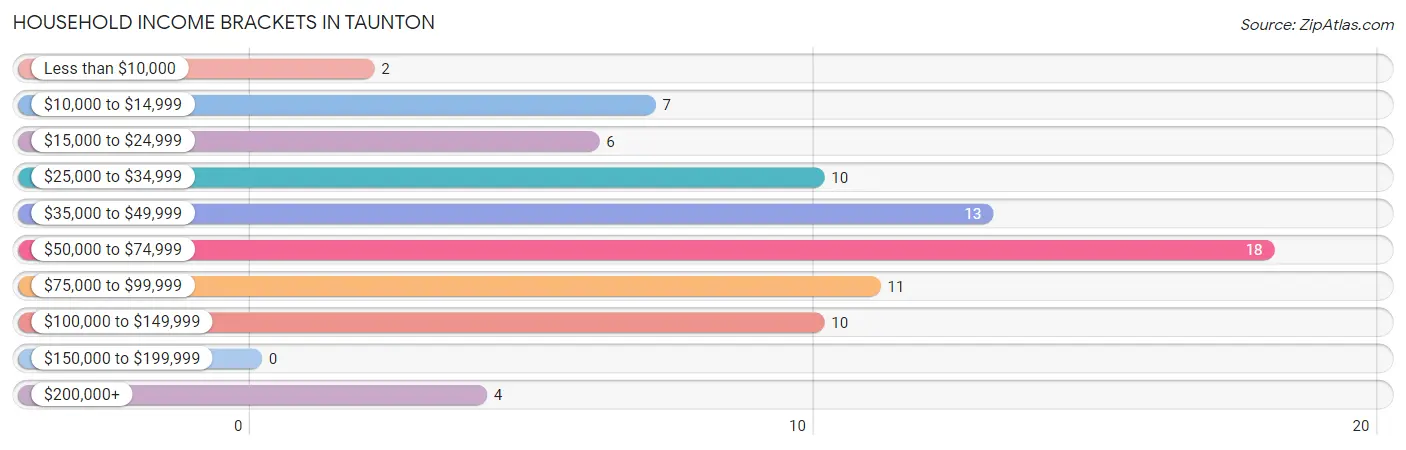
| Income Bracket | # Households | % Households |
| Less than $10,000 | 2 | 2.5% |
| $10,000 to $14,999 | 7 | 8.6% |
| $15,000 to $24,999 | 6 | 7.4% |
| $25,000 to $34,999 | 10 | 12.3% |
| $35,000 to $49,999 | 13 | 16.0% |
| $50,000 to $74,999 | 18 | 22.2% |
| $75,000 to $99,999 | 11 | 13.6% |
| $100,000 to $149,999 | 10 | 12.3% |
| $150,000 to $199,999 | 0 | 0.0% |
| $200,000+ | 4 | 4.9% |
Household Income by Householder Age in Taunton
The median household income in Taunton is $50,893, with the highest median household income of $59,375 found in the 25 to 44 years age bracket for the primary householder. A total of 16 households (19.8%) fall into this category. Meanwhile, the 15 to 24 years age bracket for the primary householder has the lowest median household income of $0, with 3 households (3.7%) in this group.
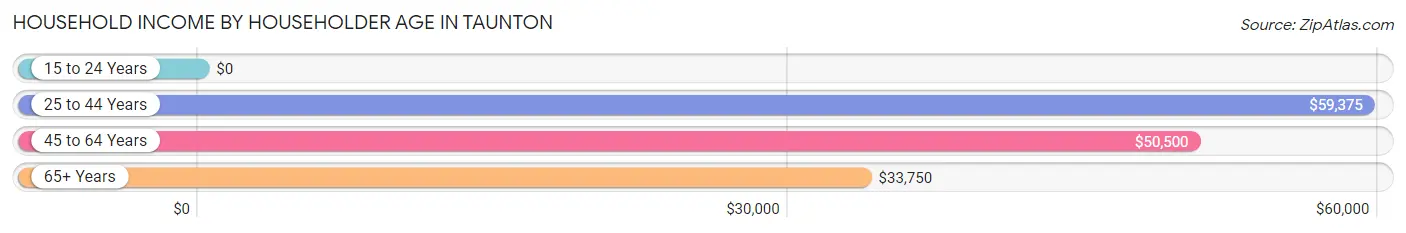
| Income Bracket | # Households | Median Income |
| 15 to 24 Years | 3 (3.7%) | $0 |
| 25 to 44 Years | 16 (19.8%) | $59,375 |
| 45 to 64 Years | 46 (56.8%) | $50,500 |
| 65+ Years | 16 (19.8%) | $33,750 |
| Total | 81 (100.0%) | $50,893 |
Poverty in Taunton
Income Below Poverty by Sex and Age in Taunton
With 14.9% poverty level for males and 17.1% for females among the residents of Taunton, 12 to 14 year old males and 6 to 11 year old females are the most vulnerable to poverty, with 2 males (100.0%) and 3 females (100.0%) in their respective age groups living below the poverty level.
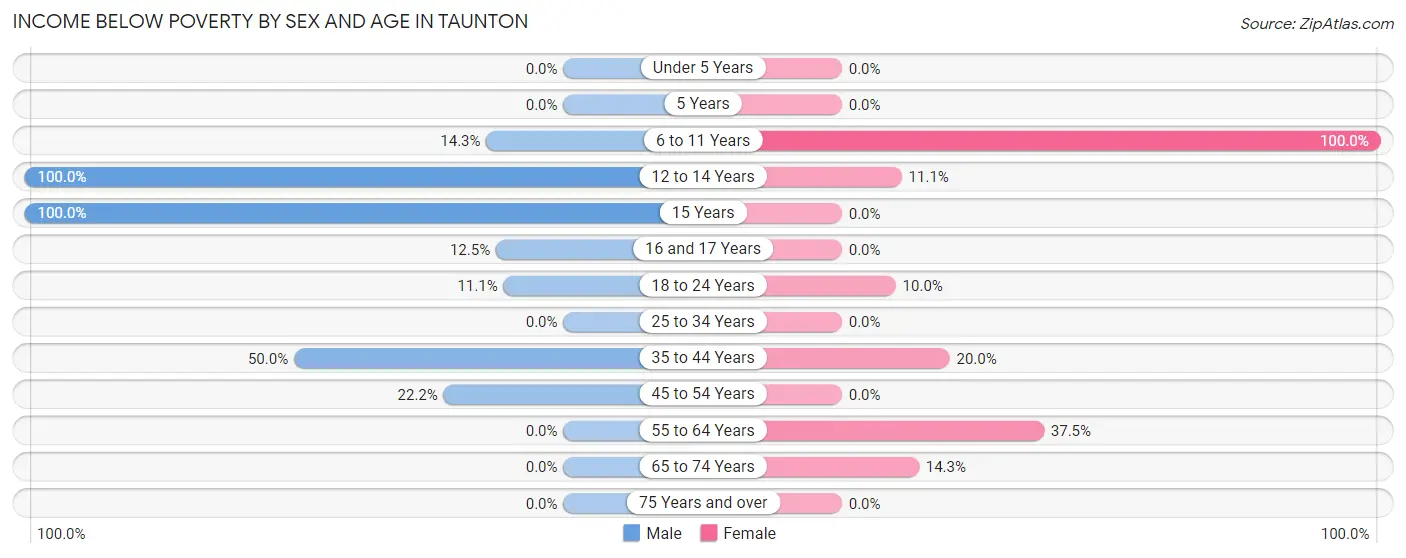
| Age Bracket | Male | Female |
| Under 5 Years | 0 (0.0%) | 0 (0.0%) |
| 5 Years | 0 (0.0%) | 0 (0.0%) |
| 6 to 11 Years | 1 (14.3%) | 3 (100.0%) |
| 12 to 14 Years | 2 (100.0%) | 1 (11.1%) |
| 15 Years | 1 (100.0%) | 0 (0.0%) |
| 16 and 17 Years | 1 (12.5%) | 0 (0.0%) |
| 18 to 24 Years | 1 (11.1%) | 1 (10.0%) |
| 25 to 34 Years | 0 (0.0%) | 0 (0.0%) |
| 35 to 44 Years | 3 (50.0%) | 2 (20.0%) |
| 45 to 54 Years | 4 (22.2%) | 0 (0.0%) |
| 55 to 64 Years | 0 (0.0%) | 6 (37.5%) |
| 65 to 74 Years | 0 (0.0%) | 1 (14.3%) |
| 75 Years and over | 0 (0.0%) | 0 (0.0%) |
| Total | 13 (14.9%) | 14 (17.1%) |
Income Above Poverty by Sex and Age in Taunton
According to the poverty statistics in Taunton, males aged under 5 years and females aged under 5 years are the age groups that are most secure financially, with 100.0% of males and 100.0% of females in these age groups living above the poverty line.
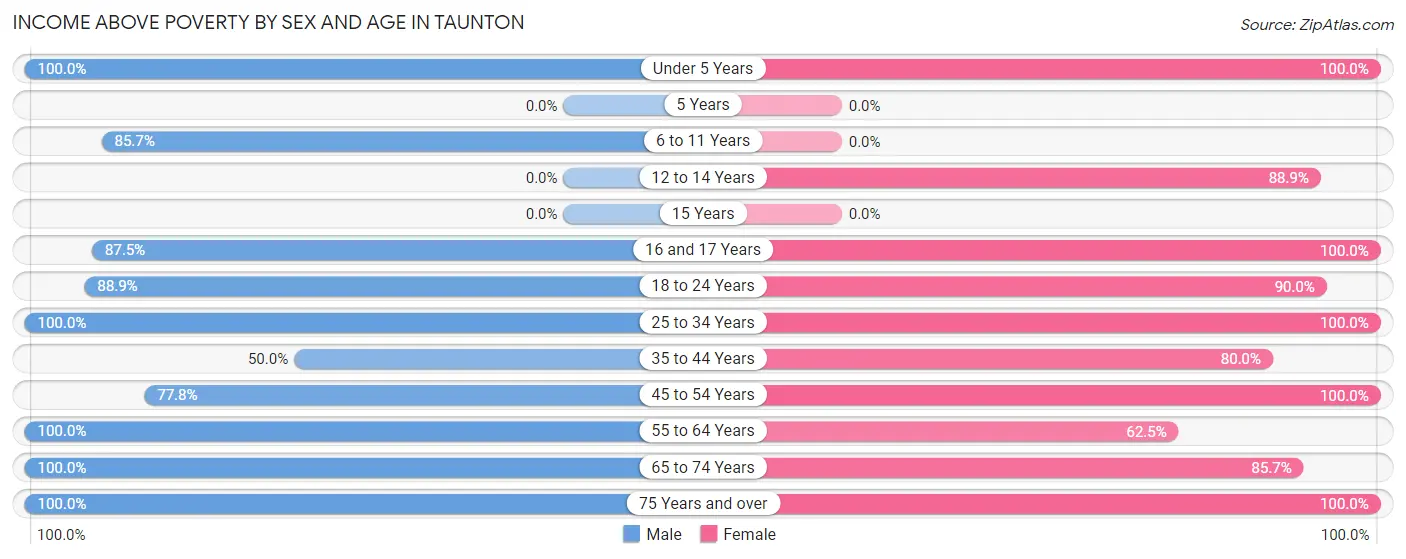
| Age Bracket | Male | Female |
| Under 5 Years | 2 (100.0%) | 1 (100.0%) |
| 5 Years | 0 (0.0%) | 0 (0.0%) |
| 6 to 11 Years | 6 (85.7%) | 0 (0.0%) |
| 12 to 14 Years | 0 (0.0%) | 8 (88.9%) |
| 15 Years | 0 (0.0%) | 0 (0.0%) |
| 16 and 17 Years | 7 (87.5%) | 6 (100.0%) |
| 18 to 24 Years | 8 (88.9%) | 9 (90.0%) |
| 25 to 34 Years | 12 (100.0%) | 5 (100.0%) |
| 35 to 44 Years | 3 (50.0%) | 8 (80.0%) |
| 45 to 54 Years | 14 (77.8%) | 6 (100.0%) |
| 55 to 64 Years | 20 (100.0%) | 10 (62.5%) |
| 65 to 74 Years | 1 (100.0%) | 6 (85.7%) |
| 75 Years and over | 1 (100.0%) | 9 (100.0%) |
| Total | 74 (85.1%) | 68 (82.9%) |
Income Below Poverty Among Married-Couple Families in Taunton
The poverty statistics for married-couple families in Taunton show that 12.0% or 3 of the total 25 families live below the poverty line. Families with 3 or 4 children have the highest poverty rate of 37.5%, comprising of 3 families. On the other hand, families with no children have the lowest poverty rate of 0.0%, which includes 0 families.
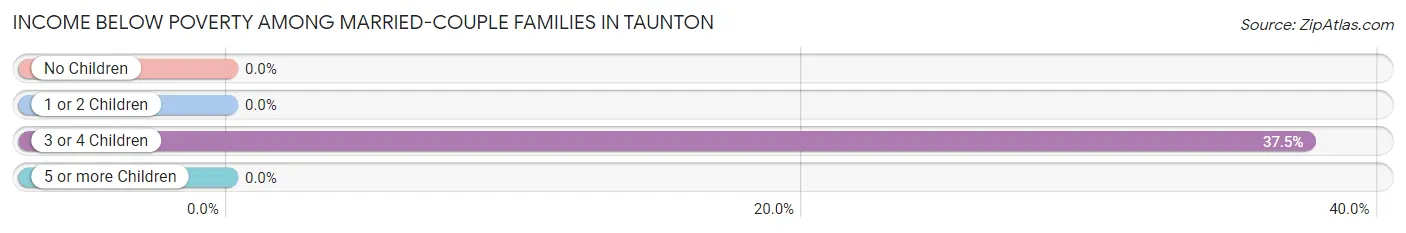
| Children | Above Poverty | Below Poverty |
| No Children | 14 (100.0%) | 0 (0.0%) |
| 1 or 2 Children | 3 (100.0%) | 0 (0.0%) |
| 3 or 4 Children | 5 (62.5%) | 3 (37.5%) |
| 5 or more Children | 0 (0.0%) | 0 (0.0%) |
| Total | 22 (88.0%) | 3 (12.0%) |
Income Below Poverty Among Single-Parent Households in Taunton
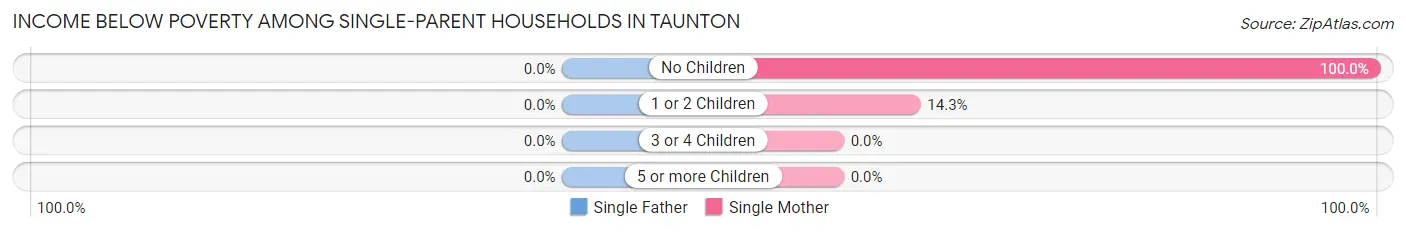
| Children | Single Father | Single Mother |
| No Children | 0 (0.0%) | 1 (100.0%) |
| 1 or 2 Children | 0 (0.0%) | 1 (14.3%) |
| 3 or 4 Children | 0 (0.0%) | 0 (0.0%) |
| 5 or more Children | 0 (0.0%) | 0 (0.0%) |
| Total | 0 (0.0%) | 2 (25.0%) |
Income Below Poverty Among Married-Couple vs Single-Parent Households in Taunton
The poverty data for Taunton shows that 3 of the married-couple family households (12.0%) and 2 of the single-parent households (11.8%) are living below the poverty level. Within the married-couple family households, those with 3 or 4 children have the highest poverty rate, with 3 households (37.5%) falling below the poverty line. Among the single-parent households, those with 1 or 2 children have the highest poverty rate, with 1 household (12.5%) living below poverty.
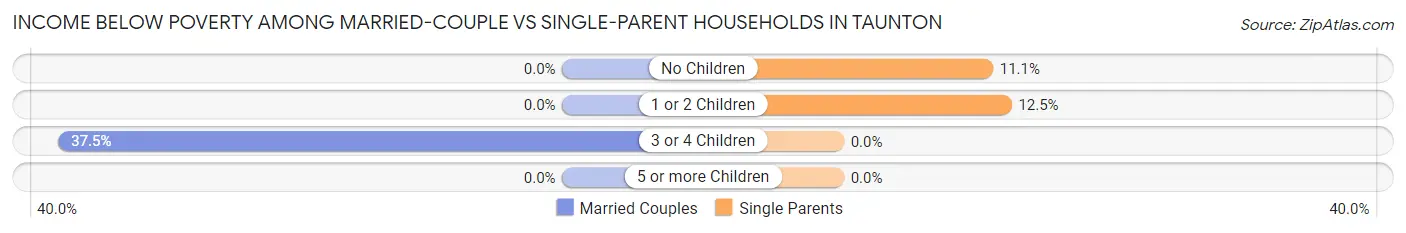
| Children | Married-Couple Families | Single-Parent Households |
| No Children | 0 (0.0%) | 1 (11.1%) |
| 1 or 2 Children | 0 (0.0%) | 1 (12.5%) |
| 3 or 4 Children | 3 (37.5%) | 0 (0.0%) |
| 5 or more Children | 0 (0.0%) | 0 (0.0%) |
| Total | 3 (12.0%) | 2 (11.8%) |
Race in Taunton
The most populous races in Taunton are , and White / Caucasian (169 | 100.0%).
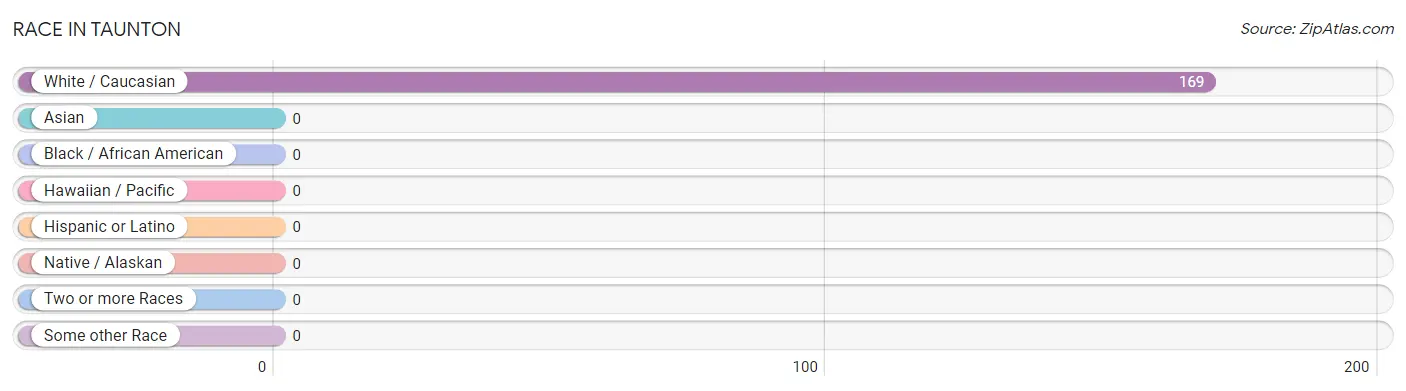
| Race | # Population | % Population |
| Asian | 0 | 0.0% |
| Black / African American | 0 | 0.0% |
| Hawaiian / Pacific | 0 | 0.0% |
| Hispanic or Latino | 0 | 0.0% |
| Native / Alaskan | 0 | 0.0% |
| White / Caucasian | 169 | 100.0% |
| Two or more Races | 0 | 0.0% |
| Some other Race | 0 | 0.0% |
| Total | 169 | 100.0% |
Ancestry in Taunton
The most populous ancestries reported in Taunton are German (121 | 71.6%), Norwegian (67 | 39.6%), Belgian (12 | 7.1%), Polish (11 | 6.5%), and Irish (10 | 5.9%), together accounting for 130.8% of all Taunton residents.
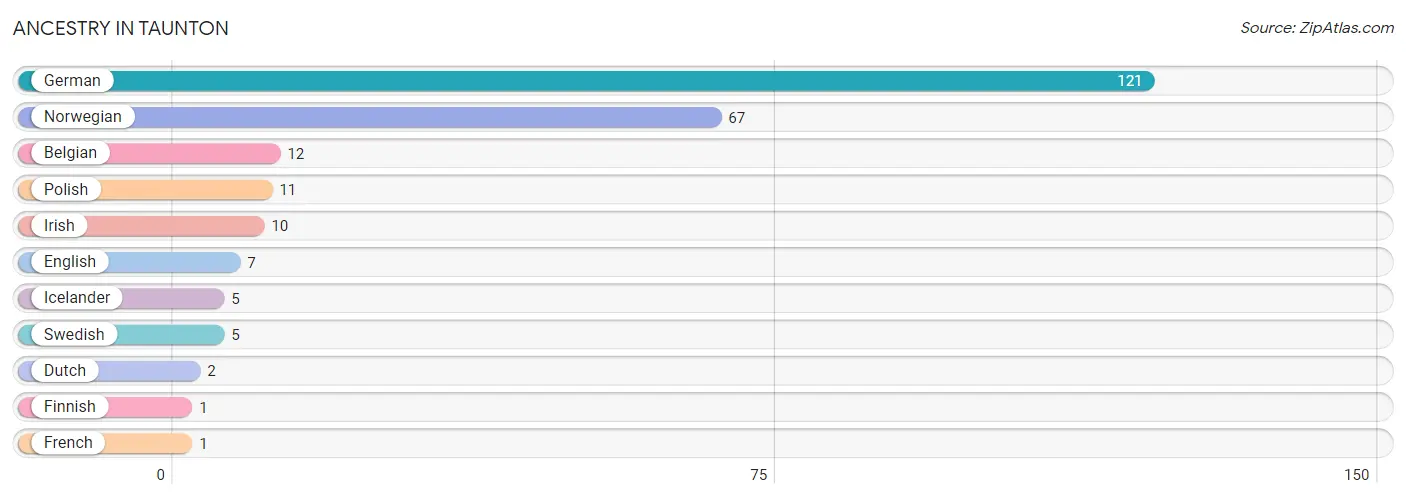
| Ancestry | # Population | % Population |
| Belgian | 12 | 7.1% |
| Dutch | 2 | 1.2% |
| English | 7 | 4.1% |
| Finnish | 1 | 0.6% |
| French | 1 | 0.6% |
| German | 121 | 71.6% |
| Icelander | 5 | 3.0% |
| Irish | 10 | 5.9% |
| Norwegian | 67 | 39.6% |
| Polish | 11 | 6.5% |
| Swedish | 5 | 3.0% | View All 11 Rows |
Immigrants in Taunton
The most numerous immigrant groups reported in Taunton came from Europe (5 | 3.0%), Western Europe (5 | 3.0%), Germany (3 | 1.8%), and Belgium (2 | 1.2%), together accounting for 8.9% of all Taunton residents.
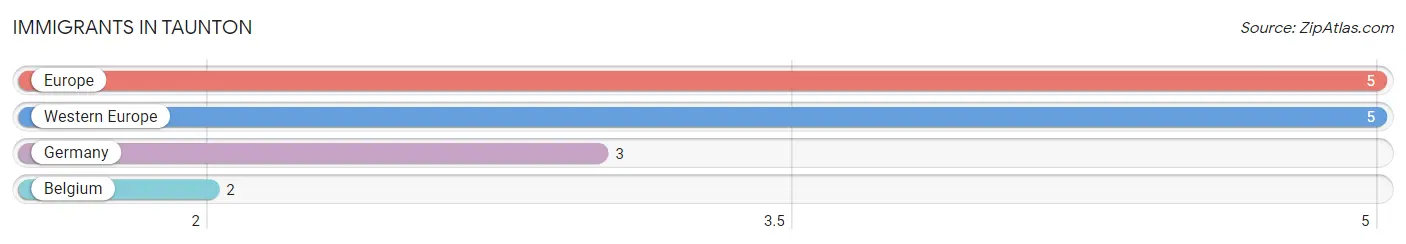
| Immigration Origin | # Population | % Population |
| Belgium | 2 | 1.2% |
| Europe | 5 | 3.0% |
| Germany | 3 | 1.8% |
| Western Europe | 5 | 3.0% | View All 4 Rows |
Sex and Age in Taunton
Sex and Age in Taunton
The most populous age groups in Taunton are 60 to 64 Years (13 | 14.9%) for men and 60 to 64 Years (12 | 14.6%) for women.
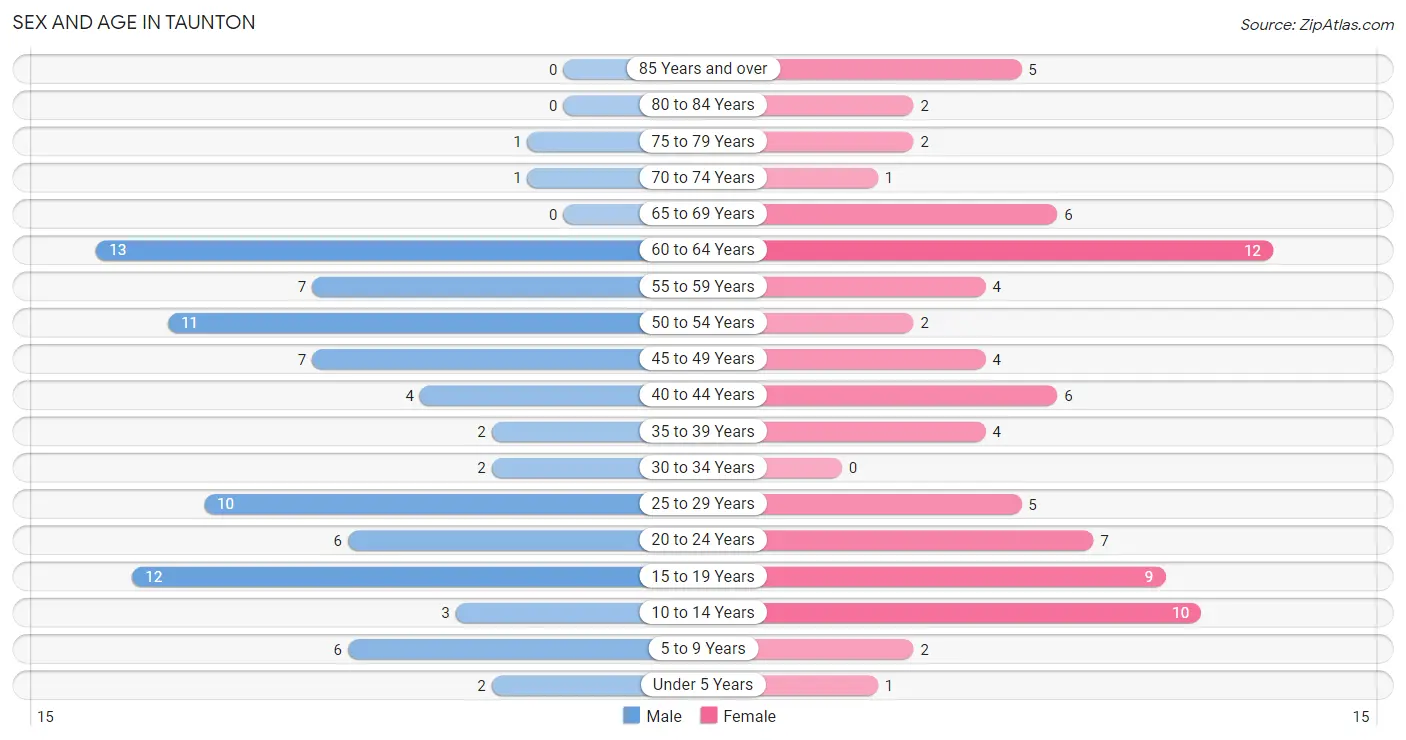
| Age Bracket | Male | Female |
| Under 5 Years | 2 (2.3%) | 1 (1.2%) |
| 5 to 9 Years | 6 (6.9%) | 2 (2.4%) |
| 10 to 14 Years | 3 (3.5%) | 10 (12.2%) |
| 15 to 19 Years | 12 (13.8%) | 9 (11.0%) |
| 20 to 24 Years | 6 (6.9%) | 7 (8.5%) |
| 25 to 29 Years | 10 (11.5%) | 5 (6.1%) |
| 30 to 34 Years | 2 (2.3%) | 0 (0.0%) |
| 35 to 39 Years | 2 (2.3%) | 4 (4.9%) |
| 40 to 44 Years | 4 (4.6%) | 6 (7.3%) |
| 45 to 49 Years | 7 (8.1%) | 4 (4.9%) |
| 50 to 54 Years | 11 (12.6%) | 2 (2.4%) |
| 55 to 59 Years | 7 (8.1%) | 4 (4.9%) |
| 60 to 64 Years | 13 (14.9%) | 12 (14.6%) |
| 65 to 69 Years | 0 (0.0%) | 6 (7.3%) |
| 70 to 74 Years | 1 (1.1%) | 1 (1.2%) |
| 75 to 79 Years | 1 (1.1%) | 2 (2.4%) |
| 80 to 84 Years | 0 (0.0%) | 2 (2.4%) |
| 85 Years and over | 0 (0.0%) | 5 (6.1%) |
| Total | 87 (100.0%) | 82 (100.0%) |
Families and Households in Taunton
Median Family Size in Taunton
The median family size in Taunton is 3.00 persons per family, with married-couple families (25 | 59.5%) accounting for the largest median family size of 3.28 persons per family. On the other hand, single male/father families (9 | 21.4%) represent the smallest median family size with 2.22 persons per family.
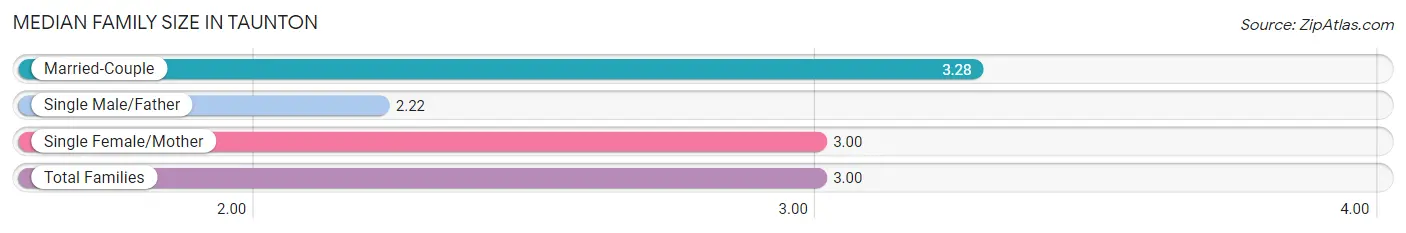
| Family Type | # Families | Family Size |
| Married-Couple | 25 (59.5%) | 3.28 |
| Single Male/Father | 9 (21.4%) | 2.22 |
| Single Female/Mother | 8 (19.1%) | 3.00 |
| Total Families | 42 (100.0%) | 3.00 |
Median Household Size in Taunton
The median household size in Taunton is 2.09 persons per household, with married-couple households (25 | 30.9%) accounting for the largest median household size of 3.28 persons per household. non-family households (39 | 48.1%) represent the smallest median household size with 1.10 persons per household.
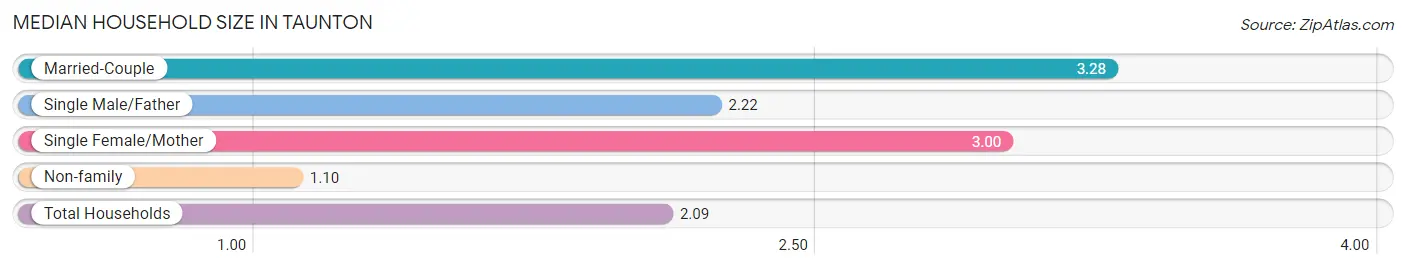
| Household Type | # Households | Household Size |
| Married-Couple | 25 (30.9%) | 3.28 |
| Single Male/Father | 9 (11.1%) | 2.22 |
| Single Female/Mother | 8 (9.9%) | 3.00 |
| Non-family | 39 (48.1%) | 1.10 |
| Total Households | 81 (100.0%) | 2.09 |
Household Size by Marriage Status in Taunton
Out of a total of 81 households in Taunton, 42 (51.8%) are family households, while 39 (48.1%) are nonfamily households. The most numerous type of family households are 2-person households, comprising 20, and the most common type of nonfamily households are 1-person households, comprising 33.
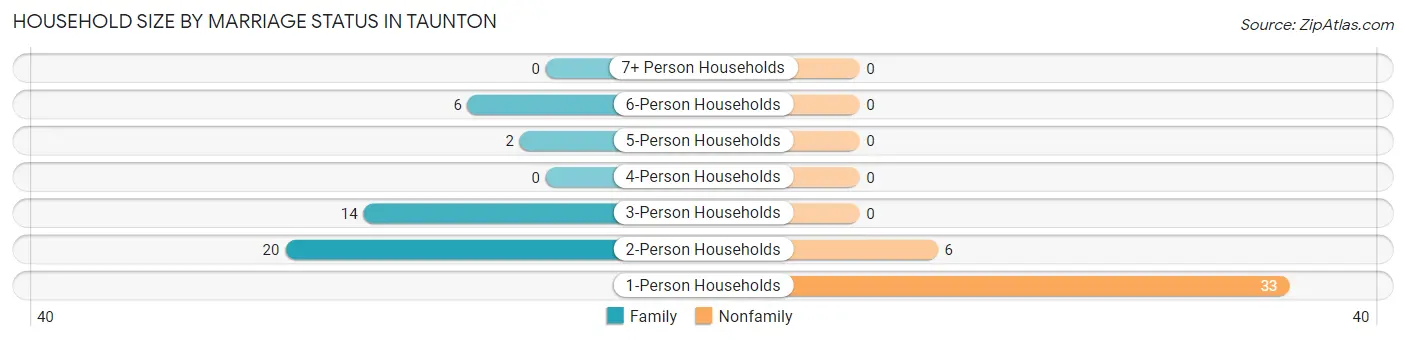
| Household Size | Family Households | Nonfamily Households |
| 1-Person Households | - | 33 (40.7%) |
| 2-Person Households | 20 (24.7%) | 6 (7.4%) |
| 3-Person Households | 14 (17.3%) | 0 (0.0%) |
| 4-Person Households | 0 (0.0%) | 0 (0.0%) |
| 5-Person Households | 2 (2.5%) | 0 (0.0%) |
| 6-Person Households | 6 (7.4%) | 0 (0.0%) |
| 7+ Person Households | 0 (0.0%) | 0 (0.0%) |
| Total | 42 (51.8%) | 39 (48.1%) |
Female Fertility in Taunton
Fertility by Age in Taunton
Average fertility rate in Taunton is 86.0 births per 1,000 women. Women in the age bracket of 20 to 34 years have the highest fertility rate with 250.0 births per 1,000 women. Women in the age bracket of 20 to 34 years acount for 100.0% of all women with births.
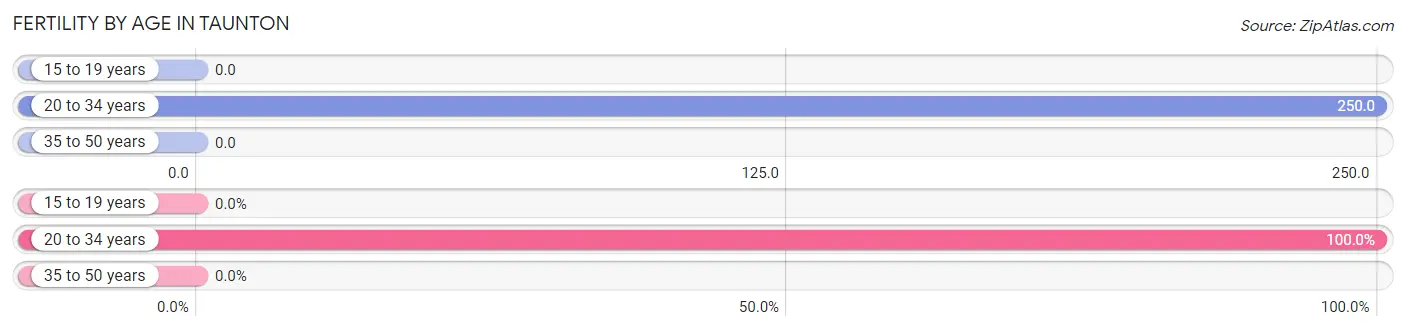
| Age Bracket | Women with Births | Births / 1,000 Women |
| 15 to 19 years | 0 (0.0%) | 0.0 |
| 20 to 34 years | 3 (100.0%) | 250.0 |
| 35 to 50 years | 0 (0.0%) | 0.0 |
| Total | 3 (100.0%) | 86.0 |
Fertility by Age by Marriage Status in Taunton
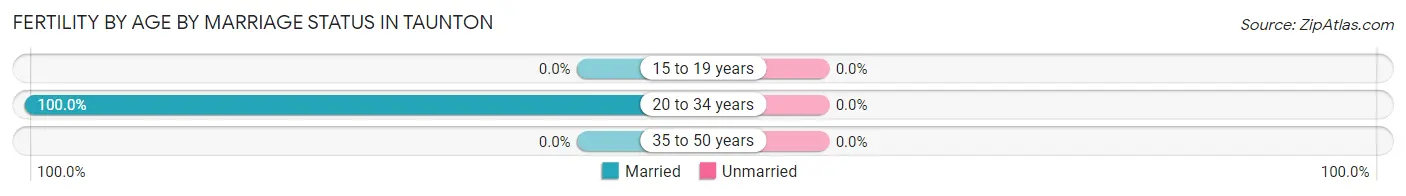
| Age Bracket | Married | Unmarried |
| 15 to 19 years | 0 (0.0%) | 0 (0.0%) |
| 20 to 34 years | 3 (100.0%) | 0 (0.0%) |
| 35 to 50 years | 0 (0.0%) | 0 (0.0%) |
| Total | 3 (100.0%) | 0 (0.0%) |
Fertility by Education in Taunton
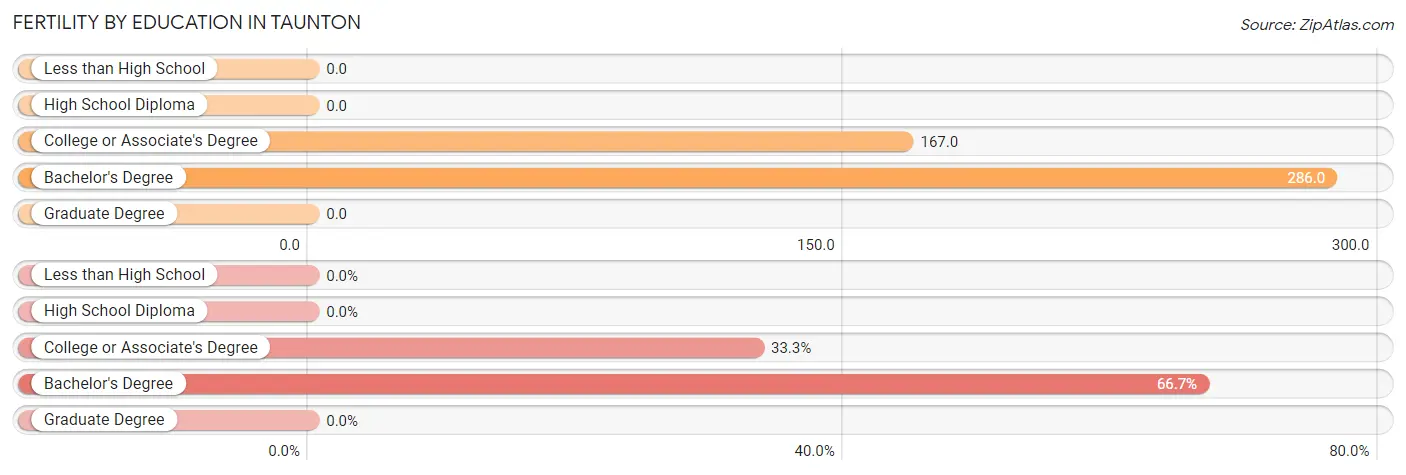
| Educational Attainment | Women with Births | Births / 1,000 Women |
| Less than High School | 0 (0.0%) | 0.0 |
| High School Diploma | 0 (0.0%) | 0.0 |
| College or Associate's Degree | 1 (33.3%) | 167.0 |
| Bachelor's Degree | 2 (66.7%) | 286.0 |
| Graduate Degree | 0 (0.0%) | 0.0 |
| Total | 3 (100.0%) | 86.0 |
Fertility by Education by Marriage Status in Taunton
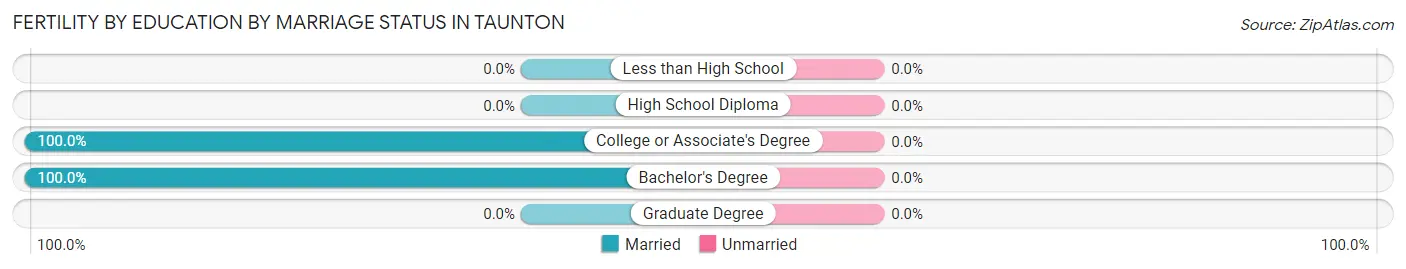
| Educational Attainment | Married | Unmarried |
| Less than High School | 0 (0.0%) | 0 (0.0%) |
| High School Diploma | 0 (0.0%) | 0 (0.0%) |
| College or Associate's Degree | 1 (100.0%) | 0 (0.0%) |
| Bachelor's Degree | 2 (100.0%) | 0 (0.0%) |
| Graduate Degree | 0 (0.0%) | 0 (0.0%) |
| Total | 3 (100.0%) | 0 (0.0%) |
Employment Characteristics in Taunton
Employment by Class of Employer in Taunton
Among the 110 employed individuals in Taunton, private company employees (74 | 67.3%), not-for-profit organizations (15 | 13.6%), and self-employed (not incorporated) (10 | 9.1%) make up the most common classes of employment.
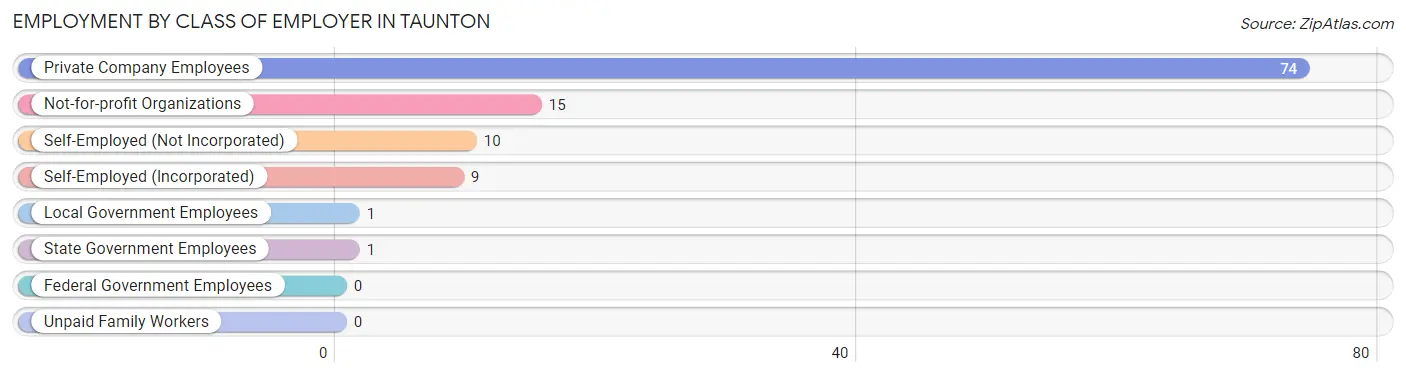
| Employer Class | # Employees | % Employees |
| Private Company Employees | 74 | 67.3% |
| Self-Employed (Incorporated) | 9 | 8.2% |
| Self-Employed (Not Incorporated) | 10 | 9.1% |
| Not-for-profit Organizations | 15 | 13.6% |
| Local Government Employees | 1 | 0.9% |
| State Government Employees | 1 | 0.9% |
| Federal Government Employees | 0 | 0.0% |
| Unpaid Family Workers | 0 | 0.0% |
| Total | 110 | 100.0% |
Employment Status by Age in Taunton
According to the labor force statistics for Taunton, out of the total population over 16 years of age (144), 79.9% or 115 individuals are in the labor force, with 0.9% or 1 of them unemployed. The age group with the highest labor force participation rate is 20 to 24 years, with 100.0% or 13 individuals in the labor force. Within the labor force, the 45 to 54 years age range has the highest percentage of unemployed individuals, with 4.2% or 1 of them being unemployed.
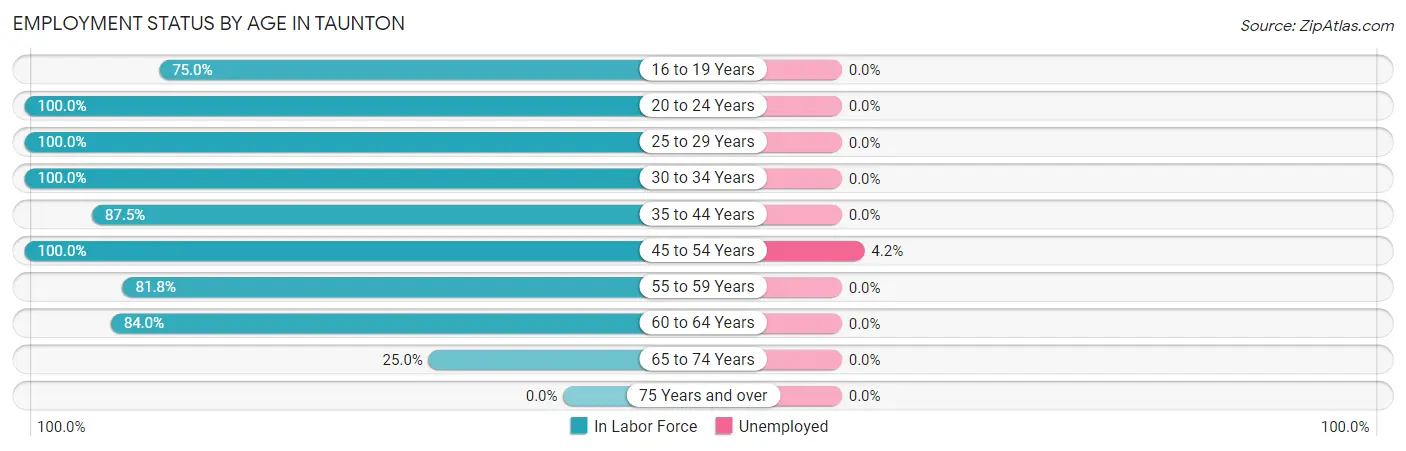
| Age Bracket | In Labor Force | Unemployed |
| 16 to 19 Years | 15 (75.0%) | 0 (0.0%) |
| 20 to 24 Years | 13 (100.0%) | 0 (0.0%) |
| 25 to 29 Years | 15 (100.0%) | 0 (0.0%) |
| 30 to 34 Years | 2 (100.0%) | 0 (0.0%) |
| 35 to 44 Years | 14 (87.5%) | 0 (0.0%) |
| 45 to 54 Years | 24 (100.0%) | 1 (4.2%) |
| 55 to 59 Years | 9 (81.8%) | 0 (0.0%) |
| 60 to 64 Years | 21 (84.0%) | 0 (0.0%) |
| 65 to 74 Years | 2 (25.0%) | 0 (0.0%) |
| 75 Years and over | 0 (0.0%) | 0 (0.0%) |
| Total | 115 (79.9%) | 1 (0.9%) |
Employment Status by Educational Attainment in Taunton
According to labor force statistics for Taunton, 91.4% of individuals (85) out of the total population between 25 and 64 years of age (93) are in the labor force, with 1.2% or 1 of them being unemployed. The group with the highest labor force participation rate are those with the educational attainment of bachelor's degree or higher, with 100.0% or 13 individuals in the labor force. Within the labor force, individuals with bachelor's degree or higher education have the highest percentage of unemployment, with 7.7% or 1 of them being unemployed.
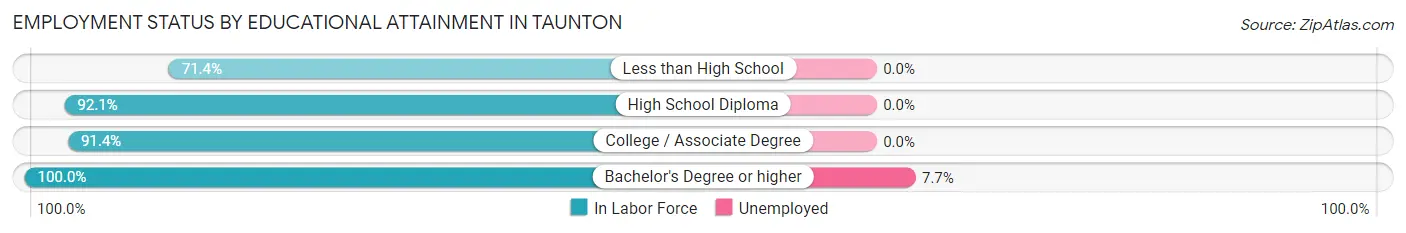
| Educational Attainment | In Labor Force | Unemployed |
| Less than High School | 5 (71.4%) | 0 (0.0%) |
| High School Diploma | 35 (92.1%) | 0 (0.0%) |
| College / Associate Degree | 32 (91.4%) | 0 (0.0%) |
| Bachelor's Degree or higher | 13 (100.0%) | 1 (7.7%) |
| Total | 85 (91.4%) | 1 (1.2%) |
Employment Occupations by Sex in Taunton
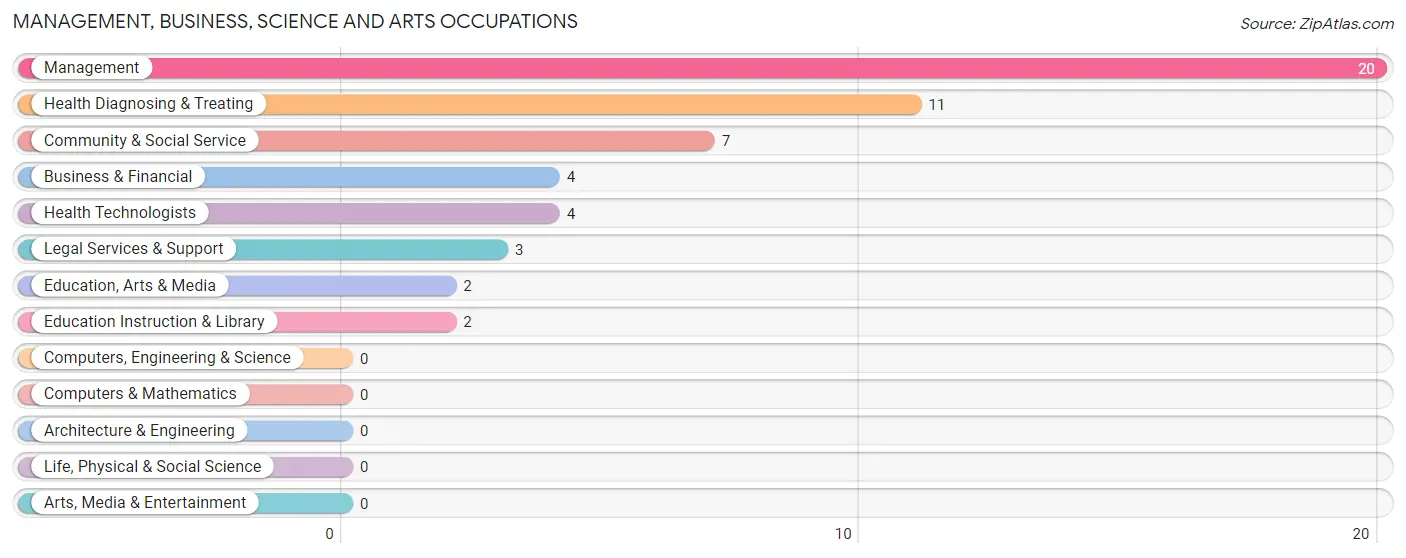
Management, Business, Science and Arts Occupations
The most common Management, Business, Science and Arts occupations in Taunton are Management (20 | 17.5%), Health Diagnosing & Treating (11 | 9.7%), Community & Social Service (7 | 6.1%), Business & Financial (4 | 3.5%), and Health Technologists (4 | 3.5%).
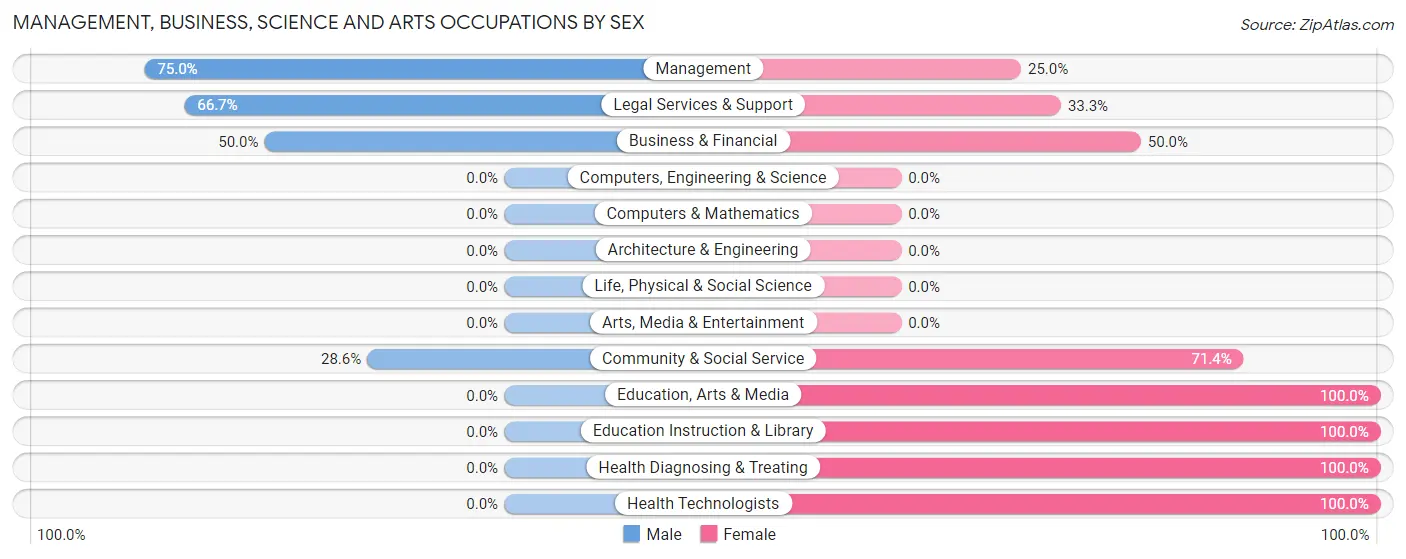
Management, Business, Science and Arts Occupations by Sex
Within the Management, Business, Science and Arts occupations in Taunton, the most male-oriented occupations are Management (75.0%), Legal Services & Support (66.7%), and Business & Financial (50.0%), while the most female-oriented occupations are Education, Arts & Media (100.0%), Education Instruction & Library (100.0%), and Health Diagnosing & Treating (100.0%).
| Occupation | Male | Female |
| Management | 15 (75.0%) | 5 (25.0%) |
| Business & Financial | 2 (50.0%) | 2 (50.0%) |
| Computers, Engineering & Science | 0 (0.0%) | 0 (0.0%) |
| Computers & Mathematics | 0 (0.0%) | 0 (0.0%) |
| Architecture & Engineering | 0 (0.0%) | 0 (0.0%) |
| Life, Physical & Social Science | 0 (0.0%) | 0 (0.0%) |
| Community & Social Service | 2 (28.6%) | 5 (71.4%) |
| Education, Arts & Media | 0 (0.0%) | 2 (100.0%) |
| Legal Services & Support | 2 (66.7%) | 1 (33.3%) |
| Education Instruction & Library | 0 (0.0%) | 2 (100.0%) |
| Arts, Media & Entertainment | 0 (0.0%) | 0 (0.0%) |
| Health Diagnosing & Treating | 0 (0.0%) | 11 (100.0%) |
| Health Technologists | 0 (0.0%) | 4 (100.0%) |
| Total (Category) | 19 (45.2%) | 23 (54.8%) |
| Total (Overall) | 69 (60.5%) | 45 (39.5%) |
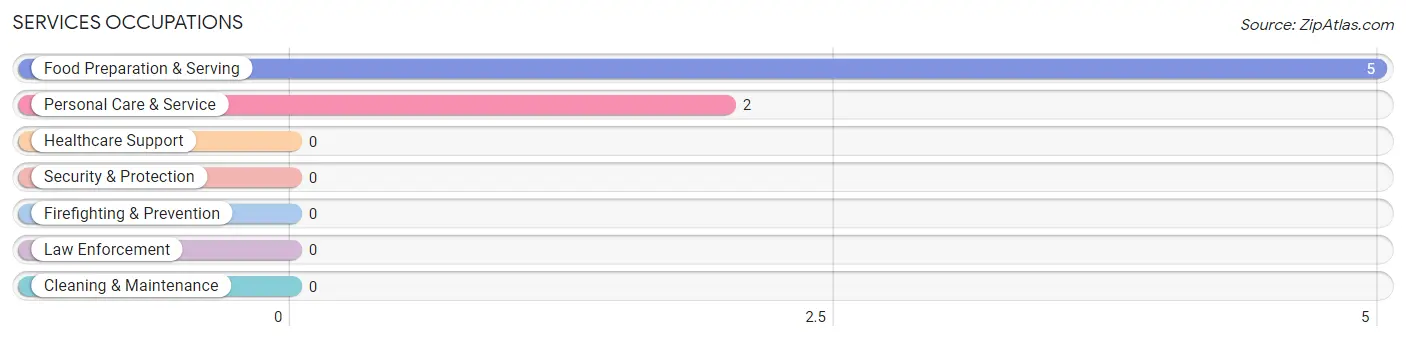
Services Occupations
The most common Services occupations in Taunton are Food Preparation & Serving (5 | 4.4%), and Personal Care & Service (2 | 1.8%).
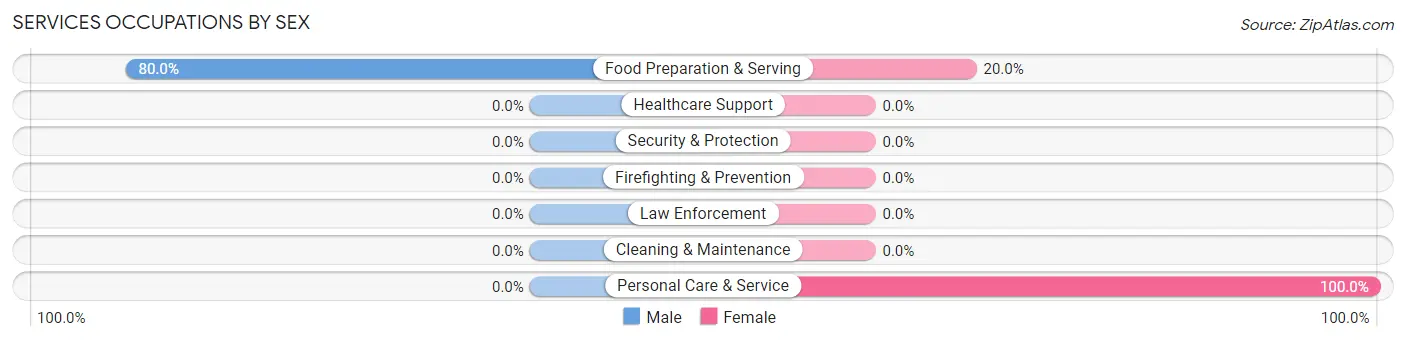
Services Occupations by Sex
| Occupation | Male | Female |
| Healthcare Support | 0 (0.0%) | 0 (0.0%) |
| Security & Protection | 0 (0.0%) | 0 (0.0%) |
| Firefighting & Prevention | 0 (0.0%) | 0 (0.0%) |
| Law Enforcement | 0 (0.0%) | 0 (0.0%) |
| Food Preparation & Serving | 4 (80.0%) | 1 (20.0%) |
| Cleaning & Maintenance | 0 (0.0%) | 0 (0.0%) |
| Personal Care & Service | 0 (0.0%) | 2 (100.0%) |
| Total (Category) | 4 (57.1%) | 3 (42.9%) |
| Total (Overall) | 69 (60.5%) | 45 (39.5%) |
Sales and Office Occupations
The most common Sales and Office occupations in Taunton are Sales & Related (15 | 13.2%), and Office & Administration (11 | 9.7%).
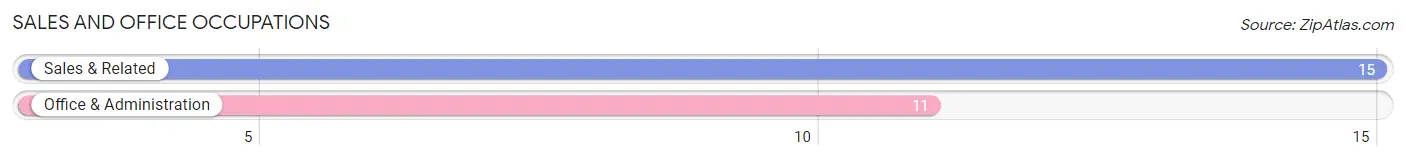
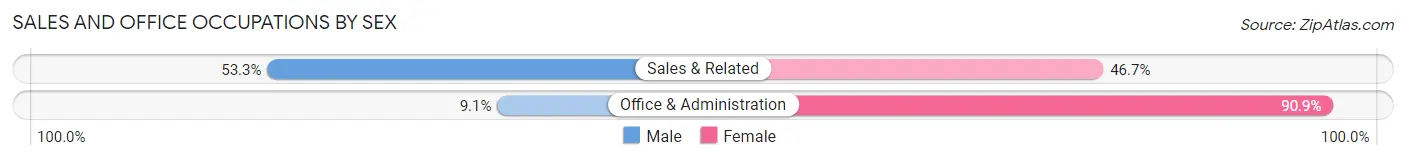
Sales and Office Occupations by Sex
| Occupation | Male | Female |
| Sales & Related | 8 (53.3%) | 7 (46.7%) |
| Office & Administration | 1 (9.1%) | 10 (90.9%) |
| Total (Category) | 9 (34.6%) | 17 (65.4%) |
| Total (Overall) | 69 (60.5%) | 45 (39.5%) |
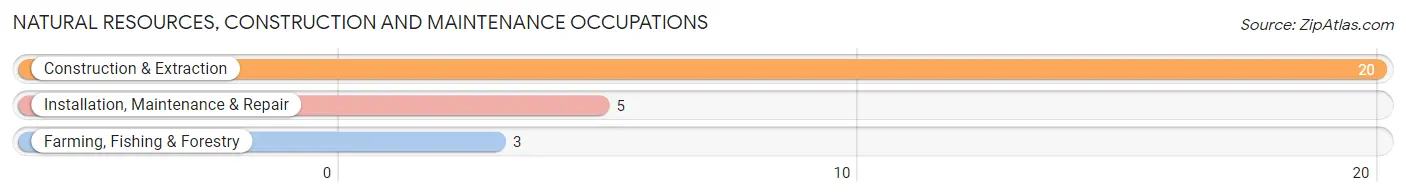
Natural Resources, Construction and Maintenance Occupations
The most common Natural Resources, Construction and Maintenance occupations in Taunton are Construction & Extraction (20 | 17.5%), Installation, Maintenance & Repair (5 | 4.4%), and Farming, Fishing & Forestry (3 | 2.6%).
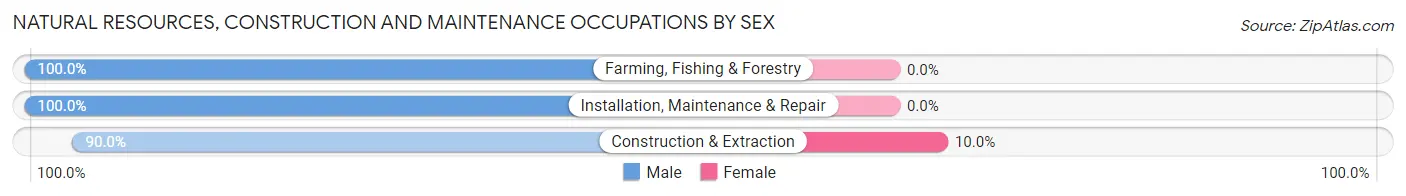
Natural Resources, Construction and Maintenance Occupations by Sex
| Occupation | Male | Female |
| Farming, Fishing & Forestry | 3 (100.0%) | 0 (0.0%) |
| Construction & Extraction | 18 (90.0%) | 2 (10.0%) |
| Installation, Maintenance & Repair | 5 (100.0%) | 0 (0.0%) |
| Total (Category) | 26 (92.9%) | 2 (7.1%) |
| Total (Overall) | 69 (60.5%) | 45 (39.5%) |
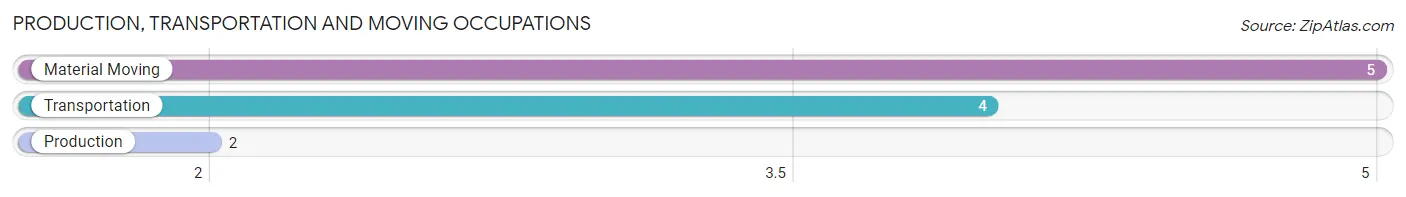
Production, Transportation and Moving Occupations
The most common Production, Transportation and Moving occupations in Taunton are Material Moving (5 | 4.4%), Transportation (4 | 3.5%), and Production (2 | 1.8%).
Production, Transportation and Moving Occupations by Sex
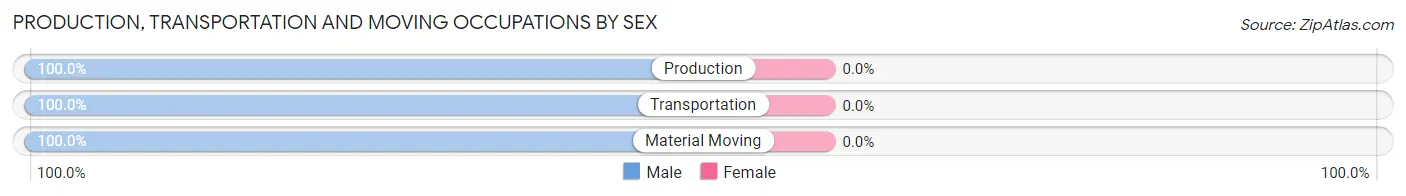
| Occupation | Male | Female |
| Production | 2 (100.0%) | 0 (0.0%) |
| Transportation | 4 (100.0%) | 0 (0.0%) |
| Material Moving | 5 (100.0%) | 0 (0.0%) |
| Total (Category) | 11 (100.0%) | 0 (0.0%) |
| Total (Overall) | 69 (60.5%) | 45 (39.5%) |
Employment Industries by Sex in Taunton
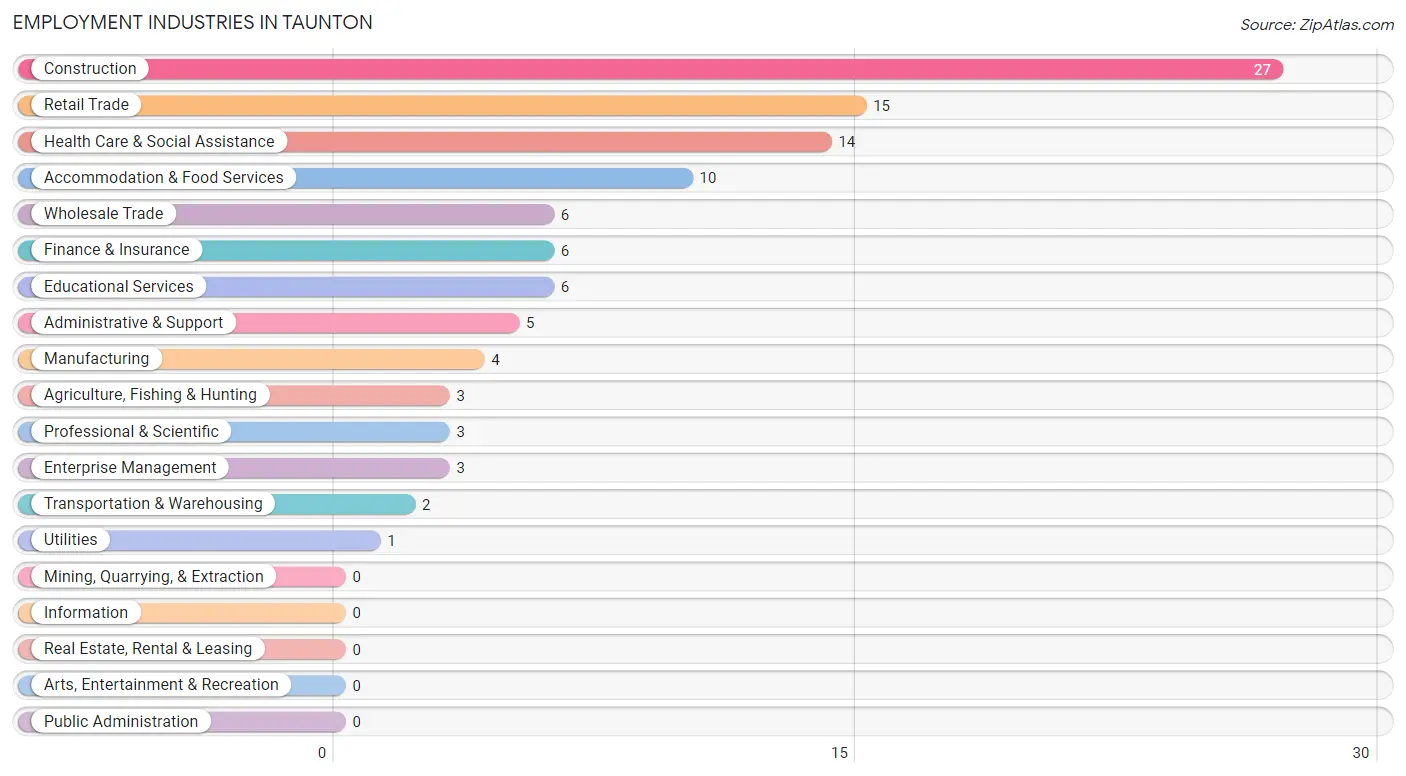
Employment Industries in Taunton
The major employment industries in Taunton include Construction (27 | 23.7%), Retail Trade (15 | 13.2%), Health Care & Social Assistance (14 | 12.3%), Accommodation & Food Services (10 | 8.8%), and Wholesale Trade (6 | 5.3%).
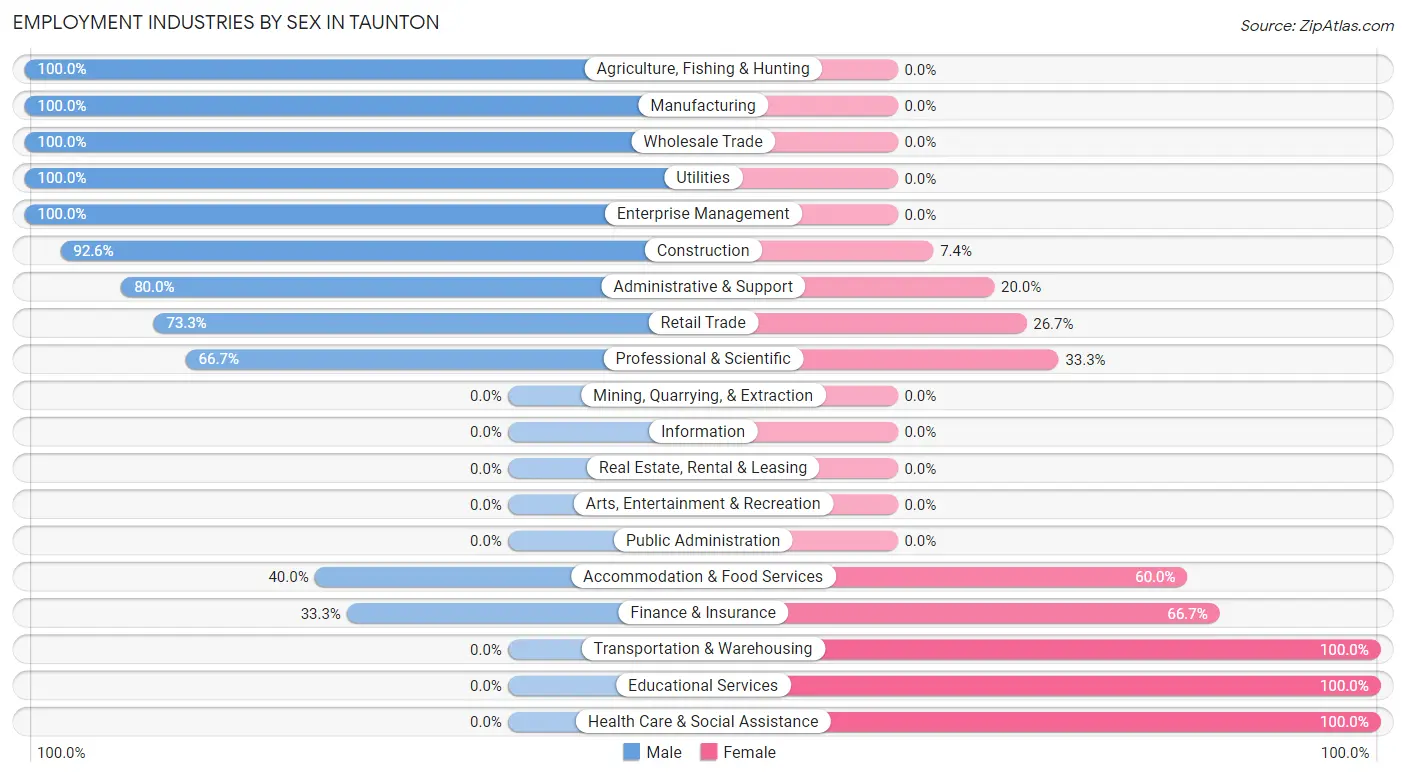
Employment Industries by Sex in Taunton
The Taunton industries that see more men than women are Agriculture, Fishing & Hunting (100.0%), Manufacturing (100.0%), and Wholesale Trade (100.0%), whereas the industries that tend to have a higher number of women are Transportation & Warehousing (100.0%), Educational Services (100.0%), and Health Care & Social Assistance (100.0%).
| Industry | Male | Female |
| Agriculture, Fishing & Hunting | 3 (100.0%) | 0 (0.0%) |
| Mining, Quarrying, & Extraction | 0 (0.0%) | 0 (0.0%) |
| Construction | 25 (92.6%) | 2 (7.4%) |
| Manufacturing | 4 (100.0%) | 0 (0.0%) |
| Wholesale Trade | 6 (100.0%) | 0 (0.0%) |
| Retail Trade | 11 (73.3%) | 4 (26.7%) |
| Transportation & Warehousing | 0 (0.0%) | 2 (100.0%) |
| Utilities | 1 (100.0%) | 0 (0.0%) |
| Information | 0 (0.0%) | 0 (0.0%) |
| Finance & Insurance | 2 (33.3%) | 4 (66.7%) |
| Real Estate, Rental & Leasing | 0 (0.0%) | 0 (0.0%) |
| Professional & Scientific | 2 (66.7%) | 1 (33.3%) |
| Enterprise Management | 3 (100.0%) | 0 (0.0%) |
| Administrative & Support | 4 (80.0%) | 1 (20.0%) |
| Educational Services | 0 (0.0%) | 6 (100.0%) |
| Health Care & Social Assistance | 0 (0.0%) | 14 (100.0%) |
| Arts, Entertainment & Recreation | 0 (0.0%) | 0 (0.0%) |
| Accommodation & Food Services | 4 (40.0%) | 6 (60.0%) |
| Public Administration | 0 (0.0%) | 0 (0.0%) |
| Total | 69 (60.5%) | 45 (39.5%) |
Education in Taunton
School Enrollment in Taunton
The most common levels of schooling among the 45 students in Taunton are high school (21 | 46.7%), middle school (11 | 24.4%), and elementary school (5 | 11.1%).
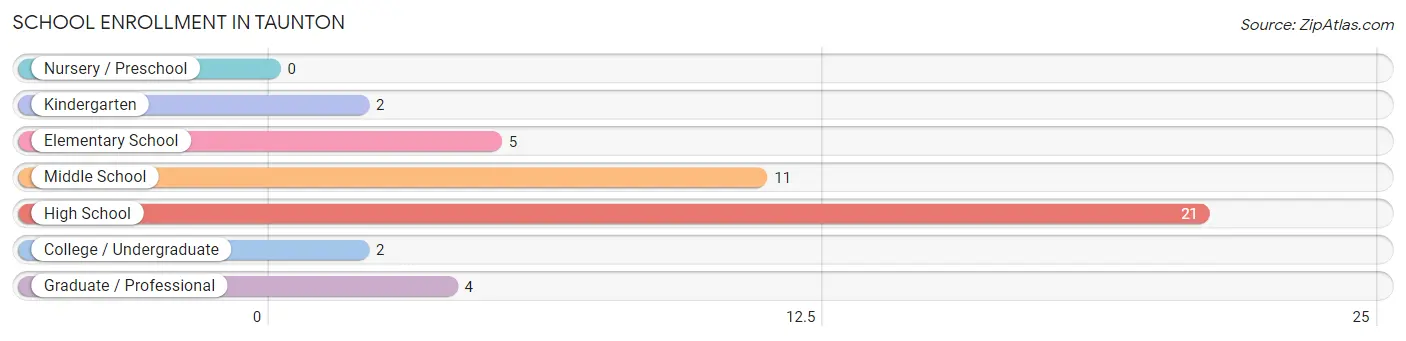
| School Level | # Students | % Students |
| Nursery / Preschool | 0 | 0.0% |
| Kindergarten | 2 | 4.4% |
| Elementary School | 5 | 11.1% |
| Middle School | 11 | 24.4% |
| High School | 21 | 46.7% |
| College / Undergraduate | 2 | 4.4% |
| Graduate / Professional | 4 | 8.9% |
| Total | 45 | 100.0% |
School Enrollment by Age by Funding Source in Taunton
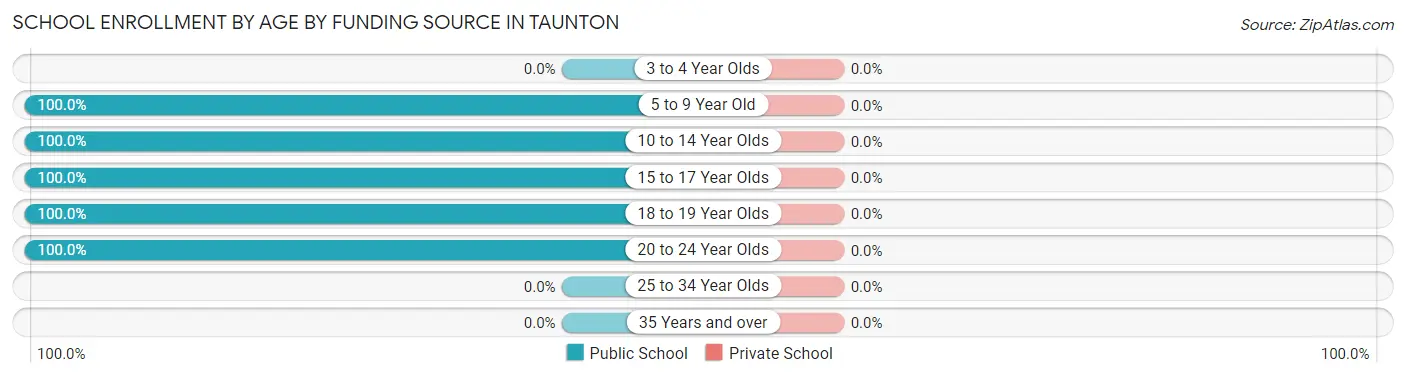
| Age Bracket | Public School | Private School |
| 3 to 4 Year Olds | 0 (0.0%) | 0 (0.0%) |
| 5 to 9 Year Old | 7 (100.0%) | 0 (0.0%) |
| 10 to 14 Year Olds | 13 (100.0%) | 0 (0.0%) |
| 15 to 17 Year Olds | 15 (100.0%) | 0 (0.0%) |
| 18 to 19 Year Olds | 6 (100.0%) | 0 (0.0%) |
| 20 to 24 Year Olds | 4 (100.0%) | 0 (0.0%) |
| 25 to 34 Year Olds | 0 (0.0%) | 0 (0.0%) |
| 35 Years and over | 0 (0.0%) | 0 (0.0%) |
| Total | 45 (100.0%) | 0 (0.0%) |
Educational Attainment by Field of Study in Taunton
Social sciences (5 | 25.0%), business (5 | 25.0%), education (3 | 15.0%), arts & humanities (3 | 15.0%), and bio, nature & agricultural (2 | 10.0%) are the most common fields of study among 20 individuals in Taunton who have obtained a bachelor's degree or higher.
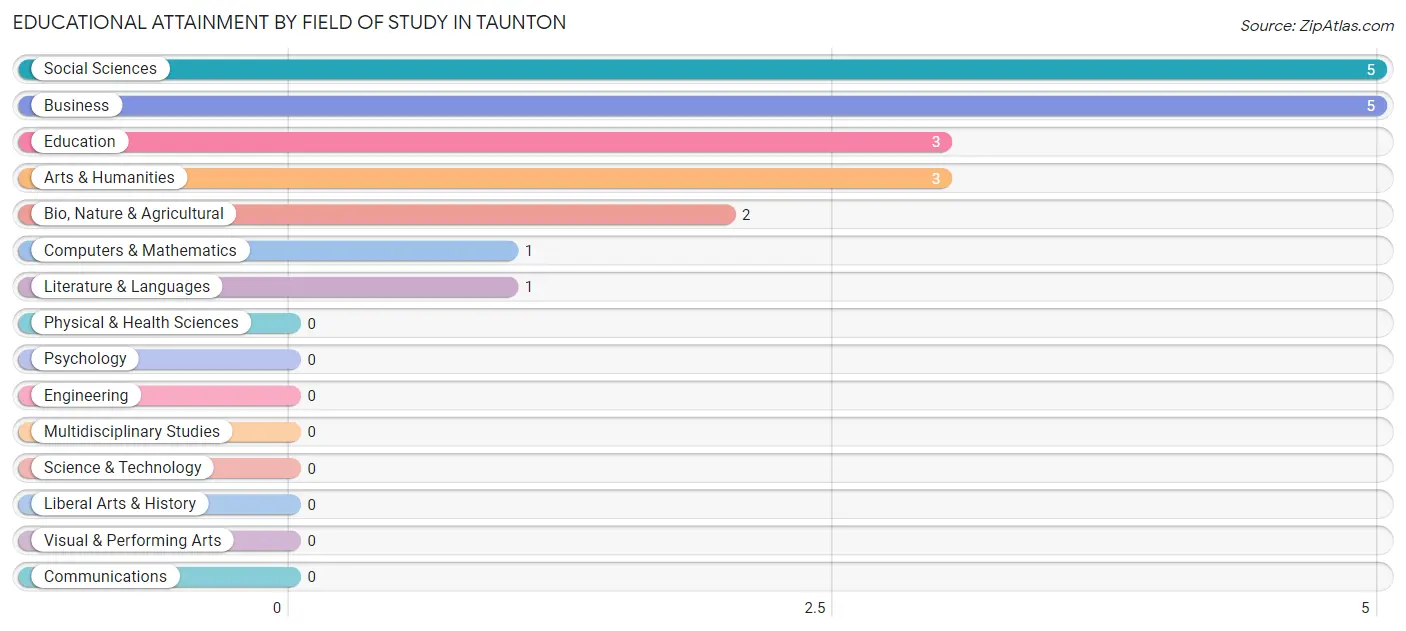
| Field of Study | # Graduates | % Graduates |
| Computers & Mathematics | 1 | 5.0% |
| Bio, Nature & Agricultural | 2 | 10.0% |
| Physical & Health Sciences | 0 | 0.0% |
| Psychology | 0 | 0.0% |
| Social Sciences | 5 | 25.0% |
| Engineering | 0 | 0.0% |
| Multidisciplinary Studies | 0 | 0.0% |
| Science & Technology | 0 | 0.0% |
| Business | 5 | 25.0% |
| Education | 3 | 15.0% |
| Literature & Languages | 1 | 5.0% |
| Liberal Arts & History | 0 | 0.0% |
| Visual & Performing Arts | 0 | 0.0% |
| Communications | 0 | 0.0% |
| Arts & Humanities | 3 | 15.0% |
| Total | 20 | 100.0% |
Transportation & Commute in Taunton
Vehicle Availability by Sex in Taunton
The most prevalent vehicle ownership categories in Taunton are males with 3 vehicles (29, accounting for 42.0%) and females with 3 vehicles (11, making up 70.7%).
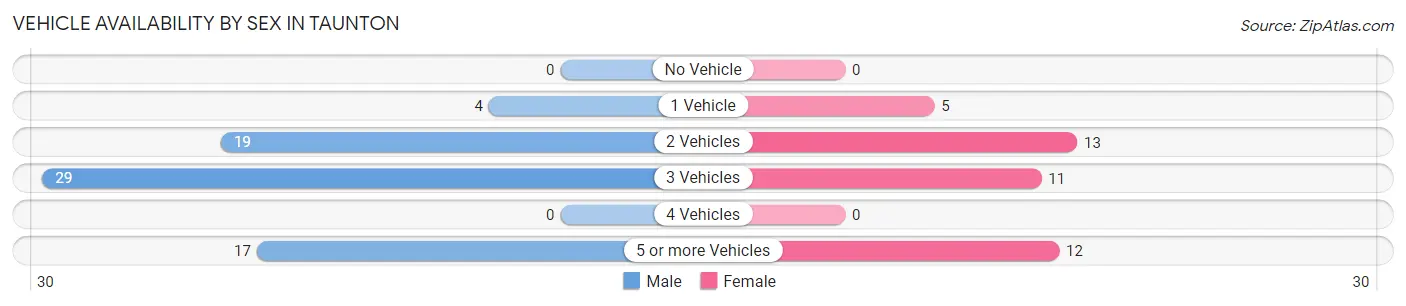
| Vehicles Available | Male | Female |
| No Vehicle | 0 (0.0%) | 0 (0.0%) |
| 1 Vehicle | 4 (5.8%) | 5 (12.2%) |
| 2 Vehicles | 19 (27.5%) | 13 (31.7%) |
| 3 Vehicles | 29 (42.0%) | 11 (26.8%) |
| 4 Vehicles | 0 (0.0%) | 0 (0.0%) |
| 5 or more Vehicles | 17 (24.6%) | 12 (29.3%) |
| Total | 69 (100.0%) | 41 (100.0%) |
Commute Time in Taunton
The most frequently occuring commute durations in Taunton are 20 to 24 minutes (40 commuters, 37.0%), 5 to 9 minutes (19 commuters, 17.6%), and 30 to 34 minutes (12 commuters, 11.1%).
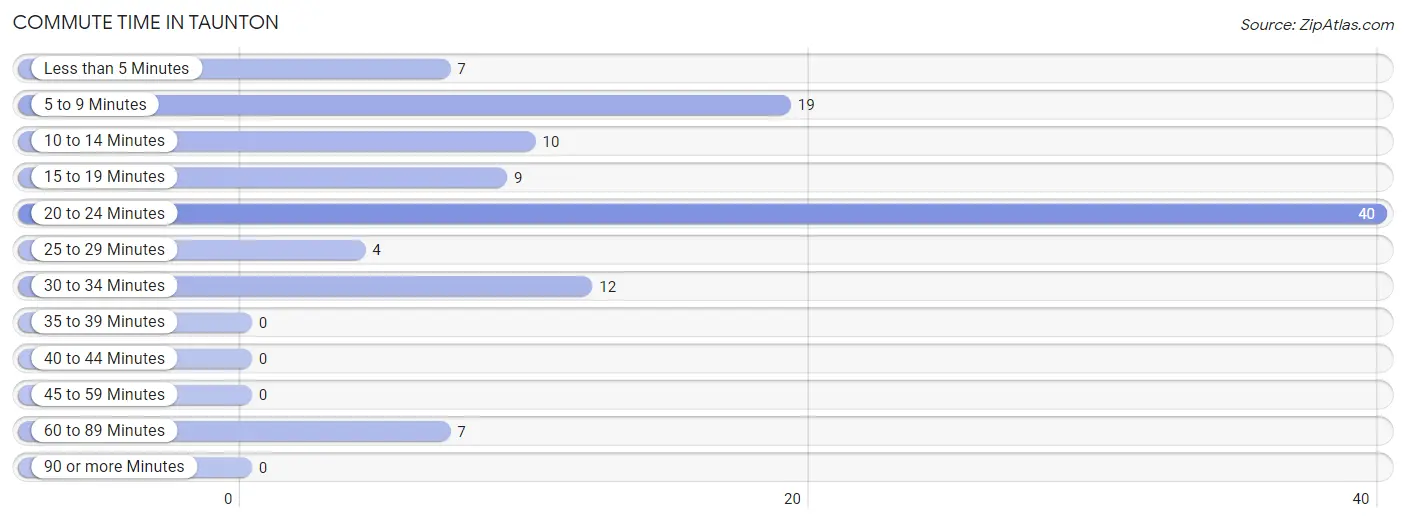
| Commute Time | # Commuters | % Commuters |
| Less than 5 Minutes | 7 | 6.5% |
| 5 to 9 Minutes | 19 | 17.6% |
| 10 to 14 Minutes | 10 | 9.3% |
| 15 to 19 Minutes | 9 | 8.3% |
| 20 to 24 Minutes | 40 | 37.0% |
| 25 to 29 Minutes | 4 | 3.7% |
| 30 to 34 Minutes | 12 | 11.1% |
| 35 to 39 Minutes | 0 | 0.0% |
| 40 to 44 Minutes | 0 | 0.0% |
| 45 to 59 Minutes | 0 | 0.0% |
| 60 to 89 Minutes | 7 | 6.5% |
| 90 or more Minutes | 0 | 0.0% |
Commute Time by Sex in Taunton
The most common commute times in Taunton are 20 to 24 minutes (22 commuters, 31.9%) for males and 20 to 24 minutes (18 commuters, 46.2%) for females.
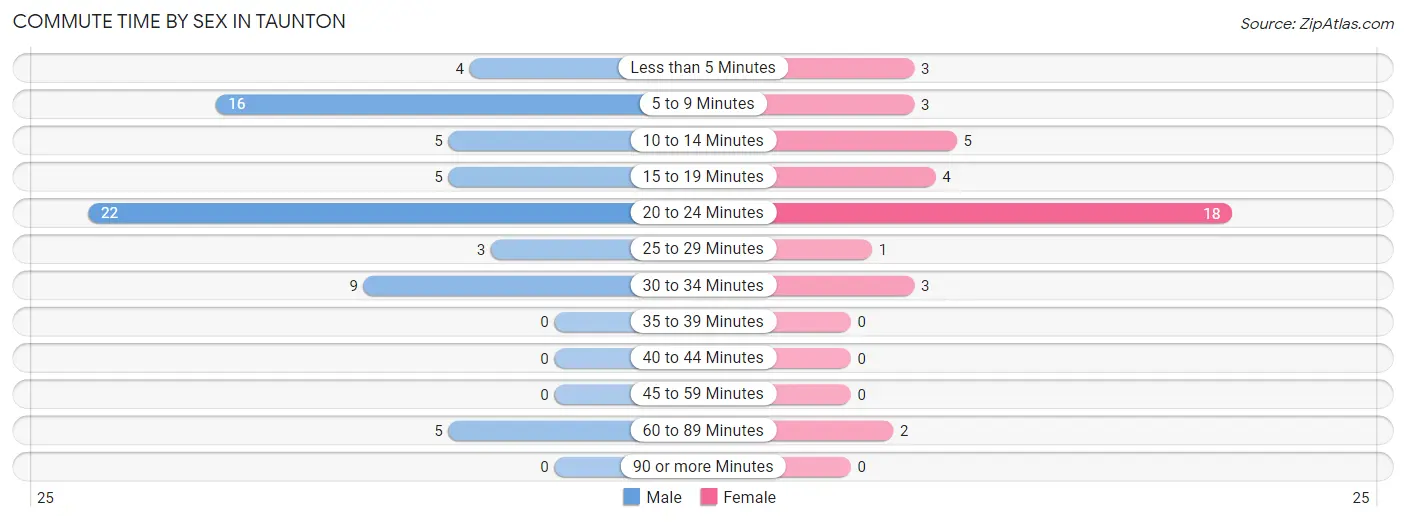
| Commute Time | Male | Female |
| Less than 5 Minutes | 4 (5.8%) | 3 (7.7%) |
| 5 to 9 Minutes | 16 (23.2%) | 3 (7.7%) |
| 10 to 14 Minutes | 5 (7.2%) | 5 (12.8%) |
| 15 to 19 Minutes | 5 (7.2%) | 4 (10.3%) |
| 20 to 24 Minutes | 22 (31.9%) | 18 (46.2%) |
| 25 to 29 Minutes | 3 (4.3%) | 1 (2.6%) |
| 30 to 34 Minutes | 9 (13.0%) | 3 (7.7%) |
| 35 to 39 Minutes | 0 (0.0%) | 0 (0.0%) |
| 40 to 44 Minutes | 0 (0.0%) | 0 (0.0%) |
| 45 to 59 Minutes | 0 (0.0%) | 0 (0.0%) |
| 60 to 89 Minutes | 5 (7.2%) | 2 (5.1%) |
| 90 or more Minutes | 0 (0.0%) | 0 (0.0%) |
Time of Departure to Work by Sex in Taunton
The most frequent times of departure to work in Taunton are 7:00 AM to 7:29 AM (18, 26.1%) for males and 7:30 AM to 7:59 AM (11, 28.2%) for females.
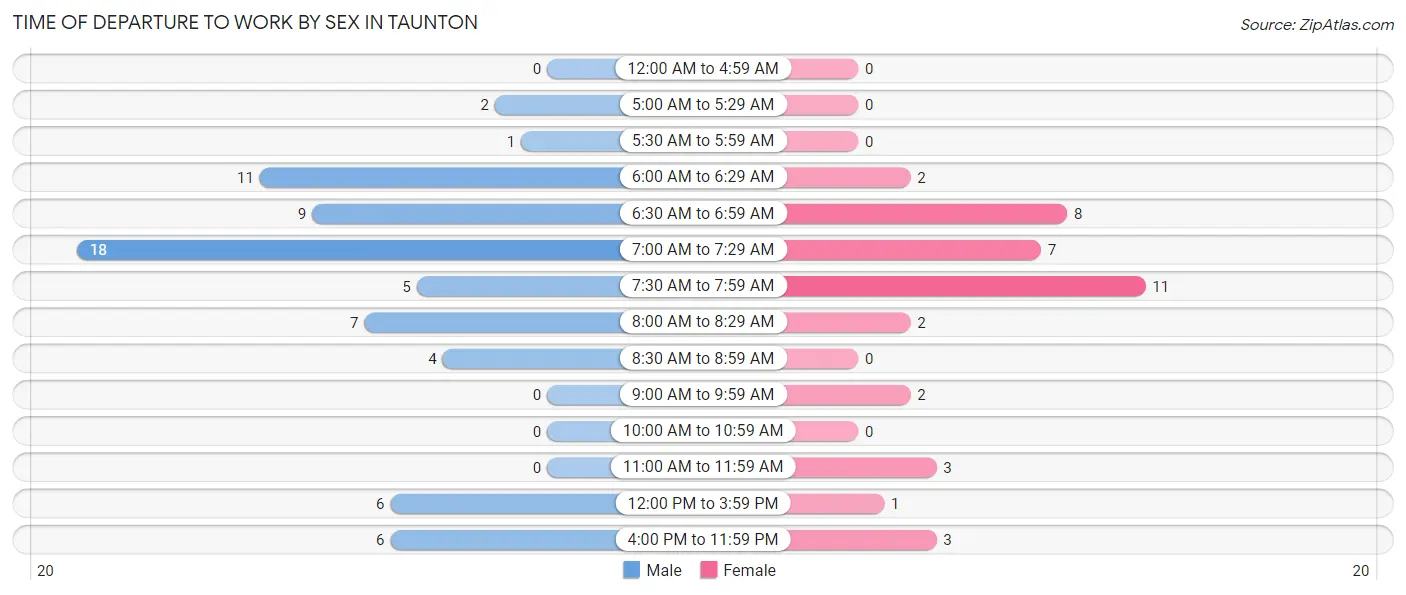
| Time of Departure | Male | Female |
| 12:00 AM to 4:59 AM | 0 (0.0%) | 0 (0.0%) |
| 5:00 AM to 5:29 AM | 2 (2.9%) | 0 (0.0%) |
| 5:30 AM to 5:59 AM | 1 (1.5%) | 0 (0.0%) |
| 6:00 AM to 6:29 AM | 11 (15.9%) | 2 (5.1%) |
| 6:30 AM to 6:59 AM | 9 (13.0%) | 8 (20.5%) |
| 7:00 AM to 7:29 AM | 18 (26.1%) | 7 (17.9%) |
| 7:30 AM to 7:59 AM | 5 (7.2%) | 11 (28.2%) |
| 8:00 AM to 8:29 AM | 7 (10.1%) | 2 (5.1%) |
| 8:30 AM to 8:59 AM | 4 (5.8%) | 0 (0.0%) |
| 9:00 AM to 9:59 AM | 0 (0.0%) | 2 (5.1%) |
| 10:00 AM to 10:59 AM | 0 (0.0%) | 0 (0.0%) |
| 11:00 AM to 11:59 AM | 0 (0.0%) | 3 (7.7%) |
| 12:00 PM to 3:59 PM | 6 (8.7%) | 1 (2.6%) |
| 4:00 PM to 11:59 PM | 6 (8.7%) | 3 (7.7%) |
| Total | 69 (100.0%) | 39 (100.0%) |
Housing Occupancy in Taunton
Occupancy by Ownership in Taunton
Of the total 81 dwellings in Taunton, owner-occupied units account for 73 (90.1%), while renter-occupied units make up 8 (9.9%).
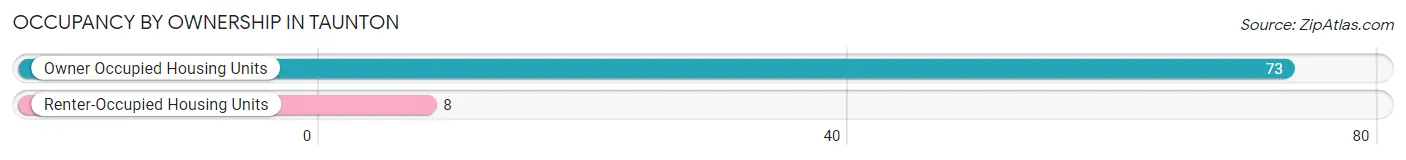
| Occupancy | # Housing Units | % Housing Units |
| Owner Occupied Housing Units | 73 | 90.1% |
| Renter-Occupied Housing Units | 8 | 9.9% |
| Total Occupied Housing Units | 81 | 100.0% |
Occupancy by Household Size in Taunton
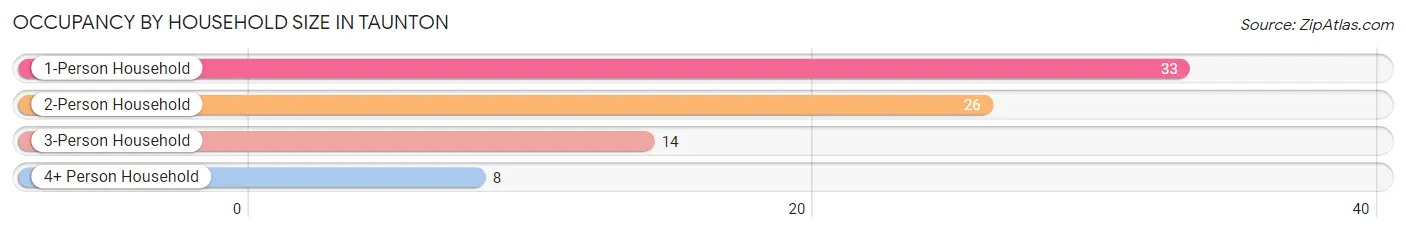
| Household Size | # Housing Units | % Housing Units |
| 1-Person Household | 33 | 40.7% |
| 2-Person Household | 26 | 32.1% |
| 3-Person Household | 14 | 17.3% |
| 4+ Person Household | 8 | 9.9% |
| Total Housing Units | 81 | 100.0% |
Occupancy by Ownership by Household Size in Taunton
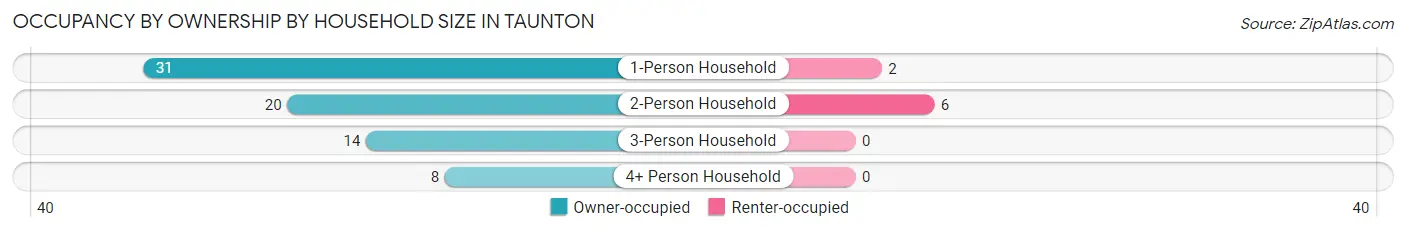
| Household Size | Owner-occupied | Renter-occupied |
| 1-Person Household | 31 (93.9%) | 2 (6.1%) |
| 2-Person Household | 20 (76.9%) | 6 (23.1%) |
| 3-Person Household | 14 (100.0%) | 0 (0.0%) |
| 4+ Person Household | 8 (100.0%) | 0 (0.0%) |
| Total Housing Units | 73 (90.1%) | 8 (9.9%) |
Occupancy by Educational Attainment in Taunton
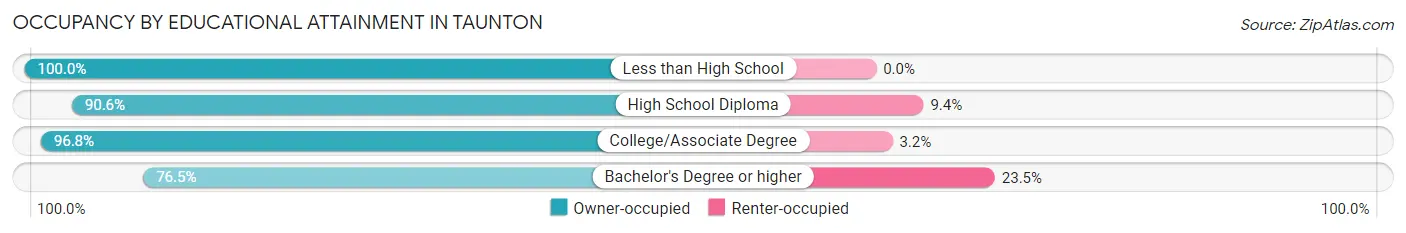
| Household Size | Owner-occupied | Renter-occupied |
| Less than High School | 1 (100.0%) | 0 (0.0%) |
| High School Diploma | 29 (90.6%) | 3 (9.4%) |
| College/Associate Degree | 30 (96.8%) | 1 (3.2%) |
| Bachelor's Degree or higher | 13 (76.5%) | 4 (23.5%) |
Occupancy by Age of Householder in Taunton
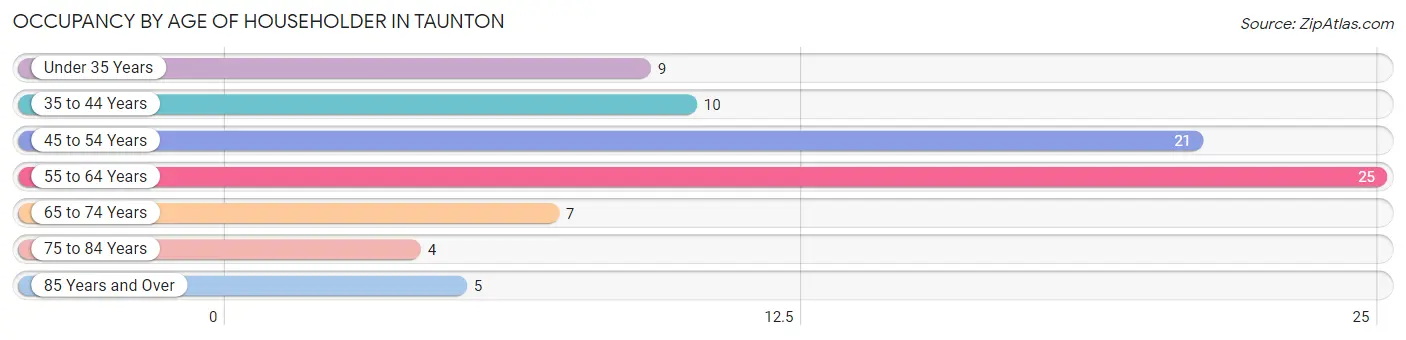
| Age Bracket | # Households | % Households |
| Under 35 Years | 9 | 11.1% |
| 35 to 44 Years | 10 | 12.3% |
| 45 to 54 Years | 21 | 25.9% |
| 55 to 64 Years | 25 | 30.9% |
| 65 to 74 Years | 7 | 8.6% |
| 75 to 84 Years | 4 | 4.9% |
| 85 Years and Over | 5 | 6.2% |
| Total | 81 | 100.0% |
Housing Finances in Taunton
Median Income by Occupancy in Taunton
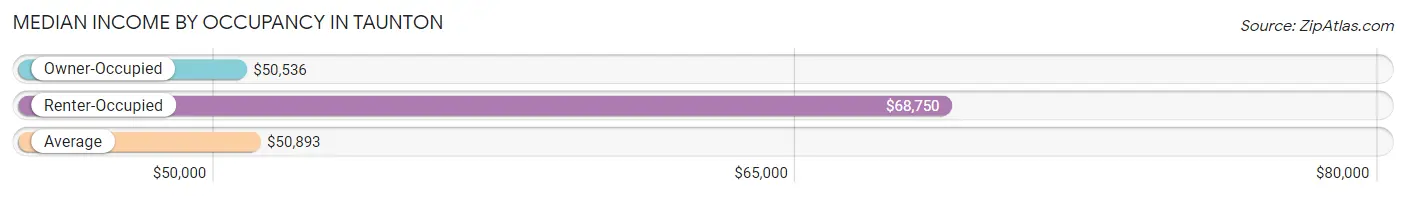
| Occupancy Type | # Households | Median Income |
| Owner-Occupied | 73 (90.1%) | $50,536 |
| Renter-Occupied | 8 (9.9%) | $68,750 |
| Average | 81 (100.0%) | $50,893 |
Occupancy by Householder Income Bracket in Taunton
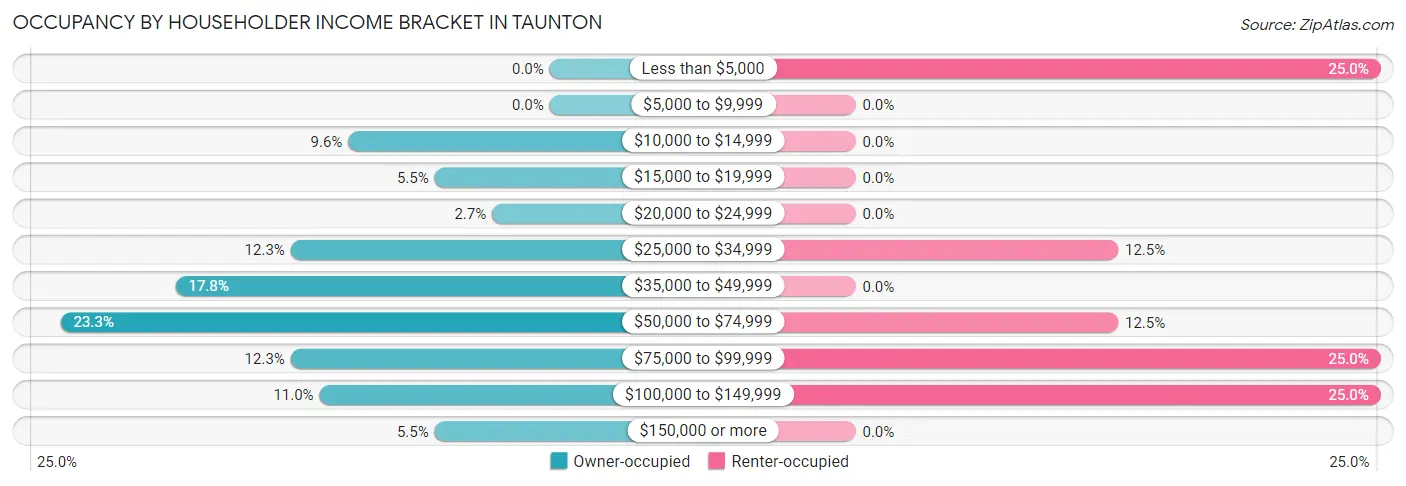
| Income Bracket | Owner-occupied | Renter-occupied |
| Less than $5,000 | 0 (0.0%) | 2 (25.0%) |
| $5,000 to $9,999 | 0 (0.0%) | 0 (0.0%) |
| $10,000 to $14,999 | 7 (9.6%) | 0 (0.0%) |
| $15,000 to $19,999 | 4 (5.5%) | 0 (0.0%) |
| $20,000 to $24,999 | 2 (2.7%) | 0 (0.0%) |
| $25,000 to $34,999 | 9 (12.3%) | 1 (12.5%) |
| $35,000 to $49,999 | 13 (17.8%) | 0 (0.0%) |
| $50,000 to $74,999 | 17 (23.3%) | 1 (12.5%) |
| $75,000 to $99,999 | 9 (12.3%) | 2 (25.0%) |
| $100,000 to $149,999 | 8 (11.0%) | 2 (25.0%) |
| $150,000 or more | 4 (5.5%) | 0 (0.0%) |
| Total | 73 (100.0%) | 8 (100.0%) |
Monthly Housing Cost Tiers in Taunton
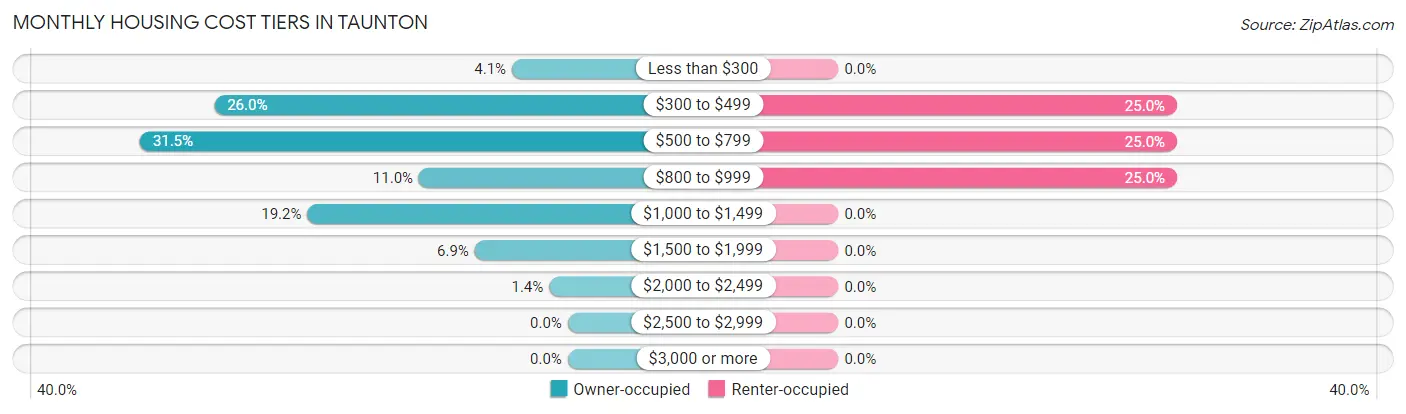
| Monthly Cost | Owner-occupied | Renter-occupied |
| Less than $300 | 3 (4.1%) | 0 (0.0%) |
| $300 to $499 | 19 (26.0%) | 2 (25.0%) |
| $500 to $799 | 23 (31.5%) | 2 (25.0%) |
| $800 to $999 | 8 (11.0%) | 2 (25.0%) |
| $1,000 to $1,499 | 14 (19.2%) | 0 (0.0%) |
| $1,500 to $1,999 | 5 (6.9%) | 0 (0.0%) |
| $2,000 to $2,499 | 1 (1.4%) | 0 (0.0%) |
| $2,500 to $2,999 | 0 (0.0%) | 0 (0.0%) |
| $3,000 or more | 0 (0.0%) | 0 (0.0%) |
| Total | 73 (100.0%) | 8 (100.0%) |
Physical Housing Characteristics in Taunton
Housing Structures in Taunton
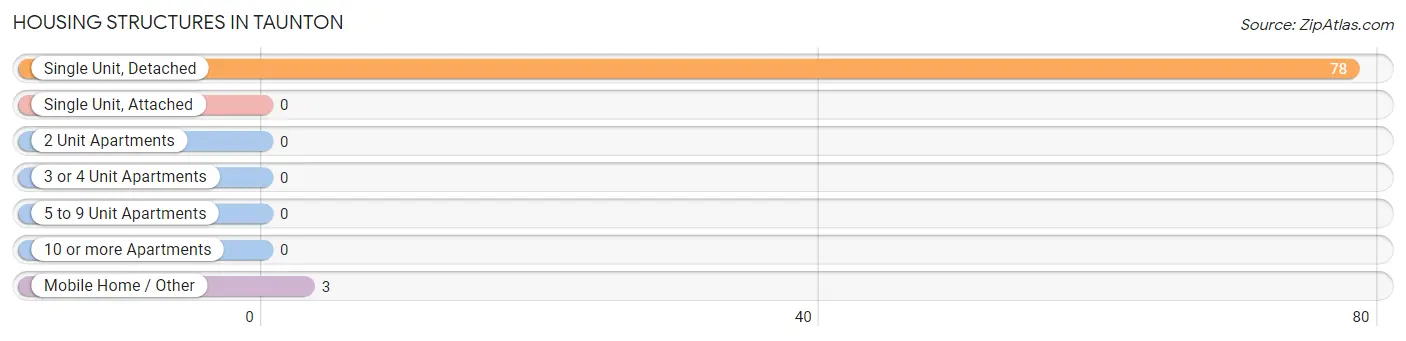
| Structure Type | # Housing Units | % Housing Units |
| Single Unit, Detached | 78 | 96.3% |
| Single Unit, Attached | 0 | 0.0% |
| 2 Unit Apartments | 0 | 0.0% |
| 3 or 4 Unit Apartments | 0 | 0.0% |
| 5 to 9 Unit Apartments | 0 | 0.0% |
| 10 or more Apartments | 0 | 0.0% |
| Mobile Home / Other | 3 | 3.7% |
| Total | 81 | 100.0% |
Housing Structures by Occupancy in Taunton
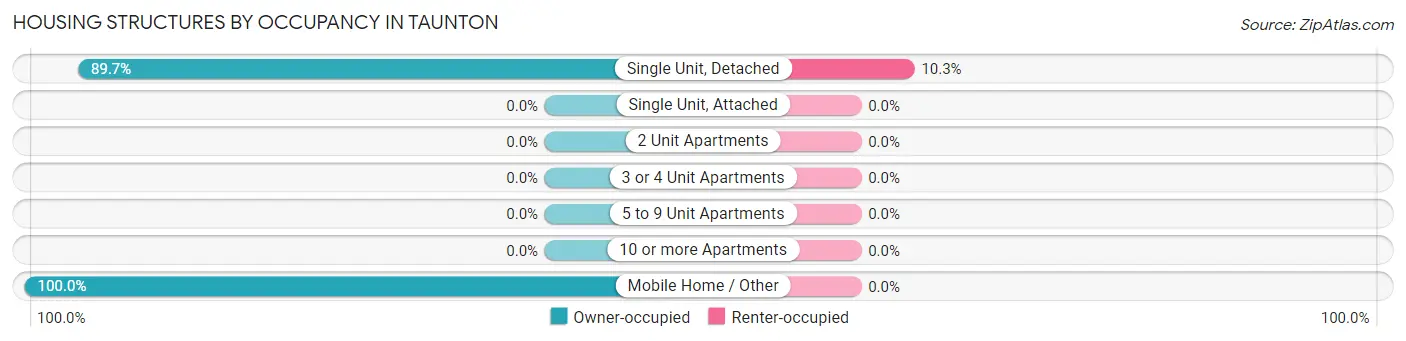
| Structure Type | Owner-occupied | Renter-occupied |
| Single Unit, Detached | 70 (89.7%) | 8 (10.3%) |
| Single Unit, Attached | 0 (0.0%) | 0 (0.0%) |
| 2 Unit Apartments | 0 (0.0%) | 0 (0.0%) |
| 3 or 4 Unit Apartments | 0 (0.0%) | 0 (0.0%) |
| 5 to 9 Unit Apartments | 0 (0.0%) | 0 (0.0%) |
| 10 or more Apartments | 0 (0.0%) | 0 (0.0%) |
| Mobile Home / Other | 3 (100.0%) | 0 (0.0%) |
| Total | 73 (90.1%) | 8 (9.9%) |
Housing Structures by Number of Rooms in Taunton
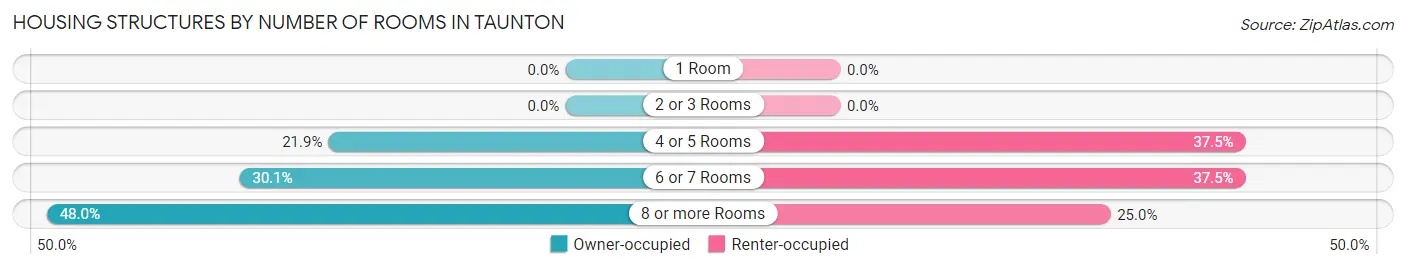
| Number of Rooms | Owner-occupied | Renter-occupied |
| 1 Room | 0 (0.0%) | 0 (0.0%) |
| 2 or 3 Rooms | 0 (0.0%) | 0 (0.0%) |
| 4 or 5 Rooms | 16 (21.9%) | 3 (37.5%) |
| 6 or 7 Rooms | 22 (30.1%) | 3 (37.5%) |
| 8 or more Rooms | 35 (47.9%) | 2 (25.0%) |
| Total | 73 (100.0%) | 8 (100.0%) |
Housing Structure by Heating Type in Taunton
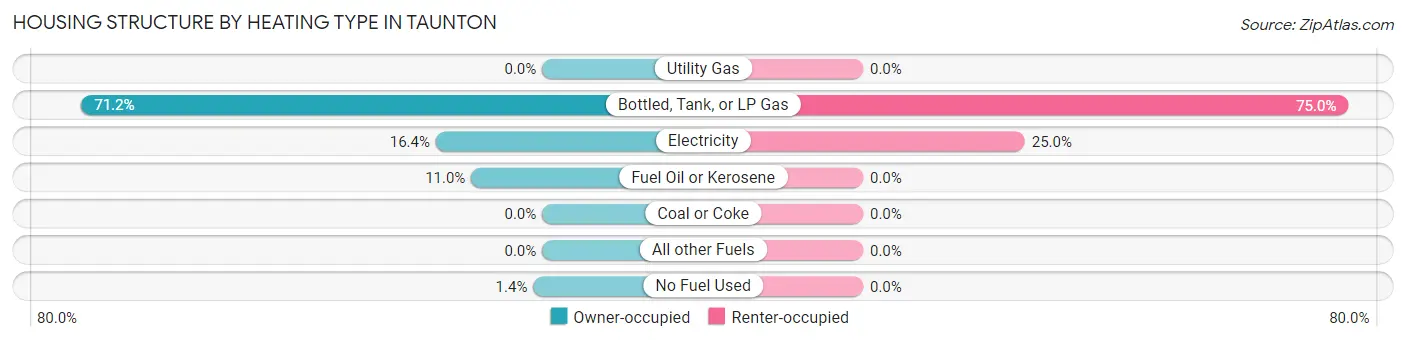
| Heating Type | Owner-occupied | Renter-occupied |
| Utility Gas | 0 (0.0%) | 0 (0.0%) |
| Bottled, Tank, or LP Gas | 52 (71.2%) | 6 (75.0%) |
| Electricity | 12 (16.4%) | 2 (25.0%) |
| Fuel Oil or Kerosene | 8 (11.0%) | 0 (0.0%) |
| Coal or Coke | 0 (0.0%) | 0 (0.0%) |
| All other Fuels | 0 (0.0%) | 0 (0.0%) |
| No Fuel Used | 1 (1.4%) | 0 (0.0%) |
| Total | 73 (100.0%) | 8 (100.0%) |
Household Vehicle Usage in Taunton
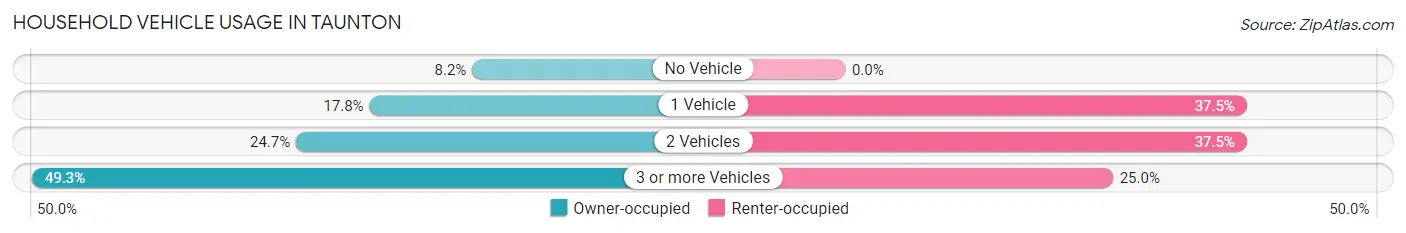
| Vehicles per Household | Owner-occupied | Renter-occupied |
| No Vehicle | 6 (8.2%) | 0 (0.0%) |
| 1 Vehicle | 13 (17.8%) | 3 (37.5%) |
| 2 Vehicles | 18 (24.7%) | 3 (37.5%) |
| 3 or more Vehicles | 36 (49.3%) | 2 (25.0%) |
| Total | 73 (100.0%) | 8 (100.0%) |
Real Estate & Mortgages in Taunton
Real Estate and Mortgage Overview in Taunton
| Characteristic | Without Mortgage | With Mortgage |
| Housing Units | 26 | 47 |
| Median Property Value | $65,700 | $66,400 |
| Median Household Income | $51,429 | $4 |
| Monthly Housing Costs | $438 | $0 |
| Real Estate Taxes | $800 | $0 |
Property Value by Mortgage Status in Taunton
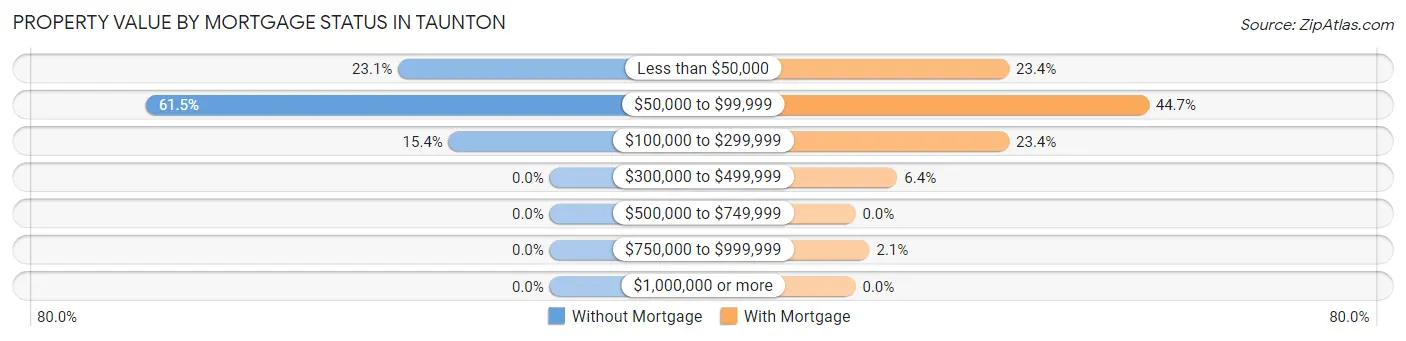
| Property Value | Without Mortgage | With Mortgage |
| Less than $50,000 | 6 (23.1%) | 11 (23.4%) |
| $50,000 to $99,999 | 16 (61.5%) | 21 (44.7%) |
| $100,000 to $299,999 | 4 (15.4%) | 11 (23.4%) |
| $300,000 to $499,999 | 0 (0.0%) | 3 (6.4%) |
| $500,000 to $749,999 | 0 (0.0%) | 0 (0.0%) |
| $750,000 to $999,999 | 0 (0.0%) | 1 (2.1%) |
| $1,000,000 or more | 0 (0.0%) | 0 (0.0%) |
| Total | 26 (100.0%) | 47 (100.0%) |
Household Income by Mortgage Status in Taunton
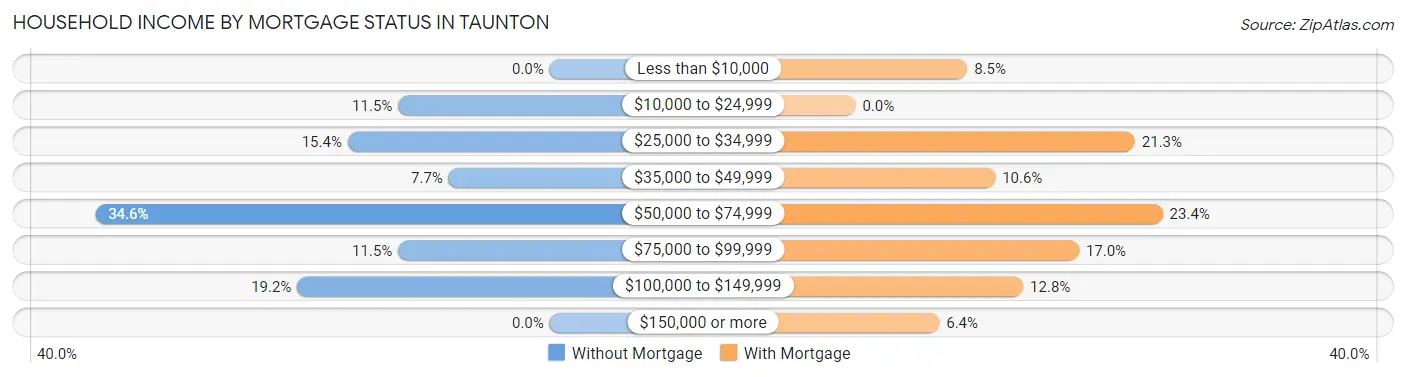
| Household Income | Without Mortgage | With Mortgage |
| Less than $10,000 | 0 (0.0%) | 4 (8.5%) |
| $10,000 to $24,999 | 3 (11.5%) | 0 (0.0%) |
| $25,000 to $34,999 | 4 (15.4%) | 10 (21.3%) |
| $35,000 to $49,999 | 2 (7.7%) | 5 (10.6%) |
| $50,000 to $74,999 | 9 (34.6%) | 11 (23.4%) |
| $75,000 to $99,999 | 3 (11.5%) | 8 (17.0%) |
| $100,000 to $149,999 | 5 (19.2%) | 6 (12.8%) |
| $150,000 or more | 0 (0.0%) | 3 (6.4%) |
| Total | 26 (100.0%) | 47 (100.0%) |
Property Value to Household Income Ratio in Taunton
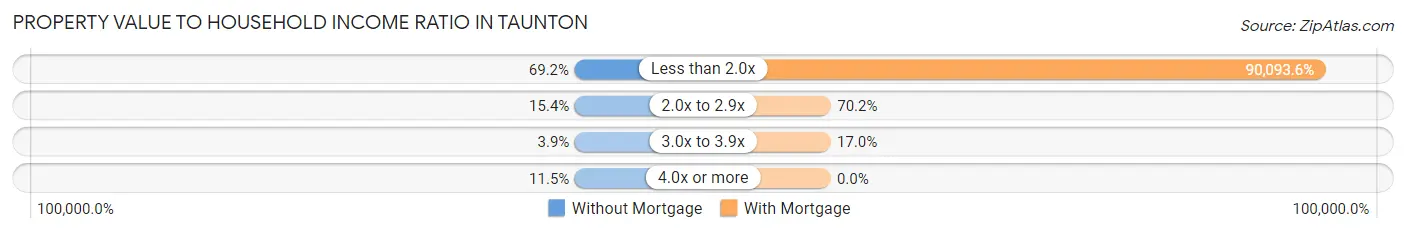
| Value-to-Income Ratio | Without Mortgage | With Mortgage |
| Less than 2.0x | 18 (69.2%) | 42,344 (90,093.6%) |
| 2.0x to 2.9x | 4 (15.4%) | 33 (70.2%) |
| 3.0x to 3.9x | 1 (3.8%) | 8 (17.0%) |
| 4.0x or more | 3 (11.5%) | 0 (0.0%) |
| Total | 26 (100.0%) | 47 (100.0%) |
Real Estate Taxes by Mortgage Status in Taunton
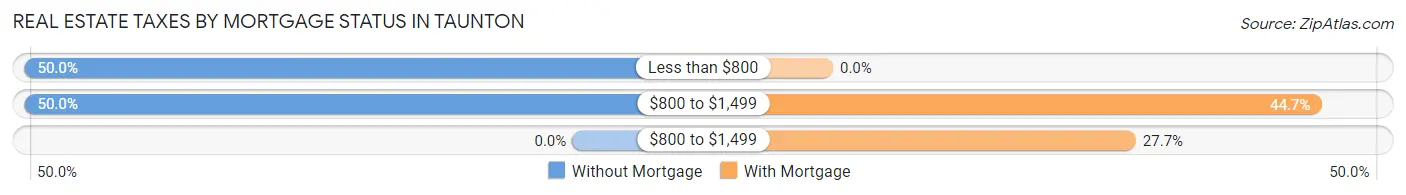
| Property Taxes | Without Mortgage | With Mortgage |
| Less than $800 | 13 (50.0%) | 0 (0.0%) |
| $800 to $1,499 | 13 (50.0%) | 21 (44.7%) |
| $800 to $1,499 | 0 (0.0%) | 13 (27.7%) |
| Total | 26 (100.0%) | 47 (100.0%) |
Health & Disability in Taunton
Health Insurance Coverage by Age in Taunton
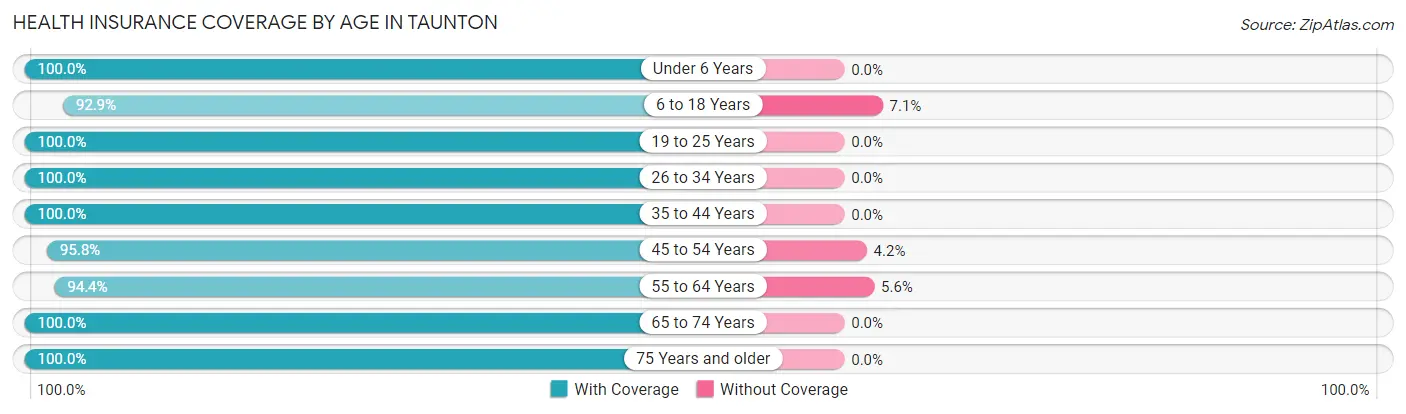
| Age Bracket | With Coverage | Without Coverage |
| Under 6 Years | 3 (100.0%) | 0 (0.0%) |
| 6 to 18 Years | 39 (92.9%) | 3 (7.1%) |
| 19 to 25 Years | 15 (100.0%) | 0 (0.0%) |
| 26 to 34 Years | 15 (100.0%) | 0 (0.0%) |
| 35 to 44 Years | 16 (100.0%) | 0 (0.0%) |
| 45 to 54 Years | 23 (95.8%) | 1 (4.2%) |
| 55 to 64 Years | 34 (94.4%) | 2 (5.6%) |
| 65 to 74 Years | 8 (100.0%) | 0 (0.0%) |
| 75 Years and older | 10 (100.0%) | 0 (0.0%) |
| Total | 163 (96.5%) | 6 (3.5%) |
Health Insurance Coverage by Citizenship Status in Taunton
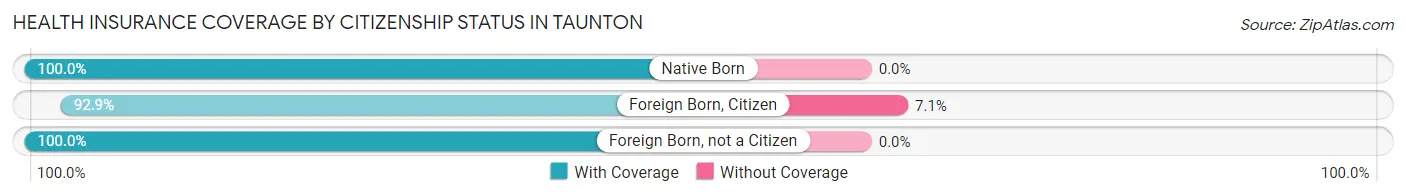
| Citizenship Status | With Coverage | Without Coverage |
| Native Born | 3 (100.0%) | 0 (0.0%) |
| Foreign Born, Citizen | 39 (92.9%) | 3 (7.1%) |
| Foreign Born, not a Citizen | 15 (100.0%) | 0 (0.0%) |
Health Insurance Coverage by Household Income in Taunton
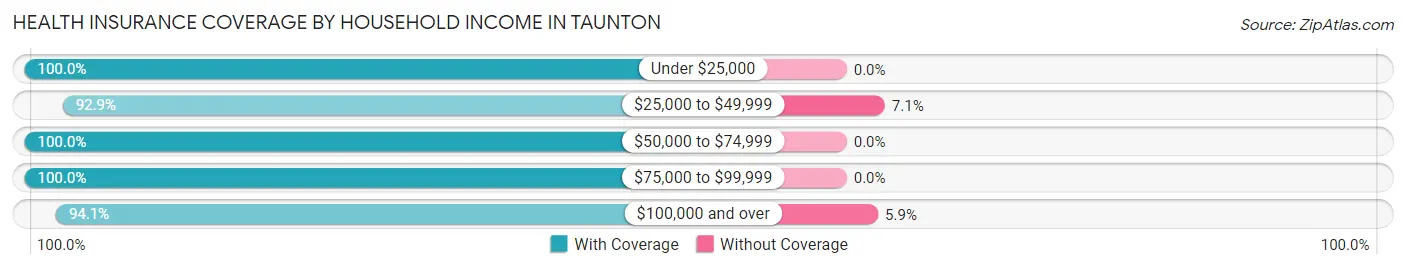
| Household Income | With Coverage | Without Coverage |
| Under $25,000 | 23 (100.0%) | 0 (0.0%) |
| $25,000 to $49,999 | 39 (92.9%) | 3 (7.1%) |
| $50,000 to $74,999 | 30 (100.0%) | 0 (0.0%) |
| $75,000 to $99,999 | 23 (100.0%) | 0 (0.0%) |
| $100,000 and over | 48 (94.1%) | 3 (5.9%) |
Public vs Private Health Insurance Coverage by Age in Taunton
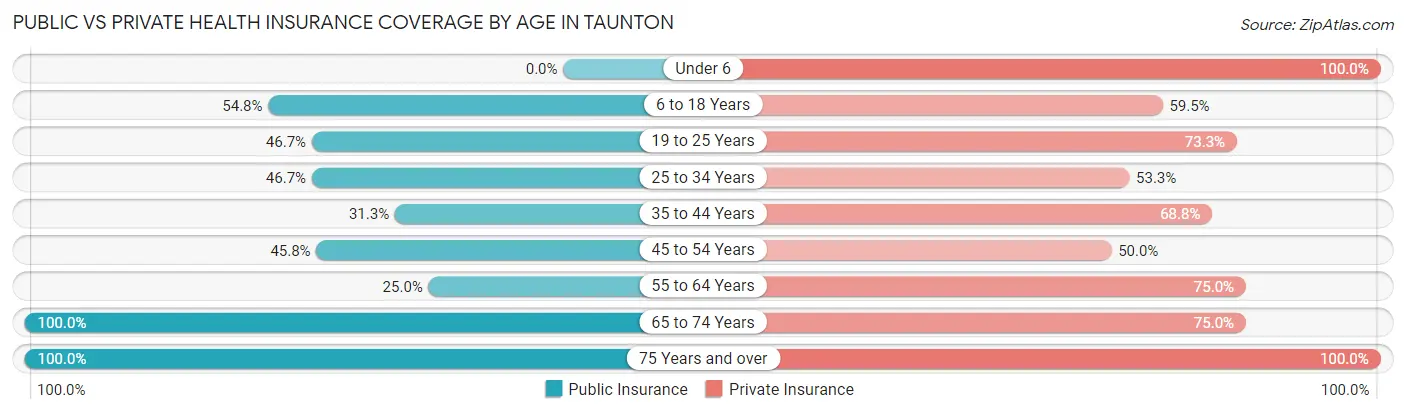
| Age Bracket | Public Insurance | Private Insurance |
| Under 6 | 0 (0.0%) | 3 (100.0%) |
| 6 to 18 Years | 23 (54.8%) | 25 (59.5%) |
| 19 to 25 Years | 7 (46.7%) | 11 (73.3%) |
| 25 to 34 Years | 7 (46.7%) | 8 (53.3%) |
| 35 to 44 Years | 5 (31.2%) | 11 (68.8%) |
| 45 to 54 Years | 11 (45.8%) | 12 (50.0%) |
| 55 to 64 Years | 9 (25.0%) | 27 (75.0%) |
| 65 to 74 Years | 8 (100.0%) | 6 (75.0%) |
| 75 Years and over | 10 (100.0%) | 10 (100.0%) |
| Total | 80 (47.3%) | 113 (66.9%) |
Disability Status by Sex by Age in Taunton
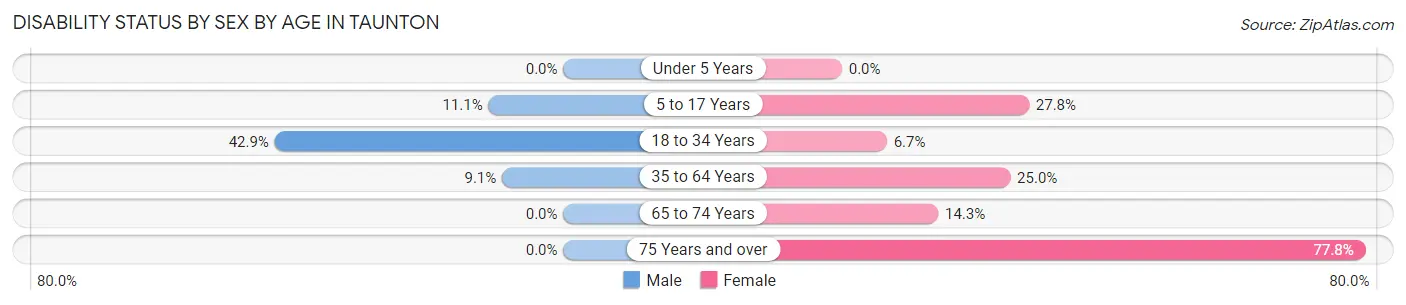
| Age Bracket | Male | Female |
| Under 5 Years | 0 (0.0%) | 0 (0.0%) |
| 5 to 17 Years | 2 (11.1%) | 5 (27.8%) |
| 18 to 34 Years | 9 (42.9%) | 1 (6.7%) |
| 35 to 64 Years | 4 (9.1%) | 8 (25.0%) |
| 65 to 74 Years | 0 (0.0%) | 1 (14.3%) |
| 75 Years and over | 0 (0.0%) | 7 (77.8%) |
Disability Class by Sex by Age in Taunton
Disability Class: Hearing Difficulty
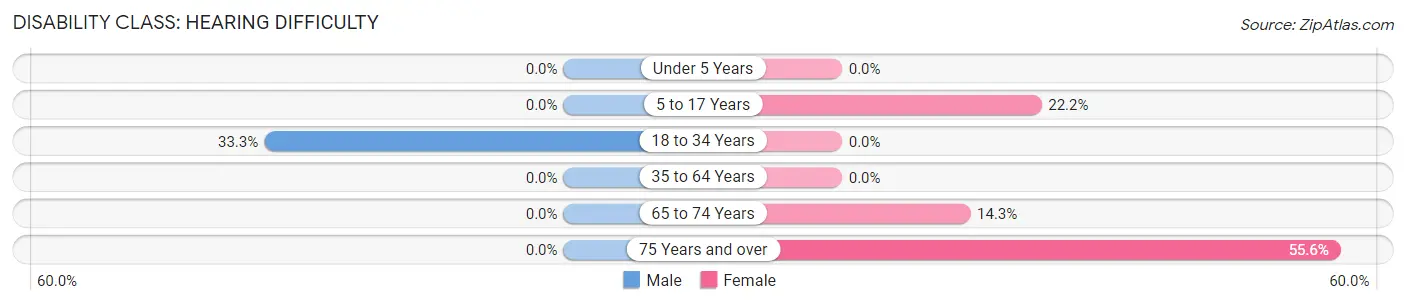
| Age Bracket | Male | Female |
| Under 5 Years | 0 (0.0%) | 0 (0.0%) |
| 5 to 17 Years | 0 (0.0%) | 4 (22.2%) |
| 18 to 34 Years | 7 (33.3%) | 0 (0.0%) |
| 35 to 64 Years | 0 (0.0%) | 0 (0.0%) |
| 65 to 74 Years | 0 (0.0%) | 1 (14.3%) |
| 75 Years and over | 0 (0.0%) | 5 (55.6%) |
Disability Class: Vision Difficulty
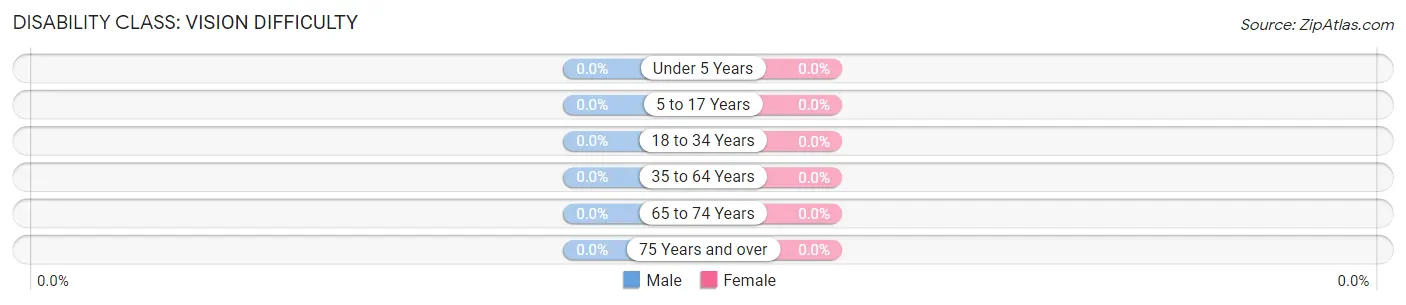
| Age Bracket | Male | Female |
| Under 5 Years | 0 (0.0%) | 0 (0.0%) |
| 5 to 17 Years | 0 (0.0%) | 0 (0.0%) |
| 18 to 34 Years | 0 (0.0%) | 0 (0.0%) |
| 35 to 64 Years | 0 (0.0%) | 0 (0.0%) |
| 65 to 74 Years | 0 (0.0%) | 0 (0.0%) |
| 75 Years and over | 0 (0.0%) | 0 (0.0%) |
Disability Class: Cognitive Difficulty
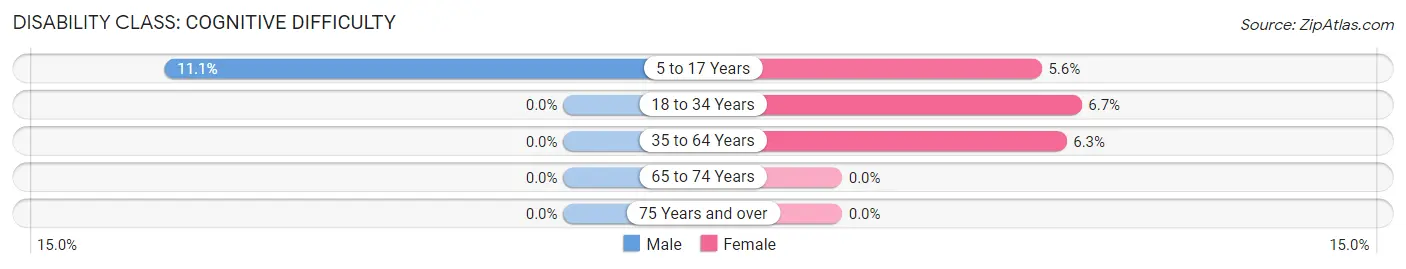
| Age Bracket | Male | Female |
| 5 to 17 Years | 2 (11.1%) | 1 (5.6%) |
| 18 to 34 Years | 0 (0.0%) | 1 (6.7%) |
| 35 to 64 Years | 0 (0.0%) | 2 (6.2%) |
| 65 to 74 Years | 0 (0.0%) | 0 (0.0%) |
| 75 Years and over | 0 (0.0%) | 0 (0.0%) |
Disability Class: Ambulatory Difficulty
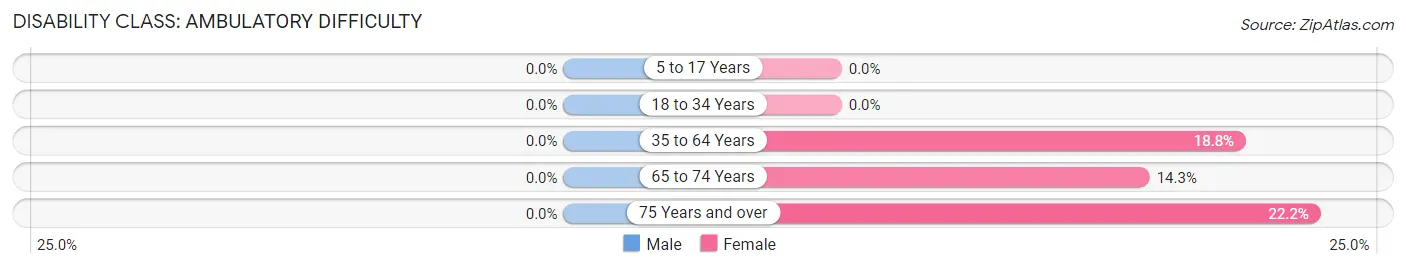
| Age Bracket | Male | Female |
| 5 to 17 Years | 0 (0.0%) | 0 (0.0%) |
| 18 to 34 Years | 0 (0.0%) | 0 (0.0%) |
| 35 to 64 Years | 0 (0.0%) | 6 (18.8%) |
| 65 to 74 Years | 0 (0.0%) | 1 (14.3%) |
| 75 Years and over | 0 (0.0%) | 2 (22.2%) |
Disability Class: Self-Care Difficulty
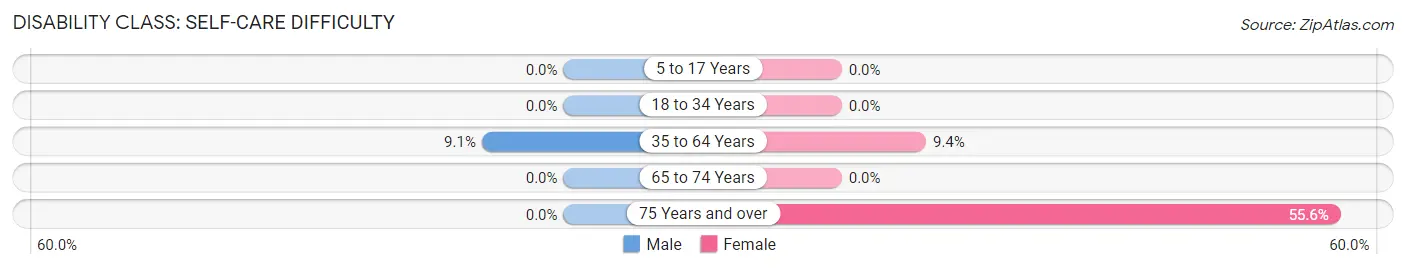
| Age Bracket | Male | Female |
| 5 to 17 Years | 0 (0.0%) | 0 (0.0%) |
| 18 to 34 Years | 0 (0.0%) | 0 (0.0%) |
| 35 to 64 Years | 4 (9.1%) | 3 (9.4%) |
| 65 to 74 Years | 0 (0.0%) | 0 (0.0%) |
| 75 Years and over | 0 (0.0%) | 5 (55.6%) |
Technology Access in Taunton
Computing Device Access in Taunton
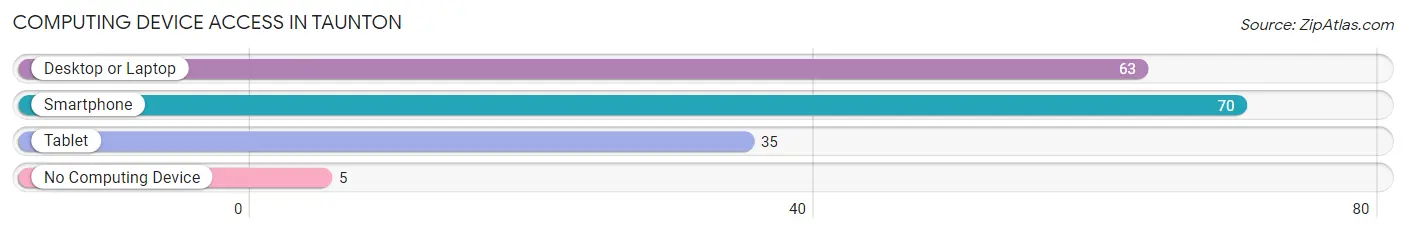
| Device Type | # Households | % Households |
| Desktop or Laptop | 63 | 77.8% |
| Smartphone | 70 | 86.4% |
| Tablet | 35 | 43.2% |
| No Computing Device | 5 | 6.2% |
| Total | 81 | 100.0% |
Internet Access in Taunton
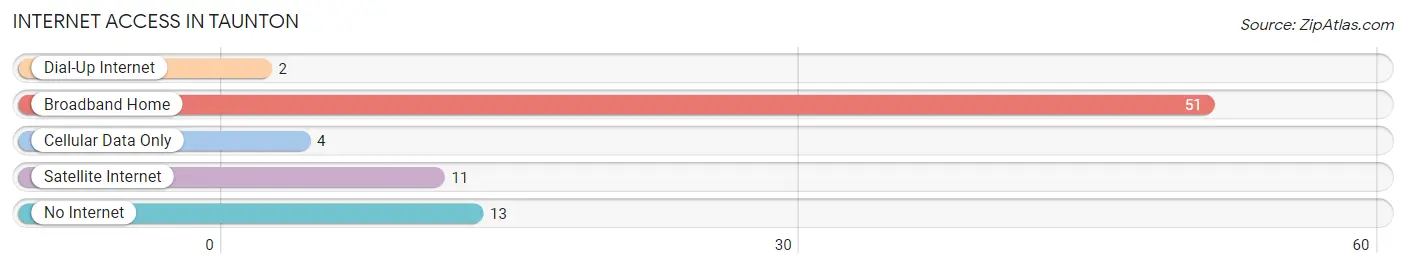
| Internet Type | # Households | % Households |
| Dial-Up Internet | 2 | 2.5% |
| Broadband Home | 51 | 63.0% |
| Cellular Data Only | 4 | 4.9% |
| Satellite Internet | 11 | 13.6% |
| No Internet | 13 | 16.1% |
| Total | 81 | 100.0% |
Taunton Summary
Taunton is a small city located in the state of Minnesota, United States. It is situated in the southwestern corner of the state, in the county of Blue Earth. The city has a population of approximately 1,400 people, according to the 2010 census.
History
Taunton was founded in 1856 by a group of settlers from the nearby town of Mankato. The settlers were looking for a place to settle and farm, and they chose the area around Taunton because of its fertile soil and abundant water supply. The town was named after Taunton, Massachusetts, the hometown of one of the settlers.
The first settlers in Taunton were mostly farmers, and the town quickly grew to become an important agricultural center. In 1872, the first railroad line was built through the town, connecting it to the larger cities of Mankato and St. Paul. This allowed for the transportation of goods and people, and helped to further the growth of the town.
In the late 19th century, Taunton became a popular destination for tourists, as it was located near several lakes and rivers. The town was also known for its mineral springs, which were believed to have healing properties.
Geography
Taunton is located in the southwestern corner of Minnesota, in the county of Blue Earth. The city is situated on the banks of the Blue Earth River, and is surrounded by rolling hills and farmland. The city is located about 50 miles south of the Twin Cities of Minneapolis and St. Paul.
The climate in Taunton is typical of the Midwest, with cold winters and hot summers. The average temperature in the winter is around 20 degrees Fahrenheit, and in the summer it is around 75 degrees Fahrenheit.
Economy
Taunton’s economy is largely based on agriculture. The town is home to several large farms, which produce a variety of crops, including corn, soybeans, and wheat. The town is also home to several small businesses, including restaurants, retail stores, and service providers.
The city is also home to several manufacturing companies, which produce a variety of products, including furniture, clothing, and electronics.
Demographics
According to the 2010 census, the population of Taunton was 1,400 people. The racial makeup of the city was 95.3% White, 0.7% African American, 0.3% Native American, 0.3% Asian, and 3.4% from other races.
The median household income in Taunton was $41,250, and the median family income was $50,000. The per capita income was $20,000. The unemployment rate in the city was 4.2%.
Conclusion
Taunton is a small city located in the southwestern corner of Minnesota. It was founded in 1856 by a group of settlers from the nearby town of Mankato, and has since grown to become an important agricultural center. The city is home to several large farms, as well as several small businesses and manufacturing companies. The population of Taunton is approximately 1,400 people, and the median household income is $41,250.
Common Questions
What is Per Capita Income in Taunton?
Per Capita income in Taunton is $29,685.
What is the Median Family Income in Taunton?
Median Family Income in Taunton is $66,250.
What is the Median Household income in Taunton?
Median Household Income in Taunton is $50,893.
What is Income or Wage Gap in Taunton?
Income or Wage Gap in Taunton is 1.8%.
Women in Taunton earn 98.2 cents for every dollar earned by a man.
What is Inequality or Gini Index in Taunton?
Inequality or Gini Index in Taunton is 0.40.
What is the Total Population of Taunton?
Total Population of Taunton is 169.
What is the Total Male Population of Taunton?
Total Male Population of Taunton is 87.
What is the Total Female Population of Taunton?
Total Female Population of Taunton is 82.
What is the Ratio of Males per 100 Females in Taunton?
There are 106.10 Males per 100 Females in Taunton.
What is the Ratio of Females per 100 Males in Taunton?
There are 94.25 Females per 100 Males in Taunton.
What is the Median Population Age in Taunton?
Median Population Age in Taunton is 42.6 Years.
What is the Average Family Size in Taunton
Average Family Size in Taunton is 3.0 People.
What is the Average Household Size in Taunton
Average Household Size in Taunton is 2.1 People.
How Large is the Labor Force in Taunton?
There are 115 People in the Labor Forcein in Taunton.
What is the Percentage of People in the Labor Force in Taunton?
79.9% of People are in the Labor Force in Taunton.
What is the Unemployment Rate in Taunton?
Unemployment Rate in Taunton is 0.9%.