Zip Codes with the Highest Percentage of Population Employed in Legal Services & Support in Minnesota
RELATED REPORTS & OPTIONS
Legal Services & Support
Minnesota
Compare Zip Codes
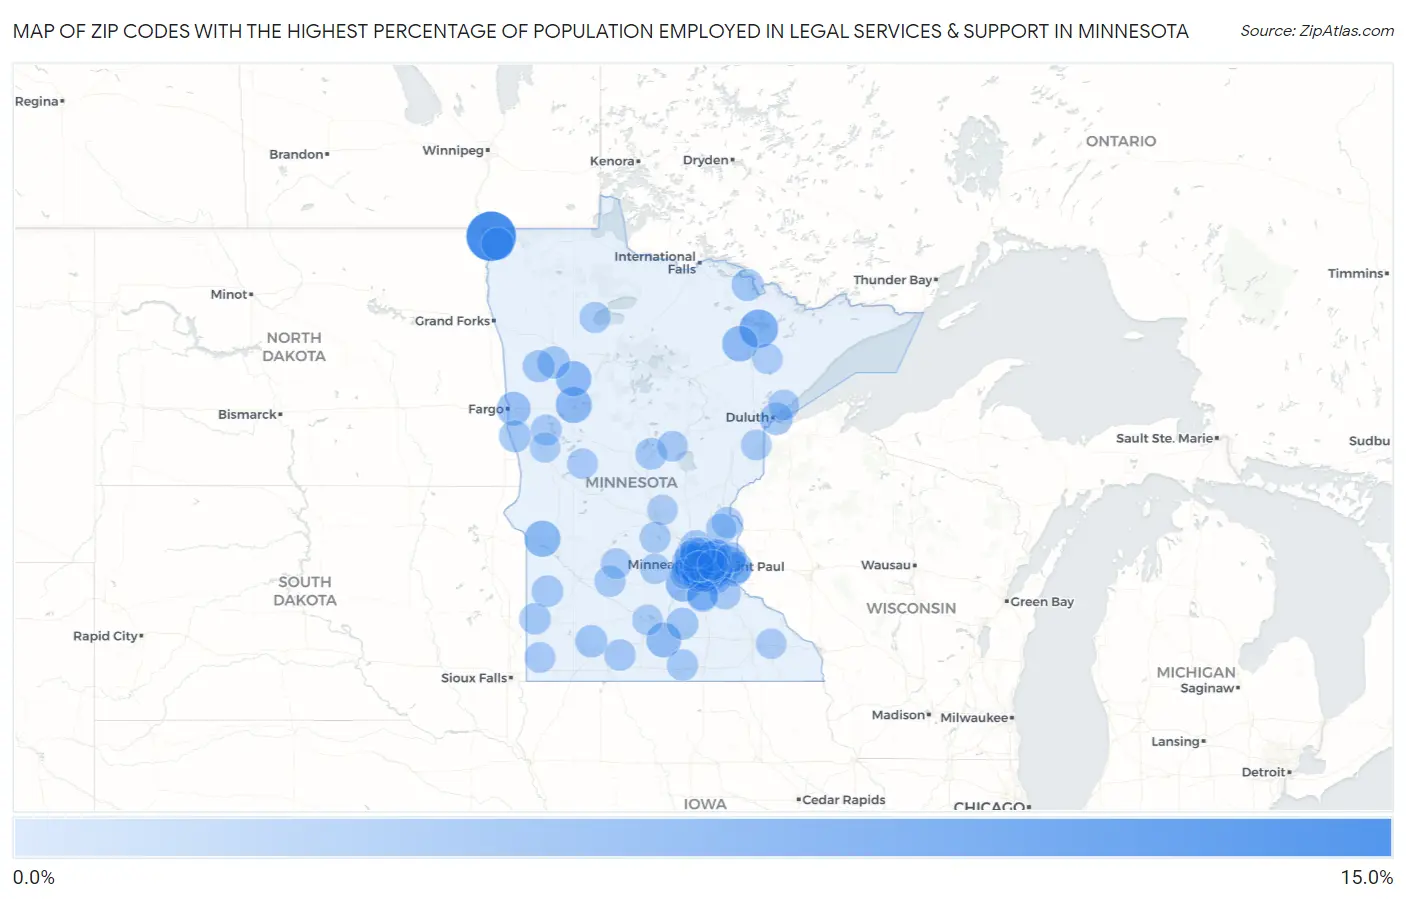
Map of Zip Codes with the Highest Percentage of Population Employed in Legal Services & Support in Minnesota
0.0%
15.0%
Zip Codes with the Highest Percentage of Population Employed in Legal Services & Support in Minnesota
| Zip Code | % Employed | vs State | vs National | |
| 1. | 56731 | 12.1% | 1.0%(+11.1)#1 | 1.2%(+10.9)#116 |
| 2. | 55424 | 8.2% | 1.0%(+7.20)#2 | 1.2%(+7.05)#244 |
| 3. | 55402 | 8.0% | 1.0%(+6.98)#3 | 1.2%(+6.83)#264 |
| 4. | 55790 | 5.9% | 1.0%(+4.88)#4 | 1.2%(+4.73)#498 |
| 5. | 55419 | 5.1% | 1.0%(+4.07)#5 | 1.2%(+3.92)#691 |
| 6. | 55401 | 5.0% | 1.0%(+3.93)#6 | 1.2%(+3.78)#727 |
| 7. | 55105 | 4.8% | 1.0%(+3.76)#7 | 1.2%(+3.61)#780 |
| 8. | 56227 | 4.5% | 1.0%(+3.48)#8 | 1.2%(+3.33)#893 |
| 9. | 56578 | 4.5% | 1.0%(+3.45)#9 | 1.2%(+3.29)#903 |
| 10. | 55315 | 4.4% | 1.0%(+3.36)#10 | 1.2%(+3.20)#945 |
| 11. | 55710 | 4.2% | 1.0%(+3.21)#11 | 1.2%(+3.06)#1,005 |
| 12. | 55356 | 4.2% | 1.0%(+3.20)#12 | 1.2%(+3.05)#1,009 |
| 13. | 55410 | 4.2% | 1.0%(+3.18)#13 | 1.2%(+3.03)#1,015 |
| 14. | 56566 | 4.1% | 1.0%(+3.06)#14 | 1.2%(+2.91)#1,086 |
| 15. | 56037 | 3.9% | 1.0%(+2.83)#15 | 1.2%(+2.68)#1,198 |
| 16. | 55439 | 3.8% | 1.0%(+2.81)#16 | 1.2%(+2.66)#1,208 |
| 17. | 55108 | 3.6% | 1.0%(+2.58)#17 | 1.2%(+2.42)#1,344 |
| 18. | 55405 | 3.4% | 1.0%(+2.42)#18 | 1.2%(+2.26)#1,475 |
| 19. | 56529 | 3.3% | 1.0%(+2.29)#19 | 1.2%(+2.13)#1,563 |
| 20. | 55436 | 3.2% | 1.0%(+2.22)#20 | 1.2%(+2.06)#1,611 |
| 21. | 55391 | 3.2% | 1.0%(+2.17)#21 | 1.2%(+2.02)#1,650 |
| 22. | 55120 | 3.2% | 1.0%(+2.15)#22 | 1.2%(+2.00)#1,666 |
| 23. | 55415 | 2.9% | 1.0%(+1.84)#23 | 1.2%(+1.68)#2,006 |
| 24. | 55042 | 2.8% | 1.0%(+1.81)#24 | 1.2%(+1.65)#2,036 |
| 25. | 55127 | 2.7% | 1.0%(+1.65)#25 | 1.2%(+1.50)#2,233 |
| 26. | 55001 | 2.7% | 1.0%(+1.63)#26 | 1.2%(+1.47)#2,260 |
| 27. | 55802 | 2.7% | 1.0%(+1.62)#27 | 1.2%(+1.47)#2,265 |
| 28. | 55102 | 2.6% | 1.0%(+1.59)#28 | 1.2%(+1.44)#2,314 |
| 29. | 55413 | 2.5% | 1.0%(+1.52)#29 | 1.2%(+1.36)#2,441 |
| 30. | 55123 | 2.5% | 1.0%(+1.48)#30 | 1.2%(+1.33)#2,487 |
| 31. | 55043 | 2.5% | 1.0%(+1.46)#31 | 1.2%(+1.31)#2,529 |
| 32. | 56728 | 2.5% | 1.0%(+1.45)#32 | 1.2%(+1.30)#2,539 |
| 33. | 55116 | 2.5% | 1.0%(+1.44)#33 | 1.2%(+1.29)#2,553 |
| 34. | 56516 | 2.5% | 1.0%(+1.44)#34 | 1.2%(+1.29)#2,567 |
| 35. | 56174 | 2.4% | 1.0%(+1.39)#35 | 1.2%(+1.24)#2,630 |
| 36. | 55447 | 2.4% | 1.0%(+1.38)#36 | 1.2%(+1.23)#2,653 |
| 37. | 55327 | 2.4% | 1.0%(+1.35)#37 | 1.2%(+1.20)#2,700 |
| 38. | 55416 | 2.4% | 1.0%(+1.35)#38 | 1.2%(+1.20)#2,701 |
| 39. | 55446 | 2.4% | 1.0%(+1.32)#39 | 1.2%(+1.17)#2,747 |
| 40. | 55422 | 2.4% | 1.0%(+1.32)#40 | 1.2%(+1.17)#2,754 |
| 41. | 56545 | 2.3% | 1.0%(+1.27)#41 | 1.2%(+1.12)#2,848 |
| 42. | 55101 | 2.3% | 1.0%(+1.26)#42 | 1.2%(+1.11)#2,853 |
| 43. | 55407 | 2.3% | 1.0%(+1.26)#43 | 1.2%(+1.11)#2,856 |
| 44. | 56594 | 2.3% | 1.0%(+1.25)#44 | 1.2%(+1.10)#2,869 |
| 45. | 55441 | 2.2% | 1.0%(+1.20)#45 | 1.2%(+1.05)#2,971 |
| 46. | 55725 | 2.2% | 1.0%(+1.19)#46 | 1.2%(+1.04)#2,990 |
| 47. | 56028 | 2.2% | 1.0%(+1.13)#47 | 1.2%(+0.982)#3,101 |
| 48. | 55409 | 2.1% | 1.0%(+1.12)#48 | 1.2%(+0.966)#3,139 |
| 49. | 55344 | 2.1% | 1.0%(+1.08)#49 | 1.2%(+0.927)#3,206 |
| 50. | 55126 | 2.1% | 1.0%(+1.07)#50 | 1.2%(+0.915)#3,232 |
| 51. | 56291 | 2.1% | 1.0%(+1.06)#51 | 1.2%(+0.908)#3,242 |
| 52. | 56425 | 2.1% | 1.0%(+1.05)#52 | 1.2%(+0.899)#3,264 |
| 53. | 55346 | 2.0% | 1.0%(+1.01)#53 | 1.2%(+0.861)#3,347 |
| 54. | 55331 | 2.0% | 1.0%(+1.01)#54 | 1.2%(+0.856)#3,365 |
| 55. | 56149 | 2.0% | 1.0%(+1.01)#55 | 1.2%(+0.853)#3,370 |
| 56. | 55107 | 2.0% | 1.0%(+1.01)#56 | 1.2%(+0.853)#3,373 |
| 57. | 55118 | 2.0% | 1.0%(+0.930)#57 | 1.2%(+0.778)#3,572 |
| 58. | 56160 | 2.0% | 1.0%(+0.930)#58 | 1.2%(+0.777)#3,577 |
| 59. | 55054 | 2.0% | 1.0%(+0.920)#59 | 1.2%(+0.768)#3,594 |
| 60. | 55031 | 1.9% | 1.0%(+0.866)#60 | 1.2%(+0.714)#3,737 |
| 61. | 55347 | 1.9% | 1.0%(+0.851)#61 | 1.2%(+0.699)#3,772 |
| 62. | 56097 | 1.9% | 1.0%(+0.850)#62 | 1.2%(+0.697)#3,777 |
| 63. | 55382 | 1.9% | 1.0%(+0.828)#63 | 1.2%(+0.676)#3,843 |
| 64. | 55056 | 1.8% | 1.0%(+0.817)#64 | 1.2%(+0.664)#3,868 |
| 65. | 55403 | 1.8% | 1.0%(+0.816)#65 | 1.2%(+0.664)#3,872 |
| 66. | 55345 | 1.8% | 1.0%(+0.773)#66 | 1.2%(+0.621)#3,990 |
| 67. | 55435 | 1.8% | 1.0%(+0.772)#67 | 1.2%(+0.620)#3,993 |
| 68. | 55113 | 1.8% | 1.0%(+0.766)#68 | 1.2%(+0.613)#4,014 |
| 69. | 56277 | 1.8% | 1.0%(+0.733)#69 | 1.2%(+0.580)#4,096 |
| 70. | 55431 | 1.7% | 1.0%(+0.717)#70 | 1.2%(+0.565)#4,148 |
| 71. | 56671 | 1.7% | 1.0%(+0.707)#71 | 1.2%(+0.554)#4,180 |
| 72. | 55406 | 1.7% | 1.0%(+0.697)#72 | 1.2%(+0.545)#4,214 |
| 73. | 55454 | 1.7% | 1.0%(+0.681)#73 | 1.2%(+0.529)#4,282 |
| 74. | 55417 | 1.7% | 1.0%(+0.676)#74 | 1.2%(+0.523)#4,293 |
| 75. | 56572 | 1.7% | 1.0%(+0.674)#75 | 1.2%(+0.521)#4,300 |
| 76. | 55418 | 1.7% | 1.0%(+0.670)#76 | 1.2%(+0.518)#4,310 |
| 77. | 55804 | 1.7% | 1.0%(+0.641)#77 | 1.2%(+0.489)#4,413 |
| 78. | 55104 | 1.6% | 1.0%(+0.614)#78 | 1.2%(+0.461)#4,499 |
| 79. | 55020 | 1.6% | 1.0%(+0.604)#79 | 1.2%(+0.452)#4,546 |
| 80. | 56444 | 1.6% | 1.0%(+0.598)#80 | 1.2%(+0.446)#4,568 |
| 81. | 56021 | 1.6% | 1.0%(+0.597)#81 | 1.2%(+0.445)#4,573 |
| 82. | 56253 | 1.6% | 1.0%(+0.585)#82 | 1.2%(+0.433)#4,620 |
| 83. | 55426 | 1.6% | 1.0%(+0.573)#83 | 1.2%(+0.420)#4,662 |
| 84. | 55112 | 1.6% | 1.0%(+0.557)#84 | 1.2%(+0.404)#4,715 |
| 85. | 56134 | 1.6% | 1.0%(+0.556)#85 | 1.2%(+0.403)#4,720 |
| 86. | 55082 | 1.6% | 1.0%(+0.539)#86 | 1.2%(+0.386)#4,780 |
| 87. | 55340 | 1.6% | 1.0%(+0.535)#87 | 1.2%(+0.383)#4,791 |
| 88. | 55749 | 1.6% | 1.0%(+0.531)#88 | 1.2%(+0.379)#4,803 |
| 89. | 56588 | 1.5% | 1.0%(+0.507)#89 | 1.2%(+0.355)#4,892 |
| 90. | 55386 | 1.5% | 1.0%(+0.499)#90 | 1.2%(+0.347)#4,918 |
| 91. | 55445 | 1.5% | 1.0%(+0.478)#91 | 1.2%(+0.325)#5,013 |
| 92. | 56379 | 1.5% | 1.0%(+0.446)#92 | 1.2%(+0.293)#5,139 |
| 93. | 55705 | 1.5% | 1.0%(+0.445)#93 | 1.2%(+0.293)#5,144 |
| 94. | 55381 | 1.5% | 1.0%(+0.436)#94 | 1.2%(+0.284)#5,184 |
| 95. | 55311 | 1.5% | 1.0%(+0.428)#95 | 1.2%(+0.275)#5,218 |
| 96. | 55929 | 1.5% | 1.0%(+0.422)#96 | 1.2%(+0.270)#5,244 |
| 97. | 55305 | 1.4% | 1.0%(+0.383)#97 | 1.2%(+0.230)#5,401 |
| 98. | 55079 | 1.4% | 1.0%(+0.382)#98 | 1.2%(+0.229)#5,409 |
| 99. | 56533 | 1.4% | 1.0%(+0.358)#99 | 1.2%(+0.205)#5,526 |
| 100. | 55114 | 1.4% | 1.0%(+0.354)#100 | 1.2%(+0.201)#5,540 |
Common Questions
What are the Top 10 Zip Codes with the Highest Percentage of Population Employed in Legal Services & Support in Minnesota?
Top 10 Zip Codes with the Highest Percentage of Population Employed in Legal Services & Support in Minnesota are:
What zip code has the Highest Percentage of Population Employed in Legal Services & Support in Minnesota?
56731 has the Highest Percentage of Population Employed in Legal Services & Support in Minnesota with 12.1%.
What is the Percentage of Population Employed in Legal Services & Support in the State of Minnesota?
Percentage of Population Employed in Legal Services & Support in Minnesota is 1.0%.
What is the Percentage of Population Employed in Legal Services & Support in the United States?
Percentage of Population Employed in Legal Services & Support in the United States is 1.2%.