Lake Shore, MN Map & Demographics
Lake Shore Map
Lake Shore Overview
$53,938
PER CAPITA INCOME
$93,611
AVG FAMILY INCOME
$100,000
AVG HOUSEHOLD INCOME
21.1%
WAGE / INCOME GAP [ % ]
78.9¢/ $1
WAGE / INCOME GAP [ $ ]
0.42
INEQUALITY / GINI INDEX
1,166
TOTAL POPULATION
589
MALE POPULATION
577
FEMALE POPULATION
102.08
MALES / 100 FEMALES
97.96
FEMALES / 100 MALES
53.9
MEDIAN AGE
2.5
AVG FAMILY SIZE
2.3
AVG HOUSEHOLD SIZE
545
LABOR FORCE [ PEOPLE ]
55.1%
PERCENT IN LABOR FORCE
2.2%
UNEMPLOYMENT RATE
Lake Shore Area Codes
Income in Lake Shore
Income Overview in Lake Shore
Per Capita Income in Lake Shore is $53,938, while median incomes of families and households are $93,611 and $100,000 respectively.
| Characteristic | Number | Measure |
| Per Capita Income | 1,166 | $53,938 |
| Median Family Income | 410 | $93,611 |
| Mean Family Income | 410 | $133,367 |
| Median Household Income | 512 | $100,000 |
| Mean Household Income | 512 | $124,272 |
| Income Deficit | 410 | $0 |
| Wage / Income Gap (%) | 1,166 | 21.14% |
| Wage / Income Gap ($) | 1,166 | 78.86¢ per $1 |
| Gini / Inequality Index | 1,166 | 0.42 |
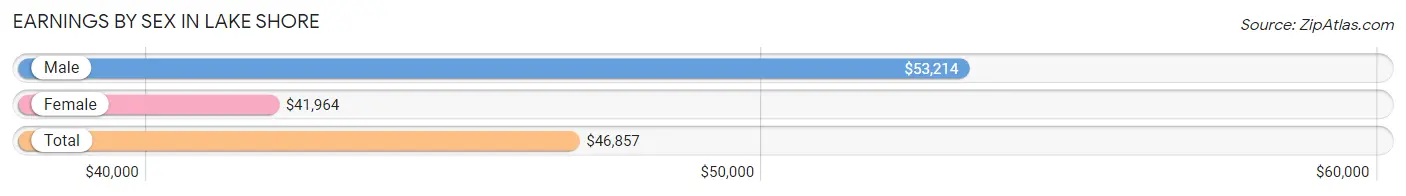
Earnings by Sex in Lake Shore
Average Earnings in Lake Shore are $46,857, $53,214 for men and $41,964 for women, a difference of 21.1%.
| Sex | Number | Average Earnings |
| Male | 342 (56.6%) | $53,214 |
| Female | 262 (43.4%) | $41,964 |
| Total | 604 (100.0%) | $46,857 |
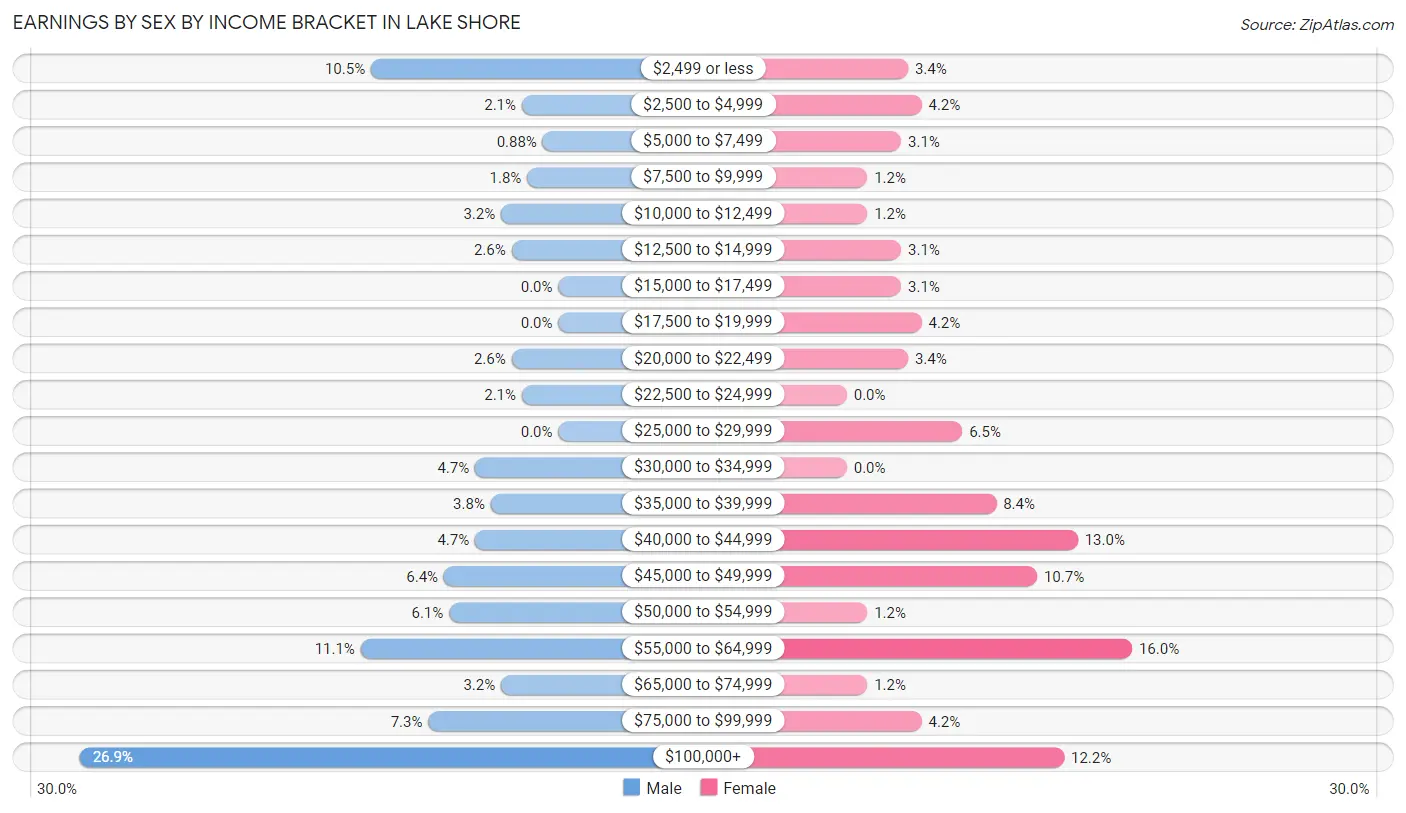
Earnings by Sex by Income Bracket in Lake Shore
The most common earnings brackets in Lake Shore are $100,000+ for men (92 | 26.9%) and $55,000 to $64,999 for women (42 | 16.0%).
| Income | Male | Female |
| $2,499 or less | 36 (10.5%) | 9 (3.4%) |
| $2,500 to $4,999 | 7 (2.1%) | 11 (4.2%) |
| $5,000 to $7,499 | 3 (0.9%) | 8 (3.0%) |
| $7,500 to $9,999 | 6 (1.8%) | 3 (1.1%) |
| $10,000 to $12,499 | 11 (3.2%) | 3 (1.1%) |
| $12,500 to $14,999 | 9 (2.6%) | 8 (3.0%) |
| $15,000 to $17,499 | 0 (0.0%) | 8 (3.0%) |
| $17,500 to $19,999 | 0 (0.0%) | 11 (4.2%) |
| $20,000 to $22,499 | 9 (2.6%) | 9 (3.4%) |
| $22,500 to $24,999 | 7 (2.1%) | 0 (0.0%) |
| $25,000 to $29,999 | 0 (0.0%) | 17 (6.5%) |
| $30,000 to $34,999 | 16 (4.7%) | 0 (0.0%) |
| $35,000 to $39,999 | 13 (3.8%) | 22 (8.4%) |
| $40,000 to $44,999 | 16 (4.7%) | 34 (13.0%) |
| $45,000 to $49,999 | 22 (6.4%) | 28 (10.7%) |
| $50,000 to $54,999 | 21 (6.1%) | 3 (1.1%) |
| $55,000 to $64,999 | 38 (11.1%) | 42 (16.0%) |
| $65,000 to $74,999 | 11 (3.2%) | 3 (1.1%) |
| $75,000 to $99,999 | 25 (7.3%) | 11 (4.2%) |
| $100,000+ | 92 (26.9%) | 32 (12.2%) |
| Total | 342 (100.0%) | 262 (100.0%) |
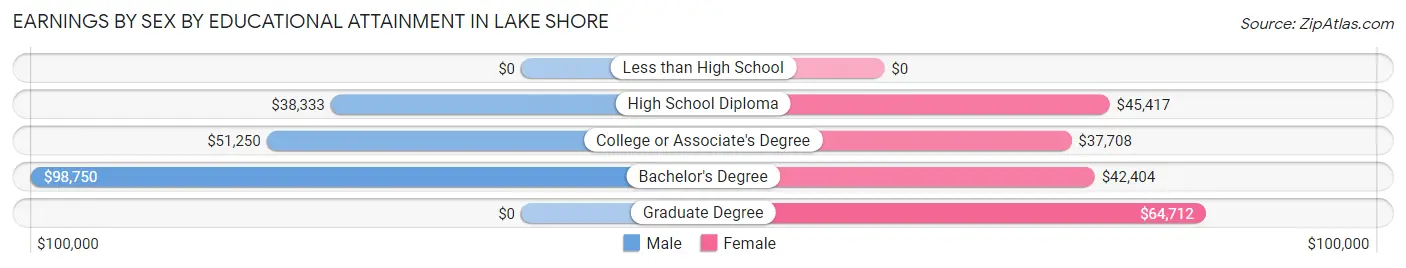
Earnings by Sex by Educational Attainment in Lake Shore
Average earnings in Lake Shore are $58,017 for men and $42,708 for women, a difference of 26.4%. Men with an educational attainment of bachelor's degree enjoy the highest average annual earnings of $98,750, while those with high school diploma education earn the least with $38,333. Women with an educational attainment of graduate degree earn the most with the average annual earnings of $64,712, while those with college or associate's degree education have the smallest earnings of $37,708.
| Educational Attainment | Male Income | Female Income |
| Less than High School | - | - |
| High School Diploma | $38,333 | $45,417 |
| College or Associate's Degree | $51,250 | $37,708 |
| Bachelor's Degree | $98,750 | $42,404 |
| Graduate Degree | - | - |
| Total | $58,017 | $42,708 |
Family Income in Lake Shore
Family Income Brackets in Lake Shore
According to the Lake Shore family income data, there are 68 families falling into the $100,000 to $149,999 income range, which is the most common income bracket and makes up 16.6% of all families. Conversely, the less than $10,000 income bracket is the least frequent group with only 2 families (0.5%) belonging to this category.
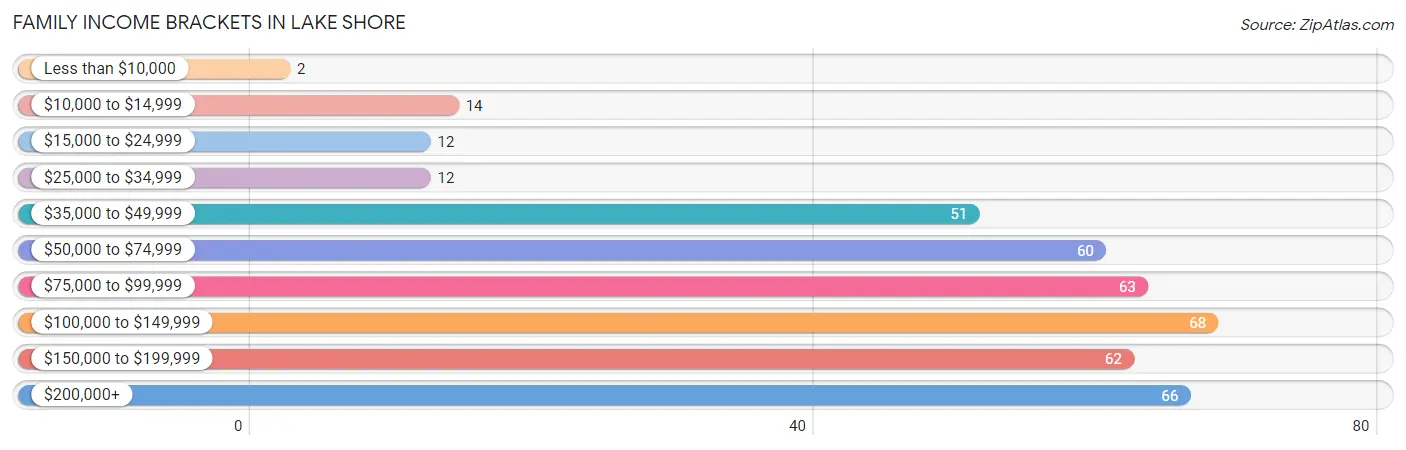
| Income Bracket | # Families | % Families |
| Less than $10,000 | 2 | 0.5% |
| $10,000 to $14,999 | 14 | 3.4% |
| $15,000 to $24,999 | 12 | 2.9% |
| $25,000 to $34,999 | 12 | 2.9% |
| $35,000 to $49,999 | 51 | 12.4% |
| $50,000 to $74,999 | 60 | 14.6% |
| $75,000 to $99,999 | 63 | 15.4% |
| $100,000 to $149,999 | 68 | 16.6% |
| $150,000 to $199,999 | 62 | 15.1% |
| $200,000+ | 66 | 16.1% |
Family Income by Famaliy Size in Lake Shore
3-person families (49 | 11.9%) account for the highest median family income in Lake Shore with $148,125 per family, while 3-person families (49 | 11.9%) have the highest median income of $49,375 per family member.
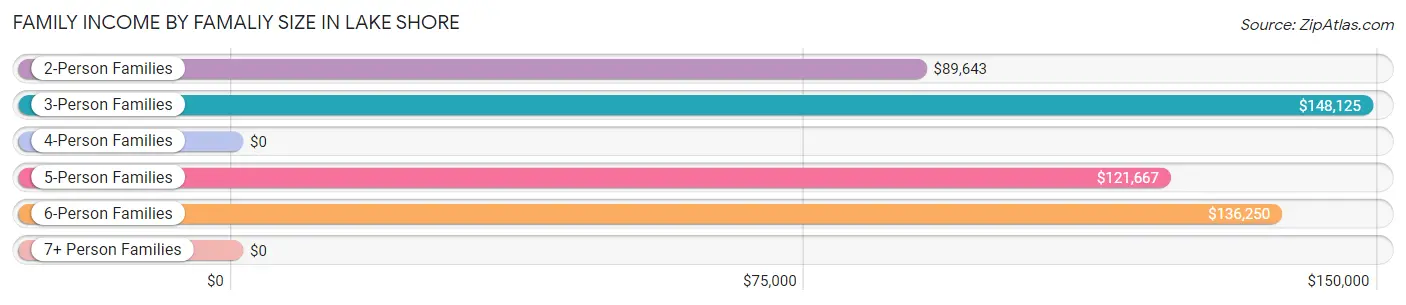
| Income Bracket | # Families | Median Income |
| 2-Person Families | 282 (68.8%) | $89,643 |
| 3-Person Families | 49 (11.9%) | $148,125 |
| 4-Person Families | 52 (12.7%) | $0 |
| 5-Person Families | 18 (4.4%) | $121,667 |
| 6-Person Families | 9 (2.2%) | $136,250 |
| 7+ Person Families | 0 (0.0%) | $0 |
| Total | 410 (100.0%) | $93,611 |
Family Income by Number of Earners in Lake Shore
The median family income in Lake Shore is $93,611, with families comprising 3+ earners (16) having the highest median family income of $156,250, while families with no earners (81) have the lowest median family income of $68,438, accounting for 3.9% and 19.8% of families, respectively.
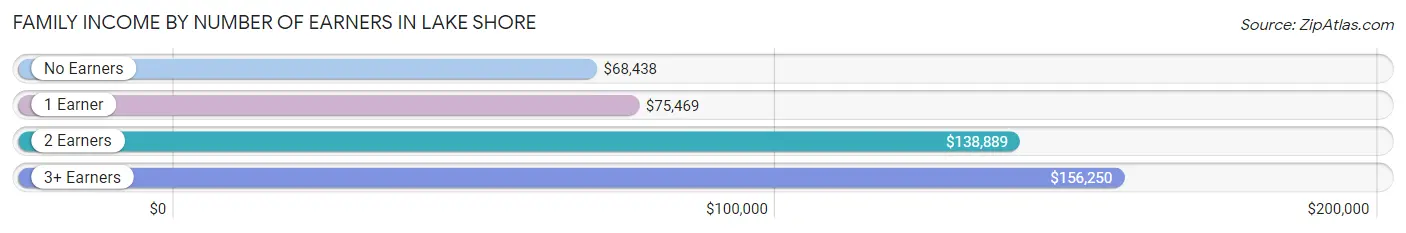
| Number of Earners | # Families | Median Income |
| No Earners | 81 (19.8%) | $68,438 |
| 1 Earner | 179 (43.7%) | $75,469 |
| 2 Earners | 134 (32.7%) | $138,889 |
| 3+ Earners | 16 (3.9%) | $156,250 |
| Total | 410 (100.0%) | $93,611 |
Household Income in Lake Shore
Household Income Brackets in Lake Shore
With 127 households falling in the category, the $100,000 to $149,999 income range is the most frequent in Lake Shore, accounting for 24.8% of all households. In contrast, only 8 households (1.6%) fall into the less than $10,000 income bracket, making it the least populous group.
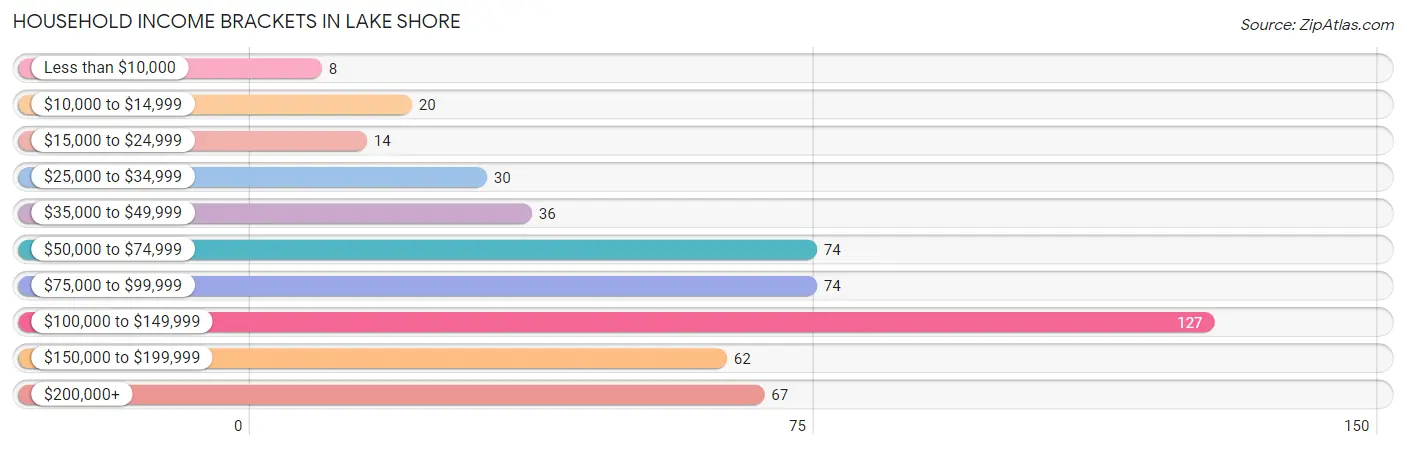
| Income Bracket | # Households | % Households |
| Less than $10,000 | 8 | 1.6% |
| $10,000 to $14,999 | 20 | 3.9% |
| $15,000 to $24,999 | 14 | 2.7% |
| $25,000 to $34,999 | 30 | 5.9% |
| $35,000 to $49,999 | 36 | 7.0% |
| $50,000 to $74,999 | 74 | 14.5% |
| $75,000 to $99,999 | 74 | 14.5% |
| $100,000 to $149,999 | 127 | 24.8% |
| $150,000 to $199,999 | 62 | 12.1% |
| $200,000+ | 67 | 13.1% |
Household Income by Householder Age in Lake Shore
The median household income in Lake Shore is $100,000, with the highest median household income of $116,250 found in the 45 to 64 years age bracket for the primary householder. A total of 194 households (37.9%) fall into this category. Meanwhile, the 15 to 24 years age bracket for the primary householder has the lowest median household income of $0, with 5 households (1.0%) in this group.
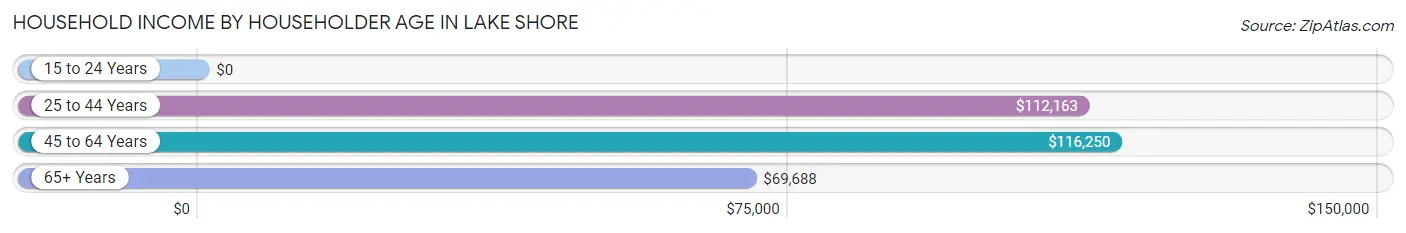
| Income Bracket | # Households | Median Income |
| 15 to 24 Years | 5 (1.0%) | $0 |
| 25 to 44 Years | 127 (24.8%) | $112,163 |
| 45 to 64 Years | 194 (37.9%) | $116,250 |
| 65+ Years | 186 (36.3%) | $69,688 |
| Total | 512 (100.0%) | $100,000 |
Poverty in Lake Shore
Income Below Poverty by Sex and Age in Lake Shore
With 8.0% poverty level for males and 5.7% for females among the residents of Lake Shore, 55 to 64 year old males and 25 to 34 year old females are the most vulnerable to poverty, with 26 males (21.7%) and 12 females (12.9%) in their respective age groups living below the poverty level.
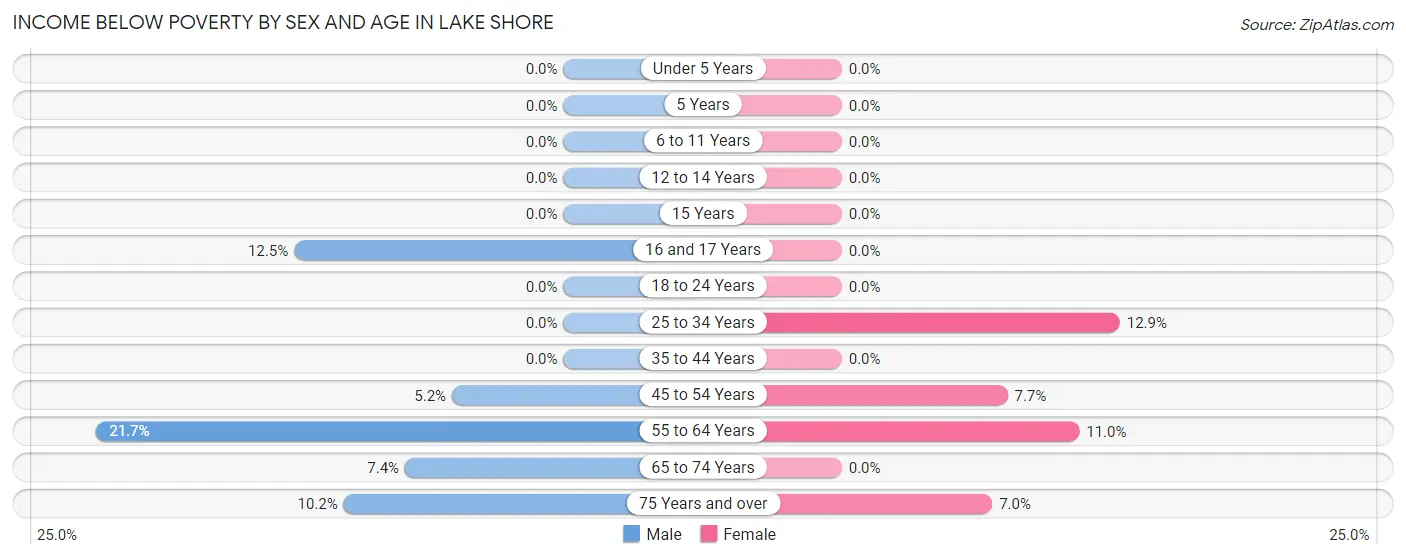
| Age Bracket | Male | Female |
| Under 5 Years | 0 (0.0%) | 0 (0.0%) |
| 5 Years | 0 (0.0%) | 0 (0.0%) |
| 6 to 11 Years | 0 (0.0%) | 0 (0.0%) |
| 12 to 14 Years | 0 (0.0%) | 0 (0.0%) |
| 15 Years | 0 (0.0%) | 0 (0.0%) |
| 16 and 17 Years | 3 (12.5%) | 0 (0.0%) |
| 18 to 24 Years | 0 (0.0%) | 0 (0.0%) |
| 25 to 34 Years | 0 (0.0%) | 12 (12.9%) |
| 35 to 44 Years | 0 (0.0%) | 0 (0.0%) |
| 45 to 54 Years | 3 (5.2%) | 5 (7.7%) |
| 55 to 64 Years | 26 (21.7%) | 13 (11.0%) |
| 65 to 74 Years | 10 (7.3%) | 0 (0.0%) |
| 75 Years and over | 5 (10.2%) | 3 (7.0%) |
| Total | 47 (8.0%) | 33 (5.7%) |
Income Above Poverty by Sex and Age in Lake Shore
According to the poverty statistics in Lake Shore, males aged under 5 years and females aged under 5 years are the age groups that are most secure financially, with 100.0% of males and 100.0% of females in these age groups living above the poverty line.
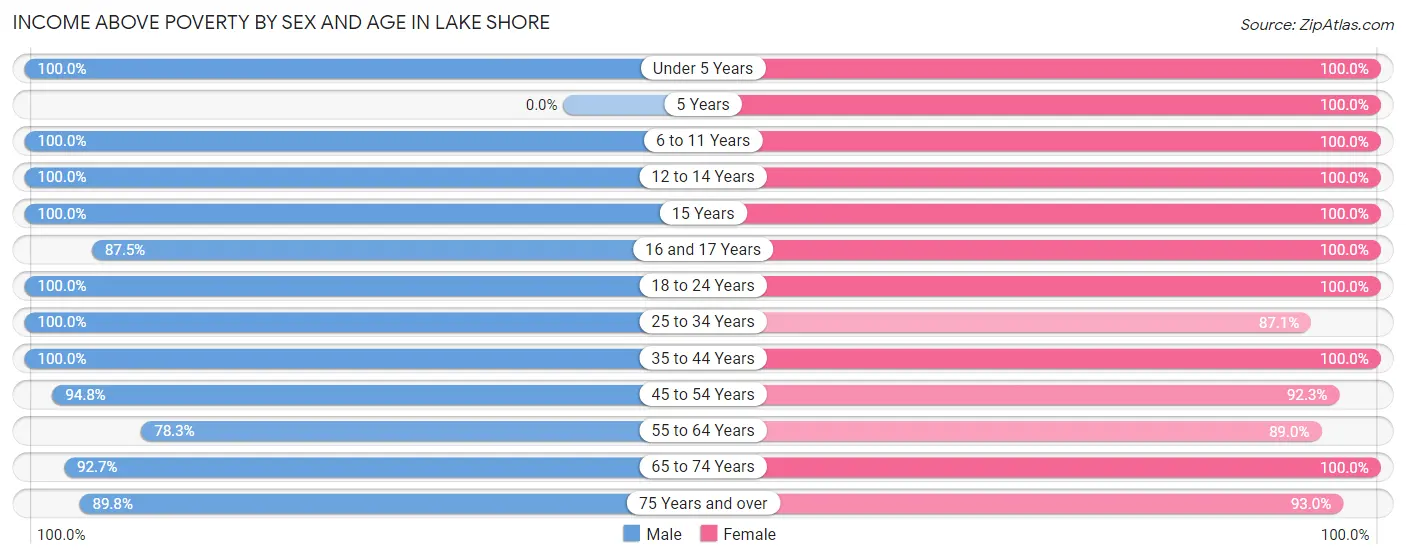
| Age Bracket | Male | Female |
| Under 5 Years | 23 (100.0%) | 26 (100.0%) |
| 5 Years | 0 (0.0%) | 10 (100.0%) |
| 6 to 11 Years | 35 (100.0%) | 34 (100.0%) |
| 12 to 14 Years | 16 (100.0%) | 16 (100.0%) |
| 15 Years | 9 (100.0%) | 6 (100.0%) |
| 16 and 17 Years | 21 (87.5%) | 4 (100.0%) |
| 18 to 24 Years | 19 (100.0%) | 15 (100.0%) |
| 25 to 34 Years | 51 (100.0%) | 81 (87.1%) |
| 35 to 44 Years | 47 (100.0%) | 41 (100.0%) |
| 45 to 54 Years | 55 (94.8%) | 60 (92.3%) |
| 55 to 64 Years | 94 (78.3%) | 105 (89.0%) |
| 65 to 74 Years | 126 (92.6%) | 106 (100.0%) |
| 75 Years and over | 44 (89.8%) | 40 (93.0%) |
| Total | 540 (92.0%) | 544 (94.3%) |
Income Below Poverty Among Married-Couple Families in Lake Shore
The poverty statistics for married-couple families in Lake Shore show that 5.2% or 18 of the total 348 families live below the poverty line. Families with no children have the highest poverty rate of 6.7%, comprising of 18 families. On the other hand, families with 1 or 2 children have the lowest poverty rate of 0.0%, which includes 0 families.
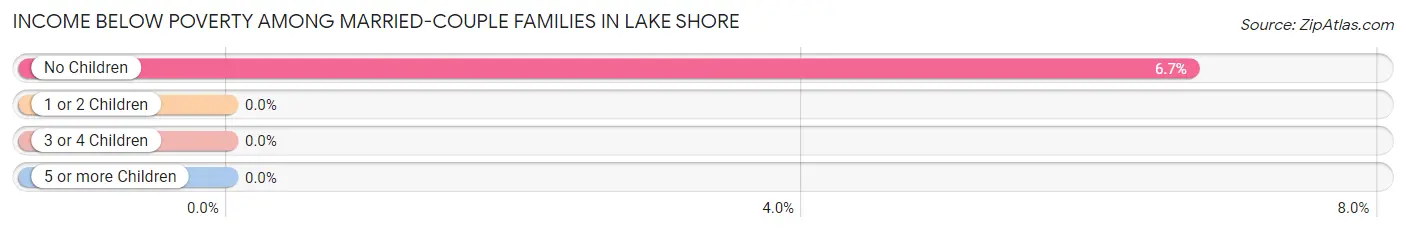
| Children | Above Poverty | Below Poverty |
| No Children | 251 (93.3%) | 18 (6.7%) |
| 1 or 2 Children | 58 (100.0%) | 0 (0.0%) |
| 3 or 4 Children | 21 (100.0%) | 0 (0.0%) |
| 5 or more Children | 0 (0.0%) | 0 (0.0%) |
| Total | 330 (94.8%) | 18 (5.2%) |
Income Below Poverty Among Single-Parent Households in Lake Shore
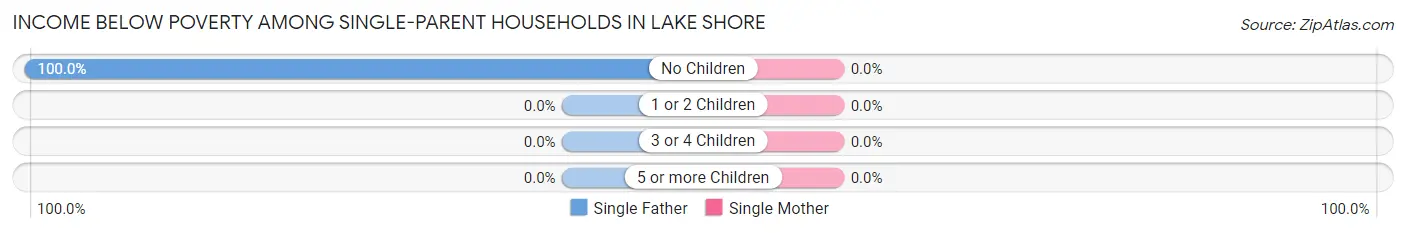
| Children | Single Father | Single Mother |
| No Children | 10 (100.0%) | 0 (0.0%) |
| 1 or 2 Children | 0 (0.0%) | 0 (0.0%) |
| 3 or 4 Children | 0 (0.0%) | 0 (0.0%) |
| 5 or more Children | 0 (0.0%) | 0 (0.0%) |
| Total | 10 (41.7%) | 0 (0.0%) |
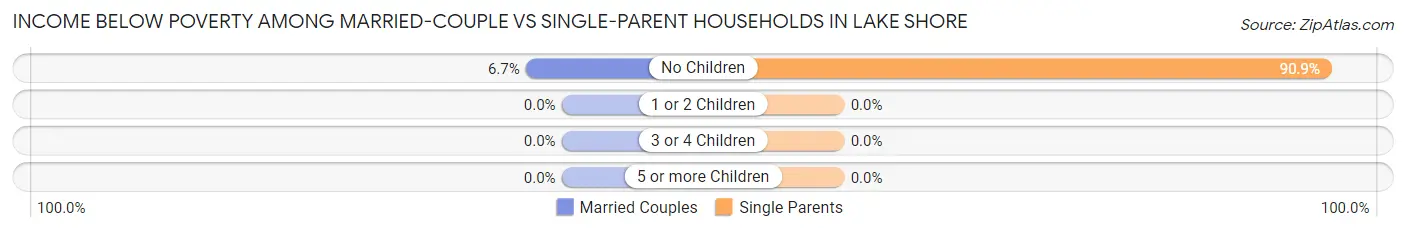
Income Below Poverty Among Married-Couple vs Single-Parent Households in Lake Shore
The poverty data for Lake Shore shows that 18 of the married-couple family households (5.2%) and 10 of the single-parent households (16.1%) are living below the poverty level. Within the married-couple family households, those with no children have the highest poverty rate, with 18 households (6.7%) falling below the poverty line. Among the single-parent households, those with no children have the highest poverty rate, with 10 household (90.9%) living below poverty.
| Children | Married-Couple Families | Single-Parent Households |
| No Children | 18 (6.7%) | 10 (90.9%) |
| 1 or 2 Children | 0 (0.0%) | 0 (0.0%) |
| 3 or 4 Children | 0 (0.0%) | 0 (0.0%) |
| 5 or more Children | 0 (0.0%) | 0 (0.0%) |
| Total | 18 (5.2%) | 10 (16.1%) |
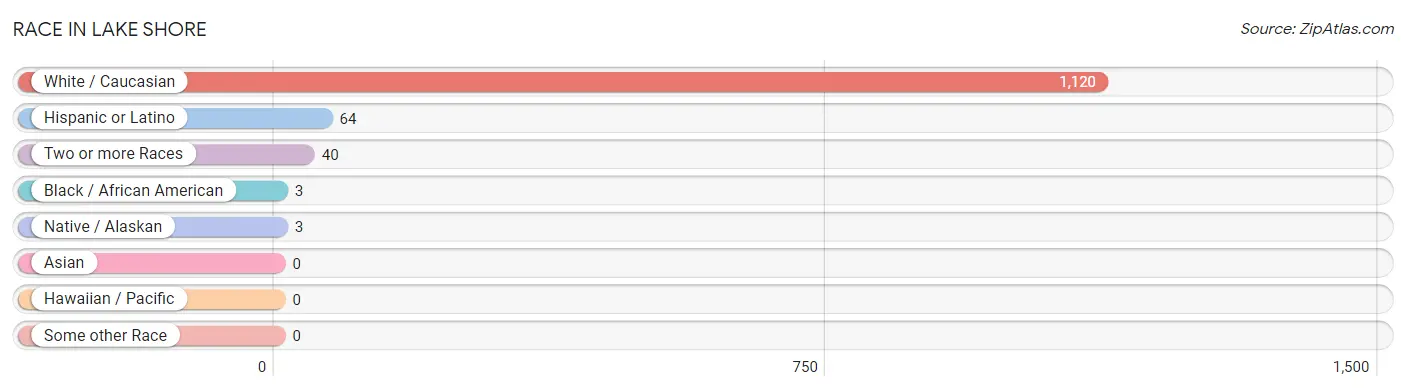
Race in Lake Shore
The most populous races in Lake Shore are White / Caucasian (1,120 | 96.1%), Hispanic or Latino (64 | 5.5%), and Two or more Races (40 | 3.4%).
| Race | # Population | % Population |
| Asian | 0 | 0.0% |
| Black / African American | 3 | 0.3% |
| Hawaiian / Pacific | 0 | 0.0% |
| Hispanic or Latino | 64 | 5.5% |
| Native / Alaskan | 3 | 0.3% |
| White / Caucasian | 1,120 | 96.1% |
| Two or more Races | 40 | 3.4% |
| Some other Race | 0 | 0.0% |
| Total | 1,166 | 100.0% |
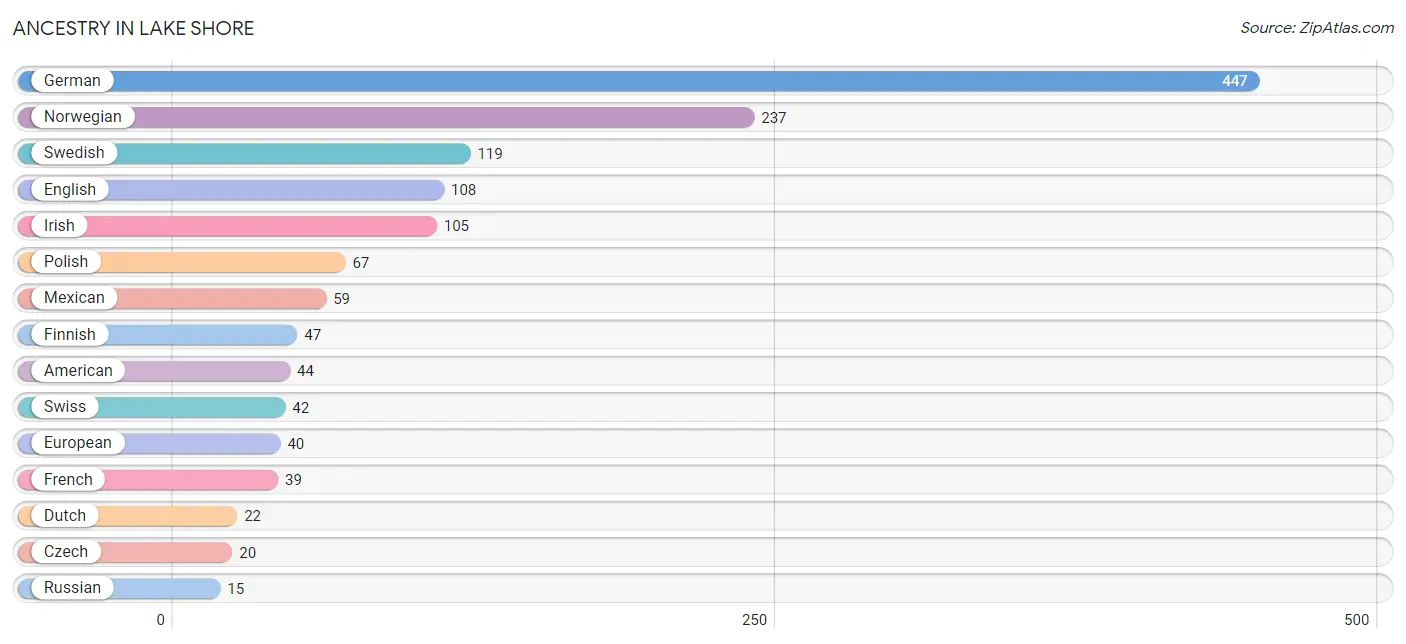
Ancestry in Lake Shore
The most populous ancestries reported in Lake Shore are German (447 | 38.3%), Norwegian (237 | 20.3%), Swedish (119 | 10.2%), English (108 | 9.3%), and Irish (105 | 9.0%), together accounting for 87.1% of all Lake Shore residents.
| Ancestry | # Population | % Population |
| American | 44 | 3.8% |
| Arab | 4 | 0.3% |
| Austrian | 3 | 0.3% |
| Canadian | 3 | 0.3% |
| Chippewa | 3 | 0.3% |
| Czech | 20 | 1.7% |
| Danish | 13 | 1.1% |
| Dutch | 22 | 1.9% |
| English | 108 | 9.3% |
| European | 40 | 3.4% |
| Finnish | 47 | 4.0% |
| French | 39 | 3.3% |
| French Canadian | 3 | 0.3% |
| German | 447 | 38.3% |
| Greek | 2 | 0.2% |
| Irish | 105 | 9.0% |
| Italian | 12 | 1.0% |
| Lithuanian | 4 | 0.3% |
| Mexican | 59 | 5.1% |
| Norwegian | 237 | 20.3% |
| Polish | 67 | 5.8% |
| Puerto Rican | 2 | 0.2% |
| Russian | 15 | 1.3% |
| Scandinavian | 3 | 0.3% |
| Scotch-Irish | 11 | 0.9% |
| Scottish | 6 | 0.5% |
| Spanish | 3 | 0.3% |
| Swedish | 119 | 10.2% |
| Swiss | 42 | 3.6% |
| Ukrainian | 3 | 0.3% |
| Welsh | 11 | 0.9% | View All 31 Rows |
Immigrants in Lake Shore
The most numerous immigrant groups reported in Lake Shore came from Canada (6 | 0.5%), Asia (4 | 0.3%), Iraq (4 | 0.3%), Western Asia (4 | 0.3%), and Europe (3 | 0.3%), together accounting for 1.8% of all Lake Shore residents.
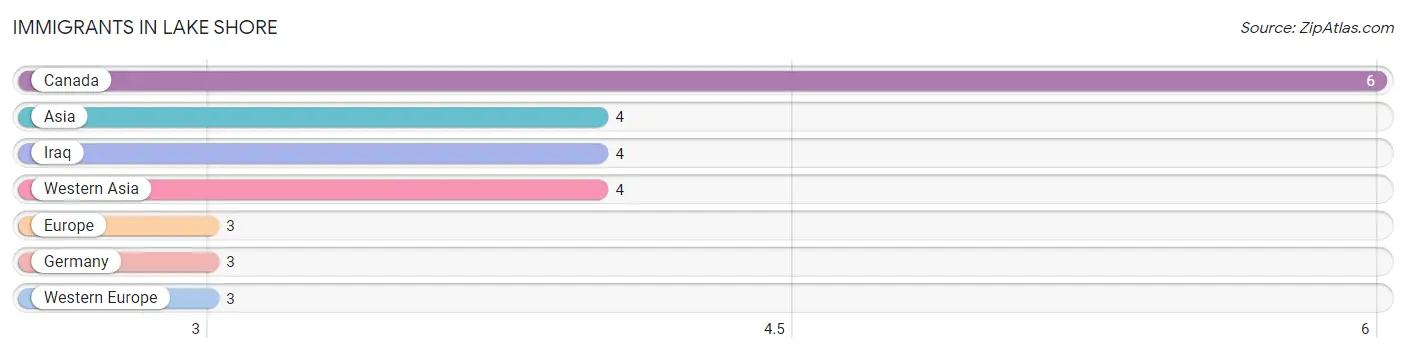
| Immigration Origin | # Population | % Population |
| Asia | 4 | 0.3% |
| Canada | 6 | 0.5% |
| Europe | 3 | 0.3% |
| Germany | 3 | 0.3% |
| Iraq | 4 | 0.3% |
| Western Asia | 4 | 0.3% |
| Western Europe | 3 | 0.3% | View All 7 Rows |
Sex and Age in Lake Shore
Sex and Age in Lake Shore
The most populous age groups in Lake Shore are 65 to 69 Years (85 | 14.4%) for men and 55 to 59 Years (59 | 10.2%) for women.
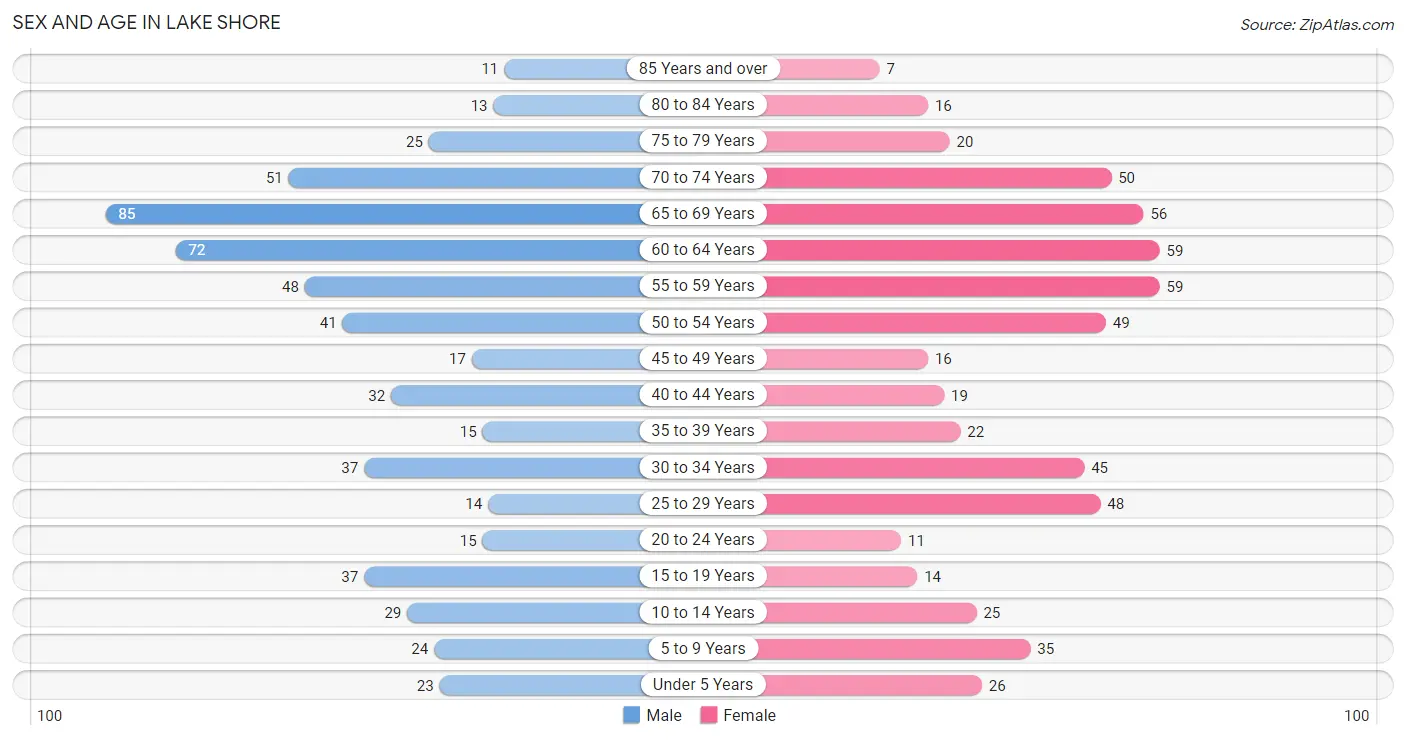
| Age Bracket | Male | Female |
| Under 5 Years | 23 (3.9%) | 26 (4.5%) |
| 5 to 9 Years | 24 (4.1%) | 35 (6.1%) |
| 10 to 14 Years | 29 (4.9%) | 25 (4.3%) |
| 15 to 19 Years | 37 (6.3%) | 14 (2.4%) |
| 20 to 24 Years | 15 (2.5%) | 11 (1.9%) |
| 25 to 29 Years | 14 (2.4%) | 48 (8.3%) |
| 30 to 34 Years | 37 (6.3%) | 45 (7.8%) |
| 35 to 39 Years | 15 (2.5%) | 22 (3.8%) |
| 40 to 44 Years | 32 (5.4%) | 19 (3.3%) |
| 45 to 49 Years | 17 (2.9%) | 16 (2.8%) |
| 50 to 54 Years | 41 (7.0%) | 49 (8.5%) |
| 55 to 59 Years | 48 (8.2%) | 59 (10.2%) |
| 60 to 64 Years | 72 (12.2%) | 59 (10.2%) |
| 65 to 69 Years | 85 (14.4%) | 56 (9.7%) |
| 70 to 74 Years | 51 (8.7%) | 50 (8.7%) |
| 75 to 79 Years | 25 (4.2%) | 20 (3.5%) |
| 80 to 84 Years | 13 (2.2%) | 16 (2.8%) |
| 85 Years and over | 11 (1.9%) | 7 (1.2%) |
| Total | 589 (100.0%) | 577 (100.0%) |
Families and Households in Lake Shore
Median Family Size in Lake Shore
The median family size in Lake Shore is 2.46 persons per family, with married-couple families (348 | 84.9%) accounting for the largest median family size of 2.5 persons per family. On the other hand, single female/mother families (38 | 9.3%) represent the smallest median family size with 2.18 persons per family.
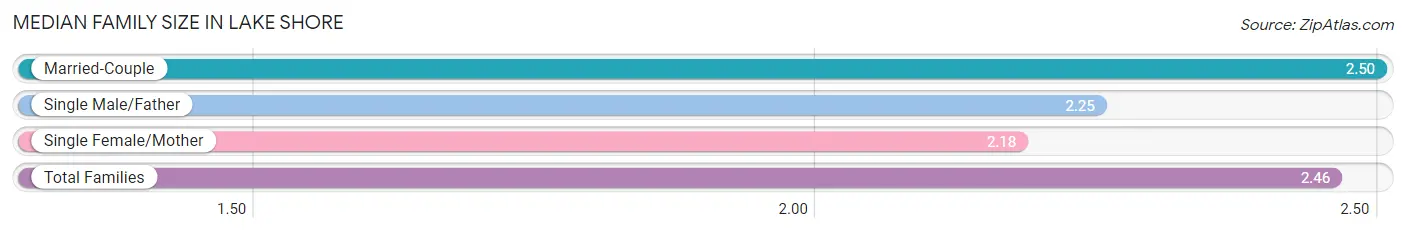
| Family Type | # Families | Family Size |
| Married-Couple | 348 (84.9%) | 2.50 |
| Single Male/Father | 24 (5.9%) | 2.25 |
| Single Female/Mother | 38 (9.3%) | 2.18 |
| Total Families | 410 (100.0%) | 2.46 |
Median Household Size in Lake Shore
The median household size in Lake Shore is 2.27 persons per household, with single male/father households (24 | 4.7%) accounting for the largest median household size of 2.71 persons per household. non-family households (102 | 19.9%) represent the smallest median household size with 1.26 persons per household.
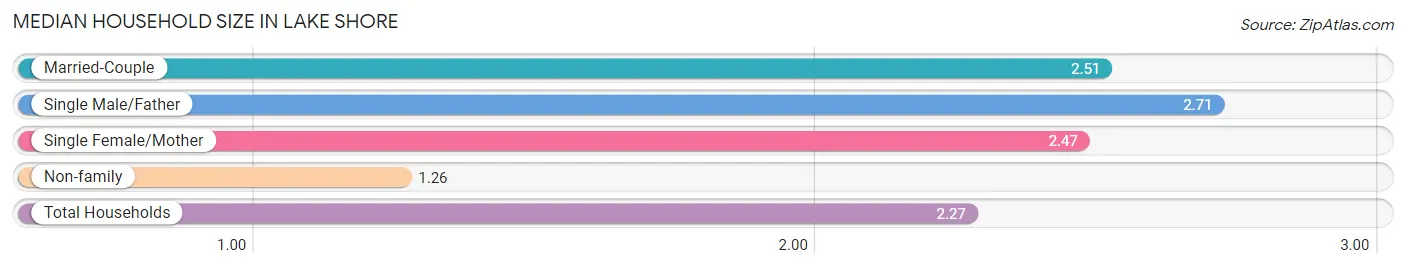
| Household Type | # Households | Household Size |
| Married-Couple | 348 (68.0%) | 2.51 |
| Single Male/Father | 24 (4.7%) | 2.71 |
| Single Female/Mother | 38 (7.4%) | 2.47 |
| Non-family | 102 (19.9%) | 1.26 |
| Total Households | 512 (100.0%) | 2.27 |
Household Size by Marriage Status in Lake Shore
Out of a total of 512 households in Lake Shore, 410 (80.1%) are family households, while 102 (19.9%) are nonfamily households. The most numerous type of family households are 2-person households, comprising 267, and the most common type of nonfamily households are 1-person households, comprising 88.
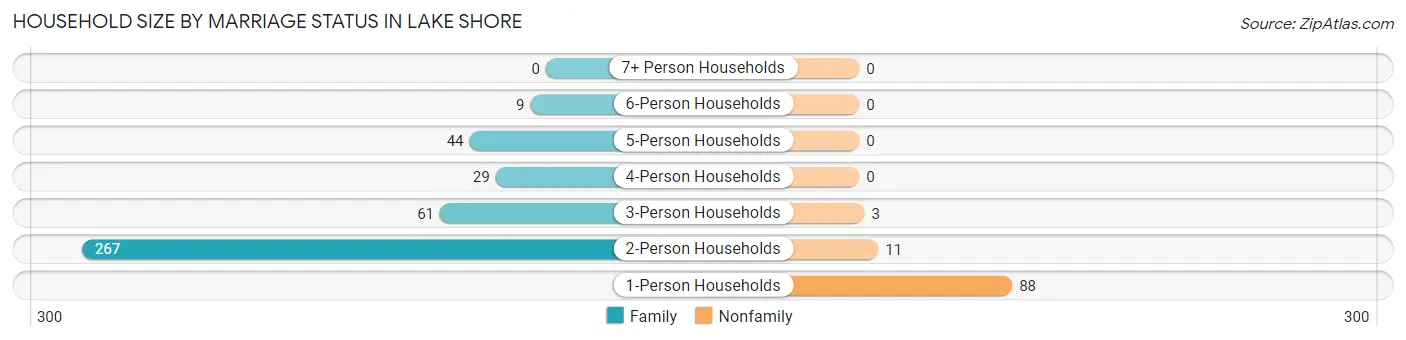
| Household Size | Family Households | Nonfamily Households |
| 1-Person Households | - | 88 (17.2%) |
| 2-Person Households | 267 (52.1%) | 11 (2.1%) |
| 3-Person Households | 61 (11.9%) | 3 (0.6%) |
| 4-Person Households | 29 (5.7%) | 0 (0.0%) |
| 5-Person Households | 44 (8.6%) | 0 (0.0%) |
| 6-Person Households | 9 (1.8%) | 0 (0.0%) |
| 7+ Person Households | 0 (0.0%) | 0 (0.0%) |
| Total | 410 (80.1%) | 102 (19.9%) |
Female Fertility in Lake Shore
Fertility by Age in Lake Shore
Average fertility rate in Lake Shore is 149.0 births per 1,000 women. Women in the age bracket of 20 to 34 years have the highest fertility rate with 279.0 births per 1,000 women. Women in the age bracket of 20 to 34 years acount for 100.0% of all women with births.
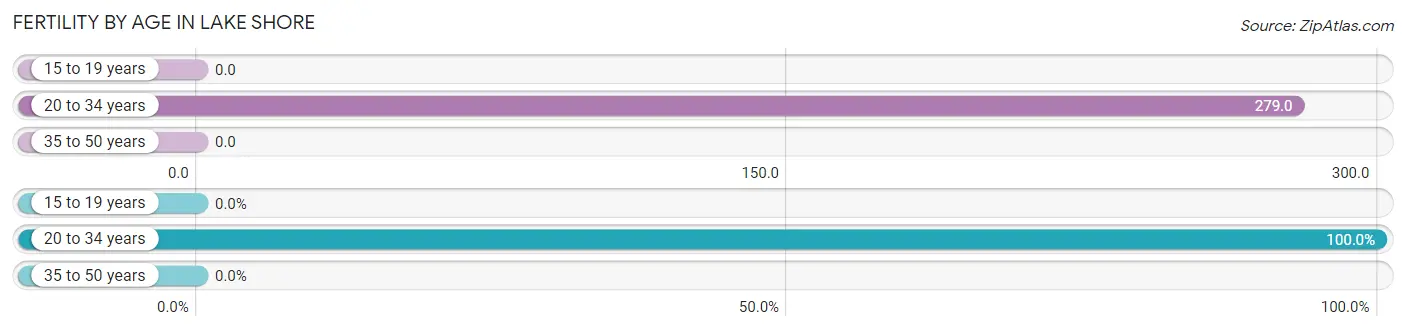
| Age Bracket | Women with Births | Births / 1,000 Women |
| 15 to 19 years | 0 (0.0%) | 0.0 |
| 20 to 34 years | 29 (100.0%) | 279.0 |
| 35 to 50 years | 0 (0.0%) | 0.0 |
| Total | 29 (100.0%) | 149.0 |
Fertility by Age by Marriage Status in Lake Shore
10.3% of women with births (29) in Lake Shore are married. The highest percentage of unmarried women with births falls into 20 to 34 years age bracket with 89.7% of them unmarried at the time of birth, while the lowest percentage of unmarried women with births belong to 20 to 34 years age bracket with 89.7% of them unmarried.
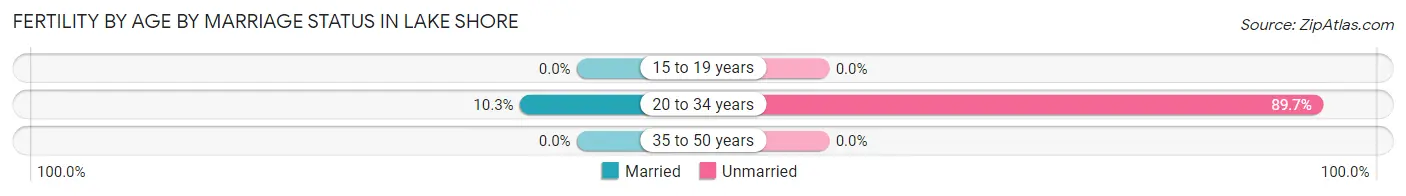
| Age Bracket | Married | Unmarried |
| 15 to 19 years | 0 (0.0%) | 0 (0.0%) |
| 20 to 34 years | 3 (10.3%) | 26 (89.7%) |
| 35 to 50 years | 0 (0.0%) | 0 (0.0%) |
| Total | 3 (10.3%) | 26 (89.7%) |
Fertility by Education in Lake Shore
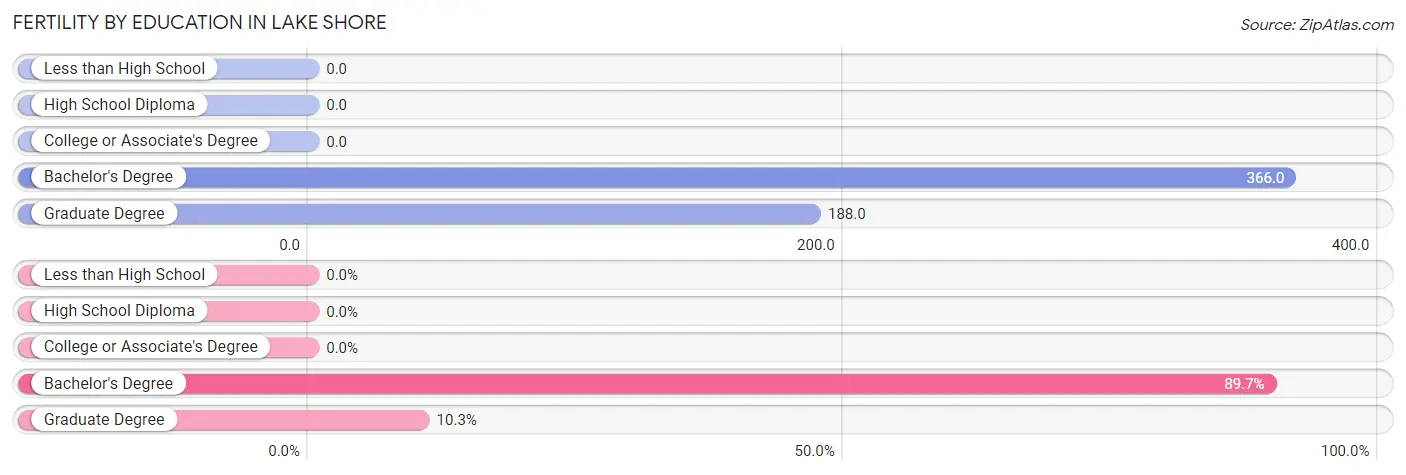
| Educational Attainment | Women with Births | Births / 1,000 Women |
| Less than High School | 0 (0.0%) | 0.0 |
| High School Diploma | 0 (0.0%) | 0.0 |
| College or Associate's Degree | 0 (0.0%) | 0.0 |
| Bachelor's Degree | 26 (89.7%) | 366.0 |
| Graduate Degree | 3 (10.3%) | 188.0 |
| Total | 29 (100.0%) | 149.0 |
Fertility by Education by Marriage Status in Lake Shore
89.7% of women with births in Lake Shore are unmarried. Women with the educational attainment of graduate degree are most likely to be married with 100.0% of them married at childbirth, while women with the educational attainment of bachelor's degree are least likely to be married with 100.0% of them unmarried at childbirth.
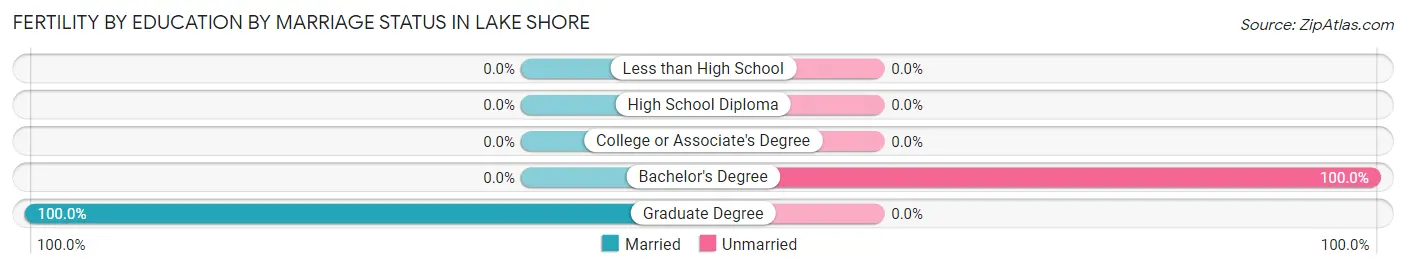
| Educational Attainment | Married | Unmarried |
| Less than High School | 0 (0.0%) | 0 (0.0%) |
| High School Diploma | 0 (0.0%) | 0 (0.0%) |
| College or Associate's Degree | 0 (0.0%) | 0 (0.0%) |
| Bachelor's Degree | 0 (0.0%) | 26 (100.0%) |
| Graduate Degree | 3 (100.0%) | 0 (0.0%) |
| Total | 3 (10.3%) | 26 (89.7%) |
Employment Characteristics in Lake Shore
Employment by Class of Employer in Lake Shore
Among the 526 employed individuals in Lake Shore, private company employees (351 | 66.7%), self-employed (incorporated) (56 | 10.6%), and local government employees (36 | 6.8%) make up the most common classes of employment.
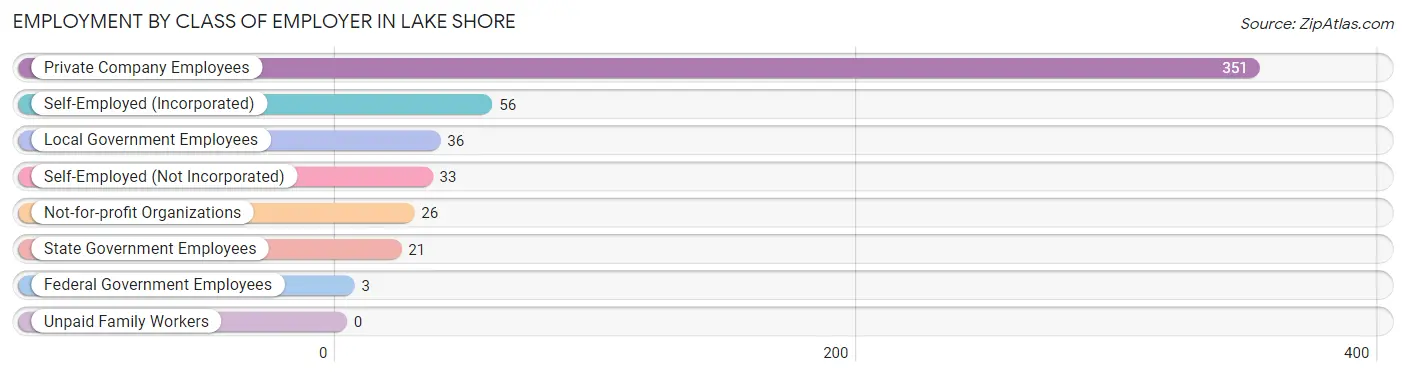
| Employer Class | # Employees | % Employees |
| Private Company Employees | 351 | 66.7% |
| Self-Employed (Incorporated) | 56 | 10.6% |
| Self-Employed (Not Incorporated) | 33 | 6.3% |
| Not-for-profit Organizations | 26 | 4.9% |
| Local Government Employees | 36 | 6.8% |
| State Government Employees | 21 | 4.0% |
| Federal Government Employees | 3 | 0.6% |
| Unpaid Family Workers | 0 | 0.0% |
| Total | 526 | 100.0% |
Employment Status by Age in Lake Shore
According to the labor force statistics for Lake Shore, out of the total population over 16 years of age (989), 55.1% or 545 individuals are in the labor force, with 2.2% or 12 of them unemployed. The age group with the highest labor force participation rate is 30 to 34 years, with 95.1% or 78 individuals in the labor force. Within the labor force, the 20 to 24 years age range has the highest percentage of unemployed individuals, with 30.0% or 6 of them being unemployed.
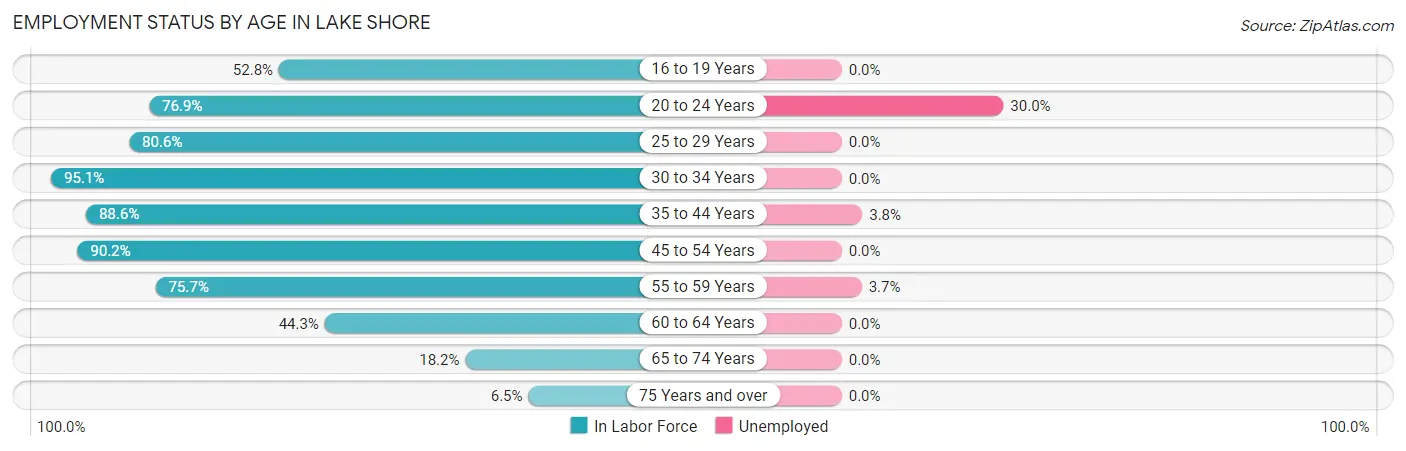
| Age Bracket | In Labor Force | Unemployed |
| 16 to 19 Years | 19 (52.8%) | 0 (0.0%) |
| 20 to 24 Years | 20 (76.9%) | 6 (30.0%) |
| 25 to 29 Years | 50 (80.6%) | 0 (0.0%) |
| 30 to 34 Years | 78 (95.1%) | 0 (0.0%) |
| 35 to 44 Years | 78 (88.6%) | 3 (3.8%) |
| 45 to 54 Years | 111 (90.2%) | 0 (0.0%) |
| 55 to 59 Years | 81 (75.7%) | 3 (3.7%) |
| 60 to 64 Years | 58 (44.3%) | 0 (0.0%) |
| 65 to 74 Years | 44 (18.2%) | 0 (0.0%) |
| 75 Years and over | 6 (6.5%) | 0 (0.0%) |
| Total | 545 (55.1%) | 12 (2.2%) |
Employment Status by Educational Attainment in Lake Shore
According to labor force statistics for Lake Shore, 76.9% of individuals (456) out of the total population between 25 and 64 years of age (593) are in the labor force, with 1.3% or 6 of them being unemployed. The group with the highest labor force participation rate are those with the educational attainment of high school diploma, with 88.1% or 118 individuals in the labor force. Within the labor force, individuals with high school diploma education have the highest percentage of unemployment, with 2.5% or 3 of them being unemployed.
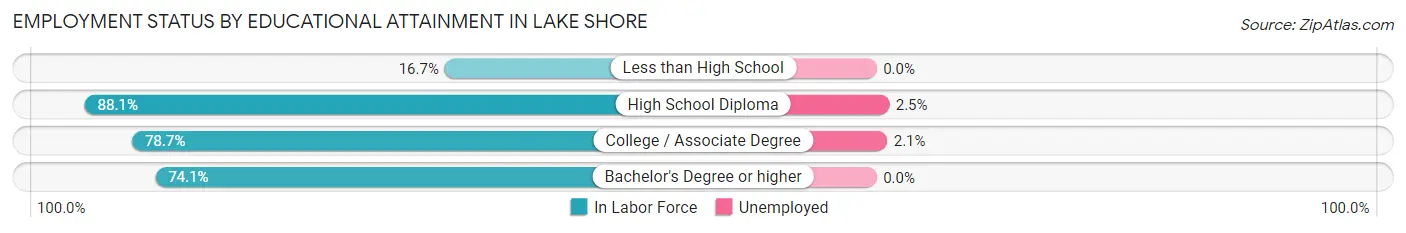
| Educational Attainment | In Labor Force | Unemployed |
| Less than High School | 3 (16.7%) | 0 (0.0%) |
| High School Diploma | 118 (88.1%) | 3 (2.5%) |
| College / Associate Degree | 140 (78.7%) | 4 (2.1%) |
| Bachelor's Degree or higher | 195 (74.1%) | 0 (0.0%) |
| Total | 456 (76.9%) | 8 (1.3%) |
Employment Occupations by Sex in Lake Shore
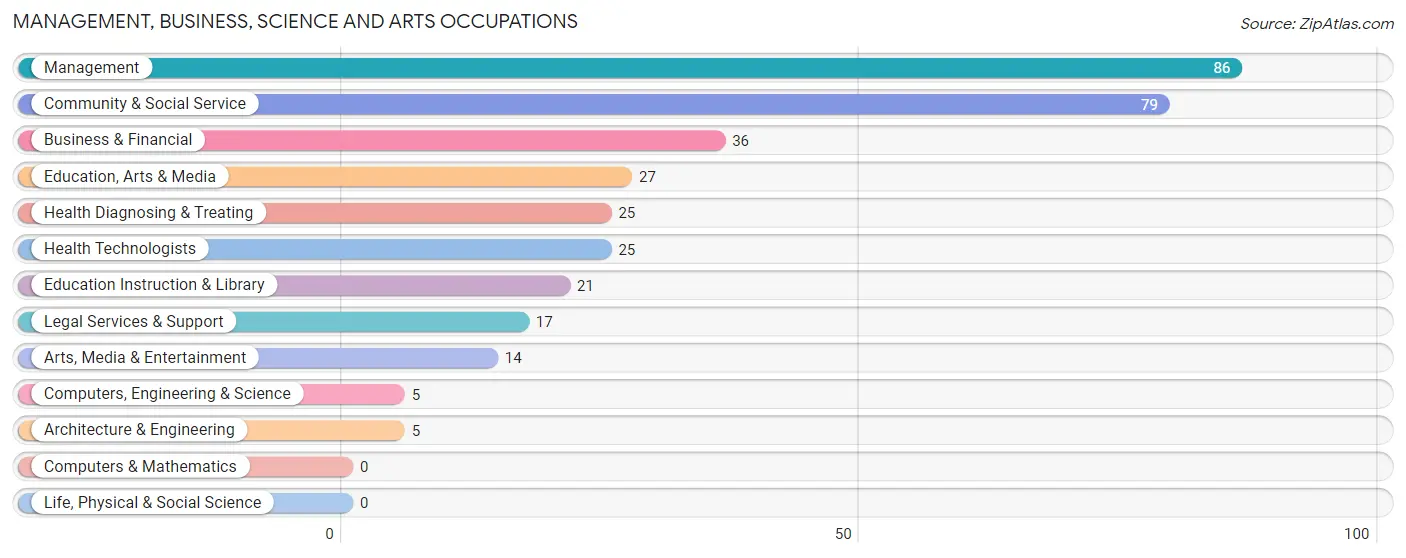
Management, Business, Science and Arts Occupations
The most common Management, Business, Science and Arts occupations in Lake Shore are Management (86 | 16.1%), Community & Social Service (79 | 14.8%), Business & Financial (36 | 6.8%), Education, Arts & Media (27 | 5.1%), and Health Diagnosing & Treating (25 | 4.7%).
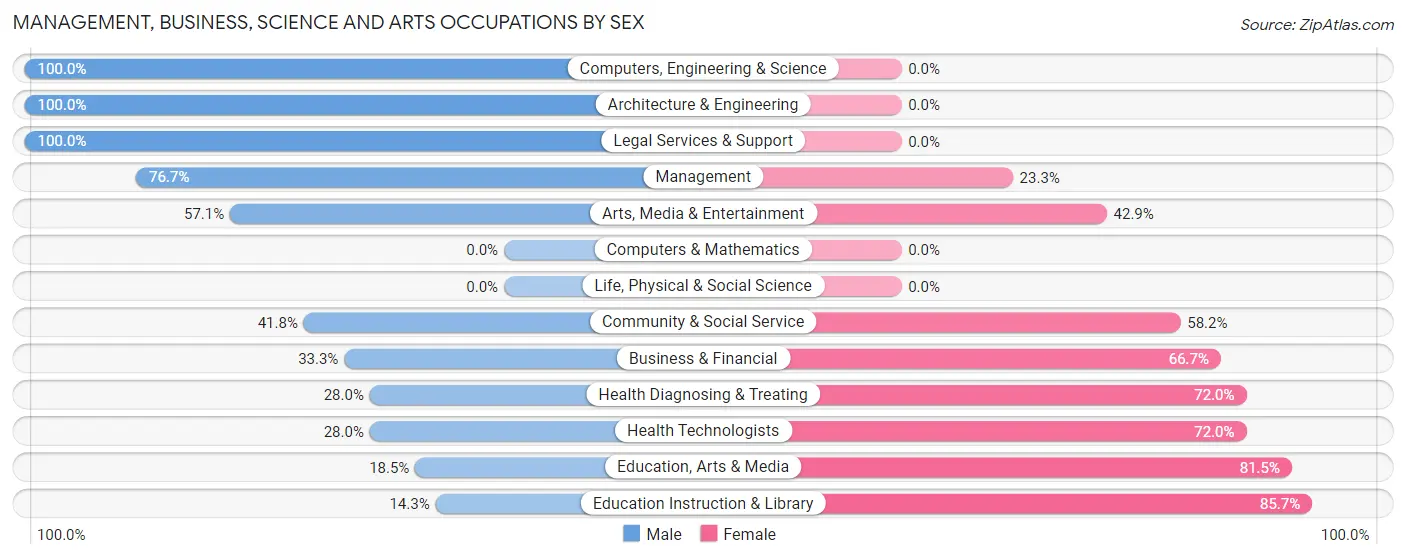
Management, Business, Science and Arts Occupations by Sex
Within the Management, Business, Science and Arts occupations in Lake Shore, the most male-oriented occupations are Computers, Engineering & Science (100.0%), Architecture & Engineering (100.0%), and Legal Services & Support (100.0%), while the most female-oriented occupations are Education Instruction & Library (85.7%), Education, Arts & Media (81.5%), and Health Diagnosing & Treating (72.0%).
| Occupation | Male | Female |
| Management | 66 (76.7%) | 20 (23.3%) |
| Business & Financial | 12 (33.3%) | 24 (66.7%) |
| Computers, Engineering & Science | 5 (100.0%) | 0 (0.0%) |
| Computers & Mathematics | 0 (0.0%) | 0 (0.0%) |
| Architecture & Engineering | 5 (100.0%) | 0 (0.0%) |
| Life, Physical & Social Science | 0 (0.0%) | 0 (0.0%) |
| Community & Social Service | 33 (41.8%) | 46 (58.2%) |
| Education, Arts & Media | 5 (18.5%) | 22 (81.5%) |
| Legal Services & Support | 17 (100.0%) | 0 (0.0%) |
| Education Instruction & Library | 3 (14.3%) | 18 (85.7%) |
| Arts, Media & Entertainment | 8 (57.1%) | 6 (42.9%) |
| Health Diagnosing & Treating | 7 (28.0%) | 18 (72.0%) |
| Health Technologists | 7 (28.0%) | 18 (72.0%) |
| Total (Category) | 123 (53.2%) | 108 (46.8%) |
| Total (Overall) | 297 (55.7%) | 236 (44.3%) |
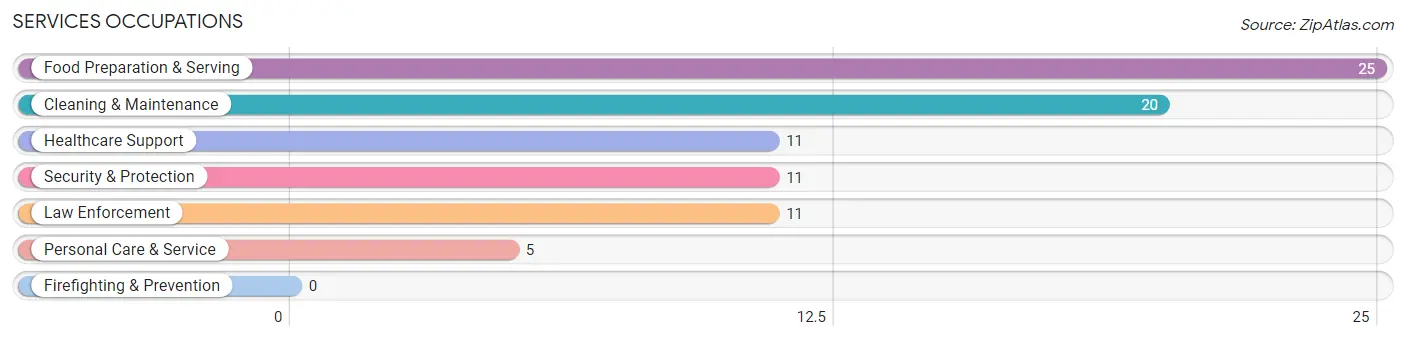
Services Occupations
The most common Services occupations in Lake Shore are Food Preparation & Serving (25 | 4.7%), Cleaning & Maintenance (20 | 3.7%), Healthcare Support (11 | 2.1%), Security & Protection (11 | 2.1%), and Law Enforcement (11 | 2.1%).
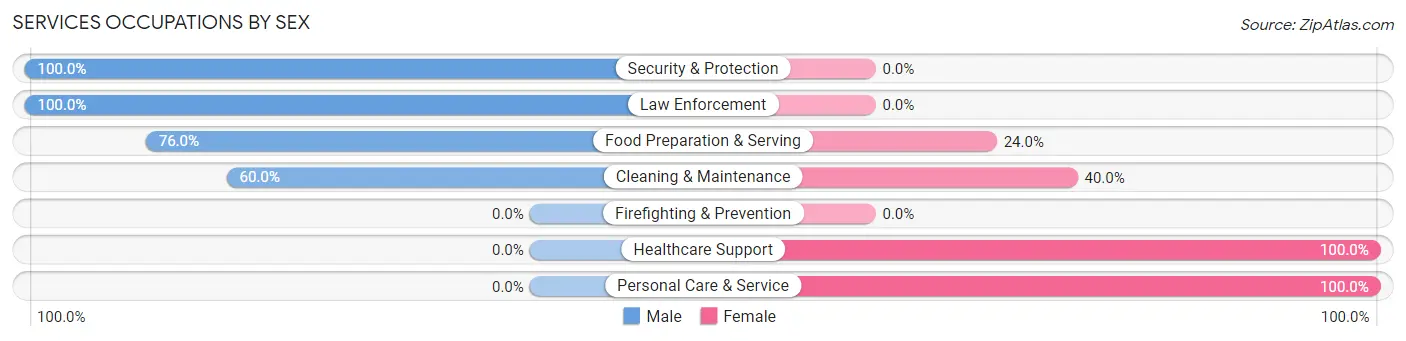
Services Occupations by Sex
Within the Services occupations in Lake Shore, the most male-oriented occupations are Security & Protection (100.0%), Law Enforcement (100.0%), and Food Preparation & Serving (76.0%), while the most female-oriented occupations are Healthcare Support (100.0%), Personal Care & Service (100.0%), and Cleaning & Maintenance (40.0%).
| Occupation | Male | Female |
| Healthcare Support | 0 (0.0%) | 11 (100.0%) |
| Security & Protection | 11 (100.0%) | 0 (0.0%) |
| Firefighting & Prevention | 0 (0.0%) | 0 (0.0%) |
| Law Enforcement | 11 (100.0%) | 0 (0.0%) |
| Food Preparation & Serving | 19 (76.0%) | 6 (24.0%) |
| Cleaning & Maintenance | 12 (60.0%) | 8 (40.0%) |
| Personal Care & Service | 0 (0.0%) | 5 (100.0%) |
| Total (Category) | 42 (58.3%) | 30 (41.7%) |
| Total (Overall) | 297 (55.7%) | 236 (44.3%) |
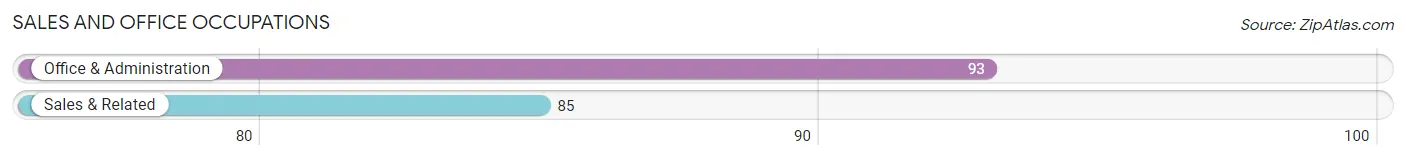
Sales and Office Occupations
The most common Sales and Office occupations in Lake Shore are Office & Administration (93 | 17.4%), and Sales & Related (85 | 16.0%).
Sales and Office Occupations by Sex
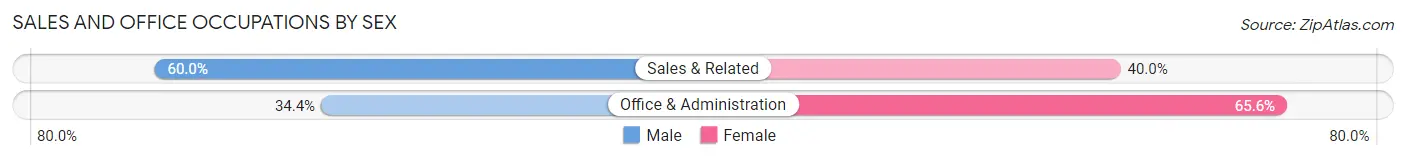
| Occupation | Male | Female |
| Sales & Related | 51 (60.0%) | 34 (40.0%) |
| Office & Administration | 32 (34.4%) | 61 (65.6%) |
| Total (Category) | 83 (46.6%) | 95 (53.4%) |
| Total (Overall) | 297 (55.7%) | 236 (44.3%) |
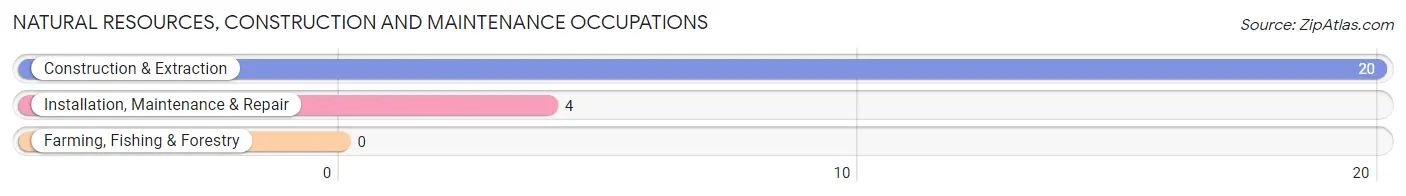
Natural Resources, Construction and Maintenance Occupations
The most common Natural Resources, Construction and Maintenance occupations in Lake Shore are Construction & Extraction (20 | 3.7%), and Installation, Maintenance & Repair (4 | 0.7%).
Natural Resources, Construction and Maintenance Occupations by Sex
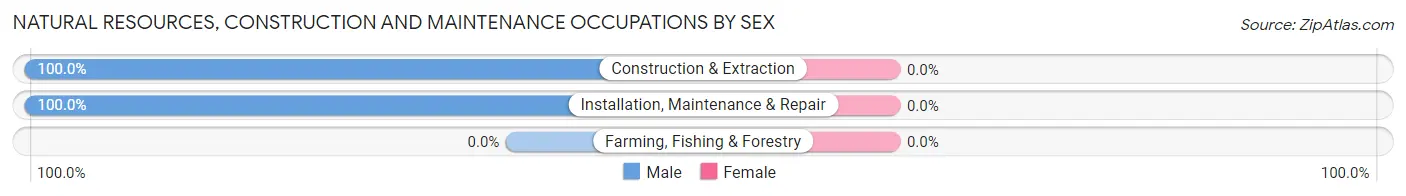
| Occupation | Male | Female |
| Farming, Fishing & Forestry | 0 (0.0%) | 0 (0.0%) |
| Construction & Extraction | 20 (100.0%) | 0 (0.0%) |
| Installation, Maintenance & Repair | 4 (100.0%) | 0 (0.0%) |
| Total (Category) | 24 (100.0%) | 0 (0.0%) |
| Total (Overall) | 297 (55.7%) | 236 (44.3%) |
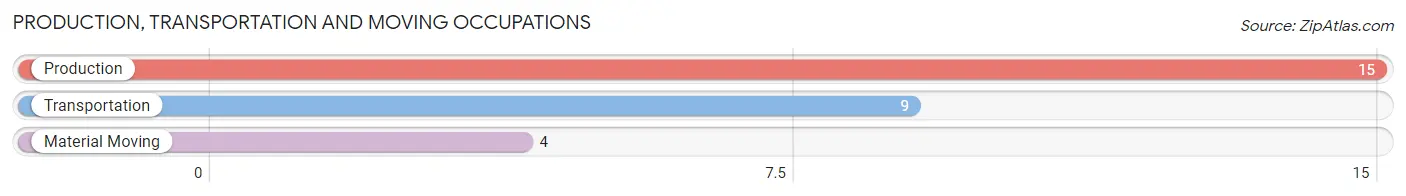
Production, Transportation and Moving Occupations
The most common Production, Transportation and Moving occupations in Lake Shore are Production (15 | 2.8%), Transportation (9 | 1.7%), and Material Moving (4 | 0.7%).
Production, Transportation and Moving Occupations by Sex
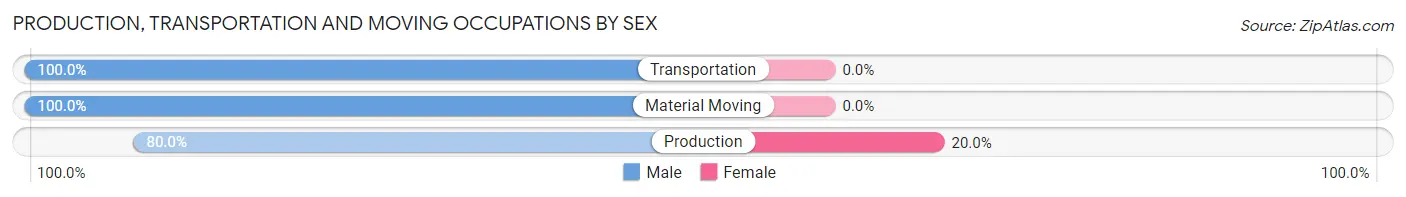
| Occupation | Male | Female |
| Production | 12 (80.0%) | 3 (20.0%) |
| Transportation | 9 (100.0%) | 0 (0.0%) |
| Material Moving | 4 (100.0%) | 0 (0.0%) |
| Total (Category) | 25 (89.3%) | 3 (10.7%) |
| Total (Overall) | 297 (55.7%) | 236 (44.3%) |
Employment Industries by Sex in Lake Shore
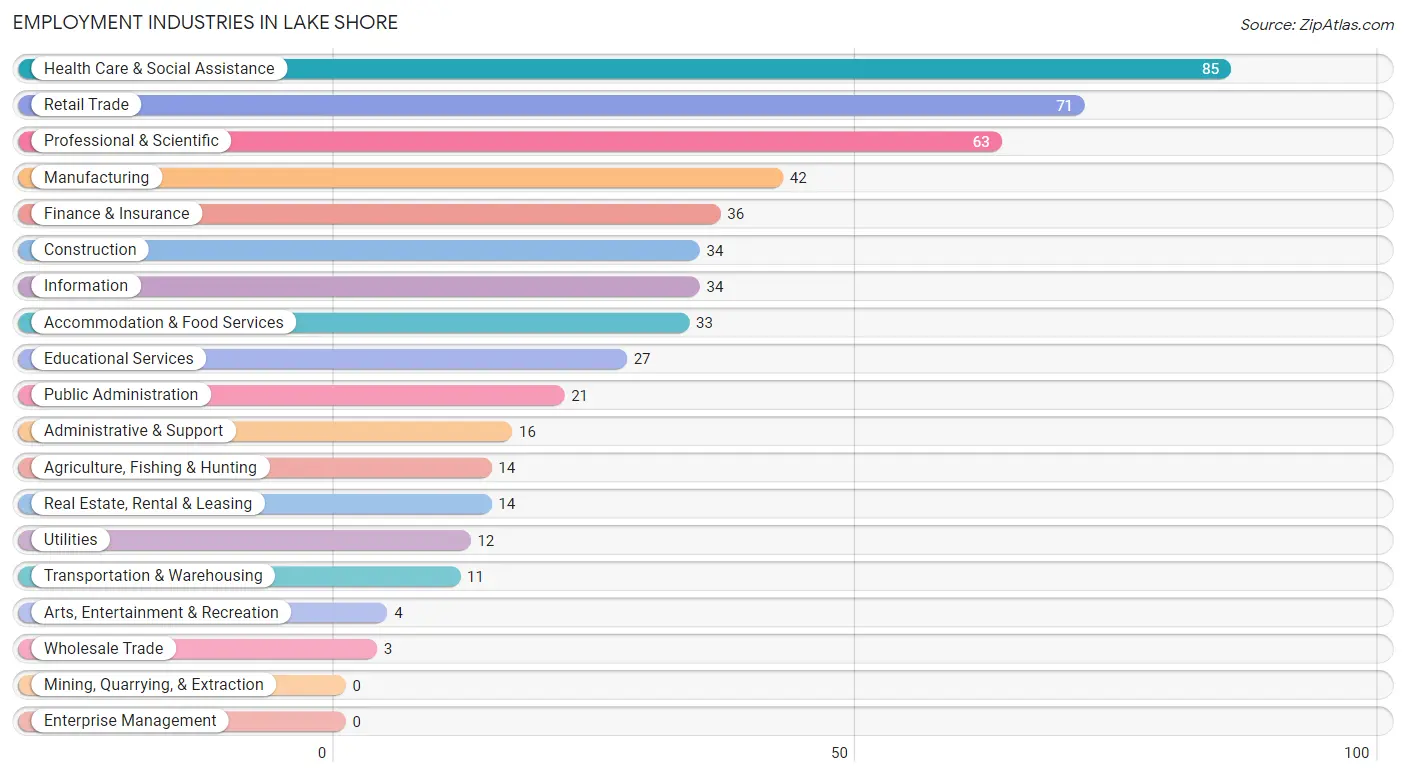
Employment Industries in Lake Shore
The major employment industries in Lake Shore include Health Care & Social Assistance (85 | 16.0%), Retail Trade (71 | 13.3%), Professional & Scientific (63 | 11.8%), Manufacturing (42 | 7.9%), and Finance & Insurance (36 | 6.8%).
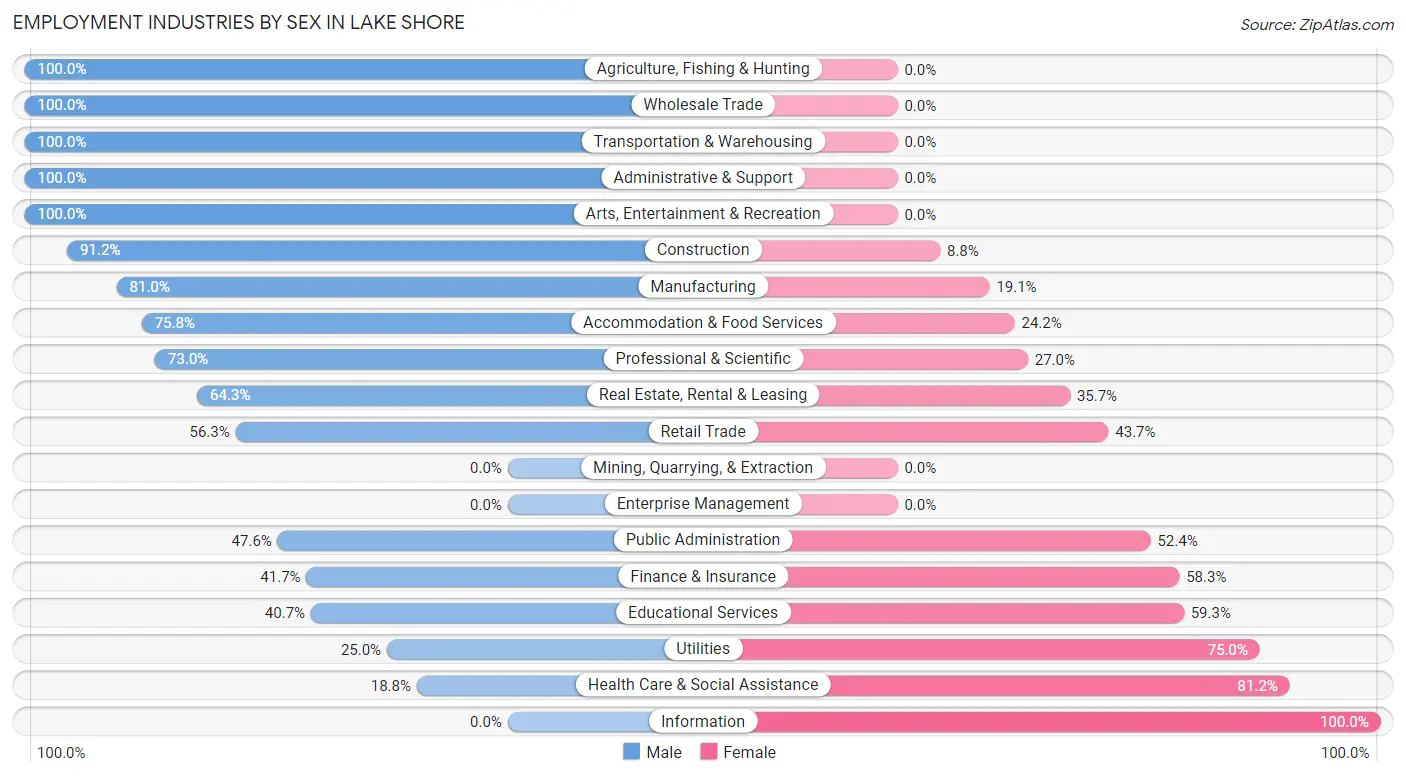
Employment Industries by Sex in Lake Shore
The Lake Shore industries that see more men than women are Agriculture, Fishing & Hunting (100.0%), Wholesale Trade (100.0%), and Transportation & Warehousing (100.0%), whereas the industries that tend to have a higher number of women are Information (100.0%), Health Care & Social Assistance (81.2%), and Utilities (75.0%).
| Industry | Male | Female |
| Agriculture, Fishing & Hunting | 14 (100.0%) | 0 (0.0%) |
| Mining, Quarrying, & Extraction | 0 (0.0%) | 0 (0.0%) |
| Construction | 31 (91.2%) | 3 (8.8%) |
| Manufacturing | 34 (80.9%) | 8 (19.1%) |
| Wholesale Trade | 3 (100.0%) | 0 (0.0%) |
| Retail Trade | 40 (56.3%) | 31 (43.7%) |
| Transportation & Warehousing | 11 (100.0%) | 0 (0.0%) |
| Utilities | 3 (25.0%) | 9 (75.0%) |
| Information | 0 (0.0%) | 34 (100.0%) |
| Finance & Insurance | 15 (41.7%) | 21 (58.3%) |
| Real Estate, Rental & Leasing | 9 (64.3%) | 5 (35.7%) |
| Professional & Scientific | 46 (73.0%) | 17 (27.0%) |
| Enterprise Management | 0 (0.0%) | 0 (0.0%) |
| Administrative & Support | 16 (100.0%) | 0 (0.0%) |
| Educational Services | 11 (40.7%) | 16 (59.3%) |
| Health Care & Social Assistance | 16 (18.8%) | 69 (81.2%) |
| Arts, Entertainment & Recreation | 4 (100.0%) | 0 (0.0%) |
| Accommodation & Food Services | 25 (75.8%) | 8 (24.2%) |
| Public Administration | 10 (47.6%) | 11 (52.4%) |
| Total | 297 (55.7%) | 236 (44.3%) |
Education in Lake Shore
School Enrollment in Lake Shore
The most common levels of schooling among the 229 students in Lake Shore are middle school (52 | 22.7%), high school (51 | 22.3%), and elementary school (46 | 20.1%).
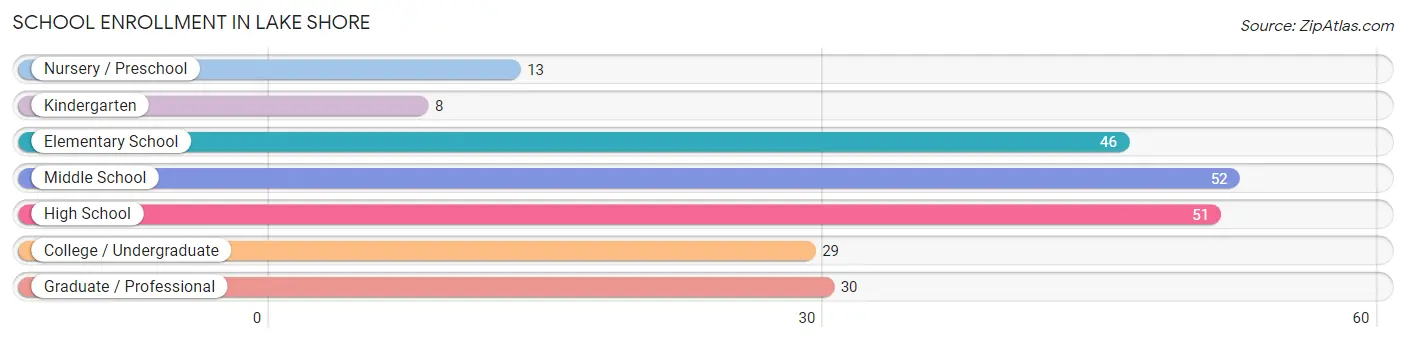
| School Level | # Students | % Students |
| Nursery / Preschool | 13 | 5.7% |
| Kindergarten | 8 | 3.5% |
| Elementary School | 46 | 20.1% |
| Middle School | 52 | 22.7% |
| High School | 51 | 22.3% |
| College / Undergraduate | 29 | 12.7% |
| Graduate / Professional | 30 | 13.1% |
| Total | 229 | 100.0% |
School Enrollment by Age by Funding Source in Lake Shore
Out of a total of 229 students who are enrolled in schools in Lake Shore, 53 (23.1%) attend a private institution, while the remaining 176 (76.9%) are enrolled in public schools. The age group of 25 to 34 year olds has the highest likelihood of being enrolled in private schools, with 26 (70.3% in the age bracket) enrolled. Conversely, the age group of 3 to 4 year olds has the lowest likelihood of being enrolled in a private school, with 6 (100.0% in the age bracket) attending a public institution.
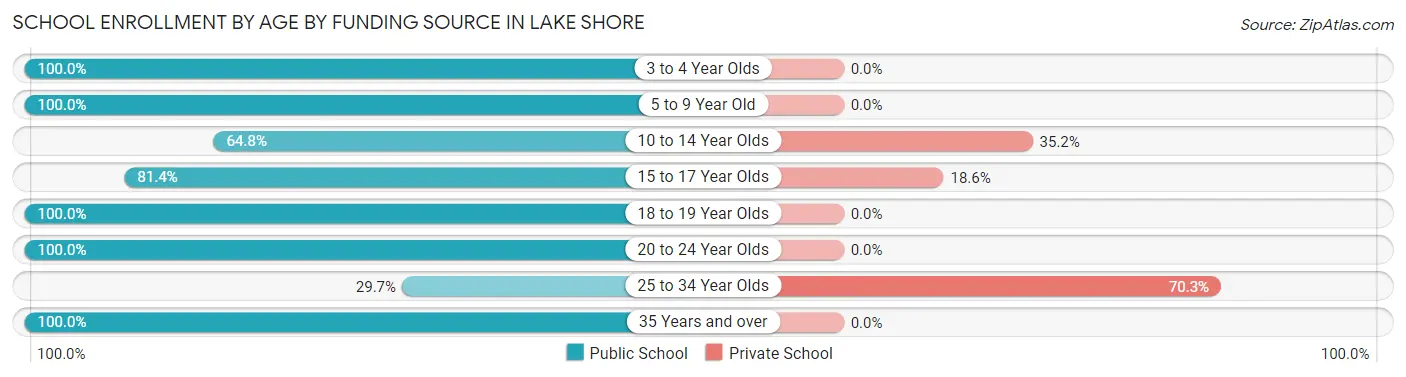
| Age Bracket | Public School | Private School |
| 3 to 4 Year Olds | 6 (100.0%) | 0 (0.0%) |
| 5 to 9 Year Old | 59 (100.0%) | 0 (0.0%) |
| 10 to 14 Year Olds | 35 (64.8%) | 19 (35.2%) |
| 15 to 17 Year Olds | 35 (81.4%) | 8 (18.6%) |
| 18 to 19 Year Olds | 8 (100.0%) | 0 (0.0%) |
| 20 to 24 Year Olds | 11 (100.0%) | 0 (0.0%) |
| 25 to 34 Year Olds | 11 (29.7%) | 26 (70.3%) |
| 35 Years and over | 11 (100.0%) | 0 (0.0%) |
| Total | 176 (76.9%) | 53 (23.1%) |
Educational Attainment by Field of Study in Lake Shore
Business (103 | 24.8%), social sciences (59 | 14.2%), education (51 | 12.3%), bio, nature & agricultural (40 | 9.6%), and psychology (40 | 9.6%) are the most common fields of study among 415 individuals in Lake Shore who have obtained a bachelor's degree or higher.
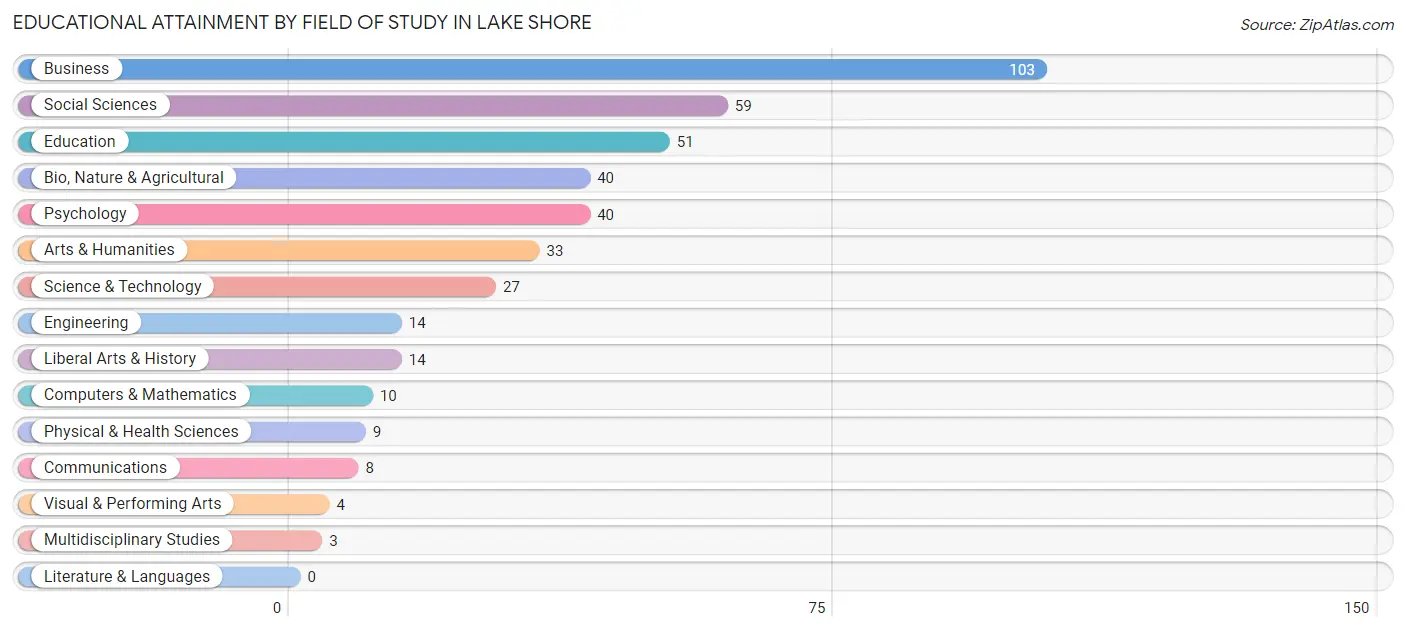
| Field of Study | # Graduates | % Graduates |
| Computers & Mathematics | 10 | 2.4% |
| Bio, Nature & Agricultural | 40 | 9.6% |
| Physical & Health Sciences | 9 | 2.2% |
| Psychology | 40 | 9.6% |
| Social Sciences | 59 | 14.2% |
| Engineering | 14 | 3.4% |
| Multidisciplinary Studies | 3 | 0.7% |
| Science & Technology | 27 | 6.5% |
| Business | 103 | 24.8% |
| Education | 51 | 12.3% |
| Literature & Languages | 0 | 0.0% |
| Liberal Arts & History | 14 | 3.4% |
| Visual & Performing Arts | 4 | 1.0% |
| Communications | 8 | 1.9% |
| Arts & Humanities | 33 | 8.0% |
| Total | 415 | 100.0% |
Transportation & Commute in Lake Shore
Vehicle Availability by Sex in Lake Shore
The most prevalent vehicle ownership categories in Lake Shore are males with 2 vehicles (158, accounting for 53.2%) and females with 2 vehicles (90, making up 69.0%).
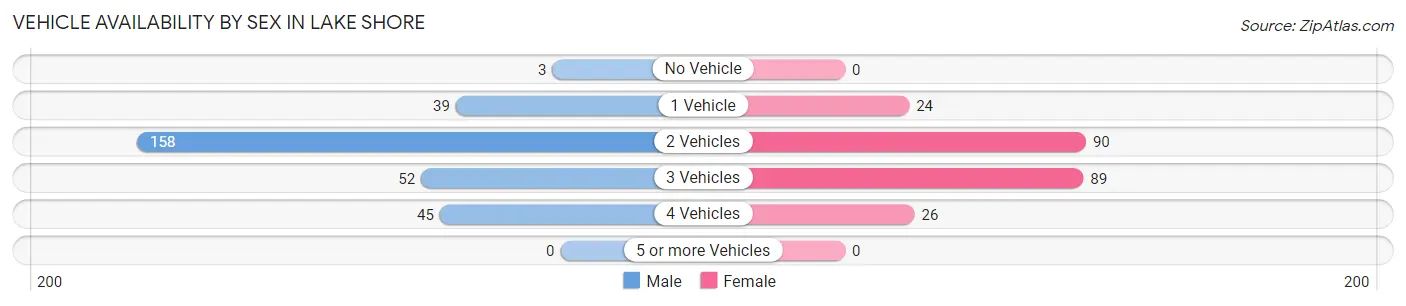
| Vehicles Available | Male | Female |
| No Vehicle | 3 (1.0%) | 0 (0.0%) |
| 1 Vehicle | 39 (13.1%) | 24 (10.5%) |
| 2 Vehicles | 158 (53.2%) | 90 (39.3%) |
| 3 Vehicles | 52 (17.5%) | 89 (38.9%) |
| 4 Vehicles | 45 (15.1%) | 26 (11.4%) |
| 5 or more Vehicles | 0 (0.0%) | 0 (0.0%) |
| Total | 297 (100.0%) | 229 (100.0%) |
Commute Time in Lake Shore
The most frequently occuring commute durations in Lake Shore are 20 to 24 minutes (127 commuters, 29.7%), 5 to 9 minutes (70 commuters, 16.4%), and 15 to 19 minutes (63 commuters, 14.7%).
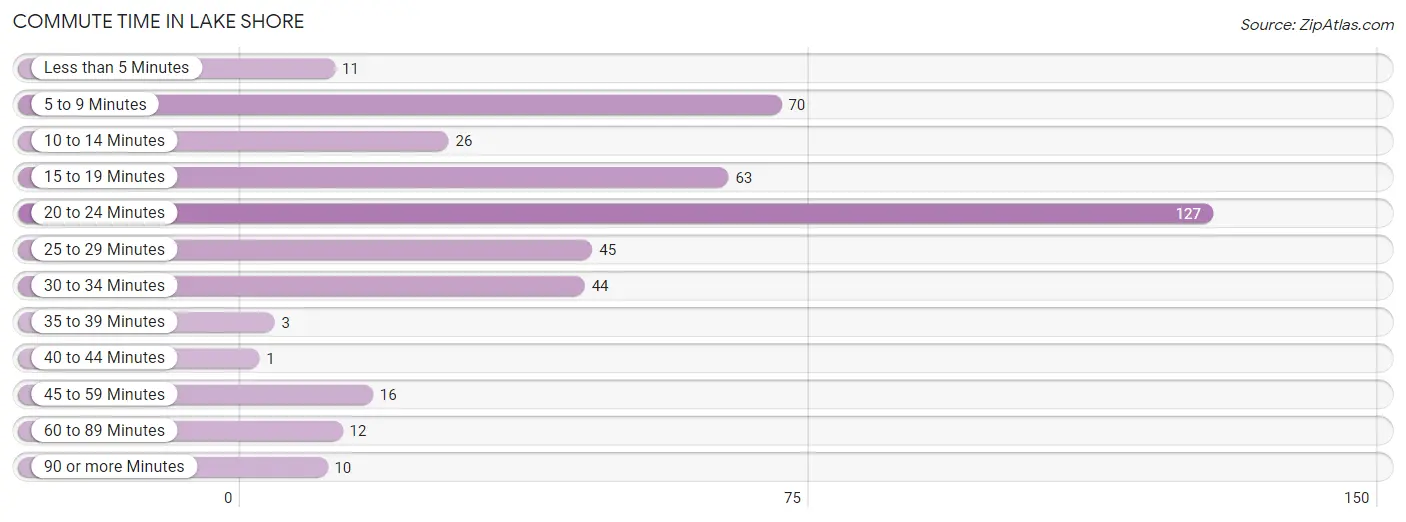
| Commute Time | # Commuters | % Commuters |
| Less than 5 Minutes | 11 | 2.6% |
| 5 to 9 Minutes | 70 | 16.4% |
| 10 to 14 Minutes | 26 | 6.1% |
| 15 to 19 Minutes | 63 | 14.7% |
| 20 to 24 Minutes | 127 | 29.7% |
| 25 to 29 Minutes | 45 | 10.5% |
| 30 to 34 Minutes | 44 | 10.3% |
| 35 to 39 Minutes | 3 | 0.7% |
| 40 to 44 Minutes | 1 | 0.2% |
| 45 to 59 Minutes | 16 | 3.7% |
| 60 to 89 Minutes | 12 | 2.8% |
| 90 or more Minutes | 10 | 2.3% |
Commute Time by Sex in Lake Shore
The most common commute times in Lake Shore are 20 to 24 minutes (63 commuters, 25.0%) for males and 20 to 24 minutes (64 commuters, 36.4%) for females.
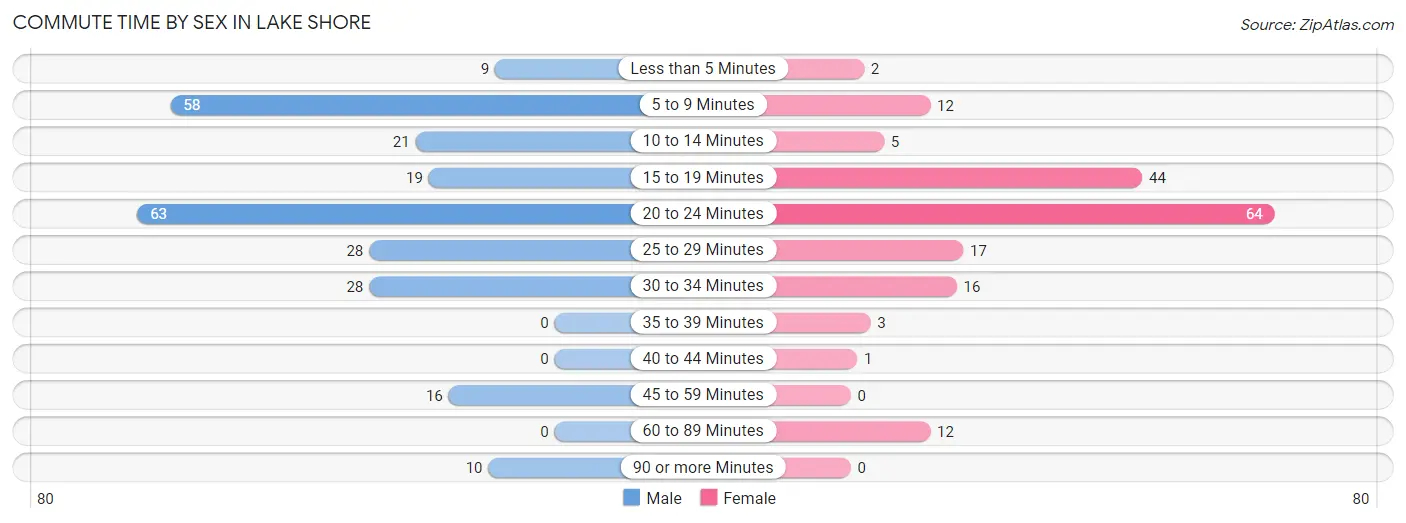
| Commute Time | Male | Female |
| Less than 5 Minutes | 9 (3.6%) | 2 (1.1%) |
| 5 to 9 Minutes | 58 (23.0%) | 12 (6.8%) |
| 10 to 14 Minutes | 21 (8.3%) | 5 (2.8%) |
| 15 to 19 Minutes | 19 (7.5%) | 44 (25.0%) |
| 20 to 24 Minutes | 63 (25.0%) | 64 (36.4%) |
| 25 to 29 Minutes | 28 (11.1%) | 17 (9.7%) |
| 30 to 34 Minutes | 28 (11.1%) | 16 (9.1%) |
| 35 to 39 Minutes | 0 (0.0%) | 3 (1.7%) |
| 40 to 44 Minutes | 0 (0.0%) | 1 (0.6%) |
| 45 to 59 Minutes | 16 (6.4%) | 0 (0.0%) |
| 60 to 89 Minutes | 0 (0.0%) | 12 (6.8%) |
| 90 or more Minutes | 10 (4.0%) | 0 (0.0%) |
Time of Departure to Work by Sex in Lake Shore
The most frequent times of departure to work in Lake Shore are 7:30 AM to 7:59 AM (66, 26.2%) for males and 7:00 AM to 7:29 AM (48, 27.3%) for females.
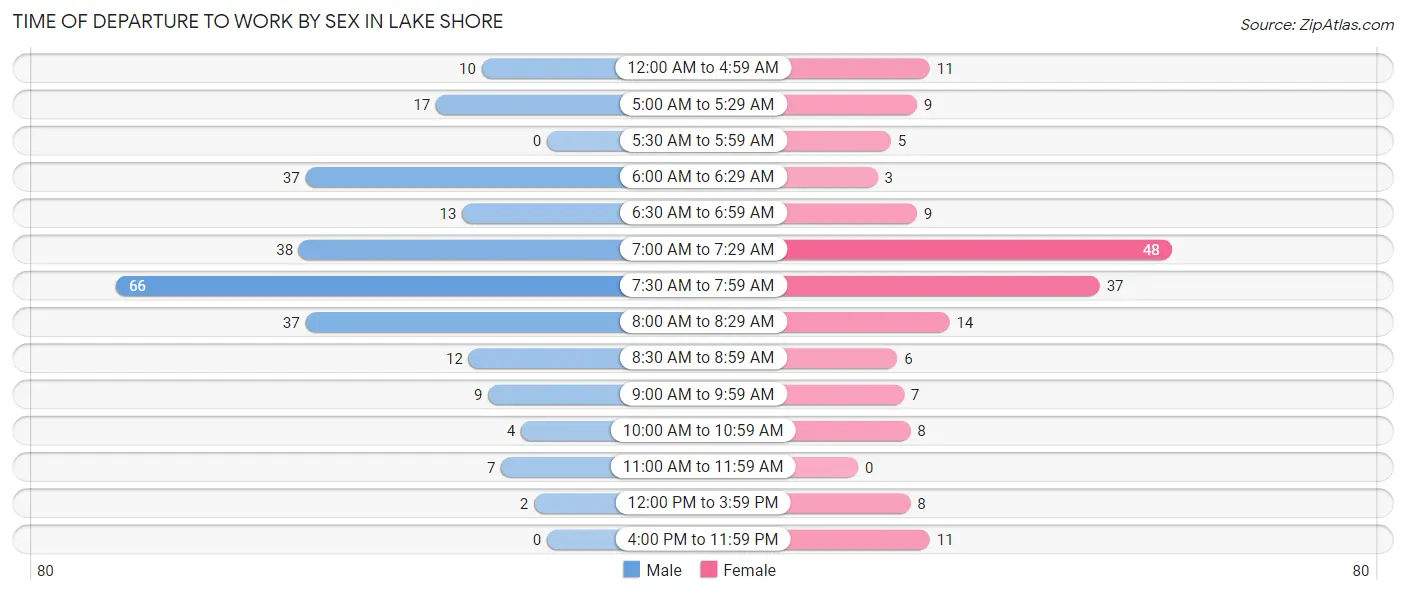
| Time of Departure | Male | Female |
| 12:00 AM to 4:59 AM | 10 (4.0%) | 11 (6.2%) |
| 5:00 AM to 5:29 AM | 17 (6.8%) | 9 (5.1%) |
| 5:30 AM to 5:59 AM | 0 (0.0%) | 5 (2.8%) |
| 6:00 AM to 6:29 AM | 37 (14.7%) | 3 (1.7%) |
| 6:30 AM to 6:59 AM | 13 (5.2%) | 9 (5.1%) |
| 7:00 AM to 7:29 AM | 38 (15.1%) | 48 (27.3%) |
| 7:30 AM to 7:59 AM | 66 (26.2%) | 37 (21.0%) |
| 8:00 AM to 8:29 AM | 37 (14.7%) | 14 (8.0%) |
| 8:30 AM to 8:59 AM | 12 (4.8%) | 6 (3.4%) |
| 9:00 AM to 9:59 AM | 9 (3.6%) | 7 (4.0%) |
| 10:00 AM to 10:59 AM | 4 (1.6%) | 8 (4.5%) |
| 11:00 AM to 11:59 AM | 7 (2.8%) | 0 (0.0%) |
| 12:00 PM to 3:59 PM | 2 (0.8%) | 8 (4.5%) |
| 4:00 PM to 11:59 PM | 0 (0.0%) | 11 (6.2%) |
| Total | 252 (100.0%) | 176 (100.0%) |
Housing Occupancy in Lake Shore
Occupancy by Ownership in Lake Shore
Of the total 512 dwellings in Lake Shore, owner-occupied units account for 450 (87.9%), while renter-occupied units make up 62 (12.1%).
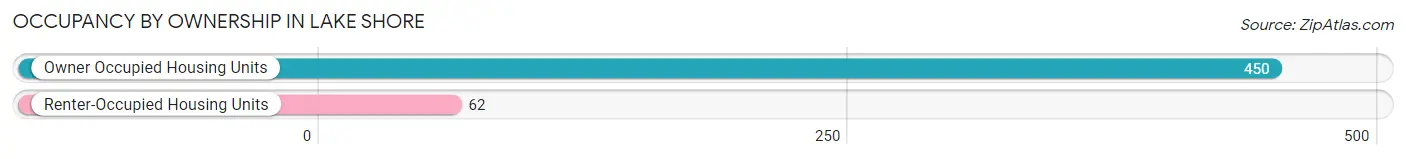
| Occupancy | # Housing Units | % Housing Units |
| Owner Occupied Housing Units | 450 | 87.9% |
| Renter-Occupied Housing Units | 62 | 12.1% |
| Total Occupied Housing Units | 512 | 100.0% |
Occupancy by Household Size in Lake Shore
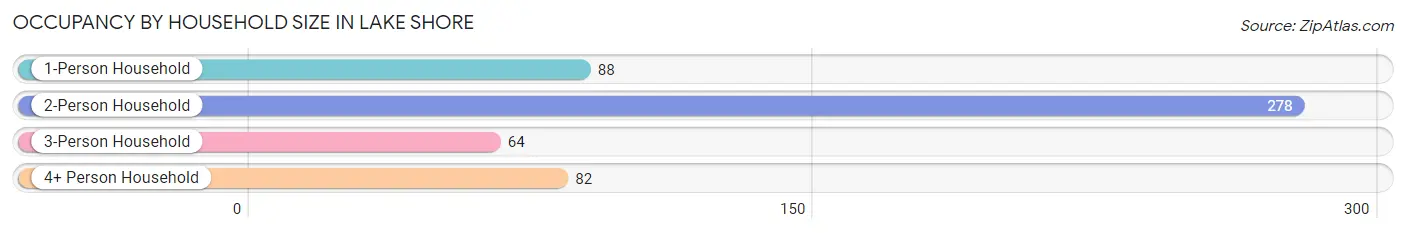
| Household Size | # Housing Units | % Housing Units |
| 1-Person Household | 88 | 17.2% |
| 2-Person Household | 278 | 54.3% |
| 3-Person Household | 64 | 12.5% |
| 4+ Person Household | 82 | 16.0% |
| Total Housing Units | 512 | 100.0% |
Occupancy by Ownership by Household Size in Lake Shore
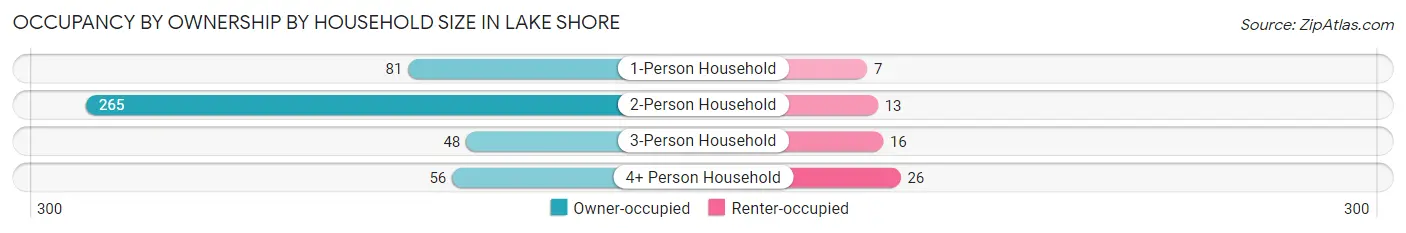
| Household Size | Owner-occupied | Renter-occupied |
| 1-Person Household | 81 (92.0%) | 7 (8.0%) |
| 2-Person Household | 265 (95.3%) | 13 (4.7%) |
| 3-Person Household | 48 (75.0%) | 16 (25.0%) |
| 4+ Person Household | 56 (68.3%) | 26 (31.7%) |
| Total Housing Units | 450 (87.9%) | 62 (12.1%) |
Occupancy by Educational Attainment in Lake Shore
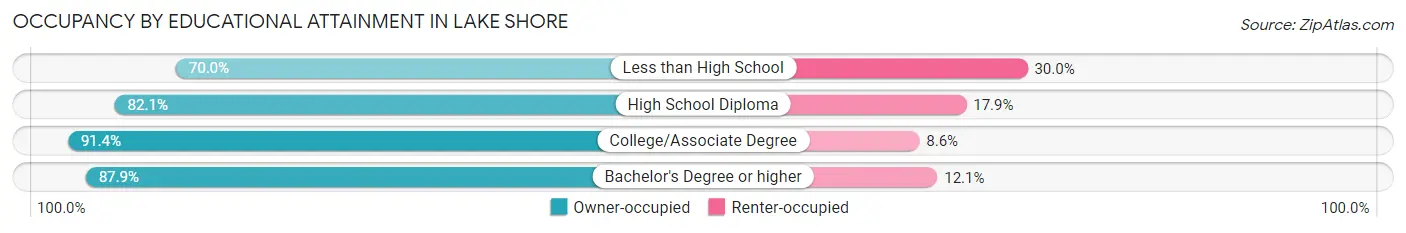
| Household Size | Owner-occupied | Renter-occupied |
| Less than High School | 7 (70.0%) | 3 (30.0%) |
| High School Diploma | 69 (82.1%) | 15 (17.9%) |
| College/Associate Degree | 171 (91.4%) | 16 (8.6%) |
| Bachelor's Degree or higher | 203 (87.9%) | 28 (12.1%) |
Occupancy by Age of Householder in Lake Shore
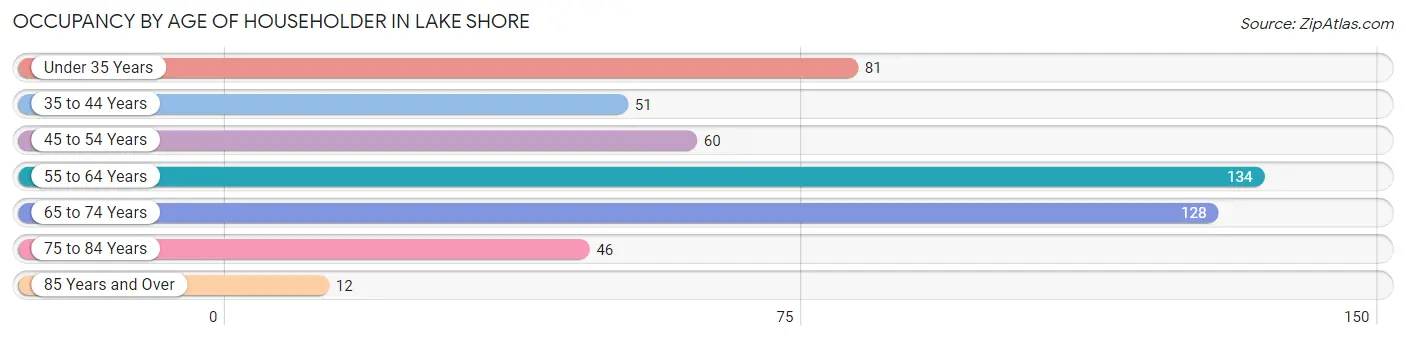
| Age Bracket | # Households | % Households |
| Under 35 Years | 81 | 15.8% |
| 35 to 44 Years | 51 | 10.0% |
| 45 to 54 Years | 60 | 11.7% |
| 55 to 64 Years | 134 | 26.2% |
| 65 to 74 Years | 128 | 25.0% |
| 75 to 84 Years | 46 | 9.0% |
| 85 Years and Over | 12 | 2.3% |
| Total | 512 | 100.0% |
Housing Finances in Lake Shore
Median Income by Occupancy in Lake Shore
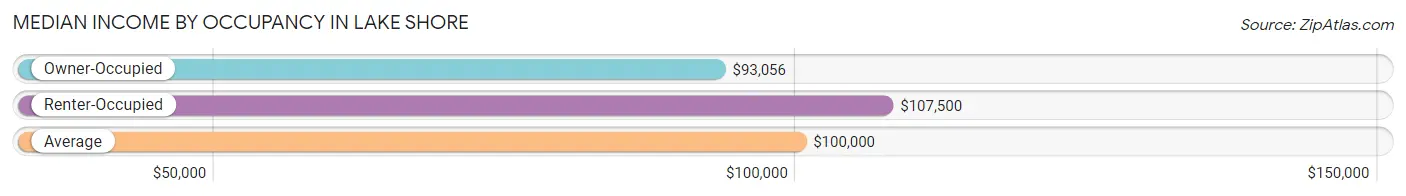
| Occupancy Type | # Households | Median Income |
| Owner-Occupied | 450 (87.9%) | $93,056 |
| Renter-Occupied | 62 (12.1%) | $107,500 |
| Average | 512 (100.0%) | $100,000 |
Occupancy by Householder Income Bracket in Lake Shore
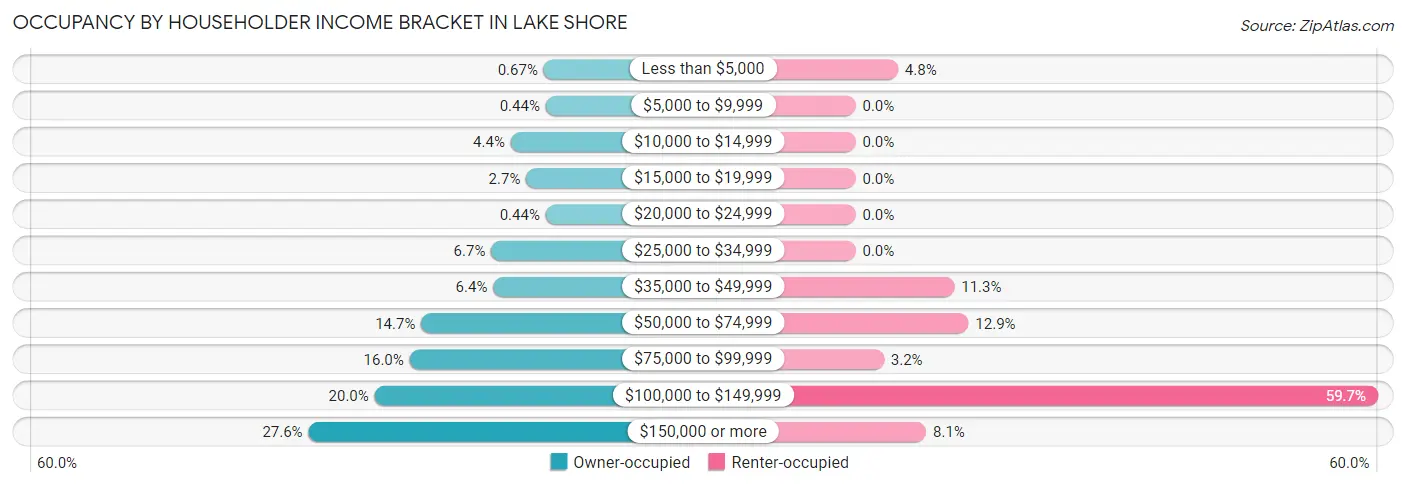
| Income Bracket | Owner-occupied | Renter-occupied |
| Less than $5,000 | 3 (0.7%) | 3 (4.8%) |
| $5,000 to $9,999 | 2 (0.4%) | 0 (0.0%) |
| $10,000 to $14,999 | 20 (4.4%) | 0 (0.0%) |
| $15,000 to $19,999 | 12 (2.7%) | 0 (0.0%) |
| $20,000 to $24,999 | 2 (0.4%) | 0 (0.0%) |
| $25,000 to $34,999 | 30 (6.7%) | 0 (0.0%) |
| $35,000 to $49,999 | 29 (6.4%) | 7 (11.3%) |
| $50,000 to $74,999 | 66 (14.7%) | 8 (12.9%) |
| $75,000 to $99,999 | 72 (16.0%) | 2 (3.2%) |
| $100,000 to $149,999 | 90 (20.0%) | 37 (59.7%) |
| $150,000 or more | 124 (27.6%) | 5 (8.1%) |
| Total | 450 (100.0%) | 62 (100.0%) |
Monthly Housing Cost Tiers in Lake Shore
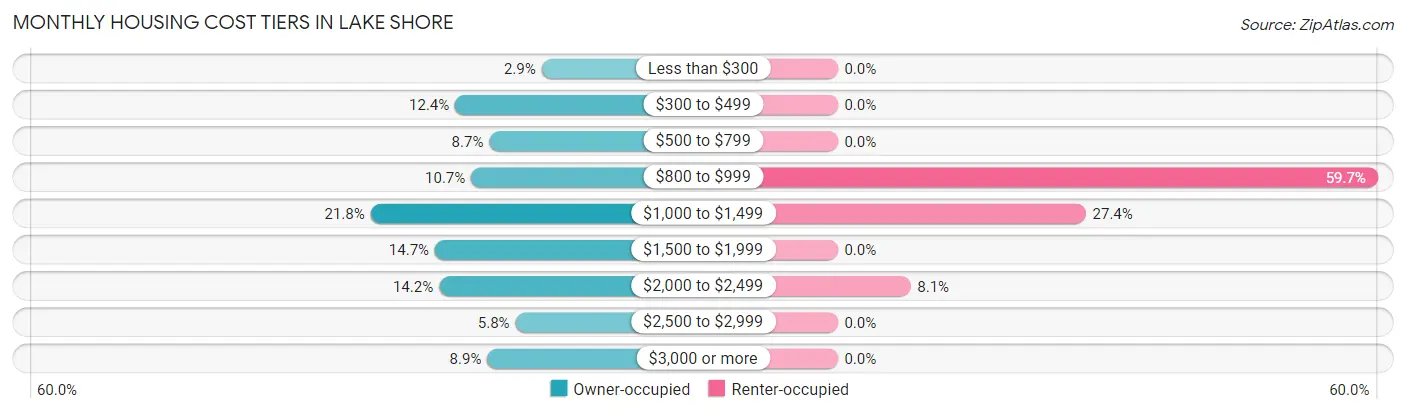
| Monthly Cost | Owner-occupied | Renter-occupied |
| Less than $300 | 13 (2.9%) | 0 (0.0%) |
| $300 to $499 | 56 (12.4%) | 0 (0.0%) |
| $500 to $799 | 39 (8.7%) | 0 (0.0%) |
| $800 to $999 | 48 (10.7%) | 37 (59.7%) |
| $1,000 to $1,499 | 98 (21.8%) | 17 (27.4%) |
| $1,500 to $1,999 | 66 (14.7%) | 0 (0.0%) |
| $2,000 to $2,499 | 64 (14.2%) | 5 (8.1%) |
| $2,500 to $2,999 | 26 (5.8%) | 0 (0.0%) |
| $3,000 or more | 40 (8.9%) | 0 (0.0%) |
| Total | 450 (100.0%) | 62 (100.0%) |
Physical Housing Characteristics in Lake Shore
Housing Structures in Lake Shore
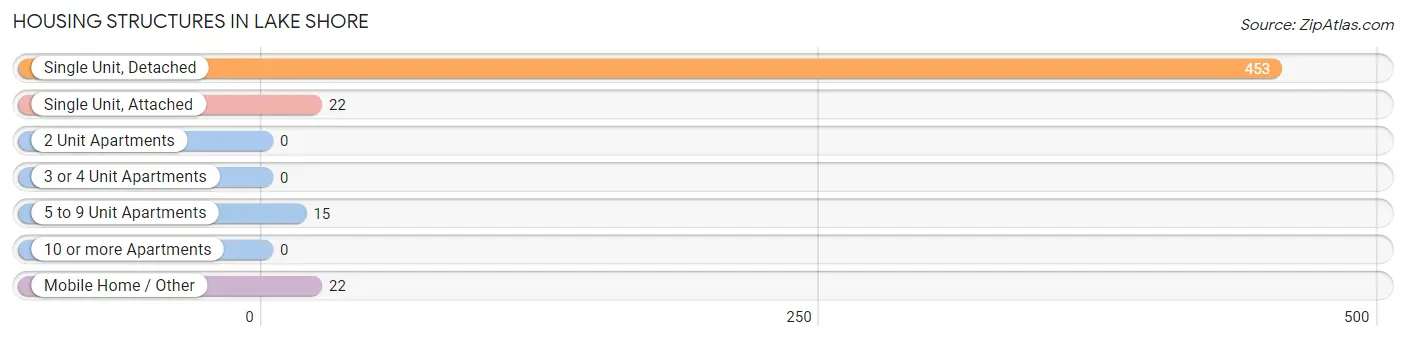
| Structure Type | # Housing Units | % Housing Units |
| Single Unit, Detached | 453 | 88.5% |
| Single Unit, Attached | 22 | 4.3% |
| 2 Unit Apartments | 0 | 0.0% |
| 3 or 4 Unit Apartments | 0 | 0.0% |
| 5 to 9 Unit Apartments | 15 | 2.9% |
| 10 or more Apartments | 0 | 0.0% |
| Mobile Home / Other | 22 | 4.3% |
| Total | 512 | 100.0% |
Housing Structures by Occupancy in Lake Shore
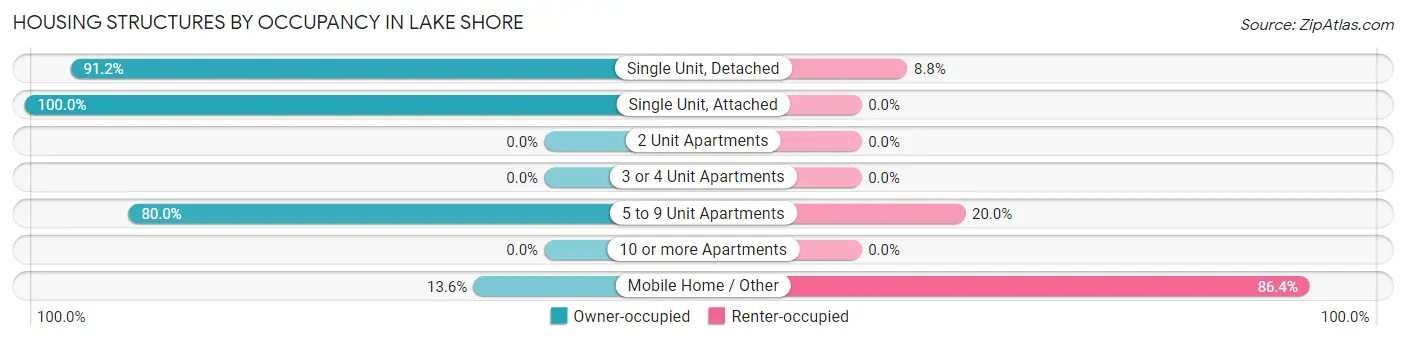
| Structure Type | Owner-occupied | Renter-occupied |
| Single Unit, Detached | 413 (91.2%) | 40 (8.8%) |
| Single Unit, Attached | 22 (100.0%) | 0 (0.0%) |
| 2 Unit Apartments | 0 (0.0%) | 0 (0.0%) |
| 3 or 4 Unit Apartments | 0 (0.0%) | 0 (0.0%) |
| 5 to 9 Unit Apartments | 12 (80.0%) | 3 (20.0%) |
| 10 or more Apartments | 0 (0.0%) | 0 (0.0%) |
| Mobile Home / Other | 3 (13.6%) | 19 (86.4%) |
| Total | 450 (87.9%) | 62 (12.1%) |
Housing Structures by Number of Rooms in Lake Shore
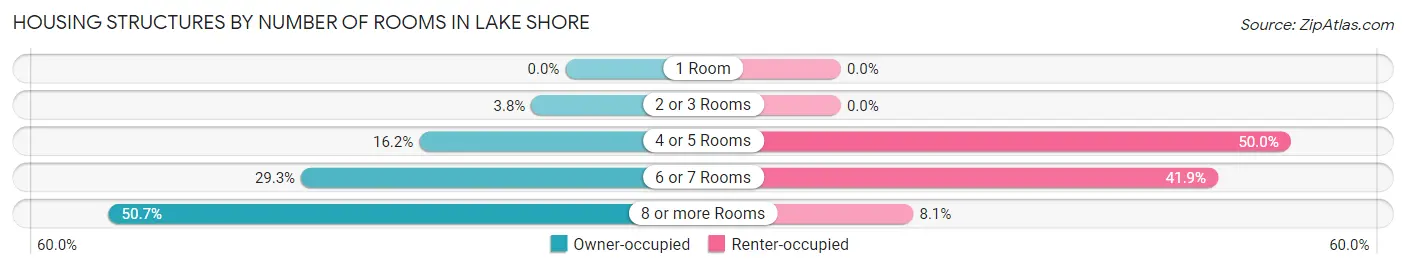
| Number of Rooms | Owner-occupied | Renter-occupied |
| 1 Room | 0 (0.0%) | 0 (0.0%) |
| 2 or 3 Rooms | 17 (3.8%) | 0 (0.0%) |
| 4 or 5 Rooms | 73 (16.2%) | 31 (50.0%) |
| 6 or 7 Rooms | 132 (29.3%) | 26 (41.9%) |
| 8 or more Rooms | 228 (50.7%) | 5 (8.1%) |
| Total | 450 (100.0%) | 62 (100.0%) |
Housing Structure by Heating Type in Lake Shore
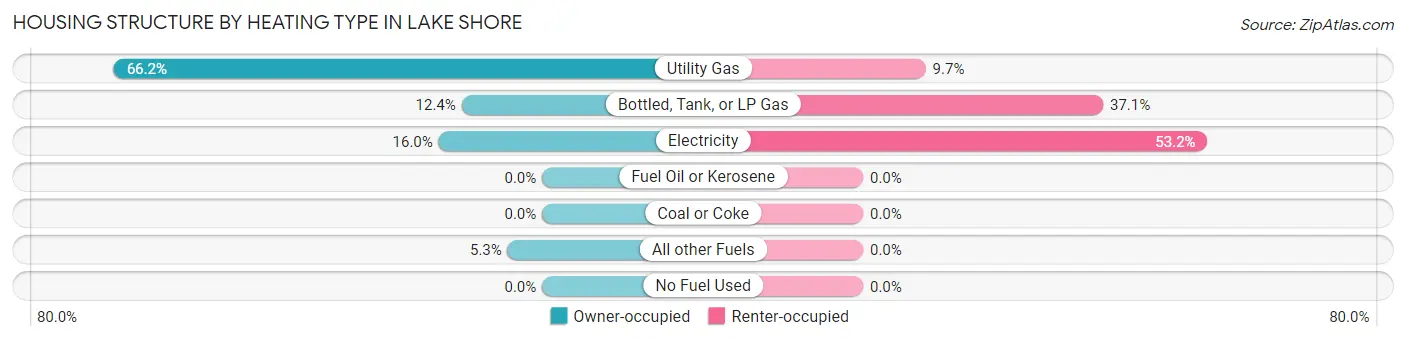
| Heating Type | Owner-occupied | Renter-occupied |
| Utility Gas | 298 (66.2%) | 6 (9.7%) |
| Bottled, Tank, or LP Gas | 56 (12.4%) | 23 (37.1%) |
| Electricity | 72 (16.0%) | 33 (53.2%) |
| Fuel Oil or Kerosene | 0 (0.0%) | 0 (0.0%) |
| Coal or Coke | 0 (0.0%) | 0 (0.0%) |
| All other Fuels | 24 (5.3%) | 0 (0.0%) |
| No Fuel Used | 0 (0.0%) | 0 (0.0%) |
| Total | 450 (100.0%) | 62 (100.0%) |
Household Vehicle Usage in Lake Shore
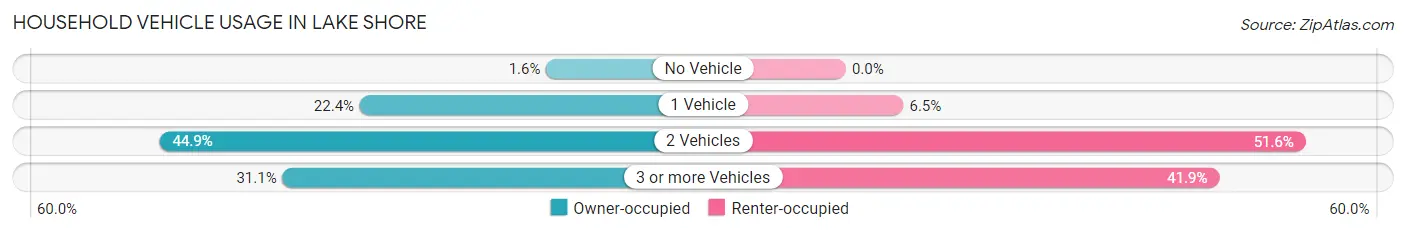
| Vehicles per Household | Owner-occupied | Renter-occupied |
| No Vehicle | 7 (1.6%) | 0 (0.0%) |
| 1 Vehicle | 101 (22.4%) | 4 (6.5%) |
| 2 Vehicles | 202 (44.9%) | 32 (51.6%) |
| 3 or more Vehicles | 140 (31.1%) | 26 (41.9%) |
| Total | 450 (100.0%) | 62 (100.0%) |
Real Estate & Mortgages in Lake Shore
Real Estate and Mortgage Overview in Lake Shore
| Characteristic | Without Mortgage | With Mortgage |
| Housing Units | 199 | 251 |
| Median Property Value | $520,800 | $420,400 |
| Median Household Income | $92,708 | $61 |
| Monthly Housing Costs | $847 | $40 |
| Real Estate Taxes | $4,958 | $3 |
Property Value by Mortgage Status in Lake Shore
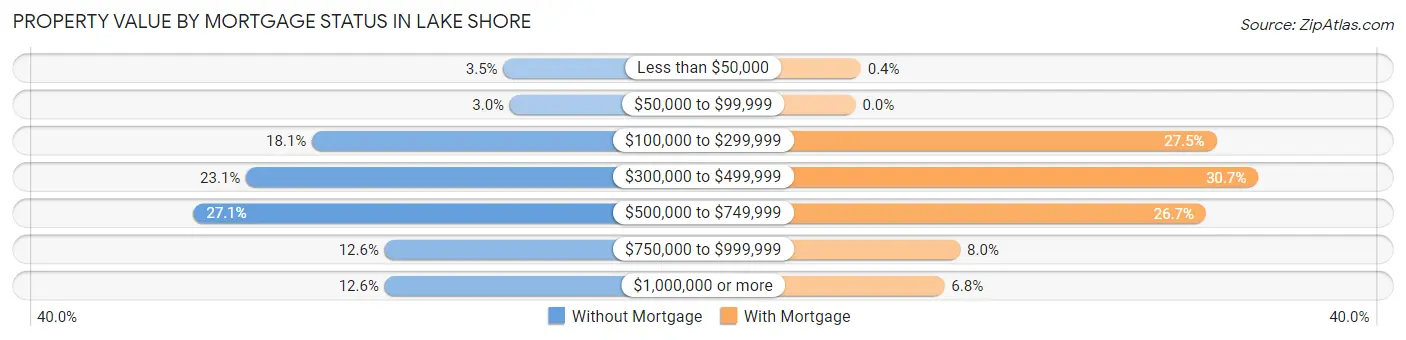
| Property Value | Without Mortgage | With Mortgage |
| Less than $50,000 | 7 (3.5%) | 1 (0.4%) |
| $50,000 to $99,999 | 6 (3.0%) | 0 (0.0%) |
| $100,000 to $299,999 | 36 (18.1%) | 69 (27.5%) |
| $300,000 to $499,999 | 46 (23.1%) | 77 (30.7%) |
| $500,000 to $749,999 | 54 (27.1%) | 67 (26.7%) |
| $750,000 to $999,999 | 25 (12.6%) | 20 (8.0%) |
| $1,000,000 or more | 25 (12.6%) | 17 (6.8%) |
| Total | 199 (100.0%) | 251 (100.0%) |
Household Income by Mortgage Status in Lake Shore
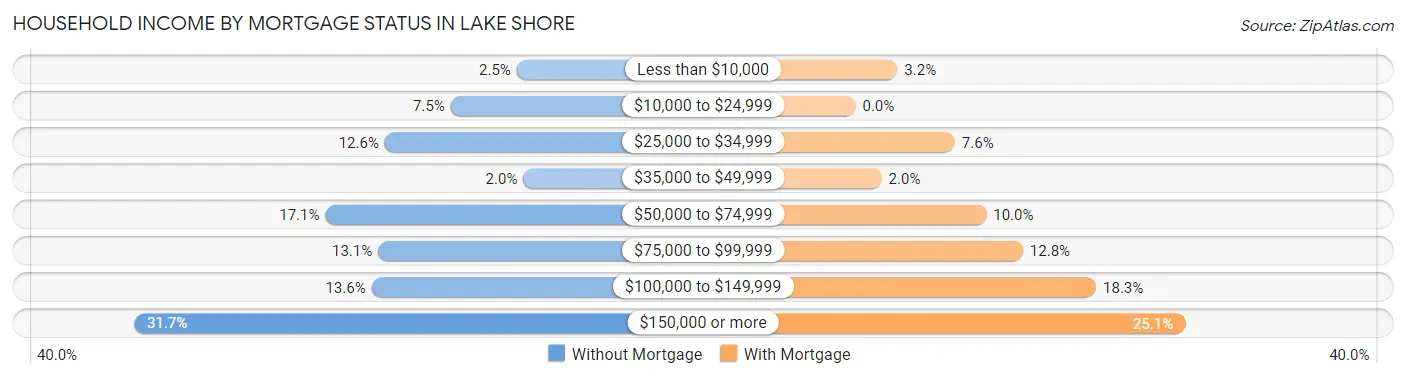
| Household Income | Without Mortgage | With Mortgage |
| Less than $10,000 | 5 (2.5%) | 8 (3.2%) |
| $10,000 to $24,999 | 15 (7.5%) | 0 (0.0%) |
| $25,000 to $34,999 | 25 (12.6%) | 19 (7.6%) |
| $35,000 to $49,999 | 4 (2.0%) | 5 (2.0%) |
| $50,000 to $74,999 | 34 (17.1%) | 25 (10.0%) |
| $75,000 to $99,999 | 26 (13.1%) | 32 (12.8%) |
| $100,000 to $149,999 | 27 (13.6%) | 46 (18.3%) |
| $150,000 or more | 63 (31.7%) | 63 (25.1%) |
| Total | 199 (100.0%) | 251 (100.0%) |
Property Value to Household Income Ratio in Lake Shore
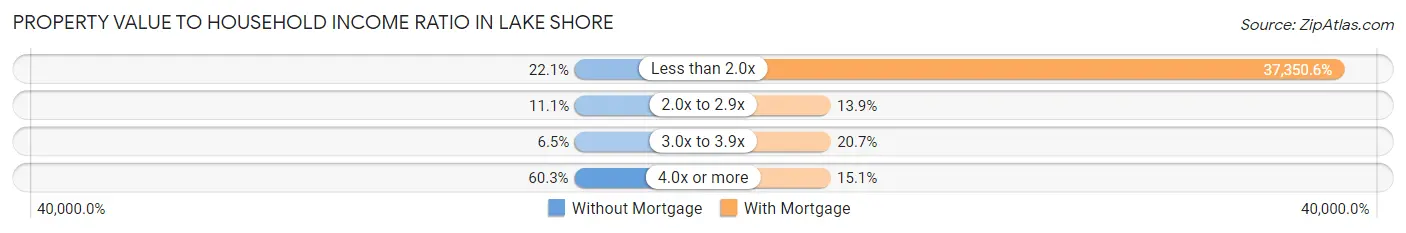
| Value-to-Income Ratio | Without Mortgage | With Mortgage |
| Less than 2.0x | 44 (22.1%) | 93,750 (37,350.6%) |
| 2.0x to 2.9x | 22 (11.1%) | 35 (13.9%) |
| 3.0x to 3.9x | 13 (6.5%) | 52 (20.7%) |
| 4.0x or more | 120 (60.3%) | 38 (15.1%) |
| Total | 199 (100.0%) | 251 (100.0%) |
Real Estate Taxes by Mortgage Status in Lake Shore
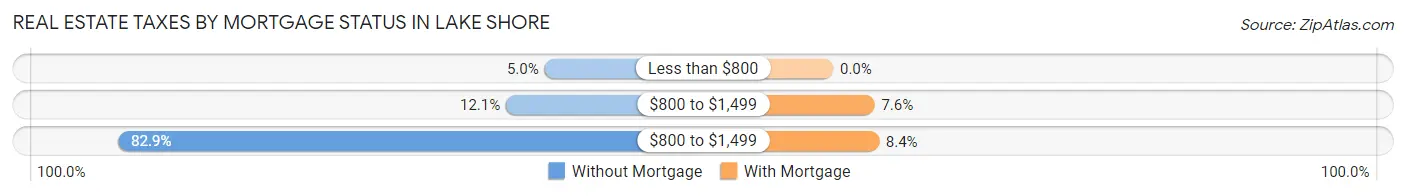
| Property Taxes | Without Mortgage | With Mortgage |
| Less than $800 | 10 (5.0%) | 0 (0.0%) |
| $800 to $1,499 | 24 (12.1%) | 19 (7.6%) |
| $800 to $1,499 | 165 (82.9%) | 21 (8.4%) |
| Total | 199 (100.0%) | 251 (100.0%) |
Health & Disability in Lake Shore
Health Insurance Coverage by Age in Lake Shore
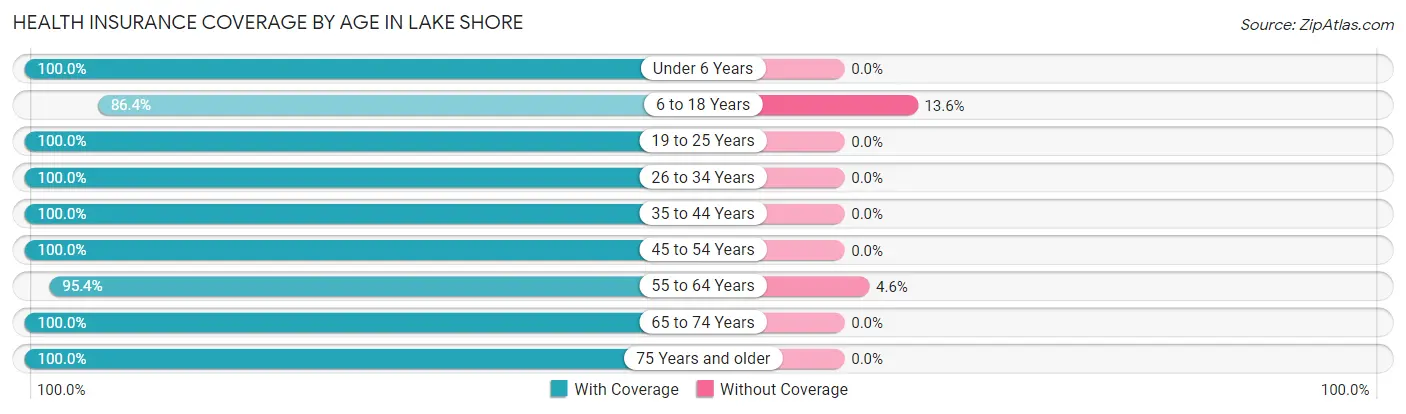
| Age Bracket | With Coverage | Without Coverage |
| Under 6 Years | 59 (100.0%) | 0 (0.0%) |
| 6 to 18 Years | 133 (86.4%) | 21 (13.6%) |
| 19 to 25 Years | 49 (100.0%) | 0 (0.0%) |
| 26 to 34 Years | 121 (100.0%) | 0 (0.0%) |
| 35 to 44 Years | 88 (100.0%) | 0 (0.0%) |
| 45 to 54 Years | 123 (100.0%) | 0 (0.0%) |
| 55 to 64 Years | 227 (95.4%) | 11 (4.6%) |
| 65 to 74 Years | 242 (100.0%) | 0 (0.0%) |
| 75 Years and older | 92 (100.0%) | 0 (0.0%) |
| Total | 1,134 (97.3%) | 32 (2.7%) |
Health Insurance Coverage by Citizenship Status in Lake Shore
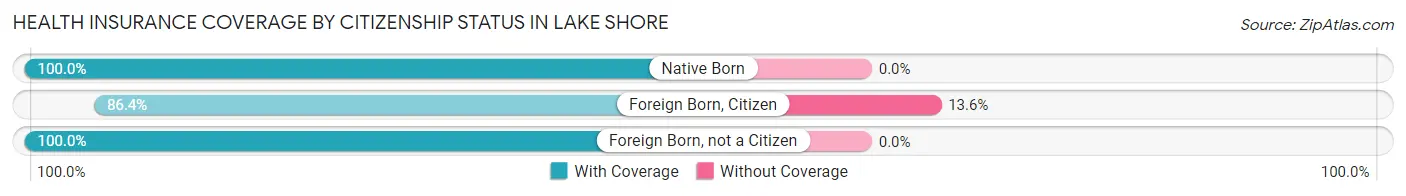
| Citizenship Status | With Coverage | Without Coverage |
| Native Born | 59 (100.0%) | 0 (0.0%) |
| Foreign Born, Citizen | 133 (86.4%) | 21 (13.6%) |
| Foreign Born, not a Citizen | 49 (100.0%) | 0 (0.0%) |
Health Insurance Coverage by Household Income in Lake Shore
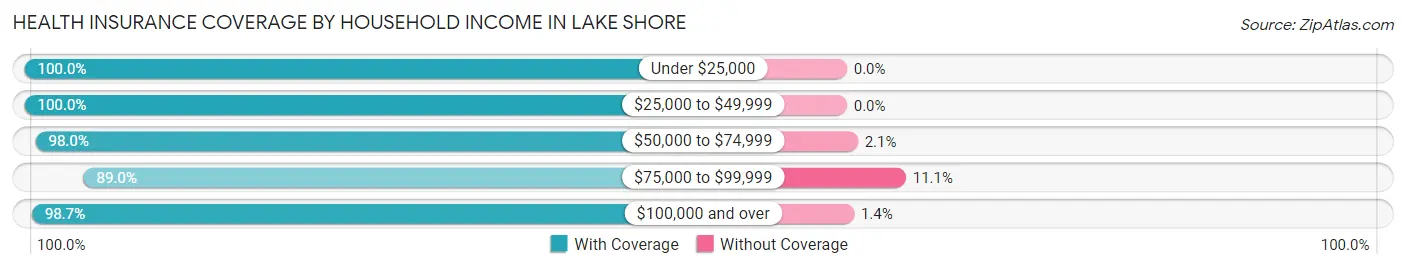
| Household Income | With Coverage | Without Coverage |
| Under $25,000 | 72 (100.0%) | 0 (0.0%) |
| $25,000 to $49,999 | 106 (100.0%) | 0 (0.0%) |
| $50,000 to $74,999 | 143 (98.0%) | 3 (2.1%) |
| $75,000 to $99,999 | 153 (88.9%) | 19 (11.1%) |
| $100,000 and over | 657 (98.7%) | 9 (1.3%) |
Public vs Private Health Insurance Coverage by Age in Lake Shore
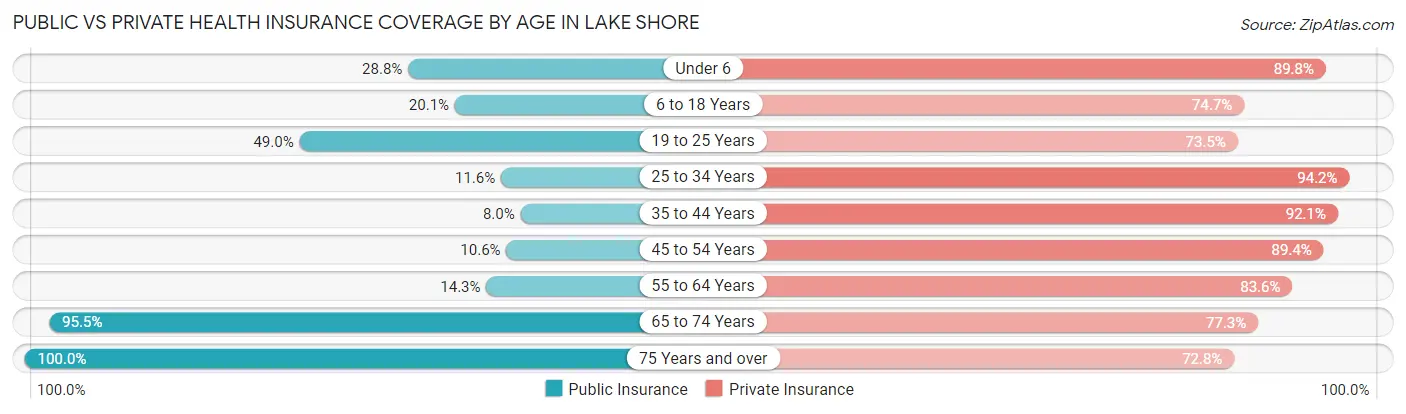
| Age Bracket | Public Insurance | Private Insurance |
| Under 6 | 17 (28.8%) | 53 (89.8%) |
| 6 to 18 Years | 31 (20.1%) | 115 (74.7%) |
| 19 to 25 Years | 24 (49.0%) | 36 (73.5%) |
| 25 to 34 Years | 14 (11.6%) | 114 (94.2%) |
| 35 to 44 Years | 7 (8.0%) | 81 (92.0%) |
| 45 to 54 Years | 13 (10.6%) | 110 (89.4%) |
| 55 to 64 Years | 34 (14.3%) | 199 (83.6%) |
| 65 to 74 Years | 231 (95.5%) | 187 (77.3%) |
| 75 Years and over | 92 (100.0%) | 67 (72.8%) |
| Total | 463 (39.7%) | 962 (82.5%) |
Disability Status by Sex by Age in Lake Shore
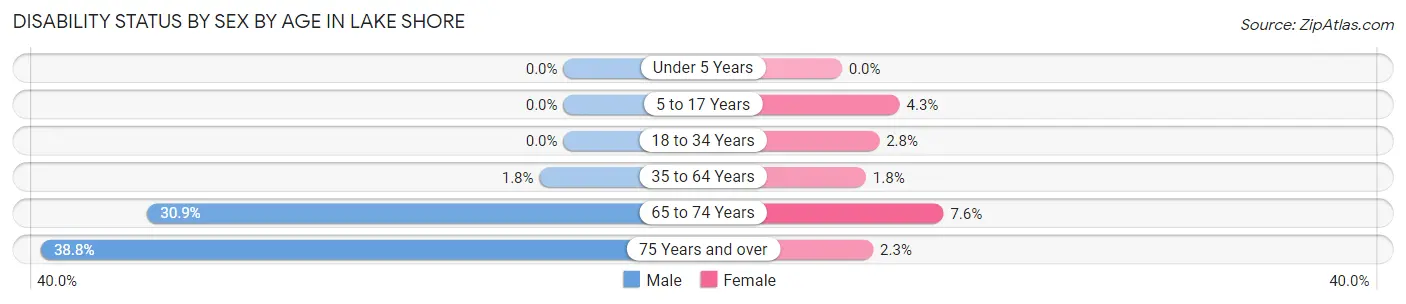
| Age Bracket | Male | Female |
| Under 5 Years | 0 (0.0%) | 0 (0.0%) |
| 5 to 17 Years | 0 (0.0%) | 3 (4.3%) |
| 18 to 34 Years | 0 (0.0%) | 3 (2.8%) |
| 35 to 64 Years | 4 (1.8%) | 4 (1.8%) |
| 65 to 74 Years | 42 (30.9%) | 8 (7.5%) |
| 75 Years and over | 19 (38.8%) | 1 (2.3%) |
Disability Class by Sex by Age in Lake Shore
Disability Class: Hearing Difficulty
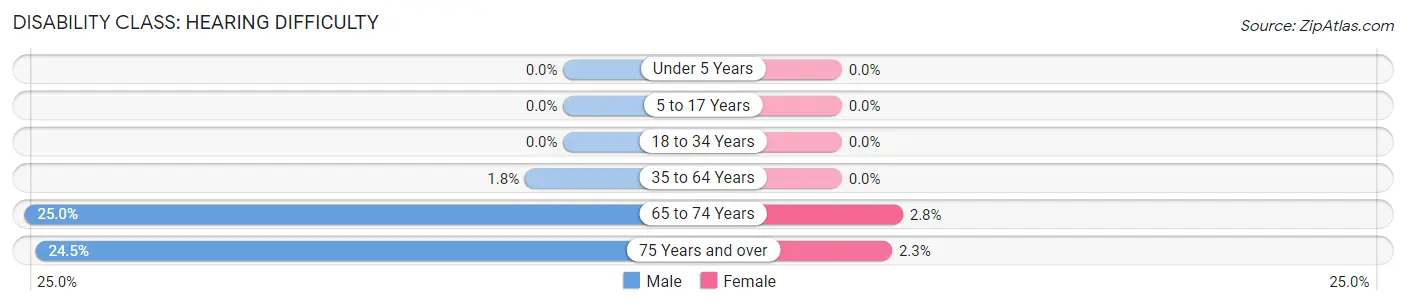
| Age Bracket | Male | Female |
| Under 5 Years | 0 (0.0%) | 0 (0.0%) |
| 5 to 17 Years | 0 (0.0%) | 0 (0.0%) |
| 18 to 34 Years | 0 (0.0%) | 0 (0.0%) |
| 35 to 64 Years | 4 (1.8%) | 0 (0.0%) |
| 65 to 74 Years | 34 (25.0%) | 3 (2.8%) |
| 75 Years and over | 12 (24.5%) | 1 (2.3%) |
Disability Class: Vision Difficulty
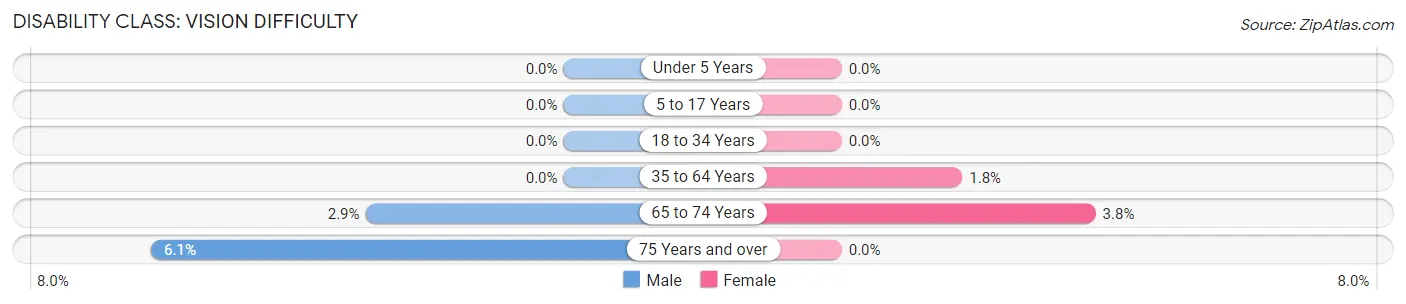
| Age Bracket | Male | Female |
| Under 5 Years | 0 (0.0%) | 0 (0.0%) |
| 5 to 17 Years | 0 (0.0%) | 0 (0.0%) |
| 18 to 34 Years | 0 (0.0%) | 0 (0.0%) |
| 35 to 64 Years | 0 (0.0%) | 4 (1.8%) |
| 65 to 74 Years | 4 (2.9%) | 4 (3.8%) |
| 75 Years and over | 3 (6.1%) | 0 (0.0%) |
Disability Class: Cognitive Difficulty
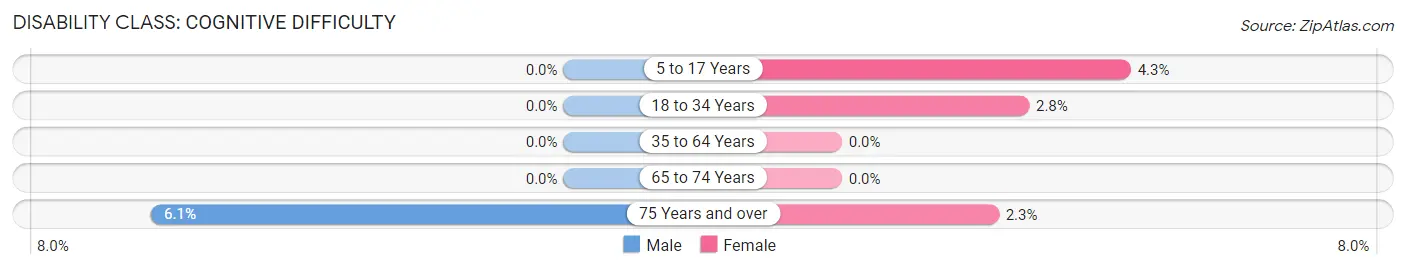
| Age Bracket | Male | Female |
| 5 to 17 Years | 0 (0.0%) | 3 (4.3%) |
| 18 to 34 Years | 0 (0.0%) | 3 (2.8%) |
| 35 to 64 Years | 0 (0.0%) | 0 (0.0%) |
| 65 to 74 Years | 0 (0.0%) | 0 (0.0%) |
| 75 Years and over | 3 (6.1%) | 1 (2.3%) |
Disability Class: Ambulatory Difficulty
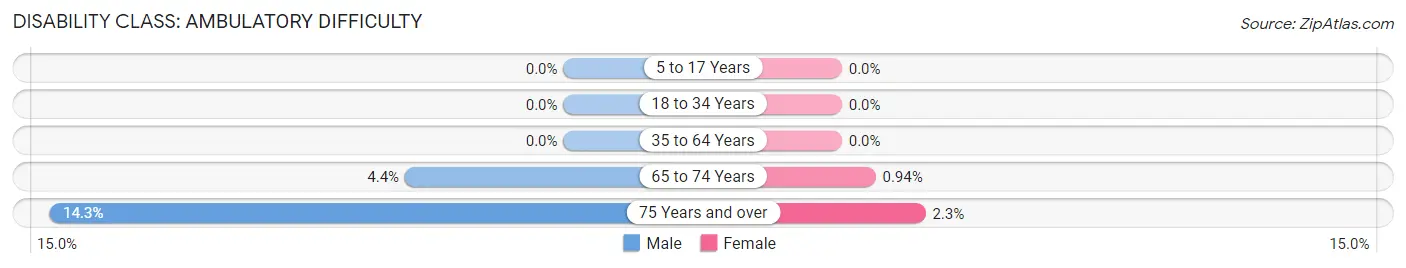
| Age Bracket | Male | Female |
| 5 to 17 Years | 0 (0.0%) | 0 (0.0%) |
| 18 to 34 Years | 0 (0.0%) | 0 (0.0%) |
| 35 to 64 Years | 0 (0.0%) | 0 (0.0%) |
| 65 to 74 Years | 6 (4.4%) | 1 (0.9%) |
| 75 Years and over | 7 (14.3%) | 1 (2.3%) |
Disability Class: Self-Care Difficulty
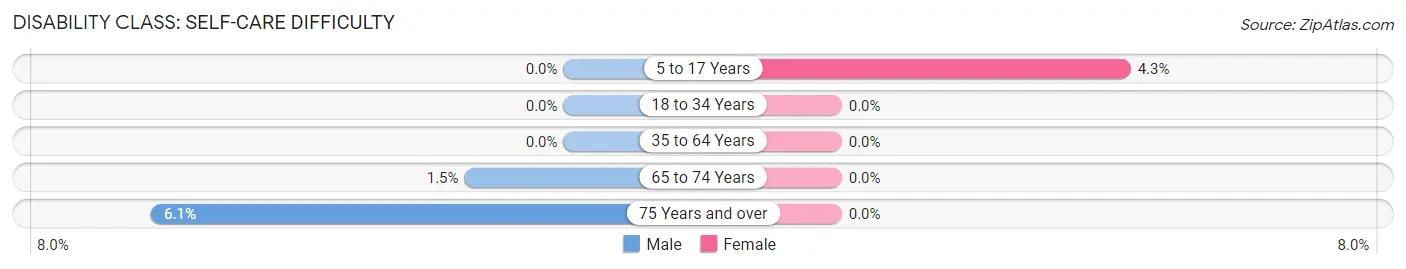
| Age Bracket | Male | Female |
| 5 to 17 Years | 0 (0.0%) | 3 (4.3%) |
| 18 to 34 Years | 0 (0.0%) | 0 (0.0%) |
| 35 to 64 Years | 0 (0.0%) | 0 (0.0%) |
| 65 to 74 Years | 2 (1.5%) | 0 (0.0%) |
| 75 Years and over | 3 (6.1%) | 0 (0.0%) |
Technology Access in Lake Shore
Computing Device Access in Lake Shore
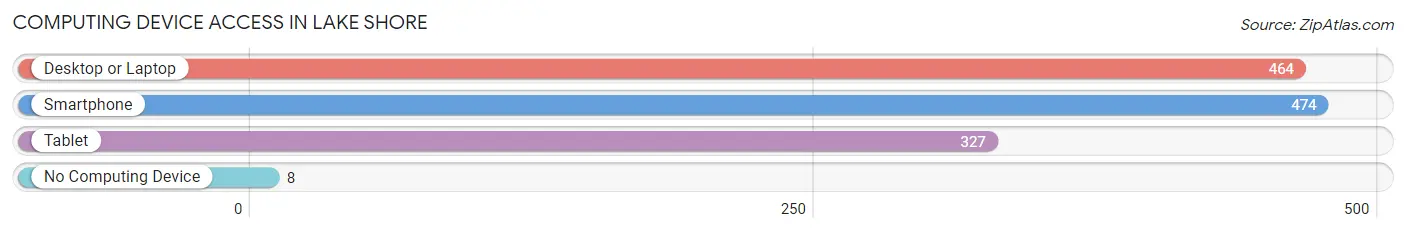
| Device Type | # Households | % Households |
| Desktop or Laptop | 464 | 90.6% |
| Smartphone | 474 | 92.6% |
| Tablet | 327 | 63.9% |
| No Computing Device | 8 | 1.6% |
| Total | 512 | 100.0% |
Internet Access in Lake Shore
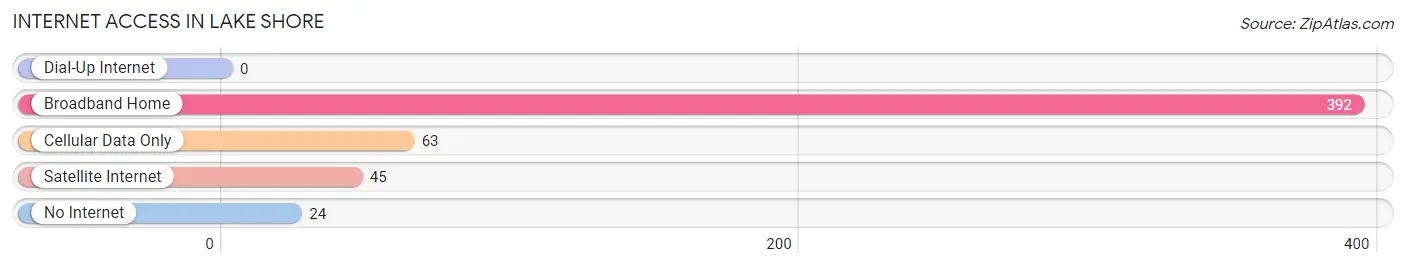
| Internet Type | # Households | % Households |
| Dial-Up Internet | 0 | 0.0% |
| Broadband Home | 392 | 76.6% |
| Cellular Data Only | 63 | 12.3% |
| Satellite Internet | 45 | 8.8% |
| No Internet | 24 | 4.7% |
| Total | 512 | 100.0% |
Lake Shore Summary
Lake Shore, Minnesota is a small city located in Cass County, Minnesota. It is situated on the south shore of Gull Lake, a popular recreational lake in the area. The city was founded in 1887 and has a population of approximately 1,500 people.
History
The area that is now Lake Shore was originally inhabited by the Ojibwe people. The first European settlers arrived in the area in the late 1800s. The first settler was a man named John B. Johnson, who arrived in 1887 and established a homestead on the south shore of Gull Lake. He named the area Lake Shore and it quickly became a popular destination for vacationers.
In the early 1900s, the area began to develop as a resort town. Hotels, restaurants, and other businesses were established to cater to the growing number of visitors. The city was officially incorporated in 1909 and the first mayor was elected in 1910.
In the 1920s, the city began to grow rapidly. The population increased from just over 500 in 1920 to over 1,000 in 1930. During this time, the city was home to several resorts, including the Gull Lake Hotel, which was built in 1924.
The city continued to grow throughout the 20th century. In the 1950s, the population reached its peak of 1,500 people. In the 1960s, the city began to decline as people moved away from the area. The population decreased to just over 1,000 by the 1970s.
Geography
Lake Shore is located in Cass County, Minnesota. It is situated on the south shore of Gull Lake, a popular recreational lake in the area. The city is surrounded by forests and lakes, making it a popular destination for outdoor activities such as fishing, boating, and camping.
The city has a total area of 1.2 square miles, all of which is land. The elevation of the city is 1,072 feet above sea level.
Economy
The economy of Lake Shore is largely based on tourism. The city is home to several resorts and hotels, as well as restaurants and other businesses that cater to visitors. The city is also home to several marinas, which provide boat rentals and other services to visitors.
In addition to tourism, the city is also home to several small businesses. These include a grocery store, a hardware store, and a gas station.
Demographics
As of the 2010 census, the population of Lake Shore was 1,500 people. The racial makeup of the city was 97.3% White, 0.7% African American, 0.3% Native American, 0.3% Asian, and 1.3% from other races.
The median household income in the city was $45,000, and the median family income was $50,000. The per capita income was $20,000. About 8.3% of the population was below the poverty line.
Conclusion
Lake Shore, Minnesota is a small city located in Cass County, Minnesota. It is situated on the south shore of Gull Lake, a popular recreational lake in the area. The city was founded in 1887 and has a population of approximately 1,500 people. The economy of the city is largely based on tourism, with several resorts and hotels, as well as restaurants and other businesses catering to visitors. The racial makeup of the city is 97.3% White, 0.7% African American, 0.3% Native American, 0.3% Asian, and 1.3% from other races. The median household income in the city was $45,000, and the median family income was $50,000.
Common Questions
What is Per Capita Income in Lake Shore?
Per Capita income in Lake Shore is $53,938.
What is the Median Family Income in Lake Shore?
Median Family Income in Lake Shore is $93,611.
What is the Median Household income in Lake Shore?
Median Household Income in Lake Shore is $100,000.
What is Income or Wage Gap in Lake Shore?
Income or Wage Gap in Lake Shore is 21.1%.
Women in Lake Shore earn 78.9 cents for every dollar earned by a man.
What is Inequality or Gini Index in Lake Shore?
Inequality or Gini Index in Lake Shore is 0.42.
What is the Total Population of Lake Shore?
Total Population of Lake Shore is 1,166.
What is the Total Male Population of Lake Shore?
Total Male Population of Lake Shore is 589.
What is the Total Female Population of Lake Shore?
Total Female Population of Lake Shore is 577.
What is the Ratio of Males per 100 Females in Lake Shore?
There are 102.08 Males per 100 Females in Lake Shore.
What is the Ratio of Females per 100 Males in Lake Shore?
There are 97.96 Females per 100 Males in Lake Shore.
What is the Median Population Age in Lake Shore?
Median Population Age in Lake Shore is 53.9 Years.
What is the Average Family Size in Lake Shore
Average Family Size in Lake Shore is 2.5 People.
What is the Average Household Size in Lake Shore
Average Household Size in Lake Shore is 2.3 People.
How Large is the Labor Force in Lake Shore?
There are 545 People in the Labor Forcein in Lake Shore.
What is the Percentage of People in the Labor Force in Lake Shore?
55.1% of People are in the Labor Force in Lake Shore.
What is the Unemployment Rate in Lake Shore?
Unemployment Rate in Lake Shore is 2.2%.