Gary, MN Map & Demographics
Gary Map
Gary Overview
$28,553
PER CAPITA INCOME
$90,156
AVG FAMILY INCOME
$73,750
AVG HOUSEHOLD INCOME
2.1%
WAGE / INCOME GAP [ % ]
97.9¢/ $1
WAGE / INCOME GAP [ $ ]
0.29
INEQUALITY / GINI INDEX
277
TOTAL POPULATION
141
MALE POPULATION
136
FEMALE POPULATION
103.68
MALES / 100 FEMALES
96.45
FEMALES / 100 MALES
30.5
MEDIAN AGE
3.1
AVG FAMILY SIZE
2.8
AVG HOUSEHOLD SIZE
152
LABOR FORCE [ PEOPLE ]
71.7%
PERCENT IN LABOR FORCE
2.0%
UNEMPLOYMENT RATE
Gary Zip Codes
Gary Area Codes
Income in Gary
Income Overview in Gary
Per Capita Income in Gary is $28,553, while median incomes of families and households are $90,156 and $73,750 respectively.
| Characteristic | Number | Measure |
| Per Capita Income | 277 | $28,553 |
| Median Family Income | 79 | $90,156 |
| Mean Family Income | 79 | $85,023 |
| Median Household Income | 99 | $73,750 |
| Mean Household Income | 99 | $78,563 |
| Income Deficit | 79 | $0 |
| Wage / Income Gap (%) | 277 | 2.10% |
| Wage / Income Gap ($) | 277 | 97.90¢ per $1 |
| Gini / Inequality Index | 277 | 0.29 |
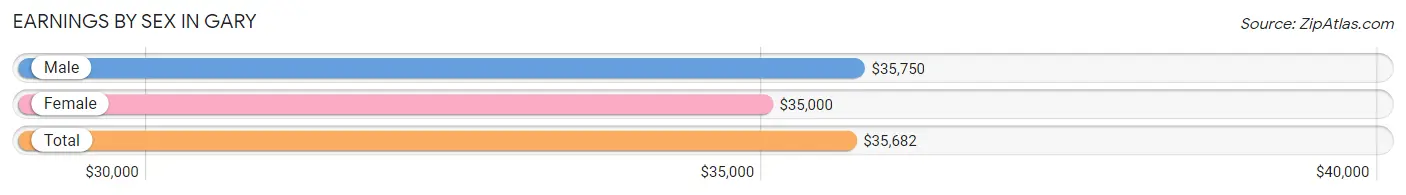
Earnings by Sex in Gary
Average Earnings in Gary are $35,682, $35,750 for men and $35,000 for women, a difference of 2.1%.
| Sex | Number | Average Earnings |
| Male | 100 (60.2%) | $35,750 |
| Female | 66 (39.8%) | $35,000 |
| Total | 166 (100.0%) | $35,682 |
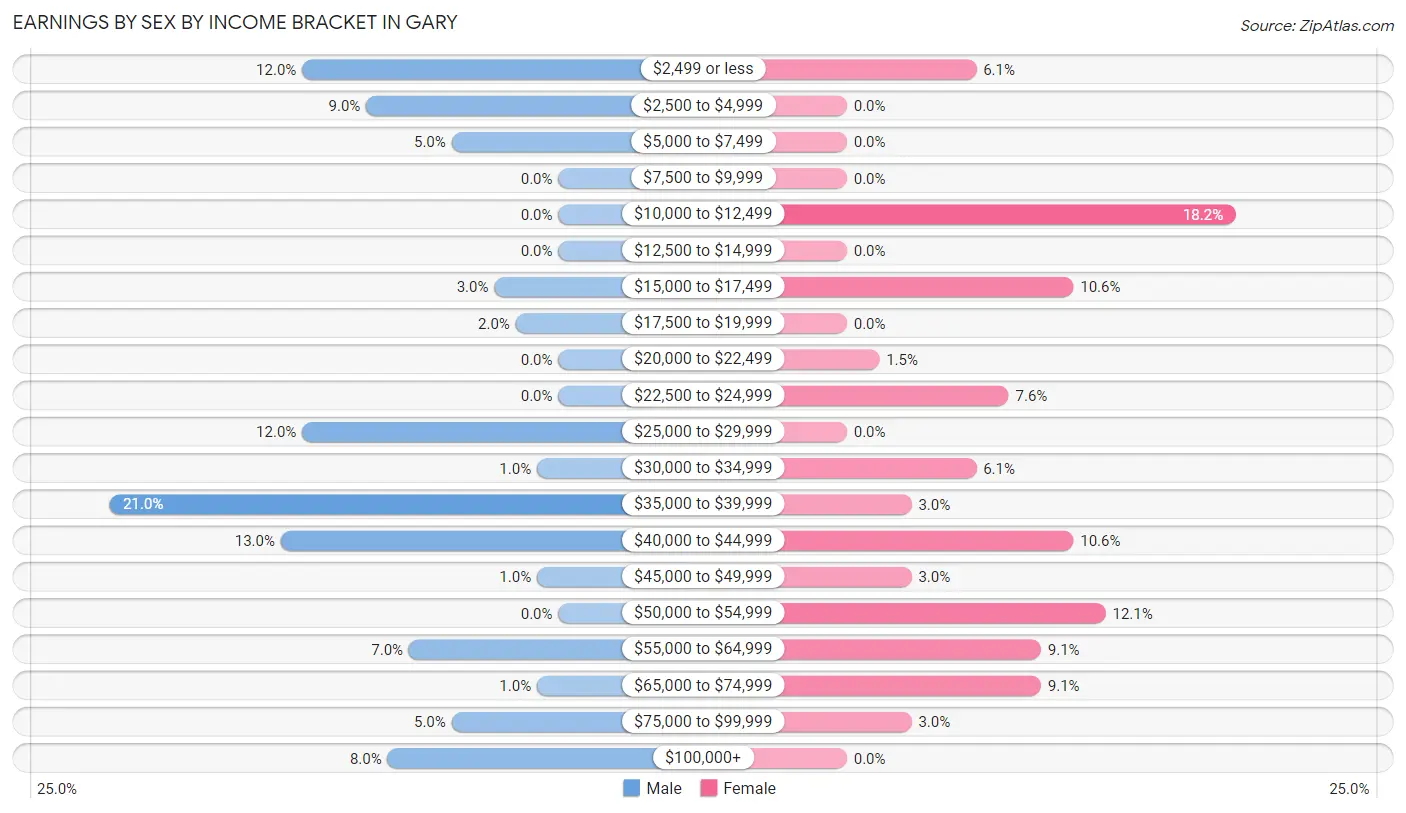
Earnings by Sex by Income Bracket in Gary
The most common earnings brackets in Gary are $35,000 to $39,999 for men (21 | 21.0%) and $10,000 to $12,499 for women (12 | 18.2%).
| Income | Male | Female |
| $2,499 or less | 12 (12.0%) | 4 (6.1%) |
| $2,500 to $4,999 | 9 (9.0%) | 0 (0.0%) |
| $5,000 to $7,499 | 5 (5.0%) | 0 (0.0%) |
| $7,500 to $9,999 | 0 (0.0%) | 0 (0.0%) |
| $10,000 to $12,499 | 0 (0.0%) | 12 (18.2%) |
| $12,500 to $14,999 | 0 (0.0%) | 0 (0.0%) |
| $15,000 to $17,499 | 3 (3.0%) | 7 (10.6%) |
| $17,500 to $19,999 | 2 (2.0%) | 0 (0.0%) |
| $20,000 to $22,499 | 0 (0.0%) | 1 (1.5%) |
| $22,500 to $24,999 | 0 (0.0%) | 5 (7.6%) |
| $25,000 to $29,999 | 12 (12.0%) | 0 (0.0%) |
| $30,000 to $34,999 | 1 (1.0%) | 4 (6.1%) |
| $35,000 to $39,999 | 21 (21.0%) | 2 (3.0%) |
| $40,000 to $44,999 | 13 (13.0%) | 7 (10.6%) |
| $45,000 to $49,999 | 1 (1.0%) | 2 (3.0%) |
| $50,000 to $54,999 | 0 (0.0%) | 8 (12.1%) |
| $55,000 to $64,999 | 7 (7.0%) | 6 (9.1%) |
| $65,000 to $74,999 | 1 (1.0%) | 6 (9.1%) |
| $75,000 to $99,999 | 5 (5.0%) | 2 (3.0%) |
| $100,000+ | 8 (8.0%) | 0 (0.0%) |
| Total | 100 (100.0%) | 66 (100.0%) |
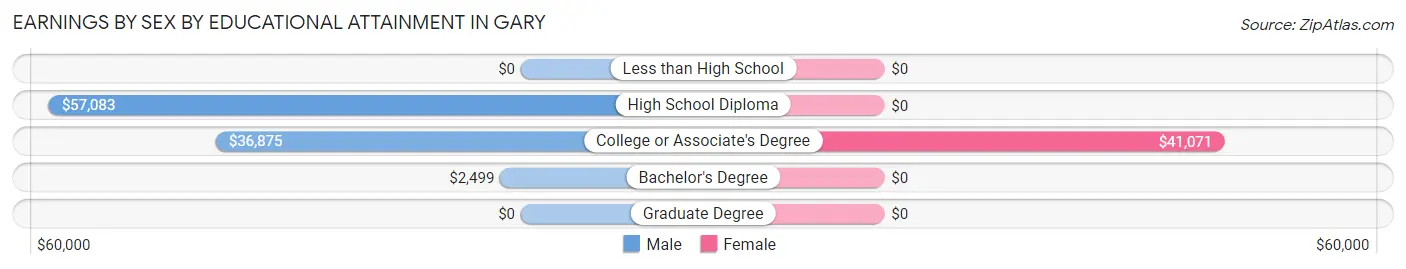
Earnings by Sex by Educational Attainment in Gary
Average earnings in Gary are $37,500 for men and $40,179 for women, a difference of 6.7%. Men with an educational attainment of high school diploma enjoy the highest average annual earnings of $57,083, while those with bachelor's degree education earn the least with $2,499. Women with an educational attainment of college or associate's degree earn the most with the average annual earnings of $41,071, while those with college or associate's degree education have the smallest earnings of $41,071.
| Educational Attainment | Male Income | Female Income |
| Less than High School | - | - |
| High School Diploma | $57,083 | $0 |
| College or Associate's Degree | $36,875 | $41,071 |
| Bachelor's Degree | $2,499 | $0 |
| Graduate Degree | - | - |
| Total | $37,500 | $40,179 |
Family Income in Gary
Family Income Brackets in Gary
According to the Gary family income data, there are 24 families falling into the $75,000 to $99,999 income range, which is the most common income bracket and makes up 30.4% of all families.
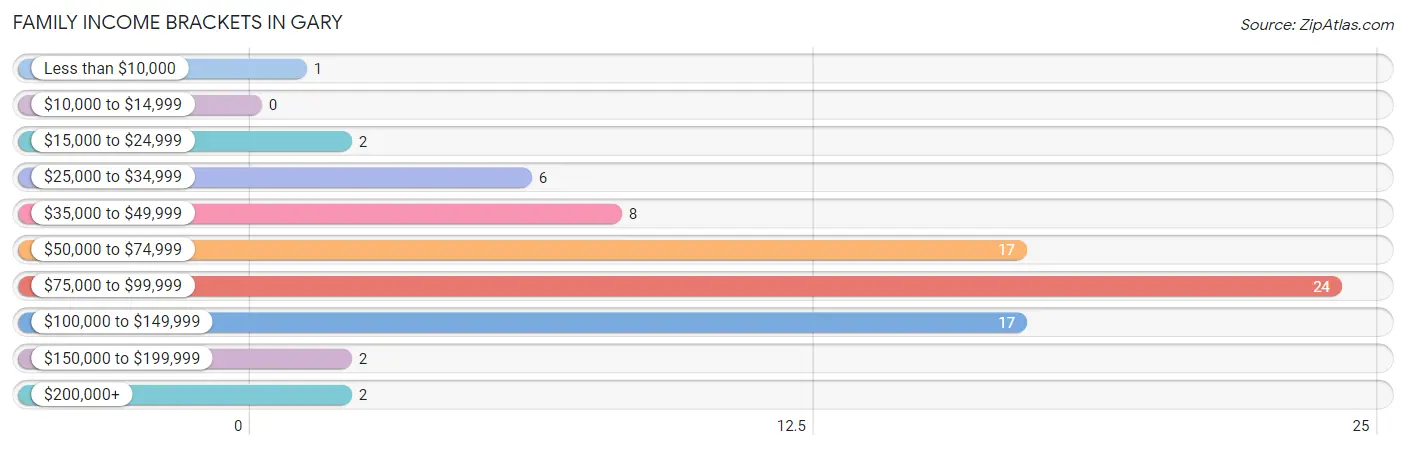
| Income Bracket | # Families | % Families |
| Less than $10,000 | 1 | 1.3% |
| $10,000 to $14,999 | 0 | 0.0% |
| $15,000 to $24,999 | 2 | 2.5% |
| $25,000 to $34,999 | 6 | 7.6% |
| $35,000 to $49,999 | 8 | 10.1% |
| $50,000 to $74,999 | 17 | 21.5% |
| $75,000 to $99,999 | 24 | 30.4% |
| $100,000 to $149,999 | 17 | 21.5% |
| $150,000 to $199,999 | 2 | 2.5% |
| $200,000+ | 2 | 2.5% |
Family Income by Famaliy Size in Gary
4-person families (8 | 10.1%) account for the highest median family income in Gary with $138,500 per family, while 2-person families (35 | 44.3%) have the highest median income of $35,312 per family member.
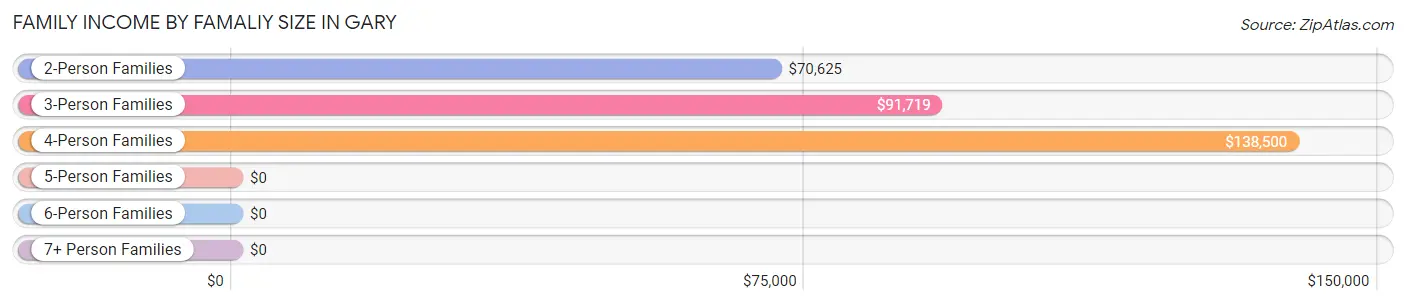
| Income Bracket | # Families | Median Income |
| 2-Person Families | 35 (44.3%) | $70,625 |
| 3-Person Families | 31 (39.2%) | $91,719 |
| 4-Person Families | 8 (10.1%) | $138,500 |
| 5-Person Families | 0 (0.0%) | $0 |
| 6-Person Families | 2 (2.5%) | $0 |
| 7+ Person Families | 3 (3.8%) | $0 |
| Total | 79 (100.0%) | $90,156 |
Family Income by Number of Earners in Gary
The median family income in Gary is $90,156, with families comprising 2 earners (40) having the highest median family income of $93,750, while families with 1 earner (10) have the lowest median family income of $31,250, accounting for 50.6% and 12.7% of families, respectively.
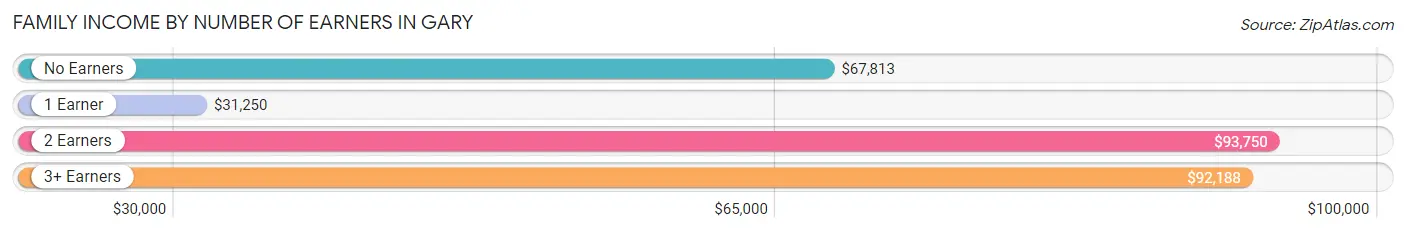
| Number of Earners | # Families | Median Income |
| No Earners | 15 (19.0%) | $67,813 |
| 1 Earner | 10 (12.7%) | $31,250 |
| 2 Earners | 40 (50.6%) | $93,750 |
| 3+ Earners | 14 (17.7%) | $92,188 |
| Total | 79 (100.0%) | $90,156 |
Household Income in Gary
Household Income Brackets in Gary
With 27 households falling in the category, the $50,000 to $74,999 income range is the most frequent in Gary, accounting for 27.3% of all households. In contrast, only 2 households (2.0%) fall into the less than $10,000 income bracket, making it the least populous group.
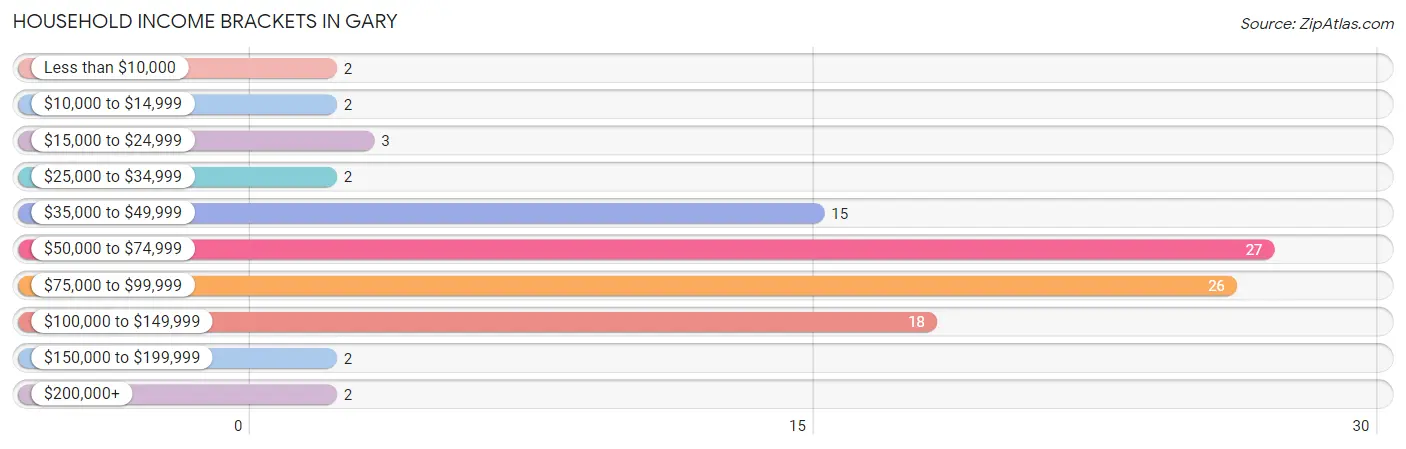
| Income Bracket | # Households | % Households |
| Less than $10,000 | 2 | 2.0% |
| $10,000 to $14,999 | 2 | 2.0% |
| $15,000 to $24,999 | 3 | 3.0% |
| $25,000 to $34,999 | 2 | 2.0% |
| $35,000 to $49,999 | 15 | 15.2% |
| $50,000 to $74,999 | 27 | 27.3% |
| $75,000 to $99,999 | 26 | 26.3% |
| $100,000 to $149,999 | 18 | 18.2% |
| $150,000 to $199,999 | 2 | 2.0% |
| $200,000+ | 2 | 2.0% |
Household Income by Householder Age in Gary
The median household income in Gary is $73,750, with the highest median household income of $96,250 found in the 45 to 64 years age bracket for the primary householder. A total of 30 households (30.3%) fall into this category. Meanwhile, the 15 to 24 years age bracket for the primary householder has the lowest median household income of $37,292, with 11 households (11.1%) in this group.
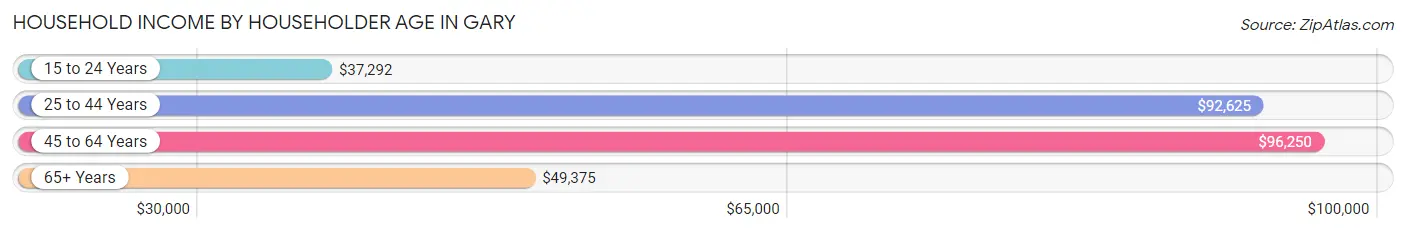
| Income Bracket | # Households | Median Income |
| 15 to 24 Years | 11 (11.1%) | $37,292 |
| 25 to 44 Years | 33 (33.3%) | $92,625 |
| 45 to 64 Years | 30 (30.3%) | $96,250 |
| 65+ Years | 25 (25.3%) | $49,375 |
| Total | 99 (100.0%) | $73,750 |
Poverty in Gary
Income Below Poverty by Sex and Age in Gary
With 2.8% poverty level for males and 6.6% for females among the residents of Gary, 65 to 74 year old males and 16 and 17 year old females are the most vulnerable to poverty, with 2 males (25.0%) and 2 females (100.0%) in their respective age groups living below the poverty level.
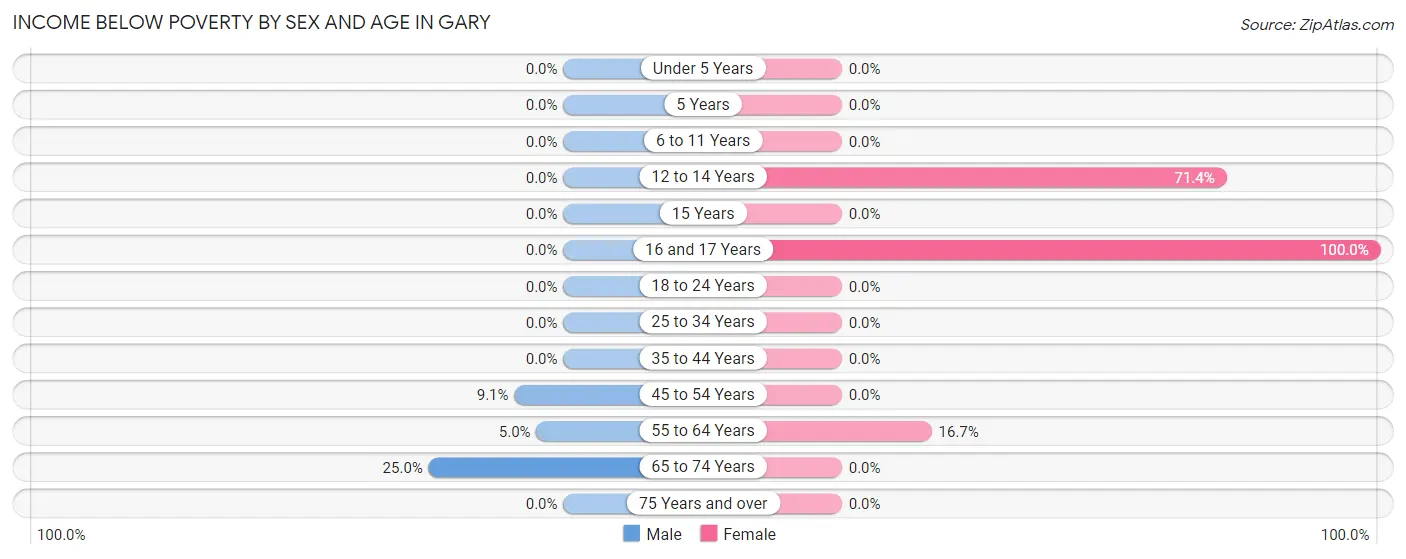
| Age Bracket | Male | Female |
| Under 5 Years | 0 (0.0%) | 0 (0.0%) |
| 5 Years | 0 (0.0%) | 0 (0.0%) |
| 6 to 11 Years | 0 (0.0%) | 0 (0.0%) |
| 12 to 14 Years | 0 (0.0%) | 5 (71.4%) |
| 15 Years | 0 (0.0%) | 0 (0.0%) |
| 16 and 17 Years | 0 (0.0%) | 2 (100.0%) |
| 18 to 24 Years | 0 (0.0%) | 0 (0.0%) |
| 25 to 34 Years | 0 (0.0%) | 0 (0.0%) |
| 35 to 44 Years | 0 (0.0%) | 0 (0.0%) |
| 45 to 54 Years | 1 (9.1%) | 0 (0.0%) |
| 55 to 64 Years | 1 (5.0%) | 2 (16.7%) |
| 65 to 74 Years | 2 (25.0%) | 0 (0.0%) |
| 75 Years and over | 0 (0.0%) | 0 (0.0%) |
| Total | 4 (2.8%) | 9 (6.6%) |
Income Above Poverty by Sex and Age in Gary
According to the poverty statistics in Gary, males aged under 5 years and females aged under 5 years are the age groups that are most secure financially, with 100.0% of males and 100.0% of females in these age groups living above the poverty line.
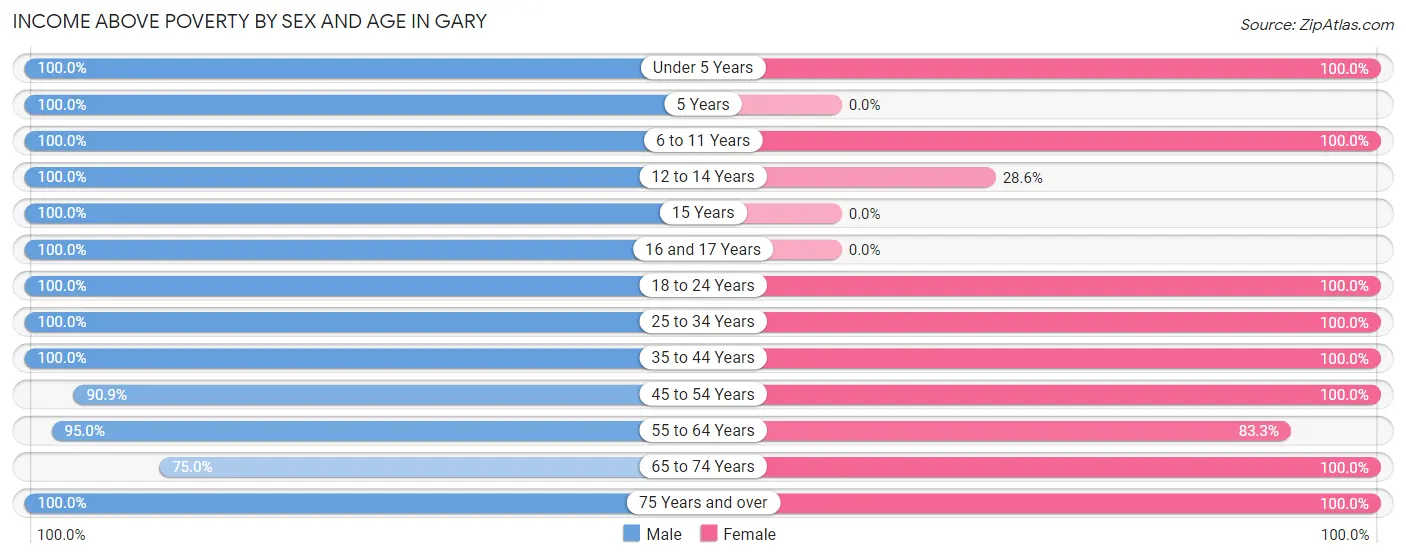
| Age Bracket | Male | Female |
| Under 5 Years | 4 (100.0%) | 13 (100.0%) |
| 5 Years | 7 (100.0%) | 0 (0.0%) |
| 6 to 11 Years | 3 (100.0%) | 22 (100.0%) |
| 12 to 14 Years | 8 (100.0%) | 2 (28.6%) |
| 15 Years | 1 (100.0%) | 0 (0.0%) |
| 16 and 17 Years | 13 (100.0%) | 0 (0.0%) |
| 18 to 24 Years | 19 (100.0%) | 9 (100.0%) |
| 25 to 34 Years | 12 (100.0%) | 24 (100.0%) |
| 35 to 44 Years | 22 (100.0%) | 7 (100.0%) |
| 45 to 54 Years | 10 (90.9%) | 19 (100.0%) |
| 55 to 64 Years | 19 (95.0%) | 10 (83.3%) |
| 65 to 74 Years | 6 (75.0%) | 9 (100.0%) |
| 75 Years and over | 13 (100.0%) | 12 (100.0%) |
| Total | 137 (97.2%) | 127 (93.4%) |
Income Below Poverty Among Married-Couple Families in Gary
The poverty statistics for married-couple families in Gary show that 1.3% or 1 of the total 74 families live below the poverty line. Families with 1 or 2 children have the highest poverty rate of 2.9%, comprising of 1 families. On the other hand, families with no children have the lowest poverty rate of 0.0%, which includes 0 families.
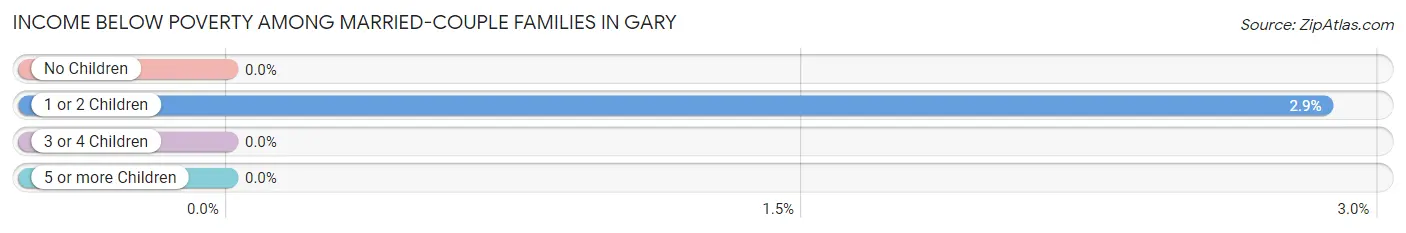
| Children | Above Poverty | Below Poverty |
| No Children | 36 (100.0%) | 0 (0.0%) |
| 1 or 2 Children | 34 (97.1%) | 1 (2.9%) |
| 3 or 4 Children | 1 (100.0%) | 0 (0.0%) |
| 5 or more Children | 2 (100.0%) | 0 (0.0%) |
| Total | 73 (98.7%) | 1 (1.3%) |
Income Below Poverty Among Single-Parent Households in Gary
| Children | Single Father | Single Mother |
| No Children | 0 (0.0%) | 0 (0.0%) |
| 1 or 2 Children | 0 (0.0%) | 0 (0.0%) |
| 3 or 4 Children | 0 (0.0%) | 0 (0.0%) |
| 5 or more Children | 0 (0.0%) | 0 (0.0%) |
| Total | 0 (0.0%) | 0 (0.0%) |
Income Below Poverty Among Married-Couple vs Single-Parent Households in Gary
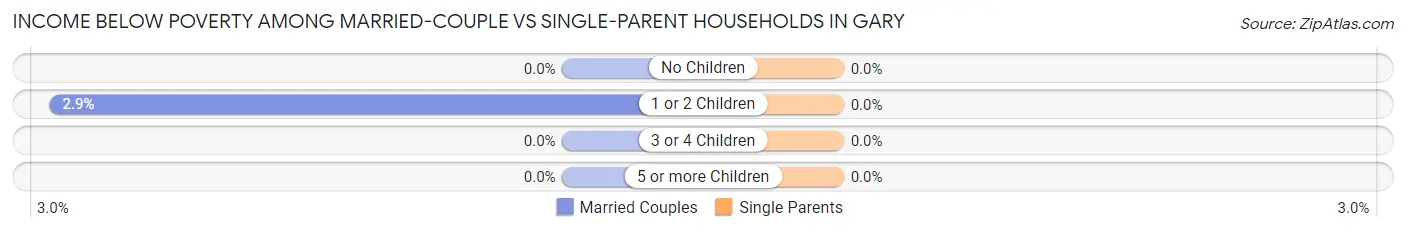
| Children | Married-Couple Families | Single-Parent Households |
| No Children | 0 (0.0%) | 0 (0.0%) |
| 1 or 2 Children | 1 (2.9%) | 0 (0.0%) |
| 3 or 4 Children | 0 (0.0%) | 0 (0.0%) |
| 5 or more Children | 0 (0.0%) | 0 (0.0%) |
| Total | 1 (1.3%) | 0 (0.0%) |
Race in Gary
The most populous races in Gary are White / Caucasian (232 | 83.8%), Hispanic or Latino (22 | 7.9%), and Black / African American (17 | 6.1%).
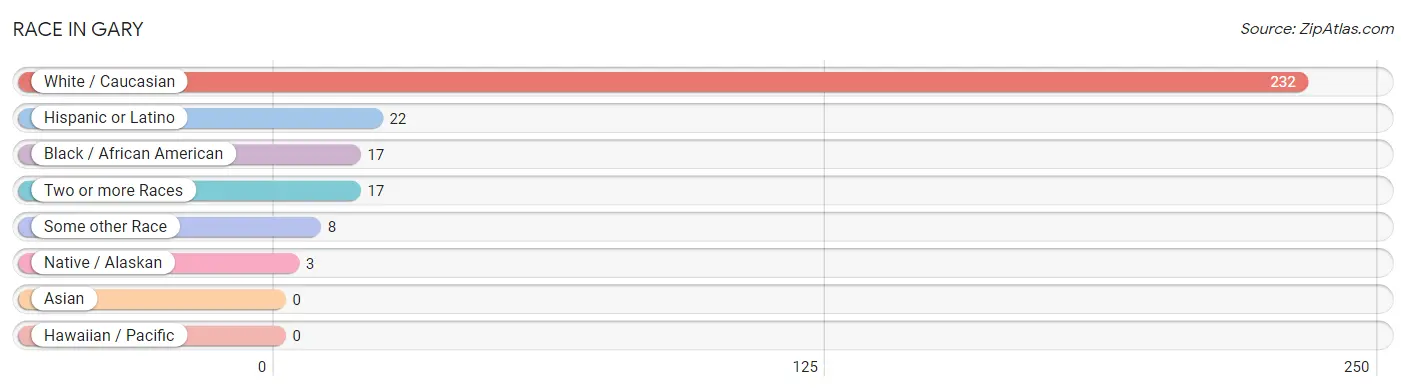
| Race | # Population | % Population |
| Asian | 0 | 0.0% |
| Black / African American | 17 | 6.1% |
| Hawaiian / Pacific | 0 | 0.0% |
| Hispanic or Latino | 22 | 7.9% |
| Native / Alaskan | 3 | 1.1% |
| White / Caucasian | 232 | 83.8% |
| Two or more Races | 17 | 6.1% |
| Some other Race | 8 | 2.9% |
| Total | 277 | 100.0% |
Ancestry in Gary
The most populous ancestries reported in Gary are Norwegian (122 | 44.0%), German (70 | 25.3%), Mexican (22 | 7.9%), French (15 | 5.4%), and Irish (14 | 5.1%), together accounting for 87.7% of all Gary residents.
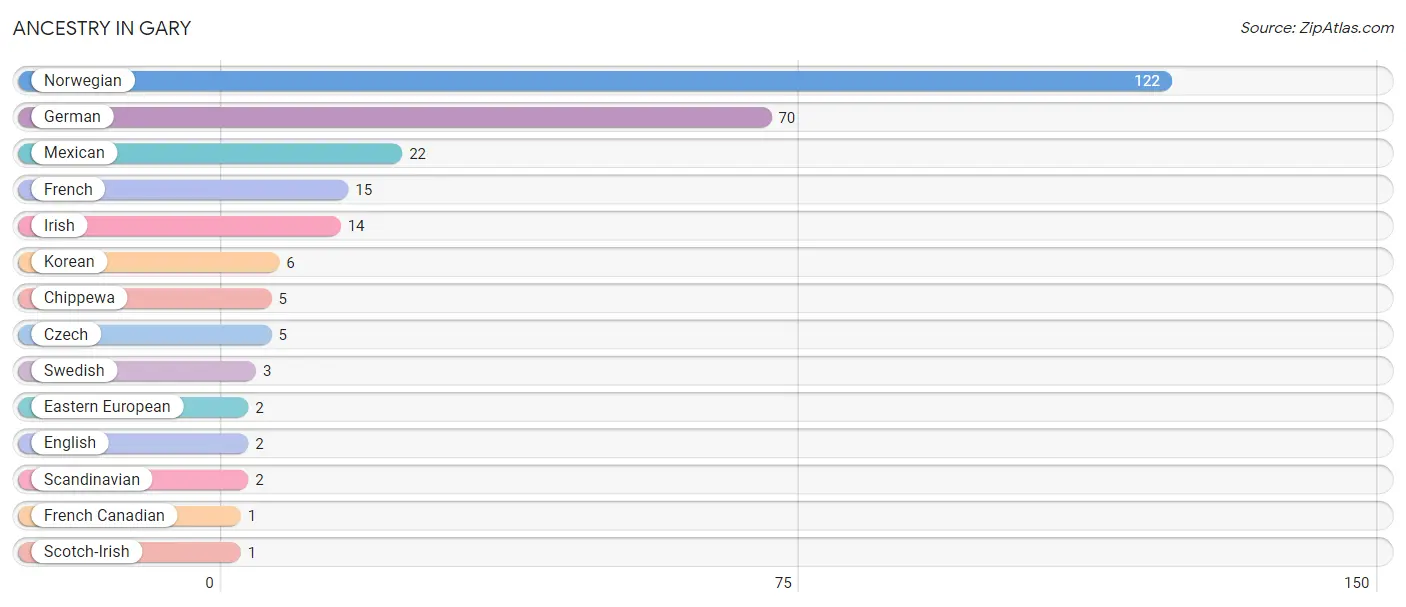
| Ancestry | # Population | % Population |
| Chippewa | 5 | 1.8% |
| Czech | 5 | 1.8% |
| Eastern European | 2 | 0.7% |
| English | 2 | 0.7% |
| French | 15 | 5.4% |
| French Canadian | 1 | 0.4% |
| German | 70 | 25.3% |
| Irish | 14 | 5.1% |
| Korean | 6 | 2.2% |
| Mexican | 22 | 7.9% |
| Norwegian | 122 | 44.0% |
| Scandinavian | 2 | 0.7% |
| Scotch-Irish | 1 | 0.4% |
| Swedish | 3 | 1.1% | View All 14 Rows |
Immigrants in Gary
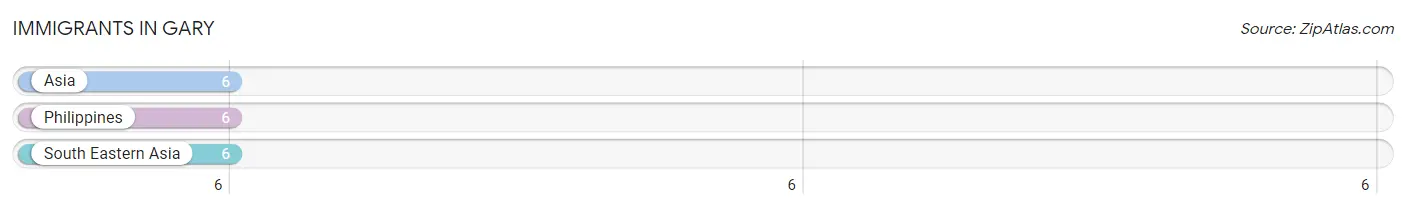
The most numerous immigrant groups reported in Gary came from Asia (6 | 2.2%), Philippines (6 | 2.2%), and South Eastern Asia (6 | 2.2%), together accounting for 6.5% of all Gary residents.
| Immigration Origin | # Population | % Population |
| Asia | 6 | 2.2% |
| Philippines | 6 | 2.2% |
| South Eastern Asia | 6 | 2.2% | View All 3 Rows |
Sex and Age in Gary
Sex and Age in Gary
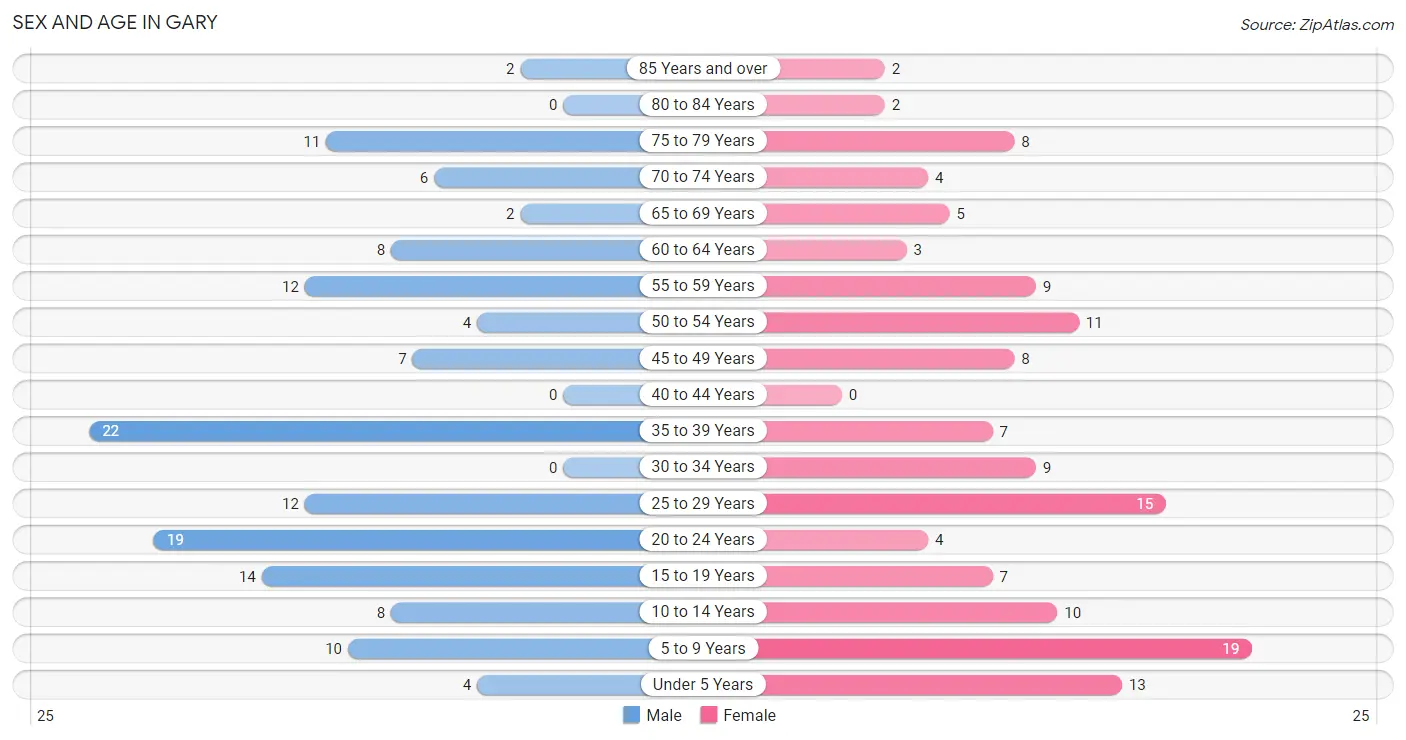
The most populous age groups in Gary are 35 to 39 Years (22 | 15.6%) for men and 5 to 9 Years (19 | 14.0%) for women.
| Age Bracket | Male | Female |
| Under 5 Years | 4 (2.8%) | 13 (9.6%) |
| 5 to 9 Years | 10 (7.1%) | 19 (14.0%) |
| 10 to 14 Years | 8 (5.7%) | 10 (7.3%) |
| 15 to 19 Years | 14 (9.9%) | 7 (5.1%) |
| 20 to 24 Years | 19 (13.5%) | 4 (2.9%) |
| 25 to 29 Years | 12 (8.5%) | 15 (11.0%) |
| 30 to 34 Years | 0 (0.0%) | 9 (6.6%) |
| 35 to 39 Years | 22 (15.6%) | 7 (5.1%) |
| 40 to 44 Years | 0 (0.0%) | 0 (0.0%) |
| 45 to 49 Years | 7 (5.0%) | 8 (5.9%) |
| 50 to 54 Years | 4 (2.8%) | 11 (8.1%) |
| 55 to 59 Years | 12 (8.5%) | 9 (6.6%) |
| 60 to 64 Years | 8 (5.7%) | 3 (2.2%) |
| 65 to 69 Years | 2 (1.4%) | 5 (3.7%) |
| 70 to 74 Years | 6 (4.3%) | 4 (2.9%) |
| 75 to 79 Years | 11 (7.8%) | 8 (5.9%) |
| 80 to 84 Years | 0 (0.0%) | 2 (1.5%) |
| 85 Years and over | 2 (1.4%) | 2 (1.5%) |
| Total | 141 (100.0%) | 136 (100.0%) |
Families and Households in Gary
Median Family Size in Gary
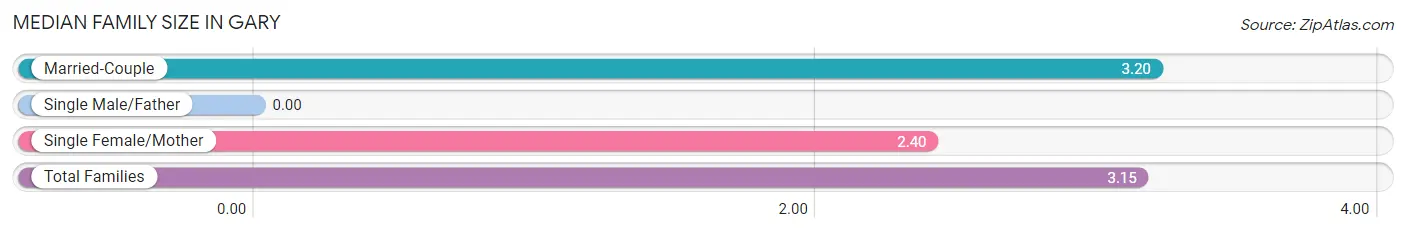
| Family Type | # Families | Family Size |
| Married-Couple | 74 (93.7%) | 3.20 |
| Single Male/Father | 0 (0.0%) | - |
| Single Female/Mother | 5 (6.3%) | 2.40 |
| Total Families | 79 (100.0%) | 3.15 |
Median Household Size in Gary
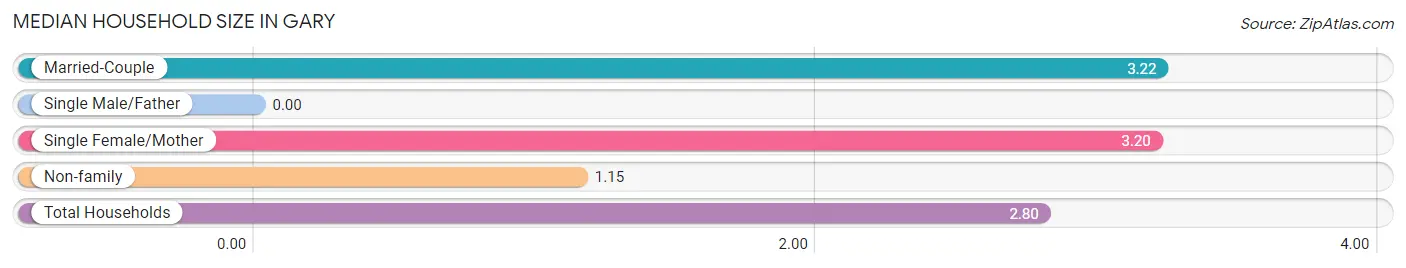
| Household Type | # Households | Household Size |
| Married-Couple | 74 (74.8%) | 3.22 |
| Single Male/Father | 0 (0.0%) | - |
| Single Female/Mother | 5 (5.1%) | 3.20 |
| Non-family | 20 (20.2%) | 1.15 |
| Total Households | 99 (100.0%) | 2.80 |
Household Size by Marriage Status in Gary
Out of a total of 99 households in Gary, 79 (79.8%) are family households, while 20 (20.2%) are nonfamily households. The most numerous type of family households are 2-person households, comprising 35, and the most common type of nonfamily households are 1-person households, comprising 17.
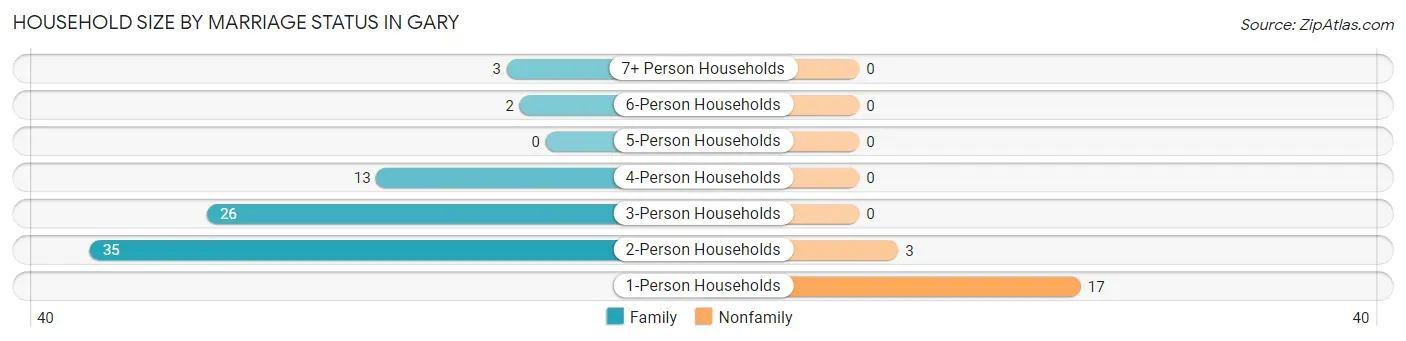
| Household Size | Family Households | Nonfamily Households |
| 1-Person Households | - | 17 (17.2%) |
| 2-Person Households | 35 (35.3%) | 3 (3.0%) |
| 3-Person Households | 26 (26.3%) | 0 (0.0%) |
| 4-Person Households | 13 (13.1%) | 0 (0.0%) |
| 5-Person Households | 0 (0.0%) | 0 (0.0%) |
| 6-Person Households | 2 (2.0%) | 0 (0.0%) |
| 7+ Person Households | 3 (3.0%) | 0 (0.0%) |
| Total | 79 (79.8%) | 20 (20.2%) |
Female Fertility in Gary
Fertility by Age in Gary
| Age Bracket | Women with Births | Births / 1,000 Women |
| 15 to 19 years | 0 (0.0%) | 0.0 |
| 20 to 34 years | 0 (0.0%) | 0.0 |
| 35 to 50 years | 0 (0.0%) | 0.0 |
| Total | 0 (0.0%) | 0.0 |
Fertility by Age by Marriage Status in Gary
| Age Bracket | Married | Unmarried |
| 15 to 19 years | 0 (0.0%) | 0 (0.0%) |
| 20 to 34 years | 0 (0.0%) | 0 (0.0%) |
| 35 to 50 years | 0 (0.0%) | 0 (0.0%) |
| Total | 0 (0.0%) | 0 (0.0%) |
Fertility by Education in Gary
| Educational Attainment | Women with Births | Births / 1,000 Women |
| Less than High School | 0 (0.0%) | 0.0 |
| High School Diploma | 0 (0.0%) | 0.0 |
| College or Associate's Degree | 0 (0.0%) | 0.0 |
| Bachelor's Degree | 0 (0.0%) | 0.0 |
| Graduate Degree | 0 (0.0%) | 0.0 |
| Total | 0 (0.0%) | 0.0 |
Fertility by Education by Marriage Status in Gary
| Educational Attainment | Married | Unmarried |
| Less than High School | 0 (0.0%) | 0 (0.0%) |
| High School Diploma | 0 (0.0%) | 0 (0.0%) |
| College or Associate's Degree | 0 (0.0%) | 0 (0.0%) |
| Bachelor's Degree | 0 (0.0%) | 0 (0.0%) |
| Graduate Degree | 0 (0.0%) | 0 (0.0%) |
| Total | 0 (0.0%) | 0 (0.0%) |
Employment Characteristics in Gary
Employment by Class of Employer in Gary
Among the 147 employed individuals in Gary, private company employees (76 | 51.7%), local government employees (18 | 12.2%), and self-employed (incorporated) (17 | 11.6%) make up the most common classes of employment.
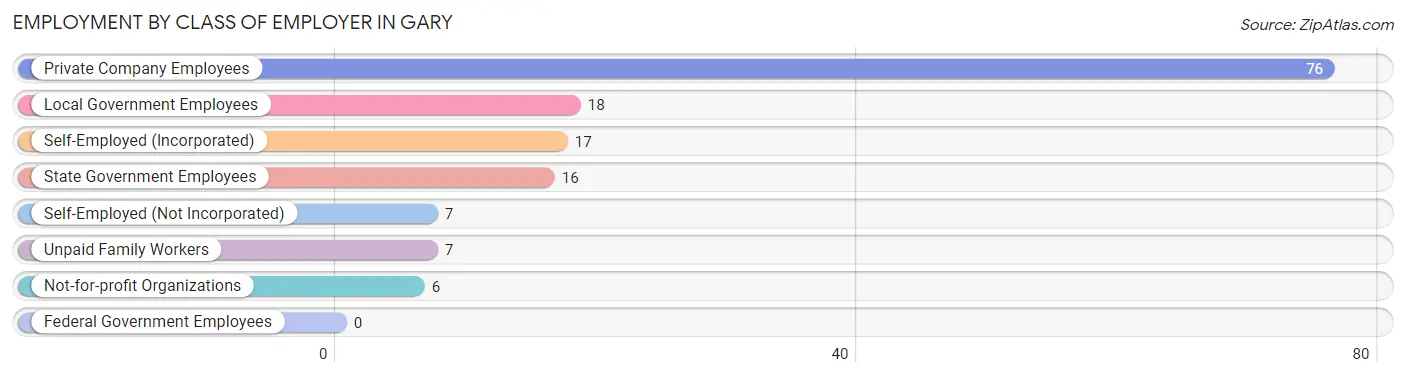
| Employer Class | # Employees | % Employees |
| Private Company Employees | 76 | 51.7% |
| Self-Employed (Incorporated) | 17 | 11.6% |
| Self-Employed (Not Incorporated) | 7 | 4.8% |
| Not-for-profit Organizations | 6 | 4.1% |
| Local Government Employees | 18 | 12.2% |
| State Government Employees | 16 | 10.9% |
| Federal Government Employees | 0 | 0.0% |
| Unpaid Family Workers | 7 | 4.8% |
| Total | 147 | 100.0% |
Employment Status by Age in Gary
According to the labor force statistics for Gary, out of the total population over 16 years of age (212), 71.7% or 152 individuals are in the labor force, with 2.0% or 3 of them unemployed. The age group with the highest labor force participation rate is 20 to 24 years, with 100.0% or 23 individuals in the labor force. Within the labor force, the 55 to 59 years age range has the highest percentage of unemployed individuals, with 5.3% or 1 of them being unemployed.
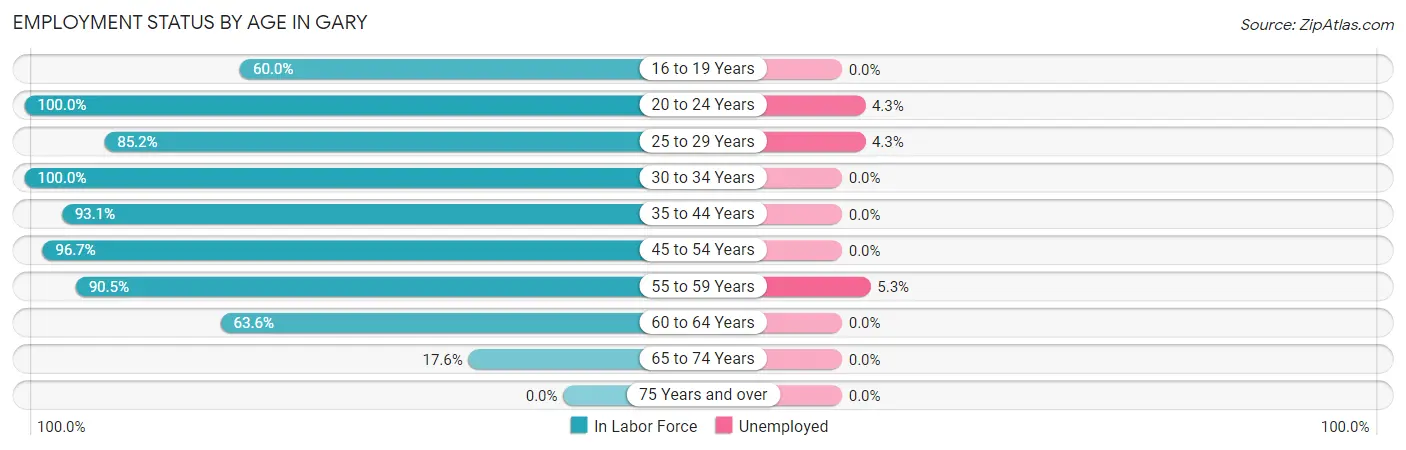
| Age Bracket | In Labor Force | Unemployed |
| 16 to 19 Years | 12 (60.0%) | 0 (0.0%) |
| 20 to 24 Years | 23 (100.0%) | 1 (4.3%) |
| 25 to 29 Years | 23 (85.2%) | 1 (4.3%) |
| 30 to 34 Years | 9 (100.0%) | 0 (0.0%) |
| 35 to 44 Years | 27 (93.1%) | 0 (0.0%) |
| 45 to 54 Years | 29 (96.7%) | 0 (0.0%) |
| 55 to 59 Years | 19 (90.5%) | 1 (5.3%) |
| 60 to 64 Years | 7 (63.6%) | 0 (0.0%) |
| 65 to 74 Years | 3 (17.6%) | 0 (0.0%) |
| 75 Years and over | 0 (0.0%) | 0 (0.0%) |
| Total | 152 (71.7%) | 3 (2.0%) |
Employment Status by Educational Attainment in Gary
According to labor force statistics for Gary, 89.8% of individuals (114) out of the total population between 25 and 64 years of age (127) are in the labor force, with 1.8% or 2 of them being unemployed. The group with the highest labor force participation rate are those with the educational attainment of high school diploma, with 96.1% or 49 individuals in the labor force. Within the labor force, individuals with less than high school education have the highest percentage of unemployment, with 16.7% or 1 of them being unemployed.
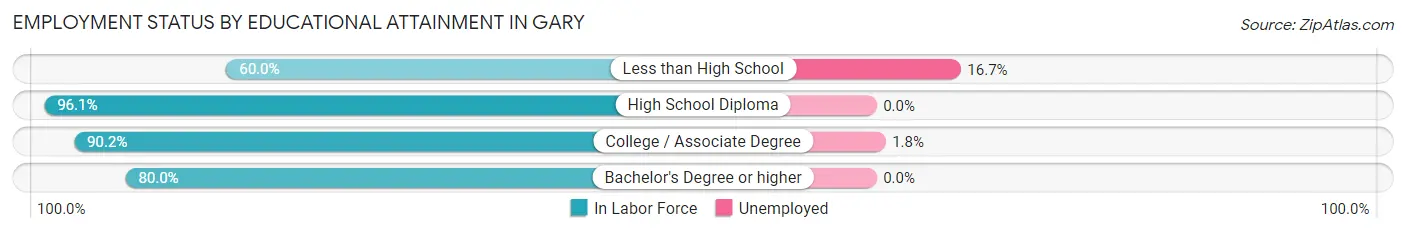
| Educational Attainment | In Labor Force | Unemployed |
| Less than High School | 6 (60.0%) | 2 (16.7%) |
| High School Diploma | 49 (96.1%) | 0 (0.0%) |
| College / Associate Degree | 55 (90.2%) | 1 (1.8%) |
| Bachelor's Degree or higher | 4 (80.0%) | 0 (0.0%) |
| Total | 114 (89.8%) | 2 (1.8%) |
Employment Occupations by Sex in Gary
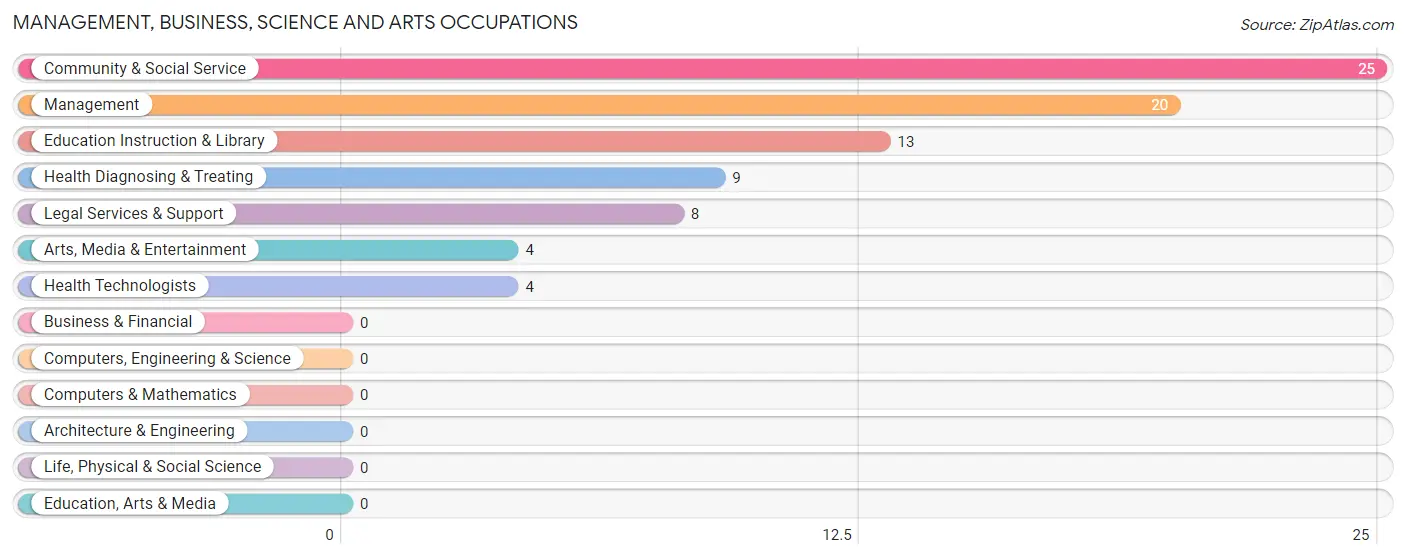
Management, Business, Science and Arts Occupations
The most common Management, Business, Science and Arts occupations in Gary are Community & Social Service (25 | 16.8%), Management (20 | 13.4%), Education Instruction & Library (13 | 8.7%), Health Diagnosing & Treating (9 | 6.0%), and Legal Services & Support (8 | 5.4%).
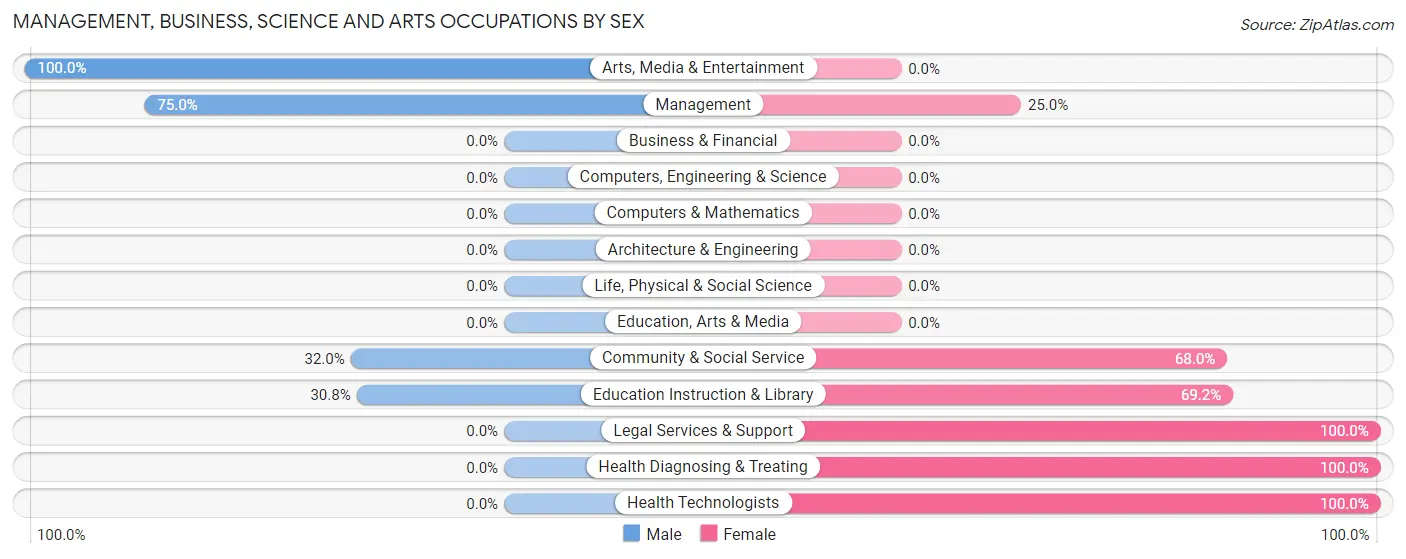
Management, Business, Science and Arts Occupations by Sex
Within the Management, Business, Science and Arts occupations in Gary, the most male-oriented occupations are Arts, Media & Entertainment (100.0%), Management (75.0%), and Community & Social Service (32.0%), while the most female-oriented occupations are Legal Services & Support (100.0%), Health Diagnosing & Treating (100.0%), and Health Technologists (100.0%).
| Occupation | Male | Female |
| Management | 15 (75.0%) | 5 (25.0%) |
| Business & Financial | 0 (0.0%) | 0 (0.0%) |
| Computers, Engineering & Science | 0 (0.0%) | 0 (0.0%) |
| Computers & Mathematics | 0 (0.0%) | 0 (0.0%) |
| Architecture & Engineering | 0 (0.0%) | 0 (0.0%) |
| Life, Physical & Social Science | 0 (0.0%) | 0 (0.0%) |
| Community & Social Service | 8 (32.0%) | 17 (68.0%) |
| Education, Arts & Media | 0 (0.0%) | 0 (0.0%) |
| Legal Services & Support | 0 (0.0%) | 8 (100.0%) |
| Education Instruction & Library | 4 (30.8%) | 9 (69.2%) |
| Arts, Media & Entertainment | 4 (100.0%) | 0 (0.0%) |
| Health Diagnosing & Treating | 0 (0.0%) | 9 (100.0%) |
| Health Technologists | 0 (0.0%) | 4 (100.0%) |
| Total (Category) | 23 (42.6%) | 31 (57.4%) |
| Total (Overall) | 86 (57.7%) | 63 (42.3%) |
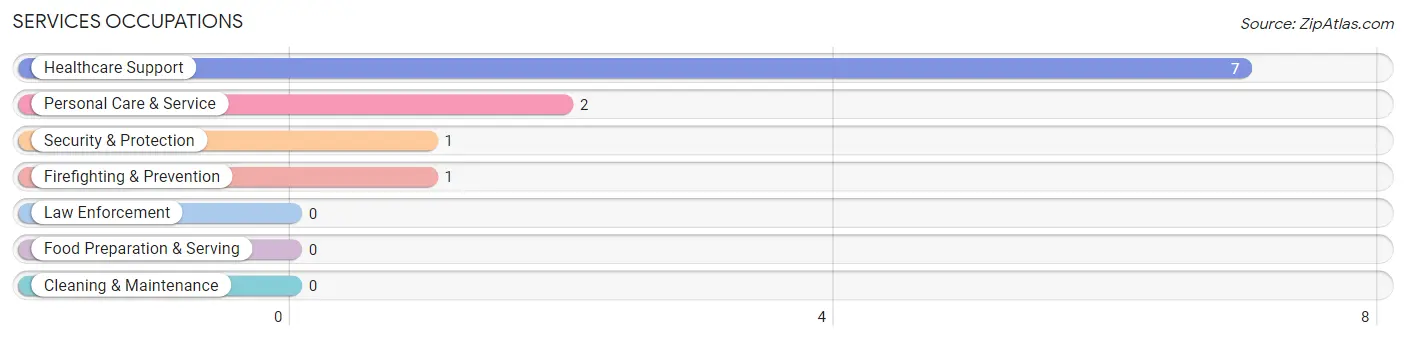
Services Occupations
The most common Services occupations in Gary are Healthcare Support (7 | 4.7%), Personal Care & Service (2 | 1.3%), Security & Protection (1 | 0.7%), and Firefighting & Prevention (1 | 0.7%).
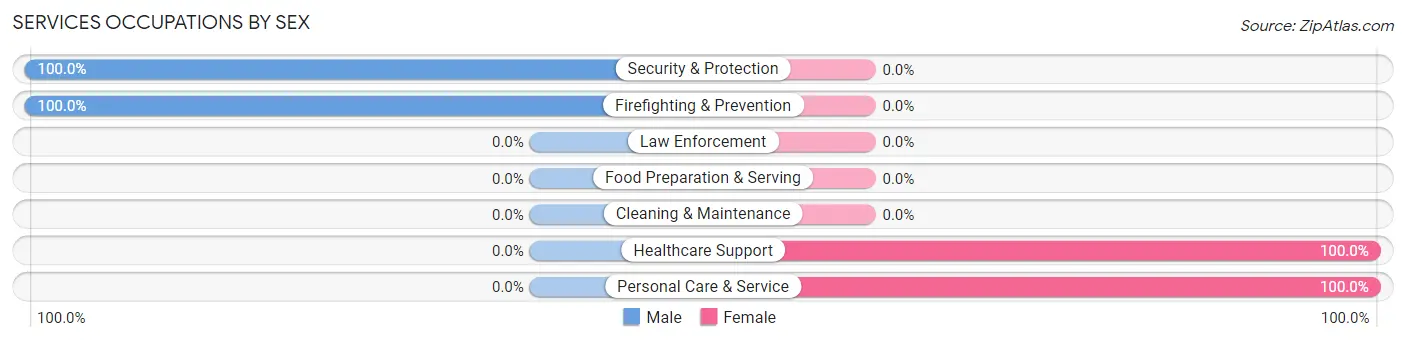
Services Occupations by Sex
Within the Services occupations in Gary, the most male-oriented occupations are Security & Protection (100.0%), and Firefighting & Prevention (100.0%), while the most female-oriented occupations are Healthcare Support (100.0%), and Personal Care & Service (100.0%).
| Occupation | Male | Female |
| Healthcare Support | 0 (0.0%) | 7 (100.0%) |
| Security & Protection | 1 (100.0%) | 0 (0.0%) |
| Firefighting & Prevention | 1 (100.0%) | 0 (0.0%) |
| Law Enforcement | 0 (0.0%) | 0 (0.0%) |
| Food Preparation & Serving | 0 (0.0%) | 0 (0.0%) |
| Cleaning & Maintenance | 0 (0.0%) | 0 (0.0%) |
| Personal Care & Service | 0 (0.0%) | 2 (100.0%) |
| Total (Category) | 1 (10.0%) | 9 (90.0%) |
| Total (Overall) | 86 (57.7%) | 63 (42.3%) |
Sales and Office Occupations
The most common Sales and Office occupations in Gary are Office & Administration (21 | 14.1%), and Sales & Related (5 | 3.4%).

Sales and Office Occupations by Sex

| Occupation | Male | Female |
| Sales & Related | 3 (60.0%) | 2 (40.0%) |
| Office & Administration | 0 (0.0%) | 21 (100.0%) |
| Total (Category) | 3 (11.5%) | 23 (88.5%) |
| Total (Overall) | 86 (57.7%) | 63 (42.3%) |
Natural Resources, Construction and Maintenance Occupations
The most common Natural Resources, Construction and Maintenance occupations in Gary are Construction & Extraction (26 | 17.4%), and Farming, Fishing & Forestry (16 | 10.7%).
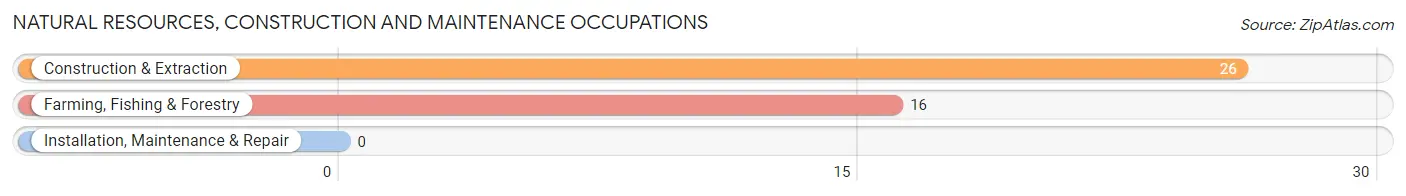
Natural Resources, Construction and Maintenance Occupations by Sex
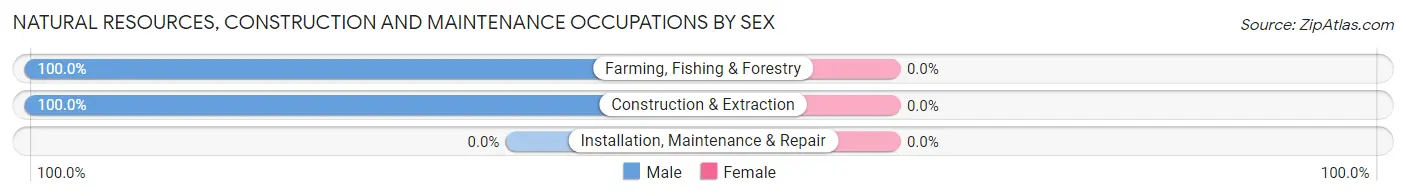
| Occupation | Male | Female |
| Farming, Fishing & Forestry | 16 (100.0%) | 0 (0.0%) |
| Construction & Extraction | 26 (100.0%) | 0 (0.0%) |
| Installation, Maintenance & Repair | 0 (0.0%) | 0 (0.0%) |
| Total (Category) | 42 (100.0%) | 0 (0.0%) |
| Total (Overall) | 86 (57.7%) | 63 (42.3%) |
Production, Transportation and Moving Occupations
The most common Production, Transportation and Moving occupations in Gary are Production (7 | 4.7%), Material Moving (7 | 4.7%), and Transportation (3 | 2.0%).
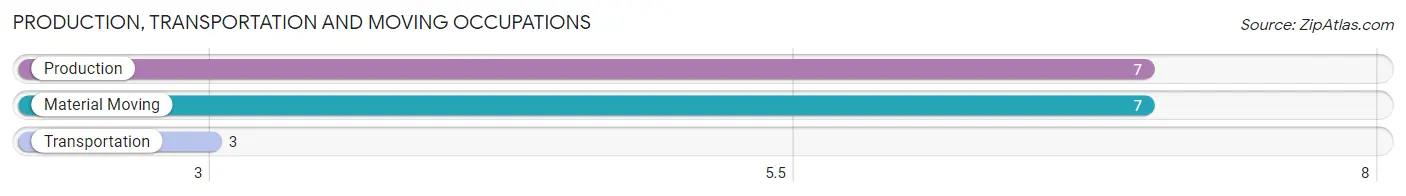
Production, Transportation and Moving Occupations by Sex
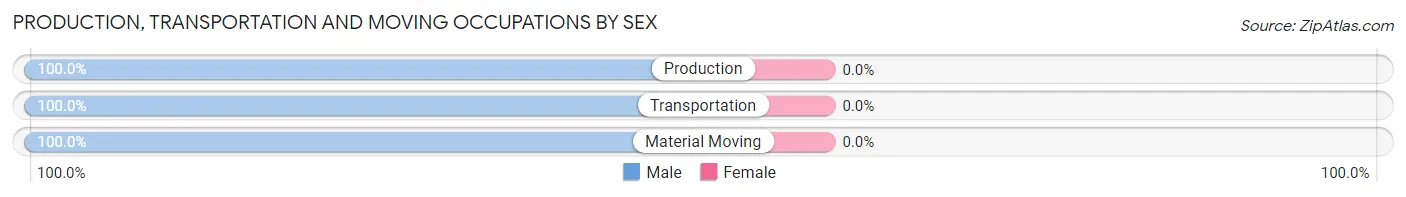
| Occupation | Male | Female |
| Production | 7 (100.0%) | 0 (0.0%) |
| Transportation | 3 (100.0%) | 0 (0.0%) |
| Material Moving | 7 (100.0%) | 0 (0.0%) |
| Total (Category) | 17 (100.0%) | 0 (0.0%) |
| Total (Overall) | 86 (57.7%) | 63 (42.3%) |
Employment Industries by Sex in Gary
Employment Industries in Gary
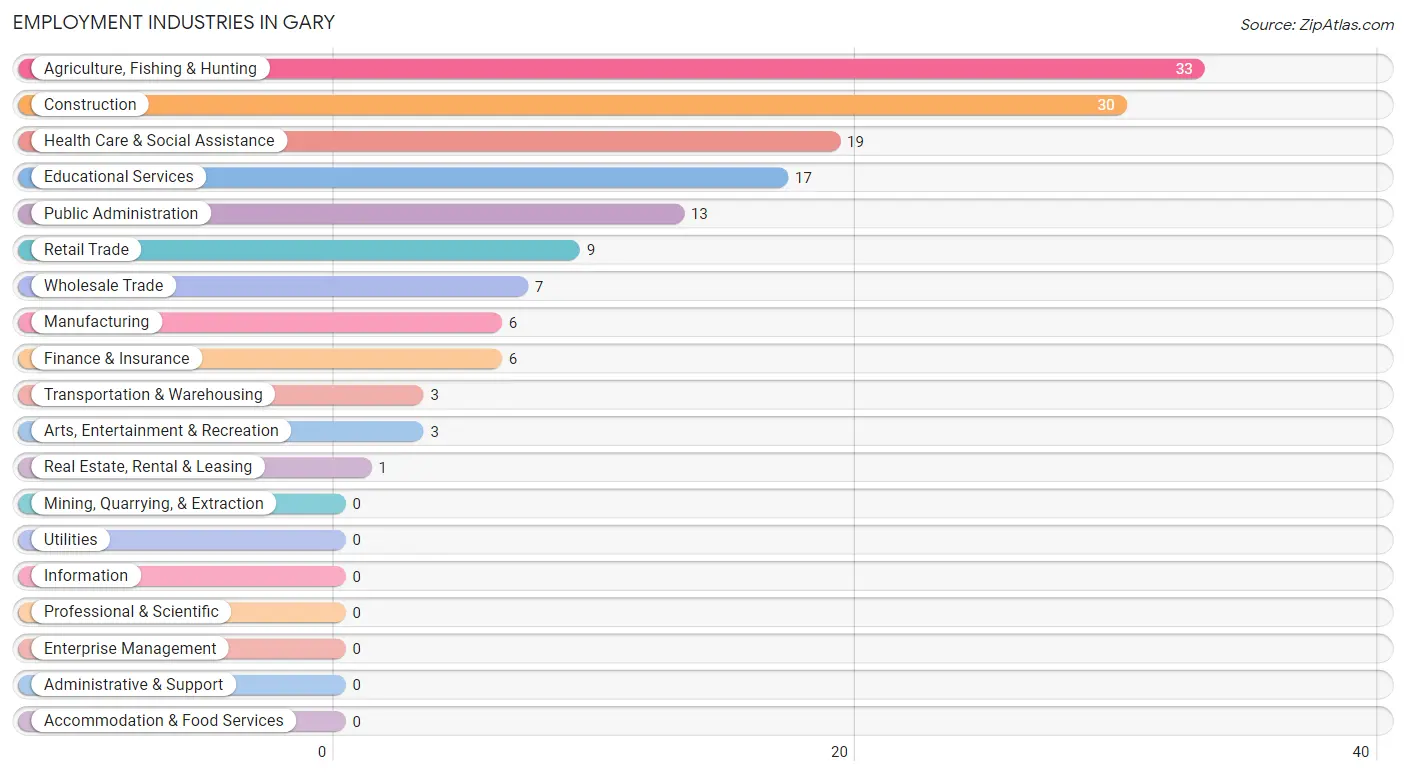
The major employment industries in Gary include Agriculture, Fishing & Hunting (33 | 22.2%), Construction (30 | 20.1%), Health Care & Social Assistance (19 | 12.8%), Educational Services (17 | 11.4%), and Public Administration (13 | 8.7%).
Employment Industries by Sex in Gary
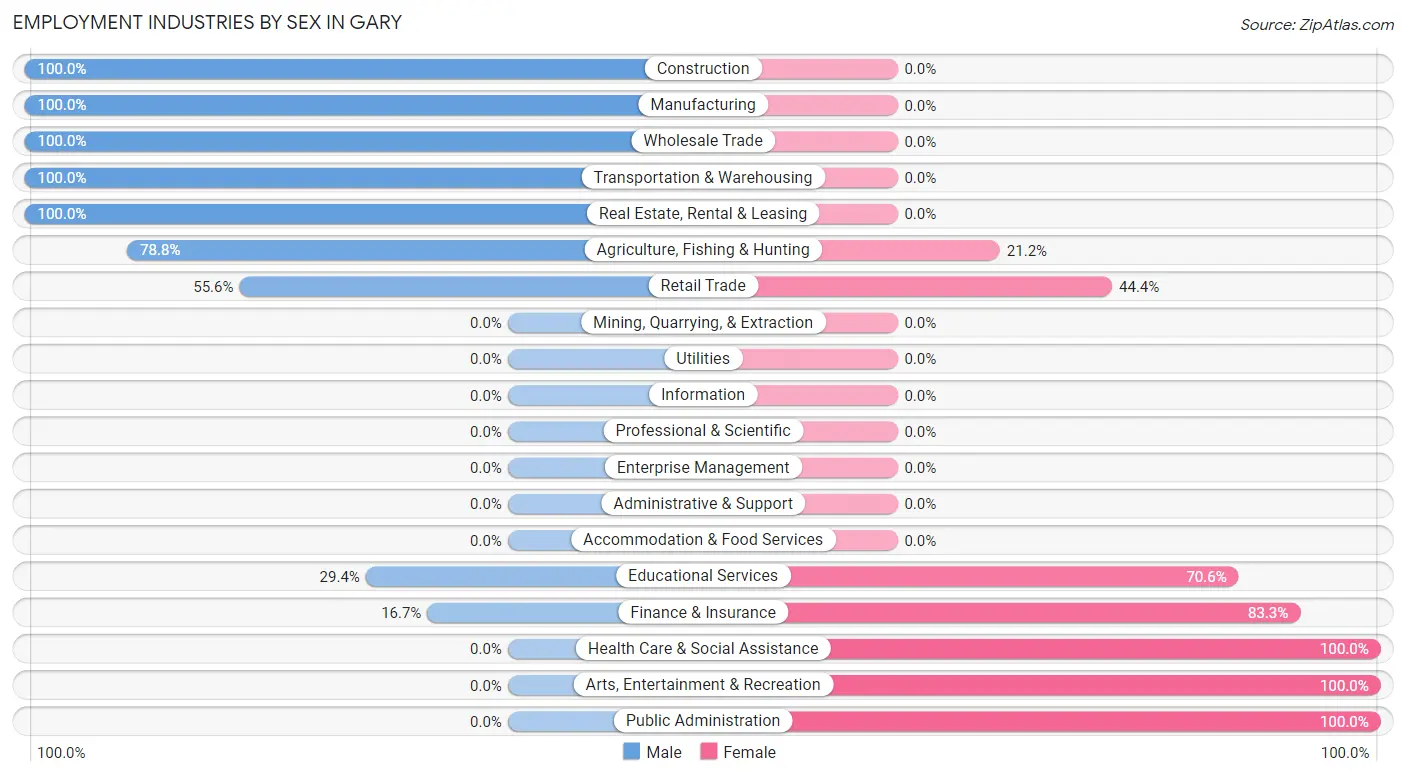
The Gary industries that see more men than women are Construction (100.0%), Manufacturing (100.0%), and Wholesale Trade (100.0%), whereas the industries that tend to have a higher number of women are Health Care & Social Assistance (100.0%), Arts, Entertainment & Recreation (100.0%), and Public Administration (100.0%).
| Industry | Male | Female |
| Agriculture, Fishing & Hunting | 26 (78.8%) | 7 (21.2%) |
| Mining, Quarrying, & Extraction | 0 (0.0%) | 0 (0.0%) |
| Construction | 30 (100.0%) | 0 (0.0%) |
| Manufacturing | 6 (100.0%) | 0 (0.0%) |
| Wholesale Trade | 7 (100.0%) | 0 (0.0%) |
| Retail Trade | 5 (55.6%) | 4 (44.4%) |
| Transportation & Warehousing | 3 (100.0%) | 0 (0.0%) |
| Utilities | 0 (0.0%) | 0 (0.0%) |
| Information | 0 (0.0%) | 0 (0.0%) |
| Finance & Insurance | 1 (16.7%) | 5 (83.3%) |
| Real Estate, Rental & Leasing | 1 (100.0%) | 0 (0.0%) |
| Professional & Scientific | 0 (0.0%) | 0 (0.0%) |
| Enterprise Management | 0 (0.0%) | 0 (0.0%) |
| Administrative & Support | 0 (0.0%) | 0 (0.0%) |
| Educational Services | 5 (29.4%) | 12 (70.6%) |
| Health Care & Social Assistance | 0 (0.0%) | 19 (100.0%) |
| Arts, Entertainment & Recreation | 0 (0.0%) | 3 (100.0%) |
| Accommodation & Food Services | 0 (0.0%) | 0 (0.0%) |
| Public Administration | 0 (0.0%) | 13 (100.0%) |
| Total | 86 (57.7%) | 63 (42.3%) |
Education in Gary
School Enrollment in Gary
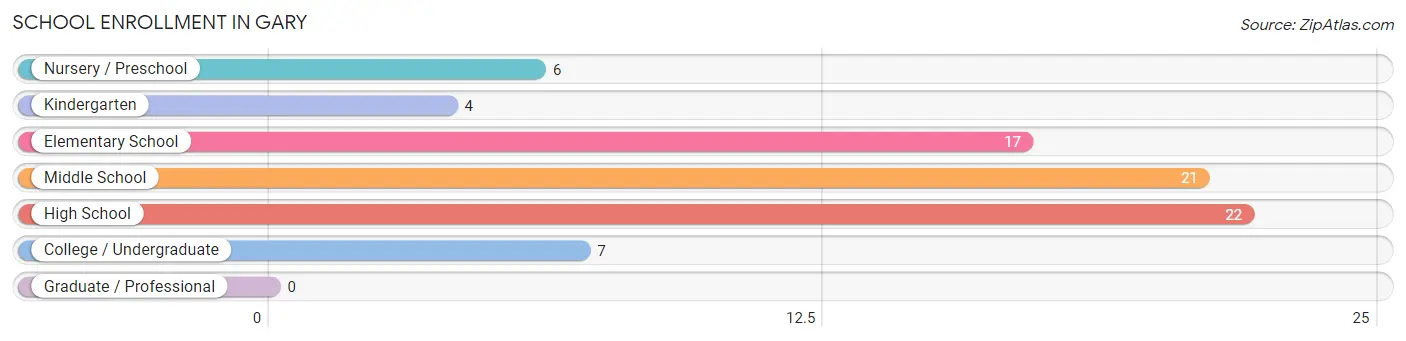
The most common levels of schooling among the 77 students in Gary are high school (22 | 28.6%), middle school (21 | 27.3%), and elementary school (17 | 22.1%).
| School Level | # Students | % Students |
| Nursery / Preschool | 6 | 7.8% |
| Kindergarten | 4 | 5.2% |
| Elementary School | 17 | 22.1% |
| Middle School | 21 | 27.3% |
| High School | 22 | 28.6% |
| College / Undergraduate | 7 | 9.1% |
| Graduate / Professional | 0 | 0.0% |
| Total | 77 | 100.0% |
School Enrollment by Age by Funding Source in Gary
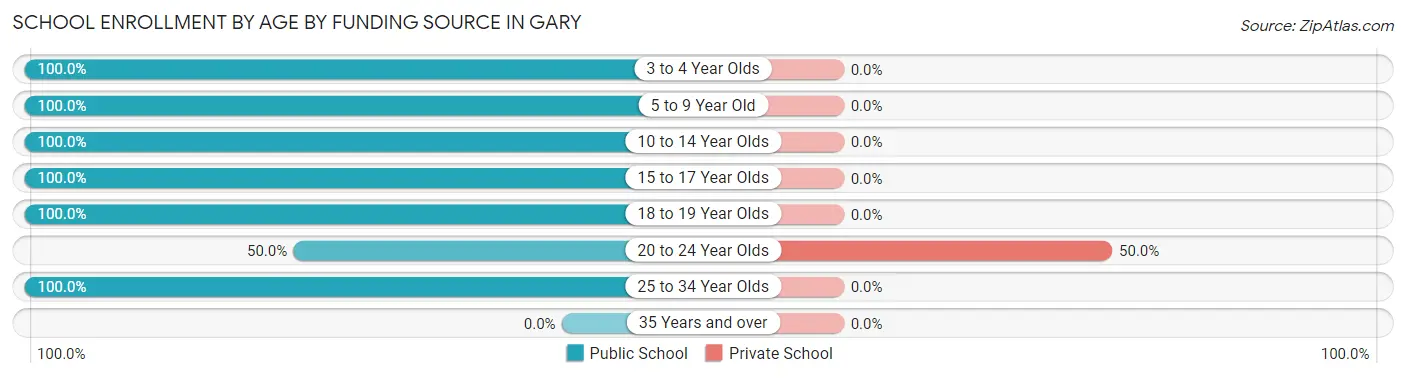
Out of a total of 77 students who are enrolled in schools in Gary, 2 (2.6%) attend a private institution, while the remaining 75 (97.4%) are enrolled in public schools. The age group of 20 to 24 year olds has the highest likelihood of being enrolled in private schools, with 2 (50.0% in the age bracket) enrolled. Conversely, the age group of 3 to 4 year olds has the lowest likelihood of being enrolled in a private school, with 2 (100.0% in the age bracket) attending a public institution.
| Age Bracket | Public School | Private School |
| 3 to 4 Year Olds | 2 (100.0%) | 0 (0.0%) |
| 5 to 9 Year Old | 29 (100.0%) | 0 (0.0%) |
| 10 to 14 Year Olds | 18 (100.0%) | 0 (0.0%) |
| 15 to 17 Year Olds | 16 (100.0%) | 0 (0.0%) |
| 18 to 19 Year Olds | 5 (100.0%) | 0 (0.0%) |
| 20 to 24 Year Olds | 2 (50.0%) | 2 (50.0%) |
| 25 to 34 Year Olds | 3 (100.0%) | 0 (0.0%) |
| 35 Years and over | 0 (0.0%) | 0 (0.0%) |
| Total | 75 (97.4%) | 2 (2.6%) |
Educational Attainment by Field of Study in Gary
Science & technology (4 | 36.4%), education (4 | 36.4%), bio, nature & agricultural (1 | 9.1%), psychology (1 | 9.1%), and arts & humanities (1 | 9.1%) are the most common fields of study among 11 individuals in Gary who have obtained a bachelor's degree or higher.
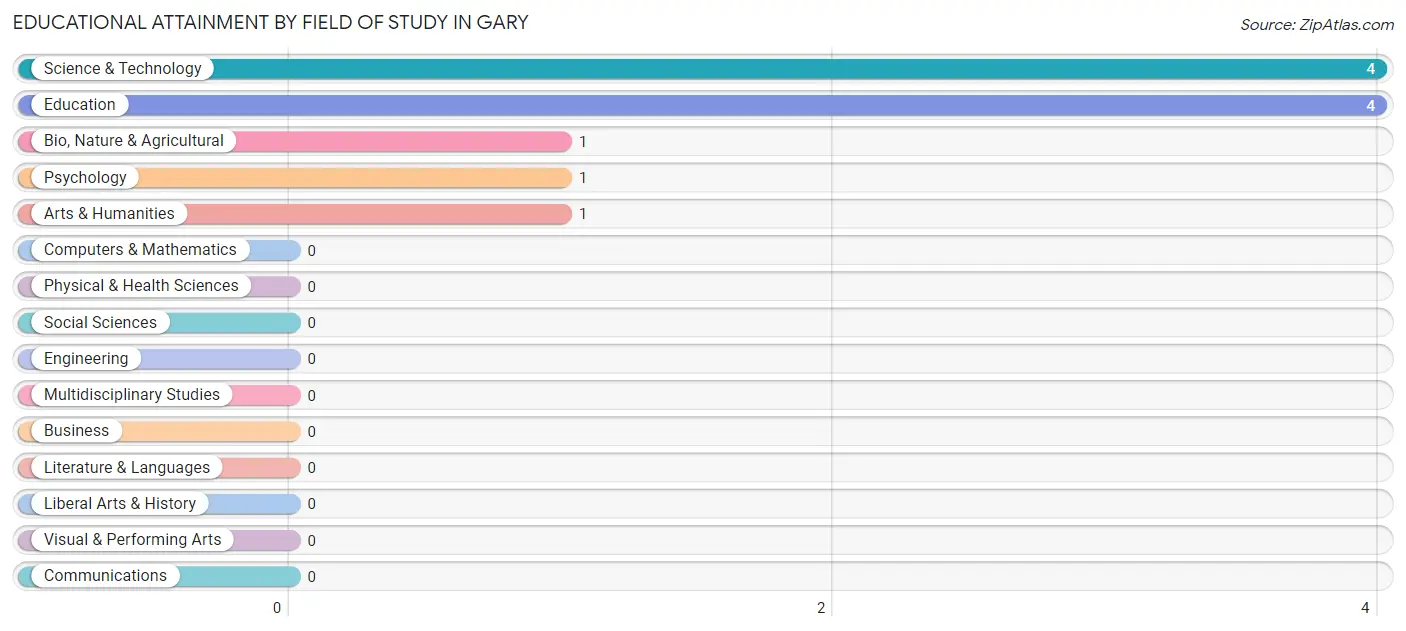
| Field of Study | # Graduates | % Graduates |
| Computers & Mathematics | 0 | 0.0% |
| Bio, Nature & Agricultural | 1 | 9.1% |
| Physical & Health Sciences | 0 | 0.0% |
| Psychology | 1 | 9.1% |
| Social Sciences | 0 | 0.0% |
| Engineering | 0 | 0.0% |
| Multidisciplinary Studies | 0 | 0.0% |
| Science & Technology | 4 | 36.4% |
| Business | 0 | 0.0% |
| Education | 4 | 36.4% |
| Literature & Languages | 0 | 0.0% |
| Liberal Arts & History | 0 | 0.0% |
| Visual & Performing Arts | 0 | 0.0% |
| Communications | 0 | 0.0% |
| Arts & Humanities | 1 | 9.1% |
| Total | 11 | 100.0% |
Transportation & Commute in Gary
Vehicle Availability by Sex in Gary
The most prevalent vehicle ownership categories in Gary are males with 3 vehicles (37, accounting for 43.0%) and females with 3 vehicles (28, making up 60.7%).
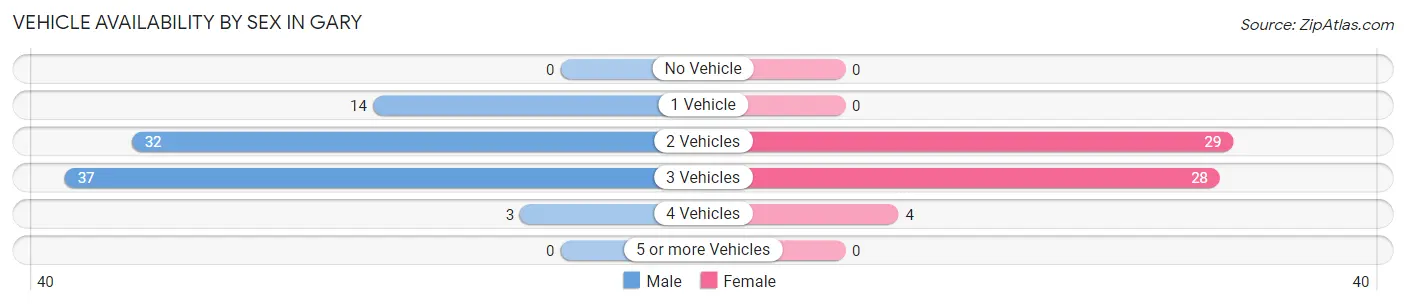
| Vehicles Available | Male | Female |
| No Vehicle | 0 (0.0%) | 0 (0.0%) |
| 1 Vehicle | 14 (16.3%) | 0 (0.0%) |
| 2 Vehicles | 32 (37.2%) | 29 (47.5%) |
| 3 Vehicles | 37 (43.0%) | 28 (45.9%) |
| 4 Vehicles | 3 (3.5%) | 4 (6.6%) |
| 5 or more Vehicles | 0 (0.0%) | 0 (0.0%) |
| Total | 86 (100.0%) | 61 (100.0%) |
Commute Time in Gary
The most frequently occuring commute durations in Gary are 20 to 24 minutes (32 commuters, 23.4%), 60 to 89 minutes (19 commuters, 13.9%), and 25 to 29 minutes (18 commuters, 13.1%).
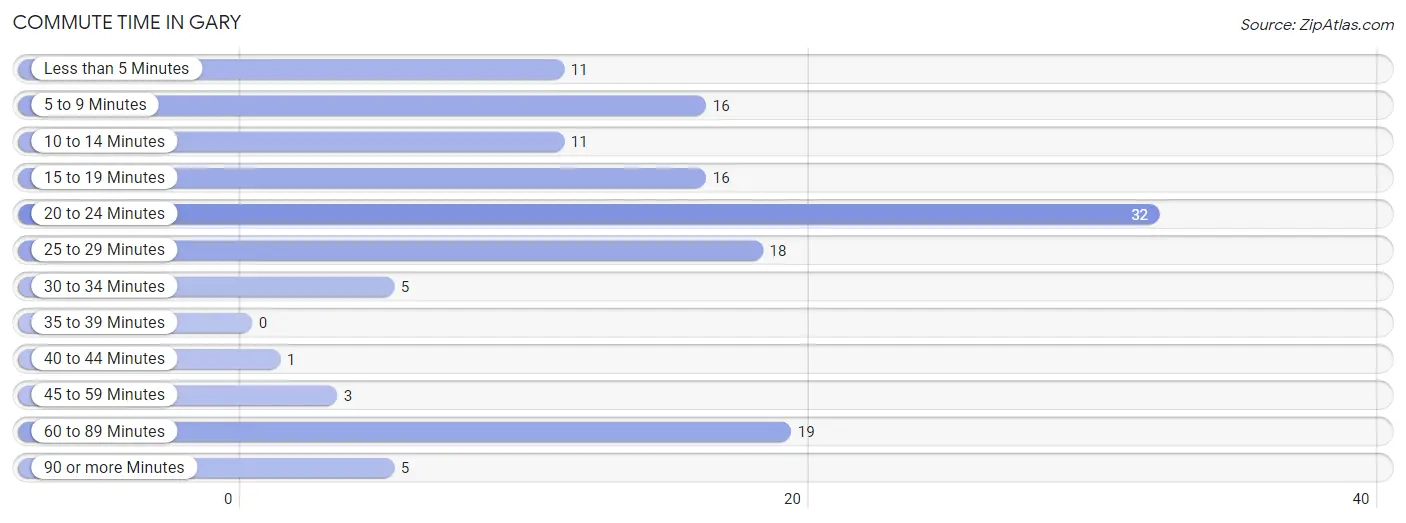
| Commute Time | # Commuters | % Commuters |
| Less than 5 Minutes | 11 | 8.0% |
| 5 to 9 Minutes | 16 | 11.7% |
| 10 to 14 Minutes | 11 | 8.0% |
| 15 to 19 Minutes | 16 | 11.7% |
| 20 to 24 Minutes | 32 | 23.4% |
| 25 to 29 Minutes | 18 | 13.1% |
| 30 to 34 Minutes | 5 | 3.6% |
| 35 to 39 Minutes | 0 | 0.0% |
| 40 to 44 Minutes | 1 | 0.7% |
| 45 to 59 Minutes | 3 | 2.2% |
| 60 to 89 Minutes | 19 | 13.9% |
| 90 or more Minutes | 5 | 3.6% |
Commute Time by Sex in Gary
The most common commute times in Gary are 20 to 24 minutes (25 commuters, 29.1%) for males and 25 to 29 minutes (17 commuters, 33.3%) for females.
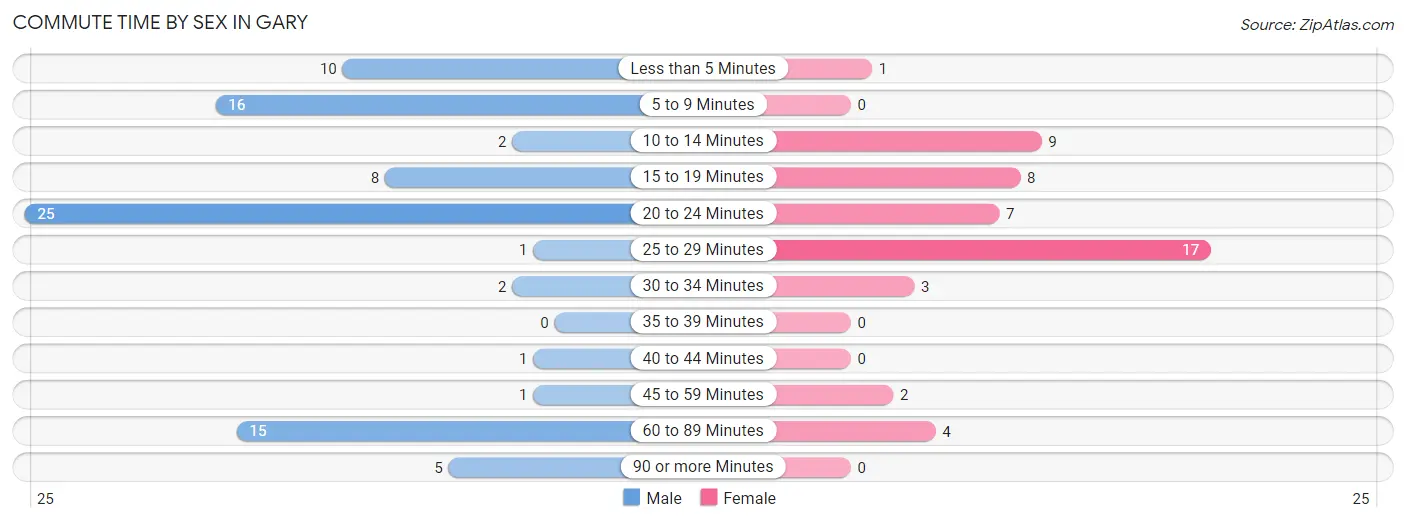
| Commute Time | Male | Female |
| Less than 5 Minutes | 10 (11.6%) | 1 (2.0%) |
| 5 to 9 Minutes | 16 (18.6%) | 0 (0.0%) |
| 10 to 14 Minutes | 2 (2.3%) | 9 (17.6%) |
| 15 to 19 Minutes | 8 (9.3%) | 8 (15.7%) |
| 20 to 24 Minutes | 25 (29.1%) | 7 (13.7%) |
| 25 to 29 Minutes | 1 (1.2%) | 17 (33.3%) |
| 30 to 34 Minutes | 2 (2.3%) | 3 (5.9%) |
| 35 to 39 Minutes | 0 (0.0%) | 0 (0.0%) |
| 40 to 44 Minutes | 1 (1.2%) | 0 (0.0%) |
| 45 to 59 Minutes | 1 (1.2%) | 2 (3.9%) |
| 60 to 89 Minutes | 15 (17.4%) | 4 (7.8%) |
| 90 or more Minutes | 5 (5.8%) | 0 (0.0%) |
Time of Departure to Work by Sex in Gary
The most frequent times of departure to work in Gary are 7:30 AM to 7:59 AM (20, 23.3%) for males and 7:00 AM to 7:29 AM (19, 37.2%) for females.
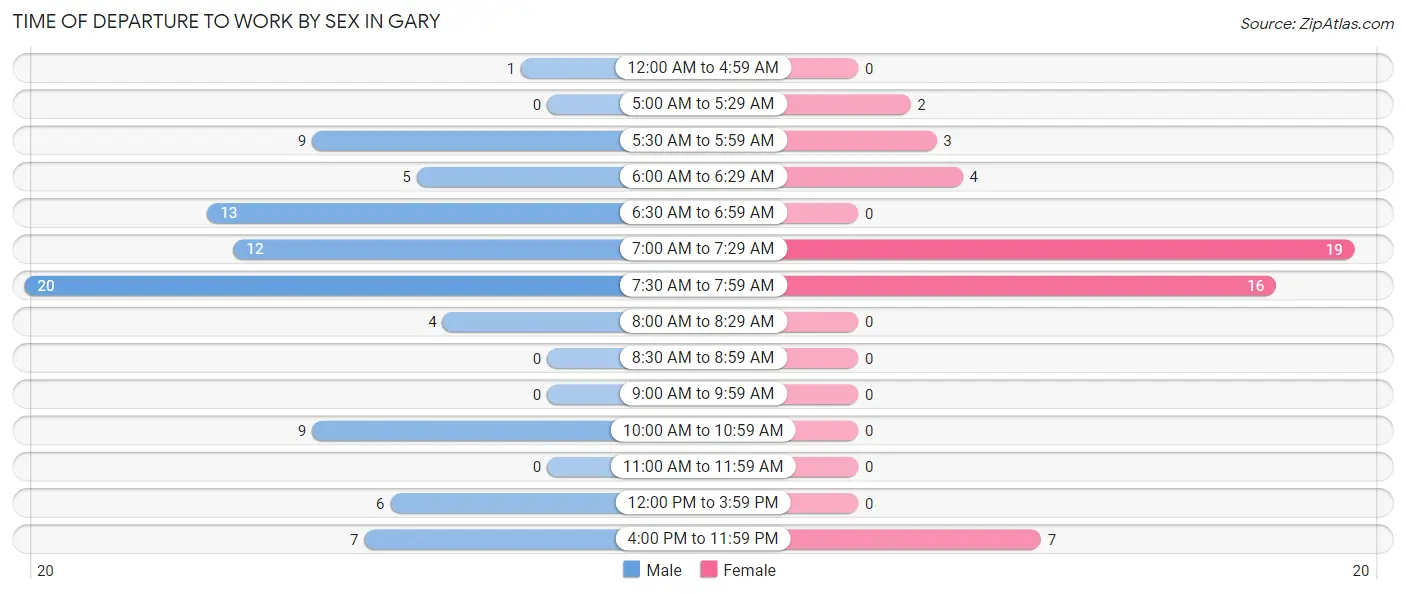
| Time of Departure | Male | Female |
| 12:00 AM to 4:59 AM | 1 (1.2%) | 0 (0.0%) |
| 5:00 AM to 5:29 AM | 0 (0.0%) | 2 (3.9%) |
| 5:30 AM to 5:59 AM | 9 (10.5%) | 3 (5.9%) |
| 6:00 AM to 6:29 AM | 5 (5.8%) | 4 (7.8%) |
| 6:30 AM to 6:59 AM | 13 (15.1%) | 0 (0.0%) |
| 7:00 AM to 7:29 AM | 12 (14.0%) | 19 (37.2%) |
| 7:30 AM to 7:59 AM | 20 (23.3%) | 16 (31.4%) |
| 8:00 AM to 8:29 AM | 4 (4.6%) | 0 (0.0%) |
| 8:30 AM to 8:59 AM | 0 (0.0%) | 0 (0.0%) |
| 9:00 AM to 9:59 AM | 0 (0.0%) | 0 (0.0%) |
| 10:00 AM to 10:59 AM | 9 (10.5%) | 0 (0.0%) |
| 11:00 AM to 11:59 AM | 0 (0.0%) | 0 (0.0%) |
| 12:00 PM to 3:59 PM | 6 (7.0%) | 0 (0.0%) |
| 4:00 PM to 11:59 PM | 7 (8.1%) | 7 (13.7%) |
| Total | 86 (100.0%) | 51 (100.0%) |
Housing Occupancy in Gary
Occupancy by Ownership in Gary
Of the total 99 dwellings in Gary, owner-occupied units account for 96 (97.0%), while renter-occupied units make up 3 (3.0%).
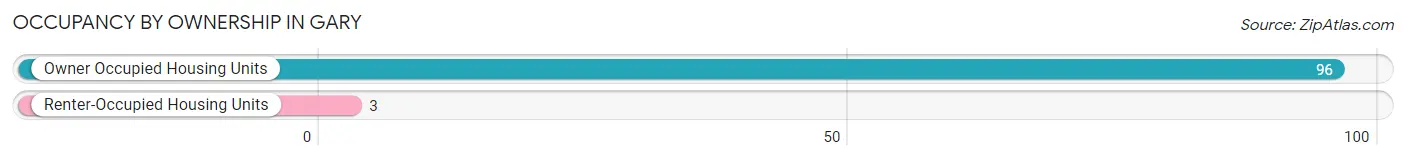
| Occupancy | # Housing Units | % Housing Units |
| Owner Occupied Housing Units | 96 | 97.0% |
| Renter-Occupied Housing Units | 3 | 3.0% |
| Total Occupied Housing Units | 99 | 100.0% |
Occupancy by Household Size in Gary
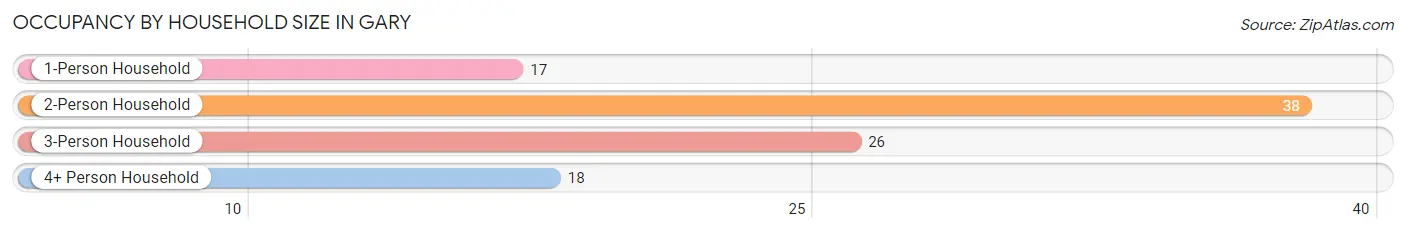
| Household Size | # Housing Units | % Housing Units |
| 1-Person Household | 17 | 17.2% |
| 2-Person Household | 38 | 38.4% |
| 3-Person Household | 26 | 26.3% |
| 4+ Person Household | 18 | 18.2% |
| Total Housing Units | 99 | 100.0% |
Occupancy by Ownership by Household Size in Gary
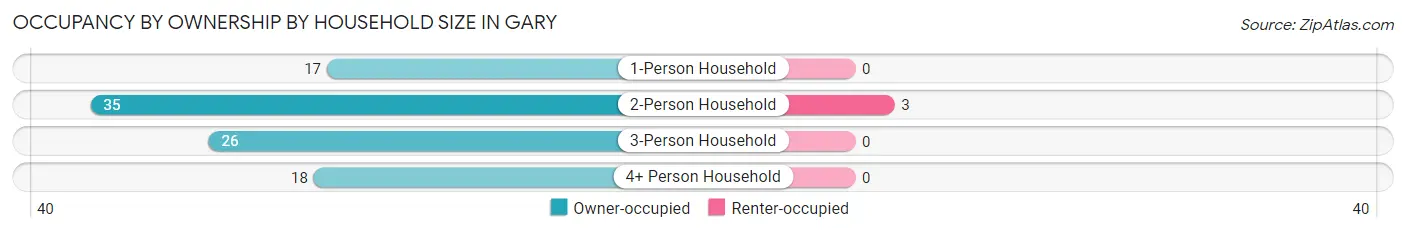
| Household Size | Owner-occupied | Renter-occupied |
| 1-Person Household | 17 (100.0%) | 0 (0.0%) |
| 2-Person Household | 35 (92.1%) | 3 (7.9%) |
| 3-Person Household | 26 (100.0%) | 0 (0.0%) |
| 4+ Person Household | 18 (100.0%) | 0 (0.0%) |
| Total Housing Units | 96 (97.0%) | 3 (3.0%) |
Occupancy by Educational Attainment in Gary
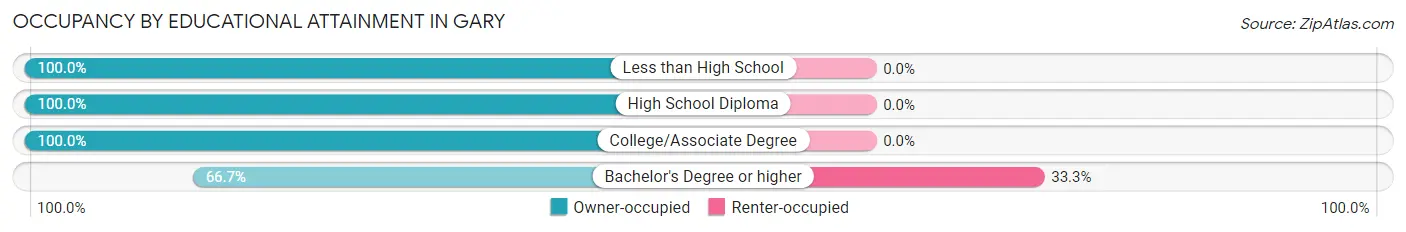
| Household Size | Owner-occupied | Renter-occupied |
| Less than High School | 2 (100.0%) | 0 (0.0%) |
| High School Diploma | 39 (100.0%) | 0 (0.0%) |
| College/Associate Degree | 49 (100.0%) | 0 (0.0%) |
| Bachelor's Degree or higher | 6 (66.7%) | 3 (33.3%) |
Occupancy by Age of Householder in Gary
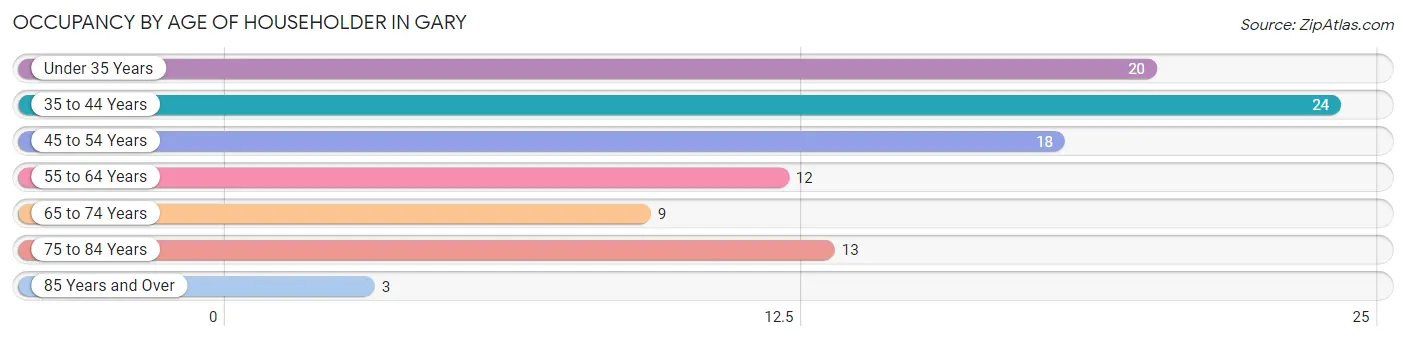
| Age Bracket | # Households | % Households |
| Under 35 Years | 20 | 20.2% |
| 35 to 44 Years | 24 | 24.2% |
| 45 to 54 Years | 18 | 18.2% |
| 55 to 64 Years | 12 | 12.1% |
| 65 to 74 Years | 9 | 9.1% |
| 75 to 84 Years | 13 | 13.1% |
| 85 Years and Over | 3 | 3.0% |
| Total | 99 | 100.0% |
Housing Finances in Gary
Median Income by Occupancy in Gary
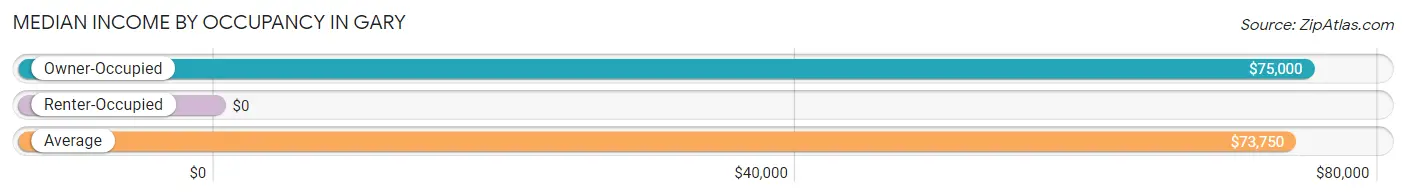
| Occupancy Type | # Households | Median Income |
| Owner-Occupied | 96 (97.0%) | $75,000 |
| Renter-Occupied | 3 (3.0%) | $0 |
| Average | 99 (100.0%) | $73,750 |
Occupancy by Householder Income Bracket in Gary
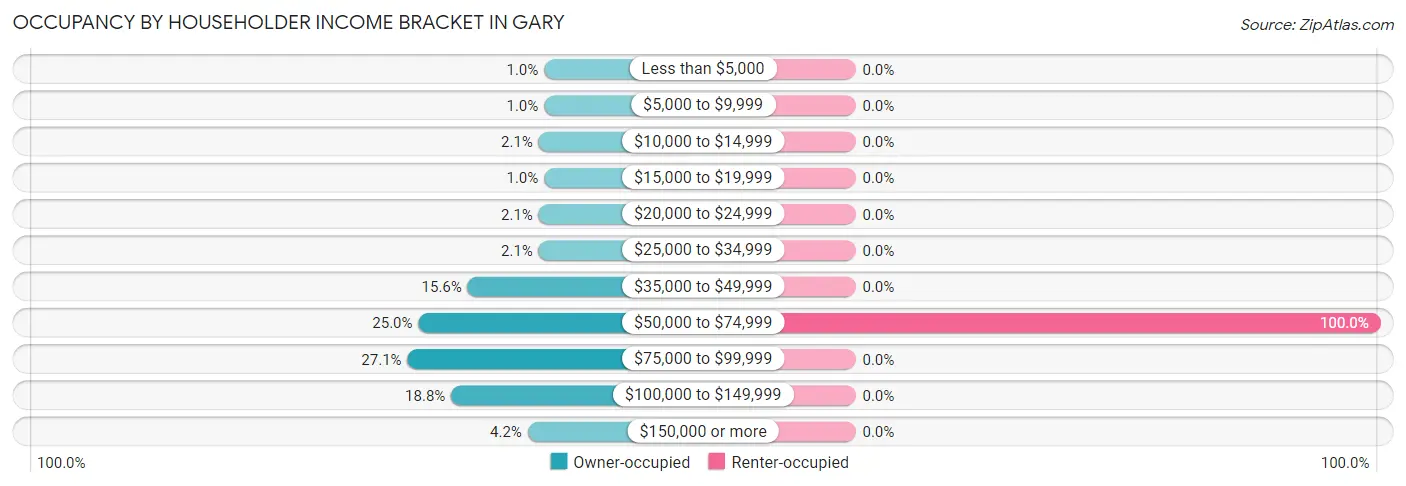
| Income Bracket | Owner-occupied | Renter-occupied |
| Less than $5,000 | 1 (1.0%) | 0 (0.0%) |
| $5,000 to $9,999 | 1 (1.0%) | 0 (0.0%) |
| $10,000 to $14,999 | 2 (2.1%) | 0 (0.0%) |
| $15,000 to $19,999 | 1 (1.0%) | 0 (0.0%) |
| $20,000 to $24,999 | 2 (2.1%) | 0 (0.0%) |
| $25,000 to $34,999 | 2 (2.1%) | 0 (0.0%) |
| $35,000 to $49,999 | 15 (15.6%) | 0 (0.0%) |
| $50,000 to $74,999 | 24 (25.0%) | 3 (100.0%) |
| $75,000 to $99,999 | 26 (27.1%) | 0 (0.0%) |
| $100,000 to $149,999 | 18 (18.8%) | 0 (0.0%) |
| $150,000 or more | 4 (4.2%) | 0 (0.0%) |
| Total | 96 (100.0%) | 3 (100.0%) |
Monthly Housing Cost Tiers in Gary
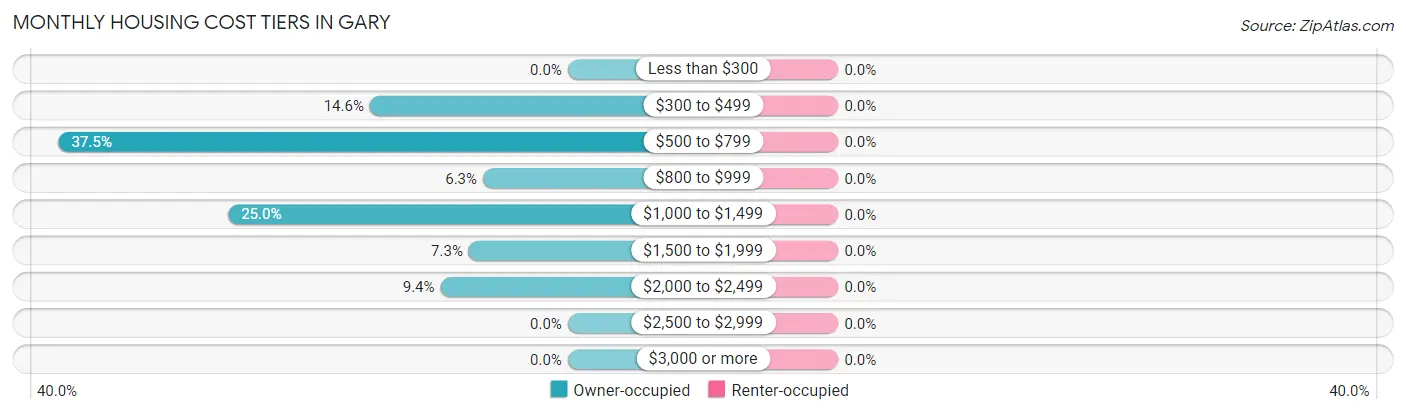
| Monthly Cost | Owner-occupied | Renter-occupied |
| Less than $300 | 0 (0.0%) | 0 (0.0%) |
| $300 to $499 | 14 (14.6%) | 0 (0.0%) |
| $500 to $799 | 36 (37.5%) | 0 (0.0%) |
| $800 to $999 | 6 (6.2%) | 0 (0.0%) |
| $1,000 to $1,499 | 24 (25.0%) | 0 (0.0%) |
| $1,500 to $1,999 | 7 (7.3%) | 0 (0.0%) |
| $2,000 to $2,499 | 9 (9.4%) | 0 (0.0%) |
| $2,500 to $2,999 | 0 (0.0%) | 0 (0.0%) |
| $3,000 or more | 0 (0.0%) | 0 (0.0%) |
| Total | 96 (100.0%) | 3 (100.0%) |
Physical Housing Characteristics in Gary
Housing Structures in Gary
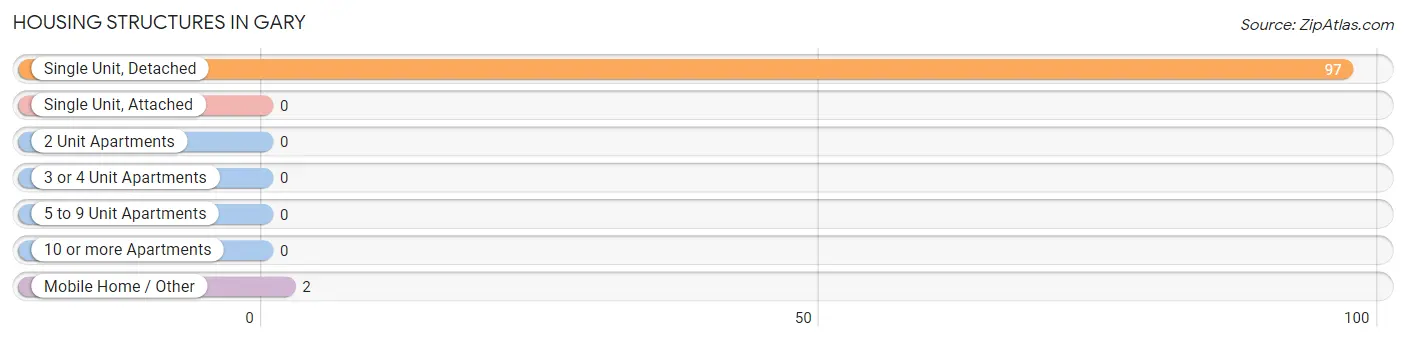
| Structure Type | # Housing Units | % Housing Units |
| Single Unit, Detached | 97 | 98.0% |
| Single Unit, Attached | 0 | 0.0% |
| 2 Unit Apartments | 0 | 0.0% |
| 3 or 4 Unit Apartments | 0 | 0.0% |
| 5 to 9 Unit Apartments | 0 | 0.0% |
| 10 or more Apartments | 0 | 0.0% |
| Mobile Home / Other | 2 | 2.0% |
| Total | 99 | 100.0% |
Housing Structures by Occupancy in Gary
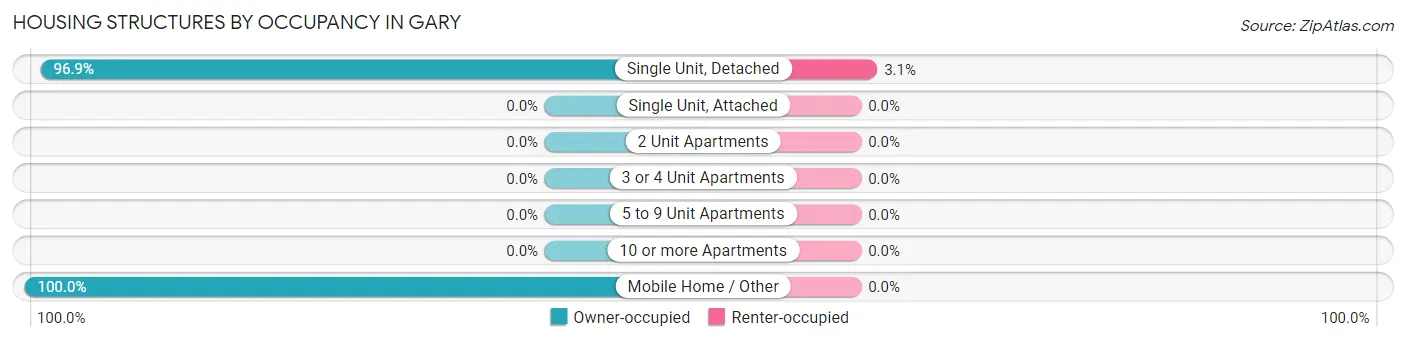
| Structure Type | Owner-occupied | Renter-occupied |
| Single Unit, Detached | 94 (96.9%) | 3 (3.1%) |
| Single Unit, Attached | 0 (0.0%) | 0 (0.0%) |
| 2 Unit Apartments | 0 (0.0%) | 0 (0.0%) |
| 3 or 4 Unit Apartments | 0 (0.0%) | 0 (0.0%) |
| 5 to 9 Unit Apartments | 0 (0.0%) | 0 (0.0%) |
| 10 or more Apartments | 0 (0.0%) | 0 (0.0%) |
| Mobile Home / Other | 2 (100.0%) | 0 (0.0%) |
| Total | 96 (97.0%) | 3 (3.0%) |
Housing Structures by Number of Rooms in Gary
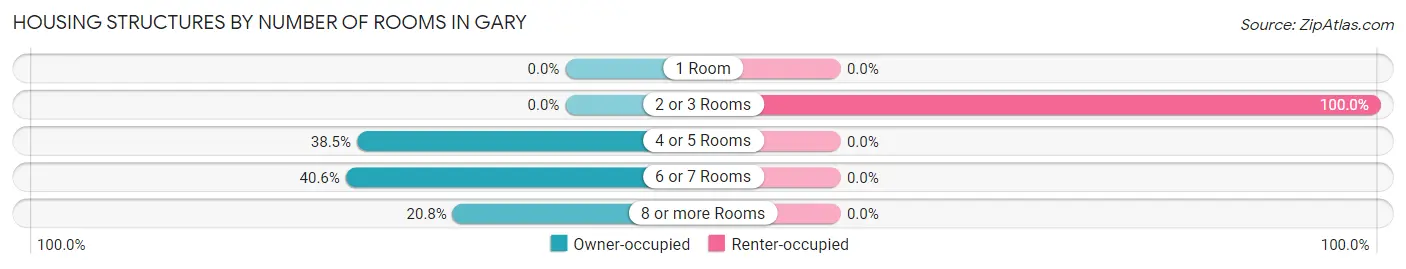
| Number of Rooms | Owner-occupied | Renter-occupied |
| 1 Room | 0 (0.0%) | 0 (0.0%) |
| 2 or 3 Rooms | 0 (0.0%) | 3 (100.0%) |
| 4 or 5 Rooms | 37 (38.5%) | 0 (0.0%) |
| 6 or 7 Rooms | 39 (40.6%) | 0 (0.0%) |
| 8 or more Rooms | 20 (20.8%) | 0 (0.0%) |
| Total | 96 (100.0%) | 3 (100.0%) |
Housing Structure by Heating Type in Gary
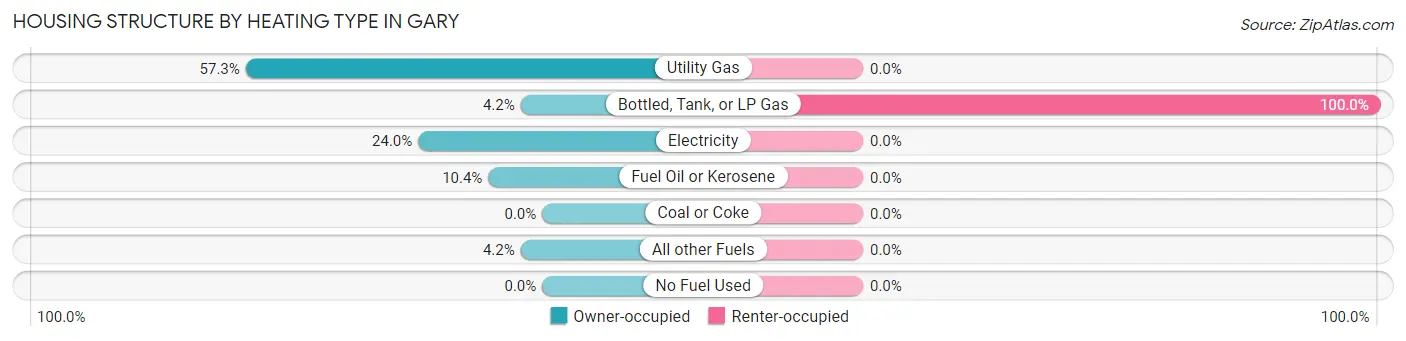
| Heating Type | Owner-occupied | Renter-occupied |
| Utility Gas | 55 (57.3%) | 0 (0.0%) |
| Bottled, Tank, or LP Gas | 4 (4.2%) | 3 (100.0%) |
| Electricity | 23 (24.0%) | 0 (0.0%) |
| Fuel Oil or Kerosene | 10 (10.4%) | 0 (0.0%) |
| Coal or Coke | 0 (0.0%) | 0 (0.0%) |
| All other Fuels | 4 (4.2%) | 0 (0.0%) |
| No Fuel Used | 0 (0.0%) | 0 (0.0%) |
| Total | 96 (100.0%) | 3 (100.0%) |
Household Vehicle Usage in Gary
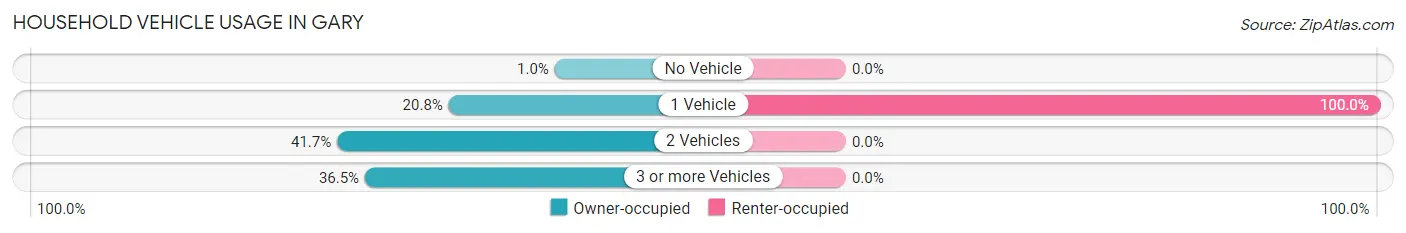
| Vehicles per Household | Owner-occupied | Renter-occupied |
| No Vehicle | 1 (1.0%) | 0 (0.0%) |
| 1 Vehicle | 20 (20.8%) | 3 (100.0%) |
| 2 Vehicles | 40 (41.7%) | 0 (0.0%) |
| 3 or more Vehicles | 35 (36.5%) | 0 (0.0%) |
| Total | 96 (100.0%) | 3 (100.0%) |
Real Estate & Mortgages in Gary
Real Estate and Mortgage Overview in Gary
| Characteristic | Without Mortgage | With Mortgage |
| Housing Units | 41 | 55 |
| Median Property Value | $79,500 | $176,000 |
| Median Household Income | $46,875 | $2 |
| Monthly Housing Costs | $593 | $0 |
| Real Estate Taxes | $1,141 | $2 |
Property Value by Mortgage Status in Gary
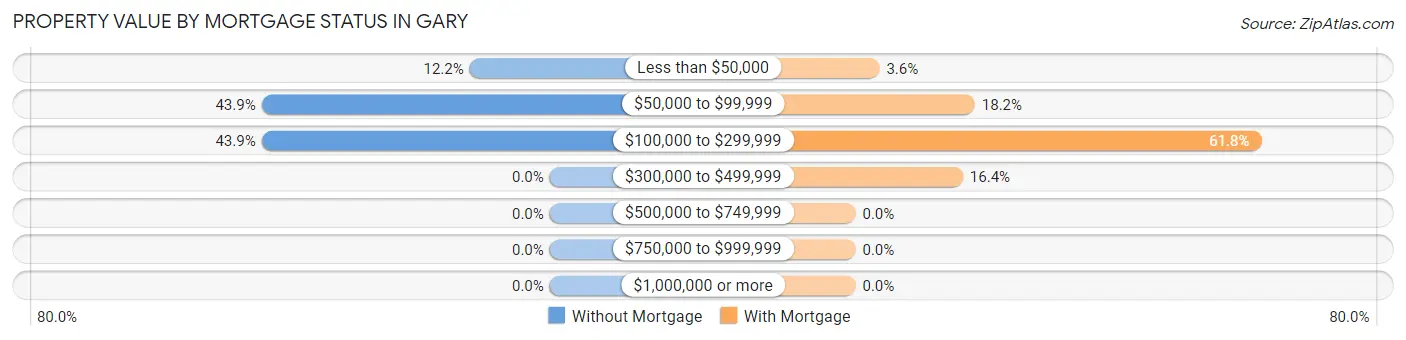
| Property Value | Without Mortgage | With Mortgage |
| Less than $50,000 | 5 (12.2%) | 2 (3.6%) |
| $50,000 to $99,999 | 18 (43.9%) | 10 (18.2%) |
| $100,000 to $299,999 | 18 (43.9%) | 34 (61.8%) |
| $300,000 to $499,999 | 0 (0.0%) | 9 (16.4%) |
| $500,000 to $749,999 | 0 (0.0%) | 0 (0.0%) |
| $750,000 to $999,999 | 0 (0.0%) | 0 (0.0%) |
| $1,000,000 or more | 0 (0.0%) | 0 (0.0%) |
| Total | 41 (100.0%) | 55 (100.0%) |
Household Income by Mortgage Status in Gary
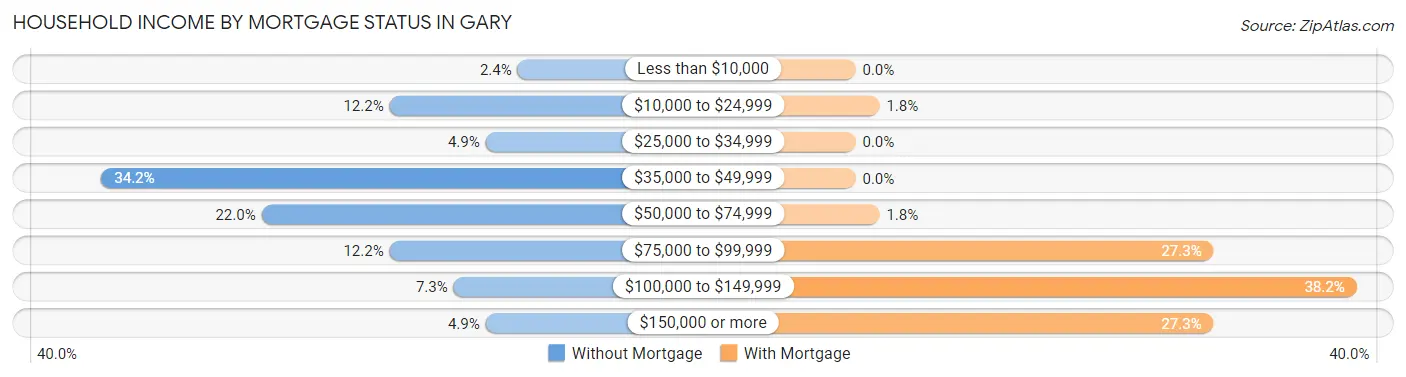
| Household Income | Without Mortgage | With Mortgage |
| Less than $10,000 | 1 (2.4%) | 0 (0.0%) |
| $10,000 to $24,999 | 5 (12.2%) | 1 (1.8%) |
| $25,000 to $34,999 | 2 (4.9%) | 0 (0.0%) |
| $35,000 to $49,999 | 14 (34.2%) | 0 (0.0%) |
| $50,000 to $74,999 | 9 (22.0%) | 1 (1.8%) |
| $75,000 to $99,999 | 5 (12.2%) | 15 (27.3%) |
| $100,000 to $149,999 | 3 (7.3%) | 21 (38.2%) |
| $150,000 or more | 2 (4.9%) | 15 (27.3%) |
| Total | 41 (100.0%) | 55 (100.0%) |
Property Value to Household Income Ratio in Gary
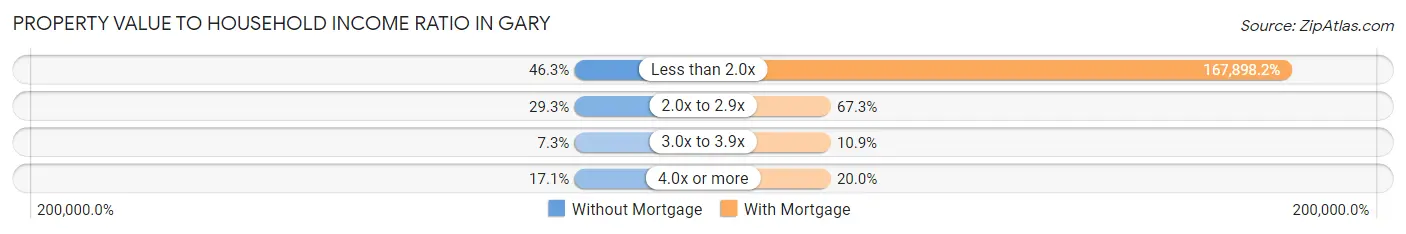
| Value-to-Income Ratio | Without Mortgage | With Mortgage |
| Less than 2.0x | 19 (46.3%) | 92,344 (167,898.2%) |
| 2.0x to 2.9x | 12 (29.3%) | 37 (67.3%) |
| 3.0x to 3.9x | 3 (7.3%) | 6 (10.9%) |
| 4.0x or more | 7 (17.1%) | 11 (20.0%) |
| Total | 41 (100.0%) | 55 (100.0%) |
Real Estate Taxes by Mortgage Status in Gary
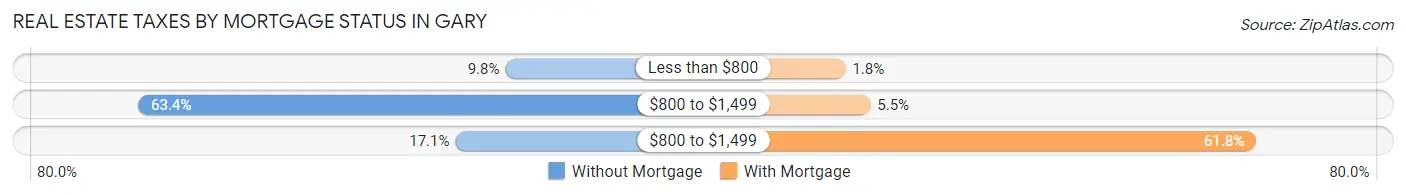
| Property Taxes | Without Mortgage | With Mortgage |
| Less than $800 | 4 (9.8%) | 1 (1.8%) |
| $800 to $1,499 | 26 (63.4%) | 3 (5.4%) |
| $800 to $1,499 | 7 (17.1%) | 34 (61.8%) |
| Total | 41 (100.0%) | 55 (100.0%) |
Health & Disability in Gary
Health Insurance Coverage by Age in Gary
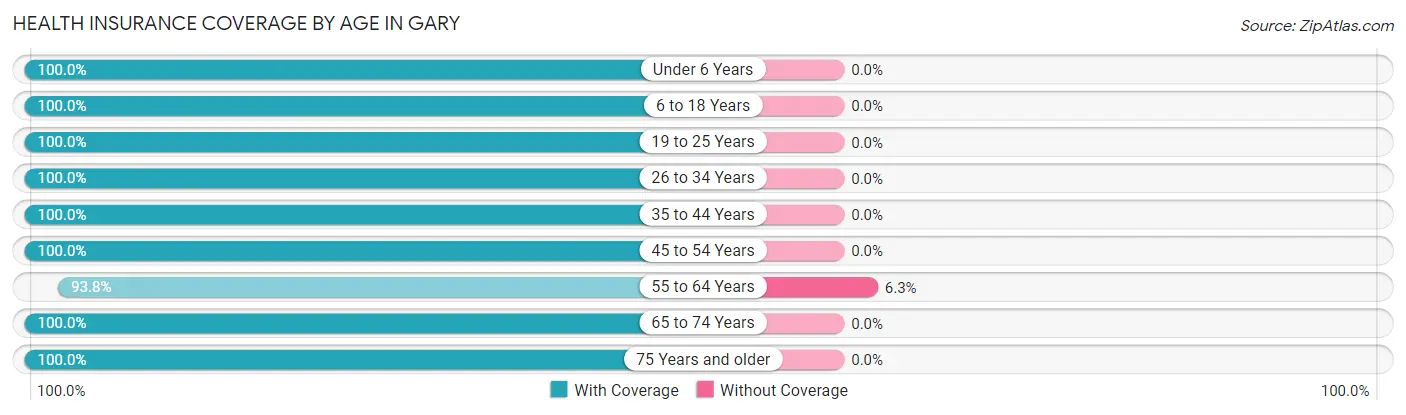
| Age Bracket | With Coverage | Without Coverage |
| Under 6 Years | 24 (100.0%) | 0 (0.0%) |
| 6 to 18 Years | 61 (100.0%) | 0 (0.0%) |
| 19 to 25 Years | 27 (100.0%) | 0 (0.0%) |
| 26 to 34 Years | 32 (100.0%) | 0 (0.0%) |
| 35 to 44 Years | 29 (100.0%) | 0 (0.0%) |
| 45 to 54 Years | 30 (100.0%) | 0 (0.0%) |
| 55 to 64 Years | 30 (93.8%) | 2 (6.2%) |
| 65 to 74 Years | 17 (100.0%) | 0 (0.0%) |
| 75 Years and older | 25 (100.0%) | 0 (0.0%) |
| Total | 275 (99.3%) | 2 (0.7%) |
Health Insurance Coverage by Citizenship Status in Gary
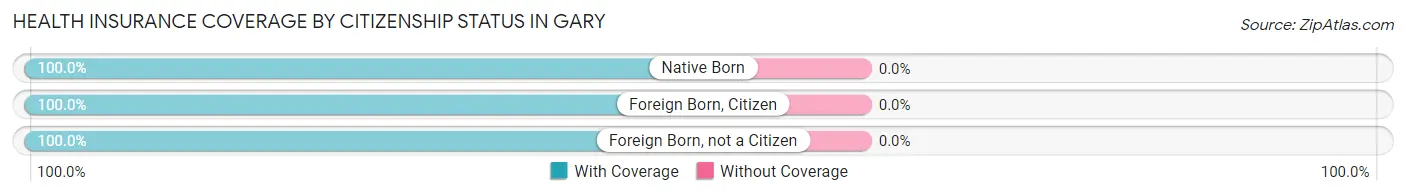
| Citizenship Status | With Coverage | Without Coverage |
| Native Born | 24 (100.0%) | 0 (0.0%) |
| Foreign Born, Citizen | 61 (100.0%) | 0 (0.0%) |
| Foreign Born, not a Citizen | 27 (100.0%) | 0 (0.0%) |
Health Insurance Coverage by Household Income in Gary
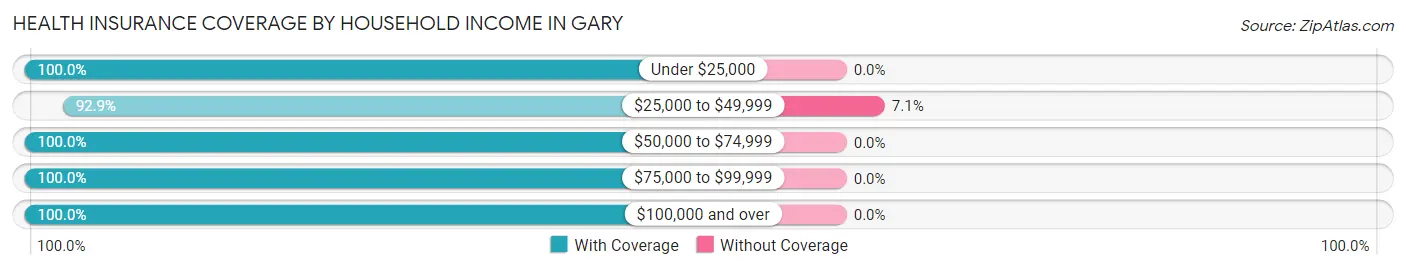
| Household Income | With Coverage | Without Coverage |
| Under $25,000 | 19 (100.0%) | 0 (0.0%) |
| $25,000 to $49,999 | 26 (92.9%) | 2 (7.1%) |
| $50,000 to $74,999 | 67 (100.0%) | 0 (0.0%) |
| $75,000 to $99,999 | 65 (100.0%) | 0 (0.0%) |
| $100,000 and over | 98 (100.0%) | 0 (0.0%) |
Public vs Private Health Insurance Coverage by Age in Gary
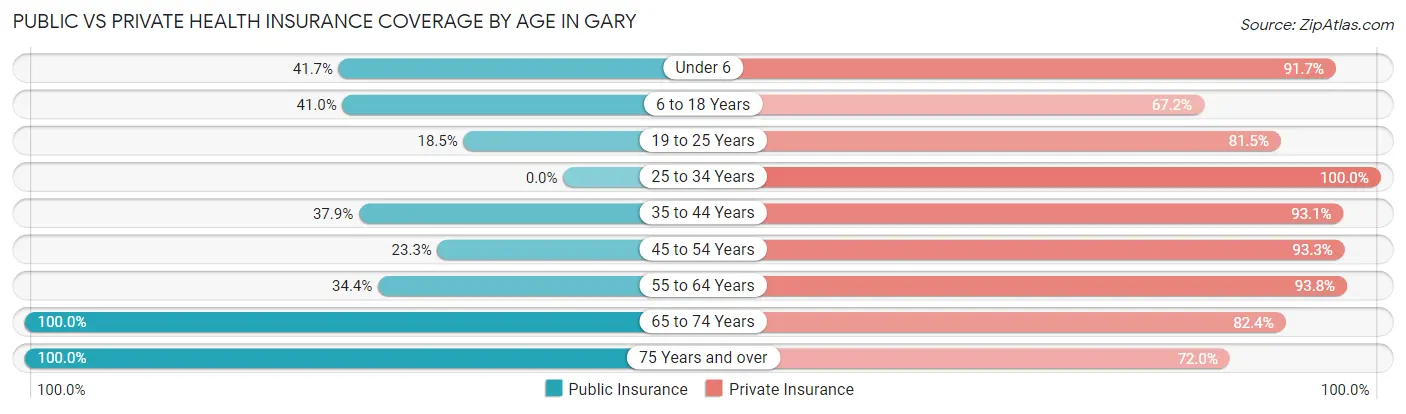
| Age Bracket | Public Insurance | Private Insurance |
| Under 6 | 10 (41.7%) | 22 (91.7%) |
| 6 to 18 Years | 25 (41.0%) | 41 (67.2%) |
| 19 to 25 Years | 5 (18.5%) | 22 (81.5%) |
| 25 to 34 Years | 0 (0.0%) | 32 (100.0%) |
| 35 to 44 Years | 11 (37.9%) | 27 (93.1%) |
| 45 to 54 Years | 7 (23.3%) | 28 (93.3%) |
| 55 to 64 Years | 11 (34.4%) | 30 (93.8%) |
| 65 to 74 Years | 17 (100.0%) | 14 (82.4%) |
| 75 Years and over | 25 (100.0%) | 18 (72.0%) |
| Total | 111 (40.1%) | 234 (84.5%) |
Disability Status by Sex by Age in Gary
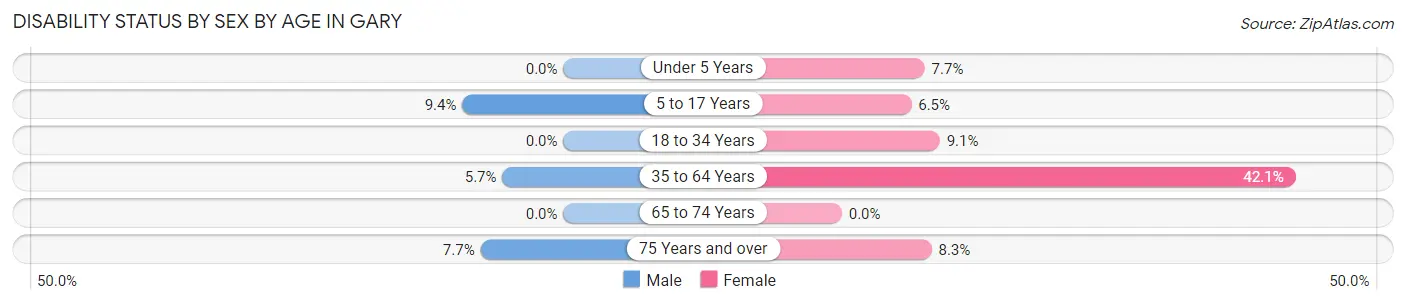
| Age Bracket | Male | Female |
| Under 5 Years | 0 (0.0%) | 1 (7.7%) |
| 5 to 17 Years | 3 (9.4%) | 2 (6.5%) |
| 18 to 34 Years | 0 (0.0%) | 3 (9.1%) |
| 35 to 64 Years | 3 (5.7%) | 16 (42.1%) |
| 65 to 74 Years | 0 (0.0%) | 0 (0.0%) |
| 75 Years and over | 1 (7.7%) | 1 (8.3%) |
Disability Class by Sex by Age in Gary
Disability Class: Hearing Difficulty
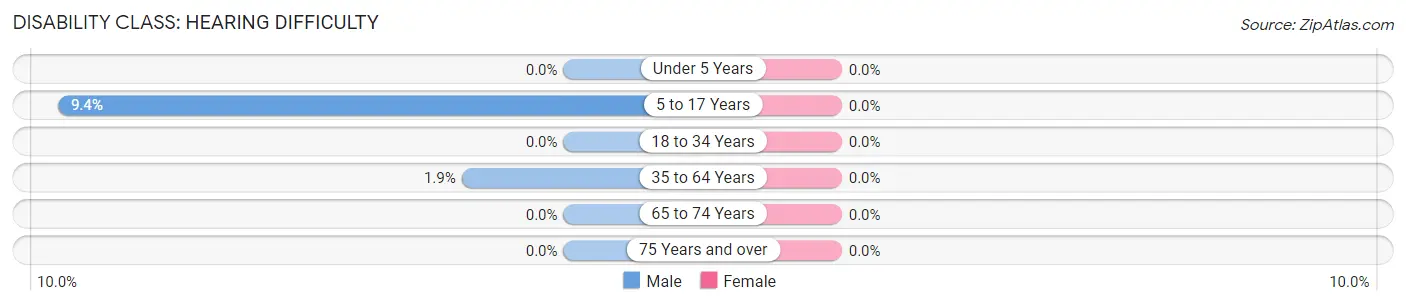
| Age Bracket | Male | Female |
| Under 5 Years | 0 (0.0%) | 0 (0.0%) |
| 5 to 17 Years | 3 (9.4%) | 0 (0.0%) |
| 18 to 34 Years | 0 (0.0%) | 0 (0.0%) |
| 35 to 64 Years | 1 (1.9%) | 0 (0.0%) |
| 65 to 74 Years | 0 (0.0%) | 0 (0.0%) |
| 75 Years and over | 0 (0.0%) | 0 (0.0%) |
Disability Class: Vision Difficulty
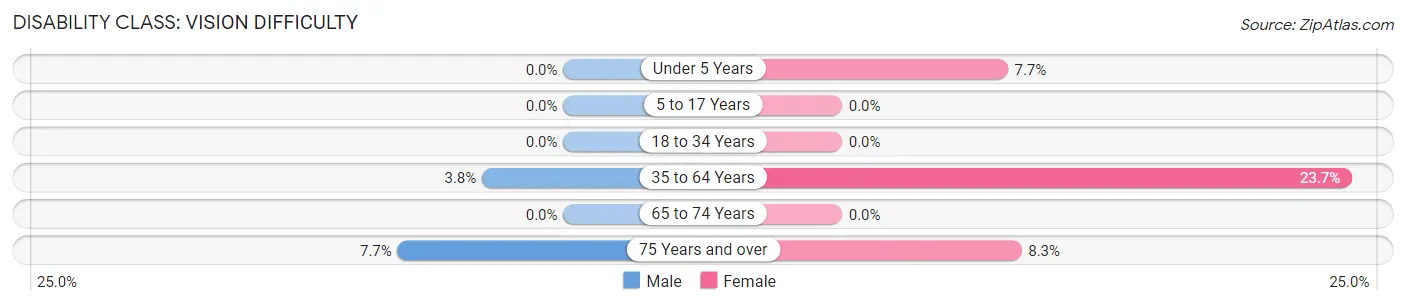
| Age Bracket | Male | Female |
| Under 5 Years | 0 (0.0%) | 1 (7.7%) |
| 5 to 17 Years | 0 (0.0%) | 0 (0.0%) |
| 18 to 34 Years | 0 (0.0%) | 0 (0.0%) |
| 35 to 64 Years | 2 (3.8%) | 9 (23.7%) |
| 65 to 74 Years | 0 (0.0%) | 0 (0.0%) |
| 75 Years and over | 1 (7.7%) | 1 (8.3%) |
Disability Class: Cognitive Difficulty
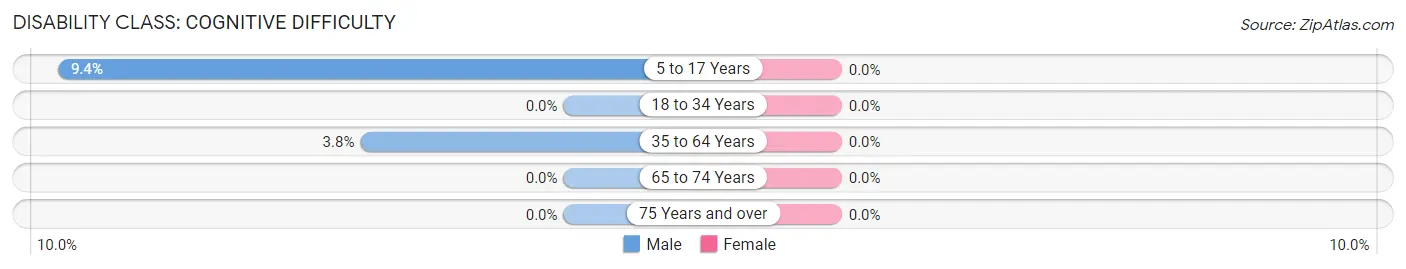
| Age Bracket | Male | Female |
| 5 to 17 Years | 3 (9.4%) | 0 (0.0%) |
| 18 to 34 Years | 0 (0.0%) | 0 (0.0%) |
| 35 to 64 Years | 2 (3.8%) | 0 (0.0%) |
| 65 to 74 Years | 0 (0.0%) | 0 (0.0%) |
| 75 Years and over | 0 (0.0%) | 0 (0.0%) |
Disability Class: Ambulatory Difficulty
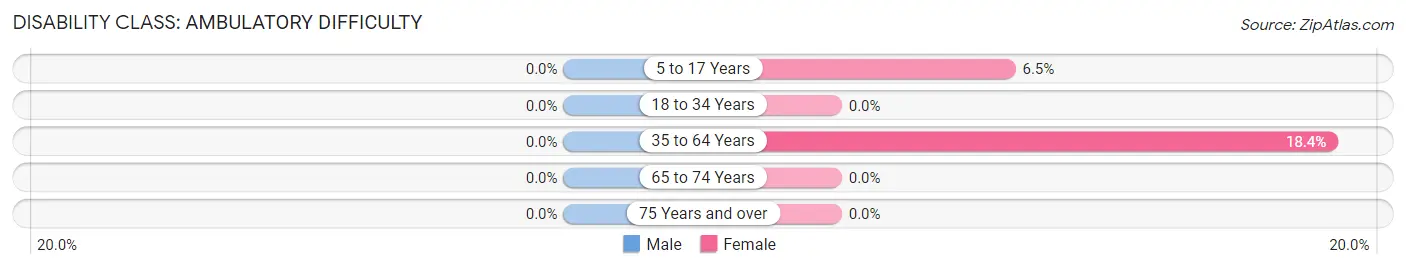
| Age Bracket | Male | Female |
| 5 to 17 Years | 0 (0.0%) | 2 (6.5%) |
| 18 to 34 Years | 0 (0.0%) | 0 (0.0%) |
| 35 to 64 Years | 0 (0.0%) | 7 (18.4%) |
| 65 to 74 Years | 0 (0.0%) | 0 (0.0%) |
| 75 Years and over | 0 (0.0%) | 0 (0.0%) |
Disability Class: Self-Care Difficulty
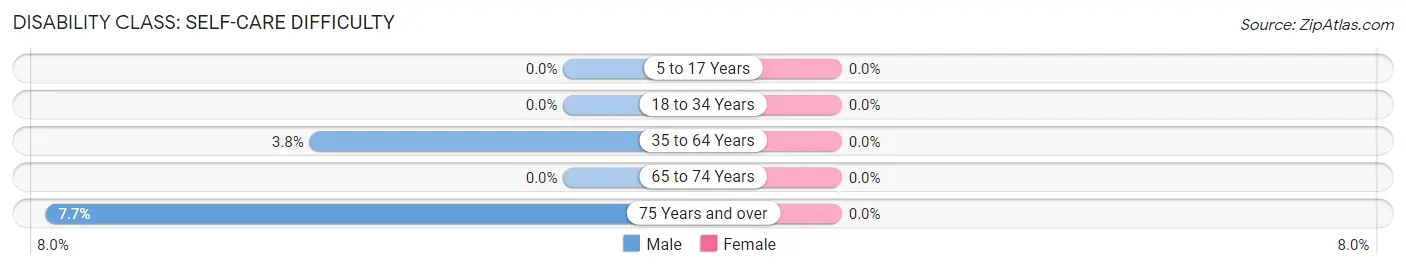
| Age Bracket | Male | Female |
| 5 to 17 Years | 0 (0.0%) | 0 (0.0%) |
| 18 to 34 Years | 0 (0.0%) | 0 (0.0%) |
| 35 to 64 Years | 2 (3.8%) | 0 (0.0%) |
| 65 to 74 Years | 0 (0.0%) | 0 (0.0%) |
| 75 Years and over | 1 (7.7%) | 0 (0.0%) |
Technology Access in Gary
Computing Device Access in Gary
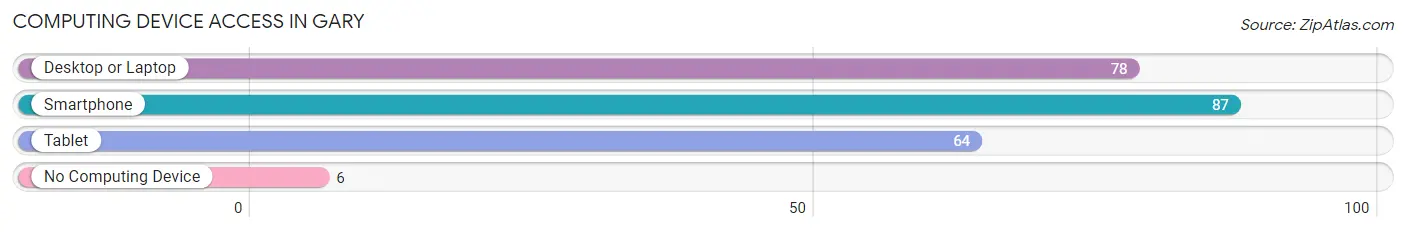
| Device Type | # Households | % Households |
| Desktop or Laptop | 78 | 78.8% |
| Smartphone | 87 | 87.9% |
| Tablet | 64 | 64.6% |
| No Computing Device | 6 | 6.1% |
| Total | 99 | 100.0% |
Internet Access in Gary
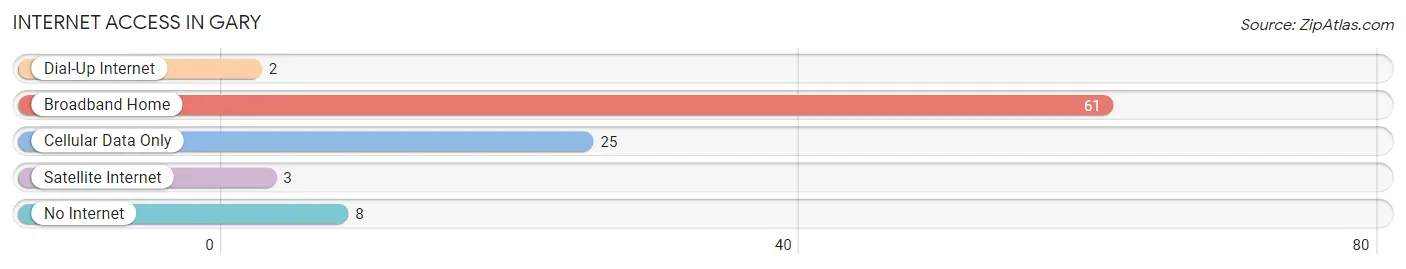
| Internet Type | # Households | % Households |
| Dial-Up Internet | 2 | 2.0% |
| Broadband Home | 61 | 61.6% |
| Cellular Data Only | 25 | 25.3% |
| Satellite Internet | 3 | 3.0% |
| No Internet | 8 | 8.1% |
| Total | 99 | 100.0% |
Gary Summary
Gary, Minnesota is a small city located in the northwest corner of the state, near the Canadian border. It is the county seat of Lake of the Woods County and is home to a population of just over 1,000 people. The city was founded in 1887 and was named after the first postmaster, Gary Johnson.
Geography
Gary is located in the northwest corner of Minnesota, near the Canadian border. It is situated on the western shore of Lake of the Woods, which is the largest lake in Minnesota. The city is surrounded by forests and lakes, and is home to a variety of wildlife. The city is located in a region known as the “North Woods”, which is characterized by its rugged terrain and dense forests.
The city is located at an elevation of 1,072 feet above sea level. The climate in Gary is classified as humid continental, with cold winters and warm summers. The average annual temperature is 37.2 degrees Fahrenheit, and the average annual precipitation is 28.3 inches.
History
Gary was founded in 1887 by Gary Johnson, the first postmaster of the city. Johnson was a Swedish immigrant who had come to the United States in search of a better life. He chose the area because of its proximity to the Canadian border and its abundance of natural resources.
The city was originally a logging and lumber town, and the first sawmill was built in 1887. The city quickly grew and by the early 1900s, it had become a major hub for the lumber industry. The city was also home to a variety of other businesses, including a hotel, a bank, a newspaper, and a variety of stores.
In the early 1900s, the city was also home to a large Finnish population. The Finnish immigrants brought with them their culture and traditions, which are still evident in the city today.
Economy
Gary’s economy is largely based on tourism and the lumber industry. The city is home to a variety of tourist attractions, including the Lake of the Woods Museum, the Gary Historical Society, and the Gary Lumber Company. The city is also home to a variety of outdoor activities, such as fishing, hunting, and camping.
The lumber industry is still a major part of the city’s economy. The Gary Lumber Company is the largest employer in the city, and it produces a variety of wood products, including lumber, plywood, and veneer.
Demographics
As of the 2010 census, the population of Gary was 1,072. The racial makeup of the city was 97.2% White, 0.7% Native American, 0.3% Asian, 0.2% from other races, and 1.6% from two or more races. The median household income was $37,917, and the median family income was $45,625.
The population of Gary is largely made up of people of Scandinavian descent. The city is also home to a large Finnish population, and the city celebrates its Finnish heritage with a variety of festivals and events.
Conclusion
Gary, Minnesota is a small city located in the northwest corner of the state, near the Canadian border. It is the county seat of Lake of the Woods County and is home to a population of just over 1,000 people. The city was founded in 1887 and was named after the first postmaster, Gary Johnson. The city is surrounded by forests and lakes, and is home to a variety of wildlife. The economy of Gary is largely based on tourism and the lumber industry, and the city is home to a variety of tourist attractions and outdoor activities. The population of Gary is largely made up of people of Scandinavian descent, and the city celebrates its Finnish heritage with a variety of festivals and events.
Common Questions
What is Per Capita Income in Gary?
Per Capita income in Gary is $28,553.
What is the Median Family Income in Gary?
Median Family Income in Gary is $90,156.
What is the Median Household income in Gary?
Median Household Income in Gary is $73,750.
What is Income or Wage Gap in Gary?
Income or Wage Gap in Gary is 2.1%.
Women in Gary earn 97.9 cents for every dollar earned by a man.
What is Inequality or Gini Index in Gary?
Inequality or Gini Index in Gary is 0.29.
What is the Total Population of Gary?
Total Population of Gary is 277.
What is the Total Male Population of Gary?
Total Male Population of Gary is 141.
What is the Total Female Population of Gary?
Total Female Population of Gary is 136.
What is the Ratio of Males per 100 Females in Gary?
There are 103.68 Males per 100 Females in Gary.
What is the Ratio of Females per 100 Males in Gary?
There are 96.45 Females per 100 Males in Gary.
What is the Median Population Age in Gary?
Median Population Age in Gary is 30.5 Years.
What is the Average Family Size in Gary
Average Family Size in Gary is 3.1 People.
What is the Average Household Size in Gary
Average Household Size in Gary is 2.8 People.
How Large is the Labor Force in Gary?
There are 152 People in the Labor Forcein in Gary.
What is the Percentage of People in the Labor Force in Gary?
71.7% of People are in the Labor Force in Gary.
What is the Unemployment Rate in Gary?
Unemployment Rate in Gary is 2.0%.