Zip Codes with the Highest Percentage of Population Employed in Legal Services & Support in Burnsville, MN
RELATED REPORTS & OPTIONS
Legal Services & Support
Burnsville
Compare Zip Codes
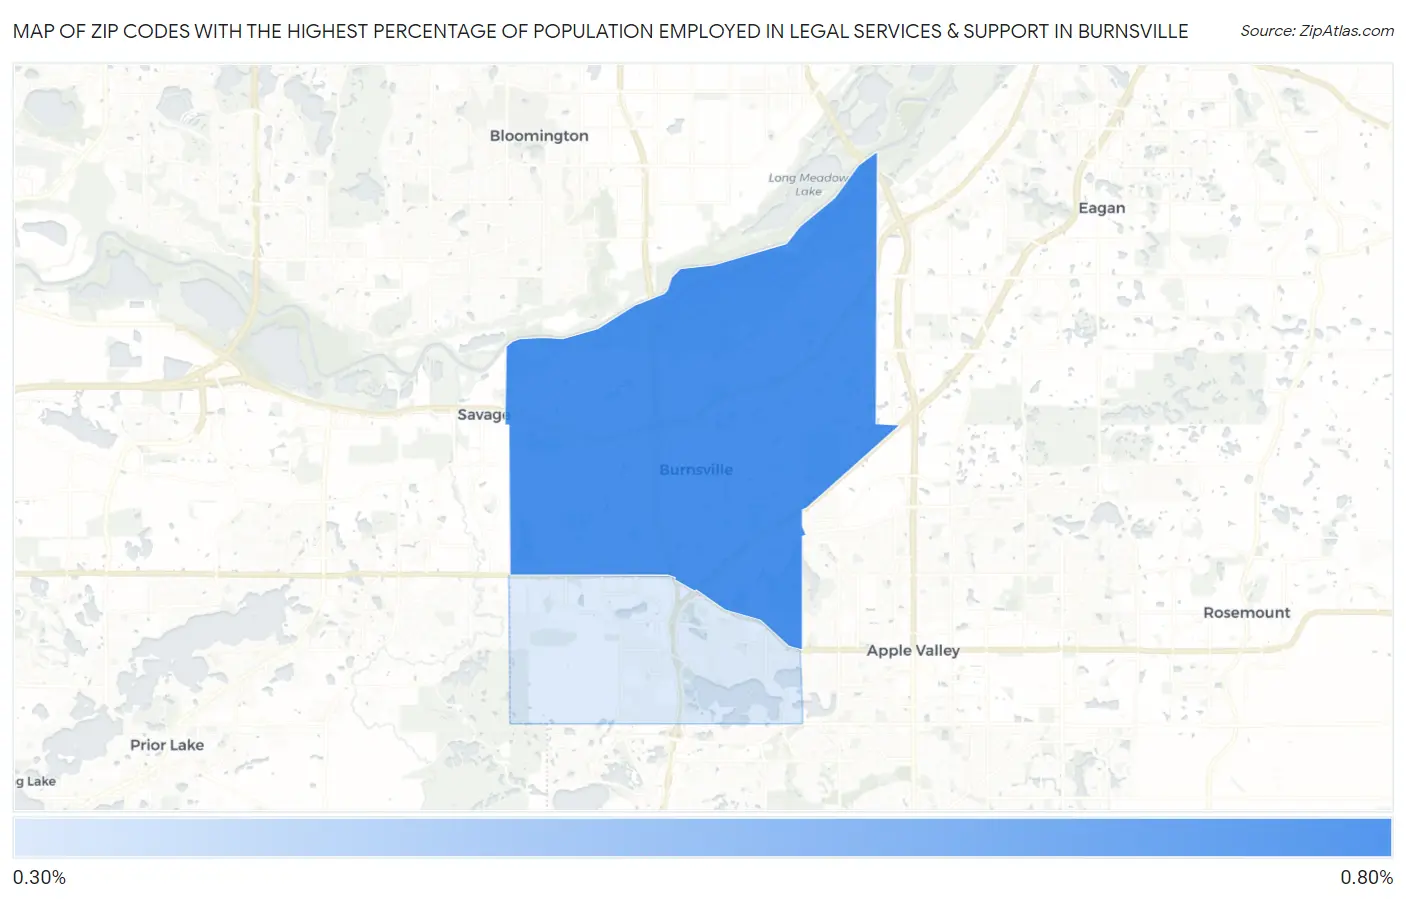
Map of Zip Codes with the Highest Percentage of Population Employed in Legal Services & Support in Burnsville
0.39%
0.80%
Zip Codes with the Highest Percentage of Population Employed in Legal Services & Support in Burnsville, MN
| Zip Code | % Employed | vs State | vs National | |
| 1. | 55337 | 0.80% | 1.0%(-0.232)#204 | 1.2%(-0.384)#9,451 |
| 2. | 55306 | 0.39% | 1.0%(-0.638)#361 | 1.2%(-0.790)#13,907 |
1
Common Questions
What are the Top Zip Codes with the Highest Percentage of Population Employed in Legal Services & Support in Burnsville, MN?
Top Zip Codes with the Highest Percentage of Population Employed in Legal Services & Support in Burnsville, MN are:
What zip code has the Highest Percentage of Population Employed in Legal Services & Support in Burnsville, MN?
55337 has the Highest Percentage of Population Employed in Legal Services & Support in Burnsville, MN with 0.80%.
What is the Percentage of Population Employed in Legal Services & Support in Burnsville, MN?
Percentage of Population Employed in Legal Services & Support in Burnsville is 0.69%.
What is the Percentage of Population Employed in Legal Services & Support in Minnesota?
Percentage of Population Employed in Legal Services & Support in Minnesota is 1.0%.
What is the Percentage of Population Employed in Legal Services & Support in the United States?
Percentage of Population Employed in Legal Services & Support in the United States is 1.2%.