Chickamaw Beach, MN Map & Demographics
Chickamaw Beach Map
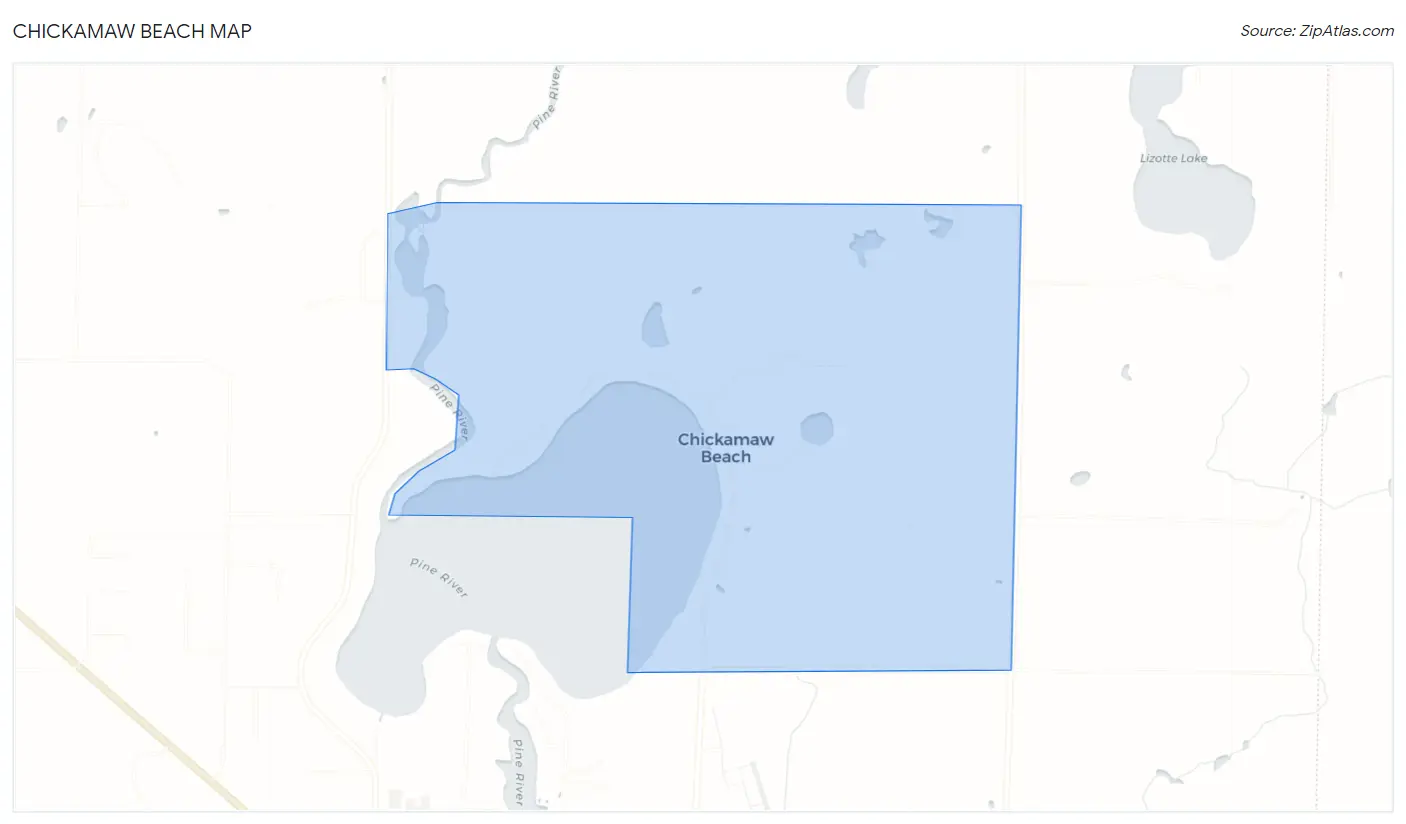
Chickamaw Beach Overview
$34,760
PER CAPITA INCOME
$112,727
AVG FAMILY INCOME
$78,438
AVG HOUSEHOLD INCOME
0.30
INEQUALITY / GINI INDEX
214
TOTAL POPULATION
107
MALE POPULATION
107
FEMALE POPULATION
100.00
MALES / 100 FEMALES
100.00
FEMALES / 100 MALES
36.5
MEDIAN AGE
3.3
AVG FAMILY SIZE
2.7
AVG HOUSEHOLD SIZE
86
LABOR FORCE [ PEOPLE ]
61.9%
PERCENT IN LABOR FORCE
2.3%
UNEMPLOYMENT RATE
Income in Chickamaw Beach
Income Overview in Chickamaw Beach
Per Capita Income in Chickamaw Beach is $34,760, while median incomes of families and households are $112,727 and $78,438 respectively.
| Characteristic | Number | Measure |
| Per Capita Income | 214 | $34,760 |
| Median Family Income | 56 | $112,727 |
| Mean Family Income | 56 | $102,654 |
| Median Household Income | 79 | $78,438 |
| Mean Household Income | 79 | $89,948 |
| Income Deficit | 56 | $0 |
| Wage / Income Gap (%) | 214 | 0.00% |
| Wage / Income Gap ($) | 214 | 100.00¢ per $1 |
| Gini / Inequality Index | 214 | 0.30 |
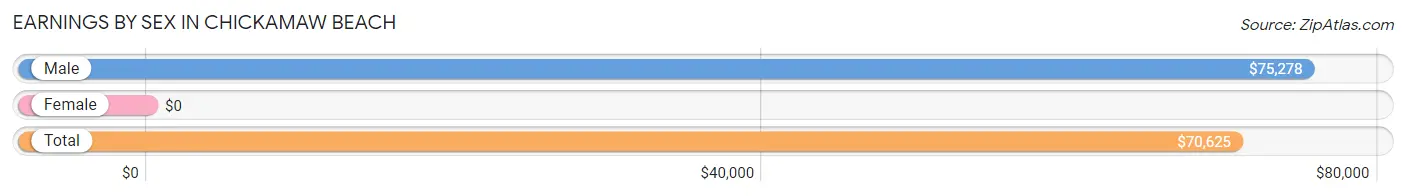
Earnings by Sex in Chickamaw Beach
| Sex | Number | Average Earnings |
| Male | 54 (59.3%) | $75,278 |
| Female | 37 (40.7%) | $0 |
| Total | 91 (100.0%) | $70,625 |
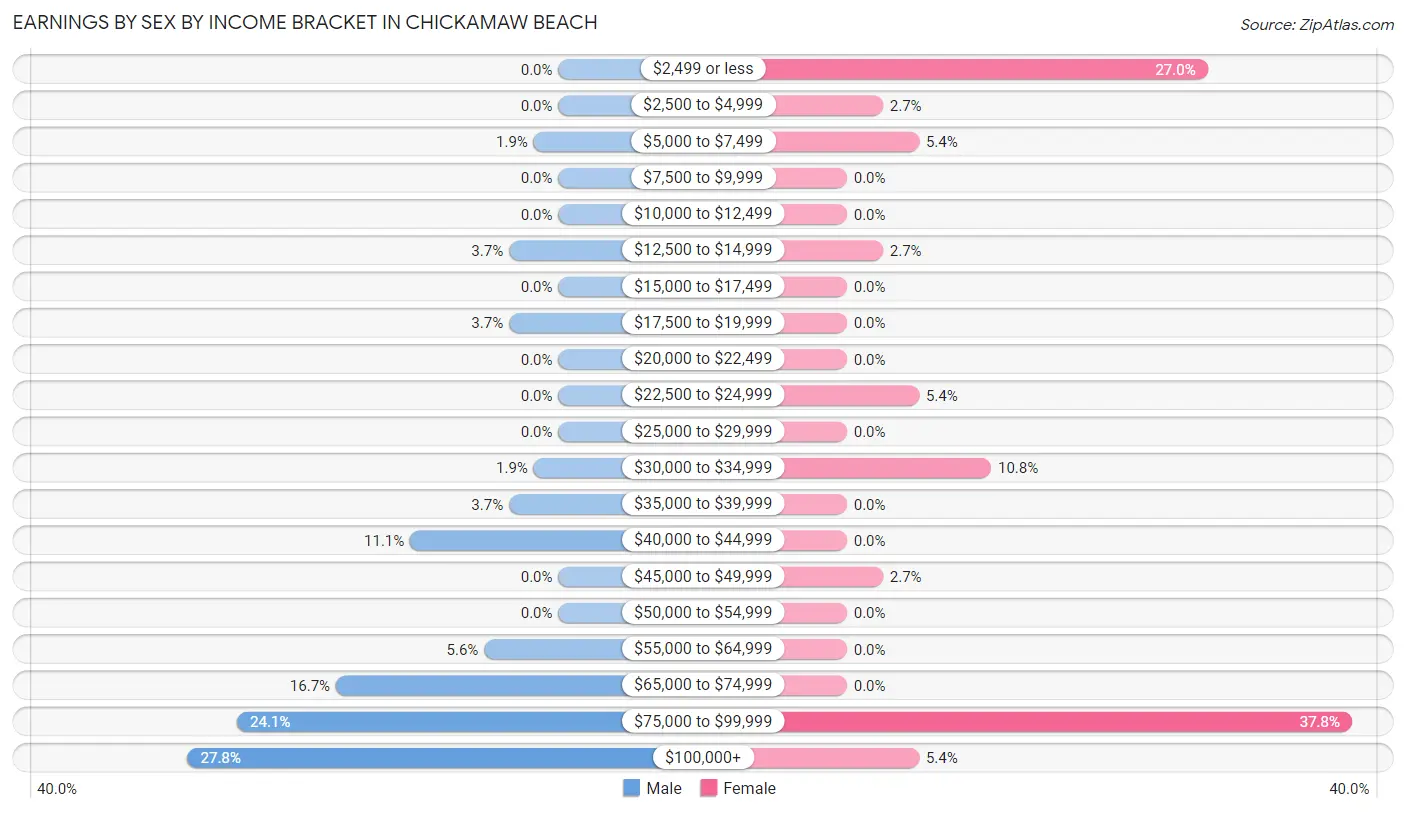
Earnings by Sex by Income Bracket in Chickamaw Beach
The most common earnings brackets in Chickamaw Beach are $100,000+ for men (15 | 27.8%) and $75,000 to $99,999 for women (14 | 37.8%).
| Income | Male | Female |
| $2,499 or less | 0 (0.0%) | 10 (27.0%) |
| $2,500 to $4,999 | 0 (0.0%) | 1 (2.7%) |
| $5,000 to $7,499 | 1 (1.8%) | 2 (5.4%) |
| $7,500 to $9,999 | 0 (0.0%) | 0 (0.0%) |
| $10,000 to $12,499 | 0 (0.0%) | 0 (0.0%) |
| $12,500 to $14,999 | 2 (3.7%) | 1 (2.7%) |
| $15,000 to $17,499 | 0 (0.0%) | 0 (0.0%) |
| $17,500 to $19,999 | 2 (3.7%) | 0 (0.0%) |
| $20,000 to $22,499 | 0 (0.0%) | 0 (0.0%) |
| $22,500 to $24,999 | 0 (0.0%) | 2 (5.4%) |
| $25,000 to $29,999 | 0 (0.0%) | 0 (0.0%) |
| $30,000 to $34,999 | 1 (1.8%) | 4 (10.8%) |
| $35,000 to $39,999 | 2 (3.7%) | 0 (0.0%) |
| $40,000 to $44,999 | 6 (11.1%) | 0 (0.0%) |
| $45,000 to $49,999 | 0 (0.0%) | 1 (2.7%) |
| $50,000 to $54,999 | 0 (0.0%) | 0 (0.0%) |
| $55,000 to $64,999 | 3 (5.6%) | 0 (0.0%) |
| $65,000 to $74,999 | 9 (16.7%) | 0 (0.0%) |
| $75,000 to $99,999 | 13 (24.1%) | 14 (37.8%) |
| $100,000+ | 15 (27.8%) | 2 (5.4%) |
| Total | 54 (100.0%) | 37 (100.0%) |
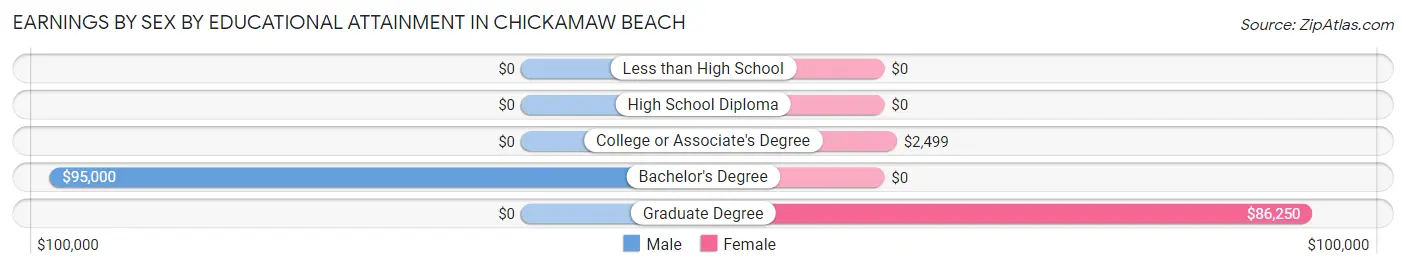
Earnings by Sex by Educational Attainment in Chickamaw Beach
| Educational Attainment | Male Income | Female Income |
| Less than High School | - | - |
| High School Diploma | - | - |
| College or Associate's Degree | - | - |
| Bachelor's Degree | $95,000 | $0 |
| Graduate Degree | - | - |
| Total | $75,278 | $0 |
Family Income in Chickamaw Beach
Family Income Brackets in Chickamaw Beach
According to the Chickamaw Beach family income data, there are 16 families falling into the $100,000 to $149,999 income range, which is the most common income bracket and makes up 28.6% of all families.
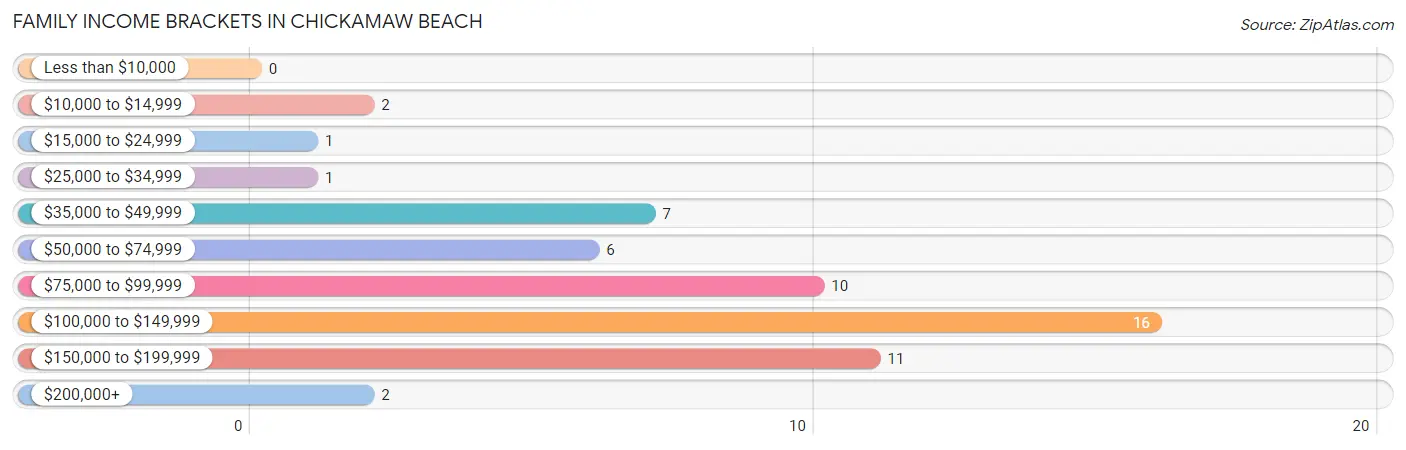
| Income Bracket | # Families | % Families |
| Less than $10,000 | 0 | 0.0% |
| $10,000 to $14,999 | 2 | 3.6% |
| $15,000 to $24,999 | 1 | 1.8% |
| $25,000 to $34,999 | 1 | 1.8% |
| $35,000 to $49,999 | 7 | 12.5% |
| $50,000 to $74,999 | 6 | 10.7% |
| $75,000 to $99,999 | 10 | 17.9% |
| $100,000 to $149,999 | 16 | 28.6% |
| $150,000 to $199,999 | 11 | 19.6% |
| $200,000+ | 2 | 3.6% |
Family Income by Famaliy Size in Chickamaw Beach
6-person families (13 | 23.2%) account for the highest median family income in Chickamaw Beach with $113,875 per family, while 2-person families (34 | 60.7%) have the highest median income of $41,875 per family member.
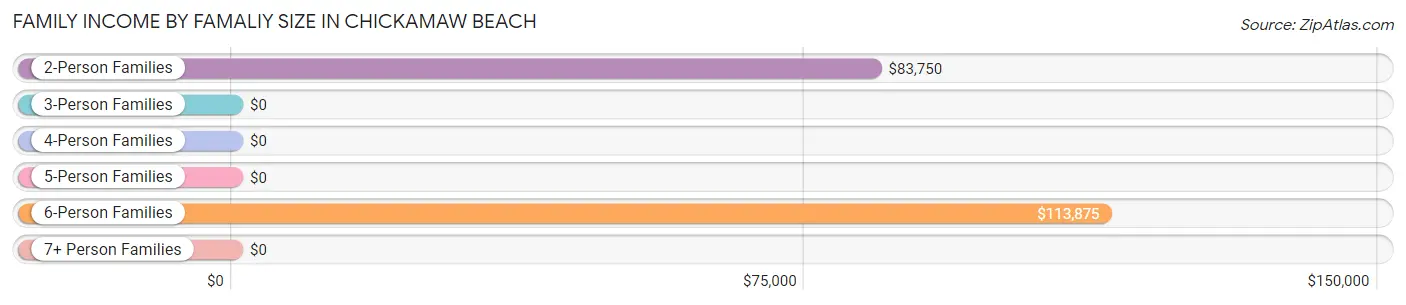
| Income Bracket | # Families | Median Income |
| 2-Person Families | 34 (60.7%) | $83,750 |
| 3-Person Families | 1 (1.8%) | $0 |
| 4-Person Families | 5 (8.9%) | $0 |
| 5-Person Families | 2 (3.6%) | $0 |
| 6-Person Families | 13 (23.2%) | $113,875 |
| 7+ Person Families | 1 (1.8%) | $0 |
| Total | 56 (100.0%) | $112,727 |
Family Income by Number of Earners in Chickamaw Beach
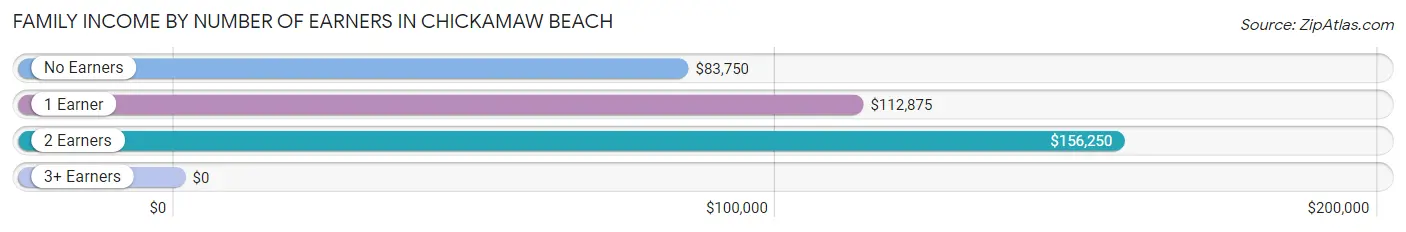
| Number of Earners | # Families | Median Income |
| No Earners | 14 (25.0%) | $83,750 |
| 1 Earner | 17 (30.4%) | $112,875 |
| 2 Earners | 24 (42.9%) | $156,250 |
| 3+ Earners | 1 (1.8%) | $0 |
| Total | 56 (100.0%) | $112,727 |
Household Income in Chickamaw Beach
Household Income Brackets in Chickamaw Beach
With 17 households falling in the category, the $100,000 to $149,999 income range is the most frequent in Chickamaw Beach, accounting for 21.5% of all households.
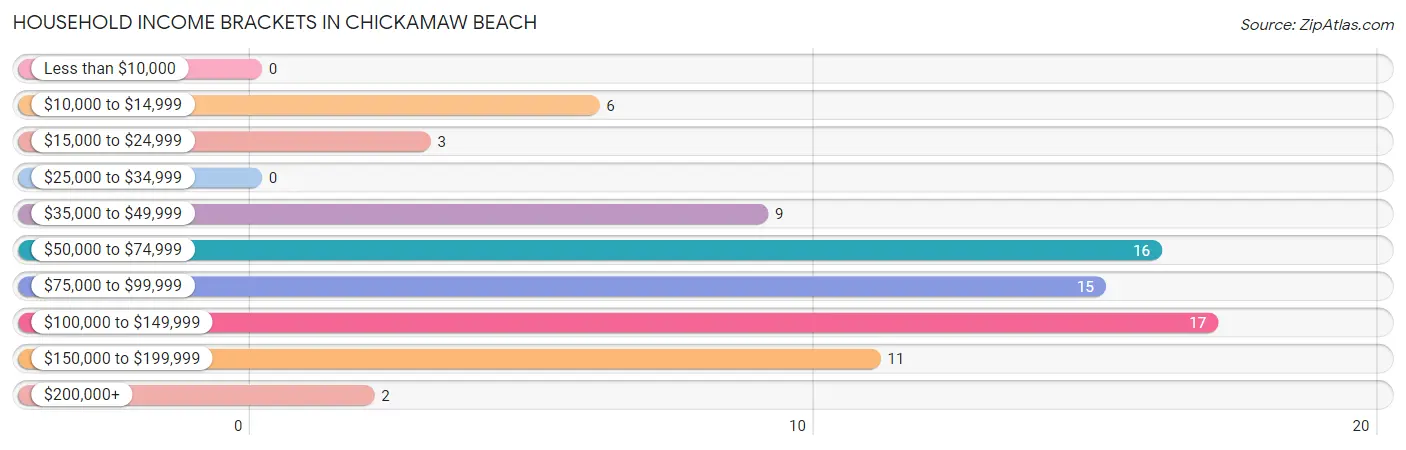
| Income Bracket | # Households | % Households |
| Less than $10,000 | 0 | 0.0% |
| $10,000 to $14,999 | 6 | 7.6% |
| $15,000 to $24,999 | 3 | 3.8% |
| $25,000 to $34,999 | 0 | 0.0% |
| $35,000 to $49,999 | 9 | 11.4% |
| $50,000 to $74,999 | 16 | 20.3% |
| $75,000 to $99,999 | 15 | 19.0% |
| $100,000 to $149,999 | 17 | 21.5% |
| $150,000 to $199,999 | 11 | 13.9% |
| $200,000+ | 2 | 2.5% |
Household Income by Householder Age in Chickamaw Beach
The median household income in Chickamaw Beach is $78,438, with the highest median household income of $96,250 found in the 25 to 44 years age bracket for the primary householder. A total of 28 households (35.4%) fall into this category.
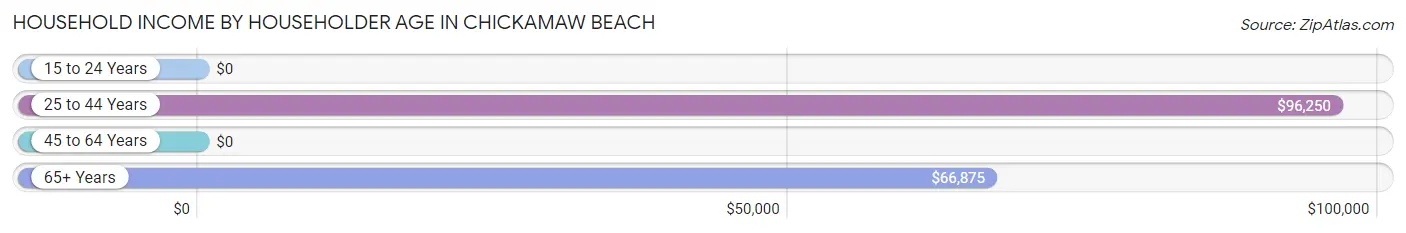
| Income Bracket | # Households | Median Income |
| 15 to 24 Years | 0 (0.0%) | $0 |
| 25 to 44 Years | 28 (35.4%) | $96,250 |
| 45 to 64 Years | 26 (32.9%) | $0 |
| 65+ Years | 25 (31.7%) | $66,875 |
| Total | 79 (100.0%) | $78,438 |
Poverty in Chickamaw Beach
Income Below Poverty by Sex and Age in Chickamaw Beach
With 1.9% poverty level for males and 5.6% for females among the residents of Chickamaw Beach, 35 to 44 year old males and 18 to 24 year old females are the most vulnerable to poverty, with 2 males (14.3%) and 2 females (100.0%) in their respective age groups living below the poverty level.
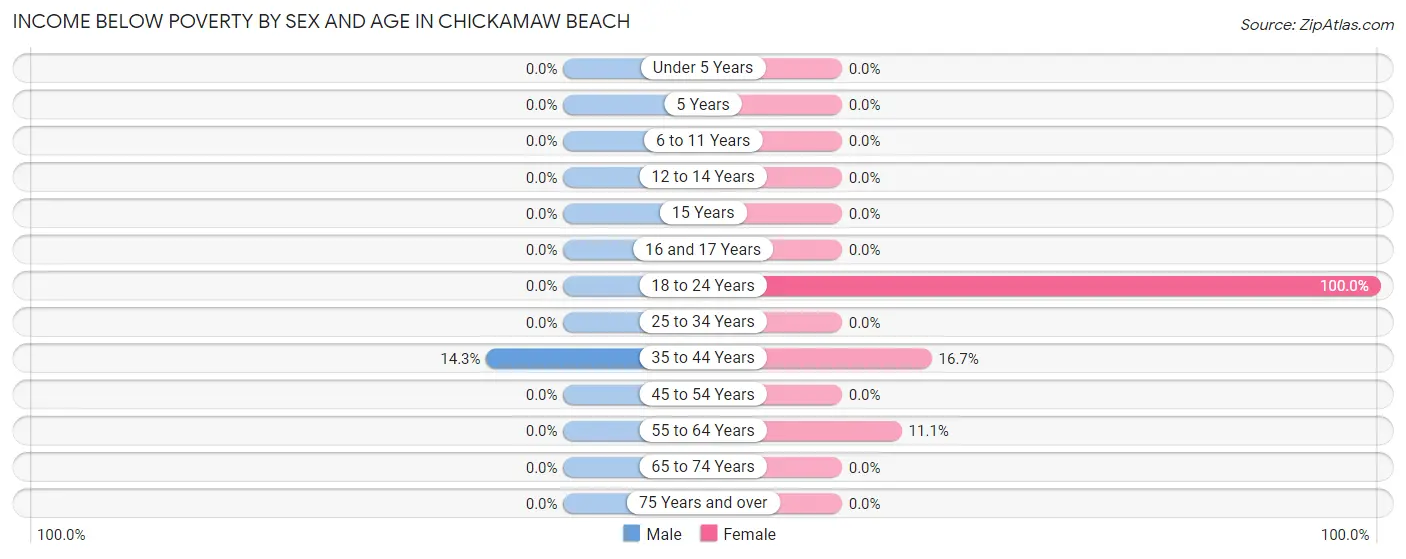
| Age Bracket | Male | Female |
| Under 5 Years | 0 (0.0%) | 0 (0.0%) |
| 5 Years | 0 (0.0%) | 0 (0.0%) |
| 6 to 11 Years | 0 (0.0%) | 0 (0.0%) |
| 12 to 14 Years | 0 (0.0%) | 0 (0.0%) |
| 15 Years | 0 (0.0%) | 0 (0.0%) |
| 16 and 17 Years | 0 (0.0%) | 0 (0.0%) |
| 18 to 24 Years | 0 (0.0%) | 2 (100.0%) |
| 25 to 34 Years | 0 (0.0%) | 0 (0.0%) |
| 35 to 44 Years | 2 (14.3%) | 2 (16.7%) |
| 45 to 54 Years | 0 (0.0%) | 0 (0.0%) |
| 55 to 64 Years | 0 (0.0%) | 2 (11.1%) |
| 65 to 74 Years | 0 (0.0%) | 0 (0.0%) |
| 75 Years and over | 0 (0.0%) | 0 (0.0%) |
| Total | 2 (1.9%) | 6 (5.6%) |
Income Above Poverty by Sex and Age in Chickamaw Beach
According to the poverty statistics in Chickamaw Beach, males aged under 5 years and females aged under 5 years are the age groups that are most secure financially, with 100.0% of males and 100.0% of females in these age groups living above the poverty line.
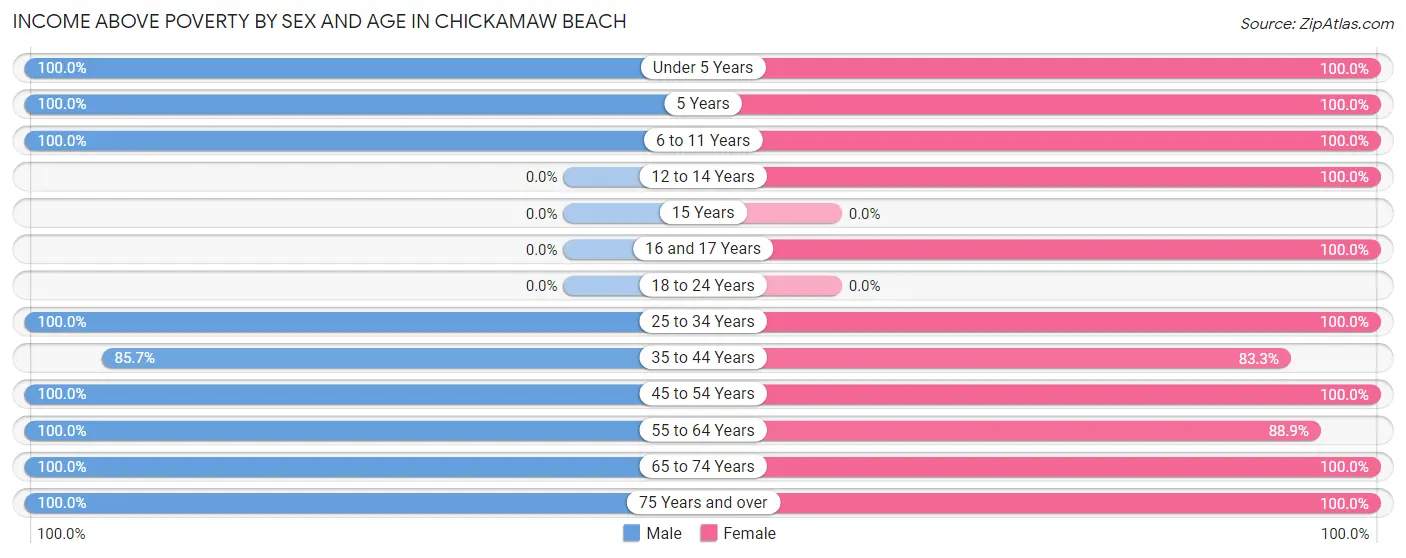
| Age Bracket | Male | Female |
| Under 5 Years | 9 (100.0%) | 28 (100.0%) |
| 5 Years | 1 (100.0%) | 2 (100.0%) |
| 6 to 11 Years | 22 (100.0%) | 10 (100.0%) |
| 12 to 14 Years | 0 (0.0%) | 3 (100.0%) |
| 15 Years | 0 (0.0%) | 0 (0.0%) |
| 16 and 17 Years | 0 (0.0%) | 1 (100.0%) |
| 18 to 24 Years | 0 (0.0%) | 0 (0.0%) |
| 25 to 34 Years | 16 (100.0%) | 12 (100.0%) |
| 35 to 44 Years | 12 (85.7%) | 10 (83.3%) |
| 45 to 54 Years | 9 (100.0%) | 2 (100.0%) |
| 55 to 64 Years | 16 (100.0%) | 16 (88.9%) |
| 65 to 74 Years | 14 (100.0%) | 7 (100.0%) |
| 75 Years and over | 6 (100.0%) | 10 (100.0%) |
| Total | 105 (98.1%) | 101 (94.4%) |
Income Below Poverty Among Married-Couple Families in Chickamaw Beach
The poverty statistics for married-couple families in Chickamaw Beach show that 3.9% or 2 of the total 51 families live below the poverty line. Families with no children have the highest poverty rate of 6.9%, comprising of 2 families. On the other hand, families with 1 or 2 children have the lowest poverty rate of 0.0%, which includes 0 families.
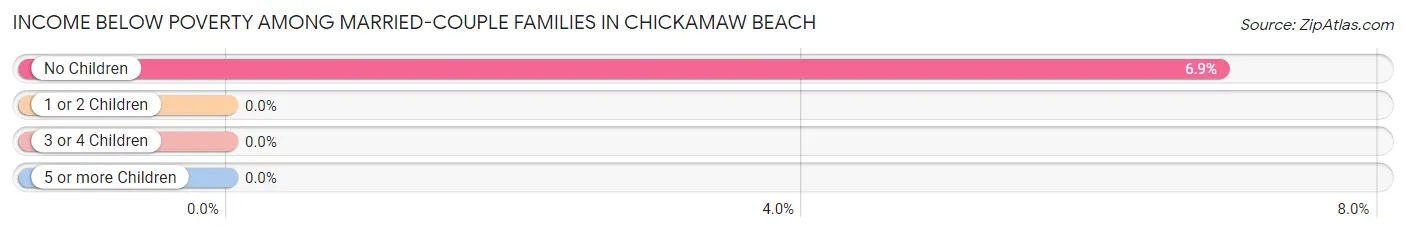
| Children | Above Poverty | Below Poverty |
| No Children | 27 (93.1%) | 2 (6.9%) |
| 1 or 2 Children | 6 (100.0%) | 0 (0.0%) |
| 3 or 4 Children | 16 (100.0%) | 0 (0.0%) |
| 5 or more Children | 0 (0.0%) | 0 (0.0%) |
| Total | 49 (96.1%) | 2 (3.9%) |
Income Below Poverty Among Single-Parent Households in Chickamaw Beach
| Children | Single Father | Single Mother |
| No Children | 0 (0.0%) | 0 (0.0%) |
| 1 or 2 Children | 0 (0.0%) | 0 (0.0%) |
| 3 or 4 Children | 0 (0.0%) | 0 (0.0%) |
| 5 or more Children | 0 (0.0%) | 0 (0.0%) |
| Total | 0 (0.0%) | 0 (0.0%) |
Income Below Poverty Among Married-Couple vs Single-Parent Households in Chickamaw Beach
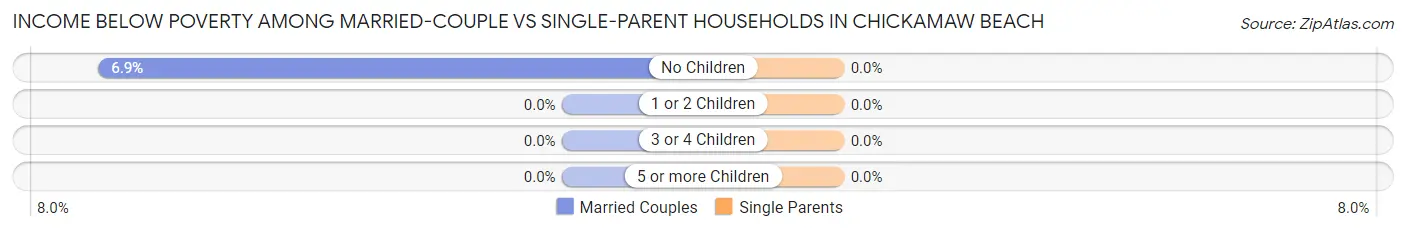
| Children | Married-Couple Families | Single-Parent Households |
| No Children | 2 (6.9%) | 0 (0.0%) |
| 1 or 2 Children | 0 (0.0%) | 0 (0.0%) |
| 3 or 4 Children | 0 (0.0%) | 0 (0.0%) |
| 5 or more Children | 0 (0.0%) | 0 (0.0%) |
| Total | 2 (3.9%) | 0 (0.0%) |
Race in Chickamaw Beach
The most populous races in Chickamaw Beach are White / Caucasian (203 | 94.9%), Two or more Races (6 | 2.8%), and Hispanic or Latino (5 | 2.3%).
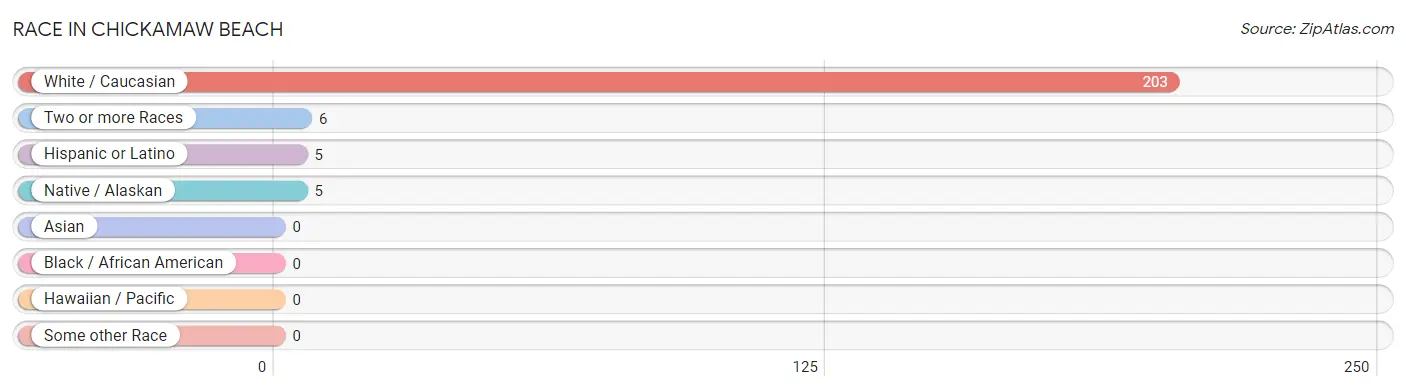
| Race | # Population | % Population |
| Asian | 0 | 0.0% |
| Black / African American | 0 | 0.0% |
| Hawaiian / Pacific | 0 | 0.0% |
| Hispanic or Latino | 5 | 2.3% |
| Native / Alaskan | 5 | 2.3% |
| White / Caucasian | 203 | 94.9% |
| Two or more Races | 6 | 2.8% |
| Some other Race | 0 | 0.0% |
| Total | 214 | 100.0% |
Ancestry in Chickamaw Beach
The most populous ancestries reported in Chickamaw Beach are German (96 | 44.9%), Norwegian (29 | 13.6%), American (27 | 12.6%), English (18 | 8.4%), and Polish (17 | 7.9%), together accounting for 87.4% of all Chickamaw Beach residents.
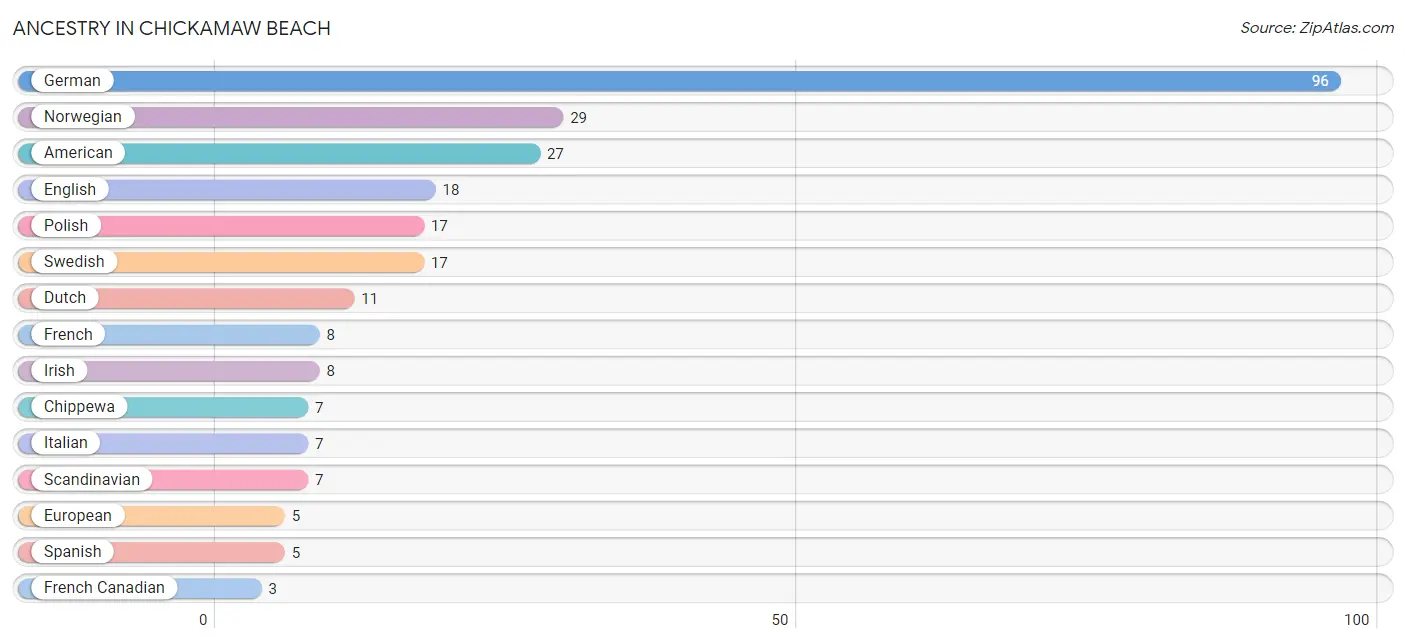
| Ancestry | # Population | % Population |
| American | 27 | 12.6% |
| Chippewa | 7 | 3.3% |
| Czech | 2 | 0.9% |
| Danish | 1 | 0.5% |
| Dutch | 11 | 5.1% |
| English | 18 | 8.4% |
| European | 5 | 2.3% |
| Finnish | 2 | 0.9% |
| French | 8 | 3.7% |
| French Canadian | 3 | 1.4% |
| German | 96 | 44.9% |
| Hungarian | 1 | 0.5% |
| Irish | 8 | 3.7% |
| Italian | 7 | 3.3% |
| Norwegian | 29 | 13.6% |
| Polish | 17 | 7.9% |
| Scandinavian | 7 | 3.3% |
| Scottish | 2 | 0.9% |
| Spanish | 5 | 2.3% |
| Swedish | 17 | 7.9% |
| Welsh | 3 | 1.4% | View All 21 Rows |
Immigrants in Chickamaw Beach

| Immigration Origin | # Population | % Population | View All 0 Rows |
Sex and Age in Chickamaw Beach
Sex and Age in Chickamaw Beach
The most populous age groups in Chickamaw Beach are 5 to 9 Years (22 | 20.6%) for men and Under 5 Years (28 | 26.2%) for women.
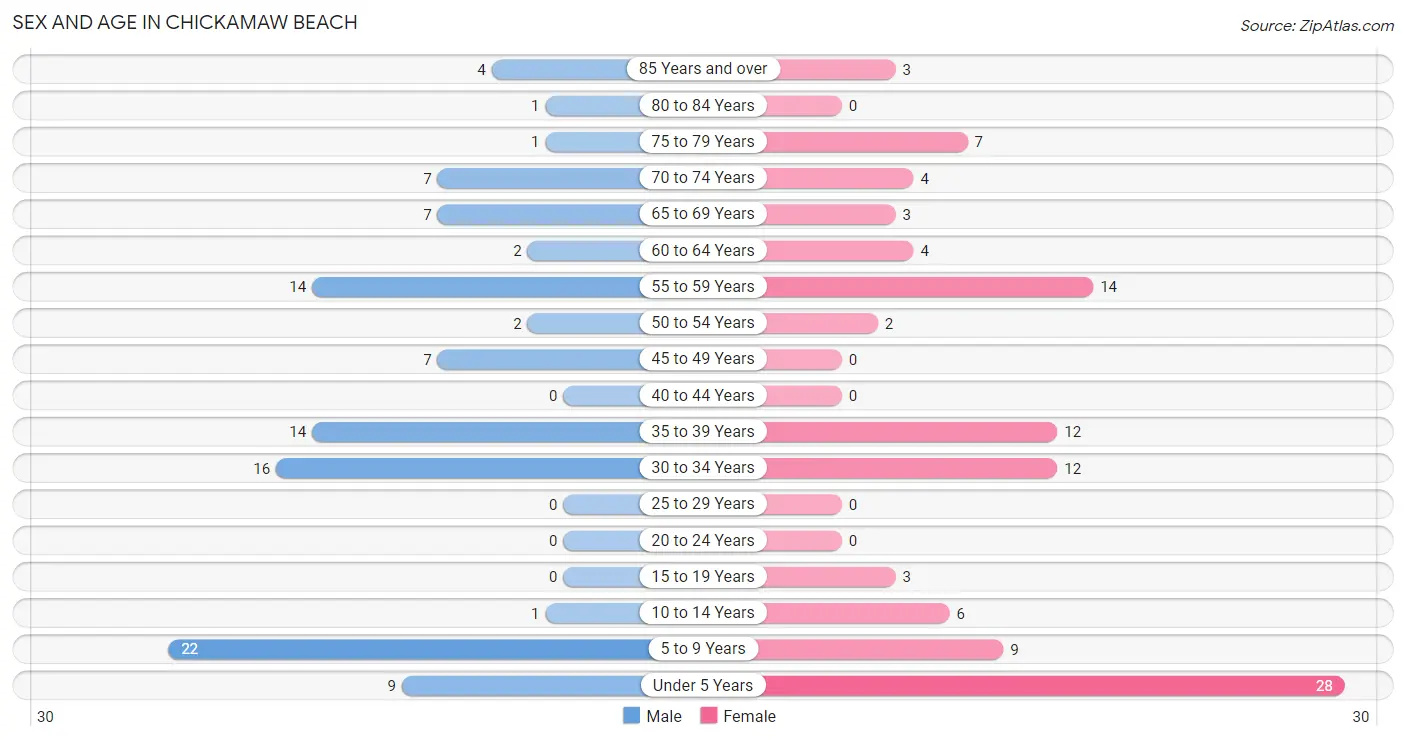
| Age Bracket | Male | Female |
| Under 5 Years | 9 (8.4%) | 28 (26.2%) |
| 5 to 9 Years | 22 (20.6%) | 9 (8.4%) |
| 10 to 14 Years | 1 (0.9%) | 6 (5.6%) |
| 15 to 19 Years | 0 (0.0%) | 3 (2.8%) |
| 20 to 24 Years | 0 (0.0%) | 0 (0.0%) |
| 25 to 29 Years | 0 (0.0%) | 0 (0.0%) |
| 30 to 34 Years | 16 (14.9%) | 12 (11.2%) |
| 35 to 39 Years | 14 (13.1%) | 12 (11.2%) |
| 40 to 44 Years | 0 (0.0%) | 0 (0.0%) |
| 45 to 49 Years | 7 (6.5%) | 0 (0.0%) |
| 50 to 54 Years | 2 (1.9%) | 2 (1.9%) |
| 55 to 59 Years | 14 (13.1%) | 14 (13.1%) |
| 60 to 64 Years | 2 (1.9%) | 4 (3.7%) |
| 65 to 69 Years | 7 (6.5%) | 3 (2.8%) |
| 70 to 74 Years | 7 (6.5%) | 4 (3.7%) |
| 75 to 79 Years | 1 (0.9%) | 7 (6.5%) |
| 80 to 84 Years | 1 (0.9%) | 0 (0.0%) |
| 85 Years and over | 4 (3.7%) | 3 (2.8%) |
| Total | 107 (100.0%) | 107 (100.0%) |
Families and Households in Chickamaw Beach
Median Family Size in Chickamaw Beach
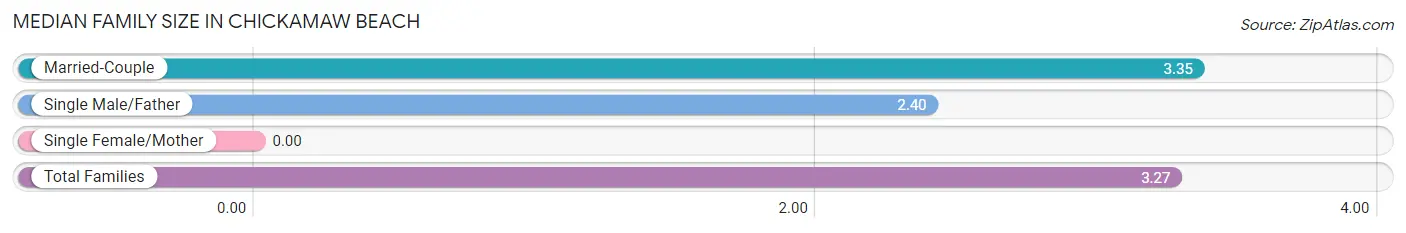
| Family Type | # Families | Family Size |
| Married-Couple | 51 (91.1%) | 3.35 |
| Single Male/Father | 5 (8.9%) | 2.40 |
| Single Female/Mother | 0 (0.0%) | - |
| Total Families | 56 (100.0%) | 3.27 |
Median Household Size in Chickamaw Beach
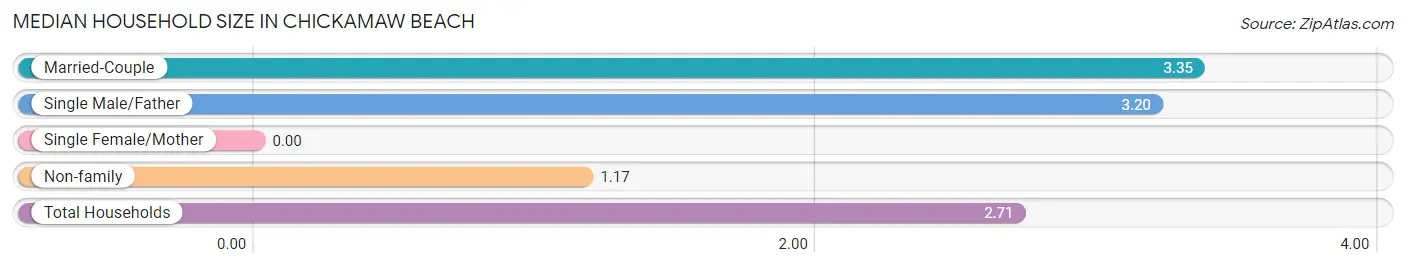
| Household Type | # Households | Household Size |
| Married-Couple | 51 (64.6%) | 3.35 |
| Single Male/Father | 5 (6.3%) | 3.20 |
| Single Female/Mother | 0 (0.0%) | - |
| Non-family | 23 (29.1%) | 1.17 |
| Total Households | 79 (100.0%) | 2.71 |
Household Size by Marriage Status in Chickamaw Beach
Out of a total of 79 households in Chickamaw Beach, 56 (70.9%) are family households, while 23 (29.1%) are nonfamily households. The most numerous type of family households are 2-person households, comprising 33, and the most common type of nonfamily households are 1-person households, comprising 19.
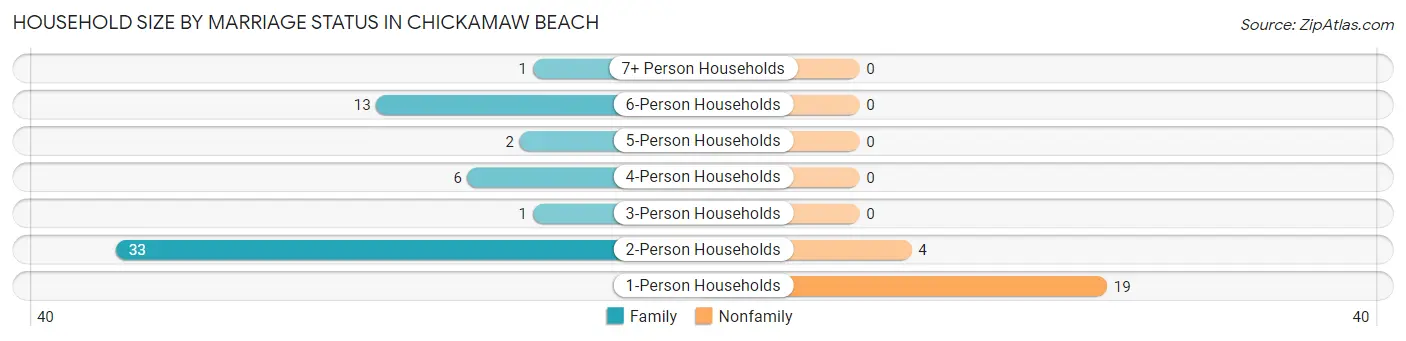
| Household Size | Family Households | Nonfamily Households |
| 1-Person Households | - | 19 (24.0%) |
| 2-Person Households | 33 (41.8%) | 4 (5.1%) |
| 3-Person Households | 1 (1.3%) | 0 (0.0%) |
| 4-Person Households | 6 (7.6%) | 0 (0.0%) |
| 5-Person Households | 2 (2.5%) | 0 (0.0%) |
| 6-Person Households | 13 (16.5%) | 0 (0.0%) |
| 7+ Person Households | 1 (1.3%) | 0 (0.0%) |
| Total | 56 (70.9%) | 23 (29.1%) |
Female Fertility in Chickamaw Beach
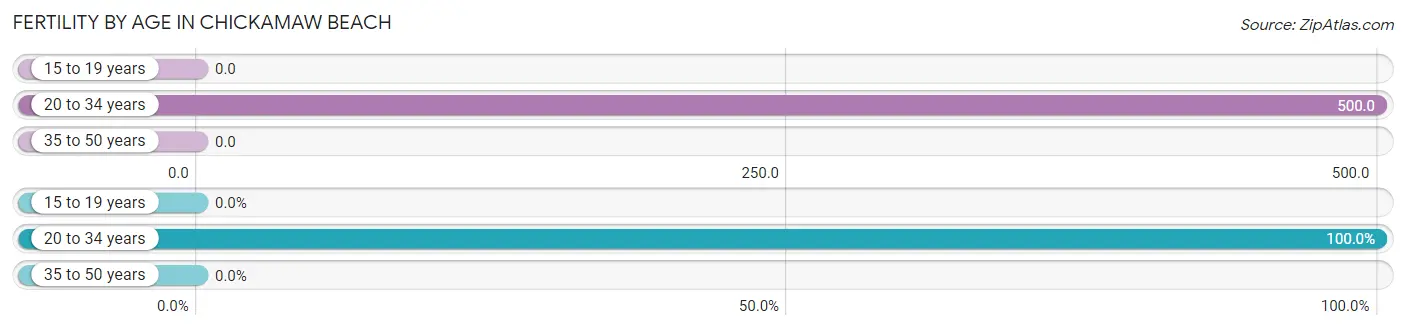
Fertility by Age in Chickamaw Beach
Average fertility rate in Chickamaw Beach is 222.0 births per 1,000 women. Women in the age bracket of 20 to 34 years have the highest fertility rate with 500.0 births per 1,000 women. Women in the age bracket of 20 to 34 years acount for 100.0% of all women with births.
| Age Bracket | Women with Births | Births / 1,000 Women |
| 15 to 19 years | 0 (0.0%) | 0.0 |
| 20 to 34 years | 6 (100.0%) | 500.0 |
| 35 to 50 years | 0 (0.0%) | 0.0 |
| Total | 6 (100.0%) | 222.0 |
Fertility by Age by Marriage Status in Chickamaw Beach
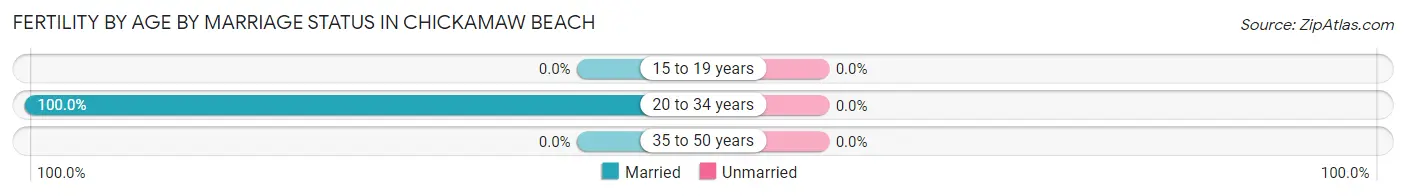
| Age Bracket | Married | Unmarried |
| 15 to 19 years | 0 (0.0%) | 0 (0.0%) |
| 20 to 34 years | 6 (100.0%) | 0 (0.0%) |
| 35 to 50 years | 0 (0.0%) | 0 (0.0%) |
| Total | 6 (100.0%) | 0 (0.0%) |
Fertility by Education in Chickamaw Beach
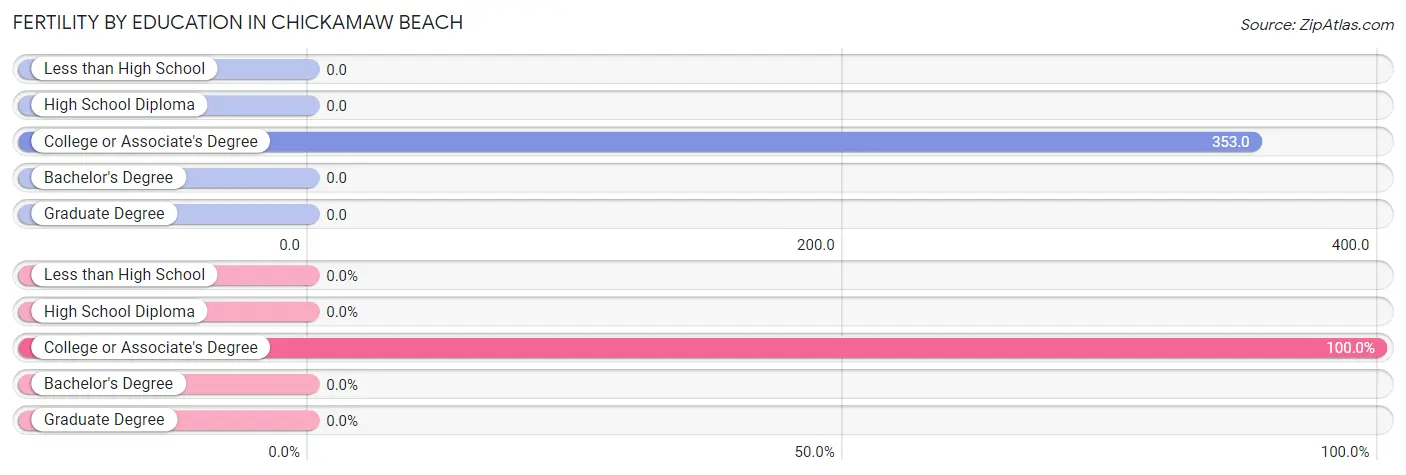
| Educational Attainment | Women with Births | Births / 1,000 Women |
| Less than High School | 0 (0.0%) | 0.0 |
| High School Diploma | 0 (0.0%) | 0.0 |
| College or Associate's Degree | 6 (100.0%) | 353.0 |
| Bachelor's Degree | 0 (0.0%) | 0.0 |
| Graduate Degree | 0 (0.0%) | 0.0 |
| Total | 6 (100.0%) | 222.0 |
Fertility by Education by Marriage Status in Chickamaw Beach
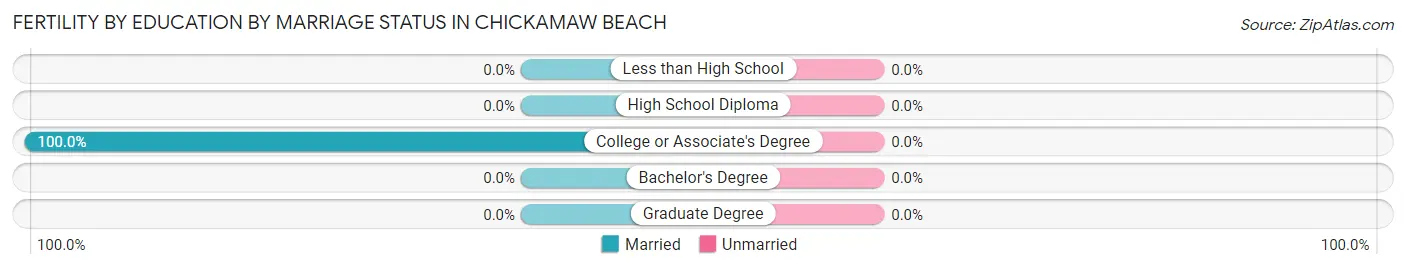
| Educational Attainment | Married | Unmarried |
| Less than High School | 0 (0.0%) | 0 (0.0%) |
| High School Diploma | 0 (0.0%) | 0 (0.0%) |
| College or Associate's Degree | 6 (100.0%) | 0 (0.0%) |
| Bachelor's Degree | 0 (0.0%) | 0 (0.0%) |
| Graduate Degree | 0 (0.0%) | 0 (0.0%) |
| Total | 6 (100.0%) | 0 (0.0%) |
Employment Characteristics in Chickamaw Beach
Employment by Class of Employer in Chickamaw Beach
Among the 77 employed individuals in Chickamaw Beach, private company employees (45 | 58.4%), state government employees (12 | 15.6%), and local government employees (10 | 13.0%) make up the most common classes of employment.
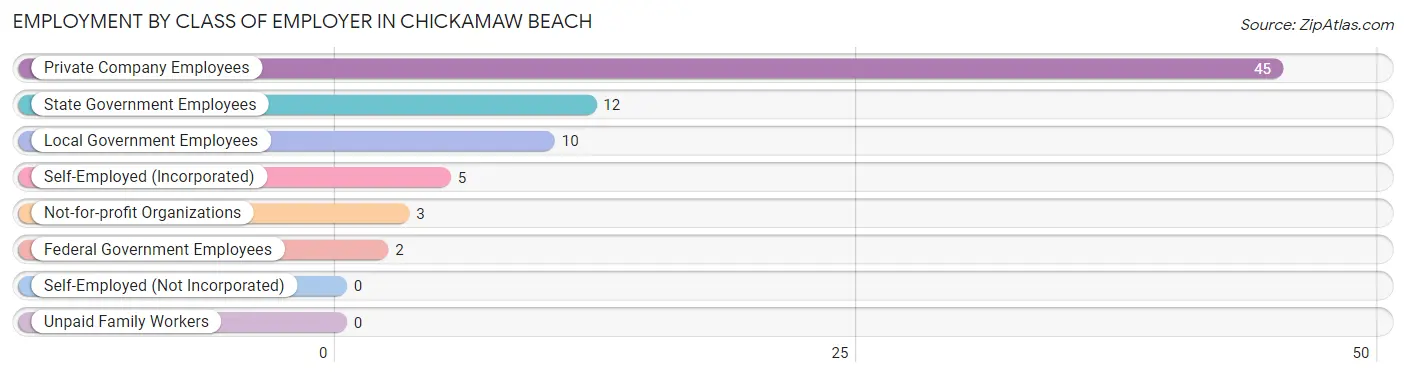
| Employer Class | # Employees | % Employees |
| Private Company Employees | 45 | 58.4% |
| Self-Employed (Incorporated) | 5 | 6.5% |
| Self-Employed (Not Incorporated) | 0 | 0.0% |
| Not-for-profit Organizations | 3 | 3.9% |
| Local Government Employees | 10 | 13.0% |
| State Government Employees | 12 | 15.6% |
| Federal Government Employees | 2 | 2.6% |
| Unpaid Family Workers | 0 | 0.0% |
| Total | 77 | 100.0% |
Employment Status by Age in Chickamaw Beach
According to the labor force statistics for Chickamaw Beach, out of the total population over 16 years of age (139), 61.9% or 86 individuals are in the labor force, with 2.3% or 2 of them unemployed. The age group with the highest labor force participation rate is 16 to 19 years, with 100.0% or 3 individuals in the labor force. Within the labor force, the 60 to 64 years age range has the highest percentage of unemployed individuals, with 50.0% or 2 of them being unemployed.
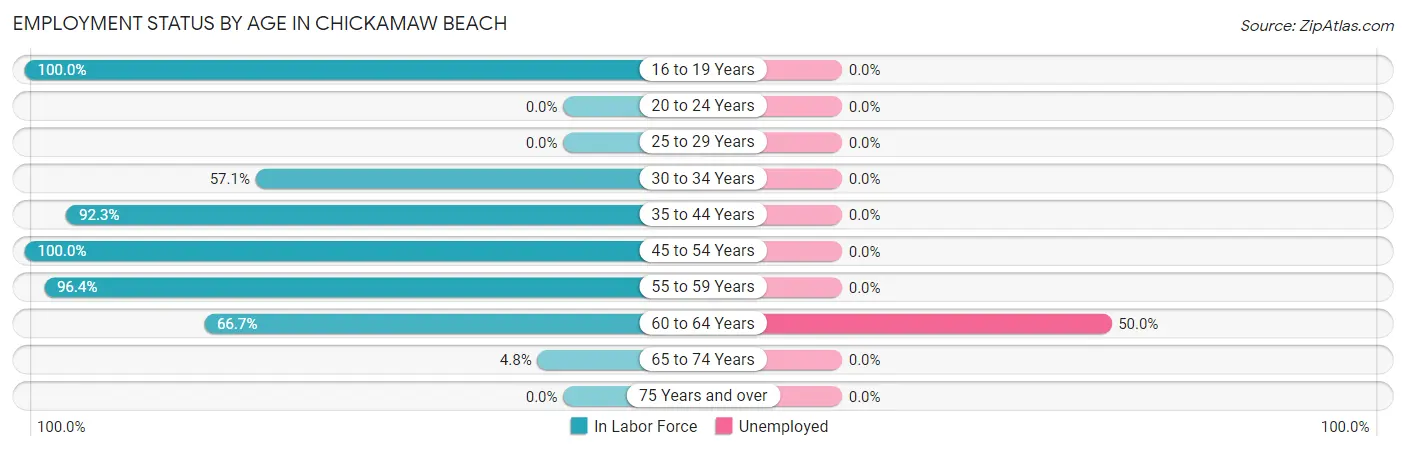
| Age Bracket | In Labor Force | Unemployed |
| 16 to 19 Years | 3 (100.0%) | 0 (0.0%) |
| 20 to 24 Years | 0 (0.0%) | 0 (0.0%) |
| 25 to 29 Years | 0 (0.0%) | 0 (0.0%) |
| 30 to 34 Years | 16 (57.1%) | 0 (0.0%) |
| 35 to 44 Years | 24 (92.3%) | 0 (0.0%) |
| 45 to 54 Years | 11 (100.0%) | 0 (0.0%) |
| 55 to 59 Years | 27 (96.4%) | 0 (0.0%) |
| 60 to 64 Years | 4 (66.7%) | 2 (50.0%) |
| 65 to 74 Years | 1 (4.8%) | 0 (0.0%) |
| 75 Years and over | 0 (0.0%) | 0 (0.0%) |
| Total | 86 (61.9%) | 2 (2.3%) |
Employment Status by Educational Attainment in Chickamaw Beach
According to labor force statistics for Chickamaw Beach, 82.8% of individuals (82) out of the total population between 25 and 64 years of age (99) are in the labor force, with 2.4% or 2 of them being unemployed. The group with the highest labor force participation rate are those with the educational attainment of less than high school, with 100.0% or 6 individuals in the labor force. Within the labor force, individuals with college / associate degree education have the highest percentage of unemployment, with 10.5% or 2 of them being unemployed.
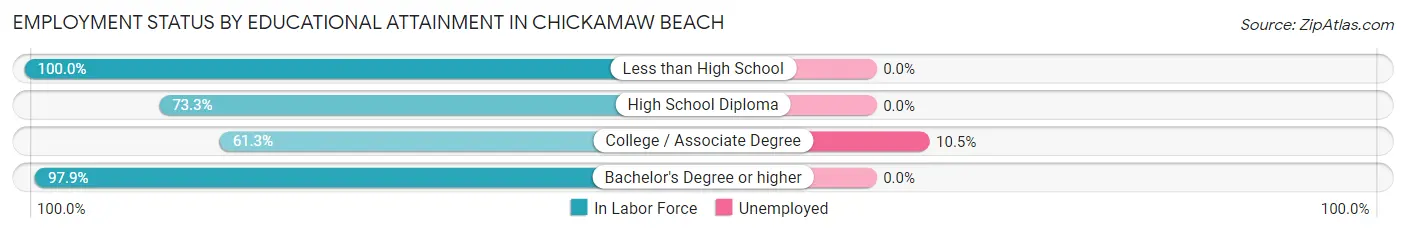
| Educational Attainment | In Labor Force | Unemployed |
| Less than High School | 6 (100.0%) | 0 (0.0%) |
| High School Diploma | 11 (73.3%) | 0 (0.0%) |
| College / Associate Degree | 19 (61.3%) | 3 (10.5%) |
| Bachelor's Degree or higher | 46 (97.9%) | 0 (0.0%) |
| Total | 82 (82.8%) | 2 (2.4%) |
Employment Occupations by Sex in Chickamaw Beach
Management, Business, Science and Arts Occupations
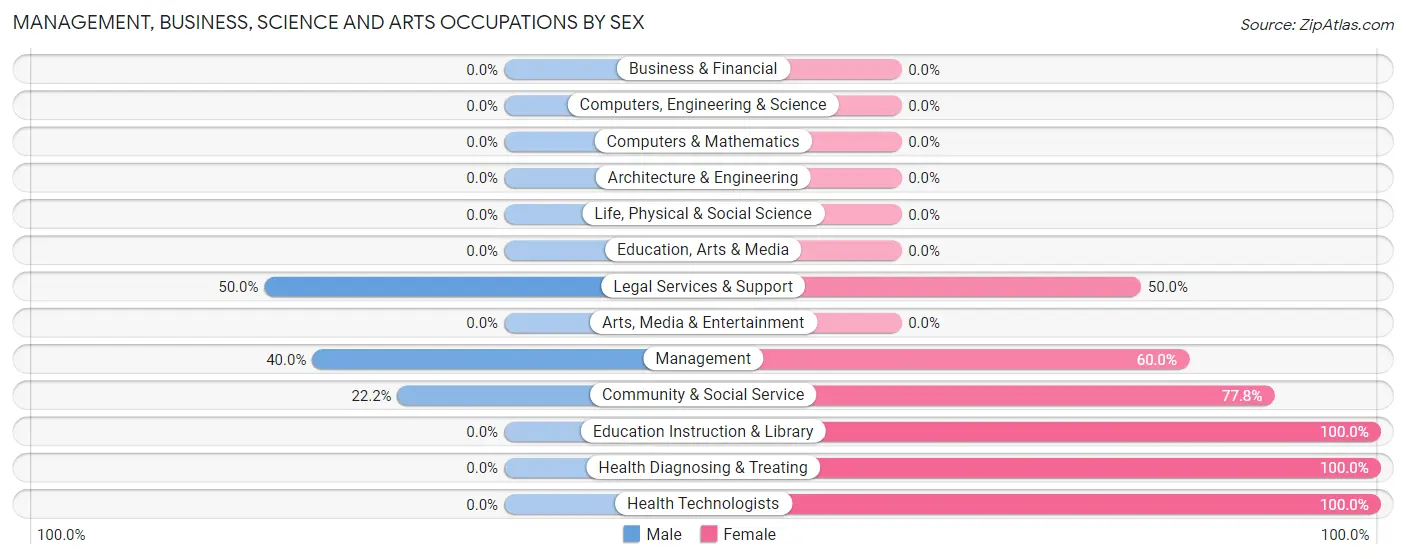
The most common Management, Business, Science and Arts occupations in Chickamaw Beach are Health Diagnosing & Treating (11 | 13.1%), Community & Social Service (9 | 10.7%), Health Technologists (9 | 10.7%), Management (5 | 5.9%), and Education Instruction & Library (5 | 5.9%).
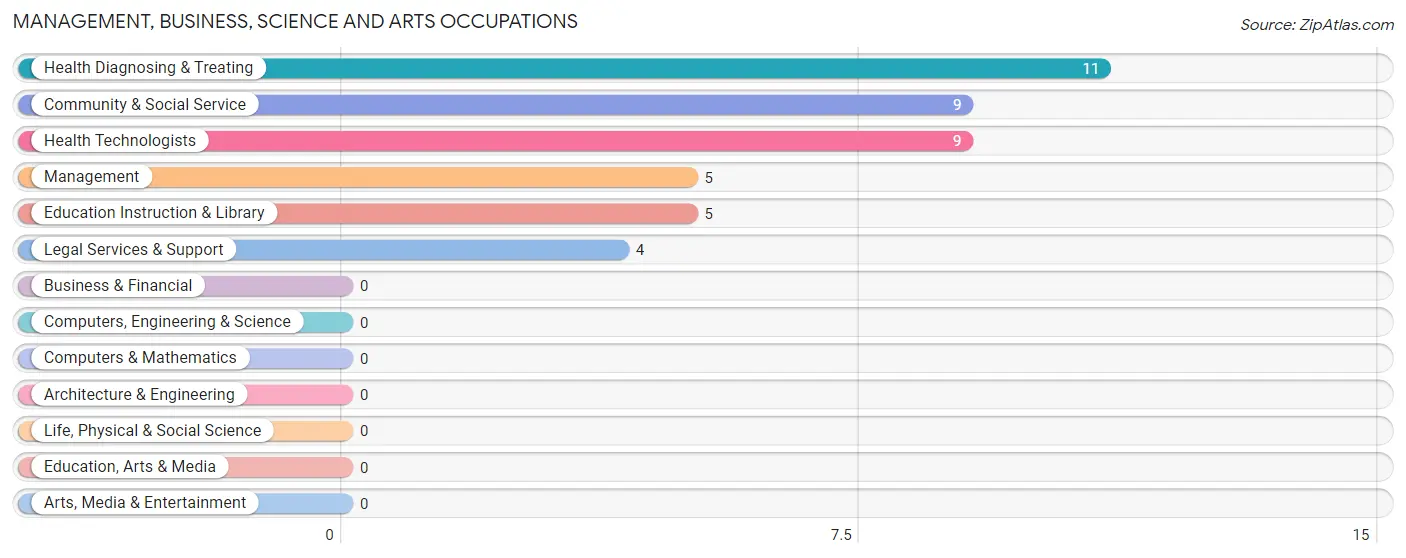
Management, Business, Science and Arts Occupations by Sex
Within the Management, Business, Science and Arts occupations in Chickamaw Beach, the most male-oriented occupations are Legal Services & Support (50.0%), Management (40.0%), and Community & Social Service (22.2%), while the most female-oriented occupations are Education Instruction & Library (100.0%), Health Diagnosing & Treating (100.0%), and Health Technologists (100.0%).
| Occupation | Male | Female |
| Management | 2 (40.0%) | 3 (60.0%) |
| Business & Financial | 0 (0.0%) | 0 (0.0%) |
| Computers, Engineering & Science | 0 (0.0%) | 0 (0.0%) |
| Computers & Mathematics | 0 (0.0%) | 0 (0.0%) |
| Architecture & Engineering | 0 (0.0%) | 0 (0.0%) |
| Life, Physical & Social Science | 0 (0.0%) | 0 (0.0%) |
| Community & Social Service | 2 (22.2%) | 7 (77.8%) |
| Education, Arts & Media | 0 (0.0%) | 0 (0.0%) |
| Legal Services & Support | 2 (50.0%) | 2 (50.0%) |
| Education Instruction & Library | 0 (0.0%) | 5 (100.0%) |
| Arts, Media & Entertainment | 0 (0.0%) | 0 (0.0%) |
| Health Diagnosing & Treating | 0 (0.0%) | 11 (100.0%) |
| Health Technologists | 0 (0.0%) | 9 (100.0%) |
| Total (Category) | 4 (16.0%) | 21 (84.0%) |
| Total (Overall) | 54 (64.3%) | 30 (35.7%) |
Services Occupations
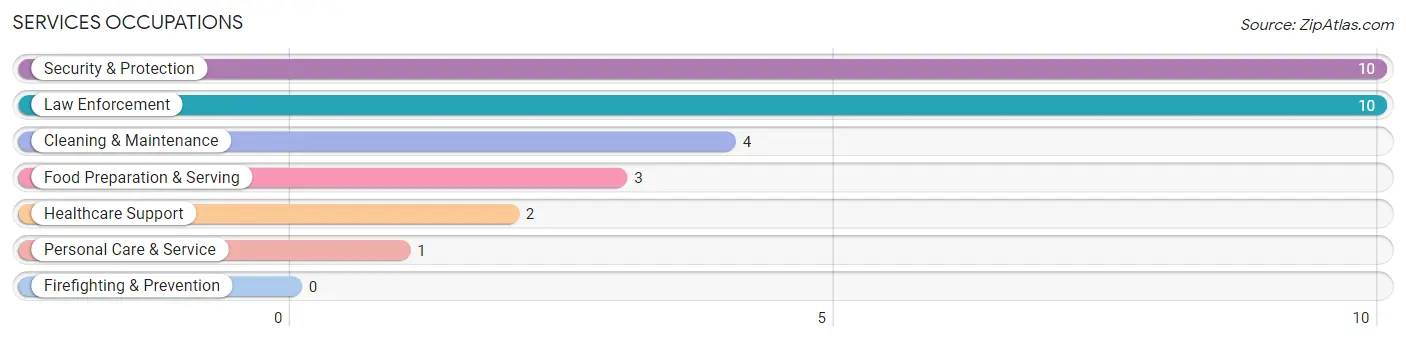
The most common Services occupations in Chickamaw Beach are Security & Protection (10 | 11.9%), Law Enforcement (10 | 11.9%), Cleaning & Maintenance (4 | 4.8%), Food Preparation & Serving (3 | 3.6%), and Healthcare Support (2 | 2.4%).
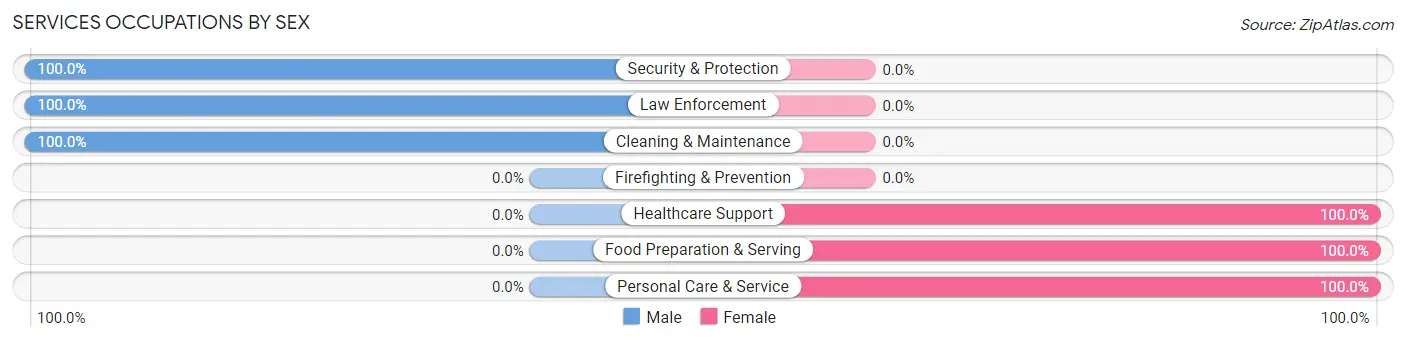
Services Occupations by Sex
Within the Services occupations in Chickamaw Beach, the most male-oriented occupations are Security & Protection (100.0%), Law Enforcement (100.0%), and Cleaning & Maintenance (100.0%), while the most female-oriented occupations are Healthcare Support (100.0%), Food Preparation & Serving (100.0%), and Personal Care & Service (100.0%).
| Occupation | Male | Female |
| Healthcare Support | 0 (0.0%) | 2 (100.0%) |
| Security & Protection | 10 (100.0%) | 0 (0.0%) |
| Firefighting & Prevention | 0 (0.0%) | 0 (0.0%) |
| Law Enforcement | 10 (100.0%) | 0 (0.0%) |
| Food Preparation & Serving | 0 (0.0%) | 3 (100.0%) |
| Cleaning & Maintenance | 4 (100.0%) | 0 (0.0%) |
| Personal Care & Service | 0 (0.0%) | 1 (100.0%) |
| Total (Category) | 14 (70.0%) | 6 (30.0%) |
| Total (Overall) | 54 (64.3%) | 30 (35.7%) |
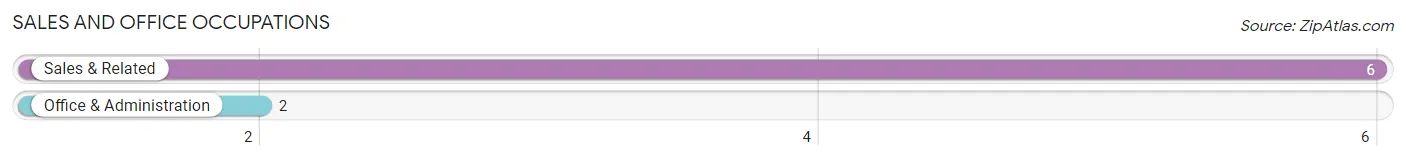
Sales and Office Occupations
The most common Sales and Office occupations in Chickamaw Beach are Sales & Related (6 | 7.1%), and Office & Administration (2 | 2.4%).
Sales and Office Occupations by Sex
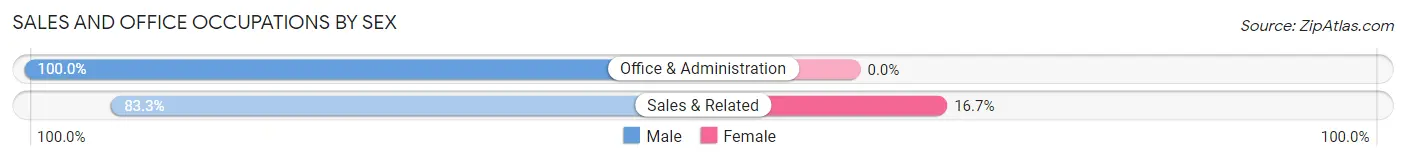
| Occupation | Male | Female |
| Sales & Related | 5 (83.3%) | 1 (16.7%) |
| Office & Administration | 2 (100.0%) | 0 (0.0%) |
| Total (Category) | 7 (87.5%) | 1 (12.5%) |
| Total (Overall) | 54 (64.3%) | 30 (35.7%) |
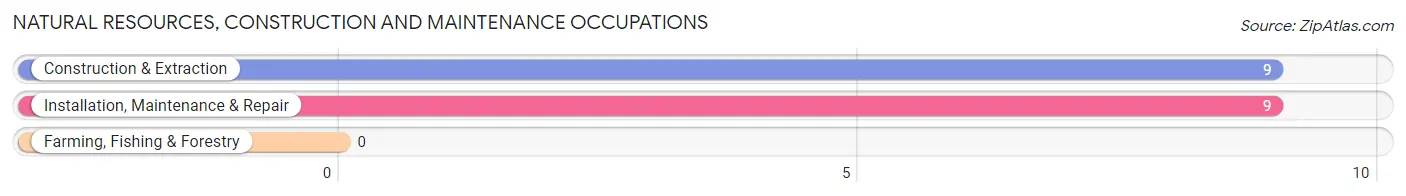
Natural Resources, Construction and Maintenance Occupations
The most common Natural Resources, Construction and Maintenance occupations in Chickamaw Beach are Construction & Extraction (9 | 10.7%), and Installation, Maintenance & Repair (9 | 10.7%).
Natural Resources, Construction and Maintenance Occupations by Sex
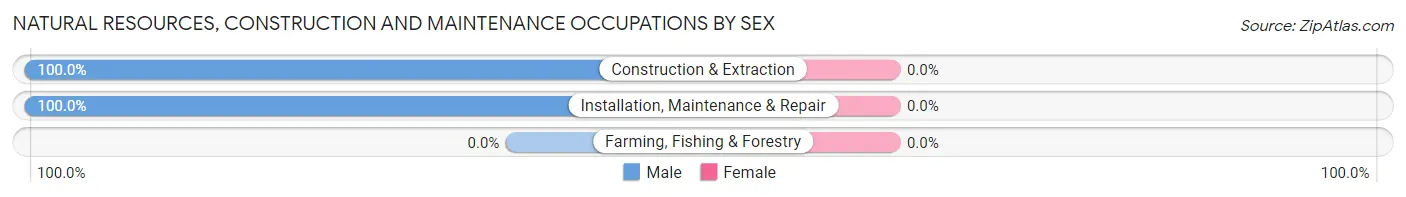
| Occupation | Male | Female |
| Farming, Fishing & Forestry | 0 (0.0%) | 0 (0.0%) |
| Construction & Extraction | 9 (100.0%) | 0 (0.0%) |
| Installation, Maintenance & Repair | 9 (100.0%) | 0 (0.0%) |
| Total (Category) | 18 (100.0%) | 0 (0.0%) |
| Total (Overall) | 54 (64.3%) | 30 (35.7%) |
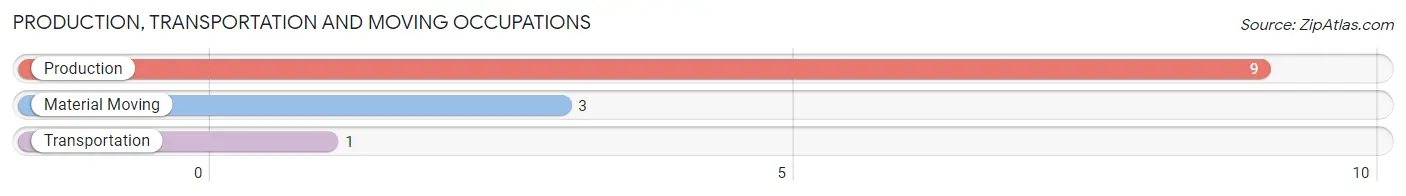
Production, Transportation and Moving Occupations
The most common Production, Transportation and Moving occupations in Chickamaw Beach are Production (9 | 10.7%), Material Moving (3 | 3.6%), and Transportation (1 | 1.2%).
Production, Transportation and Moving Occupations by Sex
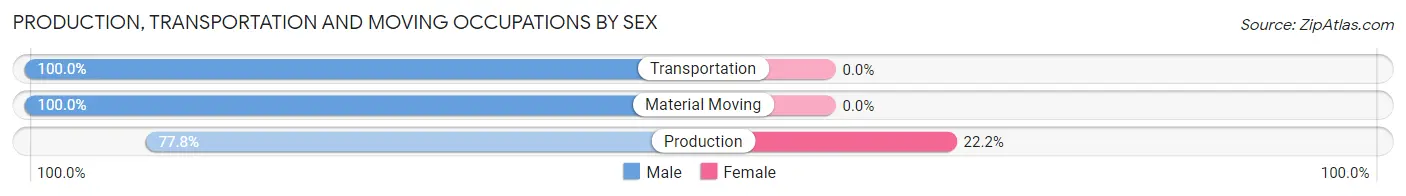
| Occupation | Male | Female |
| Production | 7 (77.8%) | 2 (22.2%) |
| Transportation | 1 (100.0%) | 0 (0.0%) |
| Material Moving | 3 (100.0%) | 0 (0.0%) |
| Total (Category) | 11 (84.6%) | 2 (15.4%) |
| Total (Overall) | 54 (64.3%) | 30 (35.7%) |
Employment Industries by Sex in Chickamaw Beach
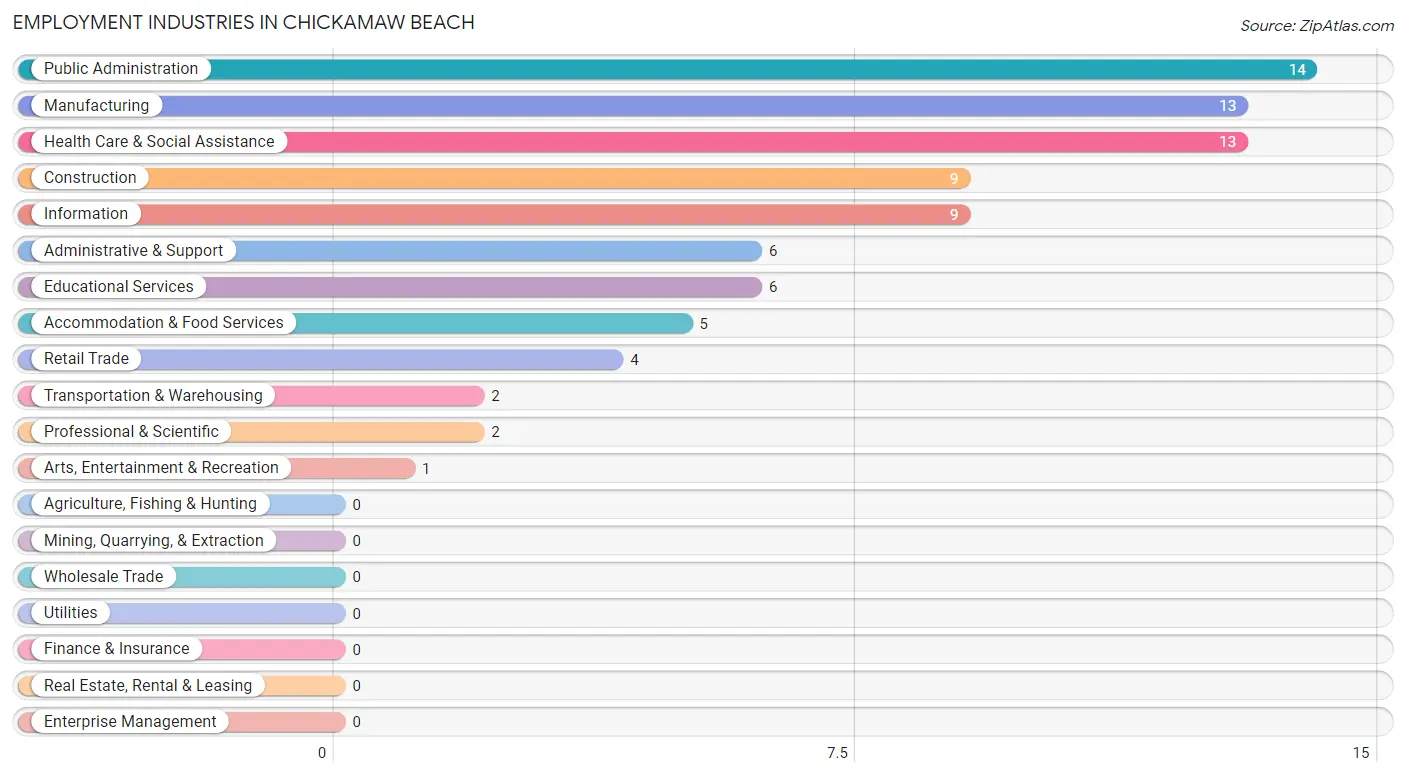
Employment Industries in Chickamaw Beach
The major employment industries in Chickamaw Beach include Public Administration (14 | 16.7%), Manufacturing (13 | 15.5%), Health Care & Social Assistance (13 | 15.5%), Construction (9 | 10.7%), and Information (9 | 10.7%).
Employment Industries by Sex in Chickamaw Beach
The Chickamaw Beach industries that see more men than women are Construction (100.0%), Transportation & Warehousing (100.0%), and Professional & Scientific (100.0%), whereas the industries that tend to have a higher number of women are Health Care & Social Assistance (100.0%), Arts, Entertainment & Recreation (100.0%), and Accommodation & Food Services (100.0%).
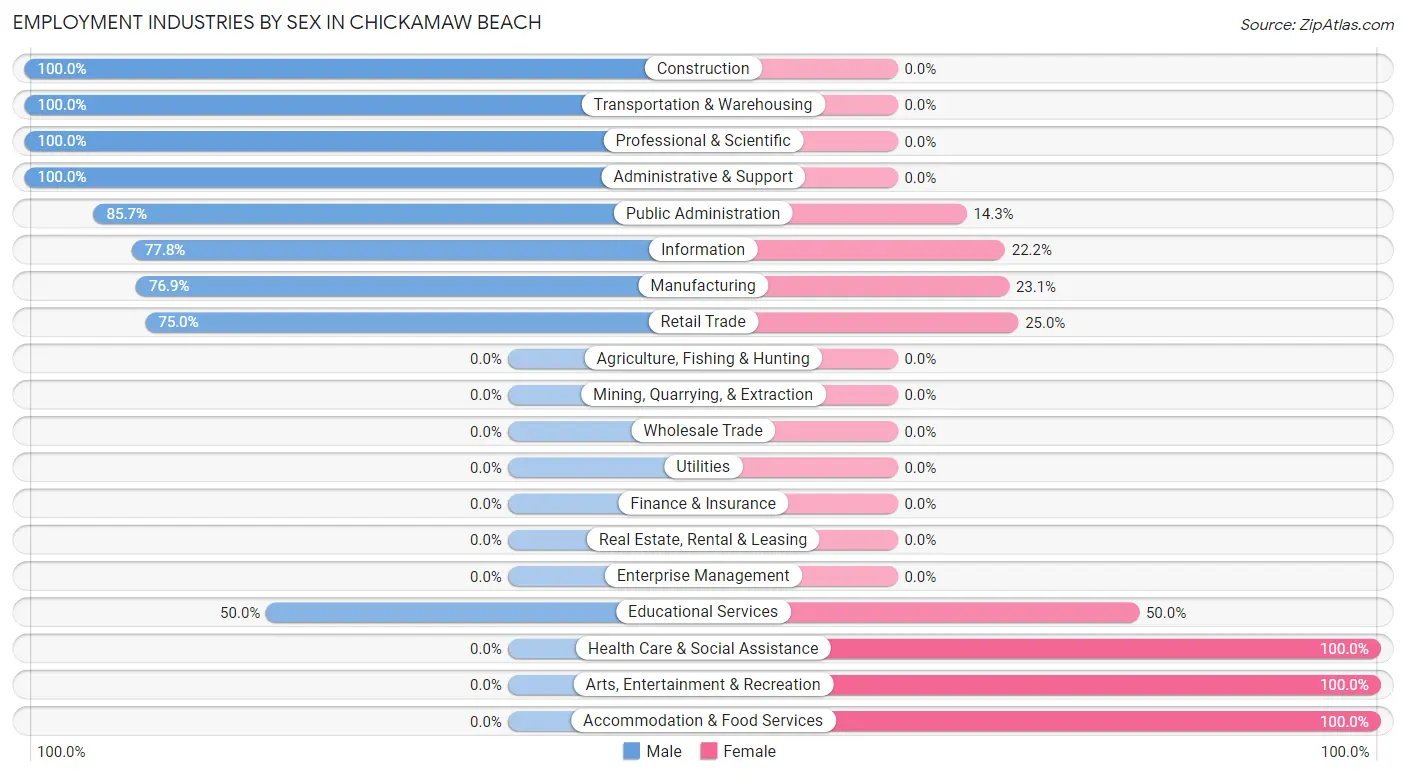
| Industry | Male | Female |
| Agriculture, Fishing & Hunting | 0 (0.0%) | 0 (0.0%) |
| Mining, Quarrying, & Extraction | 0 (0.0%) | 0 (0.0%) |
| Construction | 9 (100.0%) | 0 (0.0%) |
| Manufacturing | 10 (76.9%) | 3 (23.1%) |
| Wholesale Trade | 0 (0.0%) | 0 (0.0%) |
| Retail Trade | 3 (75.0%) | 1 (25.0%) |
| Transportation & Warehousing | 2 (100.0%) | 0 (0.0%) |
| Utilities | 0 (0.0%) | 0 (0.0%) |
| Information | 7 (77.8%) | 2 (22.2%) |
| Finance & Insurance | 0 (0.0%) | 0 (0.0%) |
| Real Estate, Rental & Leasing | 0 (0.0%) | 0 (0.0%) |
| Professional & Scientific | 2 (100.0%) | 0 (0.0%) |
| Enterprise Management | 0 (0.0%) | 0 (0.0%) |
| Administrative & Support | 6 (100.0%) | 0 (0.0%) |
| Educational Services | 3 (50.0%) | 3 (50.0%) |
| Health Care & Social Assistance | 0 (0.0%) | 13 (100.0%) |
| Arts, Entertainment & Recreation | 0 (0.0%) | 1 (100.0%) |
| Accommodation & Food Services | 0 (0.0%) | 5 (100.0%) |
| Public Administration | 12 (85.7%) | 2 (14.3%) |
| Total | 54 (64.3%) | 30 (35.7%) |
Education in Chickamaw Beach
School Enrollment in Chickamaw Beach
The most common levels of schooling among the 64 students in Chickamaw Beach are elementary school (26 | 40.6%), nursery / preschool (15 | 23.4%), and college / undergraduate (9 | 14.1%).
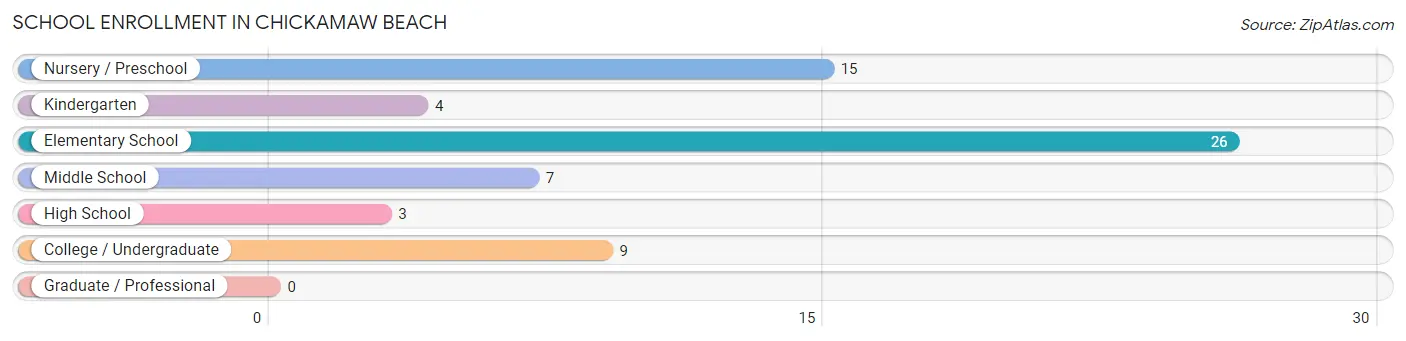
| School Level | # Students | % Students |
| Nursery / Preschool | 15 | 23.4% |
| Kindergarten | 4 | 6.2% |
| Elementary School | 26 | 40.6% |
| Middle School | 7 | 10.9% |
| High School | 3 | 4.7% |
| College / Undergraduate | 9 | 14.1% |
| Graduate / Professional | 0 | 0.0% |
| Total | 64 | 100.0% |
School Enrollment by Age by Funding Source in Chickamaw Beach
Out of a total of 64 students who are enrolled in schools in Chickamaw Beach, 14 (21.9%) attend a private institution, while the remaining 50 (78.1%) are enrolled in public schools. The age group of 10 to 14 year olds has the highest likelihood of being enrolled in private schools, with 6 (85.7% in the age bracket) enrolled. Conversely, the age group of 3 to 4 year olds has the lowest likelihood of being enrolled in a private school, with 14 (100.0% in the age bracket) attending a public institution.
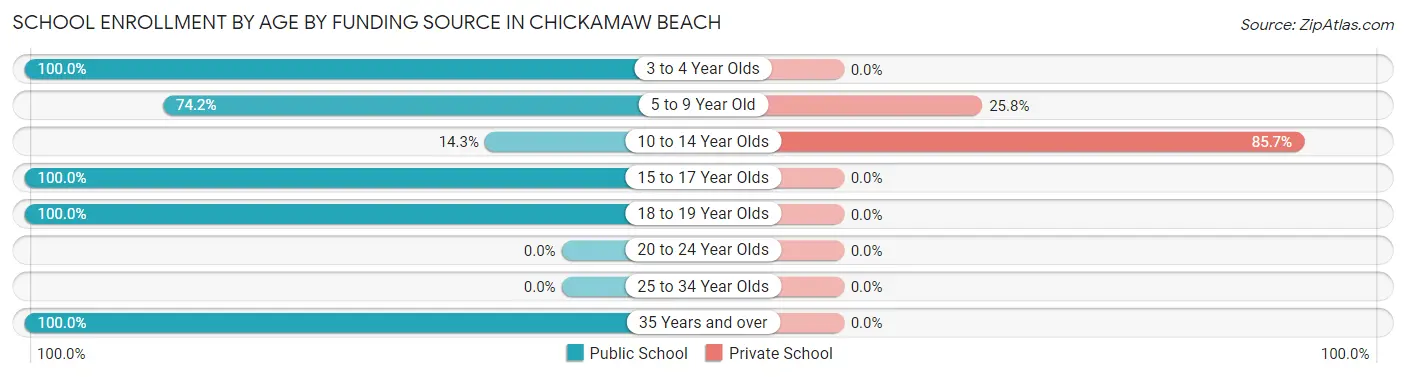
| Age Bracket | Public School | Private School |
| 3 to 4 Year Olds | 14 (100.0%) | 0 (0.0%) |
| 5 to 9 Year Old | 23 (74.2%) | 8 (25.8%) |
| 10 to 14 Year Olds | 1 (14.3%) | 6 (85.7%) |
| 15 to 17 Year Olds | 1 (100.0%) | 0 (0.0%) |
| 18 to 19 Year Olds | 2 (100.0%) | 0 (0.0%) |
| 20 to 24 Year Olds | 0 (0.0%) | 0 (0.0%) |
| 25 to 34 Year Olds | 0 (0.0%) | 0 (0.0%) |
| 35 Years and over | 9 (100.0%) | 0 (0.0%) |
| Total | 50 (78.1%) | 14 (21.9%) |
Educational Attainment by Field of Study in Chickamaw Beach
Education (19 | 32.2%), arts & humanities (12 | 20.3%), science & technology (9 | 15.2%), social sciences (4 | 6.8%), and literature & languages (4 | 6.8%) are the most common fields of study among 59 individuals in Chickamaw Beach who have obtained a bachelor's degree or higher.
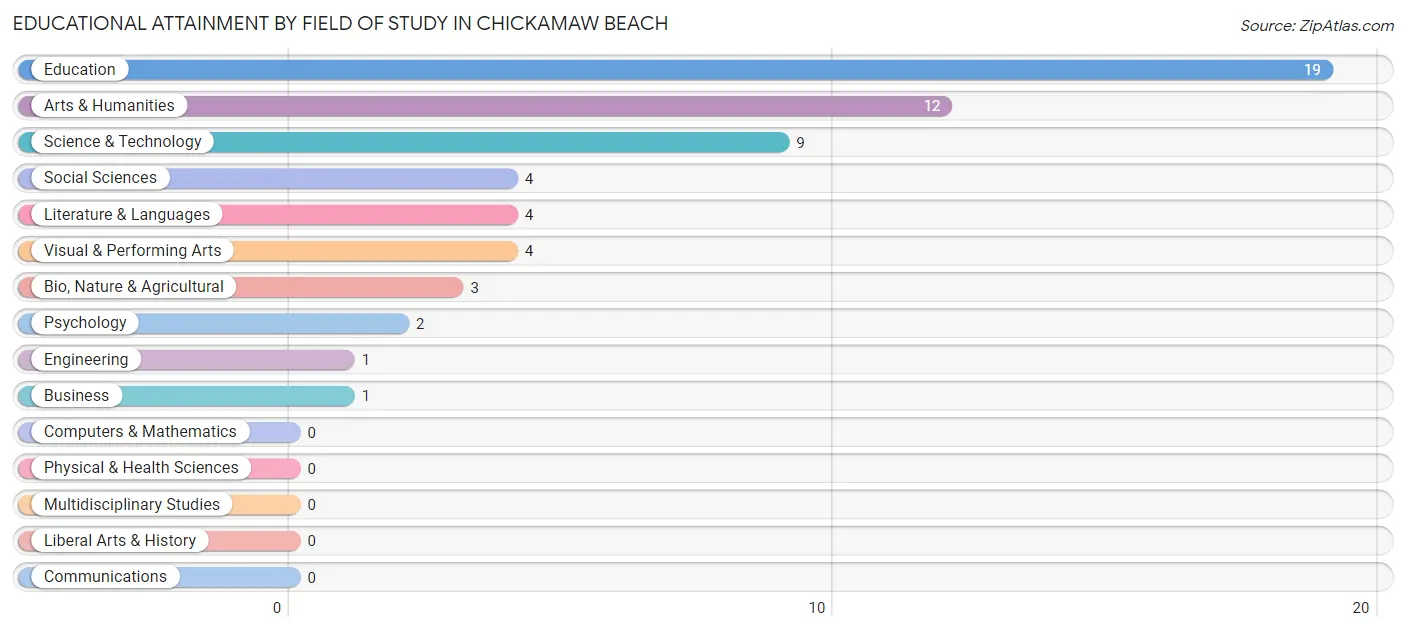
| Field of Study | # Graduates | % Graduates |
| Computers & Mathematics | 0 | 0.0% |
| Bio, Nature & Agricultural | 3 | 5.1% |
| Physical & Health Sciences | 0 | 0.0% |
| Psychology | 2 | 3.4% |
| Social Sciences | 4 | 6.8% |
| Engineering | 1 | 1.7% |
| Multidisciplinary Studies | 0 | 0.0% |
| Science & Technology | 9 | 15.2% |
| Business | 1 | 1.7% |
| Education | 19 | 32.2% |
| Literature & Languages | 4 | 6.8% |
| Liberal Arts & History | 0 | 0.0% |
| Visual & Performing Arts | 4 | 6.8% |
| Communications | 0 | 0.0% |
| Arts & Humanities | 12 | 20.3% |
| Total | 59 | 100.0% |
Transportation & Commute in Chickamaw Beach
Vehicle Availability by Sex in Chickamaw Beach
The most prevalent vehicle ownership categories in Chickamaw Beach are males with 2 vehicles (14, accounting for 29.8%) and females with 2 vehicles (7, making up 46.7%).
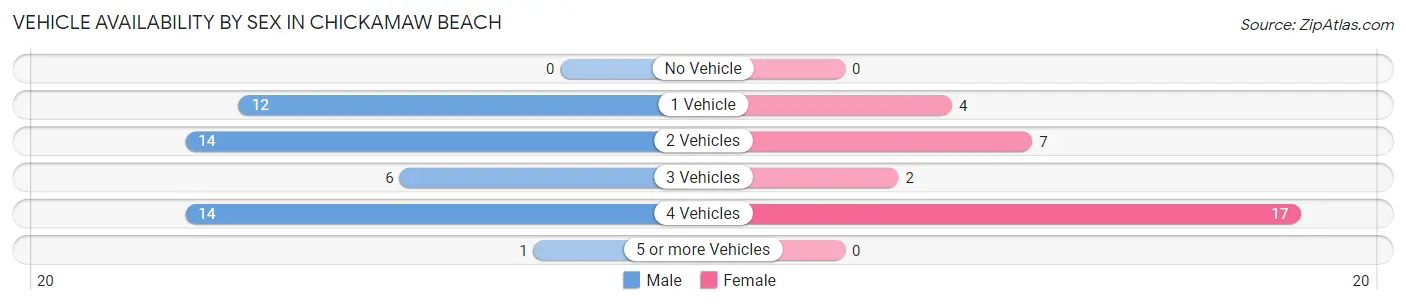
| Vehicles Available | Male | Female |
| No Vehicle | 0 (0.0%) | 0 (0.0%) |
| 1 Vehicle | 12 (25.5%) | 4 (13.3%) |
| 2 Vehicles | 14 (29.8%) | 7 (23.3%) |
| 3 Vehicles | 6 (12.8%) | 2 (6.7%) |
| 4 Vehicles | 14 (29.8%) | 17 (56.7%) |
| 5 or more Vehicles | 1 (2.1%) | 0 (0.0%) |
| Total | 47 (100.0%) | 30 (100.0%) |
Commute Time in Chickamaw Beach
The most frequently occuring commute durations in Chickamaw Beach are 5 to 9 minutes (25 commuters, 35.2%), 30 to 34 minutes (18 commuters, 25.4%), and 45 to 59 minutes (8 commuters, 11.3%).
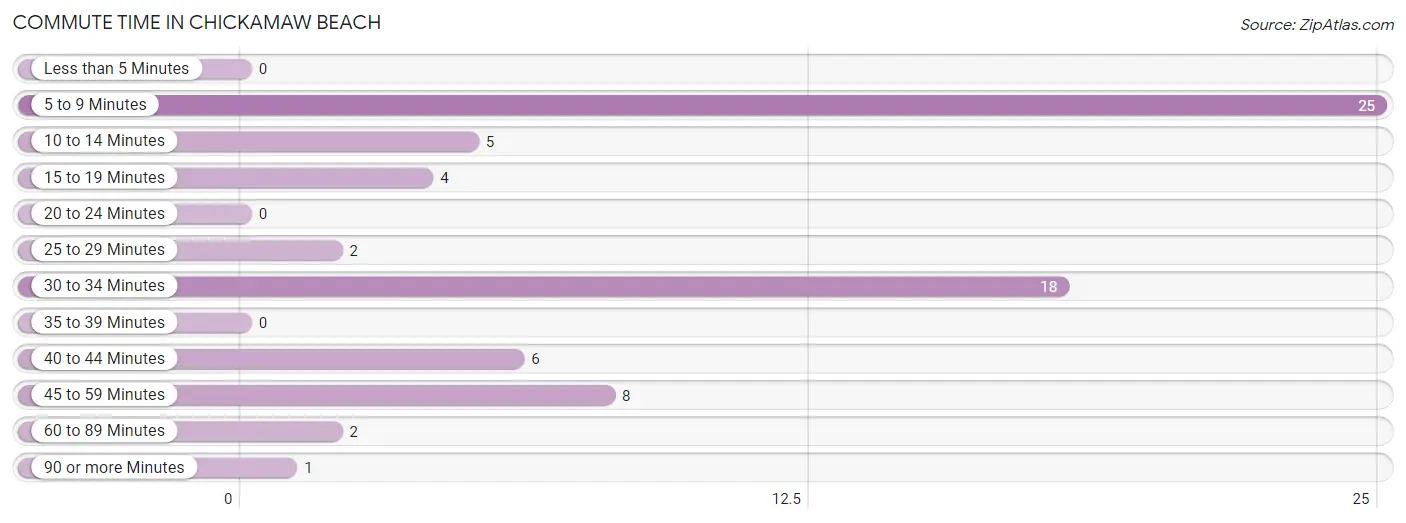
| Commute Time | # Commuters | % Commuters |
| Less than 5 Minutes | 0 | 0.0% |
| 5 to 9 Minutes | 25 | 35.2% |
| 10 to 14 Minutes | 5 | 7.0% |
| 15 to 19 Minutes | 4 | 5.6% |
| 20 to 24 Minutes | 0 | 0.0% |
| 25 to 29 Minutes | 2 | 2.8% |
| 30 to 34 Minutes | 18 | 25.4% |
| 35 to 39 Minutes | 0 | 0.0% |
| 40 to 44 Minutes | 6 | 8.5% |
| 45 to 59 Minutes | 8 | 11.3% |
| 60 to 89 Minutes | 2 | 2.8% |
| 90 or more Minutes | 1 | 1.4% |
Commute Time by Sex in Chickamaw Beach
The most common commute times in Chickamaw Beach are 30 to 34 minutes (16 commuters, 35.6%) for males and 5 to 9 minutes (10 commuters, 38.5%) for females.
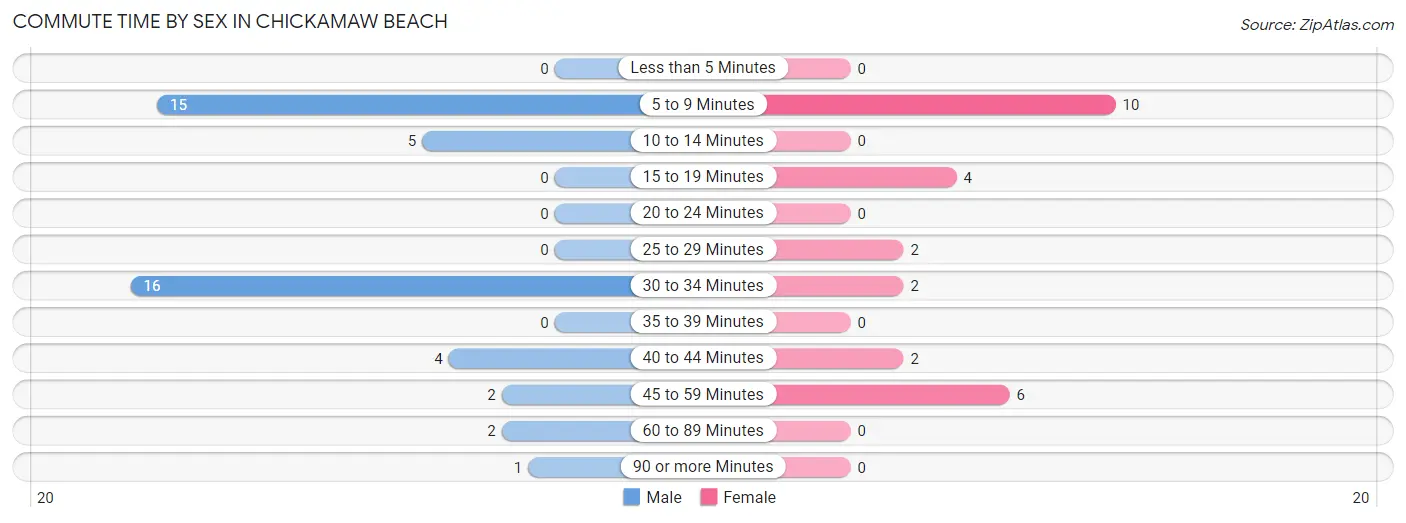
| Commute Time | Male | Female |
| Less than 5 Minutes | 0 (0.0%) | 0 (0.0%) |
| 5 to 9 Minutes | 15 (33.3%) | 10 (38.5%) |
| 10 to 14 Minutes | 5 (11.1%) | 0 (0.0%) |
| 15 to 19 Minutes | 0 (0.0%) | 4 (15.4%) |
| 20 to 24 Minutes | 0 (0.0%) | 0 (0.0%) |
| 25 to 29 Minutes | 0 (0.0%) | 2 (7.7%) |
| 30 to 34 Minutes | 16 (35.6%) | 2 (7.7%) |
| 35 to 39 Minutes | 0 (0.0%) | 0 (0.0%) |
| 40 to 44 Minutes | 4 (8.9%) | 2 (7.7%) |
| 45 to 59 Minutes | 2 (4.4%) | 6 (23.1%) |
| 60 to 89 Minutes | 2 (4.4%) | 0 (0.0%) |
| 90 or more Minutes | 1 (2.2%) | 0 (0.0%) |
Time of Departure to Work by Sex in Chickamaw Beach
The most frequent times of departure to work in Chickamaw Beach are 7:30 AM to 7:59 AM (11, 24.4%) for males and 5:00 AM to 5:29 AM (9, 34.6%) for females.
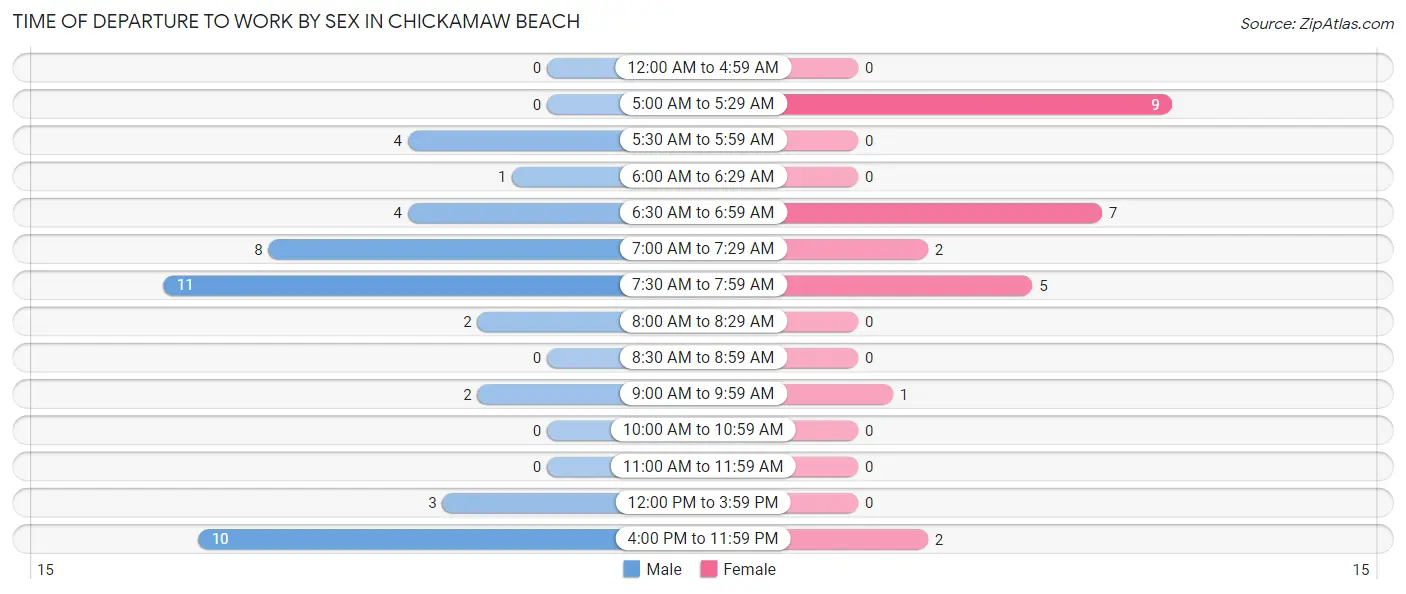
| Time of Departure | Male | Female |
| 12:00 AM to 4:59 AM | 0 (0.0%) | 0 (0.0%) |
| 5:00 AM to 5:29 AM | 0 (0.0%) | 9 (34.6%) |
| 5:30 AM to 5:59 AM | 4 (8.9%) | 0 (0.0%) |
| 6:00 AM to 6:29 AM | 1 (2.2%) | 0 (0.0%) |
| 6:30 AM to 6:59 AM | 4 (8.9%) | 7 (26.9%) |
| 7:00 AM to 7:29 AM | 8 (17.8%) | 2 (7.7%) |
| 7:30 AM to 7:59 AM | 11 (24.4%) | 5 (19.2%) |
| 8:00 AM to 8:29 AM | 2 (4.4%) | 0 (0.0%) |
| 8:30 AM to 8:59 AM | 0 (0.0%) | 0 (0.0%) |
| 9:00 AM to 9:59 AM | 2 (4.4%) | 1 (3.8%) |
| 10:00 AM to 10:59 AM | 0 (0.0%) | 0 (0.0%) |
| 11:00 AM to 11:59 AM | 0 (0.0%) | 0 (0.0%) |
| 12:00 PM to 3:59 PM | 3 (6.7%) | 0 (0.0%) |
| 4:00 PM to 11:59 PM | 10 (22.2%) | 2 (7.7%) |
| Total | 45 (100.0%) | 26 (100.0%) |
Housing Occupancy in Chickamaw Beach
Occupancy by Ownership in Chickamaw Beach
Of the total 79 dwellings in Chickamaw Beach, owner-occupied units account for 71 (89.9%), while renter-occupied units make up 8 (10.1%).
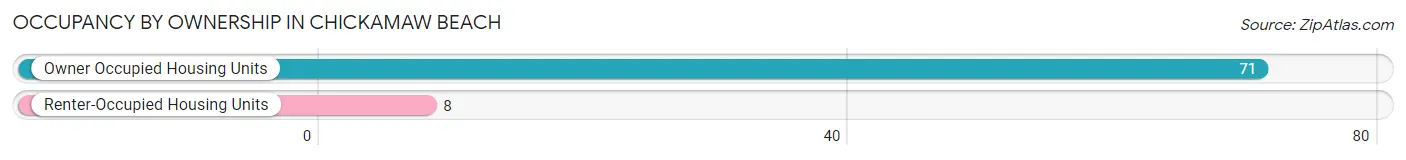
| Occupancy | # Housing Units | % Housing Units |
| Owner Occupied Housing Units | 71 | 89.9% |
| Renter-Occupied Housing Units | 8 | 10.1% |
| Total Occupied Housing Units | 79 | 100.0% |
Occupancy by Household Size in Chickamaw Beach
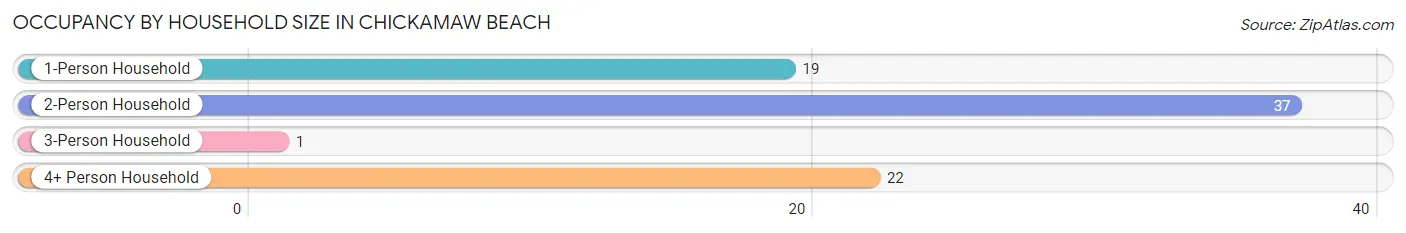
| Household Size | # Housing Units | % Housing Units |
| 1-Person Household | 19 | 24.0% |
| 2-Person Household | 37 | 46.8% |
| 3-Person Household | 1 | 1.3% |
| 4+ Person Household | 22 | 27.9% |
| Total Housing Units | 79 | 100.0% |
Occupancy by Ownership by Household Size in Chickamaw Beach
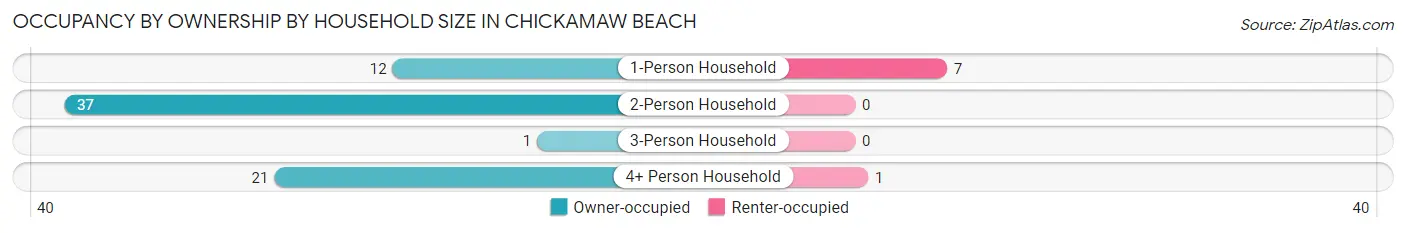
| Household Size | Owner-occupied | Renter-occupied |
| 1-Person Household | 12 (63.2%) | 7 (36.8%) |
| 2-Person Household | 37 (100.0%) | 0 (0.0%) |
| 3-Person Household | 1 (100.0%) | 0 (0.0%) |
| 4+ Person Household | 21 (95.5%) | 1 (4.5%) |
| Total Housing Units | 71 (89.9%) | 8 (10.1%) |
Occupancy by Educational Attainment in Chickamaw Beach
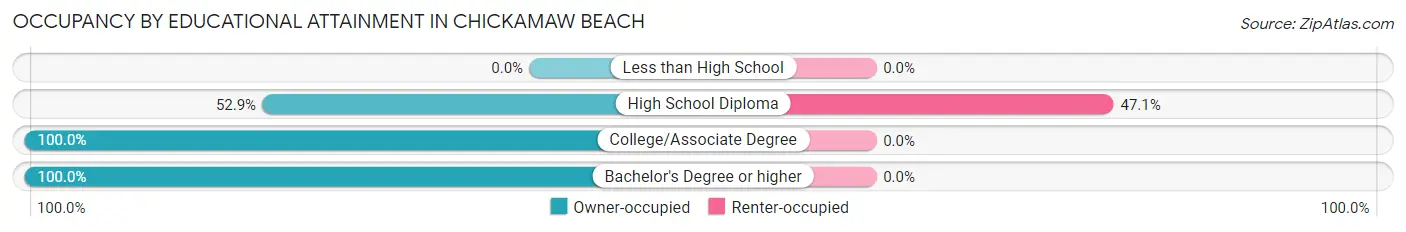
| Household Size | Owner-occupied | Renter-occupied |
| Less than High School | 0 (0.0%) | 0 (0.0%) |
| High School Diploma | 9 (52.9%) | 8 (47.1%) |
| College/Associate Degree | 27 (100.0%) | 0 (0.0%) |
| Bachelor's Degree or higher | 35 (100.0%) | 0 (0.0%) |
Occupancy by Age of Householder in Chickamaw Beach
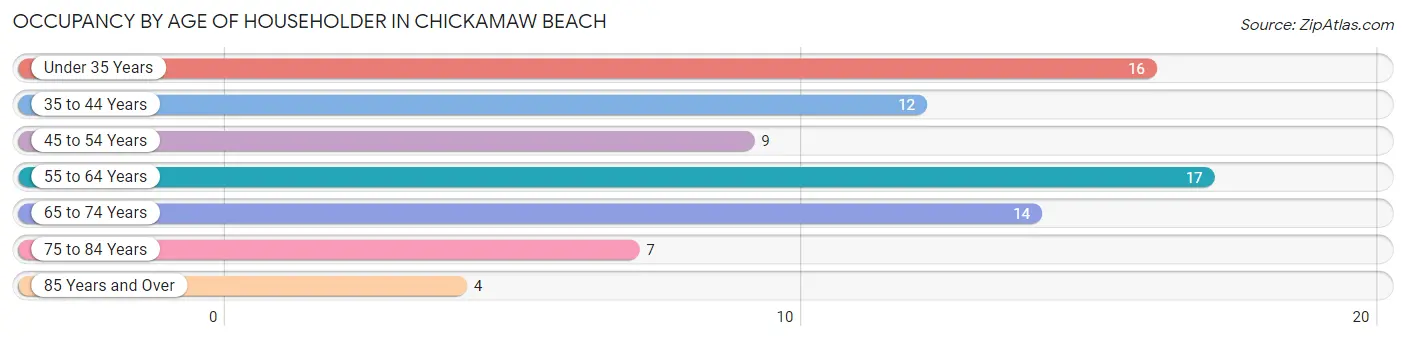
| Age Bracket | # Households | % Households |
| Under 35 Years | 16 | 20.3% |
| 35 to 44 Years | 12 | 15.2% |
| 45 to 54 Years | 9 | 11.4% |
| 55 to 64 Years | 17 | 21.5% |
| 65 to 74 Years | 14 | 17.7% |
| 75 to 84 Years | 7 | 8.9% |
| 85 Years and Over | 4 | 5.1% |
| Total | 79 | 100.0% |
Housing Finances in Chickamaw Beach
Median Income by Occupancy in Chickamaw Beach
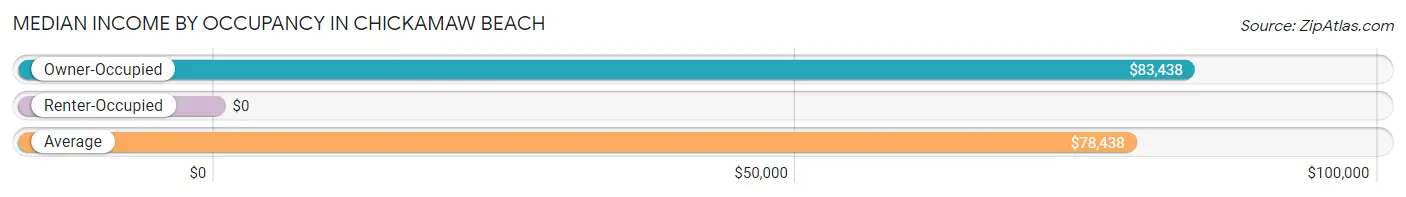
| Occupancy Type | # Households | Median Income |
| Owner-Occupied | 71 (89.9%) | $83,438 |
| Renter-Occupied | 8 (10.1%) | $0 |
| Average | 79 (100.0%) | $78,438 |
Occupancy by Householder Income Bracket in Chickamaw Beach
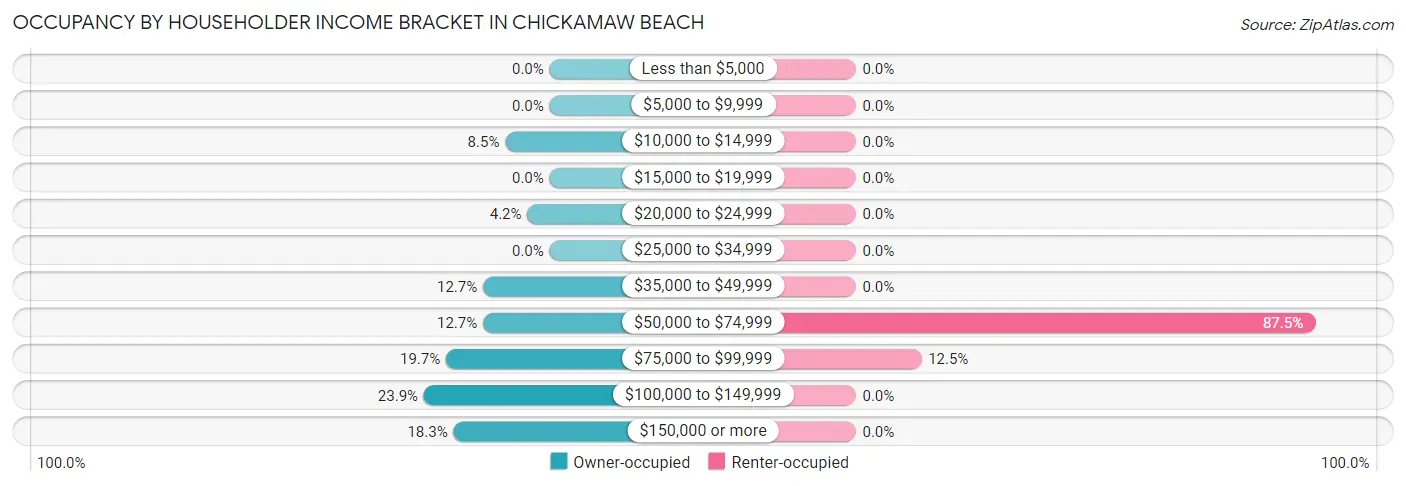
| Income Bracket | Owner-occupied | Renter-occupied |
| Less than $5,000 | 0 (0.0%) | 0 (0.0%) |
| $5,000 to $9,999 | 0 (0.0%) | 0 (0.0%) |
| $10,000 to $14,999 | 6 (8.5%) | 0 (0.0%) |
| $15,000 to $19,999 | 0 (0.0%) | 0 (0.0%) |
| $20,000 to $24,999 | 3 (4.2%) | 0 (0.0%) |
| $25,000 to $34,999 | 0 (0.0%) | 0 (0.0%) |
| $35,000 to $49,999 | 9 (12.7%) | 0 (0.0%) |
| $50,000 to $74,999 | 9 (12.7%) | 7 (87.5%) |
| $75,000 to $99,999 | 14 (19.7%) | 1 (12.5%) |
| $100,000 to $149,999 | 17 (23.9%) | 0 (0.0%) |
| $150,000 or more | 13 (18.3%) | 0 (0.0%) |
| Total | 71 (100.0%) | 8 (100.0%) |
Monthly Housing Cost Tiers in Chickamaw Beach
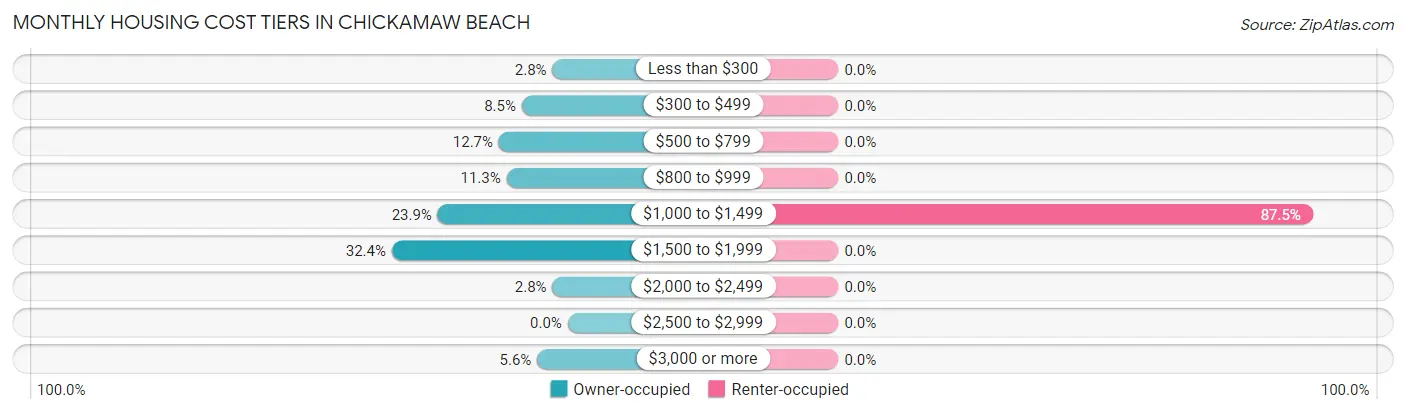
| Monthly Cost | Owner-occupied | Renter-occupied |
| Less than $300 | 2 (2.8%) | 0 (0.0%) |
| $300 to $499 | 6 (8.5%) | 0 (0.0%) |
| $500 to $799 | 9 (12.7%) | 0 (0.0%) |
| $800 to $999 | 8 (11.3%) | 0 (0.0%) |
| $1,000 to $1,499 | 17 (23.9%) | 7 (87.5%) |
| $1,500 to $1,999 | 23 (32.4%) | 0 (0.0%) |
| $2,000 to $2,499 | 2 (2.8%) | 0 (0.0%) |
| $2,500 to $2,999 | 0 (0.0%) | 0 (0.0%) |
| $3,000 or more | 4 (5.6%) | 0 (0.0%) |
| Total | 71 (100.0%) | 8 (100.0%) |
Physical Housing Characteristics in Chickamaw Beach
Housing Structures in Chickamaw Beach
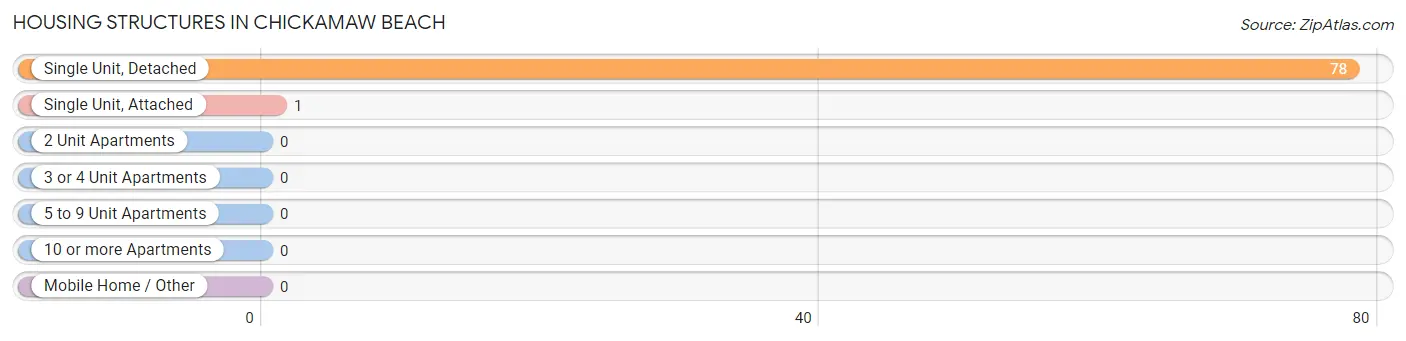
| Structure Type | # Housing Units | % Housing Units |
| Single Unit, Detached | 78 | 98.7% |
| Single Unit, Attached | 1 | 1.3% |
| 2 Unit Apartments | 0 | 0.0% |
| 3 or 4 Unit Apartments | 0 | 0.0% |
| 5 to 9 Unit Apartments | 0 | 0.0% |
| 10 or more Apartments | 0 | 0.0% |
| Mobile Home / Other | 0 | 0.0% |
| Total | 79 | 100.0% |
Housing Structures by Occupancy in Chickamaw Beach
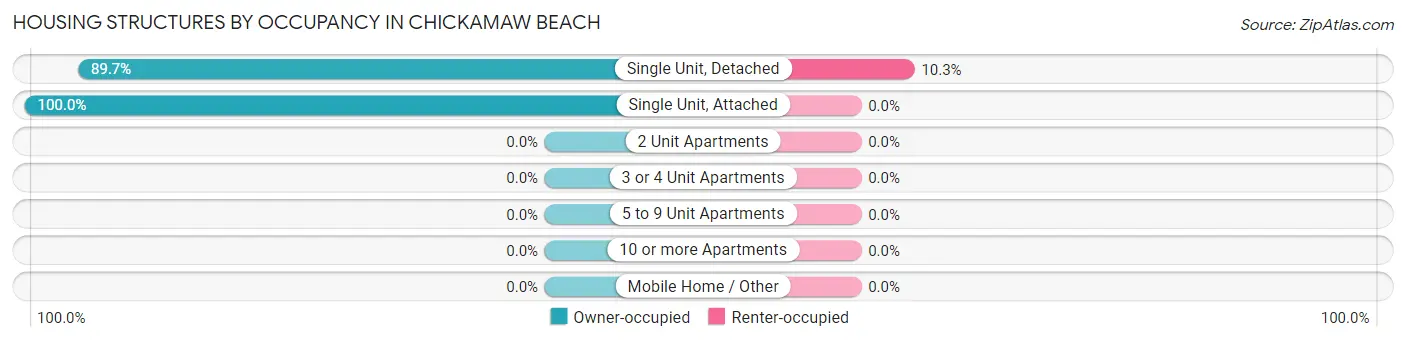
| Structure Type | Owner-occupied | Renter-occupied |
| Single Unit, Detached | 70 (89.7%) | 8 (10.3%) |
| Single Unit, Attached | 1 (100.0%) | 0 (0.0%) |
| 2 Unit Apartments | 0 (0.0%) | 0 (0.0%) |
| 3 or 4 Unit Apartments | 0 (0.0%) | 0 (0.0%) |
| 5 to 9 Unit Apartments | 0 (0.0%) | 0 (0.0%) |
| 10 or more Apartments | 0 (0.0%) | 0 (0.0%) |
| Mobile Home / Other | 0 (0.0%) | 0 (0.0%) |
| Total | 71 (89.9%) | 8 (10.1%) |
Housing Structures by Number of Rooms in Chickamaw Beach
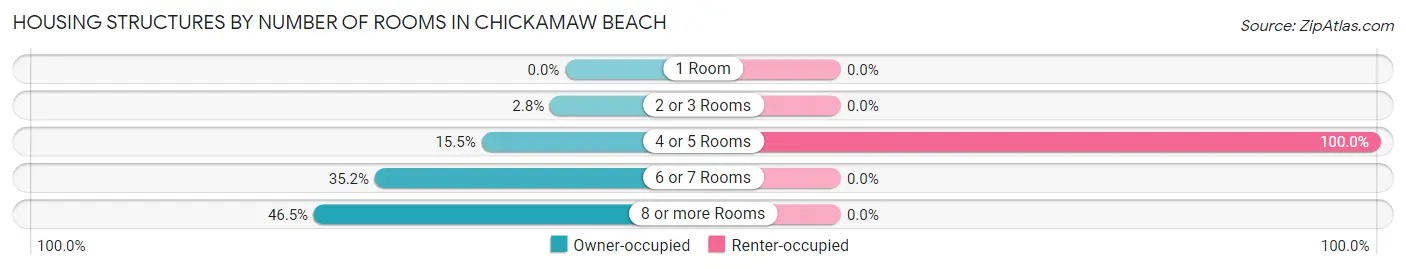
| Number of Rooms | Owner-occupied | Renter-occupied |
| 1 Room | 0 (0.0%) | 0 (0.0%) |
| 2 or 3 Rooms | 2 (2.8%) | 0 (0.0%) |
| 4 or 5 Rooms | 11 (15.5%) | 8 (100.0%) |
| 6 or 7 Rooms | 25 (35.2%) | 0 (0.0%) |
| 8 or more Rooms | 33 (46.5%) | 0 (0.0%) |
| Total | 71 (100.0%) | 8 (100.0%) |
Housing Structure by Heating Type in Chickamaw Beach
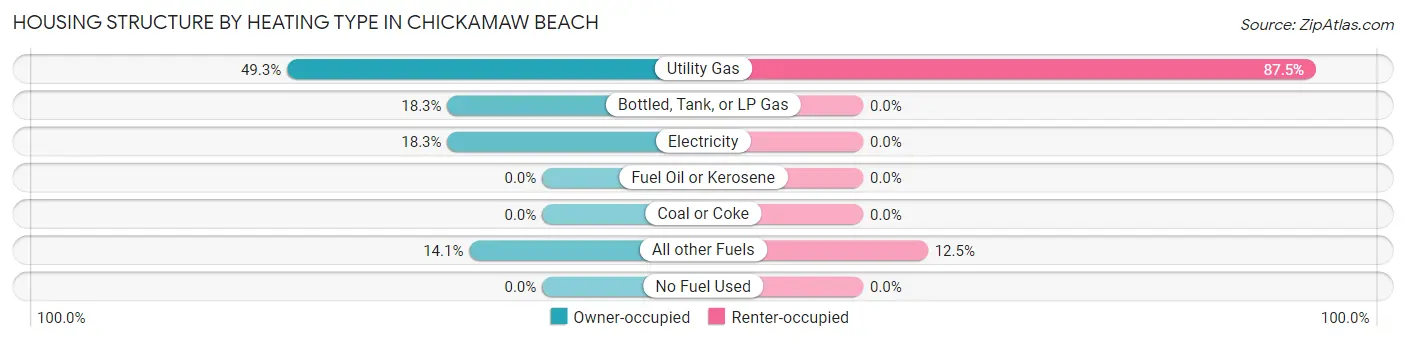
| Heating Type | Owner-occupied | Renter-occupied |
| Utility Gas | 35 (49.3%) | 7 (87.5%) |
| Bottled, Tank, or LP Gas | 13 (18.3%) | 0 (0.0%) |
| Electricity | 13 (18.3%) | 0 (0.0%) |
| Fuel Oil or Kerosene | 0 (0.0%) | 0 (0.0%) |
| Coal or Coke | 0 (0.0%) | 0 (0.0%) |
| All other Fuels | 10 (14.1%) | 1 (12.5%) |
| No Fuel Used | 0 (0.0%) | 0 (0.0%) |
| Total | 71 (100.0%) | 8 (100.0%) |
Household Vehicle Usage in Chickamaw Beach
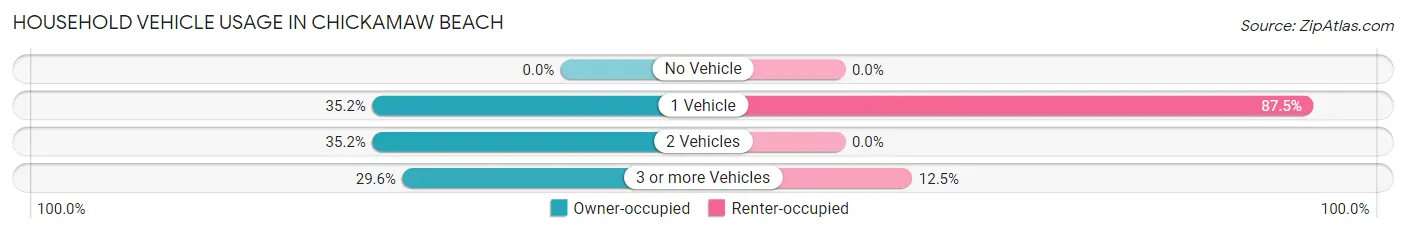
| Vehicles per Household | Owner-occupied | Renter-occupied |
| No Vehicle | 0 (0.0%) | 0 (0.0%) |
| 1 Vehicle | 25 (35.2%) | 7 (87.5%) |
| 2 Vehicles | 25 (35.2%) | 0 (0.0%) |
| 3 or more Vehicles | 21 (29.6%) | 1 (12.5%) |
| Total | 71 (100.0%) | 8 (100.0%) |
Real Estate & Mortgages in Chickamaw Beach
Real Estate and Mortgage Overview in Chickamaw Beach
| Characteristic | Without Mortgage | With Mortgage |
| Housing Units | 14 | 57 |
| Median Property Value | $290,000 | $275,000 |
| Median Household Income | $80,000 | $13 |
| Monthly Housing Costs | $400 | $4 |
| Real Estate Taxes | $1,500 | $1 |
Property Value by Mortgage Status in Chickamaw Beach
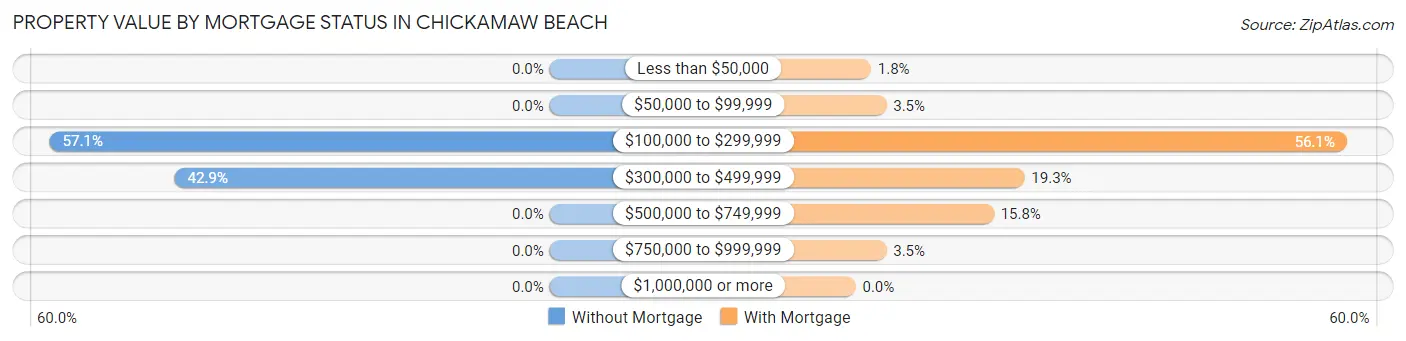
| Property Value | Without Mortgage | With Mortgage |
| Less than $50,000 | 0 (0.0%) | 1 (1.8%) |
| $50,000 to $99,999 | 0 (0.0%) | 2 (3.5%) |
| $100,000 to $299,999 | 8 (57.1%) | 32 (56.1%) |
| $300,000 to $499,999 | 6 (42.9%) | 11 (19.3%) |
| $500,000 to $749,999 | 0 (0.0%) | 9 (15.8%) |
| $750,000 to $999,999 | 0 (0.0%) | 2 (3.5%) |
| $1,000,000 or more | 0 (0.0%) | 0 (0.0%) |
| Total | 14 (100.0%) | 57 (100.0%) |
Household Income by Mortgage Status in Chickamaw Beach
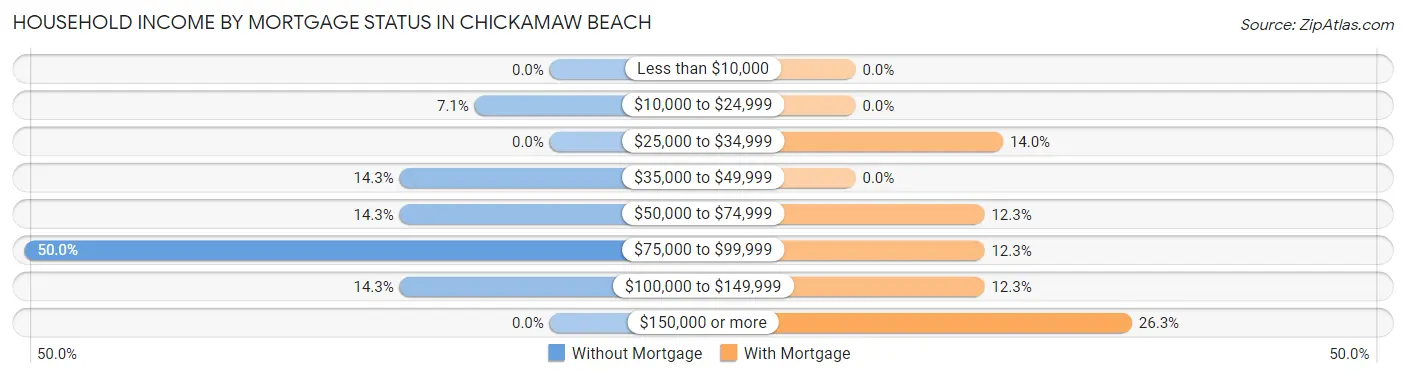
| Household Income | Without Mortgage | With Mortgage |
| Less than $10,000 | 0 (0.0%) | 0 (0.0%) |
| $10,000 to $24,999 | 1 (7.1%) | 0 (0.0%) |
| $25,000 to $34,999 | 0 (0.0%) | 8 (14.0%) |
| $35,000 to $49,999 | 2 (14.3%) | 0 (0.0%) |
| $50,000 to $74,999 | 2 (14.3%) | 7 (12.3%) |
| $75,000 to $99,999 | 7 (50.0%) | 7 (12.3%) |
| $100,000 to $149,999 | 2 (14.3%) | 7 (12.3%) |
| $150,000 or more | 0 (0.0%) | 15 (26.3%) |
| Total | 14 (100.0%) | 57 (100.0%) |
Property Value to Household Income Ratio in Chickamaw Beach
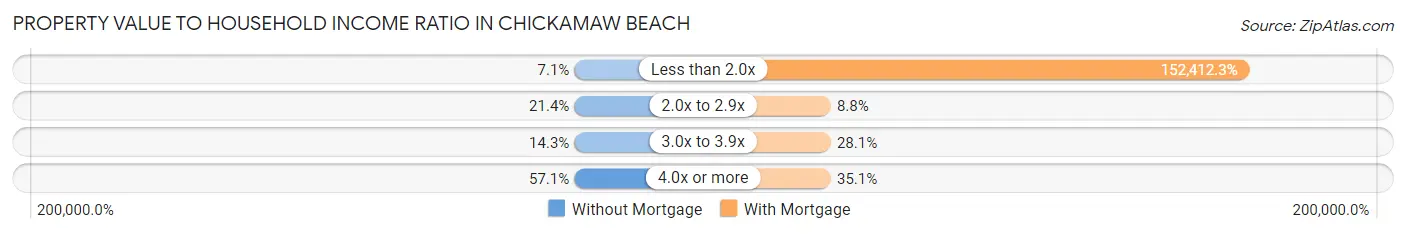
| Value-to-Income Ratio | Without Mortgage | With Mortgage |
| Less than 2.0x | 1 (7.1%) | 86,875 (152,412.3%) |
| 2.0x to 2.9x | 3 (21.4%) | 5 (8.8%) |
| 3.0x to 3.9x | 2 (14.3%) | 16 (28.1%) |
| 4.0x or more | 8 (57.1%) | 20 (35.1%) |
| Total | 14 (100.0%) | 57 (100.0%) |
Real Estate Taxes by Mortgage Status in Chickamaw Beach
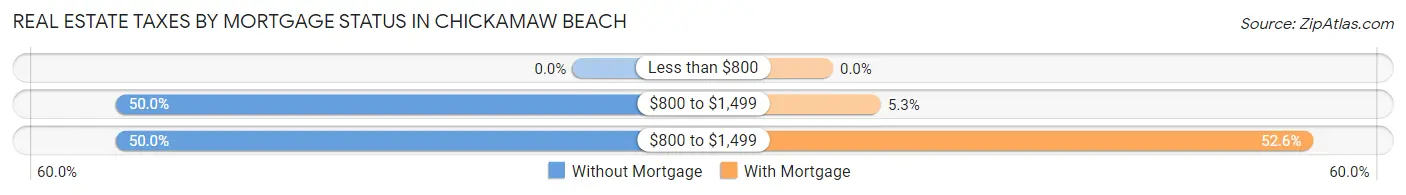
| Property Taxes | Without Mortgage | With Mortgage |
| Less than $800 | 0 (0.0%) | 0 (0.0%) |
| $800 to $1,499 | 7 (50.0%) | 3 (5.3%) |
| $800 to $1,499 | 7 (50.0%) | 30 (52.6%) |
| Total | 14 (100.0%) | 57 (100.0%) |
Health & Disability in Chickamaw Beach
Health Insurance Coverage by Age in Chickamaw Beach
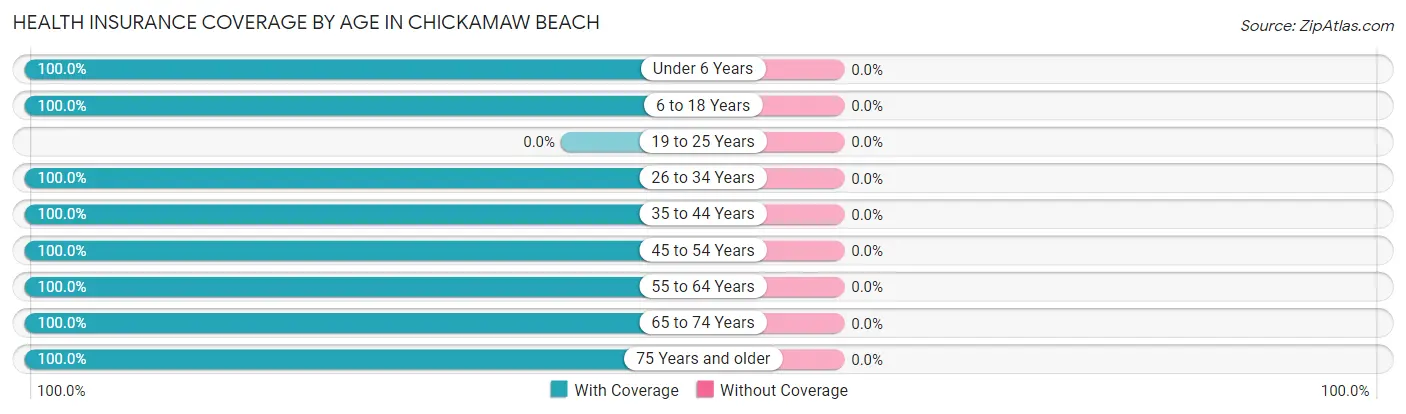
| Age Bracket | With Coverage | Without Coverage |
| Under 6 Years | 40 (100.0%) | 0 (0.0%) |
| 6 to 18 Years | 38 (100.0%) | 0 (0.0%) |
| 19 to 25 Years | 0 (0.0%) | 0 (0.0%) |
| 26 to 34 Years | 28 (100.0%) | 0 (0.0%) |
| 35 to 44 Years | 26 (100.0%) | 0 (0.0%) |
| 45 to 54 Years | 11 (100.0%) | 0 (0.0%) |
| 55 to 64 Years | 34 (100.0%) | 0 (0.0%) |
| 65 to 74 Years | 21 (100.0%) | 0 (0.0%) |
| 75 Years and older | 16 (100.0%) | 0 (0.0%) |
| Total | 214 (100.0%) | 0 (0.0%) |
Health Insurance Coverage by Citizenship Status in Chickamaw Beach
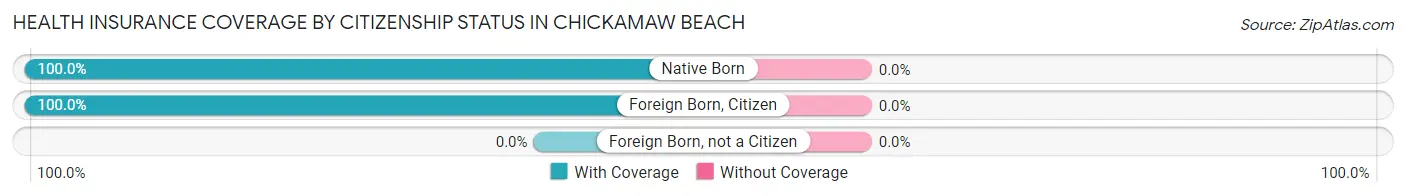
| Citizenship Status | With Coverage | Without Coverage |
| Native Born | 40 (100.0%) | 0 (0.0%) |
| Foreign Born, Citizen | 38 (100.0%) | 0 (0.0%) |
| Foreign Born, not a Citizen | 0 (0.0%) | 0 (0.0%) |
Health Insurance Coverage by Household Income in Chickamaw Beach
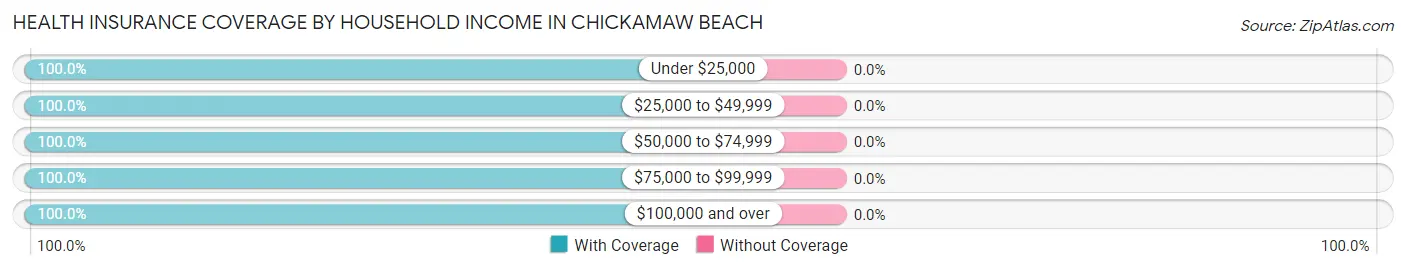
| Household Income | With Coverage | Without Coverage |
| Under $25,000 | 12 (100.0%) | 0 (0.0%) |
| $25,000 to $49,999 | 32 (100.0%) | 0 (0.0%) |
| $50,000 to $74,999 | 24 (100.0%) | 0 (0.0%) |
| $75,000 to $99,999 | 34 (100.0%) | 0 (0.0%) |
| $100,000 and over | 112 (100.0%) | 0 (0.0%) |
Public vs Private Health Insurance Coverage by Age in Chickamaw Beach
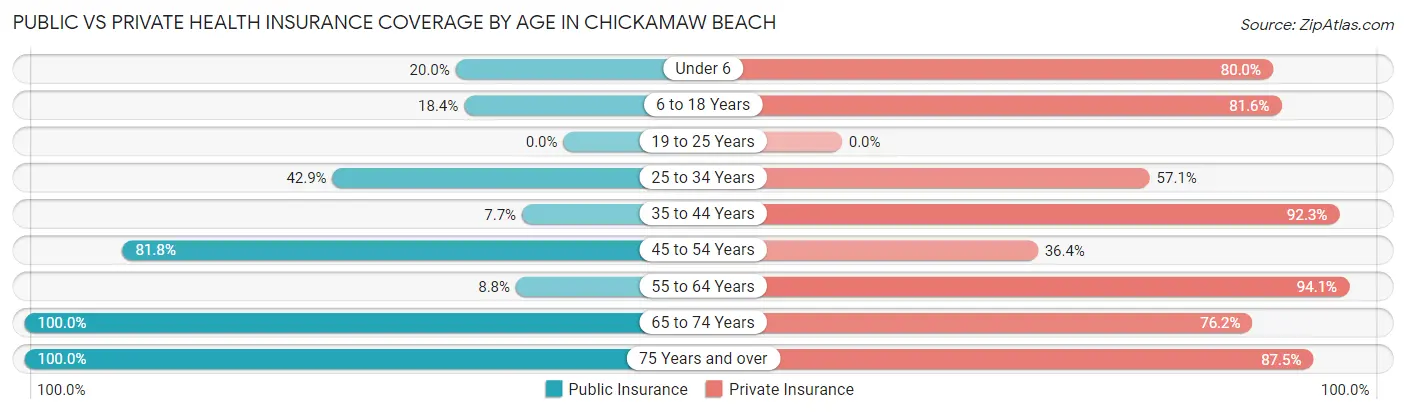
| Age Bracket | Public Insurance | Private Insurance |
| Under 6 | 8 (20.0%) | 32 (80.0%) |
| 6 to 18 Years | 7 (18.4%) | 31 (81.6%) |
| 19 to 25 Years | 0 (0.0%) | 0 (0.0%) |
| 25 to 34 Years | 12 (42.9%) | 16 (57.1%) |
| 35 to 44 Years | 2 (7.7%) | 24 (92.3%) |
| 45 to 54 Years | 9 (81.8%) | 4 (36.4%) |
| 55 to 64 Years | 3 (8.8%) | 32 (94.1%) |
| 65 to 74 Years | 21 (100.0%) | 16 (76.2%) |
| 75 Years and over | 16 (100.0%) | 14 (87.5%) |
| Total | 78 (36.4%) | 169 (79.0%) |
Disability Status by Sex by Age in Chickamaw Beach
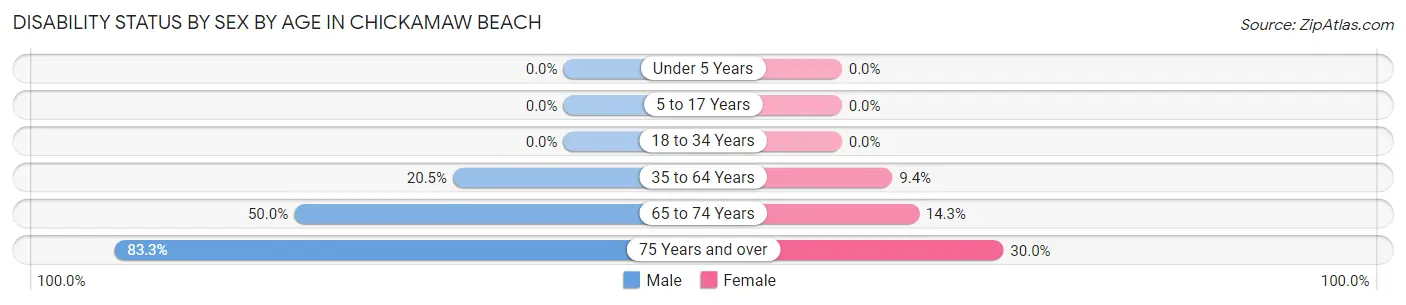
| Age Bracket | Male | Female |
| Under 5 Years | 0 (0.0%) | 0 (0.0%) |
| 5 to 17 Years | 0 (0.0%) | 0 (0.0%) |
| 18 to 34 Years | 0 (0.0%) | 0 (0.0%) |
| 35 to 64 Years | 8 (20.5%) | 3 (9.4%) |
| 65 to 74 Years | 7 (50.0%) | 1 (14.3%) |
| 75 Years and over | 5 (83.3%) | 3 (30.0%) |
Disability Class by Sex by Age in Chickamaw Beach
Disability Class: Hearing Difficulty
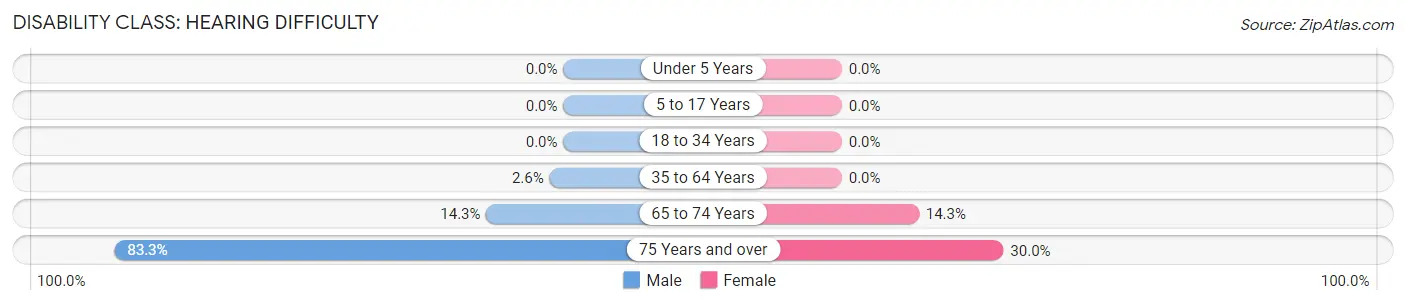
| Age Bracket | Male | Female |
| Under 5 Years | 0 (0.0%) | 0 (0.0%) |
| 5 to 17 Years | 0 (0.0%) | 0 (0.0%) |
| 18 to 34 Years | 0 (0.0%) | 0 (0.0%) |
| 35 to 64 Years | 1 (2.6%) | 0 (0.0%) |
| 65 to 74 Years | 2 (14.3%) | 1 (14.3%) |
| 75 Years and over | 5 (83.3%) | 3 (30.0%) |
Disability Class: Vision Difficulty
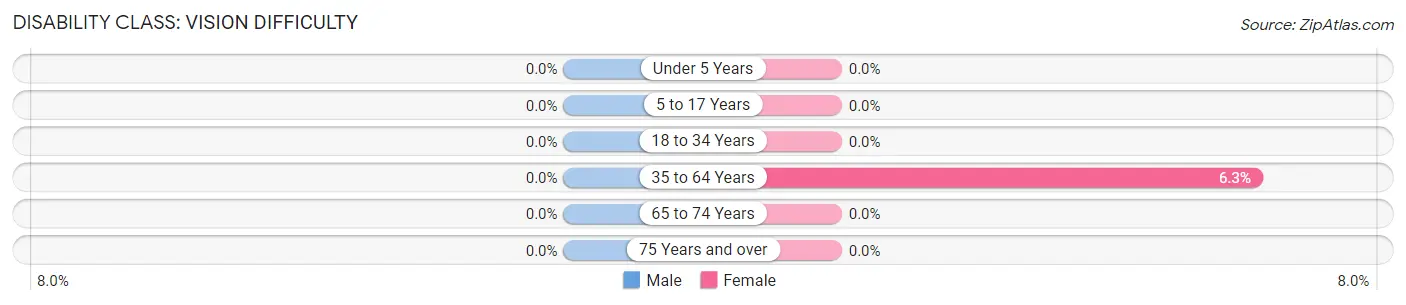
| Age Bracket | Male | Female |
| Under 5 Years | 0 (0.0%) | 0 (0.0%) |
| 5 to 17 Years | 0 (0.0%) | 0 (0.0%) |
| 18 to 34 Years | 0 (0.0%) | 0 (0.0%) |
| 35 to 64 Years | 0 (0.0%) | 2 (6.2%) |
| 65 to 74 Years | 0 (0.0%) | 0 (0.0%) |
| 75 Years and over | 0 (0.0%) | 0 (0.0%) |
Disability Class: Cognitive Difficulty
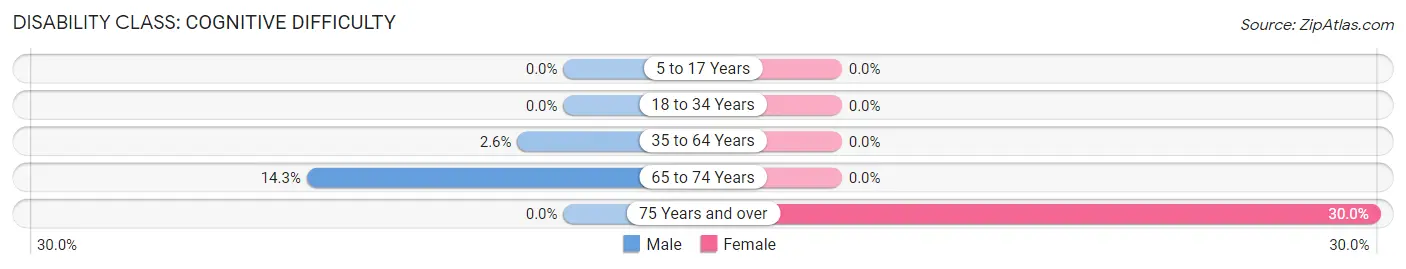
| Age Bracket | Male | Female |
| 5 to 17 Years | 0 (0.0%) | 0 (0.0%) |
| 18 to 34 Years | 0 (0.0%) | 0 (0.0%) |
| 35 to 64 Years | 1 (2.6%) | 0 (0.0%) |
| 65 to 74 Years | 2 (14.3%) | 0 (0.0%) |
| 75 Years and over | 0 (0.0%) | 3 (30.0%) |
Disability Class: Ambulatory Difficulty
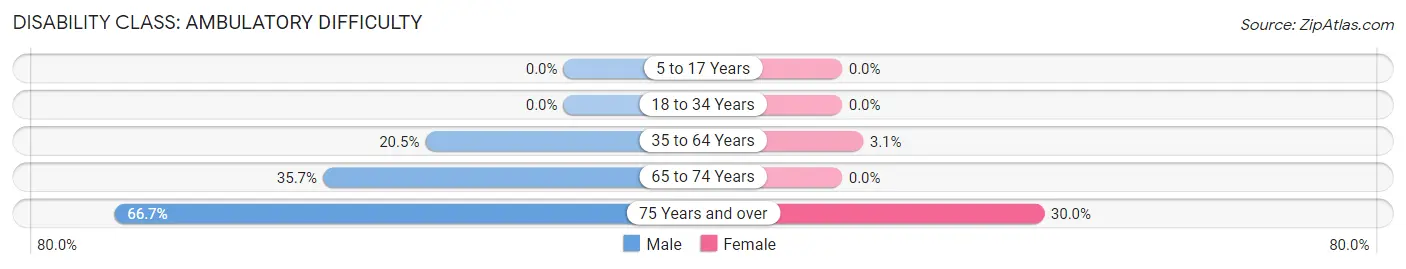
| Age Bracket | Male | Female |
| 5 to 17 Years | 0 (0.0%) | 0 (0.0%) |
| 18 to 34 Years | 0 (0.0%) | 0 (0.0%) |
| 35 to 64 Years | 8 (20.5%) | 1 (3.1%) |
| 65 to 74 Years | 5 (35.7%) | 0 (0.0%) |
| 75 Years and over | 4 (66.7%) | 3 (30.0%) |
Disability Class: Self-Care Difficulty
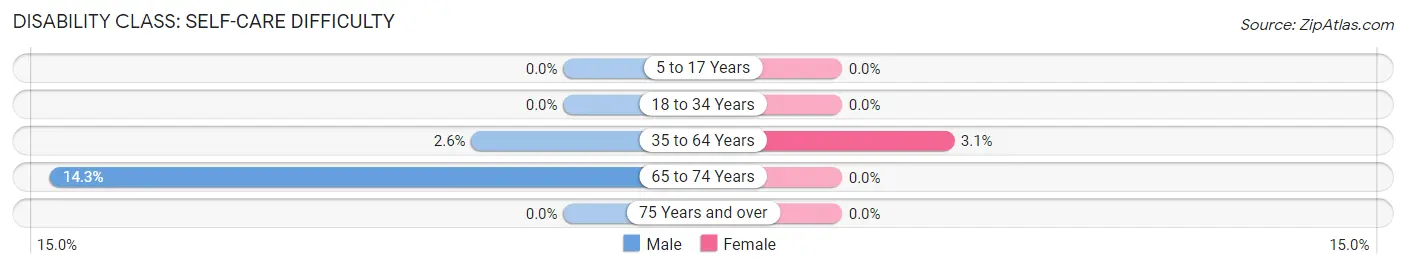
| Age Bracket | Male | Female |
| 5 to 17 Years | 0 (0.0%) | 0 (0.0%) |
| 18 to 34 Years | 0 (0.0%) | 0 (0.0%) |
| 35 to 64 Years | 1 (2.6%) | 1 (3.1%) |
| 65 to 74 Years | 2 (14.3%) | 0 (0.0%) |
| 75 Years and over | 0 (0.0%) | 0 (0.0%) |
Technology Access in Chickamaw Beach
Computing Device Access in Chickamaw Beach
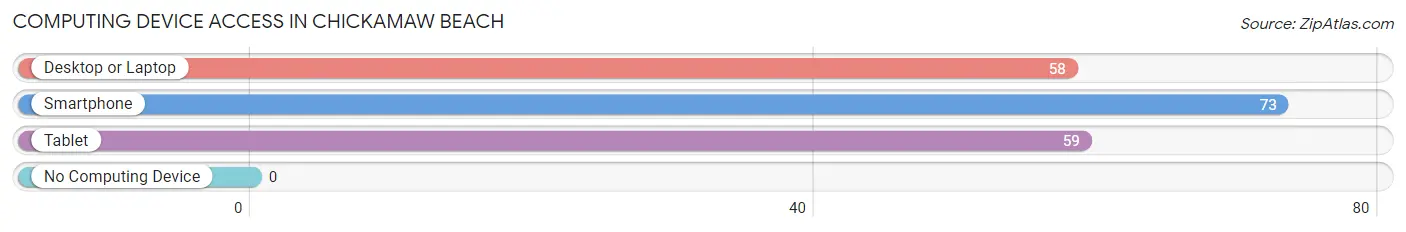
| Device Type | # Households | % Households |
| Desktop or Laptop | 58 | 73.4% |
| Smartphone | 73 | 92.4% |
| Tablet | 59 | 74.7% |
| No Computing Device | 0 | 0.0% |
| Total | 79 | 100.0% |
Internet Access in Chickamaw Beach
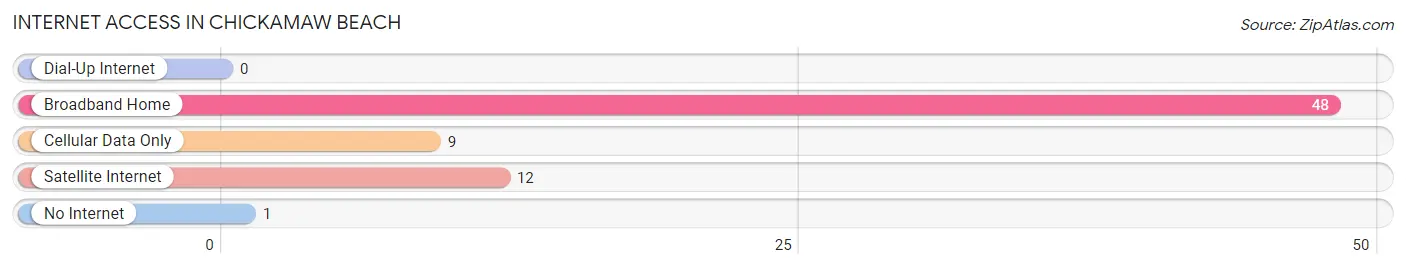
| Internet Type | # Households | % Households |
| Dial-Up Internet | 0 | 0.0% |
| Broadband Home | 48 | 60.8% |
| Cellular Data Only | 9 | 11.4% |
| Satellite Internet | 12 | 15.2% |
| No Internet | 1 | 1.3% |
| Total | 79 | 100.0% |
Chickamaw Beach Summary
Chickamaw Beach is a small unincorporated community located in the state of Minnesota, United States. It is situated in the northern part of the state, in the county of Cass. The community is located on the shores of Lake Winnibigoshish, a large lake in the region. The population of Chickamaw Beach was estimated to be around 200 people in the year 2000.
History
The area that is now known as Chickamaw Beach was first settled by the Ojibwe people in the late 1800s. The Ojibwe were a Native American tribe that lived in the area for centuries before the arrival of European settlers. The Ojibwe named the area “Chickamaw”, which means “big lake” in their language.
The first European settlers arrived in the area in the late 1800s. They were mostly farmers and loggers who were attracted to the area by the abundance of natural resources. The first permanent settlement was established in the early 1900s and the community was officially incorporated in 1912.
The community was named after the nearby lake, which was named after the Ojibwe word for “big lake”. The lake was a popular destination for fishing and recreation, and the community grew steadily over the years.
Geography
Chickamaw Beach is located in the northern part of Minnesota, in the county of Cass. The community is situated on the shores of Lake Winnibigoshish, a large lake in the region. The lake is approximately 11,842 acres in size and is a popular destination for fishing and recreation.
The community is surrounded by forests and wetlands, and is home to a variety of wildlife. The area is also known for its scenic beauty, with rolling hills and lush forests.
Economy
The economy of Chickamaw Beach is largely based on tourism and recreation. The community is a popular destination for fishing, boating, and other outdoor activities. There are several resorts and lodges in the area that cater to tourists and visitors.
The community also has a few small businesses, including a general store, a gas station, and a few restaurants. The local economy is also supported by the logging industry, as the area is home to several large timber companies.
Demographics
The population of Chickamaw Beach was estimated to be around 200 people in the year 2000. The majority of the population is white, with a small percentage of Native Americans. The median age of the population is around 40 years old.
The median household income in the community is around $35,000 per year. The unemployment rate is around 5%, which is slightly lower than the national average. The poverty rate is also slightly lower than the national average.
Conclusion
Chickamaw Beach is a small unincorporated community located in the northern part of Minnesota. The community is situated on the shores of Lake Winnibigoshish, a large lake in the region. The population of Chickamaw Beach was estimated to be around 200 people in the year 2000. The economy of the community is largely based on tourism and recreation, and the local economy is also supported by the logging industry. The majority of the population is white, with a small percentage of Native Americans. The median household income in the community is around $35,000 per year.
Common Questions
What is Per Capita Income in Chickamaw Beach?
Per Capita income in Chickamaw Beach is $34,760.
What is the Median Family Income in Chickamaw Beach?
Median Family Income in Chickamaw Beach is $112,727.
What is the Median Household income in Chickamaw Beach?
Median Household Income in Chickamaw Beach is $78,438.
What is Inequality or Gini Index in Chickamaw Beach?
Inequality or Gini Index in Chickamaw Beach is 0.30.
What is the Total Population of Chickamaw Beach?
Total Population of Chickamaw Beach is 214.
What is the Total Male Population of Chickamaw Beach?
Total Male Population of Chickamaw Beach is 107.
What is the Total Female Population of Chickamaw Beach?
Total Female Population of Chickamaw Beach is 107.
What is the Ratio of Males per 100 Females in Chickamaw Beach?
There are 100.00 Males per 100 Females in Chickamaw Beach.
What is the Ratio of Females per 100 Males in Chickamaw Beach?
There are 100.00 Females per 100 Males in Chickamaw Beach.
What is the Median Population Age in Chickamaw Beach?
Median Population Age in Chickamaw Beach is 36.5 Years.
What is the Average Family Size in Chickamaw Beach
Average Family Size in Chickamaw Beach is 3.3 People.
What is the Average Household Size in Chickamaw Beach
Average Household Size in Chickamaw Beach is 2.7 People.
How Large is the Labor Force in Chickamaw Beach?
There are 86 People in the Labor Forcein in Chickamaw Beach.
What is the Percentage of People in the Labor Force in Chickamaw Beach?
61.9% of People are in the Labor Force in Chickamaw Beach.
What is the Unemployment Rate in Chickamaw Beach?
Unemployment Rate in Chickamaw Beach is 2.3%.