Cunningham, KY Map & Demographics
Cunningham Map
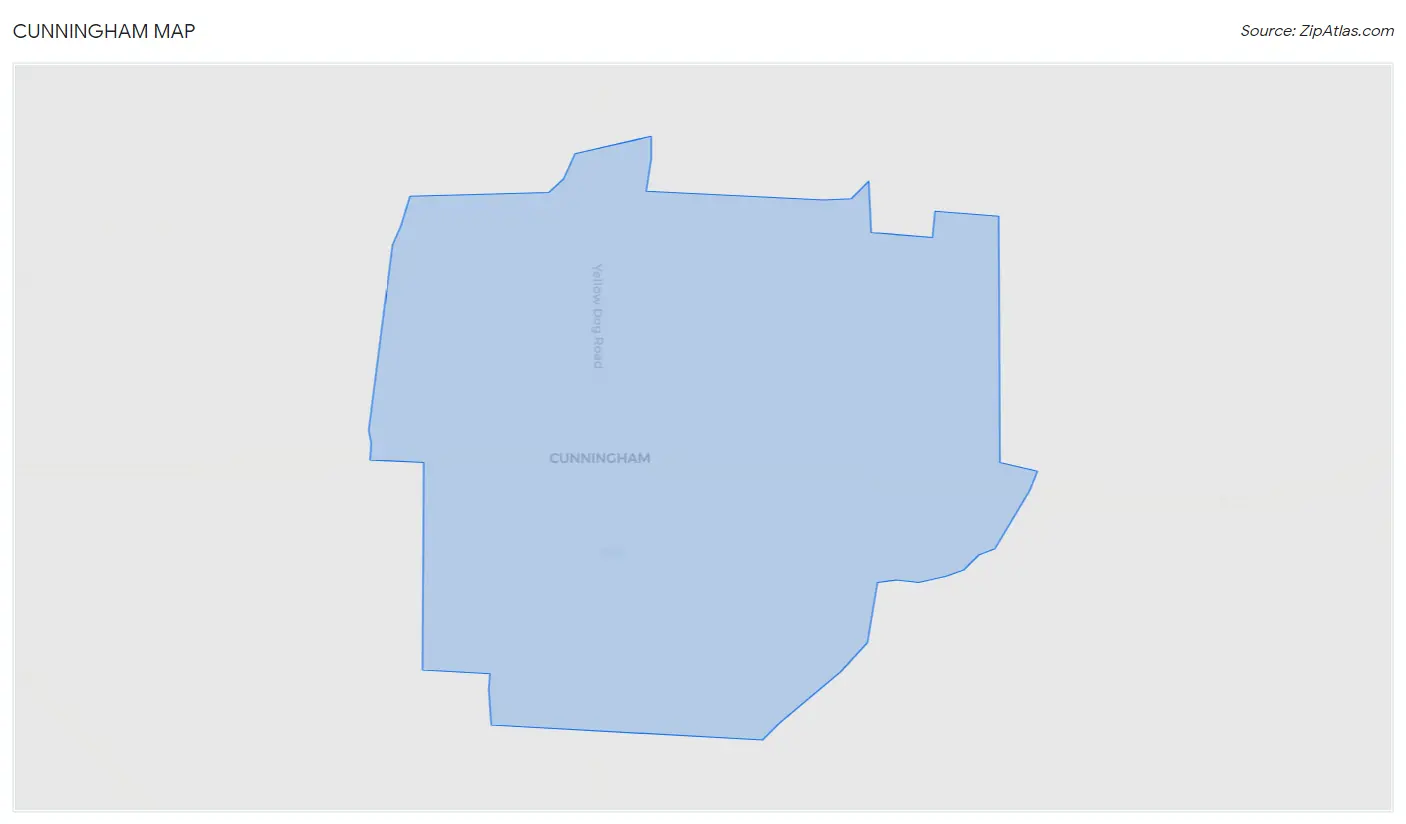
Cunningham Overview
$29,989
PER CAPITA INCOME
$37,941
AVG FAMILY INCOME
22.6%
WAGE / INCOME GAP [ % ]
77.4¢/ $1
WAGE / INCOME GAP [ $ ]
0.36
INEQUALITY / GINI INDEX
257
TOTAL POPULATION
82
MALE POPULATION
175
FEMALE POPULATION
46.86
MALES / 100 FEMALES
213.41
FEMALES / 100 MALES
41.0
MEDIAN AGE
2.7
AVG FAMILY SIZE
2.1
AVG HOUSEHOLD SIZE
105
LABOR FORCE [ PEOPLE ]
51.7%
PERCENT IN LABOR FORCE
Cunningham Zip Codes
Income in Cunningham
Income Overview in Cunningham
| Characteristic | Number | Measure |
| Per Capita Income | 257 | $29,989 |
| Median Family Income | 76 | $37,941 |
| Mean Family Income | 76 | $50,645 |
| Median Household Income | 125 | $0 |
| Mean Household Income | 125 | $61,406 |
| Income Deficit | 76 | $0 |
| Wage / Income Gap (%) | 257 | 22.59% |
| Wage / Income Gap ($) | 257 | 77.41¢ per $1 |
| Gini / Inequality Index | 257 | 0.36 |
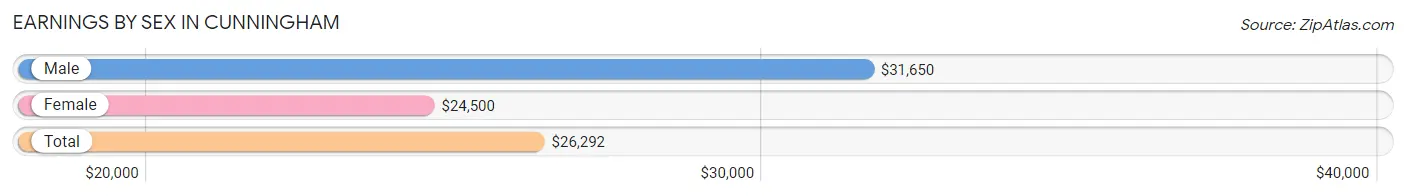
Earnings by Sex in Cunningham
Average Earnings in Cunningham are $26,292, $31,650 for men and $24,500 for women, a difference of 22.6%.
| Sex | Number | Average Earnings |
| Male | 43 (36.1%) | $31,650 |
| Female | 76 (63.9%) | $24,500 |
| Total | 119 (100.0%) | $26,292 |
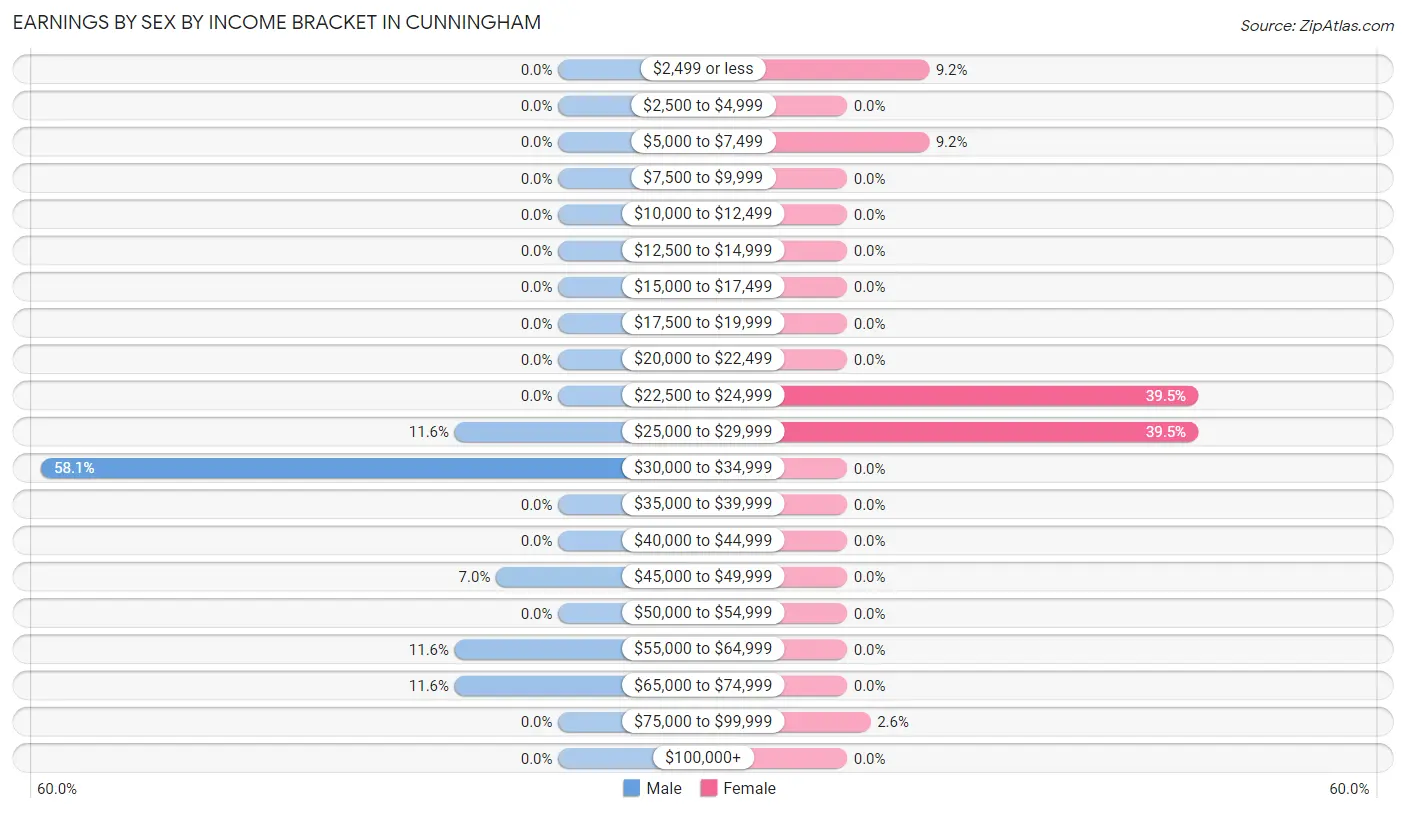
Earnings by Sex by Income Bracket in Cunningham
The most common earnings brackets in Cunningham are $30,000 to $34,999 for men (25 | 58.1%) and $22,500 to $24,999 for women (30 | 39.5%).
| Income | Male | Female |
| $2,499 or less | 0 (0.0%) | 7 (9.2%) |
| $2,500 to $4,999 | 0 (0.0%) | 0 (0.0%) |
| $5,000 to $7,499 | 0 (0.0%) | 7 (9.2%) |
| $7,500 to $9,999 | 0 (0.0%) | 0 (0.0%) |
| $10,000 to $12,499 | 0 (0.0%) | 0 (0.0%) |
| $12,500 to $14,999 | 0 (0.0%) | 0 (0.0%) |
| $15,000 to $17,499 | 0 (0.0%) | 0 (0.0%) |
| $17,500 to $19,999 | 0 (0.0%) | 0 (0.0%) |
| $20,000 to $22,499 | 0 (0.0%) | 0 (0.0%) |
| $22,500 to $24,999 | 0 (0.0%) | 30 (39.5%) |
| $25,000 to $29,999 | 5 (11.6%) | 30 (39.5%) |
| $30,000 to $34,999 | 25 (58.1%) | 0 (0.0%) |
| $35,000 to $39,999 | 0 (0.0%) | 0 (0.0%) |
| $40,000 to $44,999 | 0 (0.0%) | 0 (0.0%) |
| $45,000 to $49,999 | 3 (7.0%) | 0 (0.0%) |
| $50,000 to $54,999 | 0 (0.0%) | 0 (0.0%) |
| $55,000 to $64,999 | 5 (11.6%) | 0 (0.0%) |
| $65,000 to $74,999 | 5 (11.6%) | 0 (0.0%) |
| $75,000 to $99,999 | 0 (0.0%) | 2 (2.6%) |
| $100,000+ | 0 (0.0%) | 0 (0.0%) |
| Total | 43 (100.0%) | 76 (100.0%) |
Earnings by Sex by Educational Attainment in Cunningham
| Educational Attainment | Male Income | Female Income |
| Less than High School | - | - |
| High School Diploma | - | - |
| College or Associate's Degree | - | - |
| Bachelor's Degree | - | - |
| Graduate Degree | - | - |
| Total | $31,900 | $24,792 |
Family Income in Cunningham
Family Income Brackets in Cunningham
According to the Cunningham family income data, there are 35 families falling into the $25,000 to $34,999 income range, which is the most common income bracket and makes up 46.1% of all families.
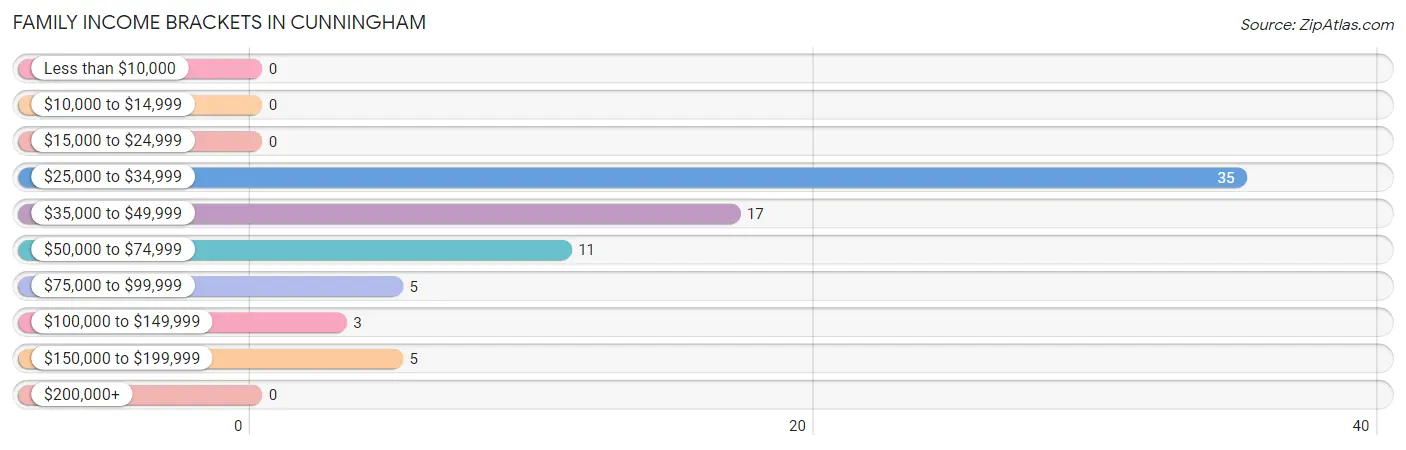
| Income Bracket | # Families | % Families |
| Less than $10,000 | 0 | 0.0% |
| $10,000 to $14,999 | 0 | 0.0% |
| $15,000 to $24,999 | 0 | 0.0% |
| $25,000 to $34,999 | 35 | 46.1% |
| $35,000 to $49,999 | 17 | 22.4% |
| $50,000 to $74,999 | 11 | 14.5% |
| $75,000 to $99,999 | 5 | 6.6% |
| $100,000 to $149,999 | 3 | 3.9% |
| $150,000 to $199,999 | 5 | 6.6% |
| $200,000+ | 0 | 0.0% |
Family Income by Famaliy Size in Cunningham
| Income Bracket | # Families | Median Income |
| 2-Person Families | 41 (53.9%) | $0 |
| 3-Person Families | 35 (46.1%) | $0 |
| 4-Person Families | 0 (0.0%) | $0 |
| 5-Person Families | 0 (0.0%) | $0 |
| 6-Person Families | 0 (0.0%) | $0 |
| 7+ Person Families | 0 (0.0%) | $0 |
| Total | 76 (100.0%) | $37,941 |
Family Income by Number of Earners in Cunningham
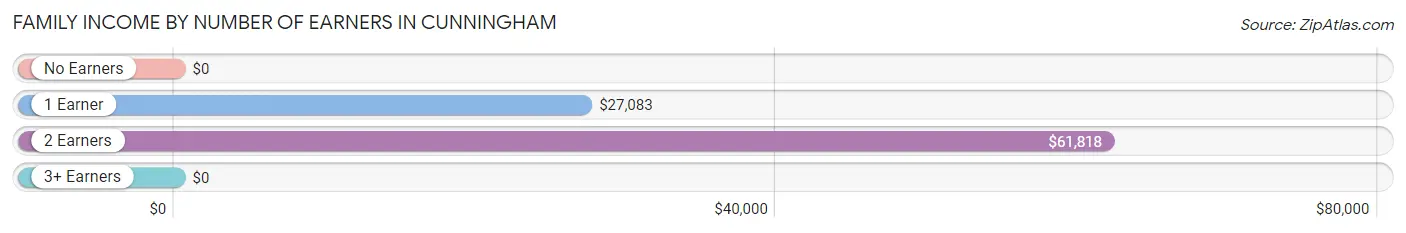
| Number of Earners | # Families | Median Income |
| No Earners | 0 (0.0%) | $0 |
| 1 Earner | 50 (65.8%) | $27,083 |
| 2 Earners | 26 (34.2%) | $61,818 |
| 3+ Earners | 0 (0.0%) | $0 |
| Total | 76 (100.0%) | $37,941 |
Household Income in Cunningham
Household Income Brackets in Cunningham
With 35 households falling in the category, the $25,000 to $34,999 income range is the most frequent in Cunningham, accounting for 28.0% of all households.
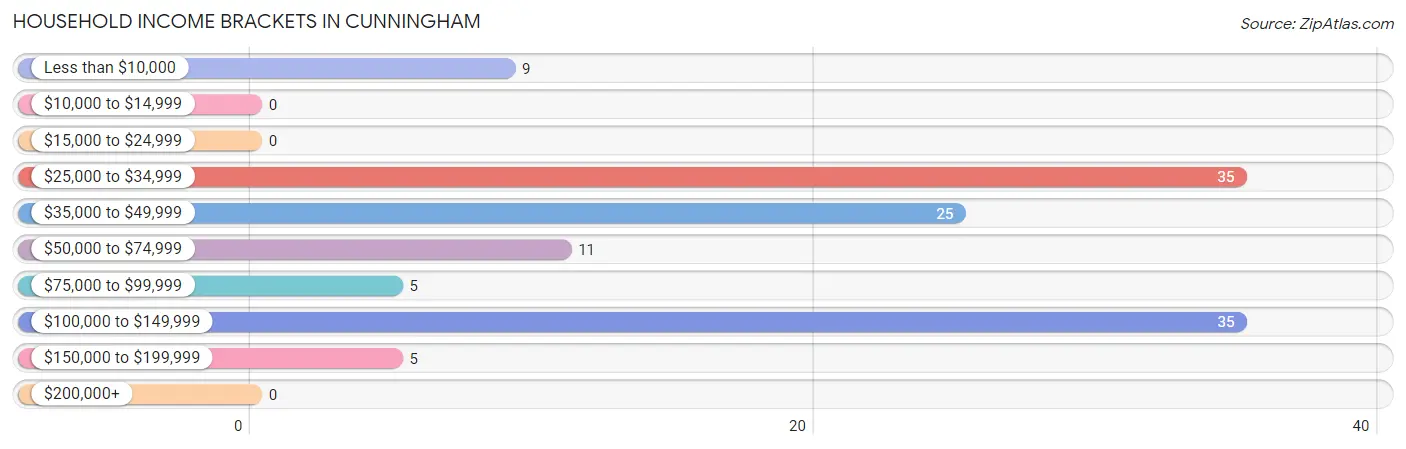
| Income Bracket | # Households | % Households |
| Less than $10,000 | 9 | 7.2% |
| $10,000 to $14,999 | 0 | 0.0% |
| $15,000 to $24,999 | 0 | 0.0% |
| $25,000 to $34,999 | 35 | 28.0% |
| $35,000 to $49,999 | 25 | 20.0% |
| $50,000 to $74,999 | 11 | 8.8% |
| $75,000 to $99,999 | 5 | 4.0% |
| $100,000 to $149,999 | 35 | 28.0% |
| $150,000 to $199,999 | 5 | 4.0% |
| $200,000+ | 0 | 0.0% |
Household Income by Householder Age in Cunningham
The median household income in Cunningham is $0, with the highest median household income of $93,000 found in the 45 to 64 years age bracket for the primary householder. A total of 24 households (19.2%) fall into this category. Meanwhile, the 15 to 24 years age bracket for the primary householder has the lowest median household income of $0, with 5 households (4.0%) in this group.
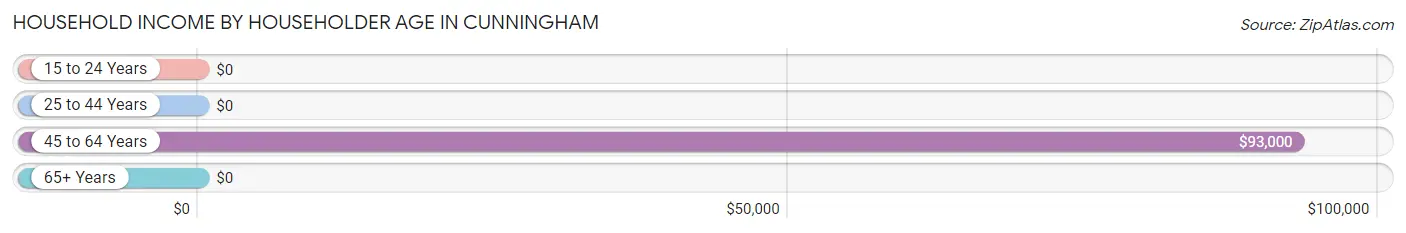
| Income Bracket | # Households | Median Income |
| 15 to 24 Years | 5 (4.0%) | $0 |
| 25 to 44 Years | 30 (24.0%) | $0 |
| 45 to 64 Years | 24 (19.2%) | $93,000 |
| 65+ Years | 66 (52.8%) | $0 |
| Total | 125 (100.0%) | $0 |
Poverty in Cunningham
Income Below Poverty by Sex and Age in Cunningham
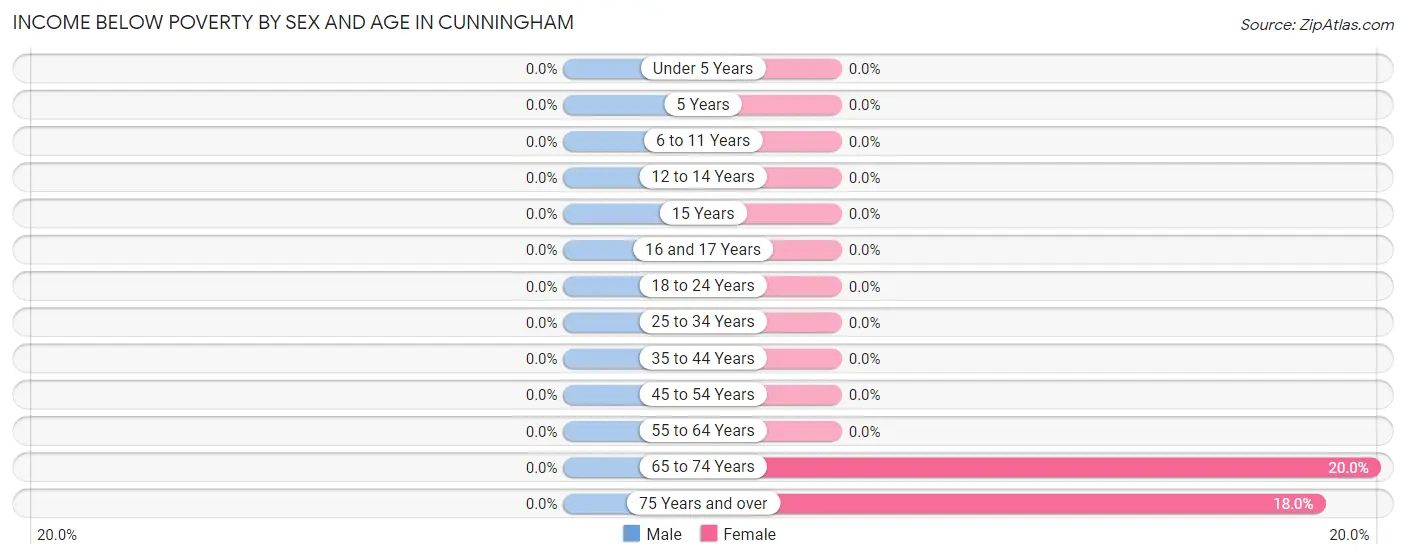
| Age Bracket | Male | Female |
| Under 5 Years | 0 (0.0%) | 0 (0.0%) |
| 5 Years | 0 (0.0%) | 0 (0.0%) |
| 6 to 11 Years | 0 (0.0%) | 0 (0.0%) |
| 12 to 14 Years | 0 (0.0%) | 0 (0.0%) |
| 15 Years | 0 (0.0%) | 0 (0.0%) |
| 16 and 17 Years | 0 (0.0%) | 0 (0.0%) |
| 18 to 24 Years | 0 (0.0%) | 0 (0.0%) |
| 25 to 34 Years | 0 (0.0%) | 0 (0.0%) |
| 35 to 44 Years | 0 (0.0%) | 0 (0.0%) |
| 45 to 54 Years | 0 (0.0%) | 0 (0.0%) |
| 55 to 64 Years | 0 (0.0%) | 0 (0.0%) |
| 65 to 74 Years | 0 (0.0%) | 2 (20.0%) |
| 75 Years and over | 0 (0.0%) | 7 (17.9%) |
| Total | 0 (0.0%) | 9 (5.1%) |
Income Above Poverty by Sex and Age in Cunningham
According to the poverty statistics in Cunningham, males aged 16 and 17 years and females aged 6 to 11 years are the age groups that are most secure financially, with 100.0% of males and 100.0% of females in these age groups living above the poverty line.
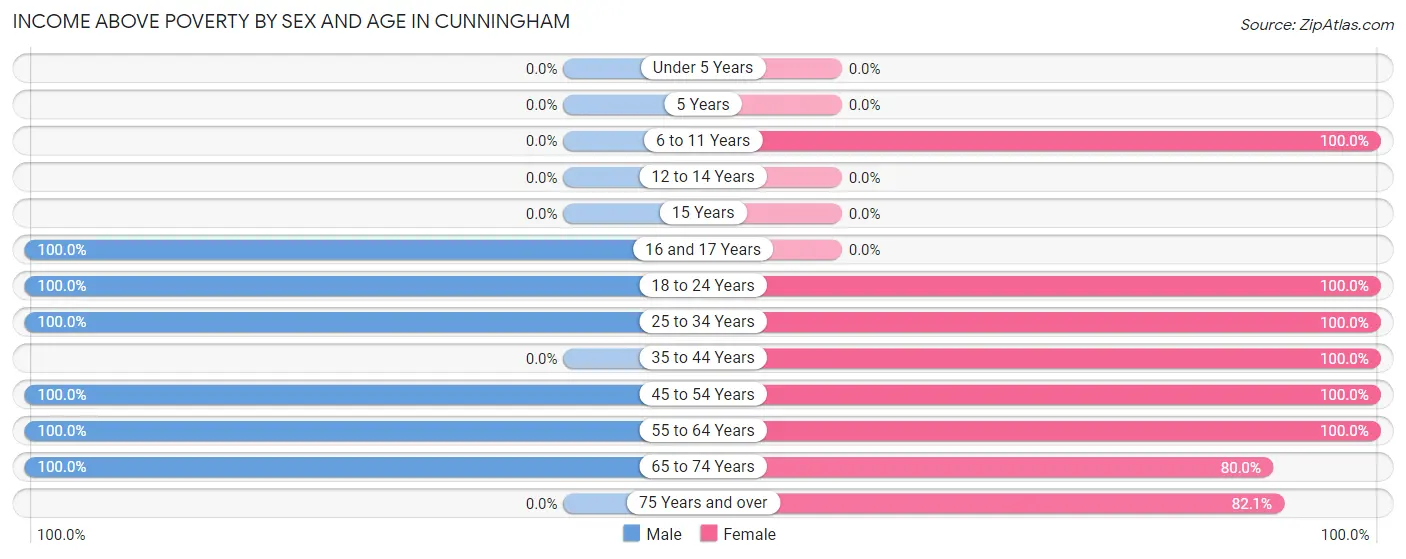
| Age Bracket | Male | Female |
| Under 5 Years | 0 (0.0%) | 0 (0.0%) |
| 5 Years | 0 (0.0%) | 0 (0.0%) |
| 6 to 11 Years | 0 (0.0%) | 54 (100.0%) |
| 12 to 14 Years | 0 (0.0%) | 0 (0.0%) |
| 15 Years | 0 (0.0%) | 0 (0.0%) |
| 16 and 17 Years | 2 (100.0%) | 0 (0.0%) |
| 18 to 24 Years | 25 (100.0%) | 7 (100.0%) |
| 25 to 34 Years | 14 (100.0%) | 26 (100.0%) |
| 35 to 44 Years | 0 (0.0%) | 30 (100.0%) |
| 45 to 54 Years | 16 (100.0%) | 2 (100.0%) |
| 55 to 64 Years | 8 (100.0%) | 7 (100.0%) |
| 65 to 74 Years | 17 (100.0%) | 8 (80.0%) |
| 75 Years and over | 0 (0.0%) | 32 (82.1%) |
| Total | 82 (100.0%) | 166 (94.9%) |
Income Below Poverty Among Married-Couple Families in Cunningham
| Children | Above Poverty | Below Poverty |
| No Children | 13 (100.0%) | 0 (0.0%) |
| 1 or 2 Children | 5 (100.0%) | 0 (0.0%) |
| 3 or 4 Children | 0 (0.0%) | 0 (0.0%) |
| 5 or more Children | 0 (0.0%) | 0 (0.0%) |
| Total | 18 (100.0%) | 0 (0.0%) |
Income Below Poverty Among Single-Parent Households in Cunningham
| Children | Single Father | Single Mother |
| No Children | 0 (0.0%) | 0 (0.0%) |
| 1 or 2 Children | 0 (0.0%) | 0 (0.0%) |
| 3 or 4 Children | 0 (0.0%) | 0 (0.0%) |
| 5 or more Children | 0 (0.0%) | 0 (0.0%) |
| Total | 0 (0.0%) | 0 (0.0%) |
Income Below Poverty Among Married-Couple vs Single-Parent Households in Cunningham
| Children | Married-Couple Families | Single-Parent Households |
| No Children | 0 (0.0%) | 0 (0.0%) |
| 1 or 2 Children | 0 (0.0%) | 0 (0.0%) |
| 3 or 4 Children | 0 (0.0%) | 0 (0.0%) |
| 5 or more Children | 0 (0.0%) | 0 (0.0%) |
| Total | 0 (0.0%) | 0 (0.0%) |
Race in Cunningham
The most populous races in Cunningham are , and White / Caucasian (257 | 100.0%).
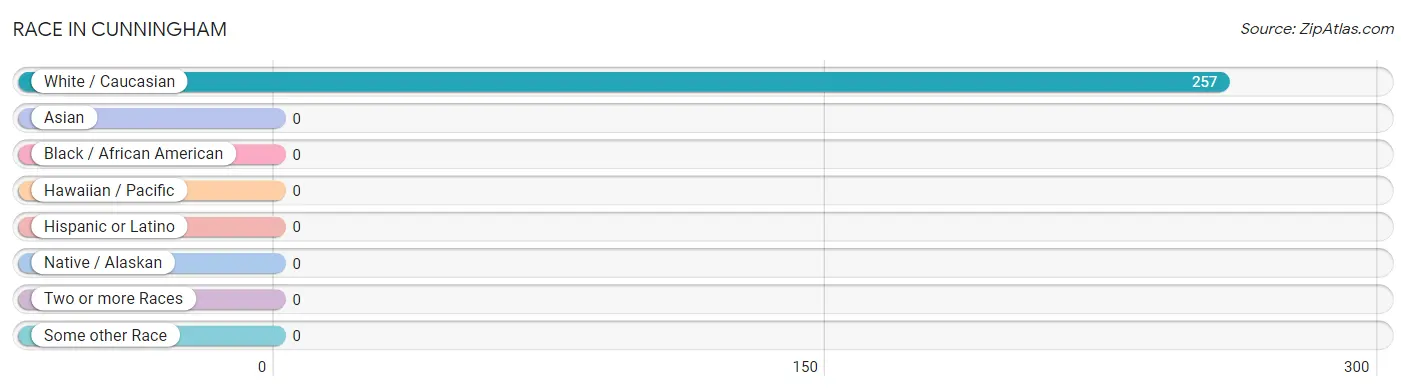
| Race | # Population | % Population |
| Asian | 0 | 0.0% |
| Black / African American | 0 | 0.0% |
| Hawaiian / Pacific | 0 | 0.0% |
| Hispanic or Latino | 0 | 0.0% |
| Native / Alaskan | 0 | 0.0% |
| White / Caucasian | 257 | 100.0% |
| Two or more Races | 0 | 0.0% |
| Some other Race | 0 | 0.0% |
| Total | 257 | 100.0% |
Ancestry in Cunningham
The most populous ancestries reported in Cunningham are English (179 | 69.7%), German (3 | 1.2%), Irish (3 | 1.2%), and European (2 | 0.8%), together accounting for 72.8% of all Cunningham residents.
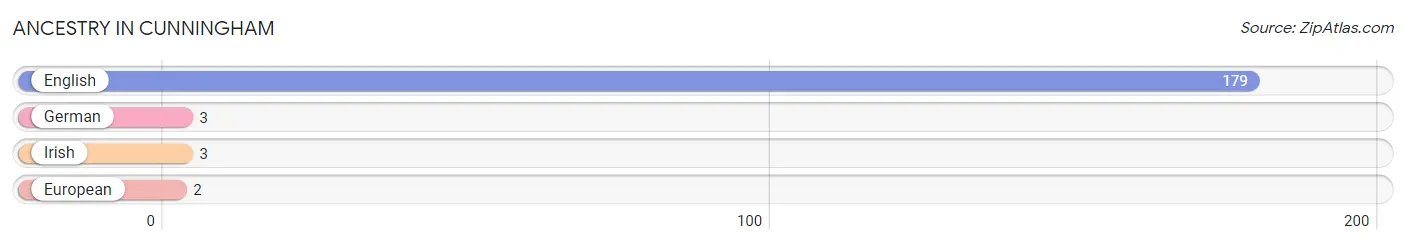
| Ancestry | # Population | % Population |
| English | 179 | 69.7% |
| European | 2 | 0.8% |
| German | 3 | 1.2% |
| Irish | 3 | 1.2% | View All 4 Rows |
Immigrants in Cunningham

| Immigration Origin | # Population | % Population | View All 0 Rows |
Sex and Age in Cunningham
Sex and Age in Cunningham
The most populous age groups in Cunningham are 15 to 19 Years (22 | 26.8%) for men and 5 to 9 Years (54 | 30.9%) for women.
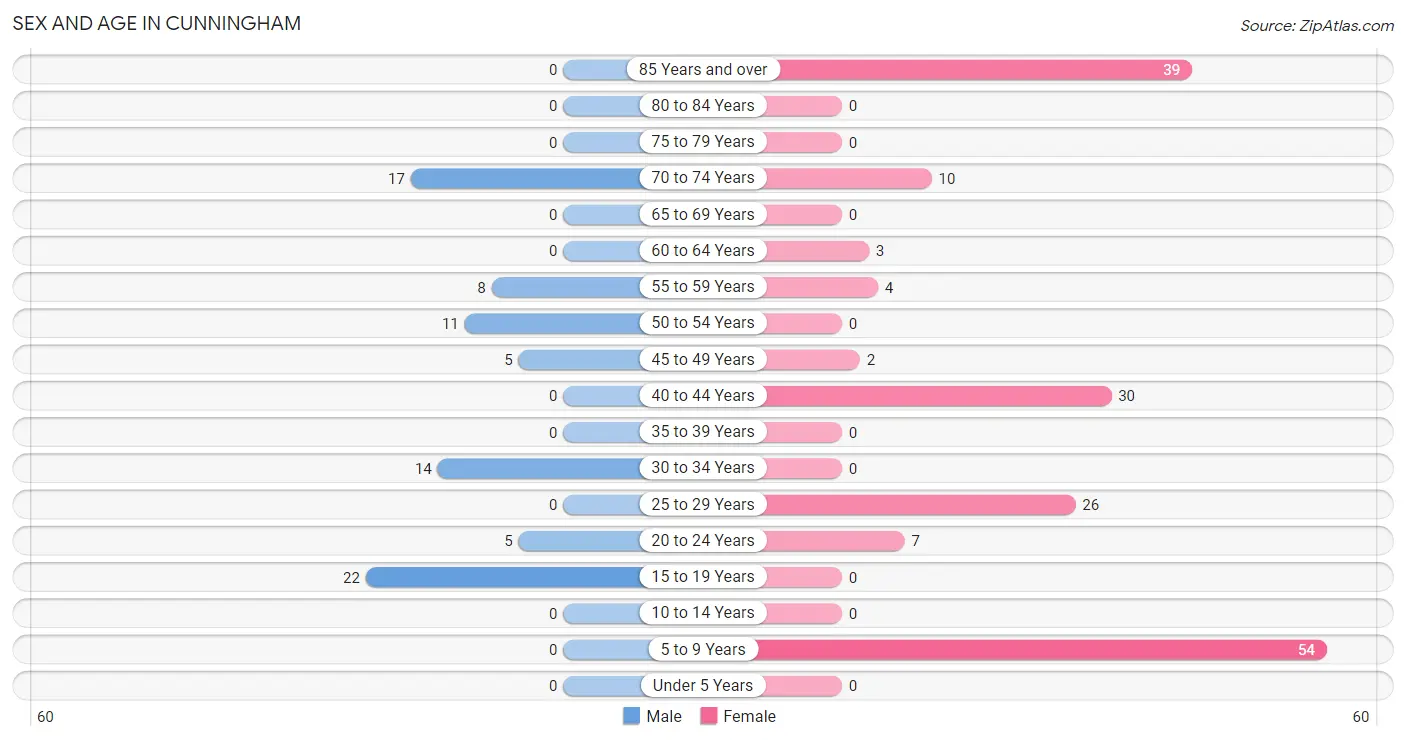
| Age Bracket | Male | Female |
| Under 5 Years | 0 (0.0%) | 0 (0.0%) |
| 5 to 9 Years | 0 (0.0%) | 54 (30.9%) |
| 10 to 14 Years | 0 (0.0%) | 0 (0.0%) |
| 15 to 19 Years | 22 (26.8%) | 0 (0.0%) |
| 20 to 24 Years | 5 (6.1%) | 7 (4.0%) |
| 25 to 29 Years | 0 (0.0%) | 26 (14.9%) |
| 30 to 34 Years | 14 (17.1%) | 0 (0.0%) |
| 35 to 39 Years | 0 (0.0%) | 0 (0.0%) |
| 40 to 44 Years | 0 (0.0%) | 30 (17.1%) |
| 45 to 49 Years | 5 (6.1%) | 2 (1.1%) |
| 50 to 54 Years | 11 (13.4%) | 0 (0.0%) |
| 55 to 59 Years | 8 (9.8%) | 4 (2.3%) |
| 60 to 64 Years | 0 (0.0%) | 3 (1.7%) |
| 65 to 69 Years | 0 (0.0%) | 0 (0.0%) |
| 70 to 74 Years | 17 (20.7%) | 10 (5.7%) |
| 75 to 79 Years | 0 (0.0%) | 0 (0.0%) |
| 80 to 84 Years | 0 (0.0%) | 0 (0.0%) |
| 85 Years and over | 0 (0.0%) | 39 (22.3%) |
| Total | 82 (100.0%) | 175 (100.0%) |
Families and Households in Cunningham
Median Family Size in Cunningham
The median family size in Cunningham is 2.74 persons per family, with single female/mother families (30 | 39.5%) accounting for the largest median family size of 3.47 persons per family. On the other hand, married-couple families (18 | 23.7%) represent the smallest median family size with 2.00 persons per family.
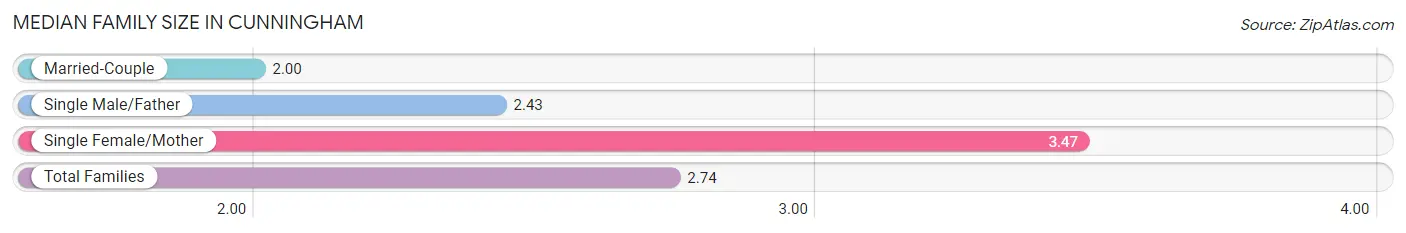
| Family Type | # Families | Family Size |
| Married-Couple | 18 (23.7%) | 2.00 |
| Single Male/Father | 28 (36.8%) | 2.43 |
| Single Female/Mother | 30 (39.5%) | 3.47 |
| Total Families | 76 (100.0%) | 2.74 |
Median Household Size in Cunningham
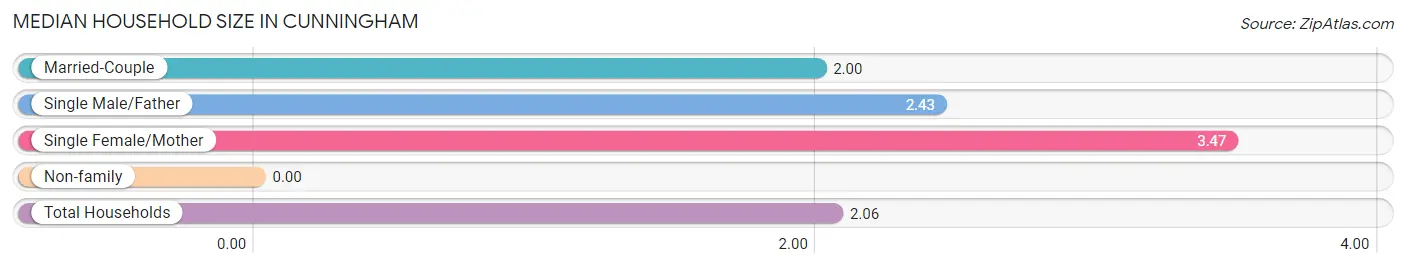
| Household Type | # Households | Household Size |
| Married-Couple | 18 (14.4%) | 2.00 |
| Single Male/Father | 28 (22.4%) | 2.43 |
| Single Female/Mother | 30 (24.0%) | 3.47 |
| Non-family | 49 (39.2%) | - |
| Total Households | 125 (100.0%) | 2.06 |
Household Size by Marriage Status in Cunningham
Out of a total of 125 households in Cunningham, 76 (60.8%) are family households, while 49 (39.2%) are nonfamily households. The most numerous type of family households are 2-person households, comprising 41, and the most common type of nonfamily households are 1-person households, comprising 49.
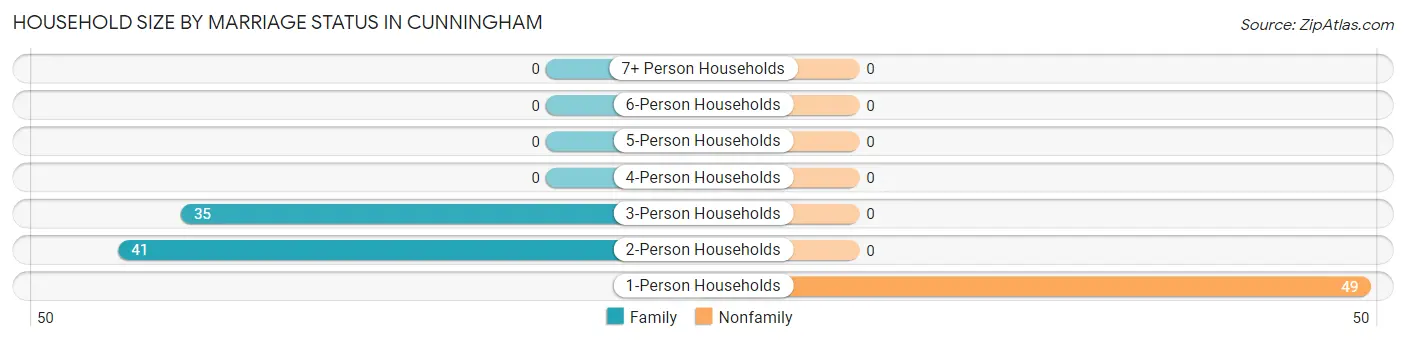
| Household Size | Family Households | Nonfamily Households |
| 1-Person Households | - | 49 (39.2%) |
| 2-Person Households | 41 (32.8%) | 0 (0.0%) |
| 3-Person Households | 35 (28.0%) | 0 (0.0%) |
| 4-Person Households | 0 (0.0%) | 0 (0.0%) |
| 5-Person Households | 0 (0.0%) | 0 (0.0%) |
| 6-Person Households | 0 (0.0%) | 0 (0.0%) |
| 7+ Person Households | 0 (0.0%) | 0 (0.0%) |
| Total | 76 (60.8%) | 49 (39.2%) |
Female Fertility in Cunningham
Fertility by Age in Cunningham
| Age Bracket | Women with Births | Births / 1,000 Women |
| 15 to 19 years | 0 (0.0%) | 0.0 |
| 20 to 34 years | 0 (0.0%) | 0.0 |
| 35 to 50 years | 0 (0.0%) | 0.0 |
| Total | 0 (0.0%) | 0.0 |
Fertility by Age by Marriage Status in Cunningham
| Age Bracket | Married | Unmarried |
| 15 to 19 years | 0 (0.0%) | 0 (0.0%) |
| 20 to 34 years | 0 (0.0%) | 0 (0.0%) |
| 35 to 50 years | 0 (0.0%) | 0 (0.0%) |
| Total | 0 (0.0%) | 0 (0.0%) |
Fertility by Education in Cunningham
| Educational Attainment | Women with Births | Births / 1,000 Women |
| Less than High School | 0 (0.0%) | 0.0 |
| High School Diploma | 0 (0.0%) | 0.0 |
| College or Associate's Degree | 0 (0.0%) | 0.0 |
| Bachelor's Degree | 0 (0.0%) | 0.0 |
| Graduate Degree | 0 (0.0%) | 0.0 |
| Total | 0 (0.0%) | 0.0 |
Fertility by Education by Marriage Status in Cunningham
| Educational Attainment | Married | Unmarried |
| Less than High School | 0 (0.0%) | 0 (0.0%) |
| High School Diploma | 0 (0.0%) | 0 (0.0%) |
| College or Associate's Degree | 0 (0.0%) | 0 (0.0%) |
| Bachelor's Degree | 0 (0.0%) | 0 (0.0%) |
| Graduate Degree | 0 (0.0%) | 0 (0.0%) |
| Total | 0 (0.0%) | 0 (0.0%) |
Employment Characteristics in Cunningham
Employment by Class of Employer in Cunningham
Among the 105 employed individuals in Cunningham, private company employees (83 | 79.0%), self-employed (not incorporated) (13 | 12.4%), and state government employees (5 | 4.8%) make up the most common classes of employment.
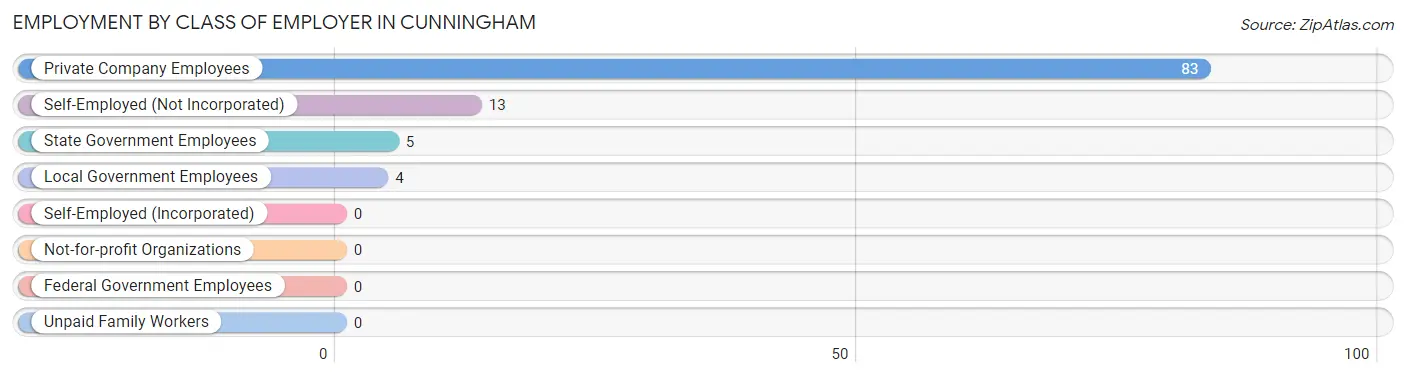
| Employer Class | # Employees | % Employees |
| Private Company Employees | 83 | 79.0% |
| Self-Employed (Incorporated) | 0 | 0.0% |
| Self-Employed (Not Incorporated) | 13 | 12.4% |
| Not-for-profit Organizations | 0 | 0.0% |
| Local Government Employees | 4 | 3.8% |
| State Government Employees | 5 | 4.8% |
| Federal Government Employees | 0 | 0.0% |
| Unpaid Family Workers | 0 | 0.0% |
| Total | 105 | 100.0% |
Employment Status by Age in Cunningham
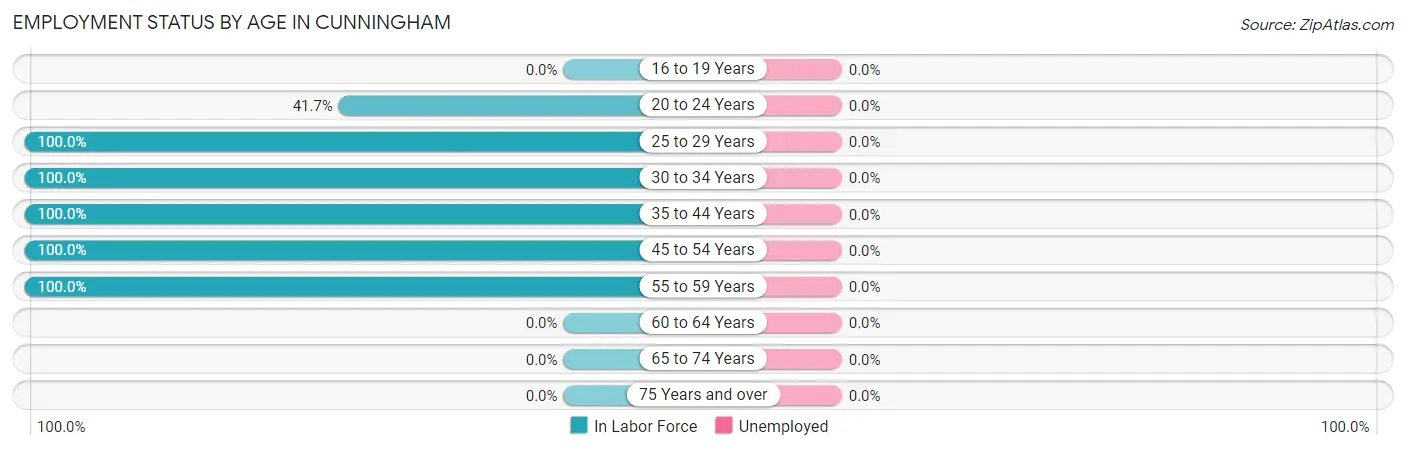
| Age Bracket | In Labor Force | Unemployed |
| 16 to 19 Years | 0 (0.0%) | 0 (0.0%) |
| 20 to 24 Years | 5 (41.7%) | 0 (0.0%) |
| 25 to 29 Years | 26 (100.0%) | 0 (0.0%) |
| 30 to 34 Years | 14 (100.0%) | 0 (0.0%) |
| 35 to 44 Years | 30 (100.0%) | 0 (0.0%) |
| 45 to 54 Years | 18 (100.0%) | 0 (0.0%) |
| 55 to 59 Years | 12 (100.0%) | 0 (0.0%) |
| 60 to 64 Years | 0 (0.0%) | 0 (0.0%) |
| 65 to 74 Years | 0 (0.0%) | 0 (0.0%) |
| 75 Years and over | 0 (0.0%) | 0 (0.0%) |
| Total | 105 (51.7%) | 0 (0.0%) |
Employment Status by Educational Attainment in Cunningham
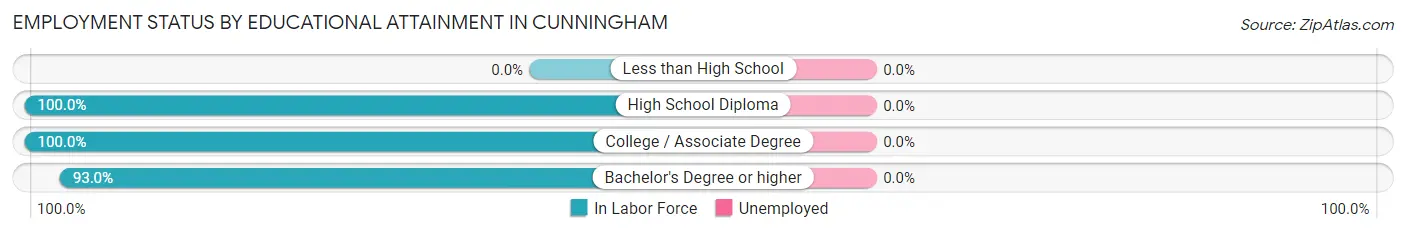
| Educational Attainment | In Labor Force | Unemployed |
| Less than High School | 0 (0.0%) | 0 (0.0%) |
| High School Diploma | 51 (100.0%) | 0 (0.0%) |
| College / Associate Degree | 9 (100.0%) | 0 (0.0%) |
| Bachelor's Degree or higher | 40 (93.0%) | 0 (0.0%) |
| Total | 100 (97.1%) | 0 (0.0%) |
Employment Occupations by Sex in Cunningham
Management, Business, Science and Arts Occupations
The most common Management, Business, Science and Arts occupations in Cunningham are Community & Social Service (48 | 45.7%), Education, Arts & Media (34 | 32.4%), Arts, Media & Entertainment (14 | 13.3%), Health Diagnosing & Treating (8 | 7.6%), and Health Technologists (5 | 4.8%).
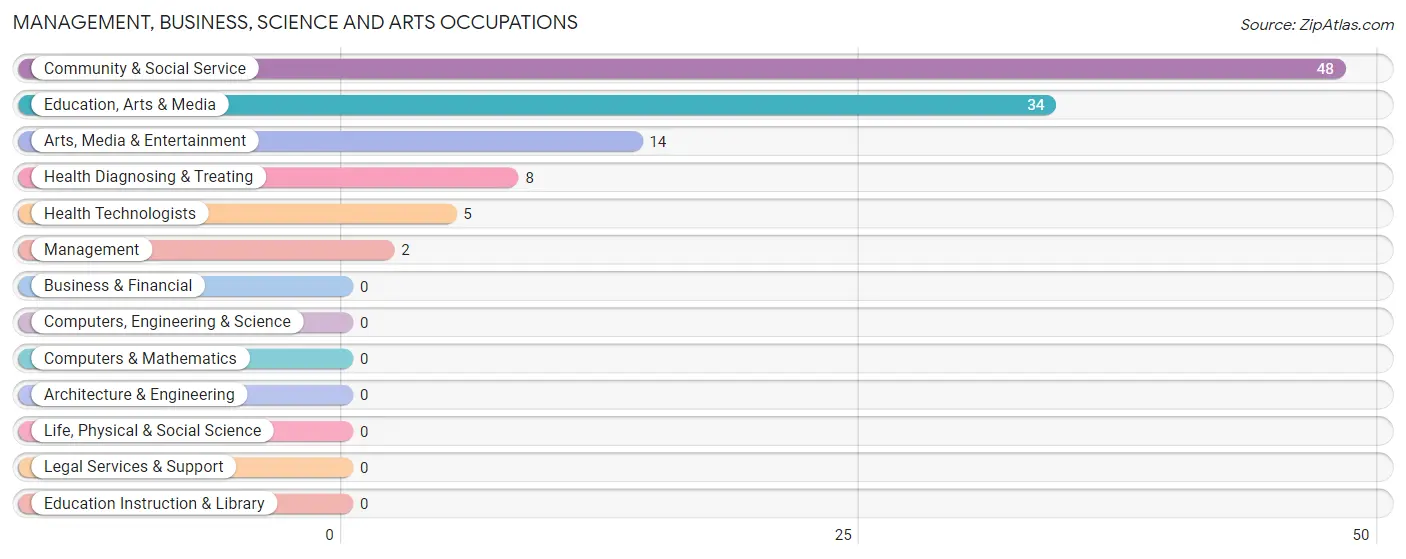
Management, Business, Science and Arts Occupations by Sex
Within the Management, Business, Science and Arts occupations in Cunningham, the most male-oriented occupations are Arts, Media & Entertainment (100.0%), Health Diagnosing & Treating (100.0%), and Health Technologists (100.0%), while the most female-oriented occupations are Management (100.0%), Education, Arts & Media (100.0%), and Community & Social Service (70.8%).
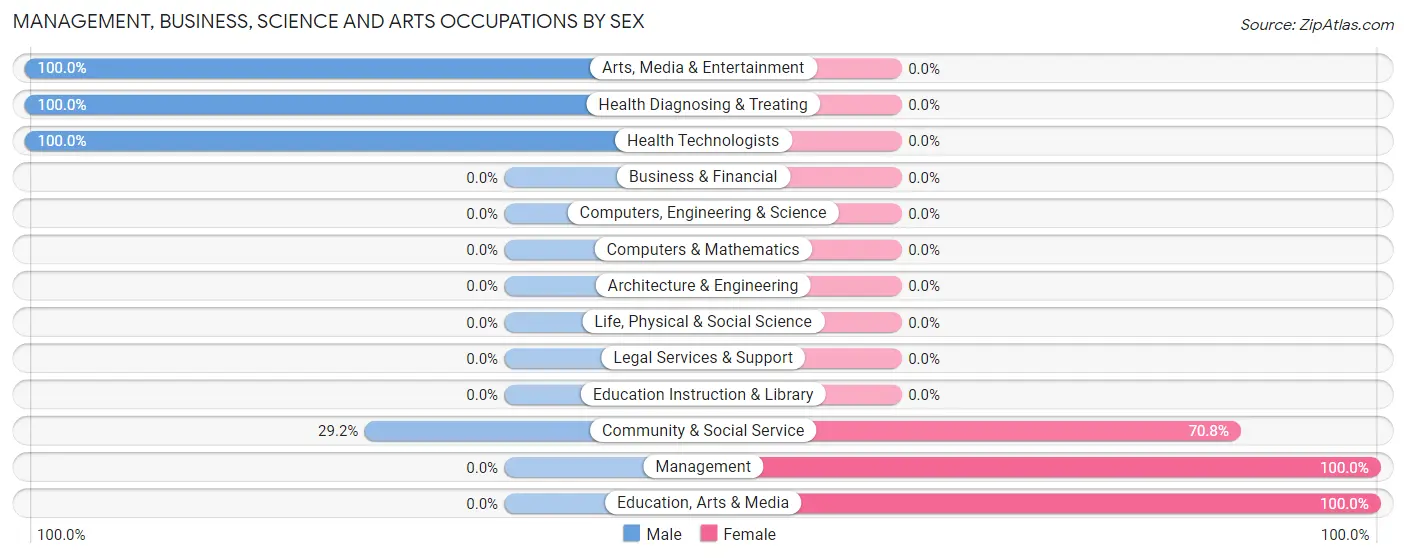
| Occupation | Male | Female |
| Management | 0 (0.0%) | 2 (100.0%) |
| Business & Financial | 0 (0.0%) | 0 (0.0%) |
| Computers, Engineering & Science | 0 (0.0%) | 0 (0.0%) |
| Computers & Mathematics | 0 (0.0%) | 0 (0.0%) |
| Architecture & Engineering | 0 (0.0%) | 0 (0.0%) |
| Life, Physical & Social Science | 0 (0.0%) | 0 (0.0%) |
| Community & Social Service | 14 (29.2%) | 34 (70.8%) |
| Education, Arts & Media | 0 (0.0%) | 34 (100.0%) |
| Legal Services & Support | 0 (0.0%) | 0 (0.0%) |
| Education Instruction & Library | 0 (0.0%) | 0 (0.0%) |
| Arts, Media & Entertainment | 14 (100.0%) | 0 (0.0%) |
| Health Diagnosing & Treating | 8 (100.0%) | 0 (0.0%) |
| Health Technologists | 5 (100.0%) | 0 (0.0%) |
| Total (Category) | 22 (37.9%) | 36 (62.1%) |
| Total (Overall) | 43 (40.9%) | 62 (59.1%) |
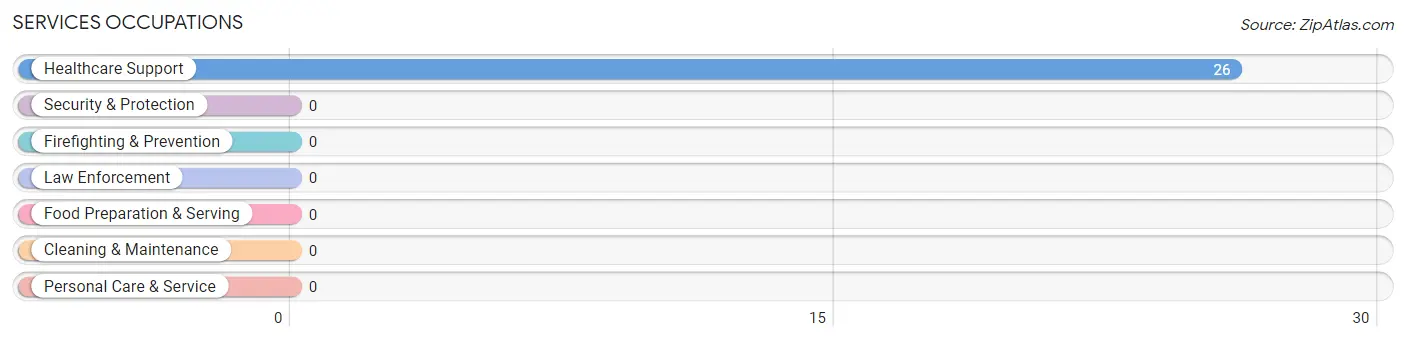
Services Occupations
The most common Services occupations in Cunningham are , and Healthcare Support (26 | 24.8%).
Services Occupations by Sex
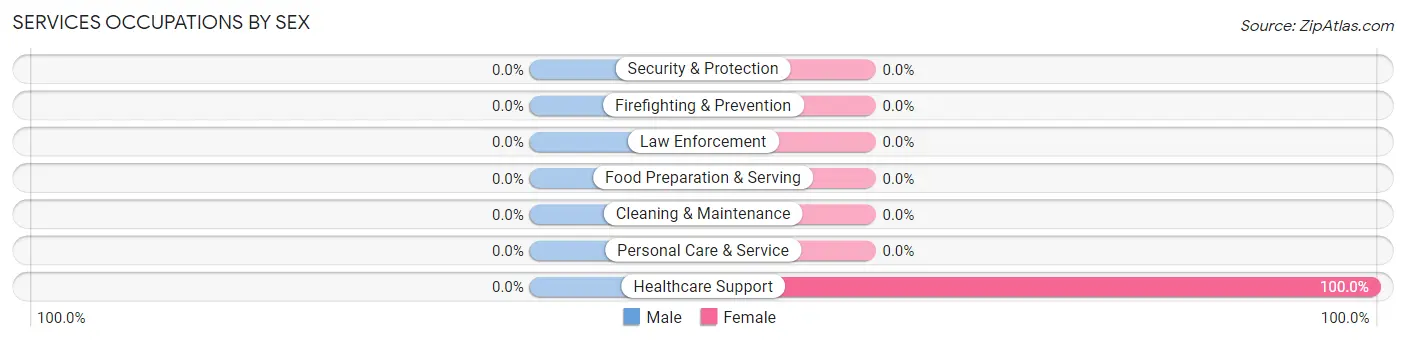
| Occupation | Male | Female |
| Healthcare Support | 0 (0.0%) | 26 (100.0%) |
| Security & Protection | 0 (0.0%) | 0 (0.0%) |
| Firefighting & Prevention | 0 (0.0%) | 0 (0.0%) |
| Law Enforcement | 0 (0.0%) | 0 (0.0%) |
| Food Preparation & Serving | 0 (0.0%) | 0 (0.0%) |
| Cleaning & Maintenance | 0 (0.0%) | 0 (0.0%) |
| Personal Care & Service | 0 (0.0%) | 0 (0.0%) |
| Total (Category) | 0 (0.0%) | 26 (100.0%) |
| Total (Overall) | 43 (40.9%) | 62 (59.1%) |
Sales and Office Occupations
Sales and Office Occupations by Sex
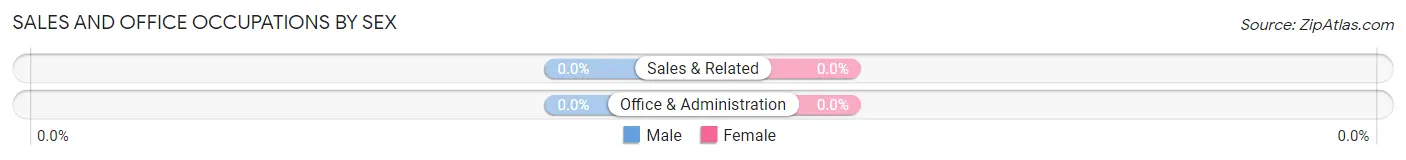
| Occupation | Male | Female |
| Sales & Related | 0 (0.0%) | 0 (0.0%) |
| Office & Administration | 0 (0.0%) | 0 (0.0%) |
| Total (Category) | 0 (0.0%) | 0 (0.0%) |
| Total (Overall) | 43 (40.9%) | 62 (59.1%) |
Natural Resources, Construction and Maintenance Occupations
The most common Natural Resources, Construction and Maintenance occupations in Cunningham are , and Construction & Extraction (16 | 15.2%).
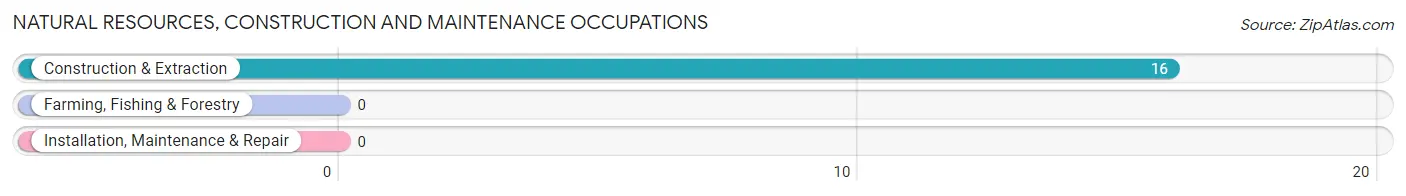
Natural Resources, Construction and Maintenance Occupations by Sex
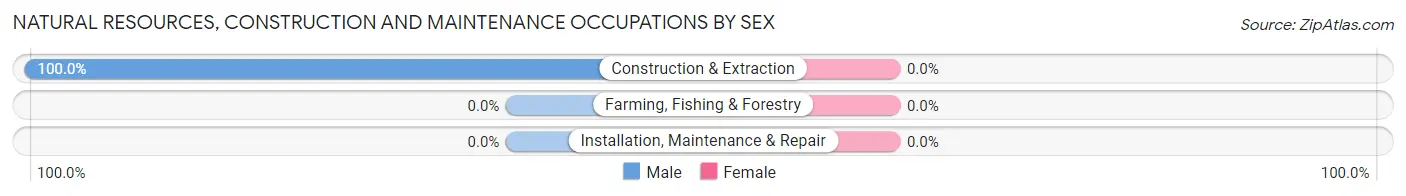
| Occupation | Male | Female |
| Farming, Fishing & Forestry | 0 (0.0%) | 0 (0.0%) |
| Construction & Extraction | 16 (100.0%) | 0 (0.0%) |
| Installation, Maintenance & Repair | 0 (0.0%) | 0 (0.0%) |
| Total (Category) | 16 (100.0%) | 0 (0.0%) |
| Total (Overall) | 43 (40.9%) | 62 (59.1%) |
Production, Transportation and Moving Occupations
The most common Production, Transportation and Moving occupations in Cunningham are , and Production (5 | 4.8%).
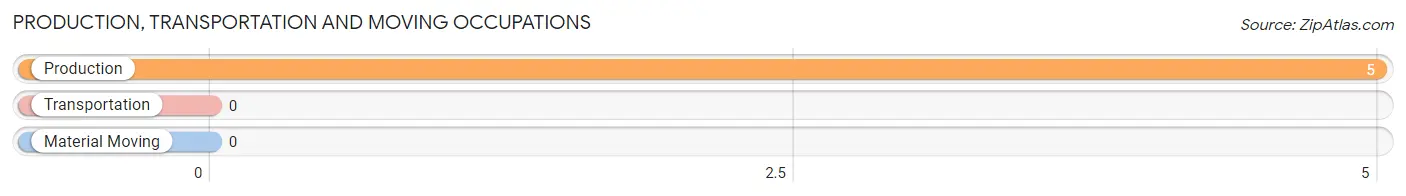
Production, Transportation and Moving Occupations by Sex
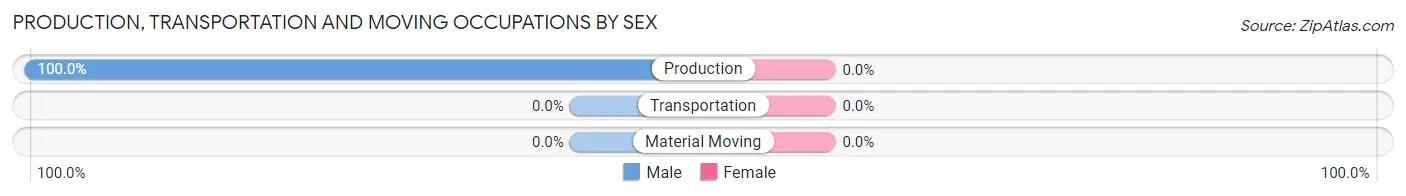
| Occupation | Male | Female |
| Production | 5 (100.0%) | 0 (0.0%) |
| Transportation | 0 (0.0%) | 0 (0.0%) |
| Material Moving | 0 (0.0%) | 0 (0.0%) |
| Total (Category) | 5 (100.0%) | 0 (0.0%) |
| Total (Overall) | 43 (40.9%) | 62 (59.1%) |
Employment Industries by Sex in Cunningham
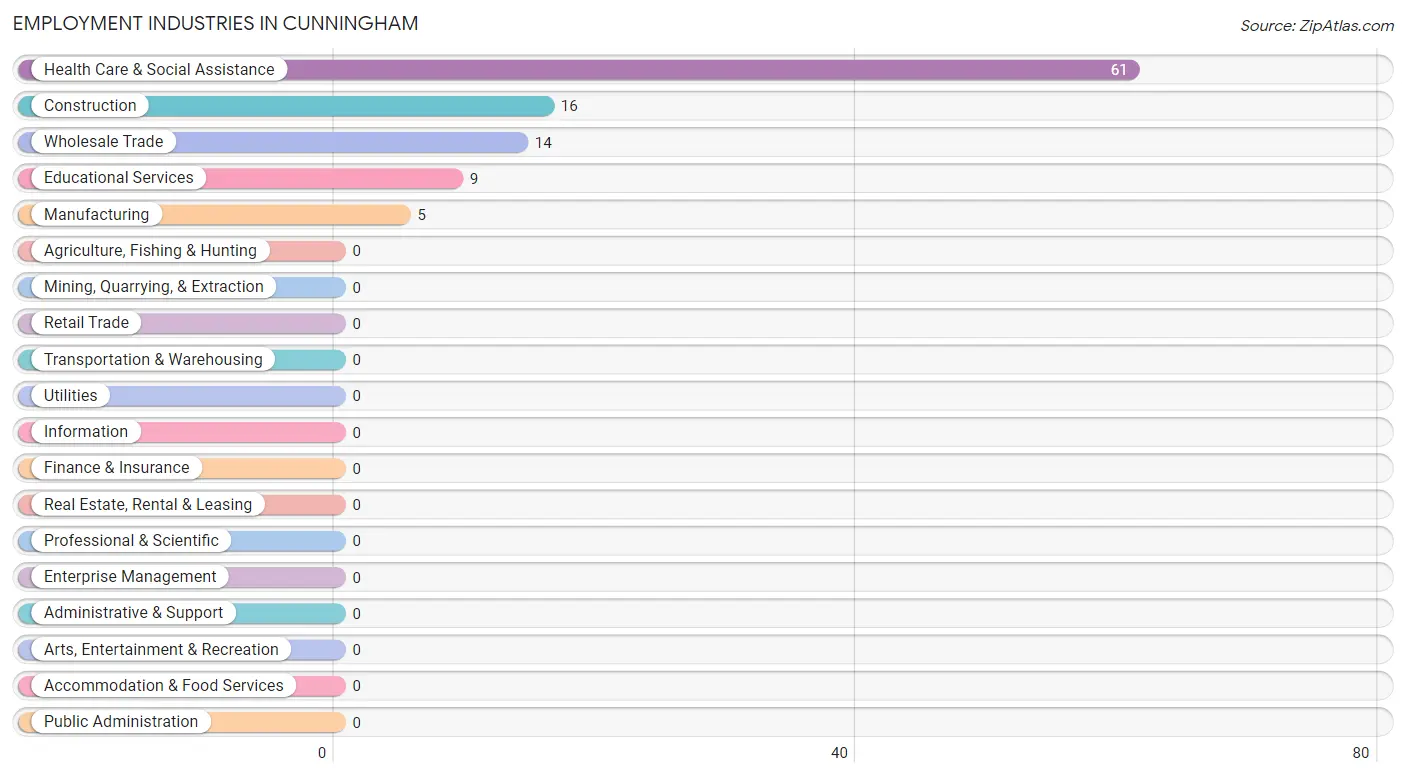
Employment Industries in Cunningham
The major employment industries in Cunningham include Health Care & Social Assistance (61 | 58.1%), Construction (16 | 15.2%), Wholesale Trade (14 | 13.3%), Educational Services (9 | 8.6%), and Manufacturing (5 | 4.8%).
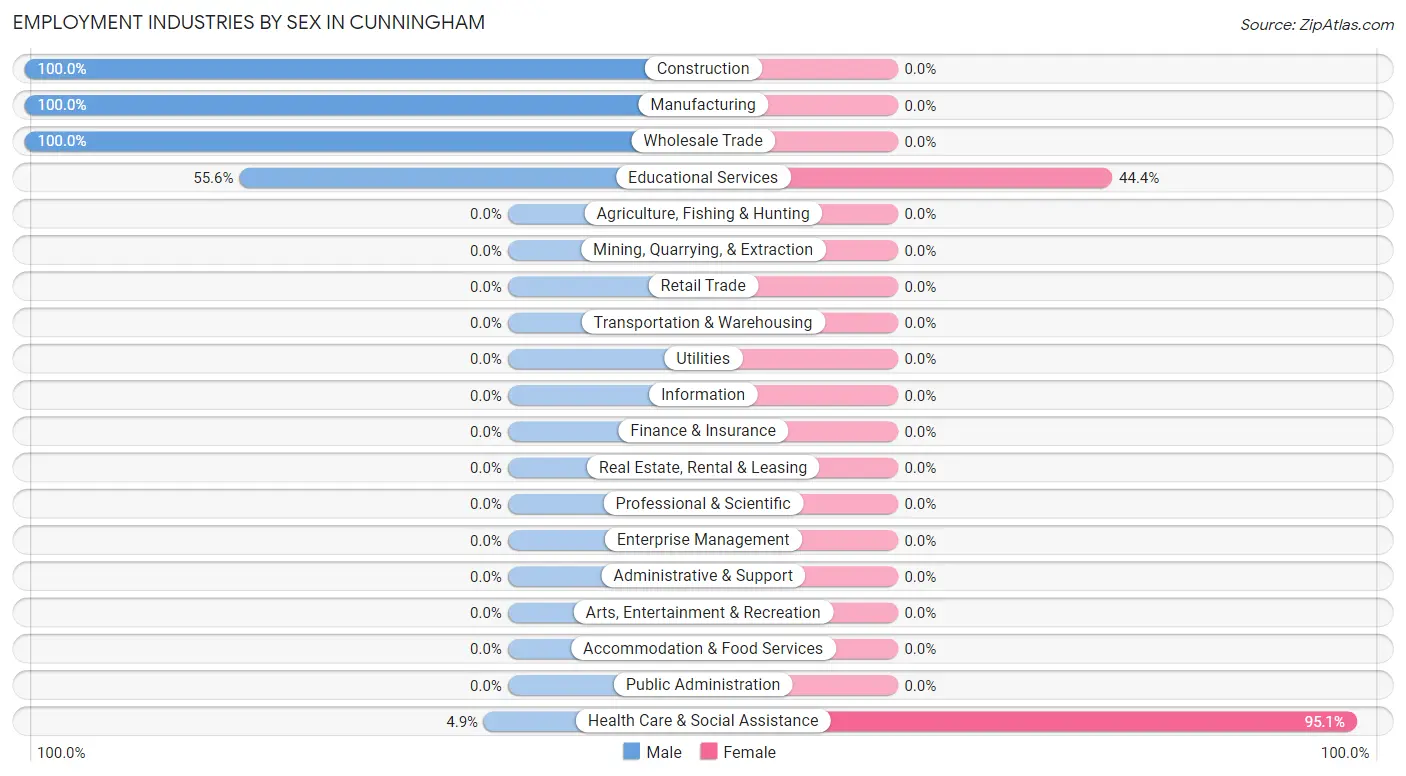
Employment Industries by Sex in Cunningham
The Cunningham industries that see more men than women are Construction (100.0%), Manufacturing (100.0%), and Wholesale Trade (100.0%), whereas the industries that tend to have a higher number of women are Health Care & Social Assistance (95.1%), and Educational Services (44.4%).
| Industry | Male | Female |
| Agriculture, Fishing & Hunting | 0 (0.0%) | 0 (0.0%) |
| Mining, Quarrying, & Extraction | 0 (0.0%) | 0 (0.0%) |
| Construction | 16 (100.0%) | 0 (0.0%) |
| Manufacturing | 5 (100.0%) | 0 (0.0%) |
| Wholesale Trade | 14 (100.0%) | 0 (0.0%) |
| Retail Trade | 0 (0.0%) | 0 (0.0%) |
| Transportation & Warehousing | 0 (0.0%) | 0 (0.0%) |
| Utilities | 0 (0.0%) | 0 (0.0%) |
| Information | 0 (0.0%) | 0 (0.0%) |
| Finance & Insurance | 0 (0.0%) | 0 (0.0%) |
| Real Estate, Rental & Leasing | 0 (0.0%) | 0 (0.0%) |
| Professional & Scientific | 0 (0.0%) | 0 (0.0%) |
| Enterprise Management | 0 (0.0%) | 0 (0.0%) |
| Administrative & Support | 0 (0.0%) | 0 (0.0%) |
| Educational Services | 5 (55.6%) | 4 (44.4%) |
| Health Care & Social Assistance | 3 (4.9%) | 58 (95.1%) |
| Arts, Entertainment & Recreation | 0 (0.0%) | 0 (0.0%) |
| Accommodation & Food Services | 0 (0.0%) | 0 (0.0%) |
| Public Administration | 0 (0.0%) | 0 (0.0%) |
| Total | 43 (40.9%) | 62 (59.1%) |
Education in Cunningham
School Enrollment in Cunningham
The most common levels of schooling among the 106 students in Cunningham are elementary school (54 | 50.9%), graduate / professional (30 | 28.3%), and college / undergraduate (20 | 18.9%).
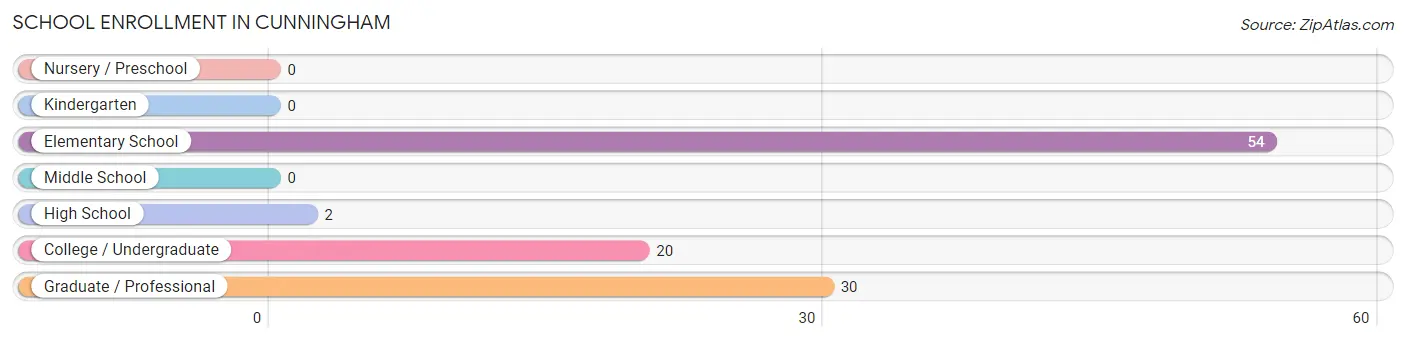
| School Level | # Students | % Students |
| Nursery / Preschool | 0 | 0.0% |
| Kindergarten | 0 | 0.0% |
| Elementary School | 54 | 50.9% |
| Middle School | 0 | 0.0% |
| High School | 2 | 1.9% |
| College / Undergraduate | 20 | 18.9% |
| Graduate / Professional | 30 | 28.3% |
| Total | 106 | 100.0% |
School Enrollment by Age by Funding Source in Cunningham
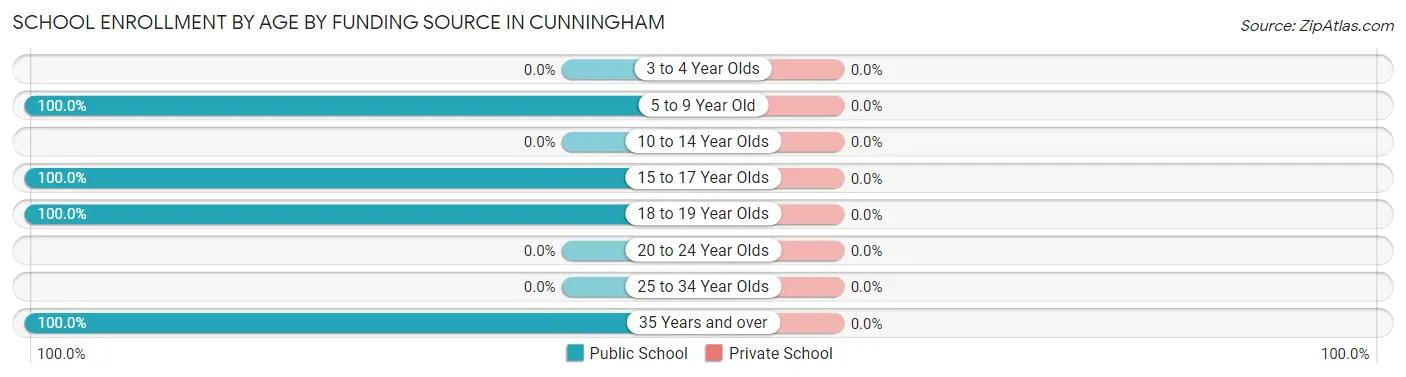
| Age Bracket | Public School | Private School |
| 3 to 4 Year Olds | 0 (0.0%) | 0 (0.0%) |
| 5 to 9 Year Old | 54 (100.0%) | 0 (0.0%) |
| 10 to 14 Year Olds | 0 (0.0%) | 0 (0.0%) |
| 15 to 17 Year Olds | 2 (100.0%) | 0 (0.0%) |
| 18 to 19 Year Olds | 20 (100.0%) | 0 (0.0%) |
| 20 to 24 Year Olds | 0 (0.0%) | 0 (0.0%) |
| 25 to 34 Year Olds | 0 (0.0%) | 0 (0.0%) |
| 35 Years and over | 30 (100.0%) | 0 (0.0%) |
| Total | 106 (100.0%) | 0 (0.0%) |
Educational Attainment by Field of Study in Cunningham
Arts & humanities (32 | 71.1%), business (10 | 22.2%), and education (3 | 6.7%) are the most common fields of study among 45 individuals in Cunningham who have obtained a bachelor's degree or higher.
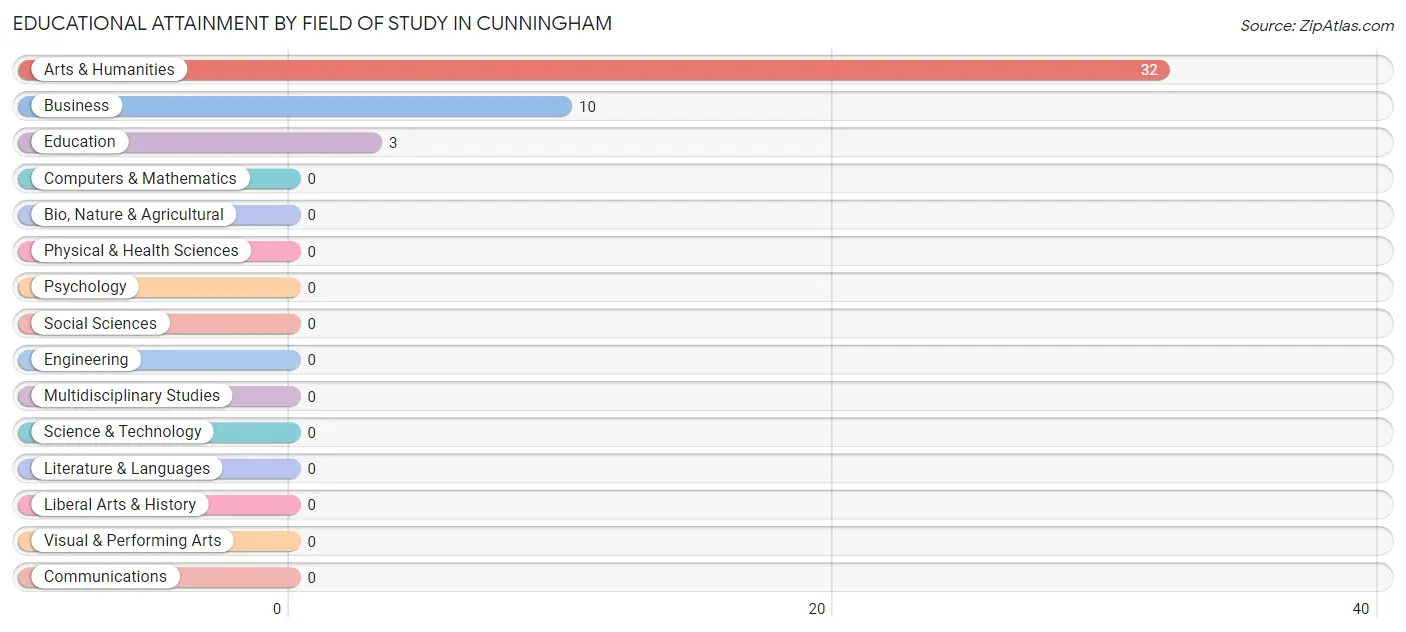
| Field of Study | # Graduates | % Graduates |
| Computers & Mathematics | 0 | 0.0% |
| Bio, Nature & Agricultural | 0 | 0.0% |
| Physical & Health Sciences | 0 | 0.0% |
| Psychology | 0 | 0.0% |
| Social Sciences | 0 | 0.0% |
| Engineering | 0 | 0.0% |
| Multidisciplinary Studies | 0 | 0.0% |
| Science & Technology | 0 | 0.0% |
| Business | 10 | 22.2% |
| Education | 3 | 6.7% |
| Literature & Languages | 0 | 0.0% |
| Liberal Arts & History | 0 | 0.0% |
| Visual & Performing Arts | 0 | 0.0% |
| Communications | 0 | 0.0% |
| Arts & Humanities | 32 | 71.1% |
| Total | 45 | 100.0% |
Transportation & Commute in Cunningham
Vehicle Availability by Sex in Cunningham
The most prevalent vehicle ownership categories in Cunningham are males with 2 vehicles (30, accounting for 69.8%) and females with 2 vehicles (58, making up 48.4%).
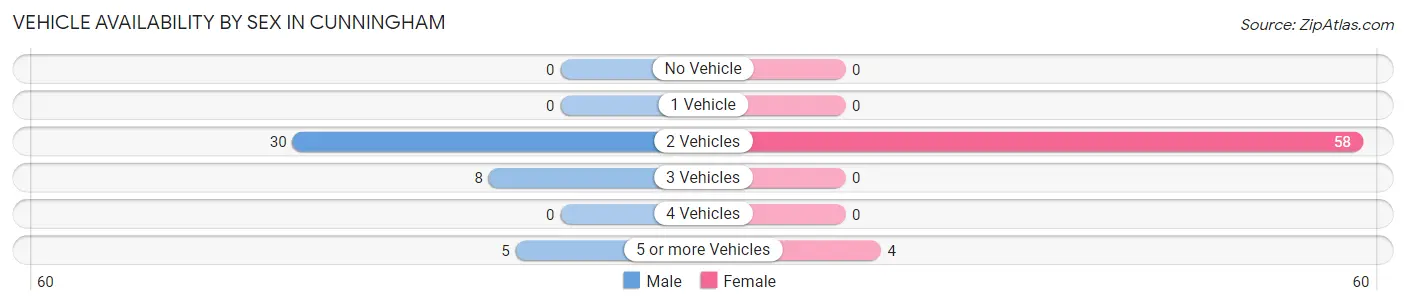
| Vehicles Available | Male | Female |
| No Vehicle | 0 (0.0%) | 0 (0.0%) |
| 1 Vehicle | 0 (0.0%) | 0 (0.0%) |
| 2 Vehicles | 30 (69.8%) | 58 (93.5%) |
| 3 Vehicles | 8 (18.6%) | 0 (0.0%) |
| 4 Vehicles | 0 (0.0%) | 0 (0.0%) |
| 5 or more Vehicles | 5 (11.6%) | 4 (6.5%) |
| Total | 43 (100.0%) | 62 (100.0%) |
Commute Time in Cunningham
The most frequently occuring commute durations in Cunningham are 15 to 19 minutes (34 commuters, 32.4%), 20 to 24 minutes (26 commuters, 24.8%), and 30 to 34 minutes (20 commuters, 19.1%).
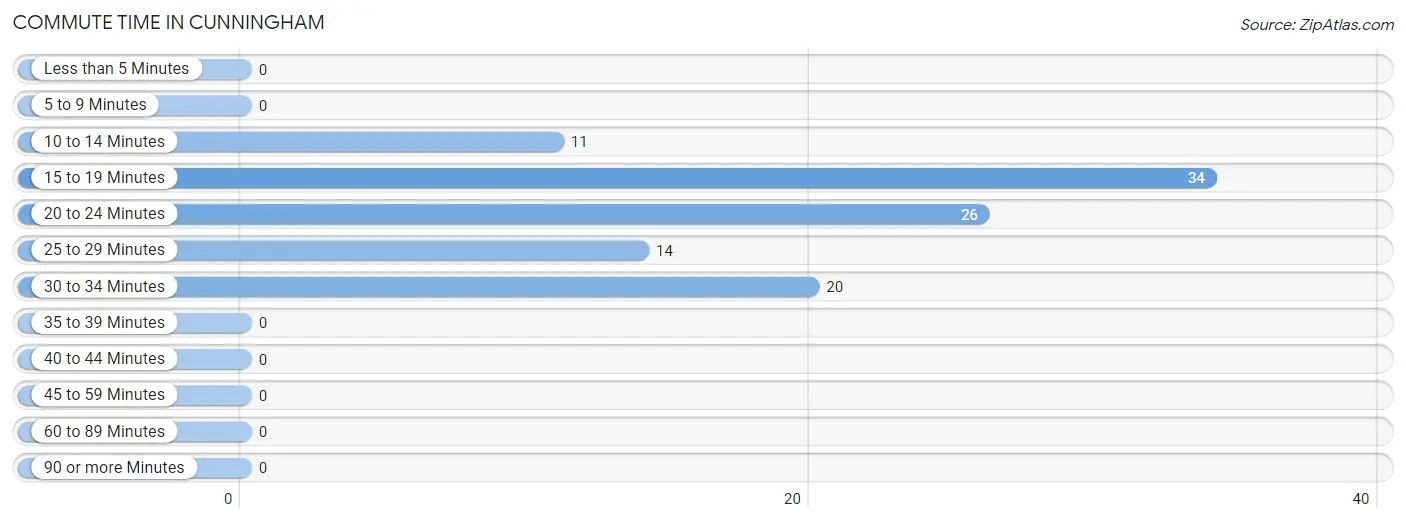
| Commute Time | # Commuters | % Commuters |
| Less than 5 Minutes | 0 | 0.0% |
| 5 to 9 Minutes | 0 | 0.0% |
| 10 to 14 Minutes | 11 | 10.5% |
| 15 to 19 Minutes | 34 | 32.4% |
| 20 to 24 Minutes | 26 | 24.8% |
| 25 to 29 Minutes | 14 | 13.3% |
| 30 to 34 Minutes | 20 | 19.1% |
| 35 to 39 Minutes | 0 | 0.0% |
| 40 to 44 Minutes | 0 | 0.0% |
| 45 to 59 Minutes | 0 | 0.0% |
| 60 to 89 Minutes | 0 | 0.0% |
| 90 or more Minutes | 0 | 0.0% |
Commute Time by Sex in Cunningham
The most common commute times in Cunningham are 30 to 34 minutes (18 commuters, 41.9%) for males and 15 to 19 minutes (34 commuters, 54.8%) for females.
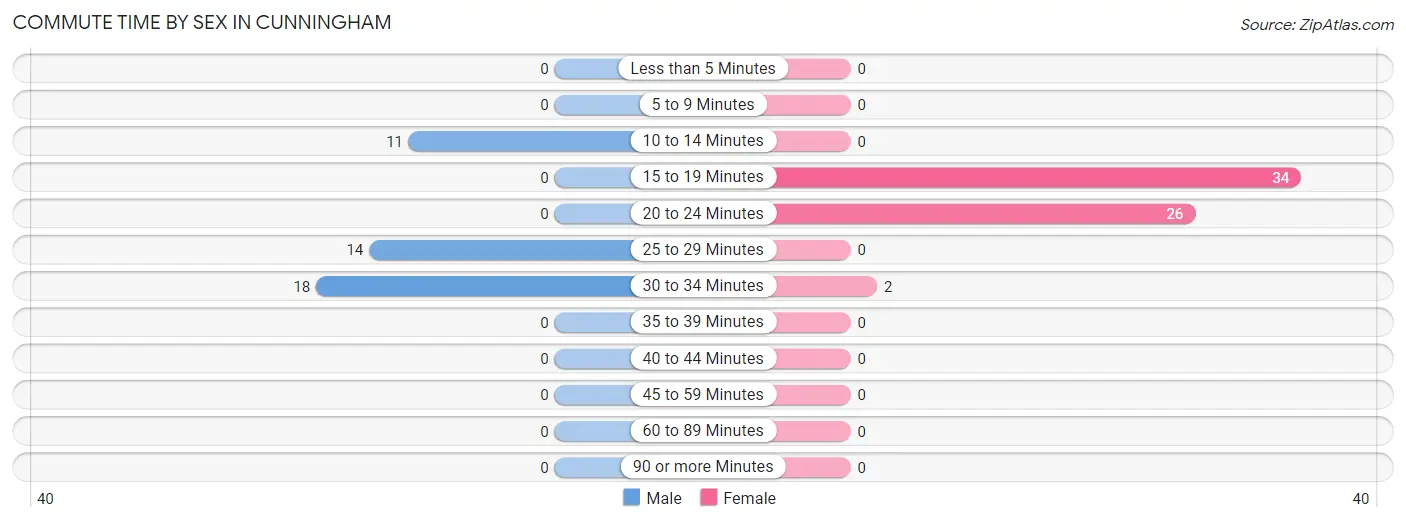
| Commute Time | Male | Female |
| Less than 5 Minutes | 0 (0.0%) | 0 (0.0%) |
| 5 to 9 Minutes | 0 (0.0%) | 0 (0.0%) |
| 10 to 14 Minutes | 11 (25.6%) | 0 (0.0%) |
| 15 to 19 Minutes | 0 (0.0%) | 34 (54.8%) |
| 20 to 24 Minutes | 0 (0.0%) | 26 (41.9%) |
| 25 to 29 Minutes | 14 (32.6%) | 0 (0.0%) |
| 30 to 34 Minutes | 18 (41.9%) | 2 (3.2%) |
| 35 to 39 Minutes | 0 (0.0%) | 0 (0.0%) |
| 40 to 44 Minutes | 0 (0.0%) | 0 (0.0%) |
| 45 to 59 Minutes | 0 (0.0%) | 0 (0.0%) |
| 60 to 89 Minutes | 0 (0.0%) | 0 (0.0%) |
| 90 or more Minutes | 0 (0.0%) | 0 (0.0%) |
Time of Departure to Work by Sex in Cunningham
The most frequent times of departure to work in Cunningham are 6:00 AM to 6:29 AM (16, 37.2%) for males and 8:00 AM to 8:29 AM (30, 48.4%) for females.
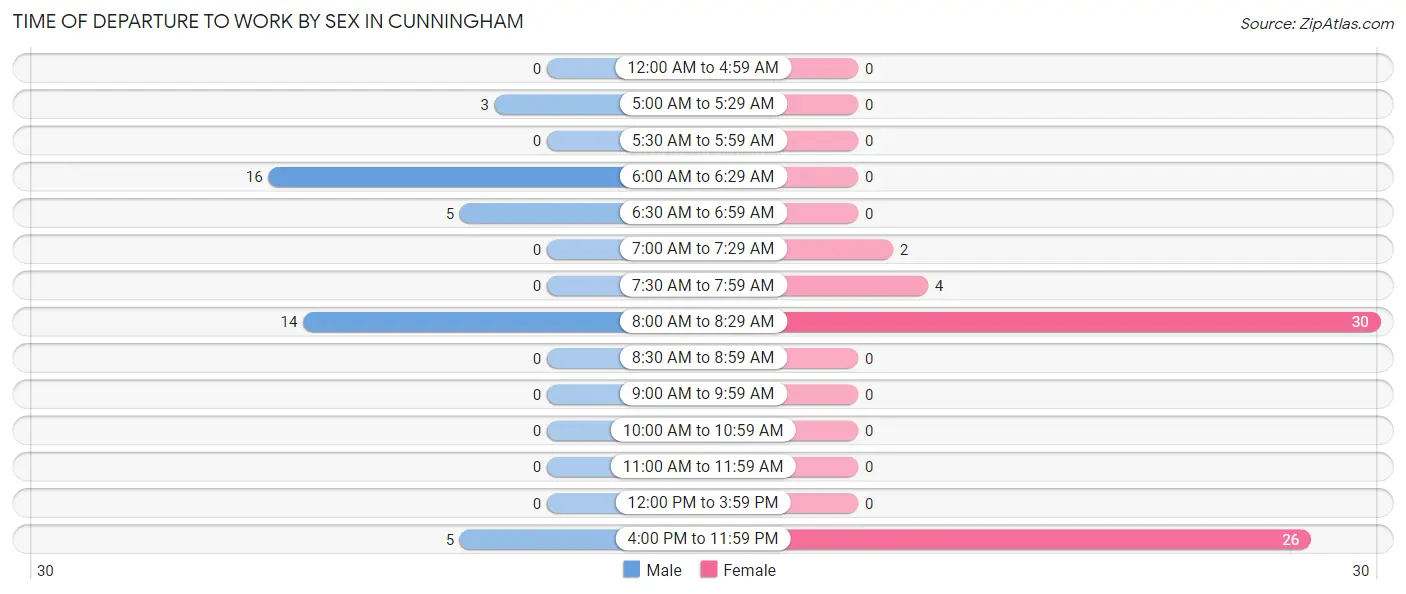
| Time of Departure | Male | Female |
| 12:00 AM to 4:59 AM | 0 (0.0%) | 0 (0.0%) |
| 5:00 AM to 5:29 AM | 3 (7.0%) | 0 (0.0%) |
| 5:30 AM to 5:59 AM | 0 (0.0%) | 0 (0.0%) |
| 6:00 AM to 6:29 AM | 16 (37.2%) | 0 (0.0%) |
| 6:30 AM to 6:59 AM | 5 (11.6%) | 0 (0.0%) |
| 7:00 AM to 7:29 AM | 0 (0.0%) | 2 (3.2%) |
| 7:30 AM to 7:59 AM | 0 (0.0%) | 4 (6.5%) |
| 8:00 AM to 8:29 AM | 14 (32.6%) | 30 (48.4%) |
| 8:30 AM to 8:59 AM | 0 (0.0%) | 0 (0.0%) |
| 9:00 AM to 9:59 AM | 0 (0.0%) | 0 (0.0%) |
| 10:00 AM to 10:59 AM | 0 (0.0%) | 0 (0.0%) |
| 11:00 AM to 11:59 AM | 0 (0.0%) | 0 (0.0%) |
| 12:00 PM to 3:59 PM | 0 (0.0%) | 0 (0.0%) |
| 4:00 PM to 11:59 PM | 5 (11.6%) | 26 (41.9%) |
| Total | 43 (100.0%) | 62 (100.0%) |
Housing Occupancy in Cunningham
Occupancy by Ownership in Cunningham
Of the total 125 dwellings in Cunningham, owner-occupied units account for 108 (86.4%), while renter-occupied units make up 17 (13.6%).
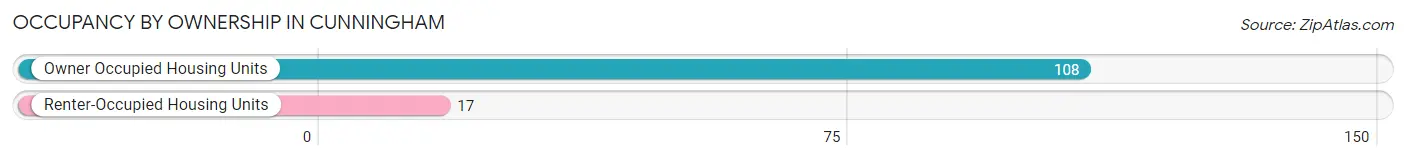
| Occupancy | # Housing Units | % Housing Units |
| Owner Occupied Housing Units | 108 | 86.4% |
| Renter-Occupied Housing Units | 17 | 13.6% |
| Total Occupied Housing Units | 125 | 100.0% |
Occupancy by Household Size in Cunningham
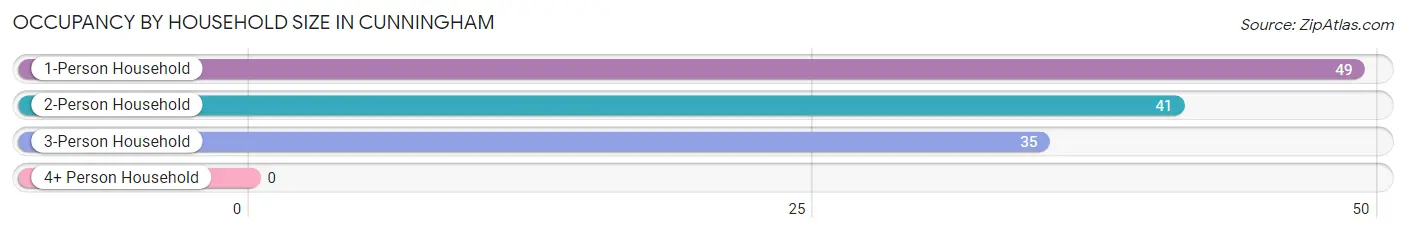
| Household Size | # Housing Units | % Housing Units |
| 1-Person Household | 49 | 39.2% |
| 2-Person Household | 41 | 32.8% |
| 3-Person Household | 35 | 28.0% |
| 4+ Person Household | 0 | 0.0% |
| Total Housing Units | 125 | 100.0% |
Occupancy by Ownership by Household Size in Cunningham
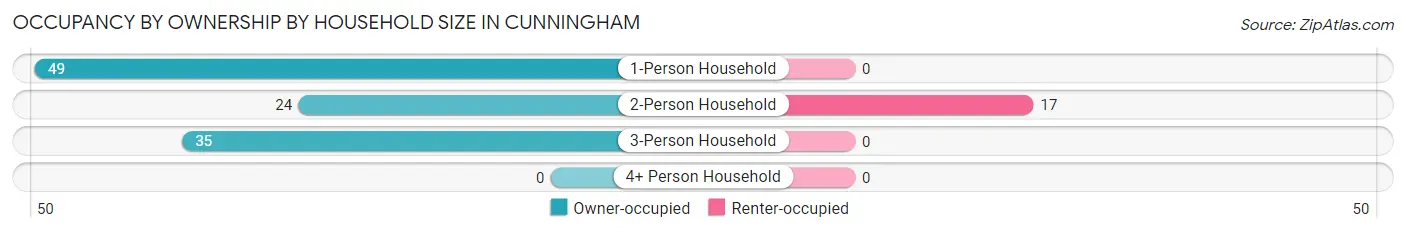
| Household Size | Owner-occupied | Renter-occupied |
| 1-Person Household | 49 (100.0%) | 0 (0.0%) |
| 2-Person Household | 24 (58.5%) | 17 (41.5%) |
| 3-Person Household | 35 (100.0%) | 0 (0.0%) |
| 4+ Person Household | 0 (0.0%) | 0 (0.0%) |
| Total Housing Units | 108 (86.4%) | 17 (13.6%) |
Occupancy by Educational Attainment in Cunningham
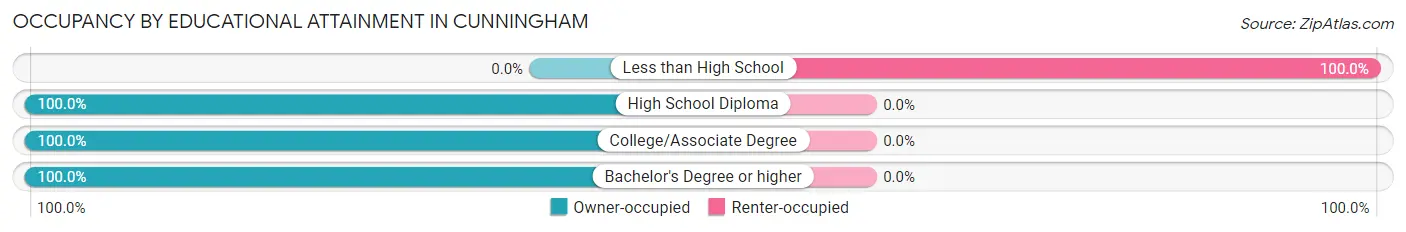
| Household Size | Owner-occupied | Renter-occupied |
| Less than High School | 0 (0.0%) | 17 (100.0%) |
| High School Diploma | 55 (100.0%) | 0 (0.0%) |
| College/Associate Degree | 11 (100.0%) | 0 (0.0%) |
| Bachelor's Degree or higher | 42 (100.0%) | 0 (0.0%) |
Occupancy by Age of Householder in Cunningham
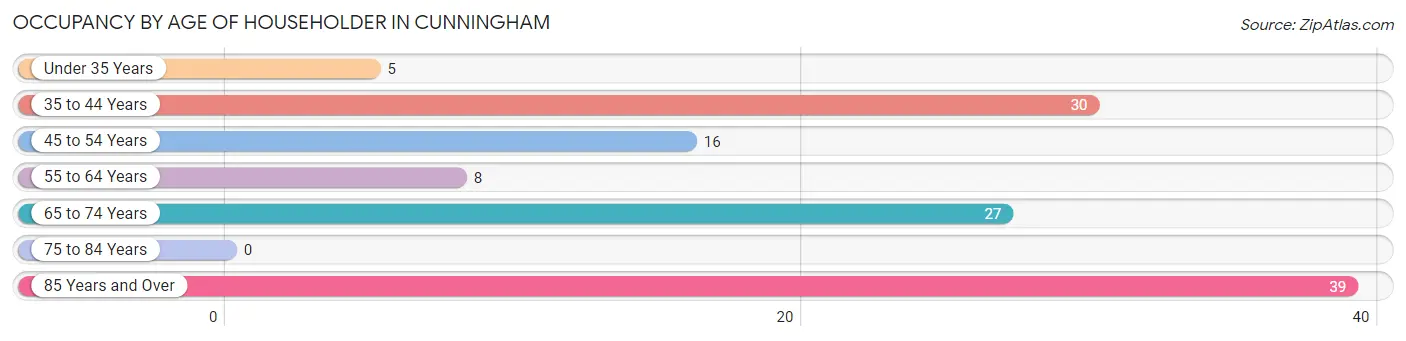
| Age Bracket | # Households | % Households |
| Under 35 Years | 5 | 4.0% |
| 35 to 44 Years | 30 | 24.0% |
| 45 to 54 Years | 16 | 12.8% |
| 55 to 64 Years | 8 | 6.4% |
| 65 to 74 Years | 27 | 21.6% |
| 75 to 84 Years | 0 | 0.0% |
| 85 Years and Over | 39 | 31.2% |
| Total | 125 | 100.0% |
Housing Finances in Cunningham
Median Income by Occupancy in Cunningham
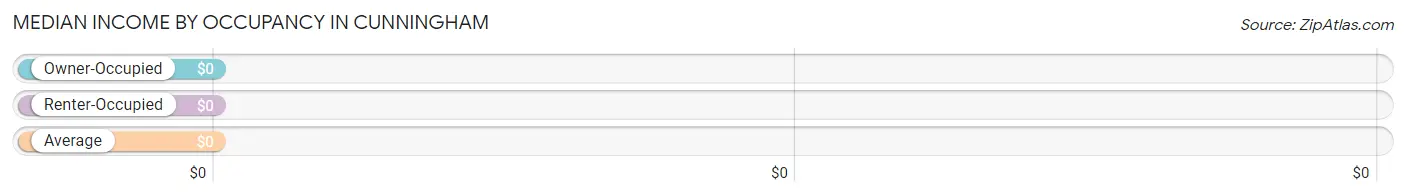
| Occupancy Type | # Households | Median Income |
| Owner-Occupied | 108 (86.4%) | $0 |
| Renter-Occupied | 17 (13.6%) | $0 |
| Average | 125 (100.0%) | $0 |
Occupancy by Householder Income Bracket in Cunningham
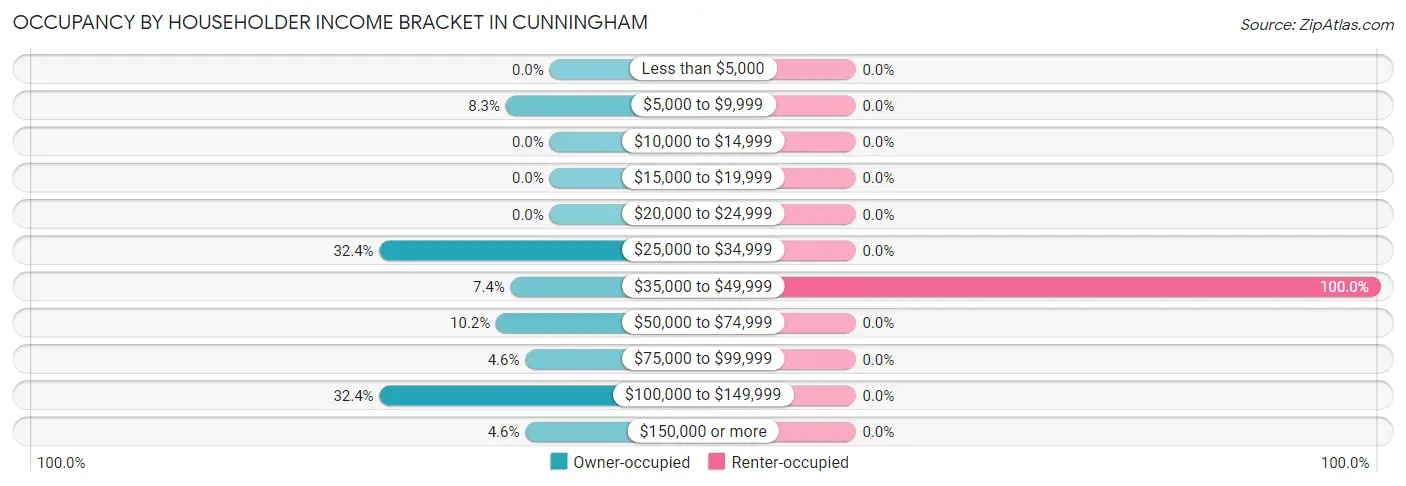
| Income Bracket | Owner-occupied | Renter-occupied |
| Less than $5,000 | 0 (0.0%) | 0 (0.0%) |
| $5,000 to $9,999 | 9 (8.3%) | 0 (0.0%) |
| $10,000 to $14,999 | 0 (0.0%) | 0 (0.0%) |
| $15,000 to $19,999 | 0 (0.0%) | 0 (0.0%) |
| $20,000 to $24,999 | 0 (0.0%) | 0 (0.0%) |
| $25,000 to $34,999 | 35 (32.4%) | 0 (0.0%) |
| $35,000 to $49,999 | 8 (7.4%) | 17 (100.0%) |
| $50,000 to $74,999 | 11 (10.2%) | 0 (0.0%) |
| $75,000 to $99,999 | 5 (4.6%) | 0 (0.0%) |
| $100,000 to $149,999 | 35 (32.4%) | 0 (0.0%) |
| $150,000 or more | 5 (4.6%) | 0 (0.0%) |
| Total | 108 (100.0%) | 17 (100.0%) |
Monthly Housing Cost Tiers in Cunningham
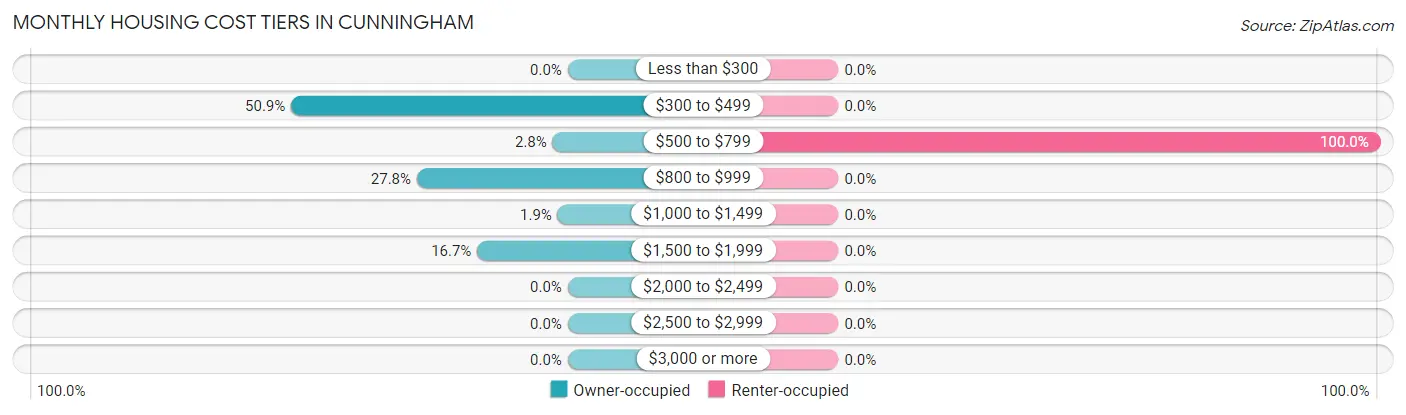
| Monthly Cost | Owner-occupied | Renter-occupied |
| Less than $300 | 0 (0.0%) | 0 (0.0%) |
| $300 to $499 | 55 (50.9%) | 0 (0.0%) |
| $500 to $799 | 3 (2.8%) | 17 (100.0%) |
| $800 to $999 | 30 (27.8%) | 0 (0.0%) |
| $1,000 to $1,499 | 2 (1.8%) | 0 (0.0%) |
| $1,500 to $1,999 | 18 (16.7%) | 0 (0.0%) |
| $2,000 to $2,499 | 0 (0.0%) | 0 (0.0%) |
| $2,500 to $2,999 | 0 (0.0%) | 0 (0.0%) |
| $3,000 or more | 0 (0.0%) | 0 (0.0%) |
| Total | 108 (100.0%) | 17 (100.0%) |
Physical Housing Characteristics in Cunningham
Housing Structures in Cunningham
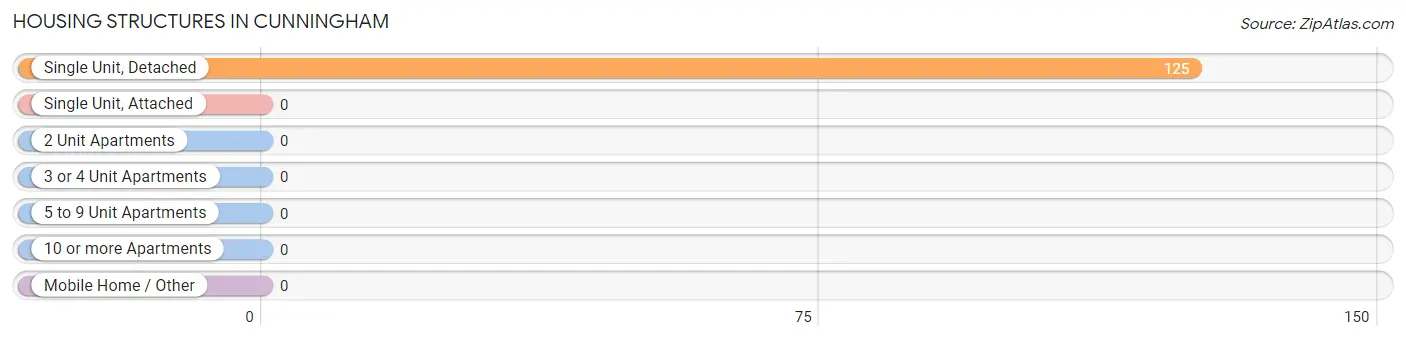
| Structure Type | # Housing Units | % Housing Units |
| Single Unit, Detached | 125 | 100.0% |
| Single Unit, Attached | 0 | 0.0% |
| 2 Unit Apartments | 0 | 0.0% |
| 3 or 4 Unit Apartments | 0 | 0.0% |
| 5 to 9 Unit Apartments | 0 | 0.0% |
| 10 or more Apartments | 0 | 0.0% |
| Mobile Home / Other | 0 | 0.0% |
| Total | 125 | 100.0% |
Housing Structures by Occupancy in Cunningham
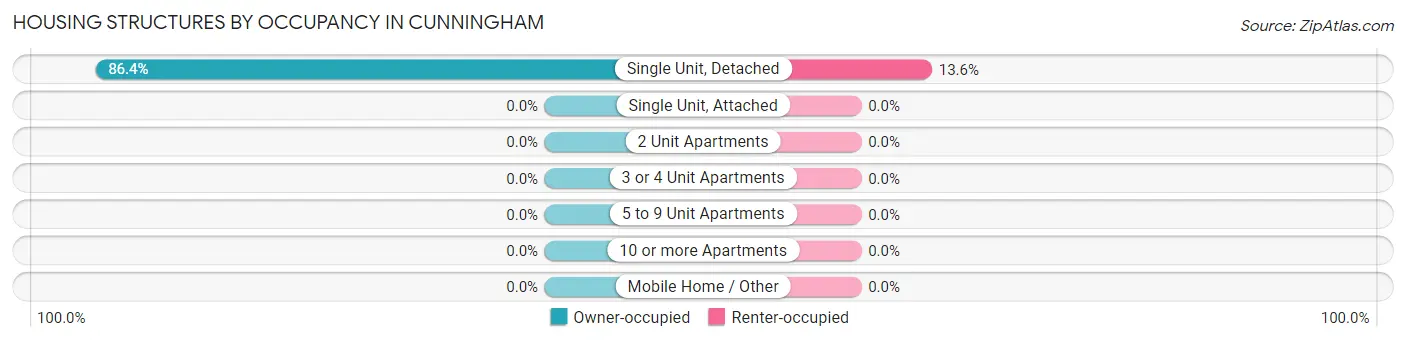
| Structure Type | Owner-occupied | Renter-occupied |
| Single Unit, Detached | 108 (86.4%) | 17 (13.6%) |
| Single Unit, Attached | 0 (0.0%) | 0 (0.0%) |
| 2 Unit Apartments | 0 (0.0%) | 0 (0.0%) |
| 3 or 4 Unit Apartments | 0 (0.0%) | 0 (0.0%) |
| 5 to 9 Unit Apartments | 0 (0.0%) | 0 (0.0%) |
| 10 or more Apartments | 0 (0.0%) | 0 (0.0%) |
| Mobile Home / Other | 0 (0.0%) | 0 (0.0%) |
| Total | 108 (86.4%) | 17 (13.6%) |
Housing Structures by Number of Rooms in Cunningham
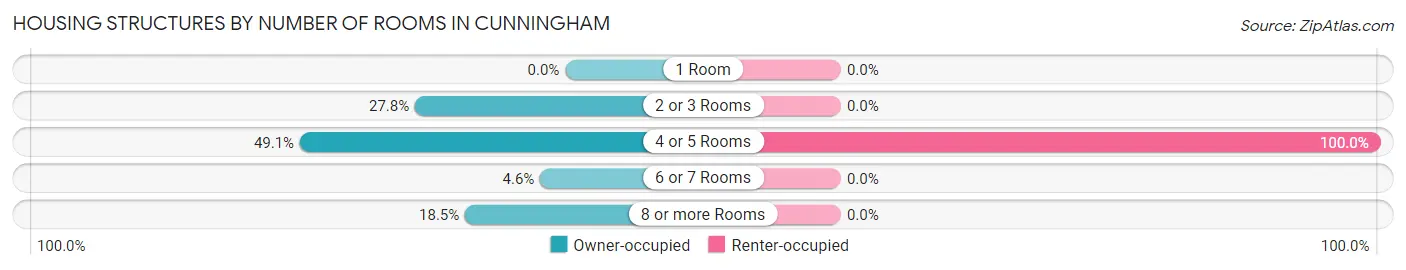
| Number of Rooms | Owner-occupied | Renter-occupied |
| 1 Room | 0 (0.0%) | 0 (0.0%) |
| 2 or 3 Rooms | 30 (27.8%) | 0 (0.0%) |
| 4 or 5 Rooms | 53 (49.1%) | 17 (100.0%) |
| 6 or 7 Rooms | 5 (4.6%) | 0 (0.0%) |
| 8 or more Rooms | 20 (18.5%) | 0 (0.0%) |
| Total | 108 (100.0%) | 17 (100.0%) |
Housing Structure by Heating Type in Cunningham
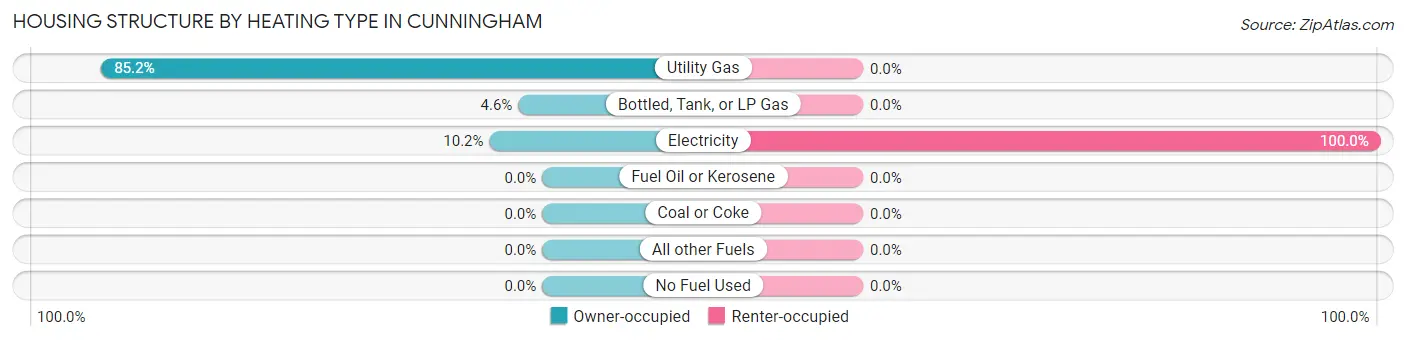
| Heating Type | Owner-occupied | Renter-occupied |
| Utility Gas | 92 (85.2%) | 0 (0.0%) |
| Bottled, Tank, or LP Gas | 5 (4.6%) | 0 (0.0%) |
| Electricity | 11 (10.2%) | 17 (100.0%) |
| Fuel Oil or Kerosene | 0 (0.0%) | 0 (0.0%) |
| Coal or Coke | 0 (0.0%) | 0 (0.0%) |
| All other Fuels | 0 (0.0%) | 0 (0.0%) |
| No Fuel Used | 0 (0.0%) | 0 (0.0%) |
| Total | 108 (100.0%) | 17 (100.0%) |
Household Vehicle Usage in Cunningham
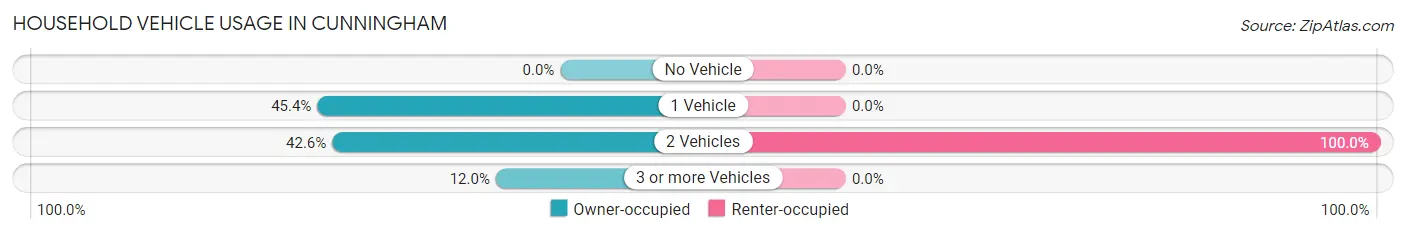
| Vehicles per Household | Owner-occupied | Renter-occupied |
| No Vehicle | 0 (0.0%) | 0 (0.0%) |
| 1 Vehicle | 49 (45.4%) | 0 (0.0%) |
| 2 Vehicles | 46 (42.6%) | 17 (100.0%) |
| 3 or more Vehicles | 13 (12.0%) | 0 (0.0%) |
| Total | 108 (100.0%) | 17 (100.0%) |
Real Estate & Mortgages in Cunningham
Real Estate and Mortgage Overview in Cunningham
| Characteristic | Without Mortgage | With Mortgage |
| Housing Units | 65 | 43 |
| Median Property Value | $87,000 | $65,200 |
| Median Household Income | $105,352 | $0 |
| Monthly Housing Costs | $384 | $0 |
| Real Estate Taxes | $1,094 | $0 |
Property Value by Mortgage Status in Cunningham
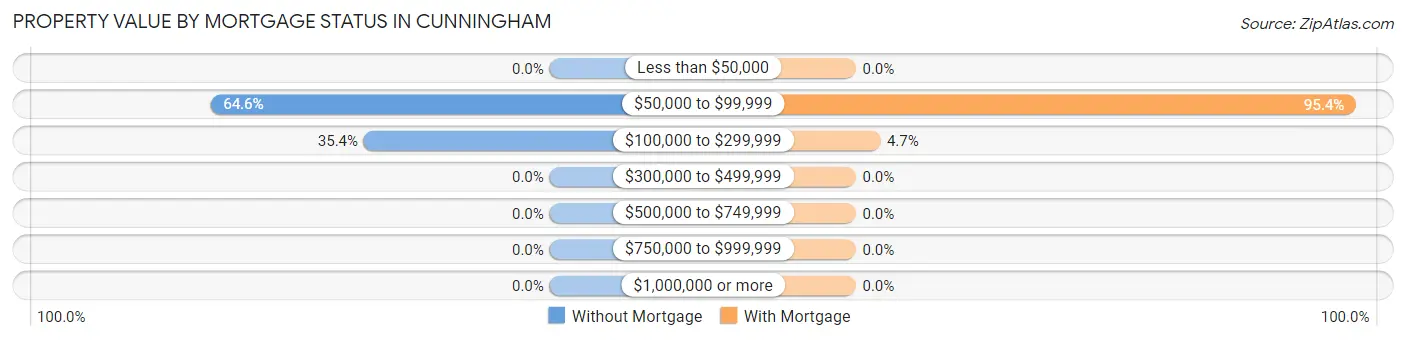
| Property Value | Without Mortgage | With Mortgage |
| Less than $50,000 | 0 (0.0%) | 0 (0.0%) |
| $50,000 to $99,999 | 42 (64.6%) | 41 (95.4%) |
| $100,000 to $299,999 | 23 (35.4%) | 2 (4.6%) |
| $300,000 to $499,999 | 0 (0.0%) | 0 (0.0%) |
| $500,000 to $749,999 | 0 (0.0%) | 0 (0.0%) |
| $750,000 to $999,999 | 0 (0.0%) | 0 (0.0%) |
| $1,000,000 or more | 0 (0.0%) | 0 (0.0%) |
| Total | 65 (100.0%) | 43 (100.0%) |
Household Income by Mortgage Status in Cunningham
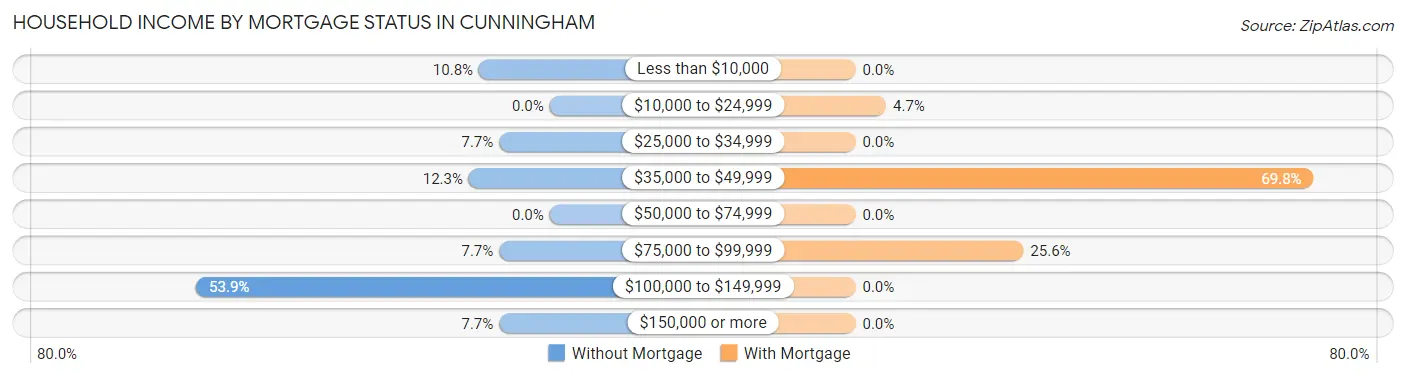
| Household Income | Without Mortgage | With Mortgage |
| Less than $10,000 | 7 (10.8%) | 0 (0.0%) |
| $10,000 to $24,999 | 0 (0.0%) | 2 (4.6%) |
| $25,000 to $34,999 | 5 (7.7%) | 0 (0.0%) |
| $35,000 to $49,999 | 8 (12.3%) | 30 (69.8%) |
| $50,000 to $74,999 | 0 (0.0%) | 0 (0.0%) |
| $75,000 to $99,999 | 5 (7.7%) | 11 (25.6%) |
| $100,000 to $149,999 | 35 (53.8%) | 0 (0.0%) |
| $150,000 or more | 5 (7.7%) | 0 (0.0%) |
| Total | 65 (100.0%) | 43 (100.0%) |
Property Value to Household Income Ratio in Cunningham
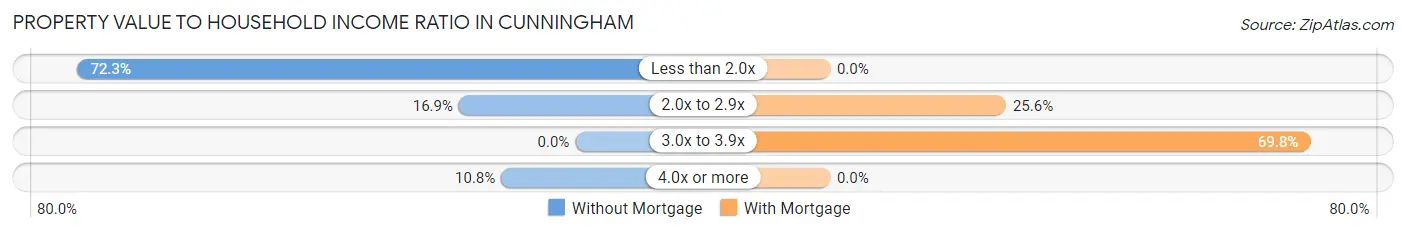
| Value-to-Income Ratio | Without Mortgage | With Mortgage |
| Less than 2.0x | 47 (72.3%) | 0 (0.0%) |
| 2.0x to 2.9x | 11 (16.9%) | 11 (25.6%) |
| 3.0x to 3.9x | 0 (0.0%) | 30 (69.8%) |
| 4.0x or more | 7 (10.8%) | 0 (0.0%) |
| Total | 65 (100.0%) | 43 (100.0%) |
Real Estate Taxes by Mortgage Status in Cunningham
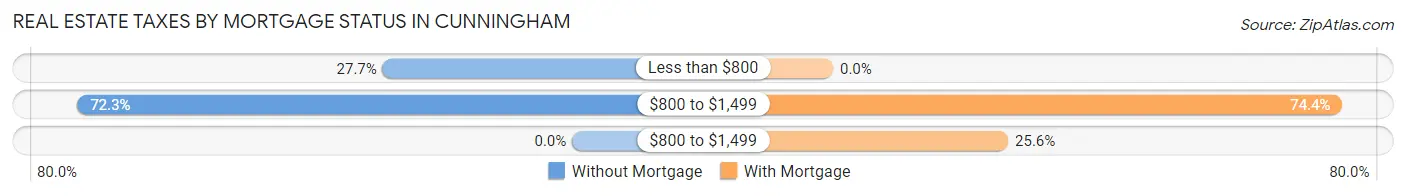
| Property Taxes | Without Mortgage | With Mortgage |
| Less than $800 | 18 (27.7%) | 0 (0.0%) |
| $800 to $1,499 | 47 (72.3%) | 32 (74.4%) |
| $800 to $1,499 | 0 (0.0%) | 11 (25.6%) |
| Total | 65 (100.0%) | 43 (100.0%) |
Health & Disability in Cunningham
Health Insurance Coverage by Age in Cunningham
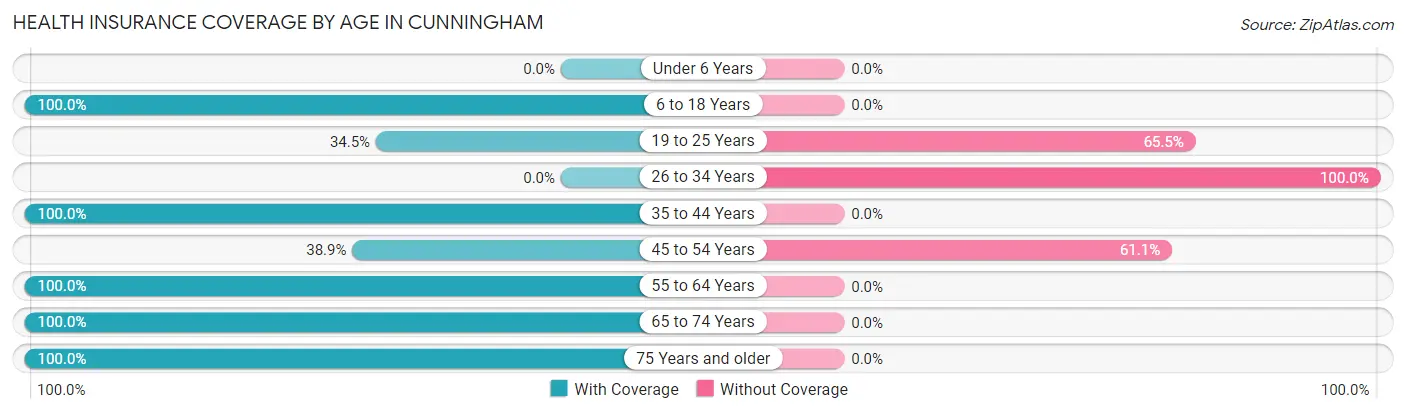
| Age Bracket | With Coverage | Without Coverage |
| Under 6 Years | 0 (0.0%) | 0 (0.0%) |
| 6 to 18 Years | 56 (100.0%) | 0 (0.0%) |
| 19 to 25 Years | 20 (34.5%) | 38 (65.5%) |
| 26 to 34 Years | 0 (0.0%) | 14 (100.0%) |
| 35 to 44 Years | 30 (100.0%) | 0 (0.0%) |
| 45 to 54 Years | 7 (38.9%) | 11 (61.1%) |
| 55 to 64 Years | 15 (100.0%) | 0 (0.0%) |
| 65 to 74 Years | 27 (100.0%) | 0 (0.0%) |
| 75 Years and older | 39 (100.0%) | 0 (0.0%) |
| Total | 194 (75.5%) | 63 (24.5%) |
Health Insurance Coverage by Citizenship Status in Cunningham
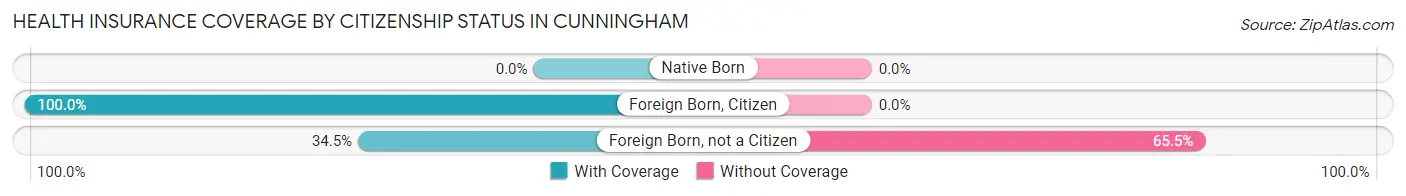
| Citizenship Status | With Coverage | Without Coverage |
| Native Born | 0 (0.0%) | 0 (0.0%) |
| Foreign Born, Citizen | 56 (100.0%) | 0 (0.0%) |
| Foreign Born, not a Citizen | 20 (34.5%) | 38 (65.5%) |
Health Insurance Coverage by Household Income in Cunningham
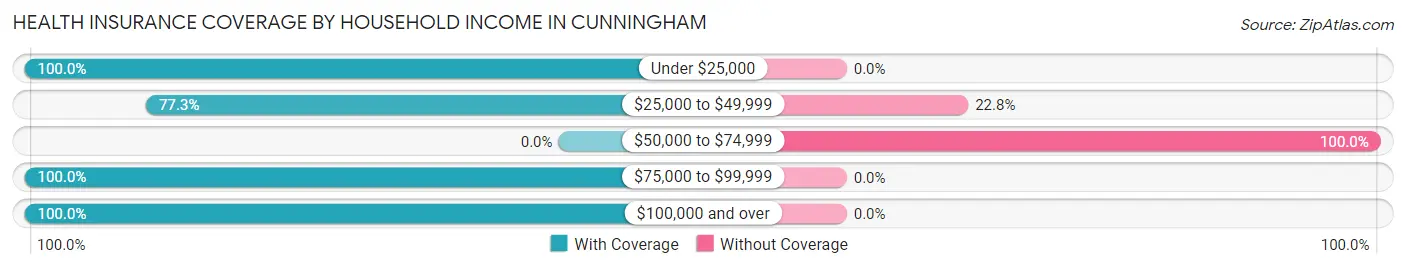
| Household Income | With Coverage | Without Coverage |
| Under $25,000 | 9 (100.0%) | 0 (0.0%) |
| $25,000 to $49,999 | 129 (77.2%) | 38 (22.8%) |
| $50,000 to $74,999 | 0 (0.0%) | 25 (100.0%) |
| $75,000 to $99,999 | 11 (100.0%) | 0 (0.0%) |
| $100,000 and over | 45 (100.0%) | 0 (0.0%) |
Public vs Private Health Insurance Coverage by Age in Cunningham
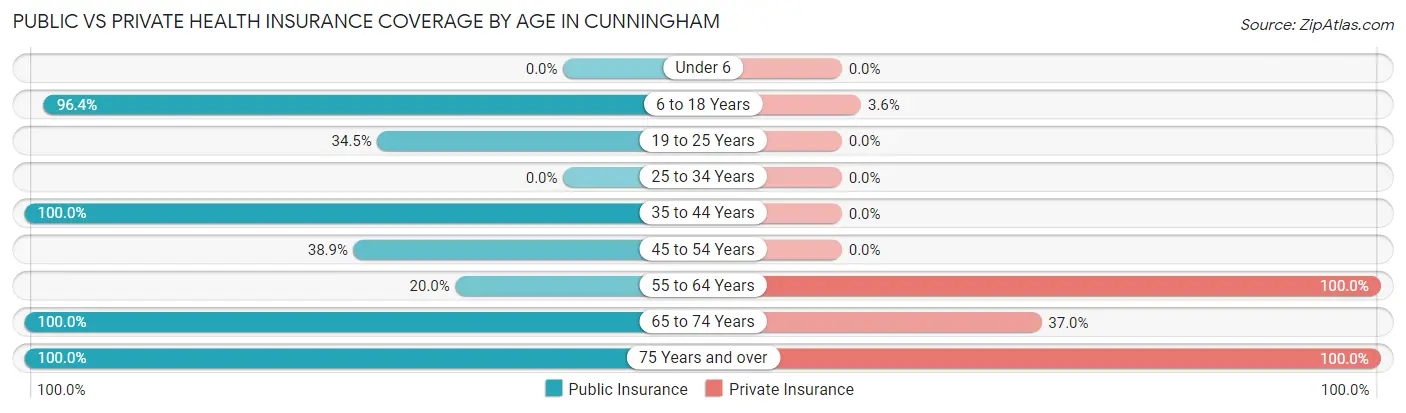
| Age Bracket | Public Insurance | Private Insurance |
| Under 6 | 0 (0.0%) | 0 (0.0%) |
| 6 to 18 Years | 54 (96.4%) | 2 (3.6%) |
| 19 to 25 Years | 20 (34.5%) | 0 (0.0%) |
| 25 to 34 Years | 0 (0.0%) | 0 (0.0%) |
| 35 to 44 Years | 30 (100.0%) | 0 (0.0%) |
| 45 to 54 Years | 7 (38.9%) | 0 (0.0%) |
| 55 to 64 Years | 3 (20.0%) | 15 (100.0%) |
| 65 to 74 Years | 27 (100.0%) | 10 (37.0%) |
| 75 Years and over | 39 (100.0%) | 39 (100.0%) |
| Total | 180 (70.0%) | 66 (25.7%) |
Disability Status by Sex by Age in Cunningham
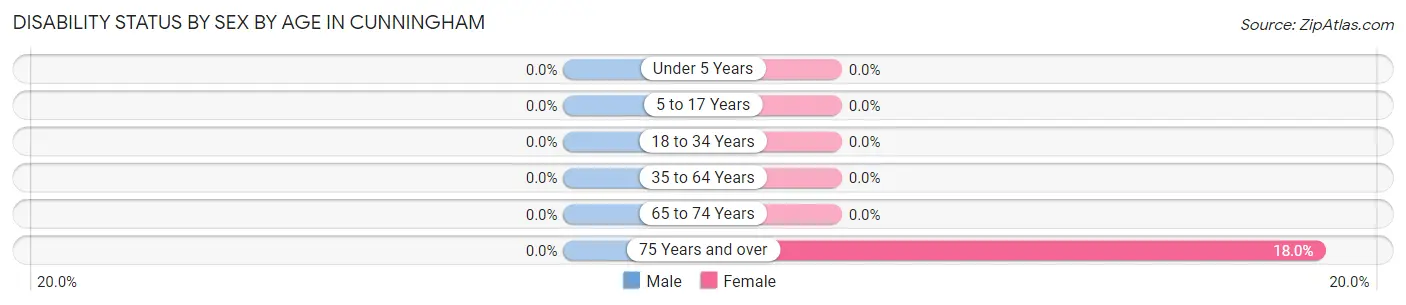
| Age Bracket | Male | Female |
| Under 5 Years | 0 (0.0%) | 0 (0.0%) |
| 5 to 17 Years | 0 (0.0%) | 0 (0.0%) |
| 18 to 34 Years | 0 (0.0%) | 0 (0.0%) |
| 35 to 64 Years | 0 (0.0%) | 0 (0.0%) |
| 65 to 74 Years | 0 (0.0%) | 0 (0.0%) |
| 75 Years and over | 0 (0.0%) | 7 (17.9%) |
Disability Class by Sex by Age in Cunningham
Disability Class: Hearing Difficulty
| Age Bracket | Male | Female |
| Under 5 Years | 0 (0.0%) | 0 (0.0%) |
| 5 to 17 Years | 0 (0.0%) | 0 (0.0%) |
| 18 to 34 Years | 0 (0.0%) | 0 (0.0%) |
| 35 to 64 Years | 0 (0.0%) | 0 (0.0%) |
| 65 to 74 Years | 0 (0.0%) | 0 (0.0%) |
| 75 Years and over | 0 (0.0%) | 0 (0.0%) |
Disability Class: Vision Difficulty
| Age Bracket | Male | Female |
| Under 5 Years | 0 (0.0%) | 0 (0.0%) |
| 5 to 17 Years | 0 (0.0%) | 0 (0.0%) |
| 18 to 34 Years | 0 (0.0%) | 0 (0.0%) |
| 35 to 64 Years | 0 (0.0%) | 0 (0.0%) |
| 65 to 74 Years | 0 (0.0%) | 0 (0.0%) |
| 75 Years and over | 0 (0.0%) | 0 (0.0%) |
Disability Class: Cognitive Difficulty
| Age Bracket | Male | Female |
| 5 to 17 Years | 0 (0.0%) | 0 (0.0%) |
| 18 to 34 Years | 0 (0.0%) | 0 (0.0%) |
| 35 to 64 Years | 0 (0.0%) | 0 (0.0%) |
| 65 to 74 Years | 0 (0.0%) | 0 (0.0%) |
| 75 Years and over | 0 (0.0%) | 0 (0.0%) |
Disability Class: Ambulatory Difficulty

| Age Bracket | Male | Female |
| 5 to 17 Years | 0 (0.0%) | 0 (0.0%) |
| 18 to 34 Years | 0 (0.0%) | 0 (0.0%) |
| 35 to 64 Years | 0 (0.0%) | 0 (0.0%) |
| 65 to 74 Years | 0 (0.0%) | 0 (0.0%) |
| 75 Years and over | 0 (0.0%) | 7 (17.9%) |
Disability Class: Self-Care Difficulty
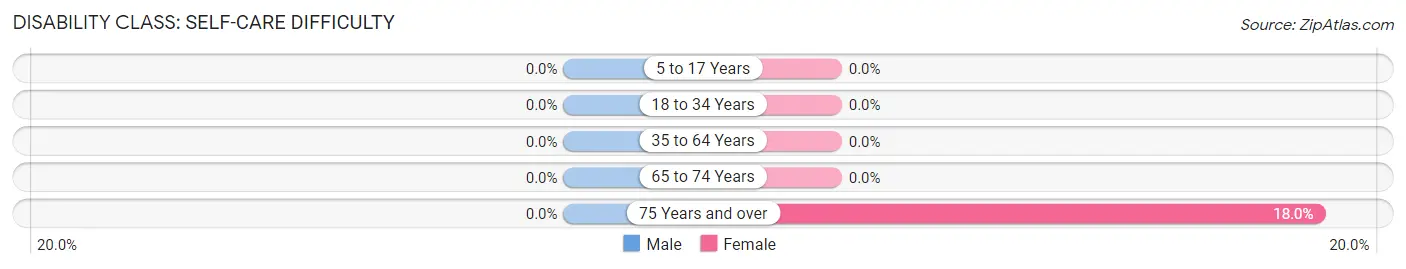
| Age Bracket | Male | Female |
| 5 to 17 Years | 0 (0.0%) | 0 (0.0%) |
| 18 to 34 Years | 0 (0.0%) | 0 (0.0%) |
| 35 to 64 Years | 0 (0.0%) | 0 (0.0%) |
| 65 to 74 Years | 0 (0.0%) | 0 (0.0%) |
| 75 Years and over | 0 (0.0%) | 7 (17.9%) |
Technology Access in Cunningham
Computing Device Access in Cunningham
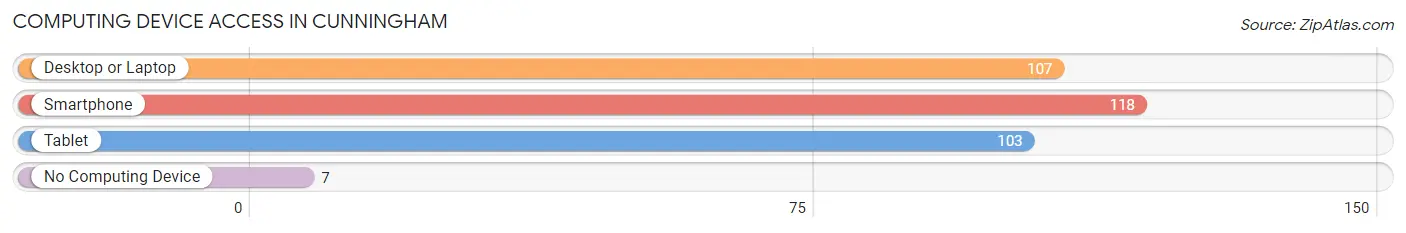
| Device Type | # Households | % Households |
| Desktop or Laptop | 107 | 85.6% |
| Smartphone | 118 | 94.4% |
| Tablet | 103 | 82.4% |
| No Computing Device | 7 | 5.6% |
| Total | 125 | 100.0% |
Internet Access in Cunningham
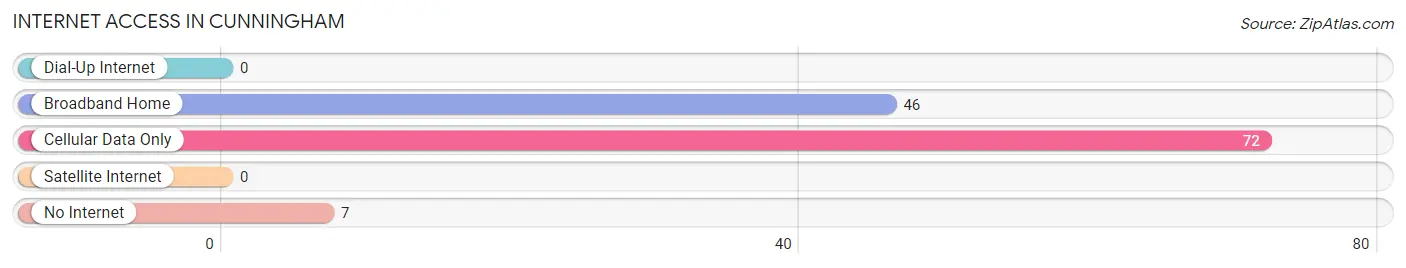
| Internet Type | # Households | % Households |
| Dial-Up Internet | 0 | 0.0% |
| Broadband Home | 46 | 36.8% |
| Cellular Data Only | 72 | 57.6% |
| Satellite Internet | 0 | 0.0% |
| No Internet | 7 | 5.6% |
| Total | 125 | 100.0% |
Cunningham Summary
Cunningham is a small unincorporated community located in Christian County, Kentucky. It is situated in the western part of the state, approximately 10 miles south of Hopkinsville. The population of Cunningham was estimated to be around 1,000 in 2020.
History
Cunningham was first settled in the early 1800s by a group of settlers from Virginia. The town was named after the Cunningham family, who were among the first settlers. The town was officially incorporated in 1820.
In the late 1800s, Cunningham was a thriving agricultural community. The town was home to several cotton gins, a grist mill, and a sawmill. The town also had a post office, a general store, and a blacksmith shop.
In the early 1900s, the town began to decline as the railroad bypassed it. The population decreased and many of the businesses closed. In the 1950s, the town was revitalized when the U.S. Army opened a base nearby. The base brought new jobs and economic growth to the area.
Geography
Cunningham is located in western Kentucky, approximately 10 miles south of Hopkinsville. The town is situated in a rural area, surrounded by rolling hills and farmland. The nearest major city is Nashville, Tennessee, which is about 90 miles away.
The climate in Cunningham is humid subtropical, with hot summers and mild winters. The average annual temperature is around 60 degrees Fahrenheit. The average annual precipitation is around 45 inches.
Economy
The economy of Cunningham is largely based on agriculture. The town is home to several farms, which produce corn, soybeans, wheat, and other crops. The town also has a few small businesses, including a gas station, a grocery store, and a few restaurants.
The U.S. Army base nearby provides jobs for many of the town’s residents. The base also provides economic benefits to the town, such as increased tourism and spending.
Demographics
The population of Cunningham was estimated to be around 1,000 in 2020. The town is predominantly white, with a small African American population. The median household income is around $35,000. The town has a high rate of poverty, with around 25% of the population living below the poverty line.
Cunningham is a small, rural community with a rich history and a bright future. The town is home to a diverse population and a thriving economy. With its close proximity to Nashville, Cunningham is an ideal place to live and work.
Common Questions
What is Per Capita Income in Cunningham?
Per Capita income in Cunningham is $29,989.
What is the Median Family Income in Cunningham?
Median Family Income in Cunningham is $37,941.
What is Income or Wage Gap in Cunningham?
Income or Wage Gap in Cunningham is 22.6%.
Women in Cunningham earn 77.4 cents for every dollar earned by a man.
What is Inequality or Gini Index in Cunningham?
Inequality or Gini Index in Cunningham is 0.36.
What is the Total Population of Cunningham?
Total Population of Cunningham is 257.
What is the Total Male Population of Cunningham?
Total Male Population of Cunningham is 82.
What is the Total Female Population of Cunningham?
Total Female Population of Cunningham is 175.
What is the Ratio of Males per 100 Females in Cunningham?
There are 46.86 Males per 100 Females in Cunningham.
What is the Ratio of Females per 100 Males in Cunningham?
There are 213.41 Females per 100 Males in Cunningham.
What is the Median Population Age in Cunningham?
Median Population Age in Cunningham is 41.0 Years.
What is the Average Family Size in Cunningham
Average Family Size in Cunningham is 2.7 People.
What is the Average Household Size in Cunningham
Average Household Size in Cunningham is 2.1 People.
How Large is the Labor Force in Cunningham?
There are 105 People in the Labor Forcein in Cunningham.
What is the Percentage of People in the Labor Force in Cunningham?
51.7% of People are in the Labor Force in Cunningham.