Zip Codes with the Highest Percentage of Population Employed in Arts, Media & Entertainment in Bowling Green, KY
RELATED REPORTS & OPTIONS
Arts, Media & Entertainment
Bowling Green
Compare Zip Codes
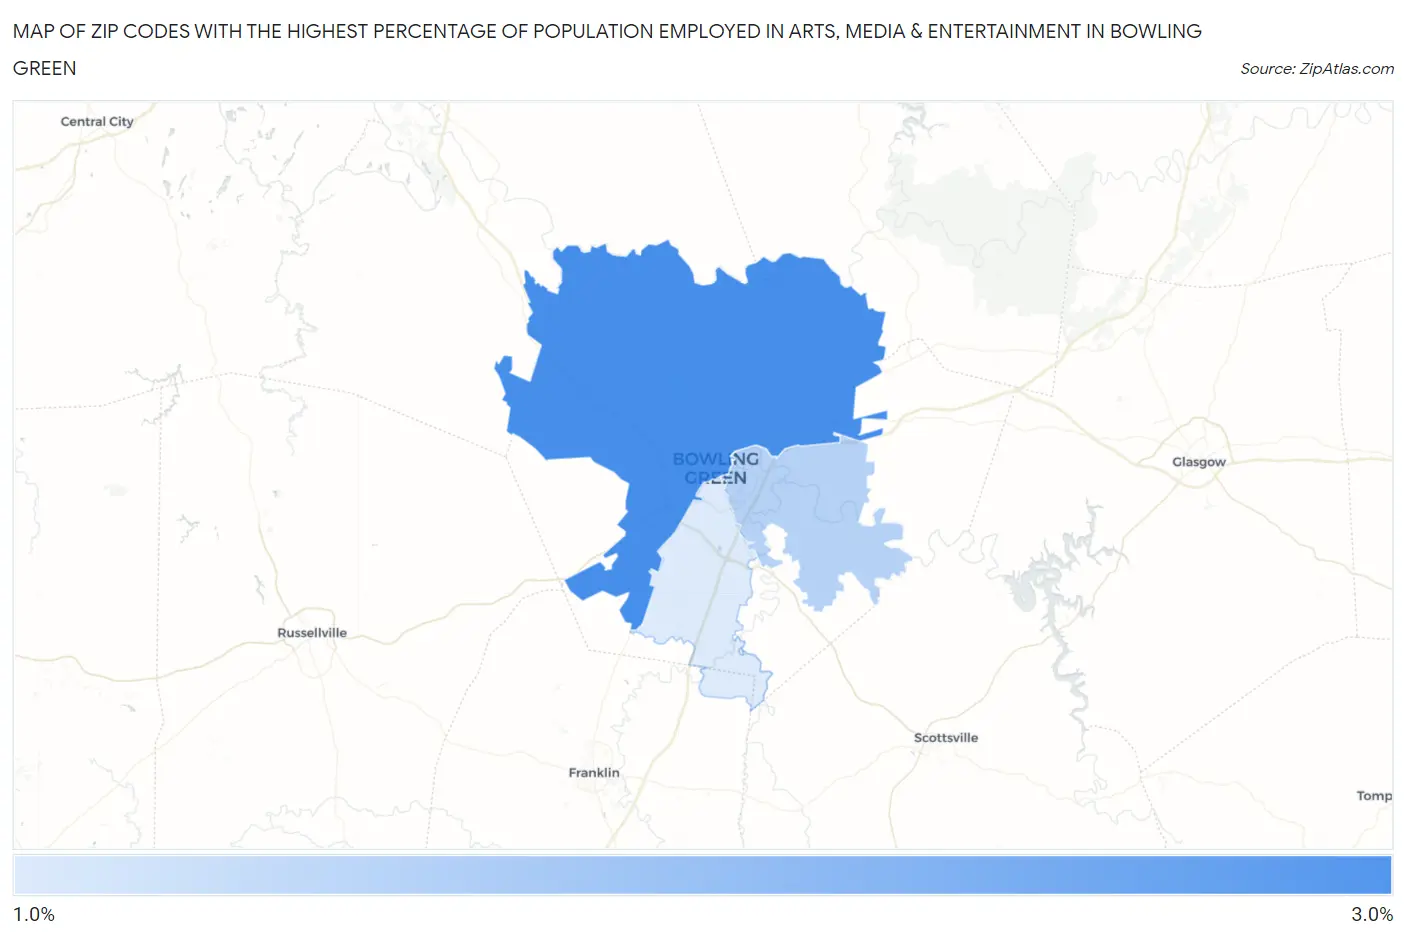
Map of Zip Codes with the Highest Percentage of Population Employed in Arts, Media & Entertainment in Bowling Green
1.5%
2.5%
Zip Codes with the Highest Percentage of Population Employed in Arts, Media & Entertainment in Bowling Green, KY
| Zip Code | % Employed | vs State | vs National | |
| 1. | 42101 | 2.5% | 1.4%(+1.12)#62 | 2.1%(+0.439)#5,546 |
| 2. | 42103 | 1.8% | 1.4%(+0.412)#108 | 2.1%(-0.268)#9,018 |
| 3. | 42104 | 1.5% | 1.4%(+0.167)#128 | 2.1%(-0.513)#10,672 |
1
Common Questions
What are the Top Zip Codes with the Highest Percentage of Population Employed in Arts, Media & Entertainment in Bowling Green, KY?
Top Zip Codes with the Highest Percentage of Population Employed in Arts, Media & Entertainment in Bowling Green, KY are:
What zip code has the Highest Percentage of Population Employed in Arts, Media & Entertainment in Bowling Green, KY?
42101 has the Highest Percentage of Population Employed in Arts, Media & Entertainment in Bowling Green, KY with 2.5%.
What is the Percentage of Population Employed in Arts, Media & Entertainment in Bowling Green, KY?
Percentage of Population Employed in Arts, Media & Entertainment in Bowling Green is 2.7%.
What is the Percentage of Population Employed in Arts, Media & Entertainment in Kentucky?
Percentage of Population Employed in Arts, Media & Entertainment in Kentucky is 1.4%.
What is the Percentage of Population Employed in Arts, Media & Entertainment in the United States?
Percentage of Population Employed in Arts, Media & Entertainment in the United States is 2.1%.