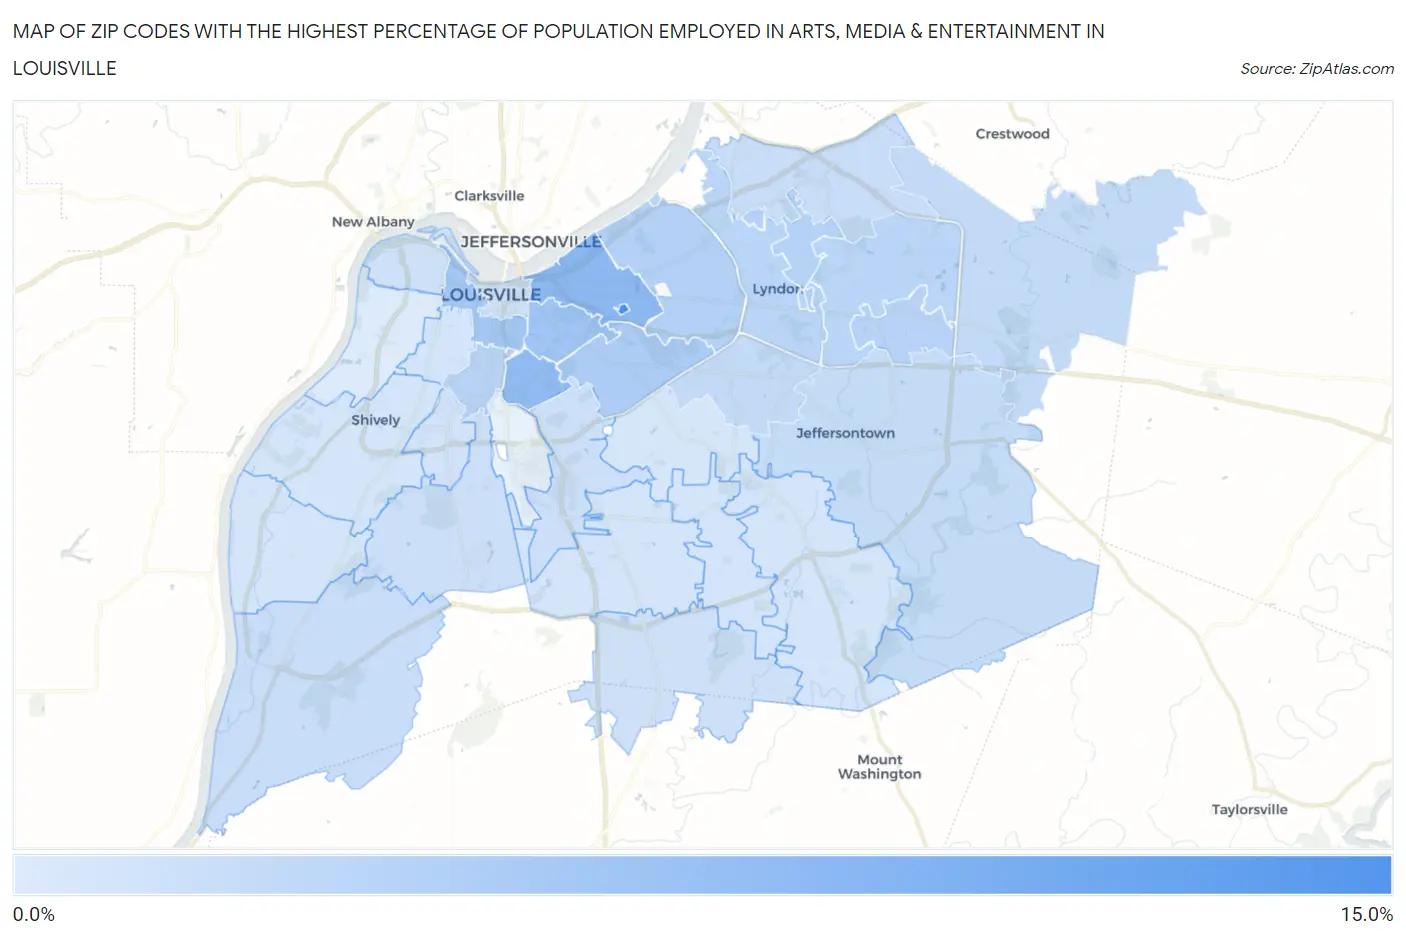
Zip Codes with the Highest Percentage of Population Employed in Arts, Media & Entertainment in Louisville, KY
RELATED REPORTS & OPTIONS
Arts, Media & Entertainment
Louisville
Compare Zip Codes
Map of Zip Codes with the Highest Percentage of Population Employed in Arts, Media & Entertainment in Louisville
0.28%
10.1%
Zip Codes with the Highest Percentage of Population Employed in Arts, Media & Entertainment in Louisville, KY
| Zip Code | % Employed | vs State | vs National | |
| 1. | 40280 | 10.1% | 1.4%(+8.75)#8 | 2.1%(+8.07)#368 |
| 2. | 40206 | 5.5% | 1.4%(+4.08)#17 | 2.1%(+3.40)#1,271 |
| 3. | 40217 | 5.1% | 1.4%(+3.72)#21 | 2.1%(+3.04)#1,444 |
| 4. | 40204 | 4.1% | 1.4%(+2.69)#27 | 2.1%(+2.01)#2,283 |
| 5. | 40203 | 4.0% | 1.4%(+2.63)#28 | 2.1%(+1.95)#2,355 |
| 6. | 40205 | 3.4% | 1.4%(+2.04)#37 | 2.1%(+1.36)#3,184 |
| 7. | 40207 | 2.9% | 1.4%(+1.56)#43 | 2.1%(+0.877)#4,237 |
| 8. | 40242 | 2.8% | 1.4%(+1.40)#51 | 2.1%(+0.722)#4,662 |
| 9. | 40208 | 2.6% | 1.4%(+1.20)#54 | 2.1%(+0.523)#5,285 |
| 10. | 40243 | 2.6% | 1.4%(+1.19)#56 | 2.1%(+0.514)#5,317 |
| 11. | 40223 | 2.5% | 1.4%(+1.10)#64 | 2.1%(+0.422)#5,610 |
| 12. | 40222 | 2.4% | 1.4%(+1.05)#68 | 2.1%(+0.365)#5,834 |
| 13. | 40220 | 1.9% | 1.4%(+0.516)#100 | 2.1%(-0.165)#8,403 |
| 14. | 40245 | 1.8% | 1.4%(+0.442)#106 | 2.1%(-0.238)#8,842 |
| 15. | 40299 | 1.7% | 1.4%(+0.354)#110 | 2.1%(-0.326)#9,375 |
| 16. | 40241 | 1.7% | 1.4%(+0.273)#118 | 2.1%(-0.407)#9,968 |
| 17. | 40272 | 1.5% | 1.4%(+0.143)#132 | 2.1%(-0.537)#10,821 |
| 18. | 40214 | 1.4% | 1.4%(-0.017)#149 | 2.1%(-0.697)#11,969 |
| 19. | 40213 | 1.2% | 1.4%(-0.151)#160 | 2.1%(-0.831)#13,013 |
| 20. | 40202 | 1.2% | 1.4%(-0.181)#164 | 2.1%(-0.862)#13,235 |
| 21. | 40229 | 1.2% | 1.4%(-0.182)#165 | 2.1%(-0.863)#13,246 |
| 22. | 40212 | 1.1% | 1.4%(-0.273)#174 | 2.1%(-0.954)#13,943 |
| 23. | 40215 | 1.00% | 1.4%(-0.381)#186 | 2.1%(-1.06)#14,810 |
| 24. | 40216 | 0.86% | 1.4%(-0.524)#211 | 2.1%(-1.20)#15,989 |
| 25. | 40291 | 0.84% | 1.4%(-0.545)#214 | 2.1%(-1.23)#16,127 |
| 26. | 40210 | 0.83% | 1.4%(-0.549)#215 | 2.1%(-1.23)#16,168 |
| 27. | 40219 | 0.83% | 1.4%(-0.555)#217 | 2.1%(-1.24)#16,210 |
| 28. | 40228 | 0.82% | 1.4%(-0.560)#218 | 2.1%(-1.24)#16,244 |
| 29. | 40258 | 0.80% | 1.4%(-0.584)#222 | 2.1%(-1.26)#16,455 |
| 30. | 40218 | 0.72% | 1.4%(-0.660)#230 | 2.1%(-1.34)#17,057 |
| 31. | 40211 | 0.28% | 1.4%(-1.10)#277 | 2.1%(-1.79)#20,512 |
1
Common Questions
What are the Top 10 Zip Codes with the Highest Percentage of Population Employed in Arts, Media & Entertainment in Louisville, KY?
Top 10 Zip Codes with the Highest Percentage of Population Employed in Arts, Media & Entertainment in Louisville, KY are:
What zip code has the Highest Percentage of Population Employed in Arts, Media & Entertainment in Louisville, KY?
40280 has the Highest Percentage of Population Employed in Arts, Media & Entertainment in Louisville, KY with 10.1%.
What is the Percentage of Population Employed in Arts, Media & Entertainment in Louisville, KY?
Percentage of Population Employed in Arts, Media & Entertainment in Louisville is 1.8%.
What is the Percentage of Population Employed in Arts, Media & Entertainment in Kentucky?
Percentage of Population Employed in Arts, Media & Entertainment in Kentucky is 1.4%.
What is the Percentage of Population Employed in Arts, Media & Entertainment in the United States?
Percentage of Population Employed in Arts, Media & Entertainment in the United States is 2.1%.