Zip Codes with the Highest Percentage of Population Employed in Arts, Media & Entertainment in Kentucky
RELATED REPORTS & OPTIONS
Arts, Media & Entertainment
Kentucky
Compare Zip Codes
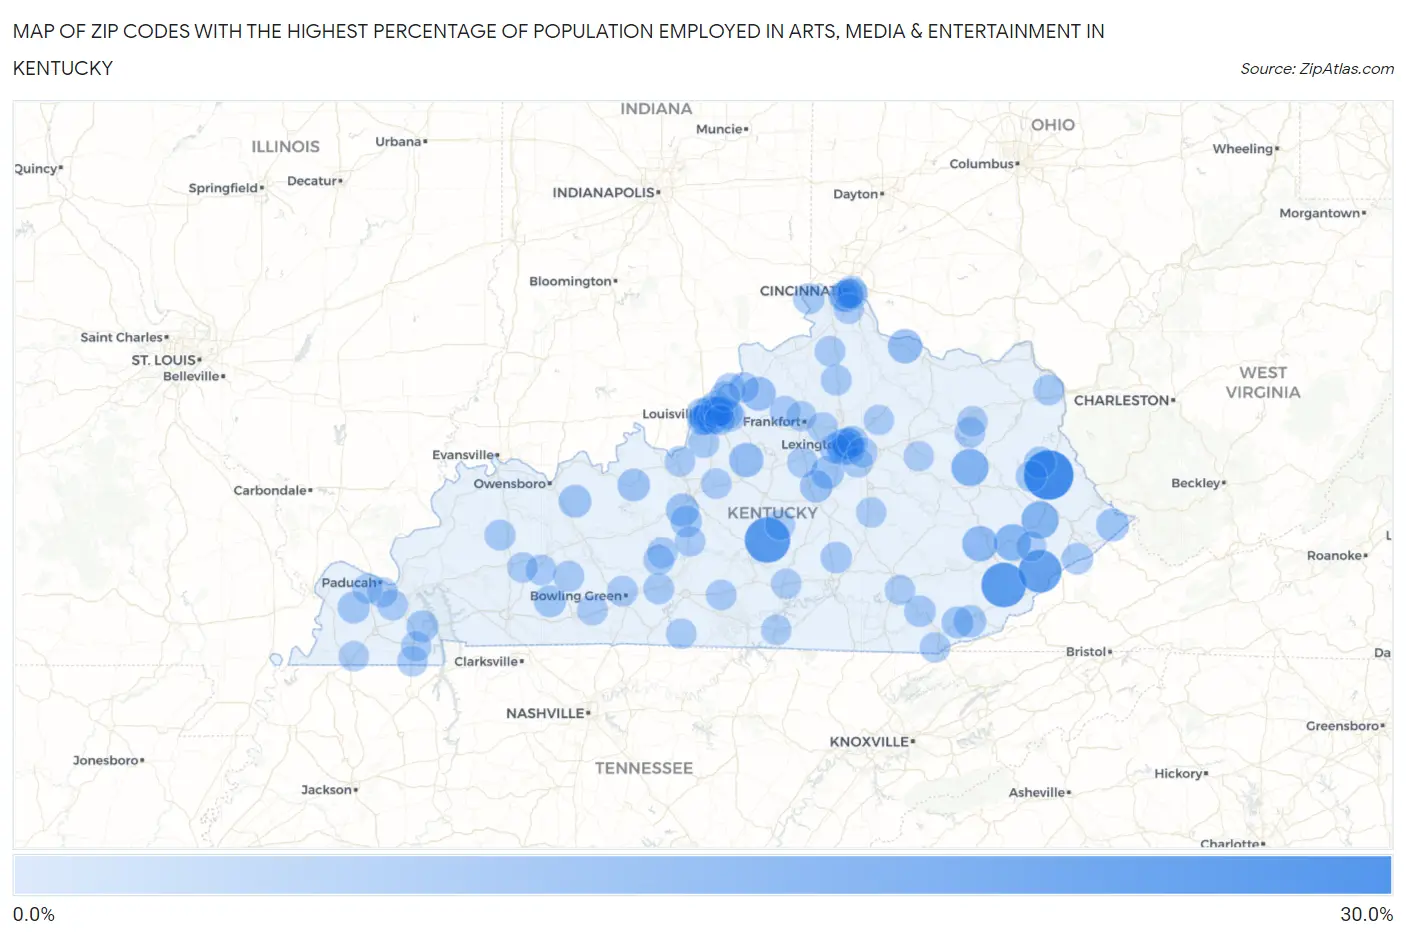
Map of Zip Codes with the Highest Percentage of Population Employed in Arts, Media & Entertainment in Kentucky
0.0%
30.0%
Zip Codes with the Highest Percentage of Population Employed in Arts, Media & Entertainment in Kentucky
| Zip Code | % Employed | vs State | vs National | |
| 1. | 41271 | 29.8% | 1.4%(+28.4)#1 | 2.1%(+27.7)#42 |
| 2. | 42758 | 23.5% | 1.4%(+22.1)#2 | 2.1%(+21.5)#68 |
| 3. | 41763 | 22.5% | 1.4%(+21.2)#3 | 2.1%(+20.5)#73 |
| 4. | 41815 | 19.9% | 1.4%(+18.6)#4 | 2.1%(+17.9)#97 |
| 5. | 41645 | 11.9% | 1.4%(+10.5)#5 | 2.1%(+9.82)#265 |
| 6. | 41425 | 11.8% | 1.4%(+10.5)#6 | 2.1%(+9.77)#266 |
| 7. | 41740 | 11.0% | 1.4%(+9.66)#7 | 2.1%(+8.98)#305 |
| 8. | 40280 | 10.1% | 1.4%(+8.75)#8 | 2.1%(+8.07)#368 |
| 9. | 41727 | 9.4% | 1.4%(+8.00)#9 | 2.1%(+7.32)#421 |
| 10. | 40020 | 7.6% | 1.4%(+6.20)#10 | 2.1%(+5.51)#631 |
| 11. | 41002 | 7.5% | 1.4%(+6.17)#11 | 2.1%(+5.48)#638 |
| 12. | 40068 | 7.2% | 1.4%(+5.78)#12 | 2.1%(+5.10)#719 |
| 13. | 42740 | 5.9% | 1.4%(+4.56)#13 | 2.1%(+3.88)#1,057 |
| 14. | 40507 | 5.7% | 1.4%(+4.36)#14 | 2.1%(+3.68)#1,141 |
| 15. | 40390 | 5.7% | 1.4%(+4.34)#15 | 2.1%(+3.66)#1,151 |
| 16. | 41553 | 5.5% | 1.4%(+4.13)#16 | 2.1%(+3.45)#1,245 |
| 17. | 40206 | 5.5% | 1.4%(+4.08)#17 | 2.1%(+3.40)#1,271 |
| 18. | 42378 | 5.3% | 1.4%(+3.96)#18 | 2.1%(+3.28)#1,331 |
| 19. | 40310 | 5.1% | 1.4%(+3.77)#19 | 2.1%(+3.09)#1,424 |
| 20. | 40144 | 5.1% | 1.4%(+3.76)#20 | 2.1%(+3.08)#1,428 |
| 21. | 40217 | 5.1% | 1.4%(+3.72)#21 | 2.1%(+3.04)#1,444 |
| 22. | 40873 | 4.9% | 1.4%(+3.47)#22 | 2.1%(+2.79)#1,581 |
| 23. | 41014 | 4.4% | 1.4%(+3.04)#23 | 2.1%(+2.36)#1,922 |
| 24. | 42280 | 4.3% | 1.4%(+2.89)#24 | 2.1%(+2.21)#2,067 |
| 25. | 42035 | 4.3% | 1.4%(+2.87)#25 | 2.1%(+2.19)#2,085 |
| 26. | 42048 | 4.1% | 1.4%(+2.75)#26 | 2.1%(+2.07)#2,213 |
| 27. | 40204 | 4.1% | 1.4%(+2.69)#27 | 2.1%(+2.01)#2,283 |
| 28. | 40203 | 4.0% | 1.4%(+2.63)#28 | 2.1%(+1.95)#2,355 |
| 29. | 41257 | 3.9% | 1.4%(+2.53)#29 | 2.1%(+1.85)#2,490 |
| 30. | 40845 | 3.9% | 1.4%(+2.53)#30 | 2.1%(+1.85)#2,491 |
| 31. | 40502 | 3.9% | 1.4%(+2.47)#31 | 2.1%(+1.79)#2,557 |
| 32. | 40906 | 3.8% | 1.4%(+2.44)#32 | 2.1%(+1.76)#2,593 |
| 33. | 41512 | 3.7% | 1.4%(+2.28)#33 | 2.1%(+1.60)#2,818 |
| 34. | 40504 | 3.6% | 1.4%(+2.20)#34 | 2.1%(+1.52)#2,938 |
| 35. | 42776 | 3.5% | 1.4%(+2.15)#35 | 2.1%(+1.47)#3,031 |
| 36. | 42567 | 3.5% | 1.4%(+2.14)#36 | 2.1%(+1.45)#3,047 |
| 37. | 40205 | 3.4% | 1.4%(+2.04)#37 | 2.1%(+1.36)#3,184 |
| 38. | 40503 | 3.2% | 1.4%(+1.86)#38 | 2.1%(+1.18)#3,531 |
| 39. | 41256 | 3.1% | 1.4%(+1.70)#39 | 2.1%(+1.02)#3,884 |
| 40. | 41080 | 3.1% | 1.4%(+1.69)#40 | 2.1%(+1.01)#3,918 |
| 41. | 40025 | 3.0% | 1.4%(+1.62)#41 | 2.1%(+0.935)#4,086 |
| 42. | 40026 | 3.0% | 1.4%(+1.59)#42 | 2.1%(+0.910)#4,156 |
| 43. | 40207 | 2.9% | 1.4%(+1.56)#43 | 2.1%(+0.877)#4,237 |
| 44. | 41010 | 2.9% | 1.4%(+1.56)#44 | 2.1%(+0.876)#4,240 |
| 45. | 42436 | 2.9% | 1.4%(+1.52)#45 | 2.1%(+0.841)#4,346 |
| 46. | 40109 | 2.9% | 1.4%(+1.51)#46 | 2.1%(+0.833)#4,363 |
| 47. | 42171 | 2.8% | 1.4%(+1.46)#47 | 2.1%(+0.783)#4,492 |
| 48. | 42339 | 2.8% | 1.4%(+1.46)#48 | 2.1%(+0.778)#4,505 |
| 49. | 41074 | 2.8% | 1.4%(+1.43)#49 | 2.1%(+0.752)#4,574 |
| 50. | 41102 | 2.8% | 1.4%(+1.42)#50 | 2.1%(+0.735)#4,631 |
| 51. | 40242 | 2.8% | 1.4%(+1.40)#51 | 2.1%(+0.722)#4,662 |
| 52. | 40508 | 2.8% | 1.4%(+1.39)#52 | 2.1%(+0.714)#4,681 |
| 53. | 40003 | 2.6% | 1.4%(+1.21)#53 | 2.1%(+0.534)#5,252 |
| 54. | 40208 | 2.6% | 1.4%(+1.20)#54 | 2.1%(+0.523)#5,285 |
| 55. | 42082 | 2.6% | 1.4%(+1.20)#55 | 2.1%(+0.520)#5,293 |
| 56. | 40243 | 2.6% | 1.4%(+1.19)#56 | 2.1%(+0.514)#5,317 |
| 57. | 40031 | 2.5% | 1.4%(+1.16)#57 | 2.1%(+0.476)#5,433 |
| 58. | 40313 | 2.5% | 1.4%(+1.14)#58 | 2.1%(+0.463)#5,473 |
| 59. | 40372 | 2.5% | 1.4%(+1.14)#59 | 2.1%(+0.461)#5,483 |
| 60. | 40513 | 2.5% | 1.4%(+1.13)#60 | 2.1%(+0.448)#5,524 |
| 61. | 42345 | 2.5% | 1.4%(+1.12)#61 | 2.1%(+0.444)#5,535 |
| 62. | 42101 | 2.5% | 1.4%(+1.12)#62 | 2.1%(+0.439)#5,546 |
| 63. | 40347 | 2.5% | 1.4%(+1.11)#63 | 2.1%(+0.429)#5,584 |
| 64. | 40223 | 2.5% | 1.4%(+1.10)#64 | 2.1%(+0.422)#5,610 |
| 65. | 40505 | 2.5% | 1.4%(+1.10)#65 | 2.1%(+0.422)#5,613 |
| 66. | 41035 | 2.5% | 1.4%(+1.09)#66 | 2.1%(+0.406)#5,662 |
| 67. | 42729 | 2.4% | 1.4%(+1.06)#67 | 2.1%(+0.383)#5,767 |
| 68. | 40222 | 2.4% | 1.4%(+1.05)#68 | 2.1%(+0.365)#5,834 |
| 69. | 41011 | 2.4% | 1.4%(+1.03)#69 | 2.1%(+0.351)#5,894 |
| 70. | 42713 | 2.4% | 1.4%(+0.978)#70 | 2.1%(+0.298)#6,093 |
| 71. | 42464 | 2.3% | 1.4%(+0.948)#71 | 2.1%(+0.268)#6,252 |
| 72. | 42049 | 2.3% | 1.4%(+0.942)#72 | 2.1%(+0.261)#6,281 |
| 73. | 42206 | 2.3% | 1.4%(+0.924)#73 | 2.1%(+0.244)#6,366 |
| 74. | 40965 | 2.3% | 1.4%(+0.904)#74 | 2.1%(+0.224)#6,440 |
| 75. | 40121 | 2.3% | 1.4%(+0.900)#75 | 2.1%(+0.220)#6,456 |
| 76. | 42003 | 2.3% | 1.4%(+0.897)#76 | 2.1%(+0.217)#6,465 |
| 77. | 42129 | 2.3% | 1.4%(+0.891)#77 | 2.1%(+0.211)#6,501 |
| 78. | 41075 | 2.3% | 1.4%(+0.891)#78 | 2.1%(+0.211)#6,503 |
| 79. | 40107 | 2.3% | 1.4%(+0.890)#79 | 2.1%(+0.210)#6,510 |
| 80. | 42259 | 2.2% | 1.4%(+0.861)#80 | 2.1%(+0.181)#6,637 |
| 81. | 40059 | 2.2% | 1.4%(+0.832)#81 | 2.1%(+0.152)#6,762 |
| 82. | 42133 | 2.2% | 1.4%(+0.831)#82 | 2.1%(+0.151)#6,770 |
| 83. | 40351 | 2.2% | 1.4%(+0.783)#83 | 2.1%(+0.103)#6,980 |
| 84. | 41015 | 2.2% | 1.4%(+0.777)#84 | 2.1%(+0.097)#7,016 |
| 85. | 42642 | 2.1% | 1.4%(+0.767)#85 | 2.1%(+0.087)#7,065 |
| 86. | 40404 | 2.1% | 1.4%(+0.758)#86 | 2.1%(+0.078)#7,092 |
| 87. | 40601 | 2.1% | 1.4%(+0.741)#87 | 2.1%(+0.061)#7,166 |
| 88. | 40361 | 2.1% | 1.4%(+0.735)#88 | 2.1%(+0.054)#7,192 |
| 89. | 40515 | 2.1% | 1.4%(+0.731)#89 | 2.1%(+0.051)#7,206 |
| 90. | 42041 | 2.1% | 1.4%(+0.694)#90 | 2.1%(+0.014)#7,413 |
| 91. | 40509 | 2.0% | 1.4%(+0.661)#91 | 2.1%(-0.020)#7,589 |
| 92. | 41844 | 2.0% | 1.4%(+0.660)#92 | 2.1%(-0.020)#7,598 |
| 93. | 40740 | 2.0% | 1.4%(+0.622)#93 | 2.1%(-0.058)#7,806 |
| 94. | 40009 | 2.0% | 1.4%(+0.597)#94 | 2.1%(-0.083)#7,928 |
| 95. | 40337 | 2.0% | 1.4%(+0.597)#95 | 2.1%(-0.083)#7,929 |
| 96. | 42071 | 2.0% | 1.4%(+0.593)#96 | 2.1%(-0.087)#7,956 |
| 97. | 42602 | 2.0% | 1.4%(+0.592)#97 | 2.1%(-0.088)#7,965 |
| 98. | 41071 | 2.0% | 1.4%(+0.581)#98 | 2.1%(-0.099)#8,014 |
| 99. | 42001 | 1.9% | 1.4%(+0.568)#99 | 2.1%(-0.112)#8,094 |
| 100. | 40220 | 1.9% | 1.4%(+0.516)#100 | 2.1%(-0.165)#8,403 |
Common Questions
What are the Top 10 Zip Codes with the Highest Percentage of Population Employed in Arts, Media & Entertainment in Kentucky?
Top 10 Zip Codes with the Highest Percentage of Population Employed in Arts, Media & Entertainment in Kentucky are:
What zip code has the Highest Percentage of Population Employed in Arts, Media & Entertainment in Kentucky?
41271 has the Highest Percentage of Population Employed in Arts, Media & Entertainment in Kentucky with 29.8%.
What is the Percentage of Population Employed in Arts, Media & Entertainment in the State of Kentucky?
Percentage of Population Employed in Arts, Media & Entertainment in Kentucky is 1.4%.
What is the Percentage of Population Employed in Arts, Media & Entertainment in the United States?
Percentage of Population Employed in Arts, Media & Entertainment in the United States is 2.1%.