Zip Codes with the Highest Poverty Level Among Children Under the Age of 5 in Indianapolis, IN

RELATED REPORTS & OPTIONS

Highest Poverty | Child 0-5
Population
Families and Households
Female Fertility
Female Fertility (Unmarried)
Race (Community Size)
Race (Percentage)
Ancestry (Community Size)
AfghanAfricanAlaskan AthabascanAlbanianAlsatianAmericanApacheArabArgentineanArmenianAustralianAustrianBahamianBangladeshiBarbadianBasqueBelgianBelizeanBhutaneseBlackfeetBolivianBrazilianBritishBritish West IndianBulgarianBurmeseCajunCanadianCelticCentral AmericanCentral American IndianCherokeeChickasawChileanChippewaChoctawColombianCosta RicanCroatianCrowCubanCzechCzechoslovakianDanishDominicanDutchEastern EuropeanEcuadorianEgyptianEnglishEstonianEthiopianEuropeanFilipinoFinnishFrenchFrench CanadianGermanGerman RussianGhanaianGreekGuamanian / ChamorroGuatemalanGuyaneseHaitianHonduranHopiHungarianIcelanderIndian (Asian)IndonesianInupiatIranianIraqiIrishIroquoisIsraeliItalianJamaicanJapaneseJordanianKenyanKoreanLaotianLatvianLebaneseLiberianLithuanianLuxembourgerMacedonianMalaysianMenomineeMexicanMexican American IndianMongolianMoroccanNative HawaiianNavajoNew ZealanderNicaraguanNigerianNorthern EuropeanNorwegianPakistaniPalestinianPanamanianPennsylvania GermanPeruvianPolishPortuguesePotawatomiPuerto RicanRomanianRussianSalvadoranSamoanScandinavianScotch-IrishScottishSeminoleSenegaleseSerbianSierra LeoneanSiouxSlavicSlovakSloveneSouth AfricanSouth AmericanSouth American IndianSpaniardSpanishSri LankanSubsaharan AfricanSudaneseSwedishSwissSyrianThaiTonganTrinidadian and TobagonianTurkishUgandanUkrainianUruguayanVenezuelanVietnameseWelshWest IndianYugoslavianZimbabwean
Ancestry (Percentage)
AfghanAfricanAlaskan AthabascanAlbanianAlsatianAmericanApacheArabArgentineanArmenianAustralianAustrianBahamianBangladeshiBarbadianBasqueBelgianBelizeanBhutaneseBlackfeetBolivianBrazilianBritishBritish West IndianBulgarianBurmeseCajunCanadianCelticCentral AmericanCentral American IndianCherokeeChickasawChileanChippewaChoctawColombianCosta RicanCroatianCrowCubanCzechCzechoslovakianDanishDominicanDutchEastern EuropeanEcuadorianEgyptianEnglishEstonianEthiopianEuropeanFilipinoFinnishFrenchFrench CanadianGermanGerman RussianGhanaianGreekGuamanian / ChamorroGuatemalanGuyaneseHaitianHonduranHopiHungarianIcelanderIndian (Asian)IndonesianInupiatIranianIraqiIrishIroquoisIsraeliItalianJamaicanJapaneseJordanianKenyanKoreanLaotianLatvianLebaneseLiberianLithuanianLuxembourgerMacedonianMalaysianMenomineeMexicanMexican American IndianMongolianMoroccanNative HawaiianNavajoNew ZealanderNicaraguanNigerianNorthern EuropeanNorwegianPakistaniPalestinianPanamanianPennsylvania GermanPeruvianPolishPortuguesePotawatomiPuerto RicanRomanianRussianSalvadoranSamoanScandinavianScotch-IrishScottishSeminoleSenegaleseSerbianSierra LeoneanSiouxSlavicSlovakSloveneSouth AfricanSouth AmericanSouth American IndianSpaniardSpanishSri LankanSubsaharan AfricanSudaneseSwedishSwissSyrianThaiTonganTrinidadian and TobagonianTurkishUgandanUkrainianUruguayanVenezuelanVietnameseWelshWest IndianYugoslavianZimbabwean
Immigrant Origin (Total)
AfghanistanAfricaArgentinaAsiaAustraliaAustriaBahamasBangladeshBarbadosBelarusBoliviaBosnia and HerzegovinaBrazilBulgariaBurma / MyanmarCambodiaCameroonCanadaCaribbeanCentral AmericaChileChinaColombiaCongoCosta RicaCubaDenmarkDominican RepublicEastern AfricaEastern AsiaEastern EuropeEcuadorEgyptEl SalvadorEnglandEritreaEthiopiaEuropeFranceGermanyGhanaGreeceGuatemalaGuyanaHaitiHondurasHong KongHungaryIndiaIndonesiaIranIraqIrelandIsraelItalyJamaicaJapanJordanKenyaKoreaLaosLatin AmericaLatviaLebanonLiberiaMalaysiaMexicoMiddle AfricaMoldovaMoroccoNepalNetherlandsNicaraguaNigeriaNorth MacedoniaNorthern AfricaNorthern EuropeNorwayOceaniaPakistanPanamaPeruPhilippinesPolandPortugalRomaniaRussiaSaudi ArabiaScotlandSenegalSerbiaSierra LeoneSingaporeSouth AfricaSouth AmericaSouth Central AsiaSouth Eastern AsiaSouthern EuropeSpainSt. Vincent and the GrenadinesSudanSyriaTaiwanThailandTrinidad and TobagoTurkeyUgandaUkraineUzbekistanVenezuelaVietnamWest IndiesWestern AfricaWestern AsiaWestern EuropeYemenZaireZimbabwe
Immigrant Origin (Percentage)
AfghanistanAfricaArgentinaAsiaAustraliaAustriaBahamasBangladeshBarbadosBelarusBoliviaBosnia and HerzegovinaBrazilBulgariaBurma / MyanmarCambodiaCameroonCanadaCaribbeanCentral AmericaChileChinaColombiaCongoCosta RicaCubaDenmarkDominican RepublicEastern AfricaEastern AsiaEastern EuropeEcuadorEgyptEl SalvadorEnglandEritreaEthiopiaEuropeFranceGermanyGhanaGreeceGuatemalaGuyanaHaitiHondurasHong KongHungaryIndiaIndonesiaIranIraqIrelandIsraelItalyJamaicaJapanJordanKenyaKoreaLaosLatin AmericaLatviaLebanonLiberiaMalaysiaMexicoMiddle AfricaMoldovaMoroccoNepalNetherlandsNicaraguaNigeriaNorth MacedoniaNorthern AfricaNorthern EuropeNorwayOceaniaPakistanPanamaPeruPhilippinesPolandPortugalRomaniaRussiaSaudi ArabiaScotlandSenegalSerbiaSierra LeoneSingaporeSouth AfricaSouth AmericaSouth Central AsiaSouth Eastern AsiaSouthern EuropeSpainSt. Vincent and the GrenadinesSudanSyriaTaiwanThailandTrinidad and TobagoTurkeyUgandaUkraineUzbekistanVenezuelaVietnamWest IndiesWestern AfricaWestern AsiaWestern EuropeYemenZaireZimbabwe
Income
Income (Families)
Income (Households)
Poverty
Poverty (Families)
Unemployment
Employment Occupations
Employment Industries
Employer Class
Commute Time
Commute Means
School Enrollment
Education by Degree Field
Occupancy
Finances
Physical Characteristics
Indianapolis
Compare Zip Codes
Comparison Subject

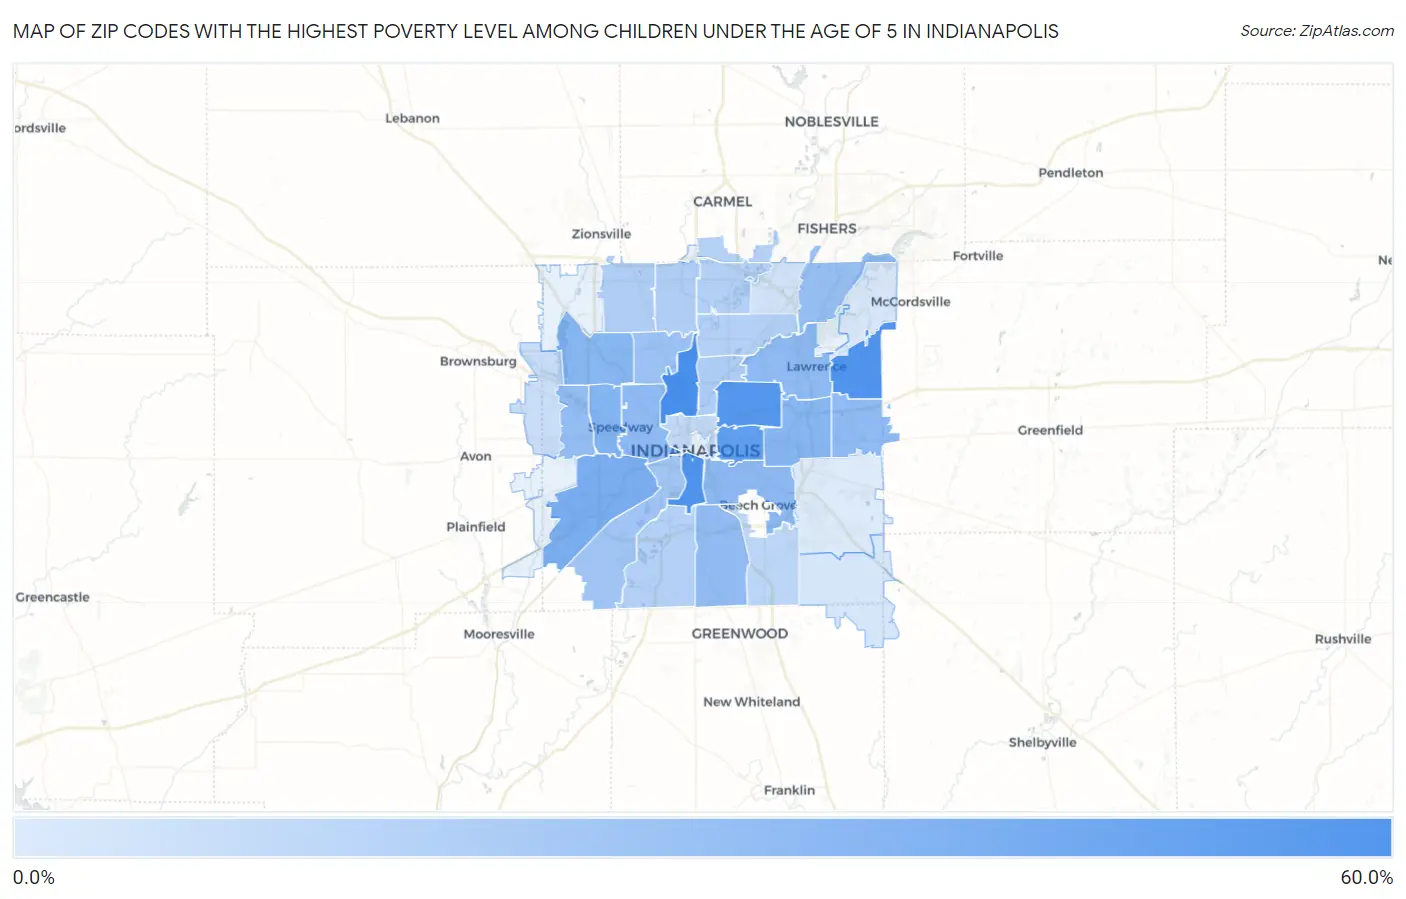
Map of Zip Codes with the Highest Poverty Level Among Children Under the Age of 5 in Indianapolis

0.0%
60.0%
Zip Codes with the Highest Poverty Level Among Children Under the Age of 5 in Indianapolis Map

Zip Codes with the Highest Poverty Level Among Children Under the Age of 5 in Indianapolis, IN

Zip Code Child Poverty vs State vs National
1.4620853.3%18.4%(+34.9)#4218.1%(+35.3)#2,209
2.4623550.7%18.4%(+32.3)#4918.1%(+32.6)#2,457
3.4622549.7%18.4%(+31.3)#5218.1%(+31.6)#2,631
4.4621847.4%18.4%(+29.0)#5918.1%(+29.3)#2,878
5.4620142.7%18.4%(+24.3)#7518.1%(+24.7)#3,529
6.4624133.4%18.4%(+15.0)#11418.1%(+15.3)#5,421
7.4622430.6%18.4%(+12.2)#13118.1%(+12.6)#6,184
8.4625428.9%18.4%(+10.5)#14218.1%(+10.8)#6,685
9.4621928.4%18.4%(+9.94)#14818.1%(+10.3)#6,862
10.4620327.2%18.4%(+8.78)#15518.1%(+9.14)#7,247
11.4622926.5%18.4%(+8.08)#16218.1%(+8.45)#7,474
12.4622626.3%18.4%(+7.91)#16418.1%(+8.27)#7,531
13.4622226.3%18.4%(+7.90)#16518.1%(+8.26)#7,532
14.4622725.1%18.4%(+6.71)#18018.1%(+7.07)#7,940
15.4621425.0%18.4%(+6.61)#18118.1%(+6.97)#7,959
16.4625623.5%18.4%(+5.04)#19918.1%(+5.40)#8,591
17.4622822.1%18.4%(+3.66)#21318.1%(+4.02)#9,156
18.4622120.1%18.4%(+1.65)#23918.1%(+2.01)#9,989
19.4620516.5%18.4%(-1.95)#29218.1%(-1.58)#11,654
20.4626816.0%18.4%(-2.46)#30218.1%(-2.10)#11,938
21.4626015.4%18.4%(-2.98)#30918.1%(-2.62)#12,194
22.4624014.4%18.4%(-4.06)#32218.1%(-3.70)#12,798
23.4622014.3%18.4%(-4.09)#32318.1%(-3.73)#12,808
24.4621714.0%18.4%(-4.47)#33418.1%(-4.11)#13,054
25.4628013.5%18.4%(-4.91)#34218.1%(-4.55)#13,316
26.4623711.3%18.4%(-7.08)#36918.1%(-6.72)#14,615
27.4620210.4%18.4%(-8.06)#38618.1%(-7.70)#15,186
28.462348.4%18.4%(-10.1)#42118.1%(-9.71)#16,515
29.462505.1%18.4%(-13.3)#47218.1%(-13.0)#18,707
30.462594.2%18.4%(-14.2)#48518.1%(-13.9)#19,329
31.462362.8%18.4%(-15.7)#51518.1%(-15.3)#20,343
32.462392.1%18.4%(-16.3)#52818.1%(-16.0)#20,764

Common Questions

What are the Top 10 Zip Codes with the Highest Poverty Level Among Children Under the Age of 5 in Indianapolis, IN?
Top 10 Zip Codes with the Highest Poverty Level Among Children Under the Age of 5 in Indianapolis, IN are:
#1
53.3%
#2
50.7%
#3
49.7%
#4
47.4%
#5
42.7%
#6
33.4%
#7
30.6%
#8
28.9%
#9
28.4%
#10
27.2%
What zip code has the Highest Poverty Level Among Children Under the Age of 5 in Indianapolis, IN?
46208 has the Highest Poverty Level Among Children Under the Age of 5 in Indianapolis, IN with 53.3%.
What is the Poverty Level Among Children Under the Age of 5 in Indianapolis, IN?
Poverty Level Among Children Under the Age of 5 in Indianapolis is 25.0%.
What is the Poverty Level Among Children Under the Age of 5 in Indiana?
Poverty Level Among Children Under the Age of 5 in Indiana is 18.4%.
What is the Poverty Level Among Children Under the Age of 5 in the United States?
Poverty Level Among Children Under the Age of 5 in the United States is 18.1%.