Zip Codes with the Highest Poverty Level Among Children Under the Age of 5 in Indiana
RELATED REPORTS & OPTIONS
Highest Poverty | Child 0-5
Indiana
Compare Zip Codes
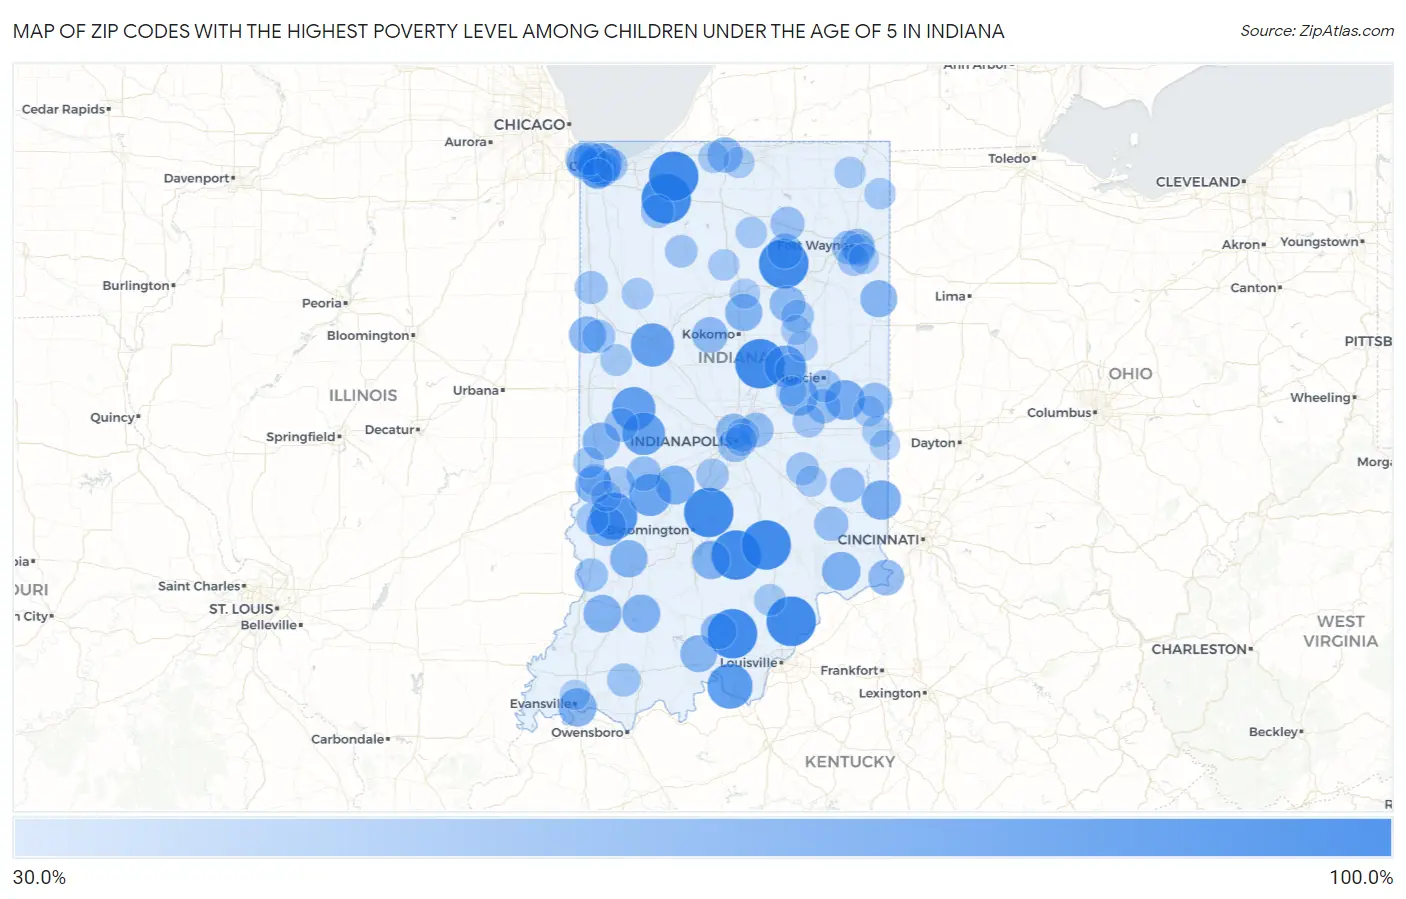
Map of Zip Codes with the Highest Poverty Level Among Children Under the Age of 5 in Indiana
30.0%
100.0%
Zip Codes with the Highest Poverty Level Among Children Under the Age of 5 in Indiana
| Zip Code | Child Poverty | vs State | vs National | |
| 1. | 47235 | 100.0% | 18.4%(+81.6)#1 | 18.1%(+81.9)#51 |
| 2. | 46340 | 100.0% | 18.4%(+81.6)#2 | 18.1%(+81.9)#60 |
| 3. | 47468 | 100.0% | 18.4%(+81.6)#3 | 18.1%(+81.9)#74 |
| 4. | 47163 | 100.0% | 18.4%(+81.6)#4 | 18.1%(+81.9)#128 |
| 5. | 47120 | 100.0% | 18.4%(+81.6)#5 | 18.1%(+81.9)#173 |
| 6. | 46980 | 100.0% | 18.4%(+81.6)#6 | 18.1%(+81.9)#405 |
| 7. | 47247 | 100.0% | 18.4%(+81.6)#7 | 18.1%(+81.9)#420 |
| 8. | 46345 | 100.0% | 18.4%(+81.6)#8 | 18.1%(+81.9)#524 |
| 9. | 46047 | 100.0% | 18.4%(+81.6)#9 | 18.1%(+81.9)#549 |
| 10. | 47858 | 91.6% | 18.4%(+73.2)#10 | 18.1%(+73.5)#621 |
| 11. | 47110 | 85.2% | 18.4%(+66.8)#11 | 18.1%(+67.2)#702 |
| 12. | 47916 | 80.0% | 18.4%(+61.6)#12 | 18.1%(+61.9)#826 |
| 13. | 47901 | 79.2% | 18.4%(+60.8)#13 | 18.1%(+61.2)#838 |
| 14. | 46175 | 77.3% | 18.4%(+58.8)#14 | 18.1%(+59.2)#890 |
| 15. | 47868 | 75.4% | 18.4%(+56.9)#15 | 18.1%(+57.3)#946 |
| 16. | 46063 | 73.3% | 18.4%(+54.9)#16 | 18.1%(+55.3)#1,037 |
| 17. | 46402 | 72.8% | 18.4%(+54.4)#17 | 18.1%(+54.8)#1,054 |
| 18. | 47354 | 68.0% | 18.4%(+49.6)#18 | 18.1%(+49.9)#1,226 |
| 19. | 47855 | 67.4% | 18.4%(+49.0)#19 | 18.1%(+49.4)#1,257 |
| 20. | 47016 | 66.7% | 18.4%(+48.2)#20 | 18.1%(+48.6)#1,286 |
| 21. | 47456 | 64.9% | 18.4%(+46.5)#21 | 18.1%(+46.8)#1,387 |
| 22. | 46017 | 64.3% | 18.4%(+45.9)#22 | 18.1%(+46.2)#1,423 |
| 23. | 46404 | 63.7% | 18.4%(+45.3)#23 | 18.1%(+45.7)#1,465 |
| 24. | 47224 | 63.6% | 18.4%(+45.2)#24 | 18.1%(+45.6)#1,471 |
| 25. | 47713 | 62.5% | 18.4%(+44.0)#25 | 18.1%(+44.4)#1,538 |
| 26. | 47519 | 62.1% | 18.4%(+43.6)#26 | 18.1%(+44.0)#1,554 |
| 27. | 47436 | 62.0% | 18.4%(+43.6)#27 | 18.1%(+43.9)#1,557 |
| 28. | 47557 | 61.5% | 18.4%(+43.1)#28 | 18.1%(+43.5)#1,589 |
| 29. | 47443 | 60.0% | 18.4%(+41.6)#29 | 18.1%(+41.9)#1,679 |
| 30. | 47862 | 60.0% | 18.4%(+41.6)#30 | 18.1%(+41.9)#1,680 |
| 31. | 46914 | 59.4% | 18.4%(+41.0)#31 | 18.1%(+41.4)#1,733 |
| 32. | 47807 | 58.9% | 18.4%(+40.4)#32 | 18.1%(+40.8)#1,775 |
| 33. | 47917 | 58.8% | 18.4%(+40.4)#33 | 18.1%(+40.8)#1,781 |
| 34. | 46772 | 58.4% | 18.4%(+40.0)#34 | 18.1%(+40.4)#1,798 |
| 35. | 47118 | 58.4% | 18.4%(+40.0)#35 | 18.1%(+40.3)#1,802 |
| 36. | 47125 | 55.3% | 18.4%(+36.9)#36 | 18.1%(+37.2)#2,056 |
| 37. | 46407 | 55.2% | 18.4%(+36.7)#37 | 18.1%(+37.1)#2,062 |
| 38. | 47038 | 55.0% | 18.4%(+36.6)#38 | 18.1%(+36.9)#2,069 |
| 39. | 46915 | 54.8% | 18.4%(+36.3)#39 | 18.1%(+36.7)#2,085 |
| 40. | 46940 | 54.5% | 18.4%(+36.1)#40 | 18.1%(+36.4)#2,104 |
| 41. | 46601 | 53.8% | 18.4%(+35.3)#41 | 18.1%(+35.7)#2,165 |
| 42. | 46208 | 53.3% | 18.4%(+34.9)#42 | 18.1%(+35.3)#2,209 |
| 43. | 46946 | 52.5% | 18.4%(+34.1)#43 | 18.1%(+34.4)#2,303 |
| 44. | 46803 | 52.3% | 18.4%(+33.9)#44 | 18.1%(+34.2)#2,321 |
| 45. | 46406 | 51.5% | 18.4%(+33.1)#45 | 18.1%(+33.4)#2,385 |
| 46. | 47024 | 51.4% | 18.4%(+33.0)#46 | 18.1%(+33.4)#2,390 |
| 47. | 47355 | 51.0% | 18.4%(+32.6)#47 | 18.1%(+32.9)#2,428 |
| 48. | 46171 | 51.0% | 18.4%(+32.6)#48 | 18.1%(+32.9)#2,430 |
| 49. | 46235 | 50.7% | 18.4%(+32.3)#49 | 18.1%(+32.6)#2,457 |
| 50. | 47361 | 50.0% | 18.4%(+31.6)#50 | 18.1%(+31.9)#2,591 |
| 51. | 47034 | 50.0% | 18.4%(+31.6)#51 | 18.1%(+31.9)#2,601 |
| 52. | 46225 | 49.7% | 18.4%(+31.3)#52 | 18.1%(+31.6)#2,631 |
| 53. | 46327 | 49.4% | 18.4%(+31.0)#53 | 18.1%(+31.4)#2,648 |
| 54. | 46562 | 48.9% | 18.4%(+30.5)#54 | 18.1%(+30.9)#2,699 |
| 55. | 46320 | 48.9% | 18.4%(+30.5)#55 | 18.1%(+30.8)#2,709 |
| 56. | 46802 | 48.5% | 18.4%(+30.0)#56 | 18.1%(+30.4)#2,760 |
| 57. | 47859 | 48.4% | 18.4%(+29.9)#57 | 18.1%(+30.3)#2,773 |
| 58. | 46348 | 47.6% | 18.4%(+29.2)#58 | 18.1%(+29.6)#2,857 |
| 59. | 46218 | 47.4% | 18.4%(+29.0)#59 | 18.1%(+29.3)#2,878 |
| 60. | 46312 | 47.3% | 18.4%(+28.8)#60 | 18.1%(+29.2)#2,888 |
| 61. | 47561 | 46.7% | 18.4%(+28.2)#61 | 18.1%(+28.6)#2,962 |
| 62. | 47921 | 46.3% | 18.4%(+27.9)#62 | 18.1%(+28.3)#3,001 |
| 63. | 47637 | 46.2% | 18.4%(+27.8)#63 | 18.1%(+28.2)#3,012 |
| 64. | 47951 | 46.0% | 18.4%(+27.6)#64 | 18.1%(+27.9)#3,051 |
| 65. | 46952 | 45.5% | 18.4%(+27.1)#65 | 18.1%(+27.4)#3,104 |
| 66. | 46146 | 45.2% | 18.4%(+26.7)#66 | 18.1%(+27.1)#3,162 |
| 67. | 46111 | 45.0% | 18.4%(+26.6)#67 | 18.1%(+26.9)#3,187 |
| 68. | 47302 | 44.4% | 18.4%(+26.0)#68 | 18.1%(+26.3)#3,282 |
| 69. | 46403 | 44.4% | 18.4%(+26.0)#69 | 18.1%(+26.3)#3,283 |
| 70. | 46996 | 44.3% | 18.4%(+25.9)#70 | 18.1%(+26.2)#3,296 |
| 71. | 47850 | 43.8% | 18.4%(+25.3)#71 | 18.1%(+25.7)#3,370 |
| 72. | 47351 | 43.8% | 18.4%(+25.3)#72 | 18.1%(+25.7)#3,378 |
| 73. | 46806 | 43.4% | 18.4%(+25.0)#73 | 18.1%(+25.3)#3,426 |
| 74. | 47881 | 42.9% | 18.4%(+24.4)#74 | 18.1%(+24.8)#3,519 |
| 75. | 46201 | 42.7% | 18.4%(+24.3)#75 | 18.1%(+24.7)#3,529 |
| 76. | 47804 | 42.7% | 18.4%(+24.2)#76 | 18.1%(+24.6)#3,540 |
| 77. | 46001 | 42.5% | 18.4%(+24.1)#77 | 18.1%(+24.4)#3,577 |
| 78. | 46819 | 42.0% | 18.4%(+23.6)#78 | 18.1%(+23.9)#3,658 |
| 79. | 47170 | 41.9% | 18.4%(+23.5)#79 | 18.1%(+23.9)#3,666 |
| 80. | 47918 | 41.7% | 18.4%(+23.3)#80 | 18.1%(+23.6)#3,703 |
| 81. | 47995 | 41.3% | 18.4%(+22.9)#81 | 18.1%(+23.3)#3,774 |
| 82. | 46539 | 40.6% | 18.4%(+22.2)#82 | 18.1%(+22.6)#3,909 |
| 83. | 46721 | 40.6% | 18.4%(+22.1)#83 | 18.1%(+22.5)#3,918 |
| 84. | 46544 | 40.2% | 18.4%(+21.8)#84 | 18.1%(+22.1)#3,978 |
| 85. | 46747 | 40.0% | 18.4%(+21.6)#85 | 18.1%(+21.9)#4,009 |
| 86. | 47884 | 40.0% | 18.4%(+21.6)#86 | 18.1%(+21.9)#4,032 |
| 87. | 46931 | 40.0% | 18.4%(+21.6)#87 | 18.1%(+21.9)#4,033 |
| 88. | 47374 | 39.6% | 18.4%(+21.2)#88 | 18.1%(+21.6)#4,097 |
| 89. | 47393 | 39.4% | 18.4%(+21.0)#89 | 18.1%(+21.3)#4,138 |
| 90. | 46408 | 39.2% | 18.4%(+20.8)#90 | 18.1%(+21.1)#4,171 |
| 91. | 46156 | 39.1% | 18.4%(+20.7)#91 | 18.1%(+21.1)#4,186 |
| 92. | 46619 | 39.1% | 18.4%(+20.6)#92 | 18.1%(+21.0)#4,201 |
| 93. | 47871 | 38.5% | 18.4%(+20.0)#93 | 18.1%(+20.4)#4,316 |
| 94. | 46930 | 38.5% | 18.4%(+20.0)#94 | 18.1%(+20.4)#4,319 |
| 95. | 46816 | 37.9% | 18.4%(+19.5)#95 | 18.1%(+19.9)#4,424 |
| 96. | 46016 | 37.6% | 18.4%(+19.2)#96 | 18.1%(+19.5)#4,476 |
| 97. | 47324 | 37.5% | 18.4%(+19.1)#97 | 18.1%(+19.4)#4,501 |
| 98. | 47710 | 37.2% | 18.4%(+18.8)#98 | 18.1%(+19.1)#4,556 |
| 99. | 46953 | 37.1% | 18.4%(+18.7)#99 | 18.1%(+19.1)#4,569 |
| 100. | 46970 | 37.0% | 18.4%(+18.6)#100 | 18.1%(+19.0)#4,584 |
Common Questions
What are the Top 10 Zip Codes with the Highest Poverty Level Among Children Under the Age of 5 in Indiana?
Top 10 Zip Codes with the Highest Poverty Level Among Children Under the Age of 5 in Indiana are:
What zip code has the Highest Poverty Level Among Children Under the Age of 5 in Indiana?
47235 has the Highest Poverty Level Among Children Under the Age of 5 in Indiana with 100.0%.
What is the Poverty Level Among Children Under the Age of 5 in the State of Indiana?
Poverty Level Among Children Under the Age of 5 in Indiana is 18.4%.
What is the Poverty Level Among Children Under the Age of 5 in the United States?
Poverty Level Among Children Under the Age of 5 in the United States is 18.1%.