Pueblo West, CO Map & Demographics
Pueblo West Map
Pueblo West Overview
$37,197
PER CAPITA INCOME
$100,972
AVG FAMILY INCOME
$89,530
AVG HOUSEHOLD INCOME
34.5%
WAGE / INCOME GAP [ % ]
65.5¢/ $1
WAGE / INCOME GAP [ $ ]
0.37
INEQUALITY / GINI INDEX
34,337
TOTAL POPULATION
17,001
MALE POPULATION
17,336
FEMALE POPULATION
98.07
MALES / 100 FEMALES
101.97
FEMALES / 100 MALES
40.7
MEDIAN AGE
3.2
AVG FAMILY SIZE
2.8
AVG HOUSEHOLD SIZE
16,652
LABOR FORCE [ PEOPLE ]
61.2%
PERCENT IN LABOR FORCE
4.4%
UNEMPLOYMENT RATE
Pueblo West Area Codes
Income in Pueblo West
Income Overview in Pueblo West
Per Capita Income in Pueblo West is $37,197, while median incomes of families and households are $100,972 and $89,530 respectively.
| Characteristic | Number | Measure |
| Per Capita Income | 34,337 | $37,197 |
| Median Family Income | 9,444 | $100,972 |
| Mean Family Income | 9,444 | $112,573 |
| Median Household Income | 12,108 | $89,530 |
| Mean Household Income | 12,108 | $104,308 |
| Income Deficit | 9,444 | $0 |
| Wage / Income Gap (%) | 34,337 | 34.52% |
| Wage / Income Gap ($) | 34,337 | 65.48¢ per $1 |
| Gini / Inequality Index | 34,337 | 0.37 |
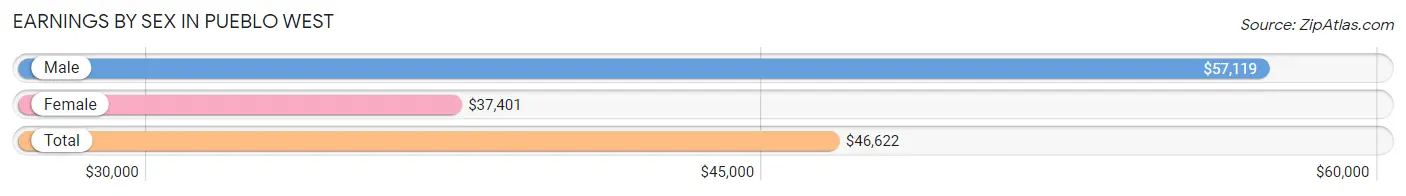
Earnings by Sex in Pueblo West
Average Earnings in Pueblo West are $46,622, $57,119 for men and $37,401 for women, a difference of 34.5%.
| Sex | Number | Average Earnings |
| Male | 9,239 (53.2%) | $57,119 |
| Female | 8,110 (46.8%) | $37,401 |
| Total | 17,349 (100.0%) | $46,622 |
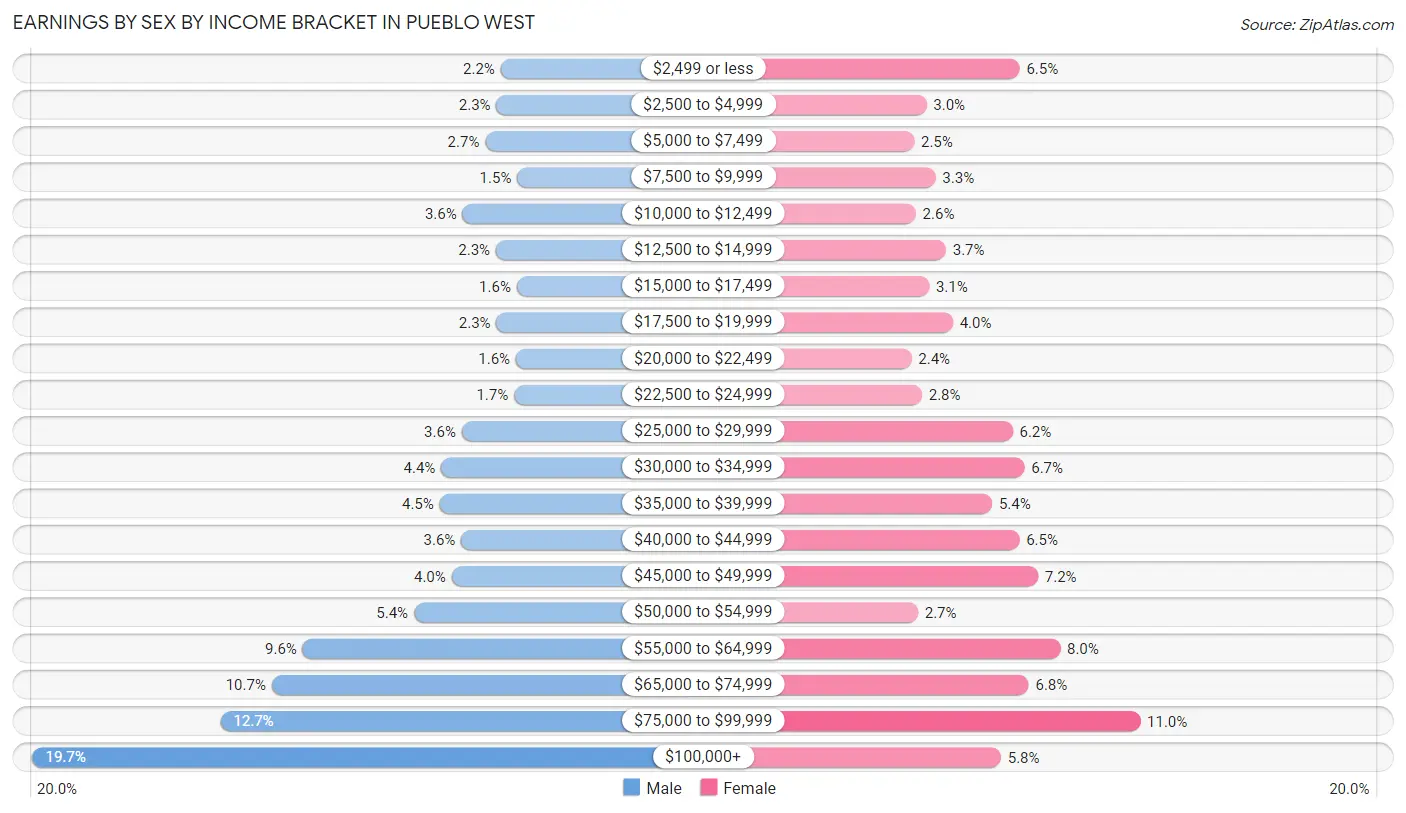
Earnings by Sex by Income Bracket in Pueblo West
The most common earnings brackets in Pueblo West are $100,000+ for men (1,820 | 19.7%) and $75,000 to $99,999 for women (891 | 11.0%).
| Income | Male | Female |
| $2,499 or less | 200 (2.2%) | 525 (6.5%) |
| $2,500 to $4,999 | 214 (2.3%) | 242 (3.0%) |
| $5,000 to $7,499 | 253 (2.7%) | 204 (2.5%) |
| $7,500 to $9,999 | 142 (1.5%) | 269 (3.3%) |
| $10,000 to $12,499 | 332 (3.6%) | 209 (2.6%) |
| $12,500 to $14,999 | 216 (2.3%) | 301 (3.7%) |
| $15,000 to $17,499 | 144 (1.6%) | 250 (3.1%) |
| $17,500 to $19,999 | 214 (2.3%) | 322 (4.0%) |
| $20,000 to $22,499 | 147 (1.6%) | 196 (2.4%) |
| $22,500 to $24,999 | 153 (1.7%) | 228 (2.8%) |
| $25,000 to $29,999 | 334 (3.6%) | 504 (6.2%) |
| $30,000 to $34,999 | 406 (4.4%) | 539 (6.7%) |
| $35,000 to $39,999 | 411 (4.4%) | 441 (5.4%) |
| $40,000 to $44,999 | 336 (3.6%) | 524 (6.5%) |
| $45,000 to $49,999 | 370 (4.0%) | 581 (7.2%) |
| $50,000 to $54,999 | 500 (5.4%) | 216 (2.7%) |
| $55,000 to $64,999 | 885 (9.6%) | 648 (8.0%) |
| $65,000 to $74,999 | 992 (10.7%) | 552 (6.8%) |
| $75,000 to $99,999 | 1,170 (12.7%) | 891 (11.0%) |
| $100,000+ | 1,820 (19.7%) | 468 (5.8%) |
| Total | 9,239 (100.0%) | 8,110 (100.0%) |
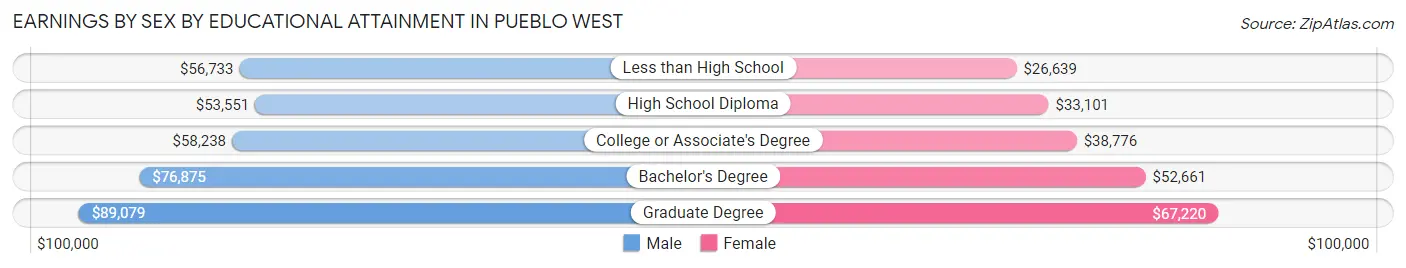
Earnings by Sex by Educational Attainment in Pueblo West
Average earnings in Pueblo West are $63,947 for men and $42,297 for women, a difference of 33.9%. Men with an educational attainment of graduate degree enjoy the highest average annual earnings of $89,079, while those with high school diploma education earn the least with $53,551. Women with an educational attainment of graduate degree earn the most with the average annual earnings of $67,220, while those with less than high school education have the smallest earnings of $26,639.
| Educational Attainment | Male Income | Female Income |
| Less than High School | $56,733 | $26,639 |
| High School Diploma | $53,551 | $33,101 |
| College or Associate's Degree | $58,238 | $38,776 |
| Bachelor's Degree | $76,875 | $52,661 |
| Graduate Degree | $89,079 | $67,220 |
| Total | $63,947 | $42,297 |
Family Income in Pueblo West
Family Income Brackets in Pueblo West
According to the Pueblo West family income data, there are 2,673 families falling into the $100,000 to $149,999 income range, which is the most common income bracket and makes up 28.3% of all families. Conversely, the $10,000 to $14,999 income bracket is the least frequent group with only 57 families (0.6%) belonging to this category.
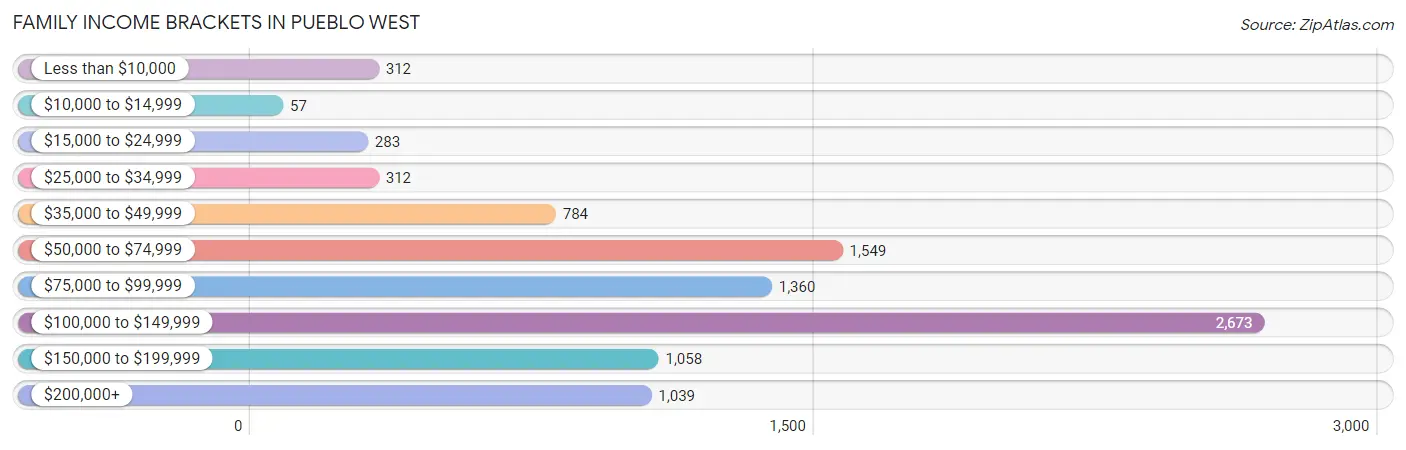
| Income Bracket | # Families | % Families |
| Less than $10,000 | 312 | 3.3% |
| $10,000 to $14,999 | 57 | 0.6% |
| $15,000 to $24,999 | 283 | 3.0% |
| $25,000 to $34,999 | 312 | 3.3% |
| $35,000 to $49,999 | 784 | 8.3% |
| $50,000 to $74,999 | 1,549 | 16.4% |
| $75,000 to $99,999 | 1,360 | 14.4% |
| $100,000 to $149,999 | 2,673 | 28.3% |
| $150,000 to $199,999 | 1,058 | 11.2% |
| $200,000+ | 1,039 | 11.0% |
Family Income by Famaliy Size in Pueblo West
6-person families (531 | 5.6%) account for the highest median family income in Pueblo West with $127,135 per family, while 2-person families (4,304 | 45.6%) have the highest median income of $42,113 per family member.
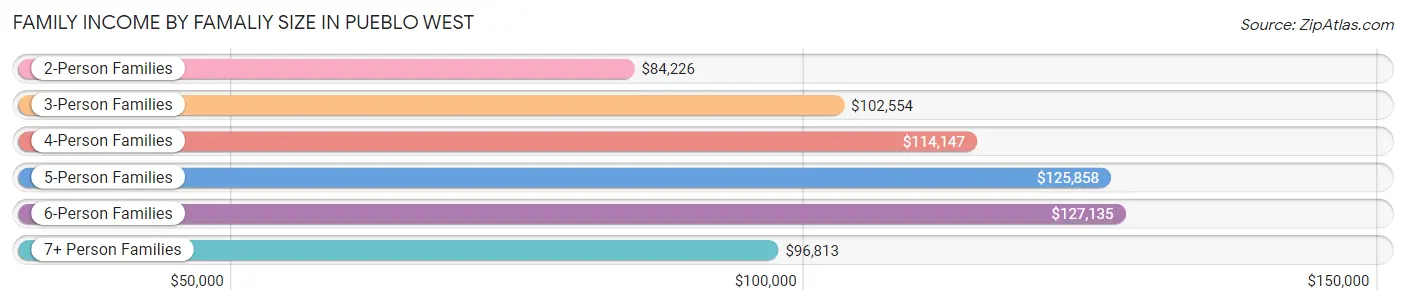
| Income Bracket | # Families | Median Income |
| 2-Person Families | 4,304 (45.6%) | $84,226 |
| 3-Person Families | 1,953 (20.7%) | $102,554 |
| 4-Person Families | 1,526 (16.2%) | $114,147 |
| 5-Person Families | 779 (8.3%) | $125,858 |
| 6-Person Families | 531 (5.6%) | $127,135 |
| 7+ Person Families | 351 (3.7%) | $96,813 |
| Total | 9,444 (100.0%) | $100,972 |
Family Income by Number of Earners in Pueblo West
The median family income in Pueblo West is $100,972, with families comprising 3+ earners (1,403) having the highest median family income of $148,884, while families with no earners (1,825) have the lowest median family income of $64,133, accounting for 14.9% and 19.3% of families, respectively.
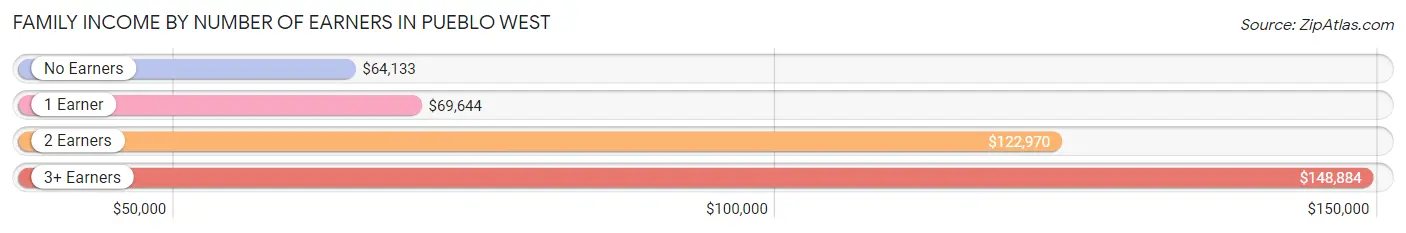
| Number of Earners | # Families | Median Income |
| No Earners | 1,825 (19.3%) | $64,133 |
| 1 Earner | 2,383 (25.2%) | $69,644 |
| 2 Earners | 3,833 (40.6%) | $122,970 |
| 3+ Earners | 1,403 (14.9%) | $148,884 |
| Total | 9,444 (100.0%) | $100,972 |
Household Income in Pueblo West
Household Income Brackets in Pueblo West
With 3,088 households falling in the category, the $100,000 to $149,999 income range is the most frequent in Pueblo West, accounting for 25.5% of all households. In contrast, only 194 households (1.6%) fall into the $10,000 to $14,999 income bracket, making it the least populous group.
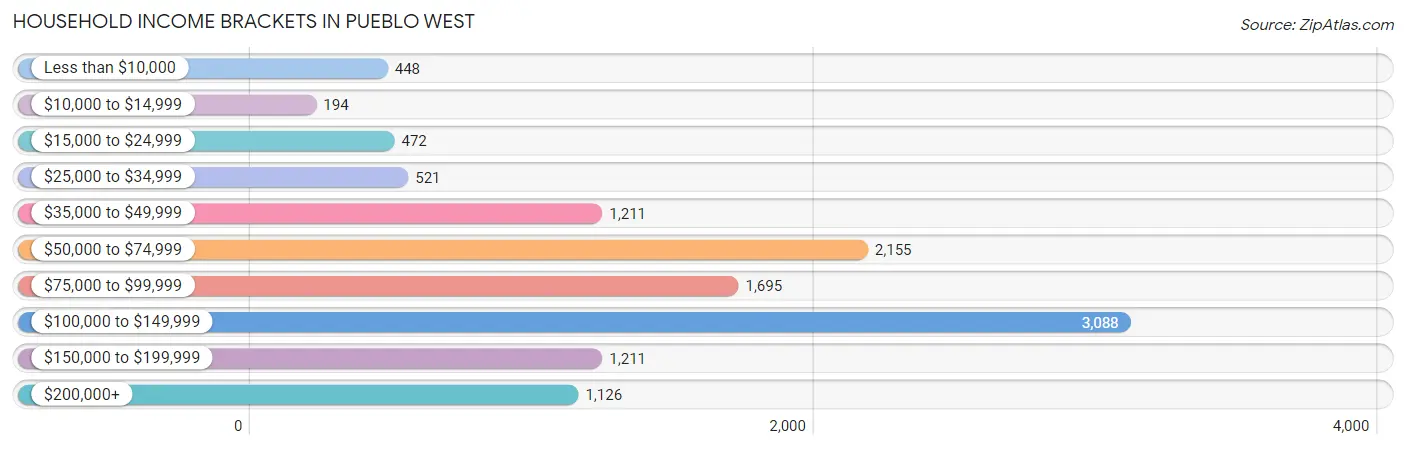
| Income Bracket | # Households | % Households |
| Less than $10,000 | 448 | 3.7% |
| $10,000 to $14,999 | 194 | 1.6% |
| $15,000 to $24,999 | 472 | 3.9% |
| $25,000 to $34,999 | 521 | 4.3% |
| $35,000 to $49,999 | 1,211 | 10.0% |
| $50,000 to $74,999 | 2,155 | 17.8% |
| $75,000 to $99,999 | 1,695 | 14.0% |
| $100,000 to $149,999 | 3,088 | 25.5% |
| $150,000 to $199,999 | 1,211 | 10.0% |
| $200,000+ | 1,126 | 9.3% |
Household Income by Householder Age in Pueblo West
The median household income in Pueblo West is $89,530, with the highest median household income of $109,969 found in the 45 to 64 years age bracket for the primary householder. A total of 5,117 households (42.3%) fall into this category. Meanwhile, the 15 to 24 years age bracket for the primary householder has the lowest median household income of $40,000, with 142 households (1.2%) in this group.
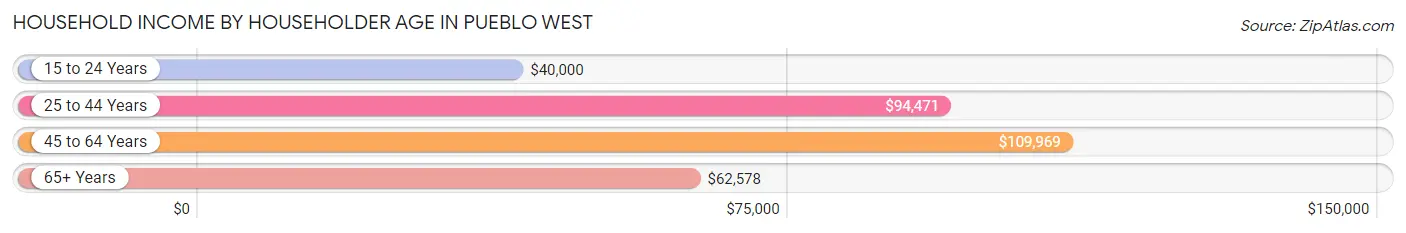
| Income Bracket | # Households | Median Income |
| 15 to 24 Years | 142 (1.2%) | $40,000 |
| 25 to 44 Years | 3,513 (29.0%) | $94,471 |
| 45 to 64 Years | 5,117 (42.3%) | $109,969 |
| 65+ Years | 3,336 (27.6%) | $62,578 |
| Total | 12,108 (100.0%) | $89,530 |
Poverty in Pueblo West
Income Below Poverty by Sex and Age in Pueblo West
With 5.3% poverty level for males and 8.8% for females among the residents of Pueblo West, 5 year old males and 16 and 17 year old females are the most vulnerable to poverty, with 64 males (20.1%) and 94 females (20.1%) in their respective age groups living below the poverty level.
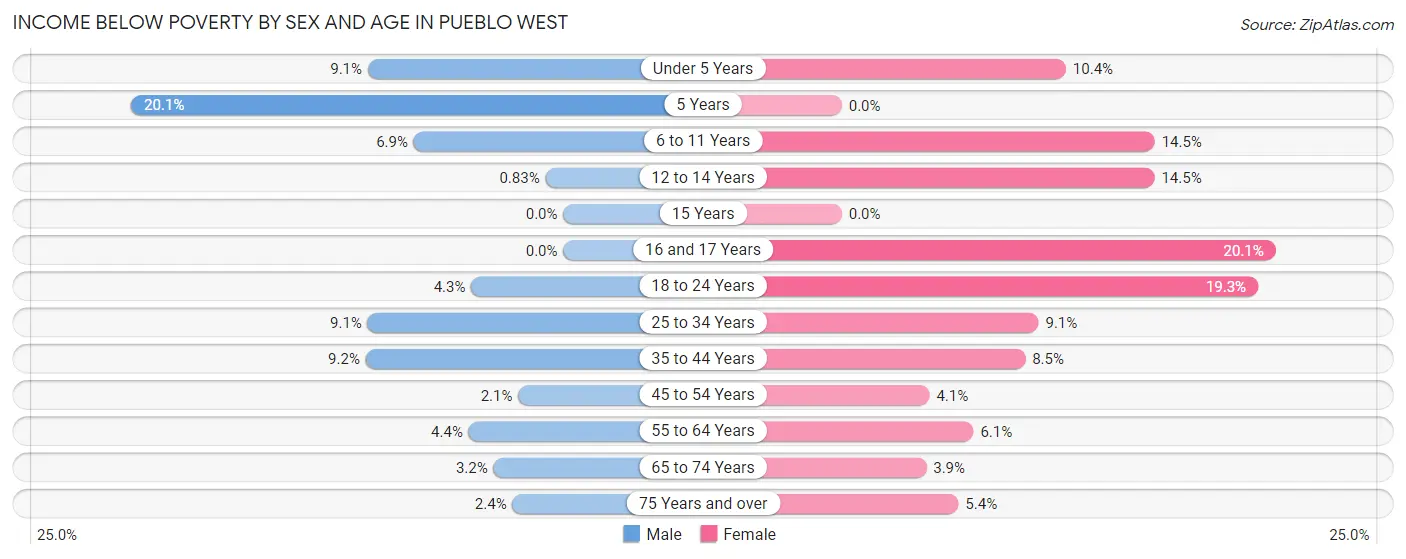
| Age Bracket | Male | Female |
| Under 5 Years | 66 (9.1%) | 75 (10.4%) |
| 5 Years | 64 (20.1%) | 0 (0.0%) |
| 6 to 11 Years | 107 (6.9%) | 262 (14.5%) |
| 12 to 14 Years | 6 (0.8%) | 109 (14.5%) |
| 15 Years | 0 (0.0%) | 0 (0.0%) |
| 16 and 17 Years | 0 (0.0%) | 94 (20.1%) |
| 18 to 24 Years | 54 (4.3%) | 241 (19.3%) |
| 25 to 34 Years | 183 (9.1%) | 193 (9.1%) |
| 35 to 44 Years | 190 (9.2%) | 189 (8.5%) |
| 45 to 54 Years | 55 (2.1%) | 101 (4.1%) |
| 55 to 64 Years | 91 (4.4%) | 133 (6.1%) |
| 65 to 74 Years | 60 (3.2%) | 75 (3.9%) |
| 75 Years and over | 24 (2.4%) | 55 (5.4%) |
| Total | 900 (5.3%) | 1,527 (8.8%) |
Income Above Poverty by Sex and Age in Pueblo West
According to the poverty statistics in Pueblo West, males aged 15 years and females aged 5 years are the age groups that are most secure financially, with 100.0% of males and 100.0% of females in these age groups living above the poverty line.
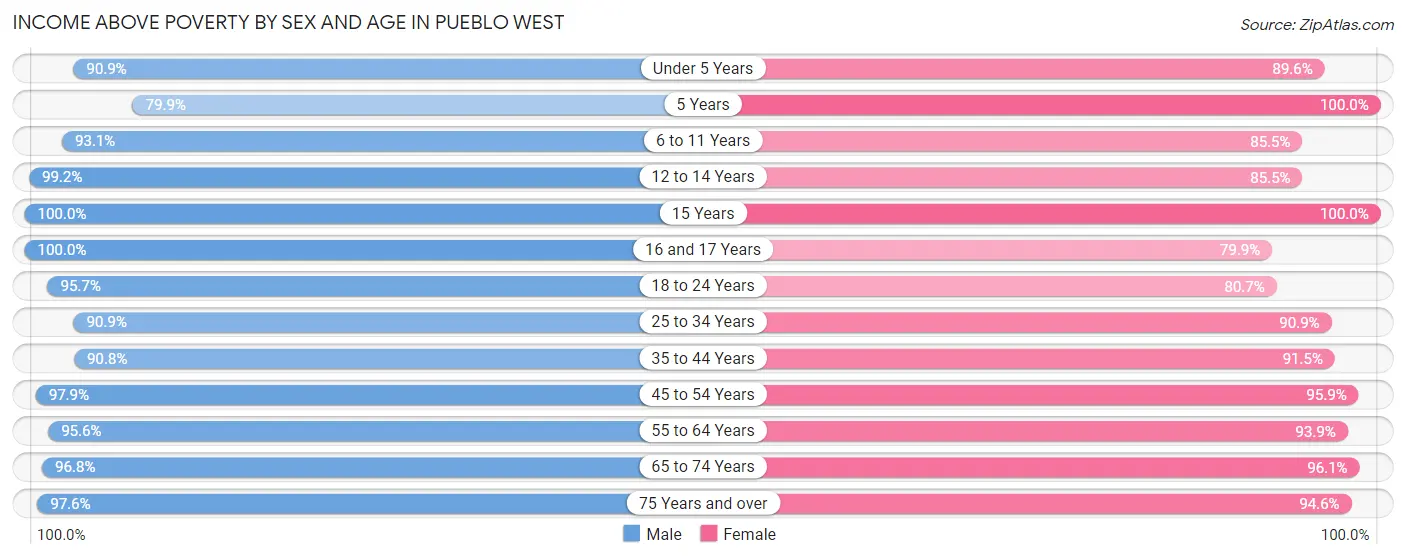
| Age Bracket | Male | Female |
| Under 5 Years | 662 (90.9%) | 646 (89.6%) |
| 5 Years | 255 (79.9%) | 119 (100.0%) |
| 6 to 11 Years | 1,434 (93.1%) | 1,542 (85.5%) |
| 12 to 14 Years | 713 (99.2%) | 642 (85.5%) |
| 15 Years | 125 (100.0%) | 253 (100.0%) |
| 16 and 17 Years | 627 (100.0%) | 373 (79.9%) |
| 18 to 24 Years | 1,211 (95.7%) | 1,007 (80.7%) |
| 25 to 34 Years | 1,833 (90.9%) | 1,922 (90.9%) |
| 35 to 44 Years | 1,882 (90.8%) | 2,031 (91.5%) |
| 45 to 54 Years | 2,576 (97.9%) | 2,380 (95.9%) |
| 55 to 64 Years | 1,983 (95.6%) | 2,043 (93.9%) |
| 65 to 74 Years | 1,794 (96.8%) | 1,838 (96.1%) |
| 75 Years and over | 995 (97.6%) | 961 (94.6%) |
| Total | 16,090 (94.7%) | 15,757 (91.2%) |
Income Below Poverty Among Married-Couple Families in Pueblo West
The poverty statistics for married-couple families in Pueblo West show that 2.2% or 170 of the total 7,604 families live below the poverty line. Families with 1 or 2 children have the highest poverty rate of 3.1%, comprising of 69 families. On the other hand, families with 5 or more children have the lowest poverty rate of 0.0%, which includes 0 families.
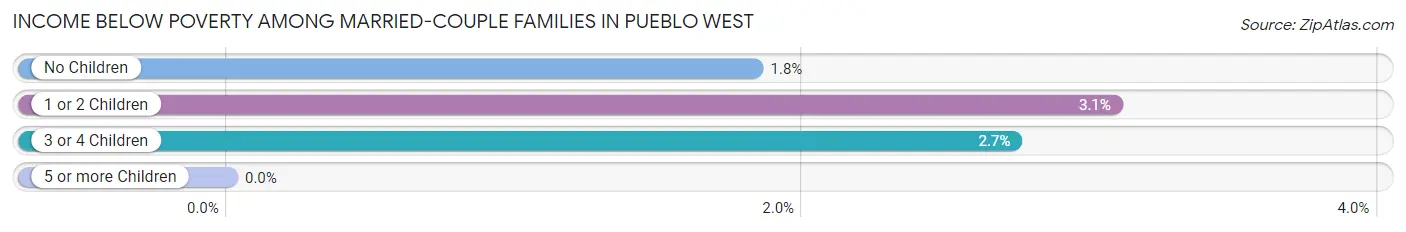
| Children | Above Poverty | Below Poverty |
| No Children | 4,405 (98.2%) | 82 (1.8%) |
| 1 or 2 Children | 2,170 (96.9%) | 69 (3.1%) |
| 3 or 4 Children | 676 (97.3%) | 19 (2.7%) |
| 5 or more Children | 183 (100.0%) | 0 (0.0%) |
| Total | 7,434 (97.8%) | 170 (2.2%) |
Income Below Poverty Among Single-Parent Households in Pueblo West
According to the poverty data in Pueblo West, 15.0% or 106 single-father households and 24.6% or 278 single-mother households are living below the poverty line. Among single-father households, those with 1 or 2 children have the highest poverty rate, with 106 households (24.9%) experiencing poverty. Likewise, among single-mother households, those with 3 or 4 children have the highest poverty rate, with 55 households (47.0%) falling below the poverty line.
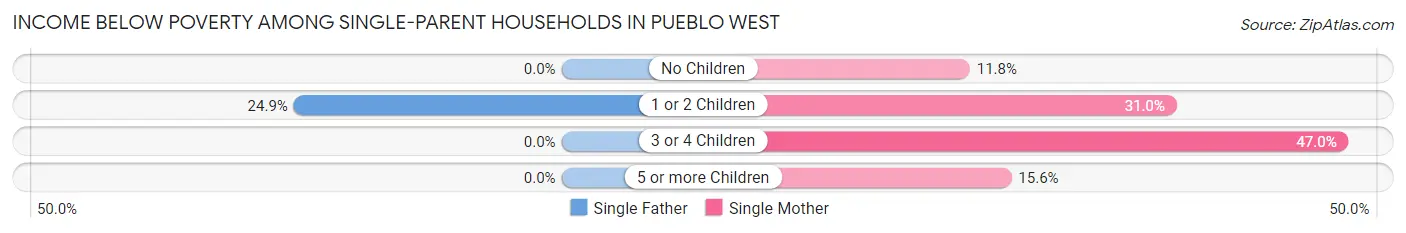
| Children | Single Father | Single Mother |
| No Children | 0 (0.0%) | 53 (11.7%) |
| 1 or 2 Children | 106 (24.9%) | 165 (31.0%) |
| 3 or 4 Children | 0 (0.0%) | 55 (47.0%) |
| 5 or more Children | 0 (0.0%) | 5 (15.6%) |
| Total | 106 (15.0%) | 278 (24.6%) |
Income Below Poverty Among Married-Couple vs Single-Parent Households in Pueblo West
The poverty data for Pueblo West shows that 170 of the married-couple family households (2.2%) and 384 of the single-parent households (20.9%) are living below the poverty level. Within the married-couple family households, those with 1 or 2 children have the highest poverty rate, with 69 households (3.1%) falling below the poverty line. Among the single-parent households, those with 3 or 4 children have the highest poverty rate, with 55 household (47.0%) living below poverty.
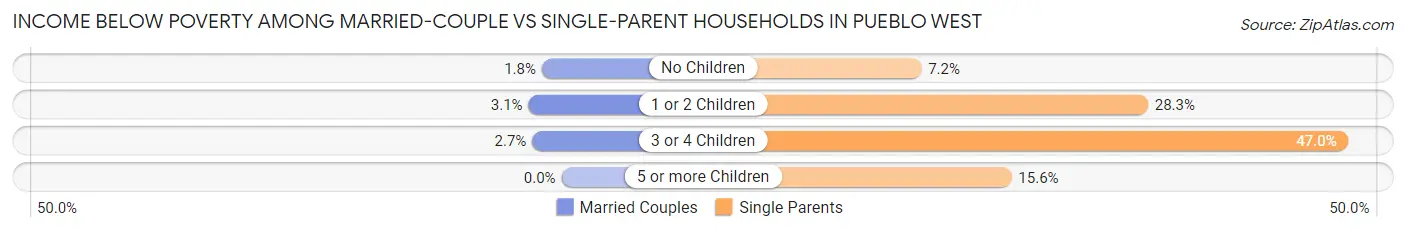
| Children | Married-Couple Families | Single-Parent Households |
| No Children | 82 (1.8%) | 53 (7.2%) |
| 1 or 2 Children | 69 (3.1%) | 271 (28.3%) |
| 3 or 4 Children | 19 (2.7%) | 55 (47.0%) |
| 5 or more Children | 0 (0.0%) | 5 (15.6%) |
| Total | 170 (2.2%) | 384 (20.9%) |
Race in Pueblo West
The most populous races in Pueblo West are White / Caucasian (28,945 | 84.3%), Hispanic or Latino (10,912 | 31.8%), and Two or more Races (3,111 | 9.1%).
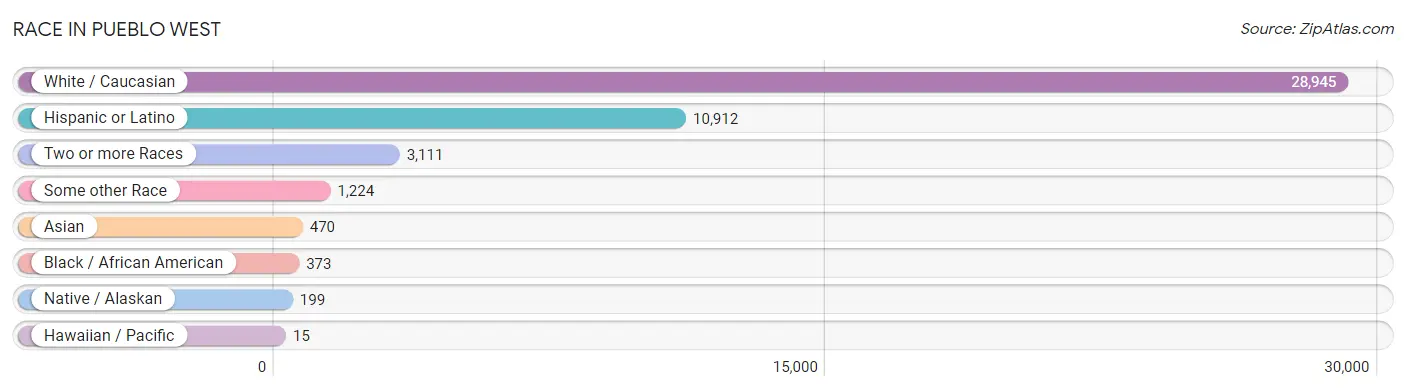
| Race | # Population | % Population |
| Asian | 470 | 1.4% |
| Black / African American | 373 | 1.1% |
| Hawaiian / Pacific | 15 | 0.0% |
| Hispanic or Latino | 10,912 | 31.8% |
| Native / Alaskan | 199 | 0.6% |
| White / Caucasian | 28,945 | 84.3% |
| Two or more Races | 3,111 | 9.1% |
| Some other Race | 1,224 | 3.6% |
| Total | 34,337 | 100.0% |
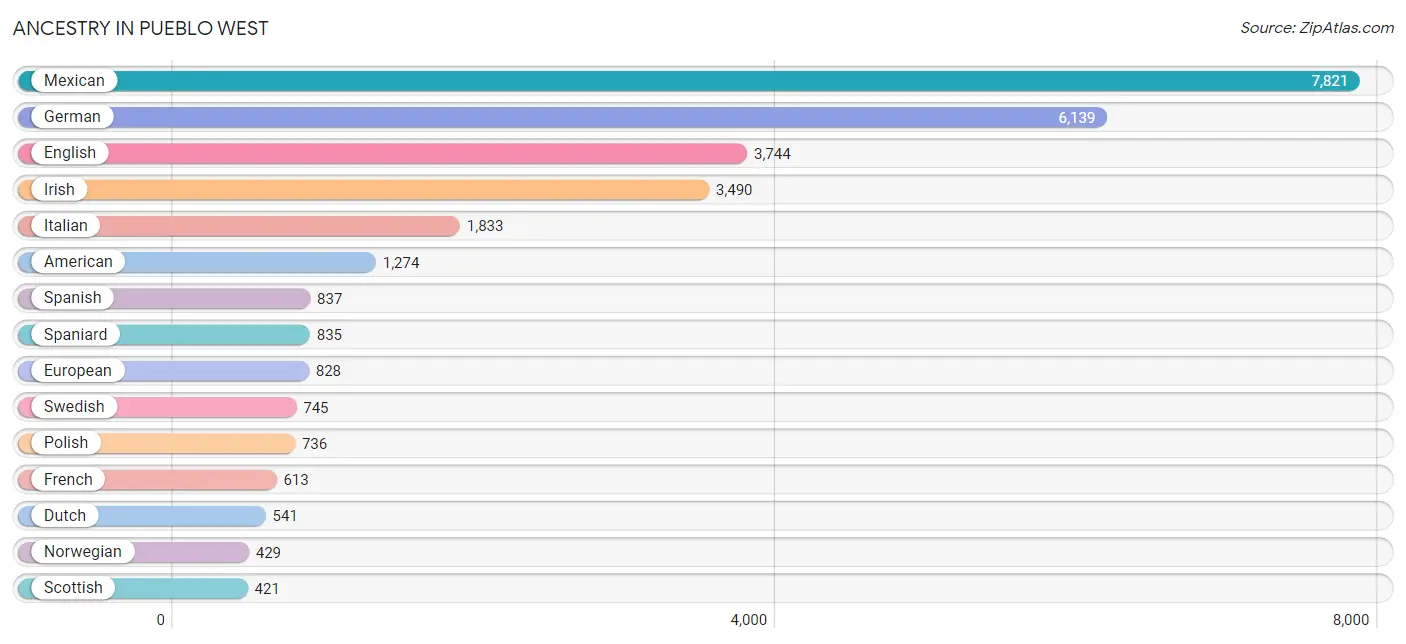
Ancestry in Pueblo West
The most populous ancestries reported in Pueblo West are Mexican (7,821 | 22.8%), German (6,139 | 17.9%), English (3,744 | 10.9%), Irish (3,490 | 10.2%), and Italian (1,833 | 5.3%), together accounting for 67.1% of all Pueblo West residents.
| Ancestry | # Population | % Population |
| Albanian | 5 | 0.0% |
| American | 1,274 | 3.7% |
| Apache | 53 | 0.2% |
| Arab | 16 | 0.1% |
| Argentinean | 19 | 0.1% |
| Armenian | 6 | 0.0% |
| Austrian | 77 | 0.2% |
| Bhutanese | 161 | 0.5% |
| Blackfeet | 1 | 0.0% |
| Bolivian | 7 | 0.0% |
| Brazilian | 11 | 0.0% |
| British | 134 | 0.4% |
| Burmese | 66 | 0.2% |
| Canadian | 33 | 0.1% |
| Celtic | 17 | 0.1% |
| Central American | 176 | 0.5% |
| Cherokee | 78 | 0.2% |
| Chilean | 13 | 0.0% |
| Choctaw | 74 | 0.2% |
| Costa Rican | 128 | 0.4% |
| Creek | 8 | 0.0% |
| Croatian | 31 | 0.1% |
| Cuban | 95 | 0.3% |
| Czech | 159 | 0.5% |
| Czechoslovakian | 29 | 0.1% |
| Danish | 279 | 0.8% |
| Dutch | 541 | 1.6% |
| Eastern European | 168 | 0.5% |
| English | 3,744 | 10.9% |
| European | 828 | 2.4% |
| French | 613 | 1.8% |
| French Canadian | 101 | 0.3% |
| German | 6,139 | 17.9% |
| Greek | 64 | 0.2% |
| Hungarian | 124 | 0.4% |
| Indian (Asian) | 38 | 0.1% |
| Irish | 3,490 | 10.2% |
| Iroquois | 6 | 0.0% |
| Italian | 1,833 | 5.3% |
| Korean | 239 | 0.7% |
| Laotian | 82 | 0.2% |
| Lebanese | 13 | 0.0% |
| Lithuanian | 47 | 0.1% |
| Mexican | 7,821 | 22.8% |
| Mexican American Indian | 70 | 0.2% |
| Native Hawaiian | 1 | 0.0% |
| Navajo | 69 | 0.2% |
| Northern European | 87 | 0.3% |
| Norwegian | 429 | 1.3% |
| Okinawan | 36 | 0.1% |
| Pakistani | 36 | 0.1% |
| Panamanian | 30 | 0.1% |
| Peruvian | 14 | 0.0% |
| Polish | 736 | 2.1% |
| Portuguese | 32 | 0.1% |
| Pueblo | 24 | 0.1% |
| Puerto Rican | 147 | 0.4% |
| Romanian | 6 | 0.0% |
| Russian | 31 | 0.1% |
| Salvadoran | 18 | 0.1% |
| Samoan | 48 | 0.1% |
| Scandinavian | 104 | 0.3% |
| Scotch-Irish | 259 | 0.7% |
| Scottish | 421 | 1.2% |
| Serbian | 8 | 0.0% |
| Sioux | 53 | 0.2% |
| Slavic | 94 | 0.3% |
| Slovak | 233 | 0.7% |
| Slovene | 114 | 0.3% |
| South American | 69 | 0.2% |
| Spaniard | 835 | 2.4% |
| Spanish | 837 | 2.4% |
| Spanish American | 272 | 0.8% |
| Spanish American Indian | 27 | 0.1% |
| Sri Lankan | 21 | 0.1% |
| Swedish | 745 | 2.2% |
| Swiss | 40 | 0.1% |
| Thai | 170 | 0.5% |
| Venezuelan | 16 | 0.1% |
| Welsh | 149 | 0.4% |
| Yugoslavian | 55 | 0.2% | View All 81 Rows |
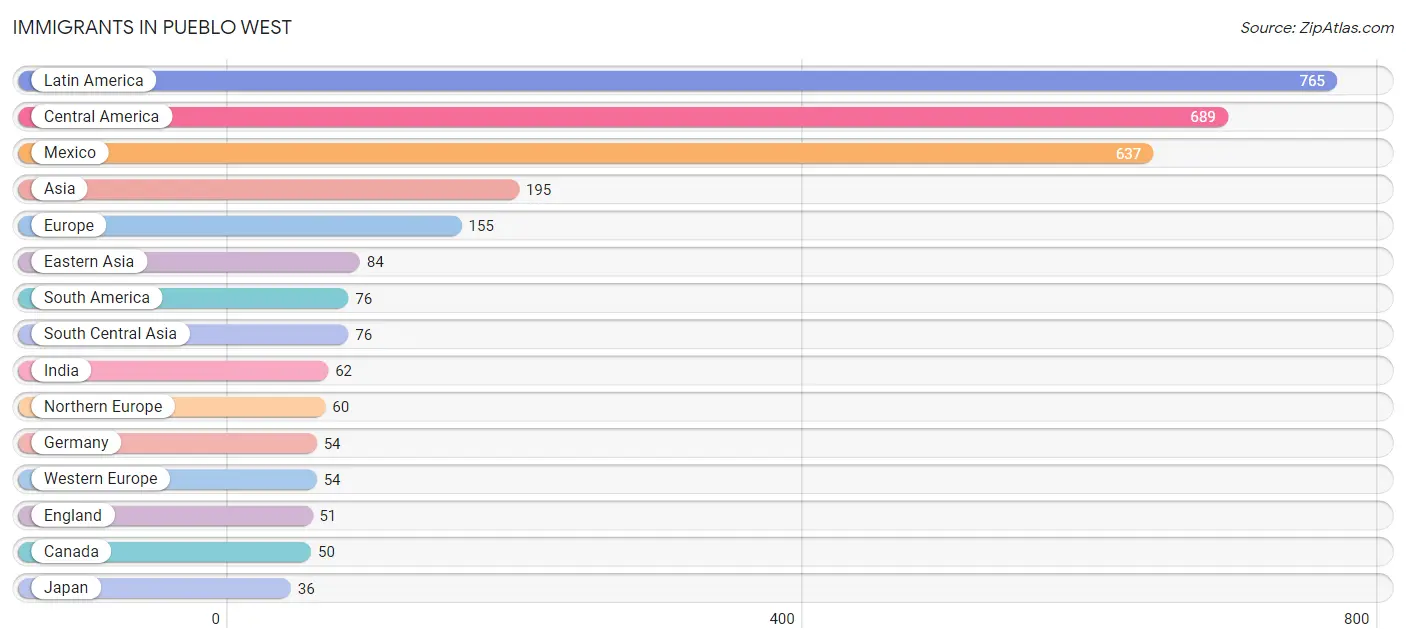
Immigrants in Pueblo West
The most numerous immigrant groups reported in Pueblo West came from Latin America (765 | 2.2%), Central America (689 | 2.0%), Mexico (637 | 1.9%), Asia (195 | 0.6%), and Europe (155 | 0.4%), together accounting for 7.1% of all Pueblo West residents.
| Immigration Origin | # Population | % Population |
| Albania | 5 | 0.0% |
| Argentina | 8 | 0.0% |
| Asia | 195 | 0.6% |
| Bolivia | 7 | 0.0% |
| Canada | 50 | 0.2% |
| Central America | 689 | 2.0% |
| Chile | 13 | 0.0% |
| China | 26 | 0.1% |
| Colombia | 32 | 0.1% |
| Costa Rica | 22 | 0.1% |
| Denmark | 4 | 0.0% |
| Eastern Asia | 84 | 0.2% |
| Eastern Europe | 25 | 0.1% |
| England | 51 | 0.2% |
| Europe | 155 | 0.4% |
| Germany | 54 | 0.2% |
| India | 62 | 0.2% |
| Italy | 16 | 0.1% |
| Japan | 36 | 0.1% |
| Korea | 22 | 0.1% |
| Latin America | 765 | 2.2% |
| Mexico | 637 | 1.9% |
| Northern Europe | 60 | 0.2% |
| Oceania | 15 | 0.0% |
| Pakistan | 9 | 0.0% |
| Panama | 30 | 0.1% |
| Philippines | 31 | 0.1% |
| Poland | 12 | 0.0% |
| Romania | 8 | 0.0% |
| Scotland | 5 | 0.0% |
| South America | 76 | 0.2% |
| South Central Asia | 76 | 0.2% |
| South Eastern Asia | 31 | 0.1% |
| Southern Europe | 16 | 0.1% |
| Venezuela | 16 | 0.1% |
| Western Asia | 4 | 0.0% |
| Western Europe | 54 | 0.2% | View All 37 Rows |
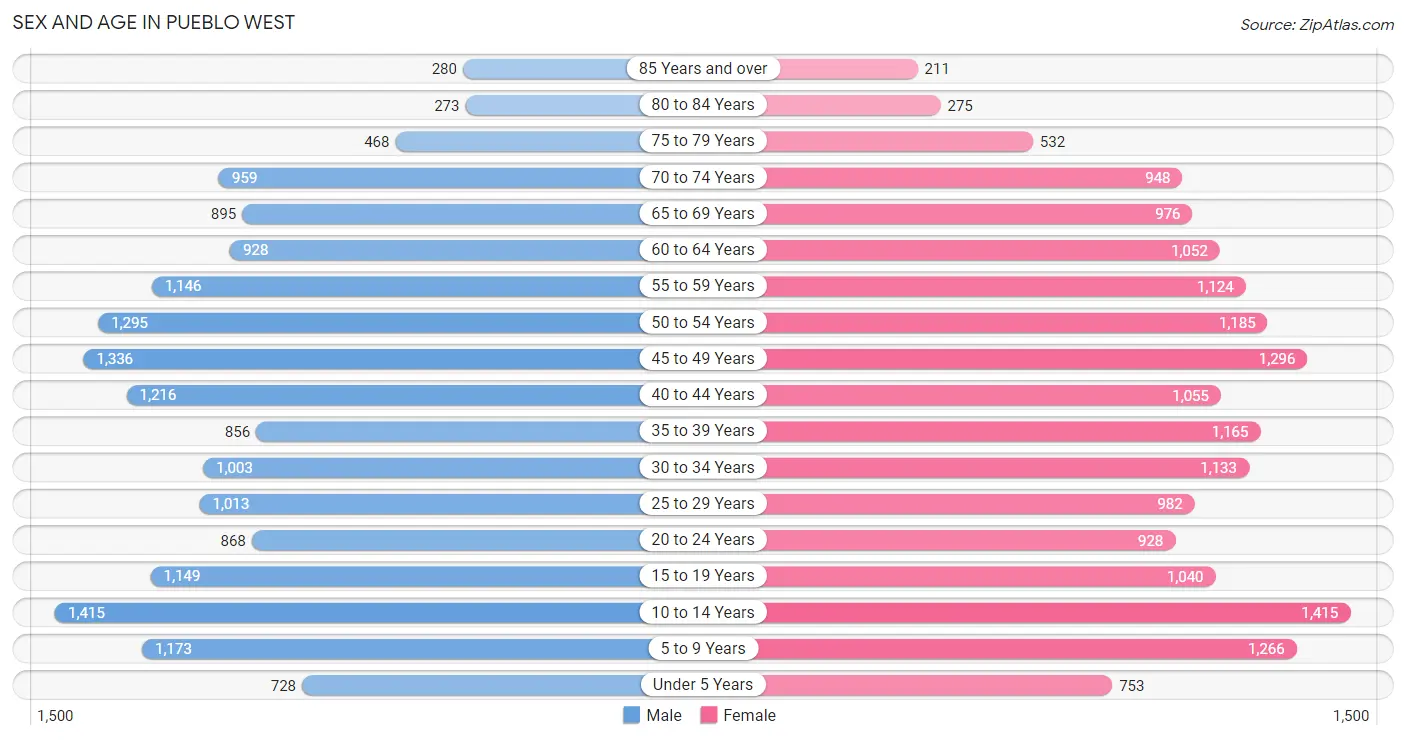
Sex and Age in Pueblo West
Sex and Age in Pueblo West
The most populous age groups in Pueblo West are 10 to 14 Years (1,415 | 8.3%) for men and 10 to 14 Years (1,415 | 8.2%) for women.
| Age Bracket | Male | Female |
| Under 5 Years | 728 (4.3%) | 753 (4.3%) |
| 5 to 9 Years | 1,173 (6.9%) | 1,266 (7.3%) |
| 10 to 14 Years | 1,415 (8.3%) | 1,415 (8.2%) |
| 15 to 19 Years | 1,149 (6.8%) | 1,040 (6.0%) |
| 20 to 24 Years | 868 (5.1%) | 928 (5.3%) |
| 25 to 29 Years | 1,013 (6.0%) | 982 (5.7%) |
| 30 to 34 Years | 1,003 (5.9%) | 1,133 (6.5%) |
| 35 to 39 Years | 856 (5.0%) | 1,165 (6.7%) |
| 40 to 44 Years | 1,216 (7.1%) | 1,055 (6.1%) |
| 45 to 49 Years | 1,336 (7.9%) | 1,296 (7.5%) |
| 50 to 54 Years | 1,295 (7.6%) | 1,185 (6.8%) |
| 55 to 59 Years | 1,146 (6.7%) | 1,124 (6.5%) |
| 60 to 64 Years | 928 (5.5%) | 1,052 (6.1%) |
| 65 to 69 Years | 895 (5.3%) | 976 (5.6%) |
| 70 to 74 Years | 959 (5.6%) | 948 (5.5%) |
| 75 to 79 Years | 468 (2.8%) | 532 (3.1%) |
| 80 to 84 Years | 273 (1.6%) | 275 (1.6%) |
| 85 Years and over | 280 (1.7%) | 211 (1.2%) |
| Total | 17,001 (100.0%) | 17,336 (100.0%) |
Families and Households in Pueblo West
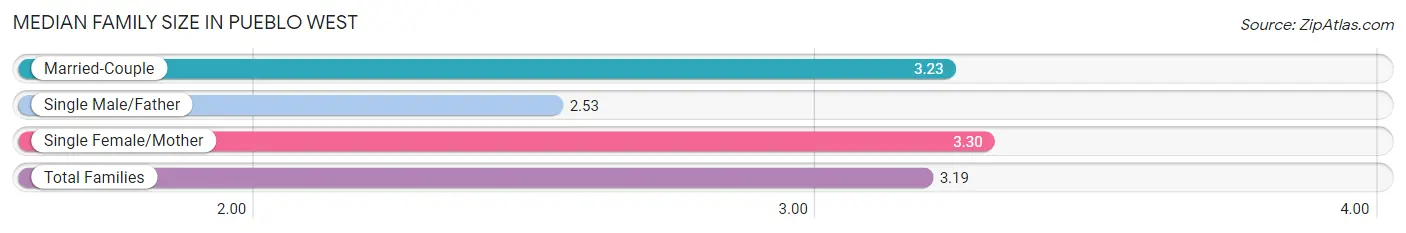
Median Family Size in Pueblo West
The median family size in Pueblo West is 3.19 persons per family, with single female/mother families (1,132 | 12.0%) accounting for the largest median family size of 3.3 persons per family. On the other hand, single male/father families (708 | 7.5%) represent the smallest median family size with 2.53 persons per family.
| Family Type | # Families | Family Size |
| Married-Couple | 7,604 (80.5%) | 3.23 |
| Single Male/Father | 708 (7.5%) | 2.53 |
| Single Female/Mother | 1,132 (12.0%) | 3.30 |
| Total Families | 9,444 (100.0%) | 3.19 |
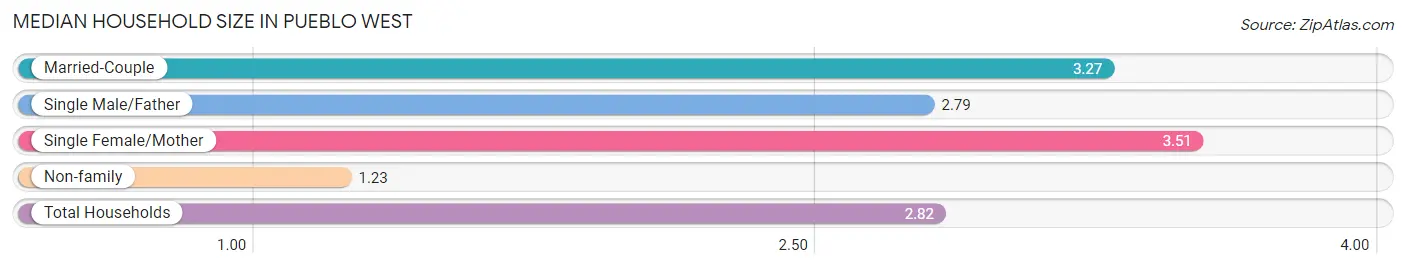
Median Household Size in Pueblo West
The median household size in Pueblo West is 2.82 persons per household, with single female/mother households (1,132 | 9.3%) accounting for the largest median household size of 3.51 persons per household. non-family households (2,664 | 22.0%) represent the smallest median household size with 1.23 persons per household.
| Household Type | # Households | Household Size |
| Married-Couple | 7,604 (62.8%) | 3.27 |
| Single Male/Father | 708 (5.9%) | 2.79 |
| Single Female/Mother | 1,132 (9.3%) | 3.51 |
| Non-family | 2,664 (22.0%) | 1.23 |
| Total Households | 12,108 (100.0%) | 2.82 |
Household Size by Marriage Status in Pueblo West
Out of a total of 12,108 households in Pueblo West, 9,444 (78.0%) are family households, while 2,664 (22.0%) are nonfamily households. The most numerous type of family households are 2-person households, comprising 4,041, and the most common type of nonfamily households are 1-person households, comprising 2,130.
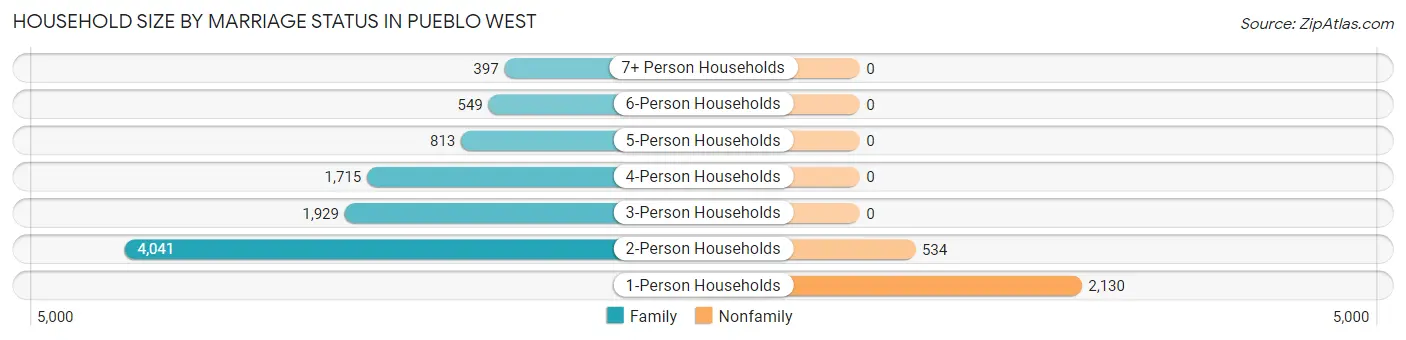
| Household Size | Family Households | Nonfamily Households |
| 1-Person Households | - | 2,130 (17.6%) |
| 2-Person Households | 4,041 (33.4%) | 534 (4.4%) |
| 3-Person Households | 1,929 (15.9%) | 0 (0.0%) |
| 4-Person Households | 1,715 (14.2%) | 0 (0.0%) |
| 5-Person Households | 813 (6.7%) | 0 (0.0%) |
| 6-Person Households | 549 (4.5%) | 0 (0.0%) |
| 7+ Person Households | 397 (3.3%) | 0 (0.0%) |
| Total | 9,444 (78.0%) | 2,664 (22.0%) |
Female Fertility in Pueblo West
Fertility by Age in Pueblo West
Average fertility rate in Pueblo West is 44.0 births per 1,000 women. Women in the age bracket of 20 to 34 years have the highest fertility rate with 73.0 births per 1,000 women. Women in the age bracket of 20 to 34 years acount for 64.6% of all women with births.
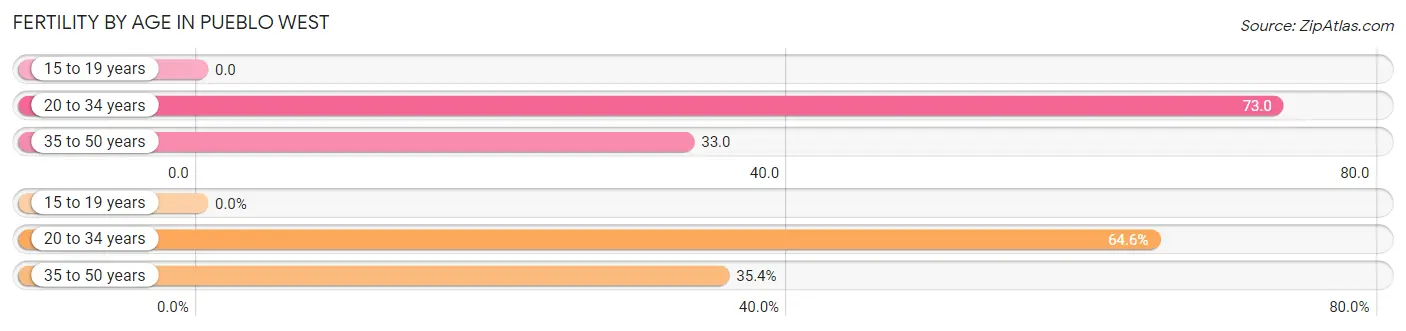
| Age Bracket | Women with Births | Births / 1,000 Women |
| 15 to 19 years | 0 (0.0%) | 0.0 |
| 20 to 34 years | 221 (64.6%) | 73.0 |
| 35 to 50 years | 121 (35.4%) | 33.0 |
| Total | 342 (100.0%) | 44.0 |
Fertility by Age by Marriage Status in Pueblo West
76.3% of women with births (342) in Pueblo West are married. The highest percentage of unmarried women with births falls into 20 to 34 years age bracket with 24.9% of them unmarried at the time of birth, while the lowest percentage of unmarried women with births belong to 35 to 50 years age bracket with 21.5% of them unmarried.
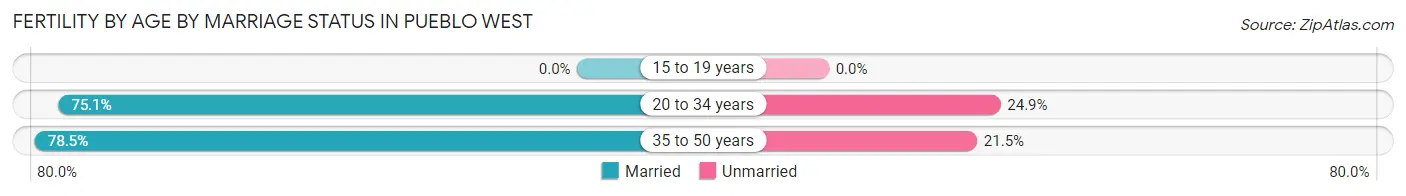
| Age Bracket | Married | Unmarried |
| 15 to 19 years | 0 (0.0%) | 0 (0.0%) |
| 20 to 34 years | 166 (75.1%) | 55 (24.9%) |
| 35 to 50 years | 95 (78.5%) | 26 (21.5%) |
| Total | 261 (76.3%) | 81 (23.7%) |
Fertility by Education in Pueblo West
Average fertility rate in Pueblo West is 44.0 births per 1,000 women. Women with the education attainment of graduate degree have the highest fertility rate of 105.0 births per 1,000 women, while women with the education attainment of high school diploma have the lowest fertility at 19.0 births per 1,000 women. Women with the education attainment of bachelor's degree represent 39.5% of all women with births.
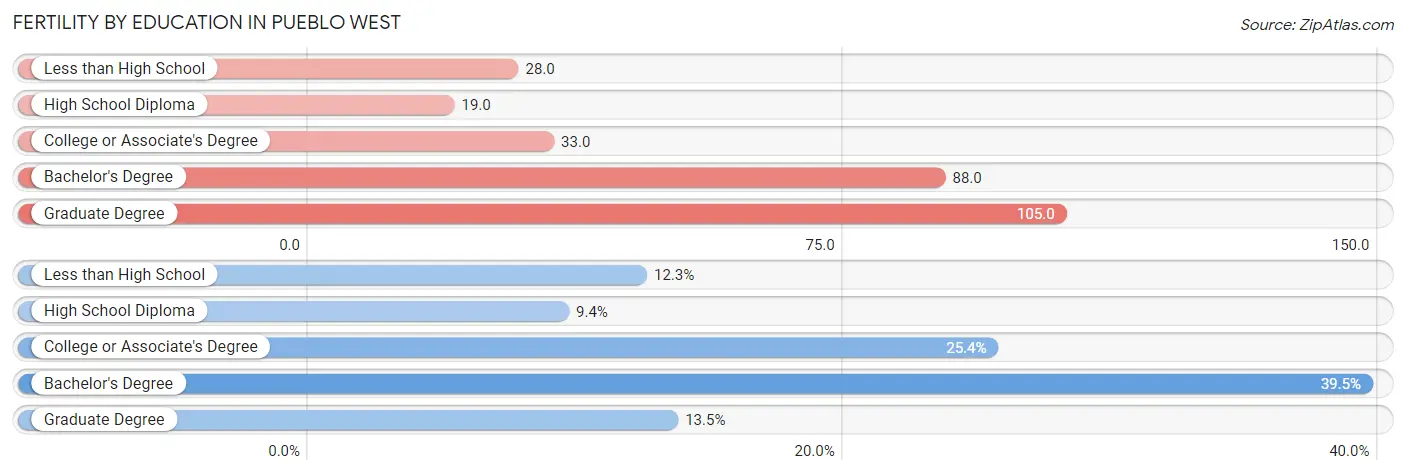
| Educational Attainment | Women with Births | Births / 1,000 Women |
| Less than High School | 42 (12.3%) | 28.0 |
| High School Diploma | 32 (9.4%) | 19.0 |
| College or Associate's Degree | 87 (25.4%) | 33.0 |
| Bachelor's Degree | 135 (39.5%) | 88.0 |
| Graduate Degree | 46 (13.5%) | 105.0 |
| Total | 342 (100.0%) | 44.0 |
Fertility by Education by Marriage Status in Pueblo West
23.7% of women with births in Pueblo West are unmarried. Women with the educational attainment of less than high school are most likely to be married with 100.0% of them married at childbirth, while women with the educational attainment of college or associate's degree are least likely to be married with 51.7% of them unmarried at childbirth.
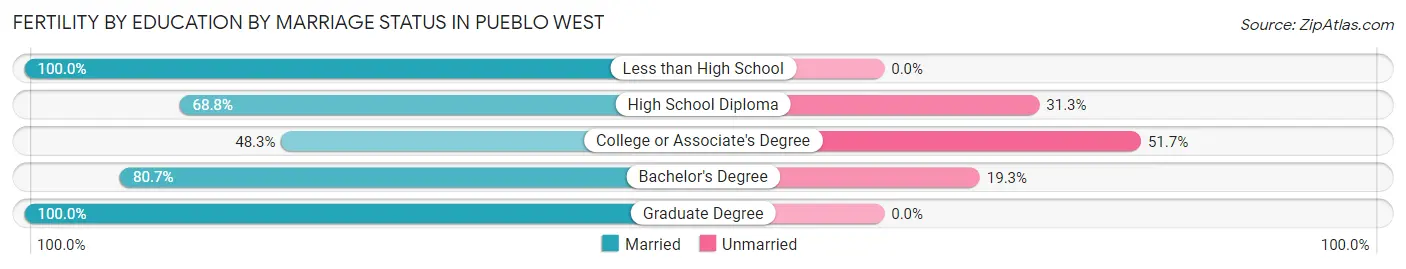
| Educational Attainment | Married | Unmarried |
| Less than High School | 42 (100.0%) | 0 (0.0%) |
| High School Diploma | 22 (68.8%) | 10 (31.2%) |
| College or Associate's Degree | 42 (48.3%) | 45 (51.7%) |
| Bachelor's Degree | 109 (80.7%) | 26 (19.3%) |
| Graduate Degree | 46 (100.0%) | 0 (0.0%) |
| Total | 261 (76.3%) | 81 (23.7%) |
Employment Characteristics in Pueblo West
Employment by Class of Employer in Pueblo West
Among the 15,683 employed individuals in Pueblo West, private company employees (10,038 | 64.0%), state government employees (1,496 | 9.5%), and local government employees (1,108 | 7.1%) make up the most common classes of employment.
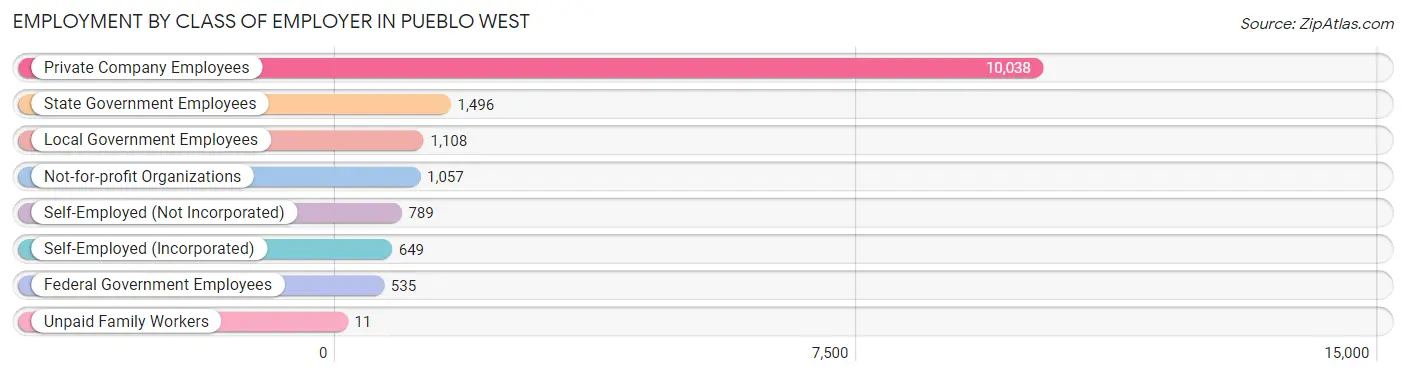
| Employer Class | # Employees | % Employees |
| Private Company Employees | 10,038 | 64.0% |
| Self-Employed (Incorporated) | 649 | 4.1% |
| Self-Employed (Not Incorporated) | 789 | 5.0% |
| Not-for-profit Organizations | 1,057 | 6.7% |
| Local Government Employees | 1,108 | 7.1% |
| State Government Employees | 1,496 | 9.5% |
| Federal Government Employees | 535 | 3.4% |
| Unpaid Family Workers | 11 | 0.1% |
| Total | 15,683 | 100.0% |
Employment Status by Age in Pueblo West
According to the labor force statistics for Pueblo West, out of the total population over 16 years of age (27,209), 61.2% or 16,652 individuals are in the labor force, with 4.4% or 733 of them unemployed. The age group with the highest labor force participation rate is 25 to 29 years, with 86.8% or 1,732 individuals in the labor force. Within the labor force, the 75 years and over age range has the highest percentage of unemployed individuals, with 22.2% or 18 of them being unemployed.
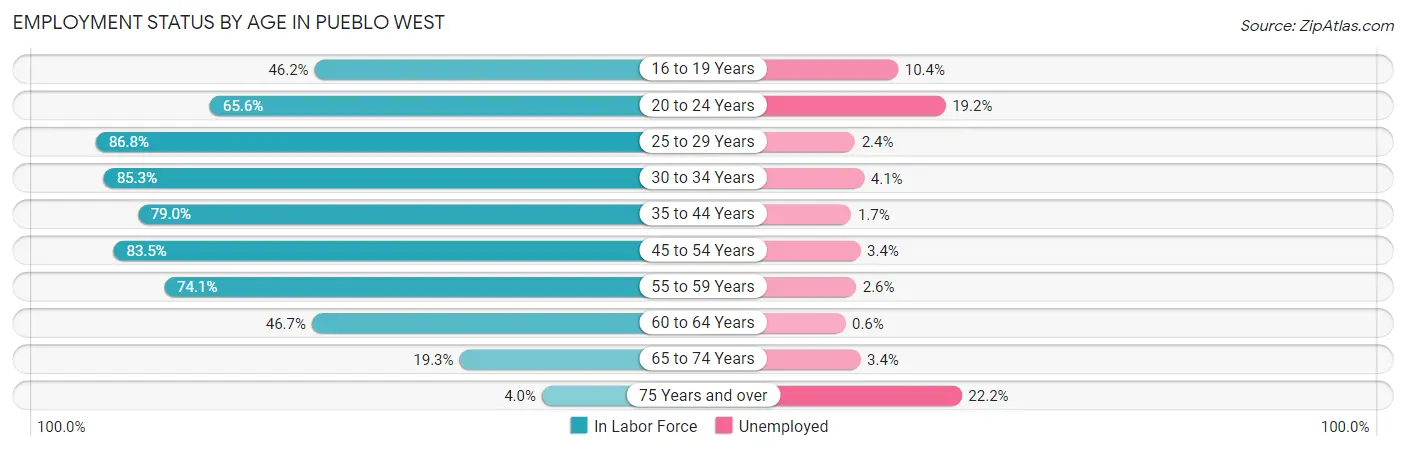
| Age Bracket | In Labor Force | Unemployed |
| 16 to 19 Years | 837 (46.2%) | 87 (10.4%) |
| 20 to 24 Years | 1,178 (65.6%) | 226 (19.2%) |
| 25 to 29 Years | 1,732 (86.8%) | 42 (2.4%) |
| 30 to 34 Years | 1,822 (85.3%) | 75 (4.1%) |
| 35 to 44 Years | 3,391 (79.0%) | 58 (1.7%) |
| 45 to 54 Years | 4,269 (83.5%) | 145 (3.4%) |
| 55 to 59 Years | 1,682 (74.1%) | 44 (2.6%) |
| 60 to 64 Years | 925 (46.7%) | 6 (0.6%) |
| 65 to 74 Years | 729 (19.3%) | 25 (3.4%) |
| 75 Years and over | 82 (4.0%) | 18 (22.2%) |
| Total | 16,652 (61.2%) | 733 (4.4%) |
Employment Status by Educational Attainment in Pueblo West
According to labor force statistics for Pueblo West, 77.7% of individuals (13,819) out of the total population between 25 and 64 years of age (17,785) are in the labor force, with 2.7% or 373 of them being unemployed. The group with the highest labor force participation rate are those with the educational attainment of bachelor's degree or higher, with 86.1% or 4,612 individuals in the labor force. Within the labor force, individuals with less than high school education have the highest percentage of unemployment, with 10.7% or 93 of them being unemployed.
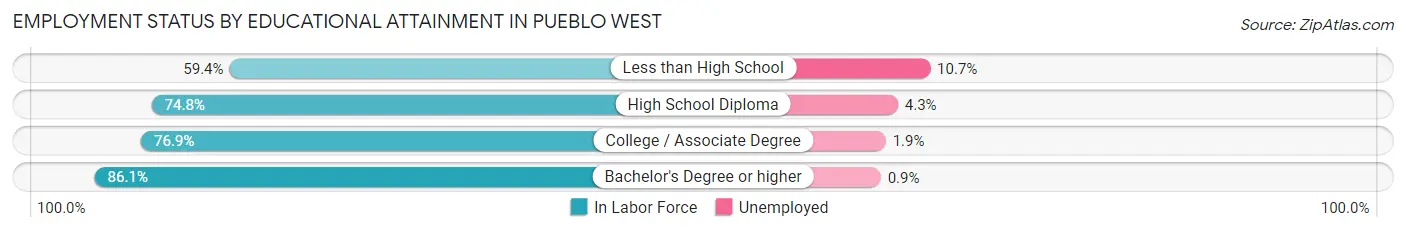
| Educational Attainment | In Labor Force | Unemployed |
| Less than High School | 868 (59.4%) | 156 (10.7%) |
| High School Diploma | 3,184 (74.8%) | 183 (4.3%) |
| College / Associate Degree | 5,160 (76.9%) | 127 (1.9%) |
| Bachelor's Degree or higher | 4,612 (86.1%) | 48 (0.9%) |
| Total | 13,819 (77.7%) | 480 (2.7%) |
Employment Occupations by Sex in Pueblo West
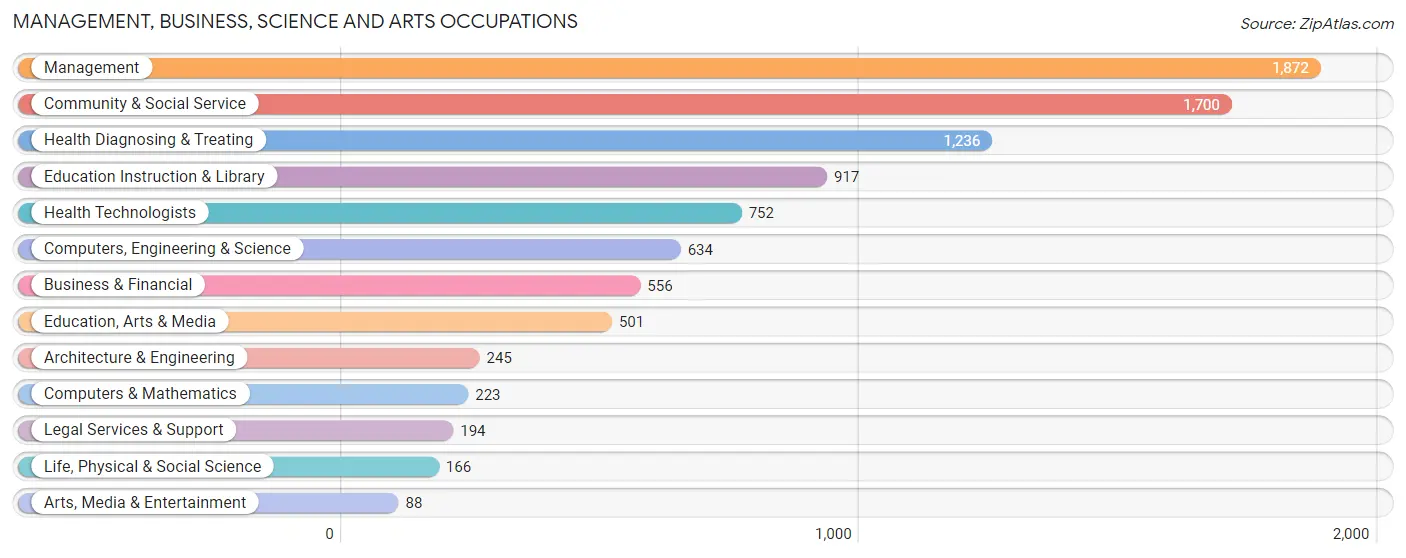
Management, Business, Science and Arts Occupations
The most common Management, Business, Science and Arts occupations in Pueblo West are Management (1,872 | 11.8%), Community & Social Service (1,700 | 10.7%), Health Diagnosing & Treating (1,236 | 7.8%), Education Instruction & Library (917 | 5.8%), and Health Technologists (752 | 4.7%).
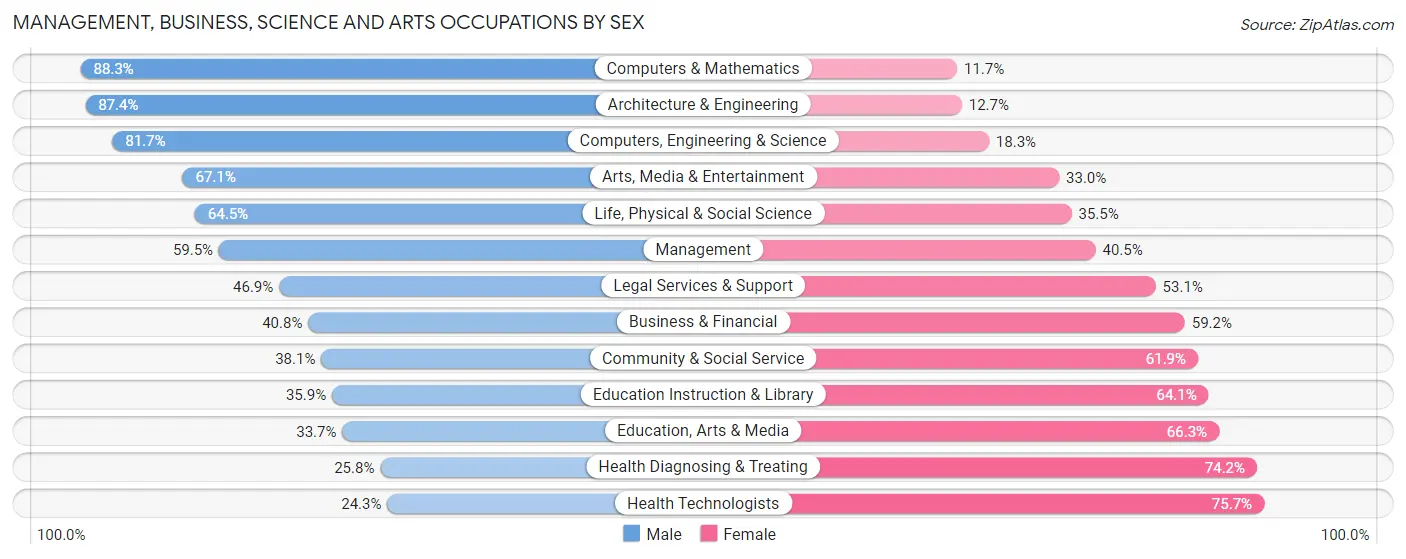
Management, Business, Science and Arts Occupations by Sex
Within the Management, Business, Science and Arts occupations in Pueblo West, the most male-oriented occupations are Computers & Mathematics (88.3%), Architecture & Engineering (87.4%), and Computers, Engineering & Science (81.7%), while the most female-oriented occupations are Health Technologists (75.7%), Health Diagnosing & Treating (74.2%), and Education, Arts & Media (66.3%).
| Occupation | Male | Female |
| Management | 1,113 (59.5%) | 759 (40.5%) |
| Business & Financial | 227 (40.8%) | 329 (59.2%) |
| Computers, Engineering & Science | 518 (81.7%) | 116 (18.3%) |
| Computers & Mathematics | 197 (88.3%) | 26 (11.7%) |
| Architecture & Engineering | 214 (87.4%) | 31 (12.7%) |
| Life, Physical & Social Science | 107 (64.5%) | 59 (35.5%) |
| Community & Social Service | 648 (38.1%) | 1,052 (61.9%) |
| Education, Arts & Media | 169 (33.7%) | 332 (66.3%) |
| Legal Services & Support | 91 (46.9%) | 103 (53.1%) |
| Education Instruction & Library | 329 (35.9%) | 588 (64.1%) |
| Arts, Media & Entertainment | 59 (67.0%) | 29 (33.0%) |
| Health Diagnosing & Treating | 319 (25.8%) | 917 (74.2%) |
| Health Technologists | 183 (24.3%) | 569 (75.7%) |
| Total (Category) | 2,825 (47.1%) | 3,173 (52.9%) |
| Total (Overall) | 8,441 (53.2%) | 7,429 (46.8%) |
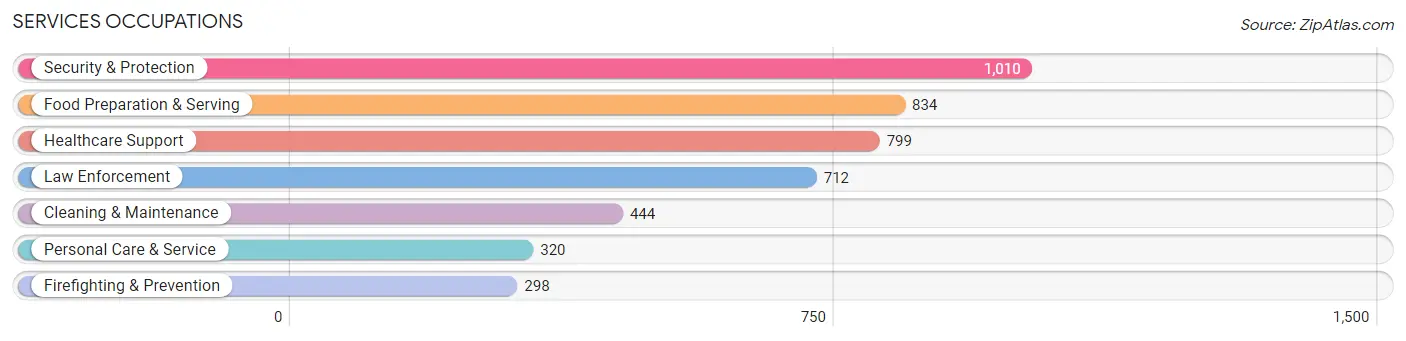
Services Occupations
The most common Services occupations in Pueblo West are Security & Protection (1,010 | 6.4%), Food Preparation & Serving (834 | 5.3%), Healthcare Support (799 | 5.0%), Law Enforcement (712 | 4.5%), and Cleaning & Maintenance (444 | 2.8%).
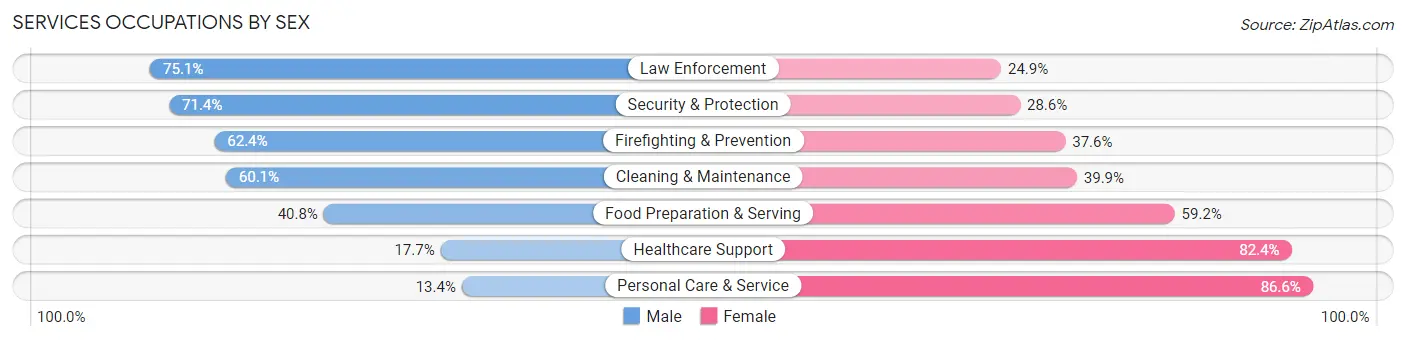
Services Occupations by Sex
Within the Services occupations in Pueblo West, the most male-oriented occupations are Law Enforcement (75.1%), Security & Protection (71.4%), and Firefighting & Prevention (62.4%), while the most female-oriented occupations are Personal Care & Service (86.6%), Healthcare Support (82.4%), and Food Preparation & Serving (59.2%).
| Occupation | Male | Female |
| Healthcare Support | 141 (17.6%) | 658 (82.4%) |
| Security & Protection | 721 (71.4%) | 289 (28.6%) |
| Firefighting & Prevention | 186 (62.4%) | 112 (37.6%) |
| Law Enforcement | 535 (75.1%) | 177 (24.9%) |
| Food Preparation & Serving | 340 (40.8%) | 494 (59.2%) |
| Cleaning & Maintenance | 267 (60.1%) | 177 (39.9%) |
| Personal Care & Service | 43 (13.4%) | 277 (86.6%) |
| Total (Category) | 1,512 (44.4%) | 1,895 (55.6%) |
| Total (Overall) | 8,441 (53.2%) | 7,429 (46.8%) |
Sales and Office Occupations
The most common Sales and Office occupations in Pueblo West are Sales & Related (1,653 | 10.4%), and Office & Administration (1,506 | 9.5%).

Sales and Office Occupations by Sex

| Occupation | Male | Female |
| Sales & Related | 1,043 (63.1%) | 610 (36.9%) |
| Office & Administration | 233 (15.5%) | 1,273 (84.5%) |
| Total (Category) | 1,276 (40.4%) | 1,883 (59.6%) |
| Total (Overall) | 8,441 (53.2%) | 7,429 (46.8%) |
Natural Resources, Construction and Maintenance Occupations
The most common Natural Resources, Construction and Maintenance occupations in Pueblo West are Construction & Extraction (588 | 3.7%), Installation, Maintenance & Repair (421 | 2.6%), and Farming, Fishing & Forestry (49 | 0.3%).
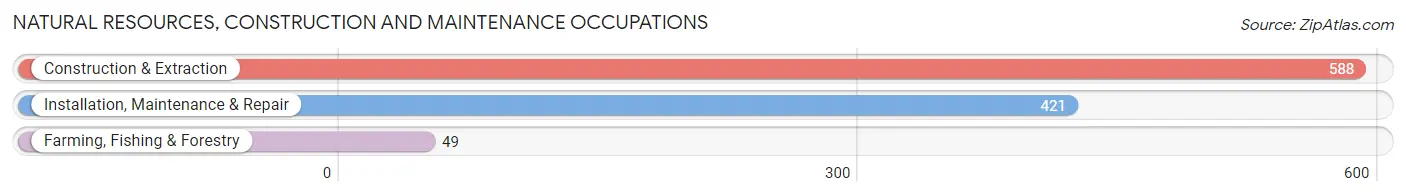
Natural Resources, Construction and Maintenance Occupations by Sex
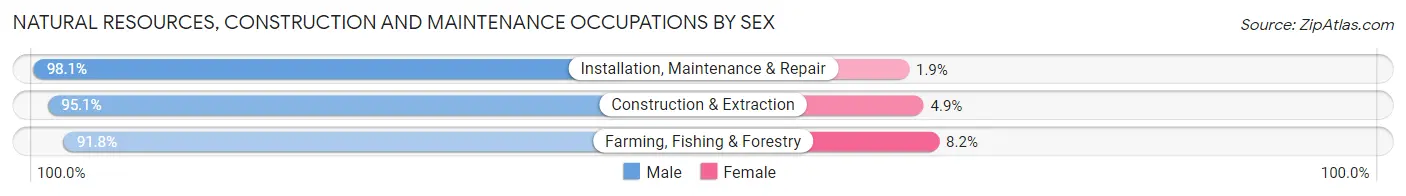
| Occupation | Male | Female |
| Farming, Fishing & Forestry | 45 (91.8%) | 4 (8.2%) |
| Construction & Extraction | 559 (95.1%) | 29 (4.9%) |
| Installation, Maintenance & Repair | 413 (98.1%) | 8 (1.9%) |
| Total (Category) | 1,017 (96.1%) | 41 (3.9%) |
| Total (Overall) | 8,441 (53.2%) | 7,429 (46.8%) |
Production, Transportation and Moving Occupations
The most common Production, Transportation and Moving occupations in Pueblo West are Production (977 | 6.2%), Material Moving (803 | 5.1%), and Transportation (468 | 2.9%).
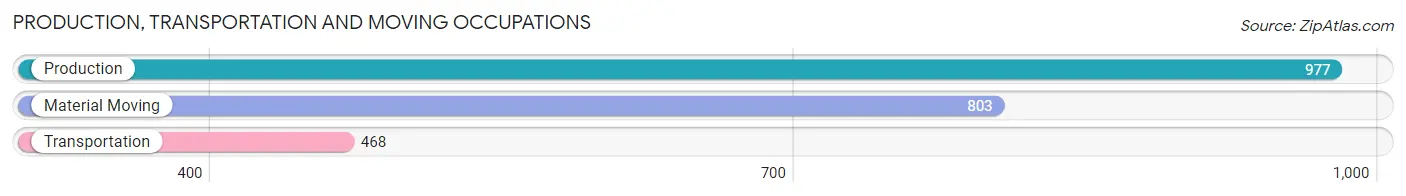
Production, Transportation and Moving Occupations by Sex
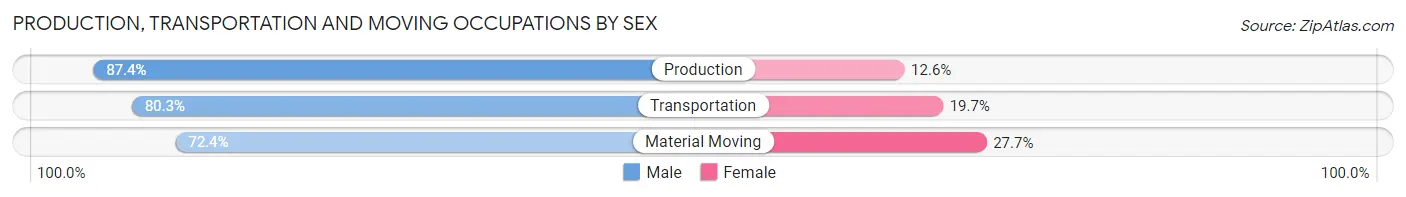
| Occupation | Male | Female |
| Production | 854 (87.4%) | 123 (12.6%) |
| Transportation | 376 (80.3%) | 92 (19.7%) |
| Material Moving | 581 (72.4%) | 222 (27.7%) |
| Total (Category) | 1,811 (80.6%) | 437 (19.4%) |
| Total (Overall) | 8,441 (53.2%) | 7,429 (46.8%) |
Employment Industries by Sex in Pueblo West
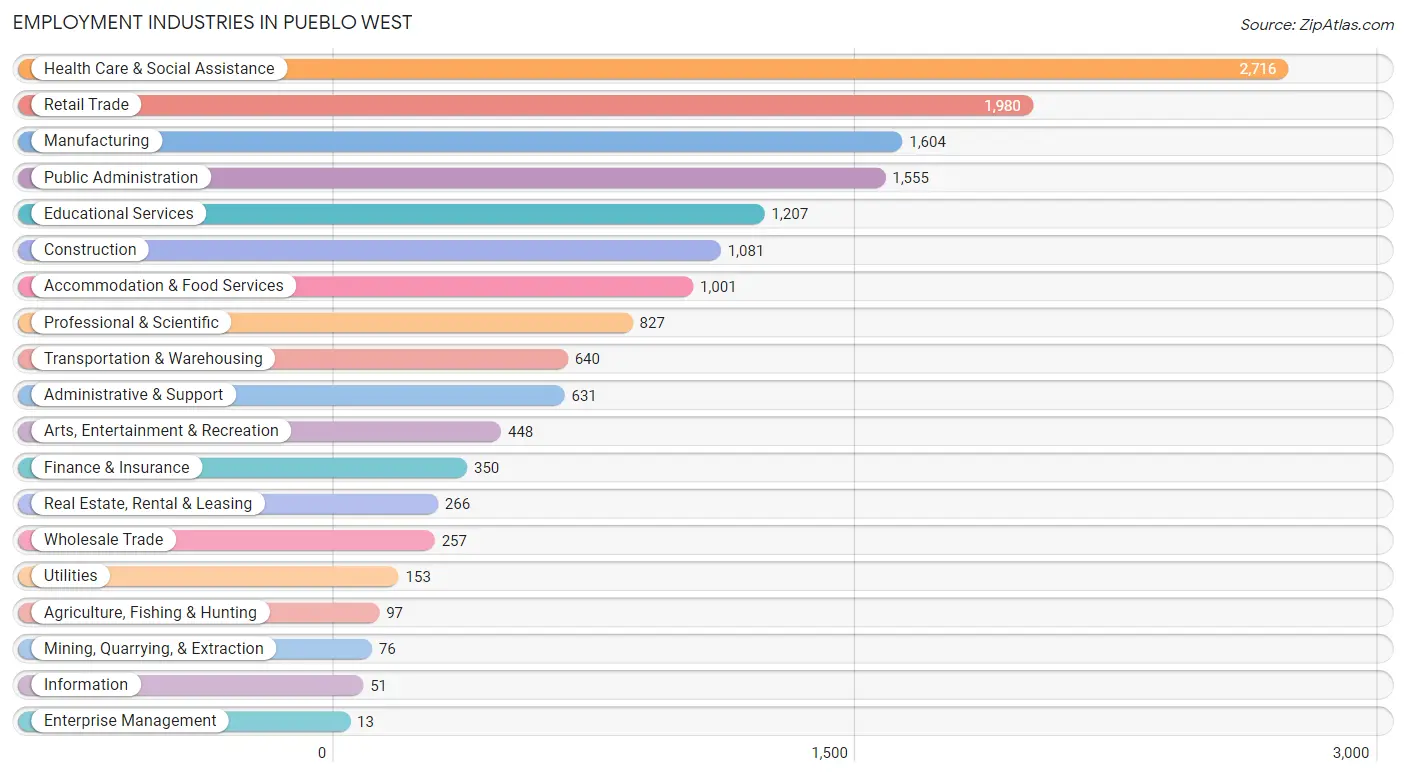
Employment Industries in Pueblo West
The major employment industries in Pueblo West include Health Care & Social Assistance (2,716 | 17.1%), Retail Trade (1,980 | 12.5%), Manufacturing (1,604 | 10.1%), Public Administration (1,555 | 9.8%), and Educational Services (1,207 | 7.6%).
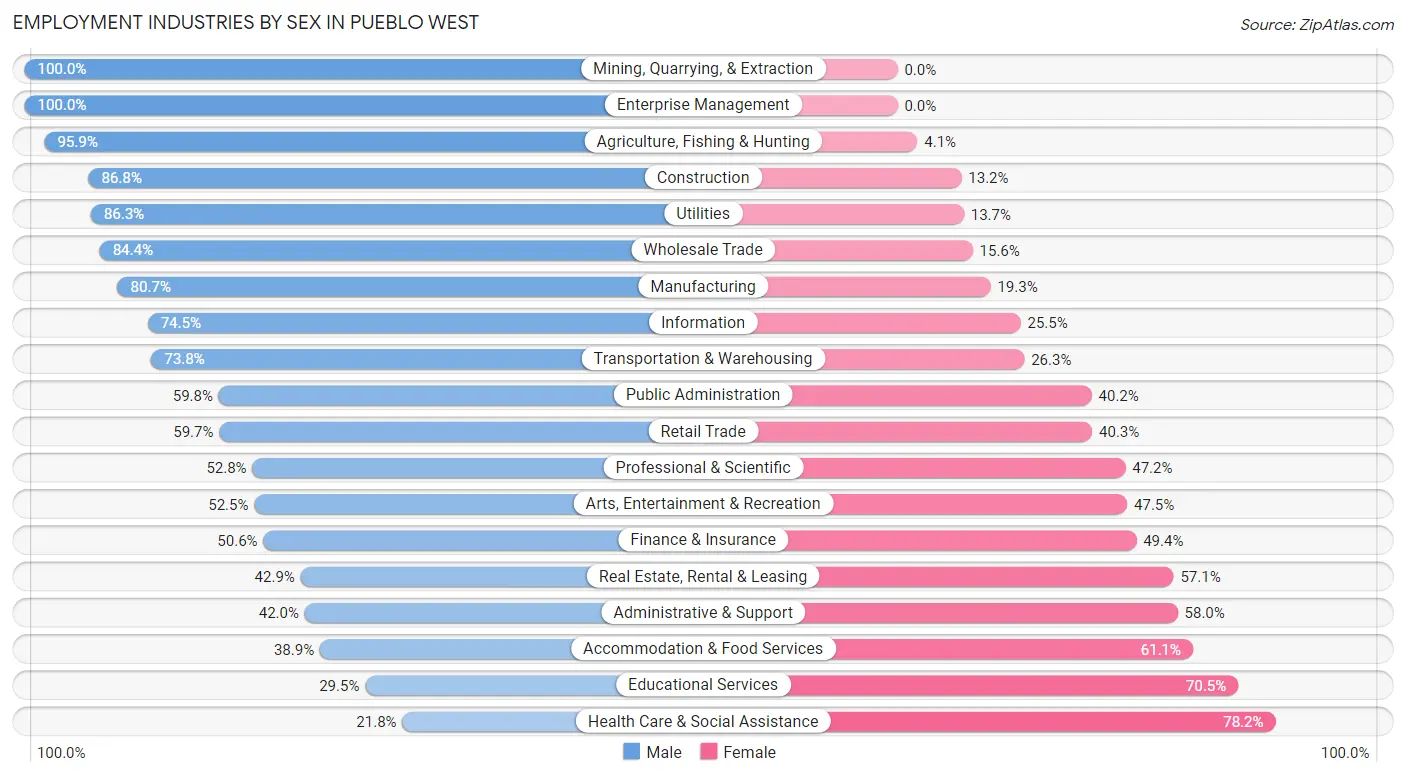
Employment Industries by Sex in Pueblo West
The Pueblo West industries that see more men than women are Mining, Quarrying, & Extraction (100.0%), Enterprise Management (100.0%), and Agriculture, Fishing & Hunting (95.9%), whereas the industries that tend to have a higher number of women are Health Care & Social Assistance (78.2%), Educational Services (70.5%), and Accommodation & Food Services (61.1%).
| Industry | Male | Female |
| Agriculture, Fishing & Hunting | 93 (95.9%) | 4 (4.1%) |
| Mining, Quarrying, & Extraction | 76 (100.0%) | 0 (0.0%) |
| Construction | 938 (86.8%) | 143 (13.2%) |
| Manufacturing | 1,295 (80.7%) | 309 (19.3%) |
| Wholesale Trade | 217 (84.4%) | 40 (15.6%) |
| Retail Trade | 1,182 (59.7%) | 798 (40.3%) |
| Transportation & Warehousing | 472 (73.8%) | 168 (26.3%) |
| Utilities | 132 (86.3%) | 21 (13.7%) |
| Information | 38 (74.5%) | 13 (25.5%) |
| Finance & Insurance | 177 (50.6%) | 173 (49.4%) |
| Real Estate, Rental & Leasing | 114 (42.9%) | 152 (57.1%) |
| Professional & Scientific | 437 (52.8%) | 390 (47.2%) |
| Enterprise Management | 13 (100.0%) | 0 (0.0%) |
| Administrative & Support | 265 (42.0%) | 366 (58.0%) |
| Educational Services | 356 (29.5%) | 851 (70.5%) |
| Health Care & Social Assistance | 592 (21.8%) | 2,124 (78.2%) |
| Arts, Entertainment & Recreation | 235 (52.5%) | 213 (47.5%) |
| Accommodation & Food Services | 389 (38.9%) | 612 (61.1%) |
| Public Administration | 930 (59.8%) | 625 (40.2%) |
| Total | 8,441 (53.2%) | 7,429 (46.8%) |
Education in Pueblo West
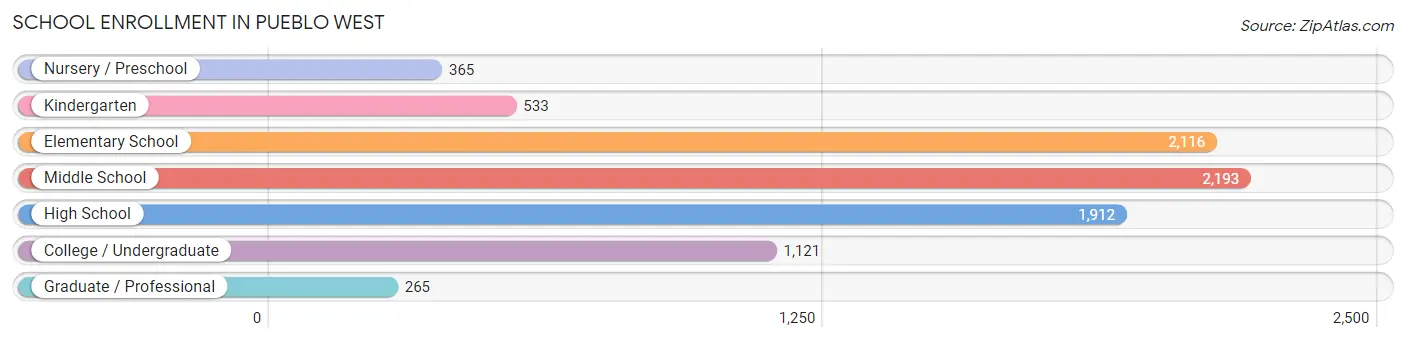
School Enrollment in Pueblo West
The most common levels of schooling among the 8,505 students in Pueblo West are middle school (2,193 | 25.8%), elementary school (2,116 | 24.9%), and high school (1,912 | 22.5%).
| School Level | # Students | % Students |
| Nursery / Preschool | 365 | 4.3% |
| Kindergarten | 533 | 6.3% |
| Elementary School | 2,116 | 24.9% |
| Middle School | 2,193 | 25.8% |
| High School | 1,912 | 22.5% |
| College / Undergraduate | 1,121 | 13.2% |
| Graduate / Professional | 265 | 3.1% |
| Total | 8,505 | 100.0% |
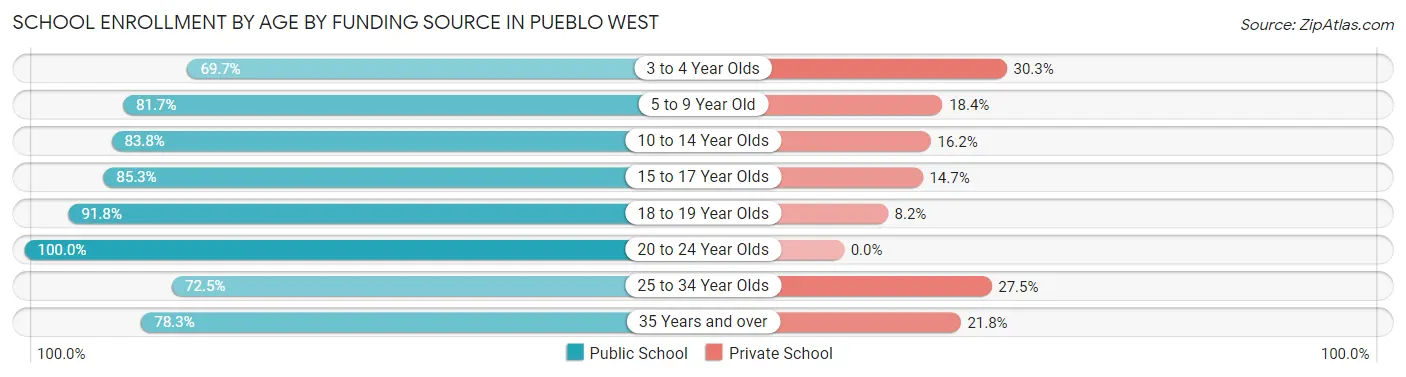
School Enrollment by Age by Funding Source in Pueblo West
Out of a total of 8,505 students who are enrolled in schools in Pueblo West, 1,386 (16.3%) attend a private institution, while the remaining 7,119 (83.7%) are enrolled in public schools. The age group of 3 to 4 year olds has the highest likelihood of being enrolled in private schools, with 71 (30.3% in the age bracket) enrolled. Conversely, the age group of 20 to 24 year olds has the lowest likelihood of being enrolled in a private school, with 509 (100.0% in the age bracket) attending a public institution.
| Age Bracket | Public School | Private School |
| 3 to 4 Year Olds | 163 (69.7%) | 71 (30.3%) |
| 5 to 9 Year Old | 1,900 (81.7%) | 427 (18.3%) |
| 10 to 14 Year Olds | 2,346 (83.8%) | 453 (16.2%) |
| 15 to 17 Year Olds | 1,221 (85.3%) | 210 (14.7%) |
| 18 to 19 Year Olds | 404 (91.8%) | 36 (8.2%) |
| 20 to 24 Year Olds | 509 (100.0%) | 0 (0.0%) |
| 25 to 34 Year Olds | 248 (72.5%) | 94 (27.5%) |
| 35 Years and over | 331 (78.2%) | 92 (21.7%) |
| Total | 7,119 (83.7%) | 1,386 (16.3%) |
Educational Attainment by Field of Study in Pueblo West
Business (1,716 | 21.4%), science & technology (926 | 11.6%), education (846 | 10.6%), arts & humanities (693 | 8.7%), and social sciences (640 | 8.0%) are the most common fields of study among 8,002 individuals in Pueblo West who have obtained a bachelor's degree or higher.
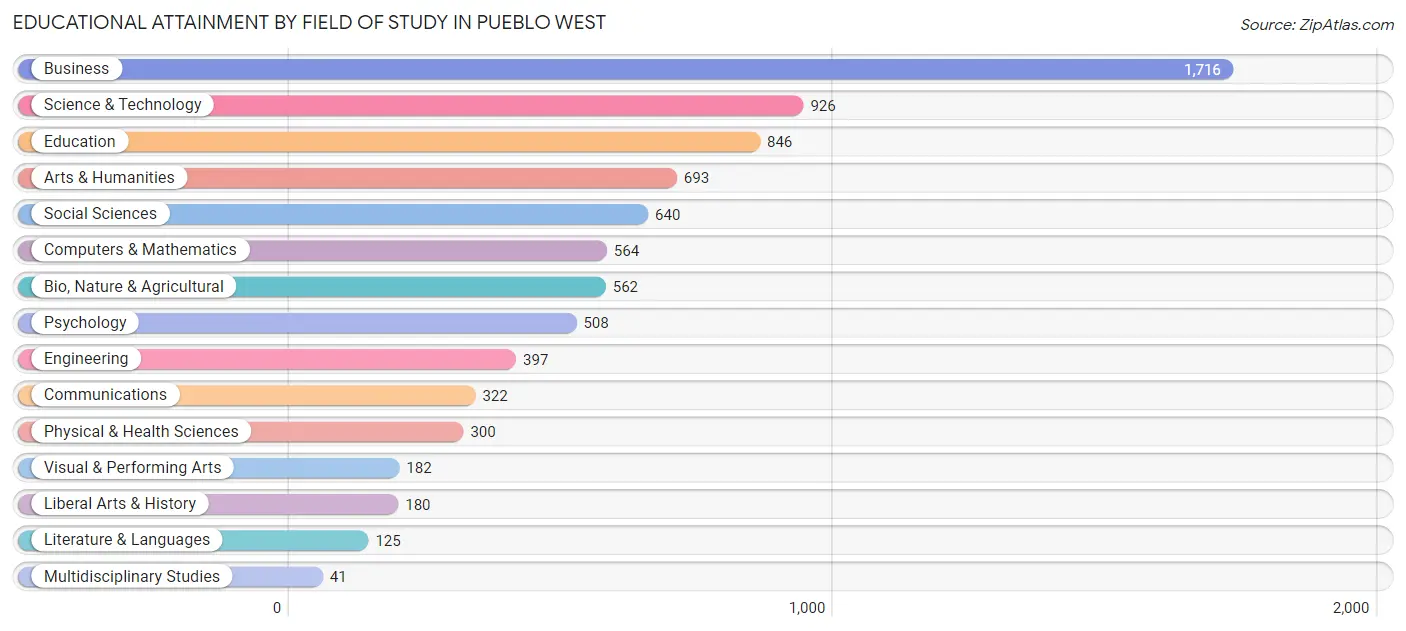
| Field of Study | # Graduates | % Graduates |
| Computers & Mathematics | 564 | 7.0% |
| Bio, Nature & Agricultural | 562 | 7.0% |
| Physical & Health Sciences | 300 | 3.7% |
| Psychology | 508 | 6.4% |
| Social Sciences | 640 | 8.0% |
| Engineering | 397 | 5.0% |
| Multidisciplinary Studies | 41 | 0.5% |
| Science & Technology | 926 | 11.6% |
| Business | 1,716 | 21.4% |
| Education | 846 | 10.6% |
| Literature & Languages | 125 | 1.6% |
| Liberal Arts & History | 180 | 2.2% |
| Visual & Performing Arts | 182 | 2.3% |
| Communications | 322 | 4.0% |
| Arts & Humanities | 693 | 8.7% |
| Total | 8,002 | 100.0% |
Transportation & Commute in Pueblo West
Vehicle Availability by Sex in Pueblo West
The most prevalent vehicle ownership categories in Pueblo West are males with 2 vehicles (3,185, accounting for 37.7%) and females with 2 vehicles (2,668, making up 44.1%).
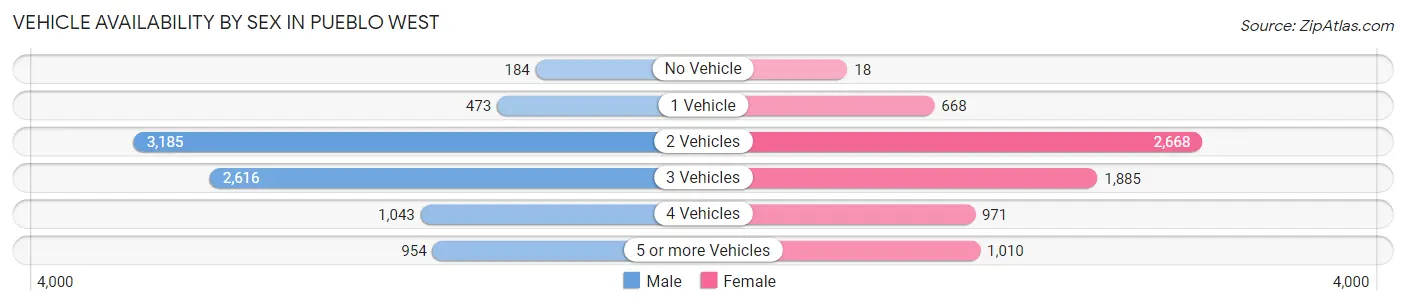
| Vehicles Available | Male | Female |
| No Vehicle | 184 (2.2%) | 18 (0.3%) |
| 1 Vehicle | 473 (5.6%) | 668 (9.2%) |
| 2 Vehicles | 3,185 (37.7%) | 2,668 (36.9%) |
| 3 Vehicles | 2,616 (30.9%) | 1,885 (26.1%) |
| 4 Vehicles | 1,043 (12.3%) | 971 (13.5%) |
| 5 or more Vehicles | 954 (11.3%) | 1,010 (14.0%) |
| Total | 8,455 (100.0%) | 7,220 (100.0%) |
Commute Time in Pueblo West
The most frequently occuring commute durations in Pueblo West are 20 to 24 minutes (2,936 commuters, 20.3%), 15 to 19 minutes (2,689 commuters, 18.6%), and 30 to 34 minutes (1,865 commuters, 12.9%).
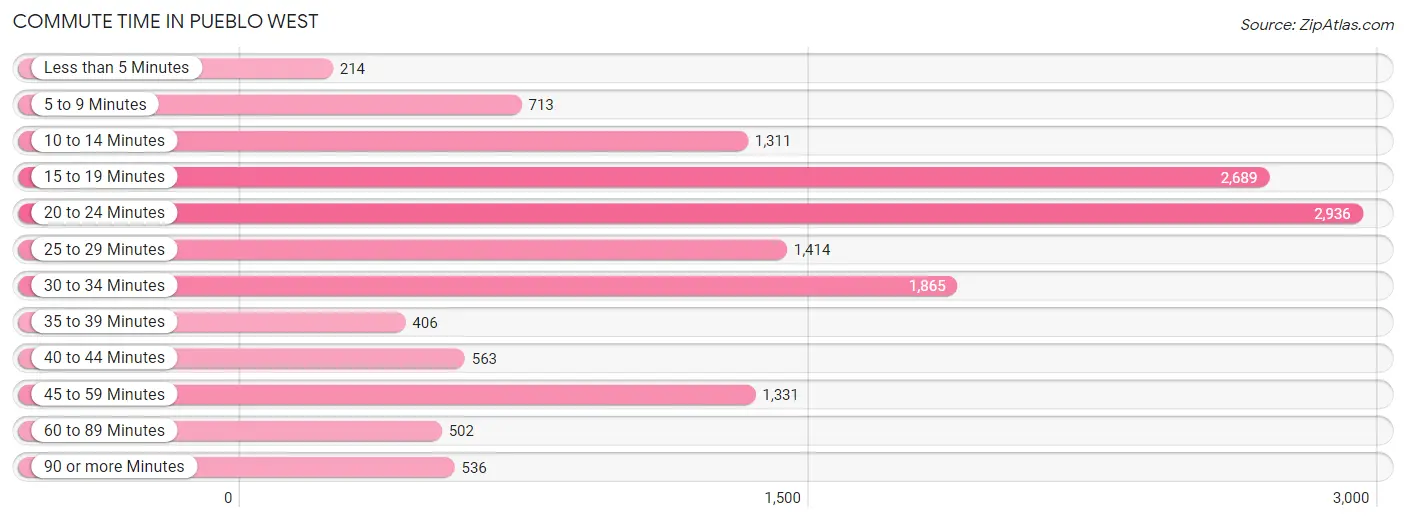
| Commute Time | # Commuters | % Commuters |
| Less than 5 Minutes | 214 | 1.5% |
| 5 to 9 Minutes | 713 | 4.9% |
| 10 to 14 Minutes | 1,311 | 9.0% |
| 15 to 19 Minutes | 2,689 | 18.6% |
| 20 to 24 Minutes | 2,936 | 20.3% |
| 25 to 29 Minutes | 1,414 | 9.8% |
| 30 to 34 Minutes | 1,865 | 12.9% |
| 35 to 39 Minutes | 406 | 2.8% |
| 40 to 44 Minutes | 563 | 3.9% |
| 45 to 59 Minutes | 1,331 | 9.2% |
| 60 to 89 Minutes | 502 | 3.5% |
| 90 or more Minutes | 536 | 3.7% |
Commute Time by Sex in Pueblo West
The most common commute times in Pueblo West are 20 to 24 minutes (1,487 commuters, 18.7%) for males and 20 to 24 minutes (1,449 commuters, 22.2%) for females.
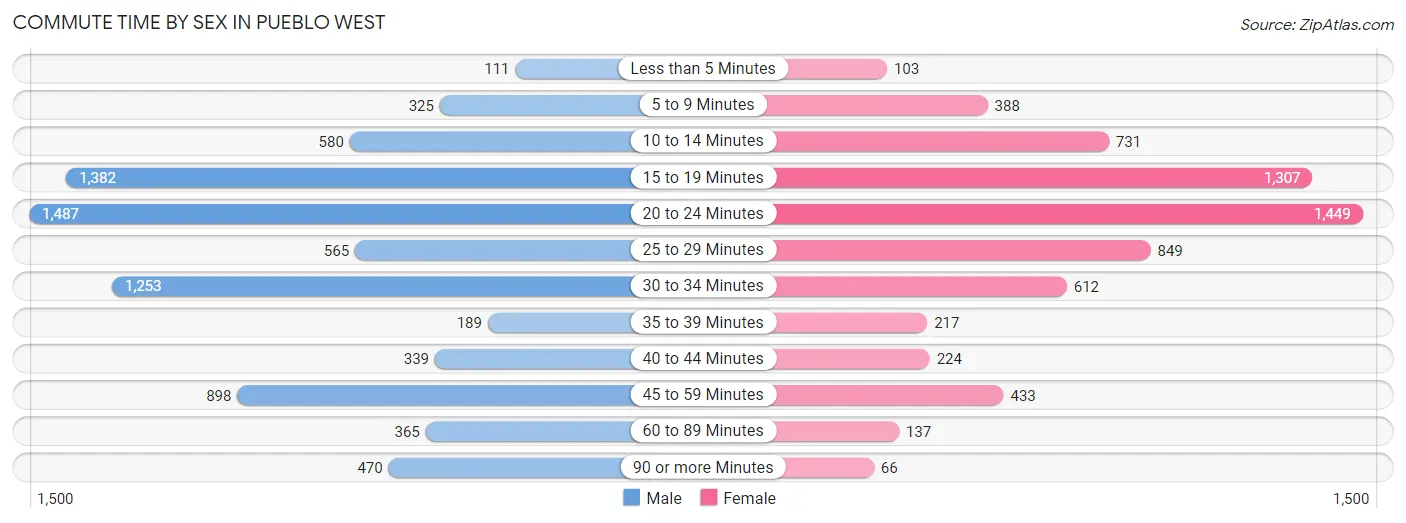
| Commute Time | Male | Female |
| Less than 5 Minutes | 111 (1.4%) | 103 (1.6%) |
| 5 to 9 Minutes | 325 (4.1%) | 388 (5.9%) |
| 10 to 14 Minutes | 580 (7.3%) | 731 (11.2%) |
| 15 to 19 Minutes | 1,382 (17.3%) | 1,307 (20.1%) |
| 20 to 24 Minutes | 1,487 (18.7%) | 1,449 (22.2%) |
| 25 to 29 Minutes | 565 (7.1%) | 849 (13.0%) |
| 30 to 34 Minutes | 1,253 (15.7%) | 612 (9.4%) |
| 35 to 39 Minutes | 189 (2.4%) | 217 (3.3%) |
| 40 to 44 Minutes | 339 (4.3%) | 224 (3.4%) |
| 45 to 59 Minutes | 898 (11.3%) | 433 (6.7%) |
| 60 to 89 Minutes | 365 (4.6%) | 137 (2.1%) |
| 90 or more Minutes | 470 (5.9%) | 66 (1.0%) |
Time of Departure to Work by Sex in Pueblo West
The most frequent times of departure to work in Pueblo West are 7:00 AM to 7:29 AM (1,027, 12.9%) for males and 7:00 AM to 7:29 AM (1,283, 19.7%) for females.
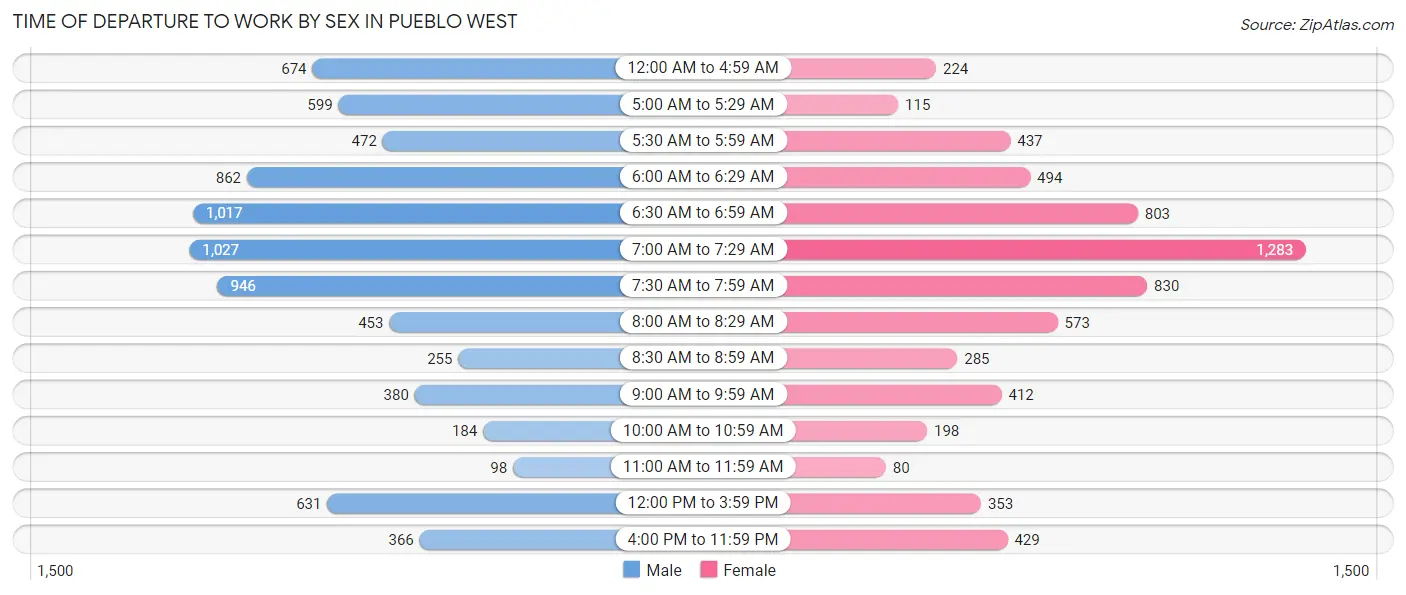
| Time of Departure | Male | Female |
| 12:00 AM to 4:59 AM | 674 (8.5%) | 224 (3.4%) |
| 5:00 AM to 5:29 AM | 599 (7.5%) | 115 (1.8%) |
| 5:30 AM to 5:59 AM | 472 (5.9%) | 437 (6.7%) |
| 6:00 AM to 6:29 AM | 862 (10.8%) | 494 (7.6%) |
| 6:30 AM to 6:59 AM | 1,017 (12.8%) | 803 (12.3%) |
| 7:00 AM to 7:29 AM | 1,027 (12.9%) | 1,283 (19.7%) |
| 7:30 AM to 7:59 AM | 946 (11.9%) | 830 (12.7%) |
| 8:00 AM to 8:29 AM | 453 (5.7%) | 573 (8.8%) |
| 8:30 AM to 8:59 AM | 255 (3.2%) | 285 (4.4%) |
| 9:00 AM to 9:59 AM | 380 (4.8%) | 412 (6.3%) |
| 10:00 AM to 10:59 AM | 184 (2.3%) | 198 (3.0%) |
| 11:00 AM to 11:59 AM | 98 (1.2%) | 80 (1.2%) |
| 12:00 PM to 3:59 PM | 631 (7.9%) | 353 (5.4%) |
| 4:00 PM to 11:59 PM | 366 (4.6%) | 429 (6.6%) |
| Total | 7,964 (100.0%) | 6,516 (100.0%) |
Housing Occupancy in Pueblo West
Occupancy by Ownership in Pueblo West
Of the total 12,108 dwellings in Pueblo West, owner-occupied units account for 10,412 (86.0%), while renter-occupied units make up 1,696 (14.0%).
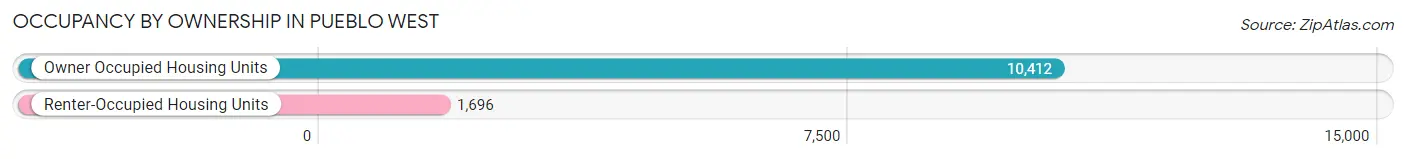
| Occupancy | # Housing Units | % Housing Units |
| Owner Occupied Housing Units | 10,412 | 86.0% |
| Renter-Occupied Housing Units | 1,696 | 14.0% |
| Total Occupied Housing Units | 12,108 | 100.0% |
Occupancy by Household Size in Pueblo West
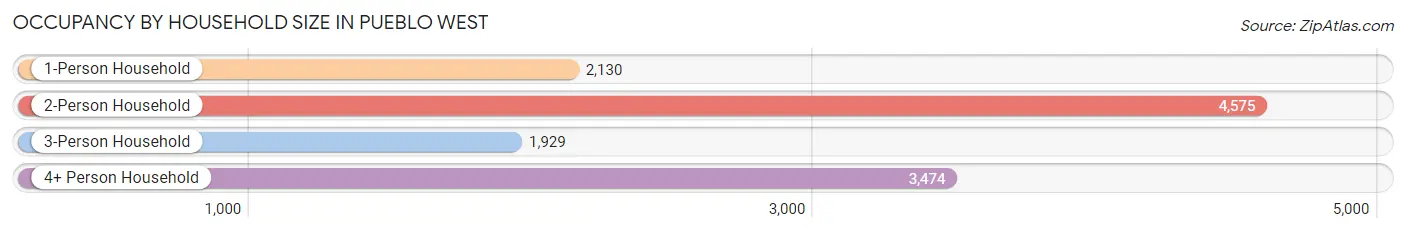
| Household Size | # Housing Units | % Housing Units |
| 1-Person Household | 2,130 | 17.6% |
| 2-Person Household | 4,575 | 37.8% |
| 3-Person Household | 1,929 | 15.9% |
| 4+ Person Household | 3,474 | 28.7% |
| Total Housing Units | 12,108 | 100.0% |
Occupancy by Ownership by Household Size in Pueblo West
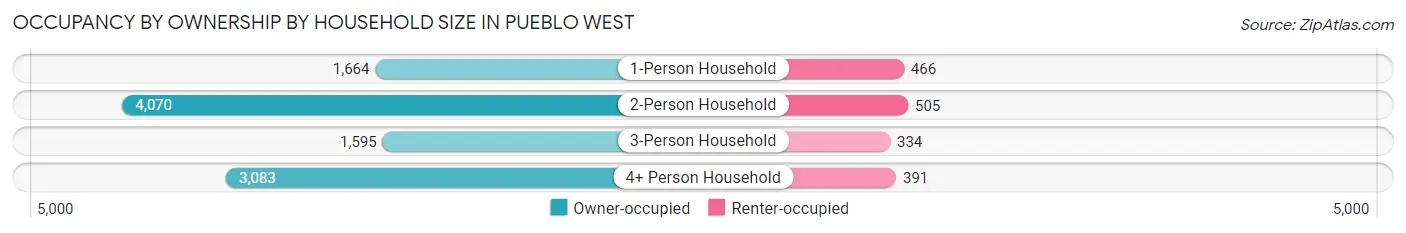
| Household Size | Owner-occupied | Renter-occupied |
| 1-Person Household | 1,664 (78.1%) | 466 (21.9%) |
| 2-Person Household | 4,070 (89.0%) | 505 (11.0%) |
| 3-Person Household | 1,595 (82.7%) | 334 (17.3%) |
| 4+ Person Household | 3,083 (88.7%) | 391 (11.3%) |
| Total Housing Units | 10,412 (86.0%) | 1,696 (14.0%) |
Occupancy by Educational Attainment in Pueblo West
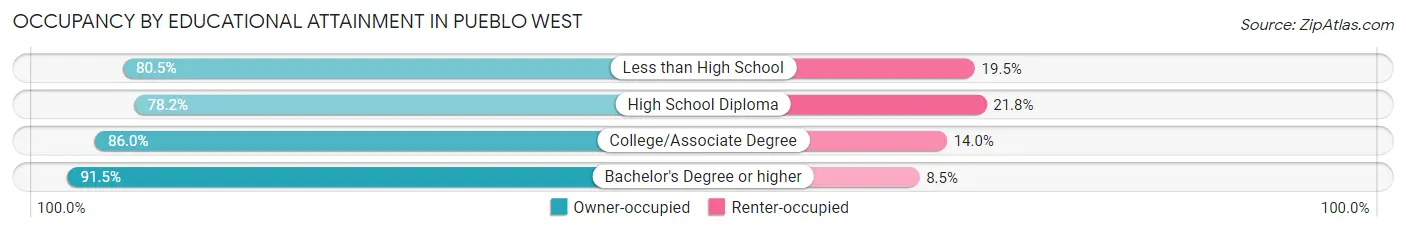
| Household Size | Owner-occupied | Renter-occupied |
| Less than High School | 482 (80.5%) | 117 (19.5%) |
| High School Diploma | 1,884 (78.2%) | 526 (21.8%) |
| College/Associate Degree | 4,368 (86.0%) | 710 (14.0%) |
| Bachelor's Degree or higher | 3,678 (91.5%) | 343 (8.5%) |
Occupancy by Age of Householder in Pueblo West
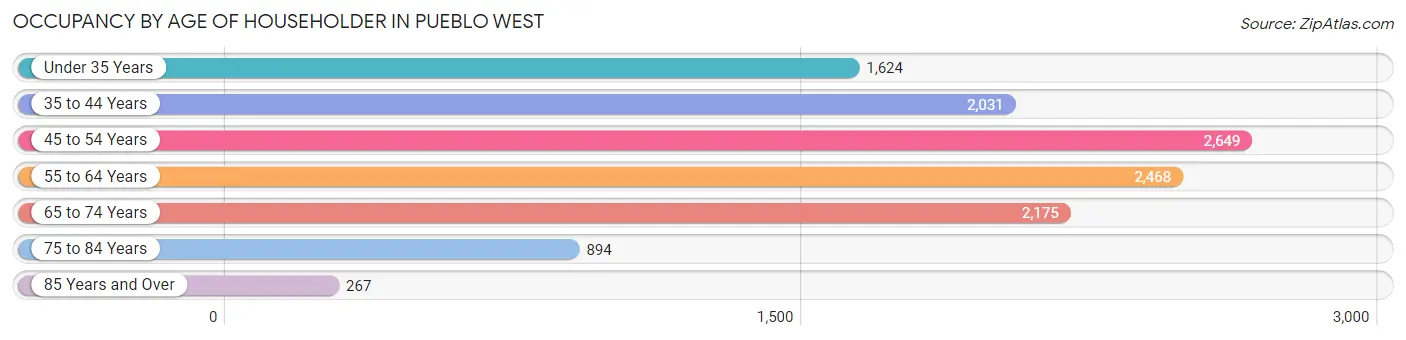
| Age Bracket | # Households | % Households |
| Under 35 Years | 1,624 | 13.4% |
| 35 to 44 Years | 2,031 | 16.8% |
| 45 to 54 Years | 2,649 | 21.9% |
| 55 to 64 Years | 2,468 | 20.4% |
| 65 to 74 Years | 2,175 | 18.0% |
| 75 to 84 Years | 894 | 7.4% |
| 85 Years and Over | 267 | 2.2% |
| Total | 12,108 | 100.0% |
Housing Finances in Pueblo West
Median Income by Occupancy in Pueblo West
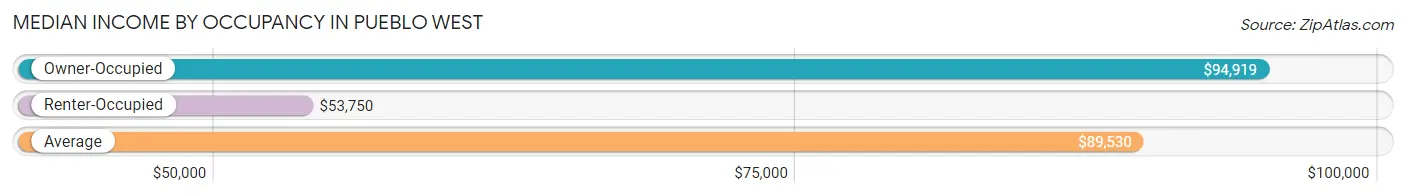
| Occupancy Type | # Households | Median Income |
| Owner-Occupied | 10,412 (86.0%) | $94,919 |
| Renter-Occupied | 1,696 (14.0%) | $53,750 |
| Average | 12,108 (100.0%) | $89,530 |
Occupancy by Householder Income Bracket in Pueblo West
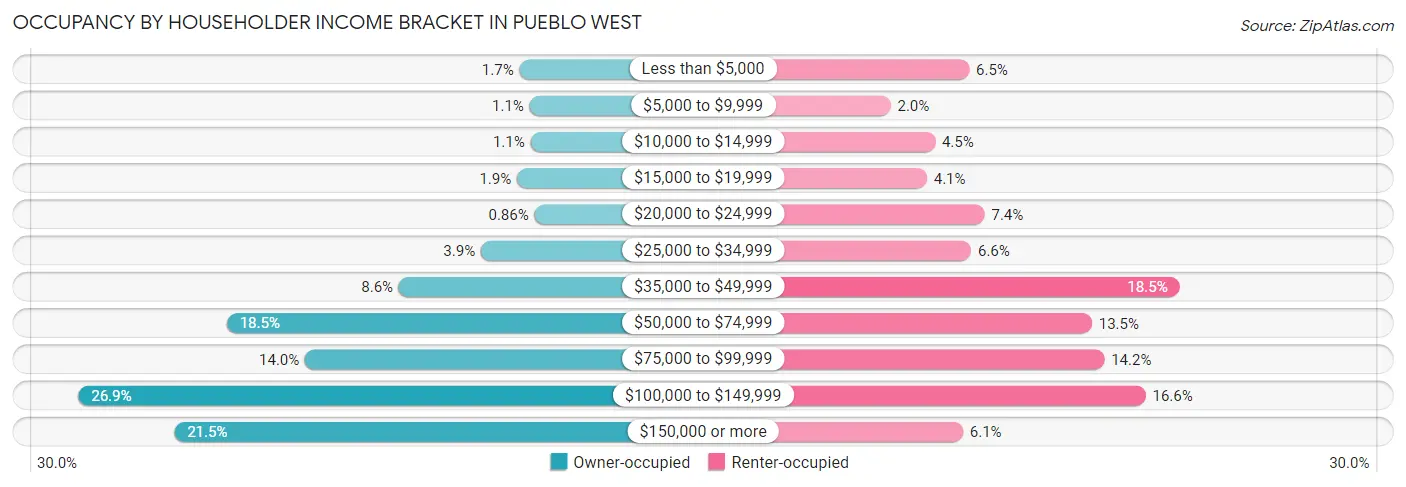
| Income Bracket | Owner-occupied | Renter-occupied |
| Less than $5,000 | 179 (1.7%) | 110 (6.5%) |
| $5,000 to $9,999 | 119 (1.1%) | 34 (2.0%) |
| $10,000 to $14,999 | 113 (1.1%) | 77 (4.5%) |
| $15,000 to $19,999 | 194 (1.9%) | 69 (4.1%) |
| $20,000 to $24,999 | 90 (0.9%) | 125 (7.4%) |
| $25,000 to $34,999 | 408 (3.9%) | 112 (6.6%) |
| $35,000 to $49,999 | 896 (8.6%) | 314 (18.5%) |
| $50,000 to $74,999 | 1,921 (18.4%) | 229 (13.5%) |
| $75,000 to $99,999 | 1,455 (14.0%) | 241 (14.2%) |
| $100,000 to $149,999 | 2,804 (26.9%) | 281 (16.6%) |
| $150,000 or more | 2,233 (21.4%) | 104 (6.1%) |
| Total | 10,412 (100.0%) | 1,696 (100.0%) |
Monthly Housing Cost Tiers in Pueblo West
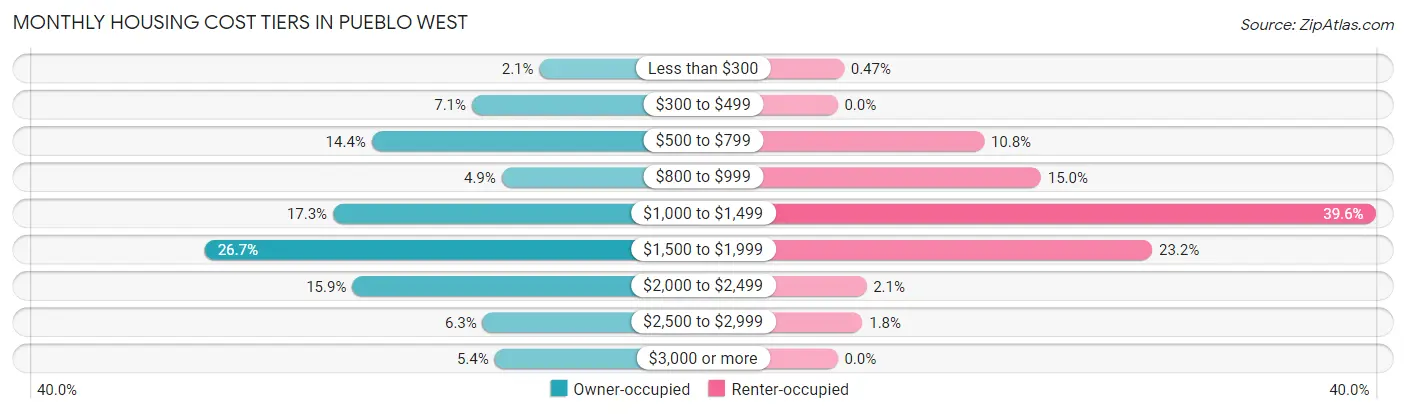
| Monthly Cost | Owner-occupied | Renter-occupied |
| Less than $300 | 218 (2.1%) | 8 (0.5%) |
| $300 to $499 | 735 (7.1%) | 0 (0.0%) |
| $500 to $799 | 1,503 (14.4%) | 183 (10.8%) |
| $800 to $999 | 507 (4.9%) | 254 (15.0%) |
| $1,000 to $1,499 | 1,800 (17.3%) | 672 (39.6%) |
| $1,500 to $1,999 | 2,783 (26.7%) | 393 (23.2%) |
| $2,000 to $2,499 | 1,652 (15.9%) | 36 (2.1%) |
| $2,500 to $2,999 | 653 (6.3%) | 31 (1.8%) |
| $3,000 or more | 561 (5.4%) | 0 (0.0%) |
| Total | 10,412 (100.0%) | 1,696 (100.0%) |
Physical Housing Characteristics in Pueblo West
Housing Structures in Pueblo West
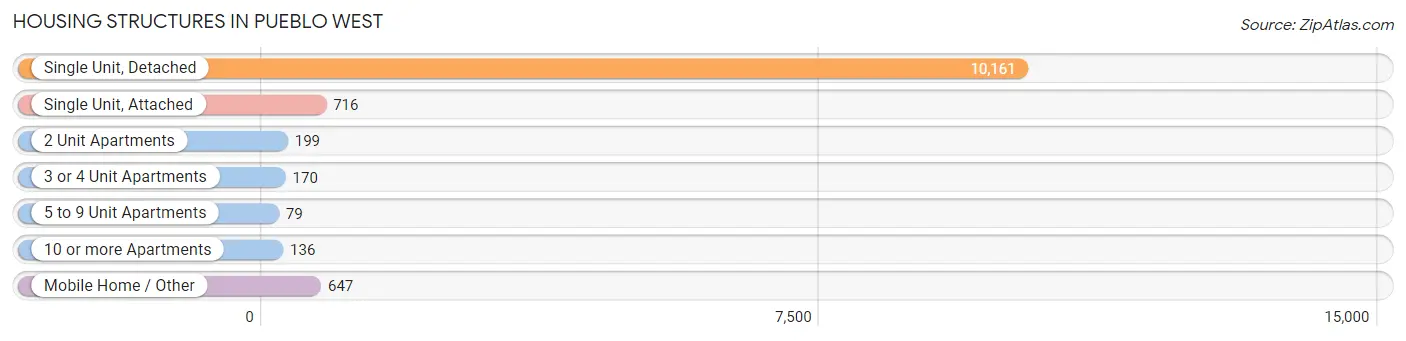
| Structure Type | # Housing Units | % Housing Units |
| Single Unit, Detached | 10,161 | 83.9% |
| Single Unit, Attached | 716 | 5.9% |
| 2 Unit Apartments | 199 | 1.6% |
| 3 or 4 Unit Apartments | 170 | 1.4% |
| 5 to 9 Unit Apartments | 79 | 0.6% |
| 10 or more Apartments | 136 | 1.1% |
| Mobile Home / Other | 647 | 5.3% |
| Total | 12,108 | 100.0% |
Housing Structures by Occupancy in Pueblo West
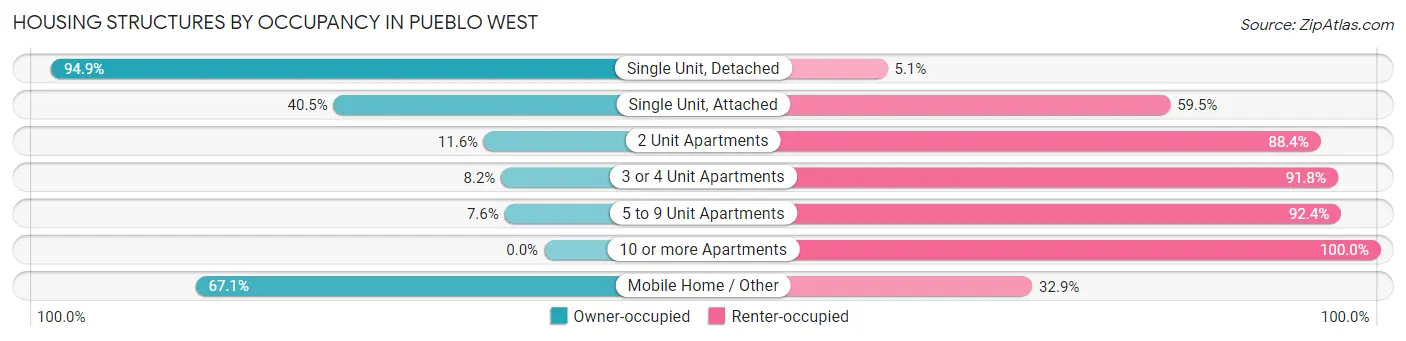
| Structure Type | Owner-occupied | Renter-occupied |
| Single Unit, Detached | 9,645 (94.9%) | 516 (5.1%) |
| Single Unit, Attached | 290 (40.5%) | 426 (59.5%) |
| 2 Unit Apartments | 23 (11.6%) | 176 (88.4%) |
| 3 or 4 Unit Apartments | 14 (8.2%) | 156 (91.8%) |
| 5 to 9 Unit Apartments | 6 (7.6%) | 73 (92.4%) |
| 10 or more Apartments | 0 (0.0%) | 136 (100.0%) |
| Mobile Home / Other | 434 (67.1%) | 213 (32.9%) |
| Total | 10,412 (86.0%) | 1,696 (14.0%) |
Housing Structures by Number of Rooms in Pueblo West
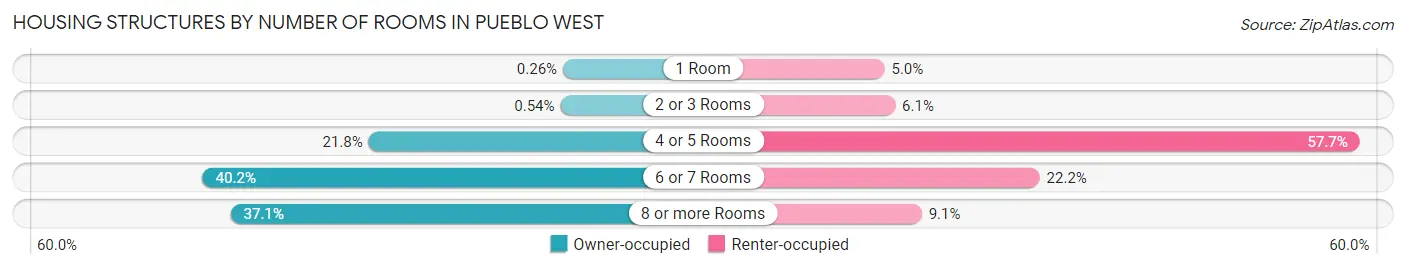
| Number of Rooms | Owner-occupied | Renter-occupied |
| 1 Room | 27 (0.3%) | 84 (5.0%) |
| 2 or 3 Rooms | 56 (0.5%) | 104 (6.1%) |
| 4 or 5 Rooms | 2,273 (21.8%) | 978 (57.7%) |
| 6 or 7 Rooms | 4,190 (40.2%) | 376 (22.2%) |
| 8 or more Rooms | 3,866 (37.1%) | 154 (9.1%) |
| Total | 10,412 (100.0%) | 1,696 (100.0%) |
Housing Structure by Heating Type in Pueblo West
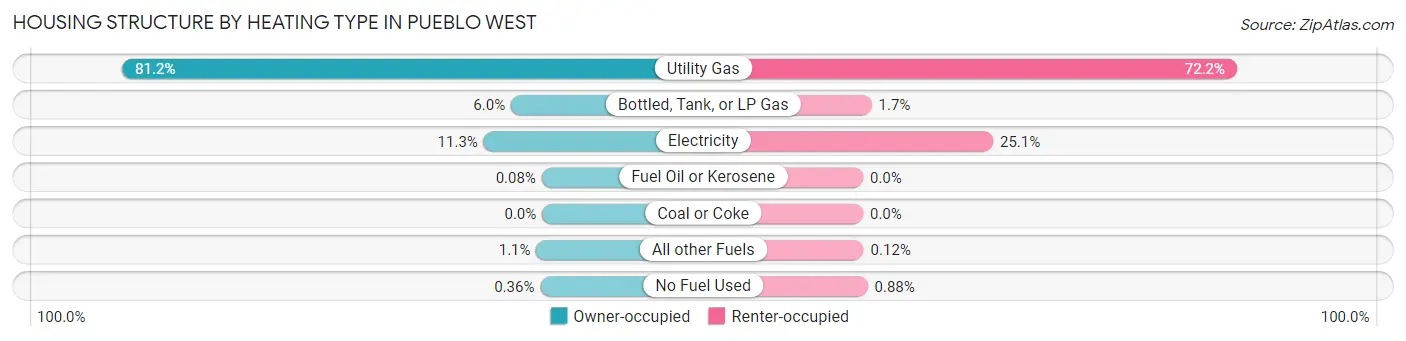
| Heating Type | Owner-occupied | Renter-occupied |
| Utility Gas | 8,450 (81.2%) | 1,225 (72.2%) |
| Bottled, Tank, or LP Gas | 626 (6.0%) | 28 (1.7%) |
| Electricity | 1,175 (11.3%) | 426 (25.1%) |
| Fuel Oil or Kerosene | 8 (0.1%) | 0 (0.0%) |
| Coal or Coke | 0 (0.0%) | 0 (0.0%) |
| All other Fuels | 116 (1.1%) | 2 (0.1%) |
| No Fuel Used | 37 (0.4%) | 15 (0.9%) |
| Total | 10,412 (100.0%) | 1,696 (100.0%) |
Household Vehicle Usage in Pueblo West
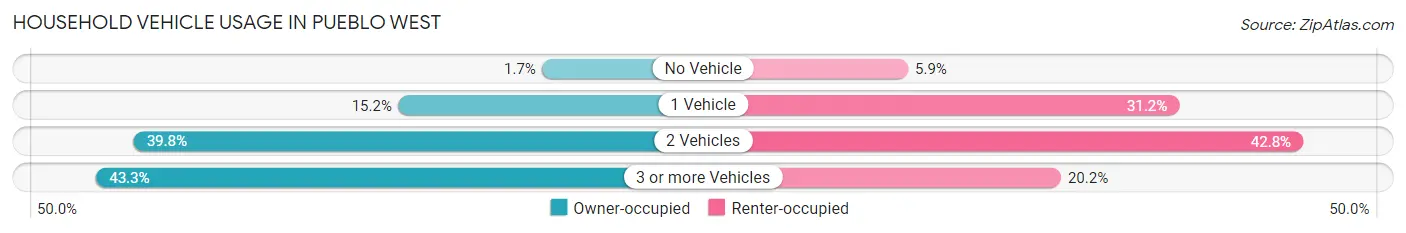
| Vehicles per Household | Owner-occupied | Renter-occupied |
| No Vehicle | 180 (1.7%) | 100 (5.9%) |
| 1 Vehicle | 1,579 (15.2%) | 529 (31.2%) |
| 2 Vehicles | 4,145 (39.8%) | 725 (42.7%) |
| 3 or more Vehicles | 4,508 (43.3%) | 342 (20.2%) |
| Total | 10,412 (100.0%) | 1,696 (100.0%) |
Real Estate & Mortgages in Pueblo West
Real Estate and Mortgage Overview in Pueblo West
| Characteristic | Without Mortgage | With Mortgage |
| Housing Units | 2,565 | 7,847 |
| Median Property Value | $318,900 | $331,800 |
| Median Household Income | $72,917 | $1,890 |
| Monthly Housing Costs | $569 | $529 |
| Real Estate Taxes | $1,726 | $101 |
Property Value by Mortgage Status in Pueblo West
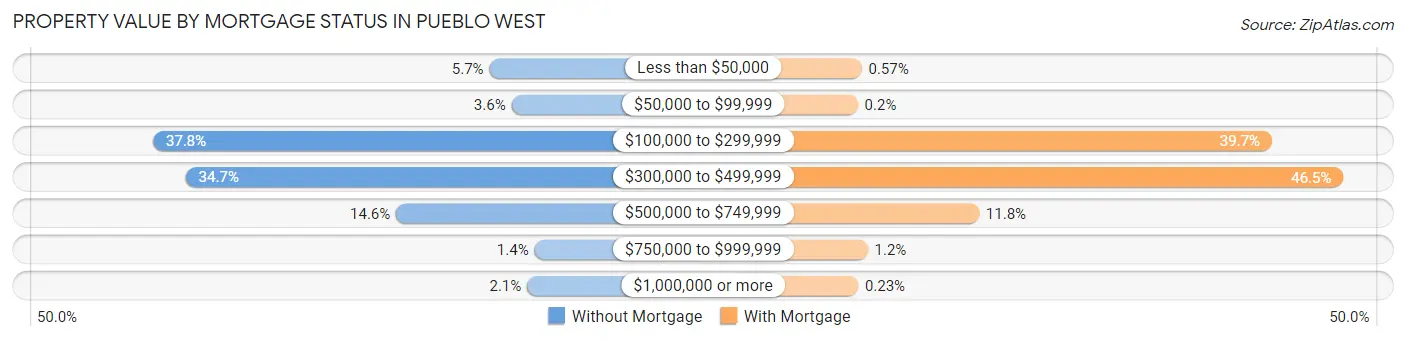
| Property Value | Without Mortgage | With Mortgage |
| Less than $50,000 | 147 (5.7%) | 45 (0.6%) |
| $50,000 to $99,999 | 93 (3.6%) | 16 (0.2%) |
| $100,000 to $299,999 | 969 (37.8%) | 3,111 (39.7%) |
| $300,000 to $499,999 | 889 (34.7%) | 3,645 (46.5%) |
| $500,000 to $749,999 | 375 (14.6%) | 922 (11.7%) |
| $750,000 to $999,999 | 37 (1.4%) | 90 (1.1%) |
| $1,000,000 or more | 55 (2.1%) | 18 (0.2%) |
| Total | 2,565 (100.0%) | 7,847 (100.0%) |
Household Income by Mortgage Status in Pueblo West
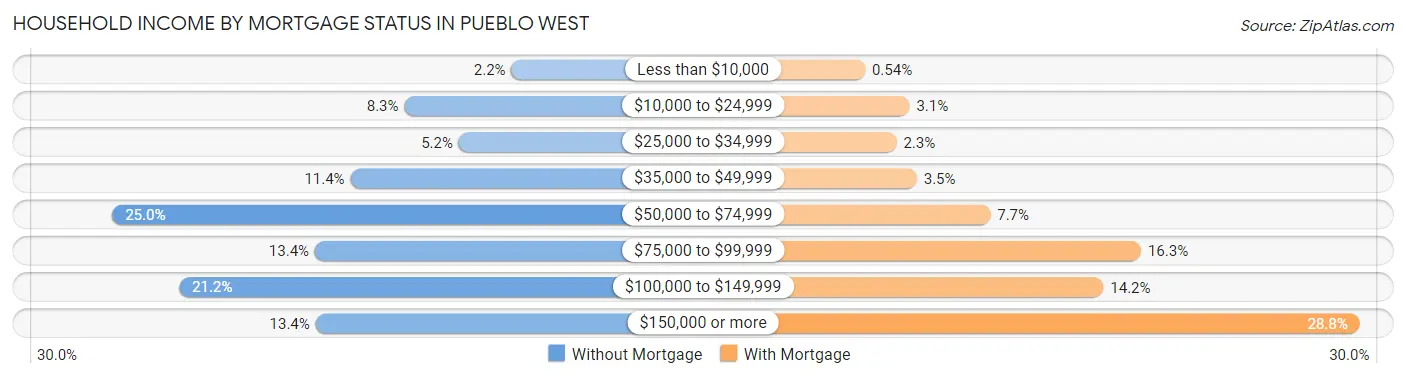
| Household Income | Without Mortgage | With Mortgage |
| Less than $10,000 | 56 (2.2%) | 42 (0.5%) |
| $10,000 to $24,999 | 213 (8.3%) | 242 (3.1%) |
| $25,000 to $34,999 | 133 (5.2%) | 184 (2.3%) |
| $35,000 to $49,999 | 292 (11.4%) | 275 (3.5%) |
| $50,000 to $74,999 | 641 (25.0%) | 604 (7.7%) |
| $75,000 to $99,999 | 344 (13.4%) | 1,280 (16.3%) |
| $100,000 to $149,999 | 543 (21.2%) | 1,111 (14.2%) |
| $150,000 or more | 343 (13.4%) | 2,261 (28.8%) |
| Total | 2,565 (100.0%) | 7,847 (100.0%) |
Property Value to Household Income Ratio in Pueblo West
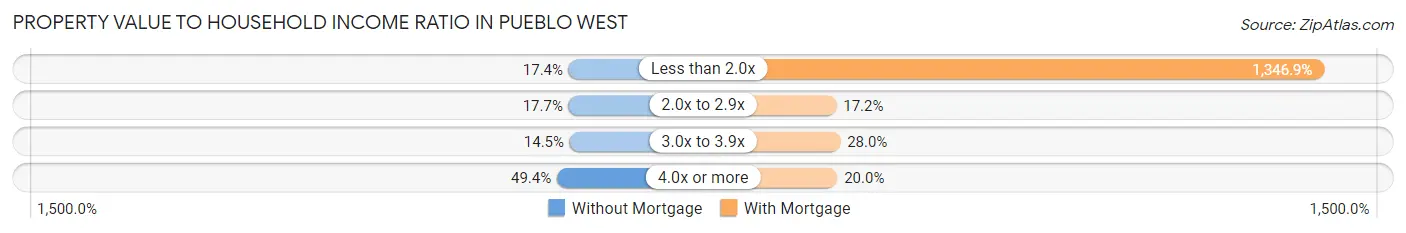
| Value-to-Income Ratio | Without Mortgage | With Mortgage |
| Less than 2.0x | 446 (17.4%) | 105,687 (1,346.9%) |
| 2.0x to 2.9x | 454 (17.7%) | 1,353 (17.2%) |
| 3.0x to 3.9x | 373 (14.5%) | 2,195 (28.0%) |
| 4.0x or more | 1,268 (49.4%) | 1,569 (20.0%) |
| Total | 2,565 (100.0%) | 7,847 (100.0%) |
Real Estate Taxes by Mortgage Status in Pueblo West

| Property Taxes | Without Mortgage | With Mortgage |
| Less than $800 | 404 (15.8%) | 88 (1.1%) |
| $800 to $1,499 | 539 (21.0%) | 308 (3.9%) |
| $800 to $1,499 | 1,556 (60.7%) | 2,291 (29.2%) |
| Total | 2,565 (100.0%) | 7,847 (100.0%) |
Health & Disability in Pueblo West
Health Insurance Coverage by Age in Pueblo West
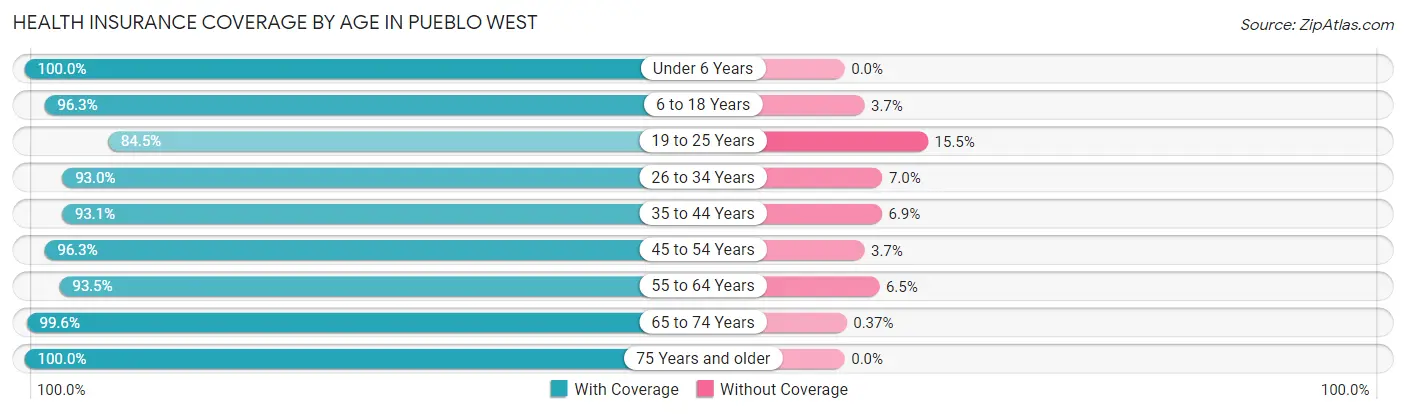
| Age Bracket | With Coverage | Without Coverage |
| Under 6 Years | 1,919 (100.0%) | 0 (0.0%) |
| 6 to 18 Years | 6,382 (96.3%) | 244 (3.7%) |
| 19 to 25 Years | 2,060 (84.5%) | 379 (15.5%) |
| 26 to 34 Years | 3,561 (93.0%) | 269 (7.0%) |
| 35 to 44 Years | 3,994 (93.1%) | 298 (6.9%) |
| 45 to 54 Years | 4,924 (96.3%) | 188 (3.7%) |
| 55 to 64 Years | 3,975 (93.5%) | 275 (6.5%) |
| 65 to 74 Years | 3,753 (99.6%) | 14 (0.4%) |
| 75 Years and older | 2,035 (100.0%) | 0 (0.0%) |
| Total | 32,603 (95.1%) | 1,667 (4.9%) |
Health Insurance Coverage by Citizenship Status in Pueblo West

| Citizenship Status | With Coverage | Without Coverage |
| Native Born | 1,919 (100.0%) | 0 (0.0%) |
| Foreign Born, Citizen | 6,382 (96.3%) | 244 (3.7%) |
| Foreign Born, not a Citizen | 2,060 (84.5%) | 379 (15.5%) |
Health Insurance Coverage by Household Income in Pueblo West
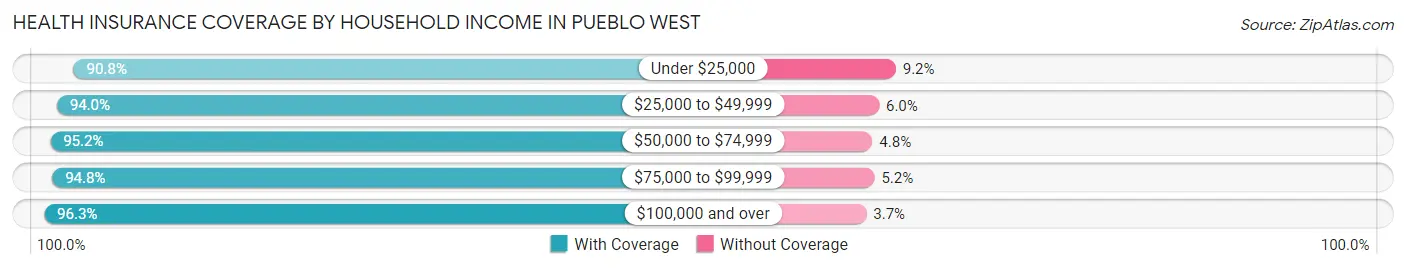
| Household Income | With Coverage | Without Coverage |
| Under $25,000 | 1,850 (90.8%) | 187 (9.2%) |
| $25,000 to $49,999 | 3,811 (94.0%) | 245 (6.0%) |
| $50,000 to $74,999 | 5,291 (95.2%) | 267 (4.8%) |
| $75,000 to $99,999 | 4,227 (94.8%) | 231 (5.2%) |
| $100,000 and over | 17,295 (96.3%) | 659 (3.7%) |
Public vs Private Health Insurance Coverage by Age in Pueblo West
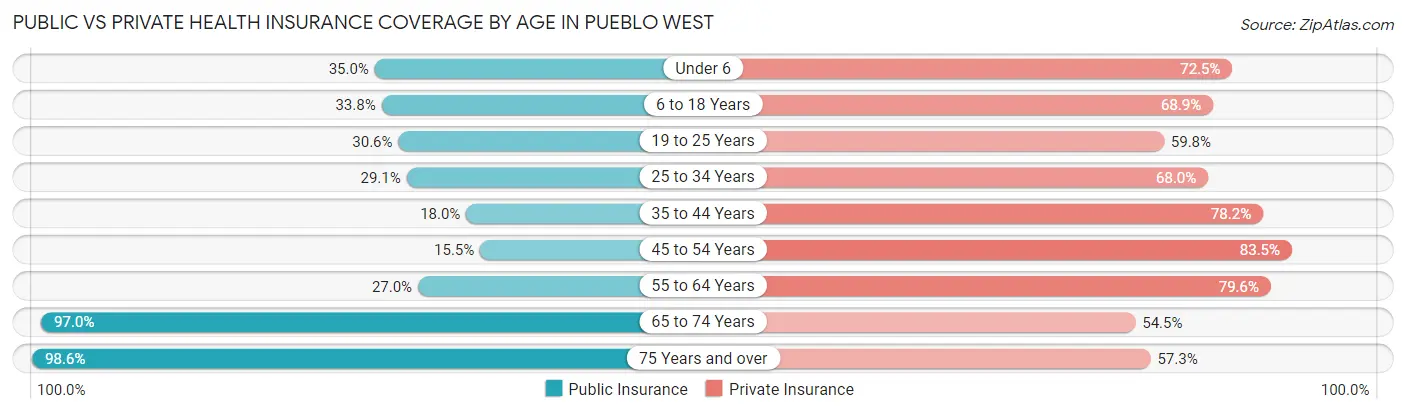
| Age Bracket | Public Insurance | Private Insurance |
| Under 6 | 672 (35.0%) | 1,391 (72.5%) |
| 6 to 18 Years | 2,237 (33.8%) | 4,565 (68.9%) |
| 19 to 25 Years | 747 (30.6%) | 1,458 (59.8%) |
| 25 to 34 Years | 1,115 (29.1%) | 2,604 (68.0%) |
| 35 to 44 Years | 774 (18.0%) | 3,355 (78.2%) |
| 45 to 54 Years | 790 (15.4%) | 4,270 (83.5%) |
| 55 to 64 Years | 1,147 (27.0%) | 3,384 (79.6%) |
| 65 to 74 Years | 3,652 (97.0%) | 2,052 (54.5%) |
| 75 Years and over | 2,007 (98.6%) | 1,166 (57.3%) |
| Total | 13,141 (38.4%) | 24,245 (70.8%) |
Disability Status by Sex by Age in Pueblo West
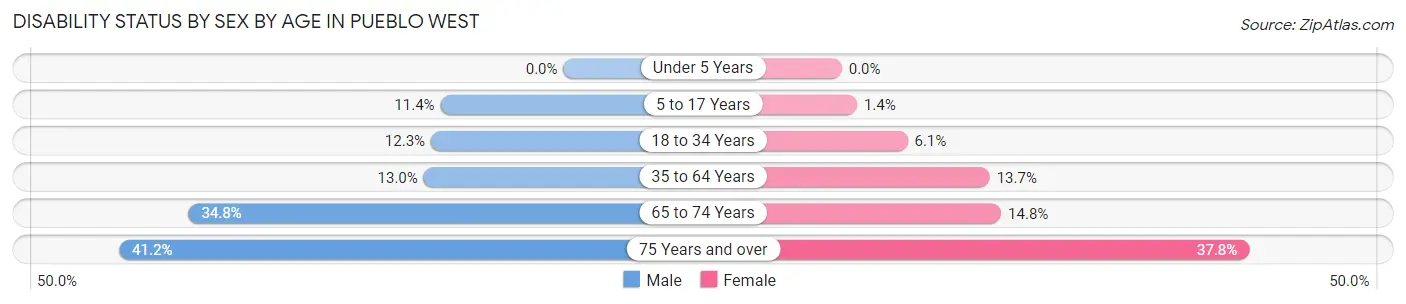
| Age Bracket | Male | Female |
| Under 5 Years | 0 (0.0%) | 0 (0.0%) |
| 5 to 17 Years | 381 (11.4%) | 48 (1.4%) |
| 18 to 34 Years | 397 (12.3%) | 205 (6.1%) |
| 35 to 64 Years | 879 (13.0%) | 944 (13.7%) |
| 65 to 74 Years | 645 (34.8%) | 283 (14.8%) |
| 75 Years and over | 420 (41.2%) | 384 (37.8%) |
Disability Class by Sex by Age in Pueblo West
Disability Class: Hearing Difficulty
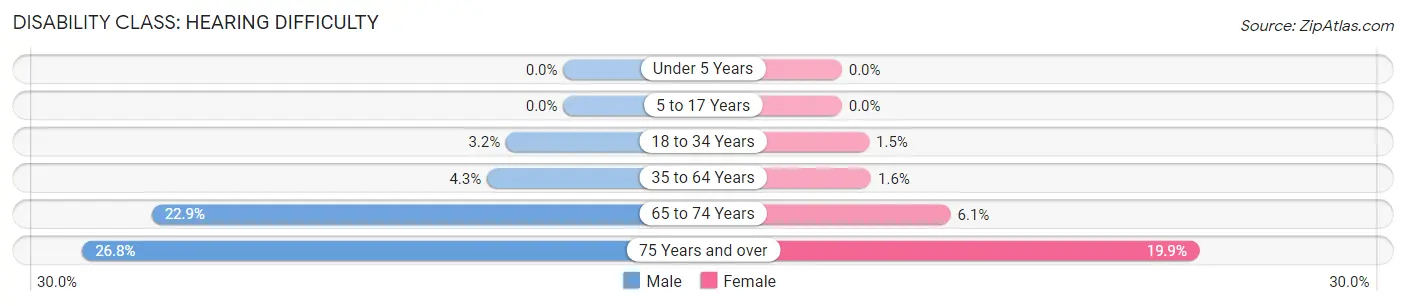
| Age Bracket | Male | Female |
| Under 5 Years | 0 (0.0%) | 0 (0.0%) |
| 5 to 17 Years | 0 (0.0%) | 0 (0.0%) |
| 18 to 34 Years | 103 (3.2%) | 51 (1.5%) |
| 35 to 64 Years | 288 (4.3%) | 112 (1.6%) |
| 65 to 74 Years | 425 (22.9%) | 116 (6.1%) |
| 75 Years and over | 273 (26.8%) | 202 (19.9%) |
Disability Class: Vision Difficulty
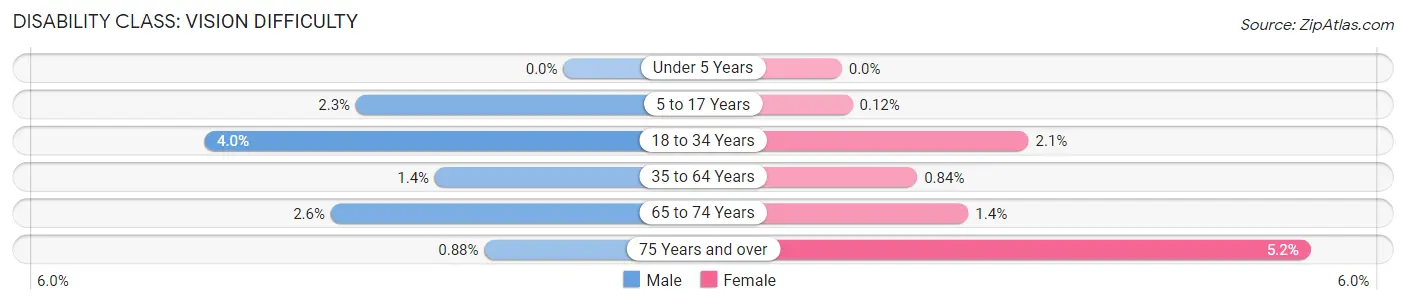
| Age Bracket | Male | Female |
| Under 5 Years | 0 (0.0%) | 0 (0.0%) |
| 5 to 17 Years | 77 (2.3%) | 4 (0.1%) |
| 18 to 34 Years | 129 (4.0%) | 70 (2.1%) |
| 35 to 64 Years | 97 (1.4%) | 58 (0.8%) |
| 65 to 74 Years | 48 (2.6%) | 27 (1.4%) |
| 75 Years and over | 9 (0.9%) | 53 (5.2%) |
Disability Class: Cognitive Difficulty
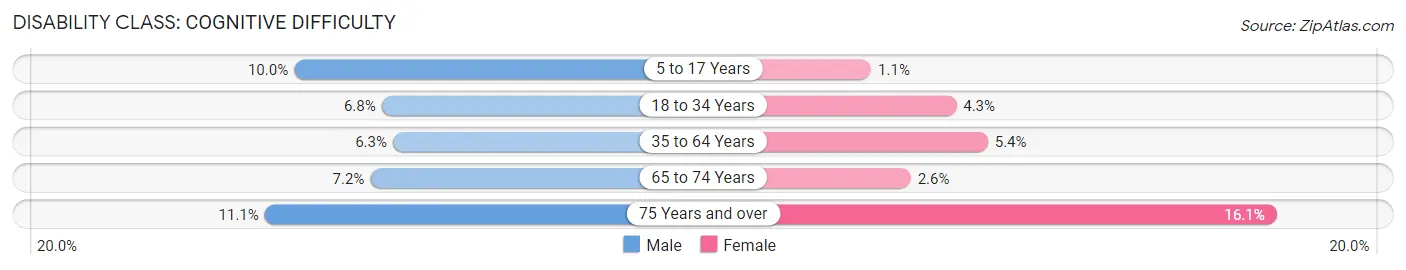
| Age Bracket | Male | Female |
| 5 to 17 Years | 334 (10.0%) | 37 (1.1%) |
| 18 to 34 Years | 218 (6.8%) | 143 (4.3%) |
| 35 to 64 Years | 429 (6.3%) | 373 (5.4%) |
| 65 to 74 Years | 133 (7.2%) | 49 (2.6%) |
| 75 Years and over | 113 (11.1%) | 164 (16.1%) |
Disability Class: Ambulatory Difficulty
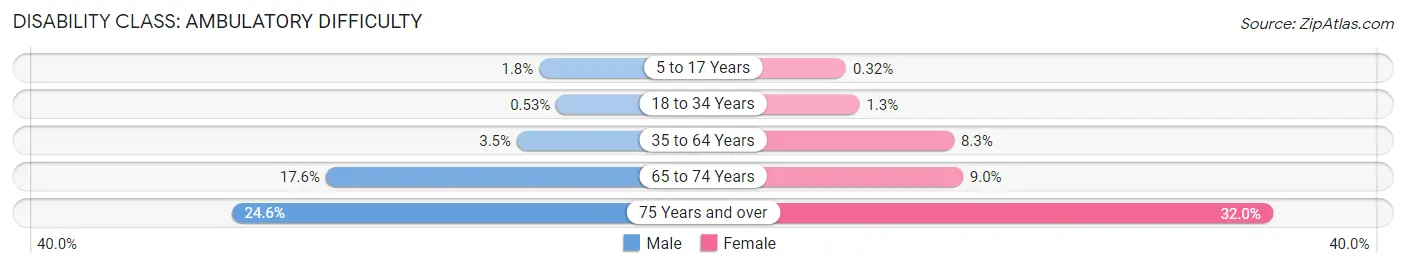
| Age Bracket | Male | Female |
| 5 to 17 Years | 60 (1.8%) | 11 (0.3%) |
| 18 to 34 Years | 17 (0.5%) | 44 (1.3%) |
| 35 to 64 Years | 234 (3.5%) | 573 (8.3%) |
| 65 to 74 Years | 327 (17.6%) | 172 (9.0%) |
| 75 Years and over | 251 (24.6%) | 325 (32.0%) |
Disability Class: Self-Care Difficulty
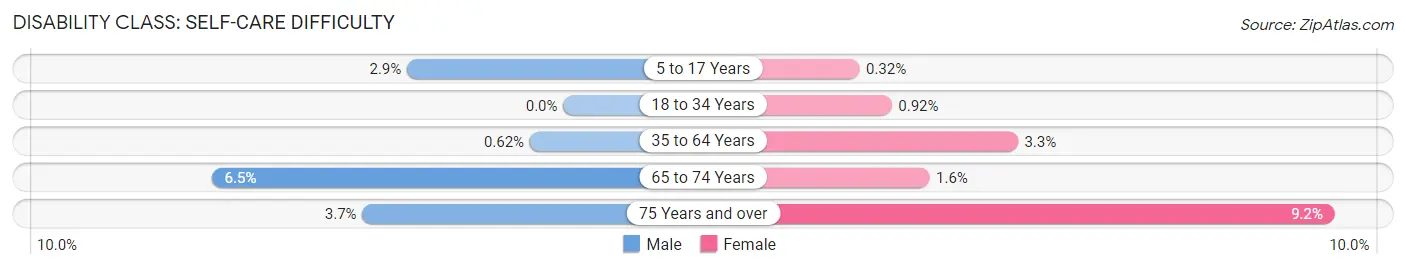
| Age Bracket | Male | Female |
| 5 to 17 Years | 97 (2.9%) | 11 (0.3%) |
| 18 to 34 Years | 0 (0.0%) | 31 (0.9%) |
| 35 to 64 Years | 42 (0.6%) | 224 (3.3%) |
| 65 to 74 Years | 121 (6.5%) | 31 (1.6%) |
| 75 Years and over | 38 (3.7%) | 93 (9.1%) |
Technology Access in Pueblo West
Computing Device Access in Pueblo West
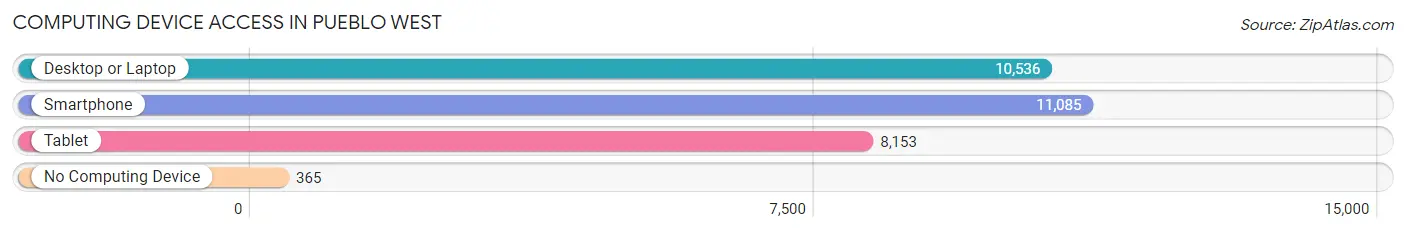
| Device Type | # Households | % Households |
| Desktop or Laptop | 10,536 | 87.0% |
| Smartphone | 11,085 | 91.5% |
| Tablet | 8,153 | 67.3% |
| No Computing Device | 365 | 3.0% |
| Total | 12,108 | 100.0% |
Internet Access in Pueblo West
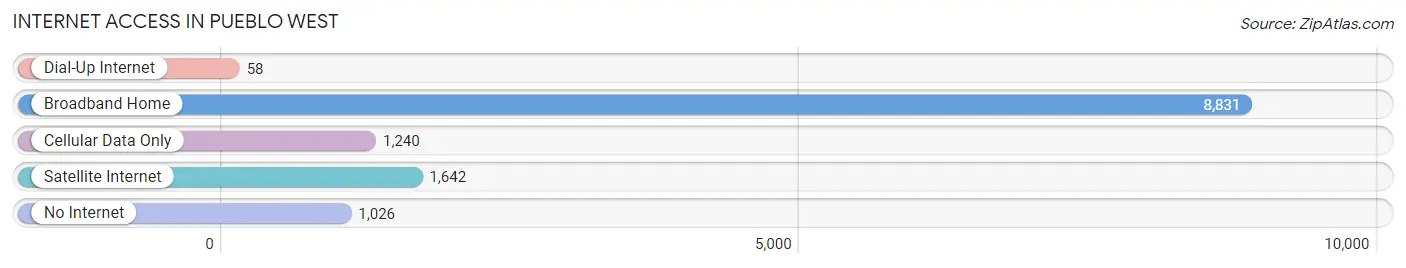
| Internet Type | # Households | % Households |
| Dial-Up Internet | 58 | 0.5% |
| Broadband Home | 8,831 | 72.9% |
| Cellular Data Only | 1,240 | 10.2% |
| Satellite Internet | 1,642 | 13.6% |
| No Internet | 1,026 | 8.5% |
| Total | 12,108 | 100.0% |
Pueblo West Summary
Pueblo West is an unincorporated community located in Pueblo County, Colorado, United States. It is situated on the western edge of the city of Pueblo, approximately 10 miles (16 km) southwest of the city center. The community was established in 1970 as a planned community and is the largest suburb of Pueblo.
History
Pueblo West was established in 1970 as a planned community. The idea for the community was conceived by local businessman and philanthropist, Charles Bishop, who wanted to create a community that would provide affordable housing and a better quality of life for the people of Pueblo. Bishop purchased the land for the community and donated it to the Pueblo West Metropolitan District, which was formed to manage the development of the community.
The first homes in Pueblo West were built in 1971 and the community has grown steadily since then. The population of Pueblo West was estimated to be around 33,000 in 2020.
Geography
Pueblo West is located in Pueblo County, Colorado, approximately 10 miles (16 km) southwest of the city of Pueblo. The community is situated on the western edge of the city and is bordered by the Arkansas River to the north and the St. Charles River to the south. The community covers an area of approximately 25 square miles (65 km2).
The terrain of Pueblo West is mostly flat, with some rolling hills in the northern and western parts of the community. The climate is semi-arid, with hot summers and cold winters.
Economy
Pueblo West is primarily a residential community, but it also has a thriving business sector. The community is home to a variety of businesses, including retail stores, restaurants, and professional services. The largest employers in the community are the Pueblo West Metropolitan District, the Pueblo West Fire Department, and the Pueblo West Medical Center.
Demographics
As of the 2020 census, the population of Pueblo West was estimated to be 33,000. The racial makeup of the community was 79.3% White, 1.3% African American, 0.7% Native American, 1.2% Asian, 0.1% Pacific Islander, 14.2% from other races, and 3.4% from two or more races. Hispanic or Latino of any race were 24.3% of the population.
The median household income in Pueblo West was $60,945 in 2020, and the median home value was $246,000. The unemployment rate in the community was 4.2%.
Conclusion
Pueblo West is an unincorporated community located in Pueblo County, Colorado, United States. It was established in 1970 as a planned community and is the largest suburb of Pueblo. The community covers an area of approximately 25 square miles (65 km2) and has a population of around 33,000. The economy of Pueblo West is primarily residential, but it also has a thriving business sector. The racial makeup of the community is 79.3% White, 1.3% African American, 0.7% Native American, 1.2% Asian, 0.1% Pacific Islander, 14.2% from other races, and 3.4% from two or more races. The median household income in Pueblo West was $60,945 in 2020, and the median home value was $246,000.
Common Questions
What is Per Capita Income in Pueblo West?
Per Capita income in Pueblo West is $37,197.
What is the Median Family Income in Pueblo West?
Median Family Income in Pueblo West is $100,972.
What is the Median Household income in Pueblo West?
Median Household Income in Pueblo West is $89,530.
What is Income or Wage Gap in Pueblo West?
Income or Wage Gap in Pueblo West is 34.5%.
Women in Pueblo West earn 65.5 cents for every dollar earned by a man.
What is Inequality or Gini Index in Pueblo West?
Inequality or Gini Index in Pueblo West is 0.37.
What is the Total Population of Pueblo West?
Total Population of Pueblo West is 34,337.
What is the Total Male Population of Pueblo West?
Total Male Population of Pueblo West is 17,001.
What is the Total Female Population of Pueblo West?
Total Female Population of Pueblo West is 17,336.
What is the Ratio of Males per 100 Females in Pueblo West?
There are 98.07 Males per 100 Females in Pueblo West.
What is the Ratio of Females per 100 Males in Pueblo West?
There are 101.97 Females per 100 Males in Pueblo West.
What is the Median Population Age in Pueblo West?
Median Population Age in Pueblo West is 40.7 Years.
What is the Average Family Size in Pueblo West
Average Family Size in Pueblo West is 3.2 People.
What is the Average Household Size in Pueblo West
Average Household Size in Pueblo West is 2.8 People.
How Large is the Labor Force in Pueblo West?
There are 16,652 People in the Labor Forcein in Pueblo West.
What is the Percentage of People in the Labor Force in Pueblo West?
61.2% of People are in the Labor Force in Pueblo West.
What is the Unemployment Rate in Pueblo West?
Unemployment Rate in Pueblo West is 4.4%.