Longmont, CO Map & Demographics
Longmont Map
Longmont Overview
$45,482
PER CAPITA INCOME
$112,262
AVG FAMILY INCOME
$89,720
AVG HOUSEHOLD INCOME
35.0%
WAGE / INCOME GAP [ % ]
65.0¢/ $1
WAGE / INCOME GAP [ $ ]
$9,118
FAMILY INCOME DEFICIT
0.42
INEQUALITY / GINI INDEX
98,282
TOTAL POPULATION
48,880
MALE POPULATION
49,402
FEMALE POPULATION
98.94
MALES / 100 FEMALES
101.07
FEMALES / 100 MALES
39.7
MEDIAN AGE
3.1
AVG FAMILY SIZE
2.4
AVG HOUSEHOLD SIZE
55,417
LABOR FORCE [ PEOPLE ]
68.6%
PERCENT IN LABOR FORCE
4.1%
UNEMPLOYMENT RATE
Income in Longmont
Income Overview in Longmont
Per Capita Income in Longmont is $45,482, while median incomes of families and households are $112,262 and $89,720 respectively.
| Characteristic | Number | Measure |
| Per Capita Income | 98,282 | $45,482 |
| Median Family Income | 24,391 | $112,262 |
| Mean Family Income | 24,391 | $131,372 |
| Median Household Income | 39,939 | $89,720 |
| Mean Household Income | 39,939 | $110,057 |
| Income Deficit | 24,391 | $9,118 |
| Wage / Income Gap (%) | 98,282 | 34.97% |
| Wage / Income Gap ($) | 98,282 | 65.03¢ per $1 |
| Gini / Inequality Index | 98,282 | 0.42 |
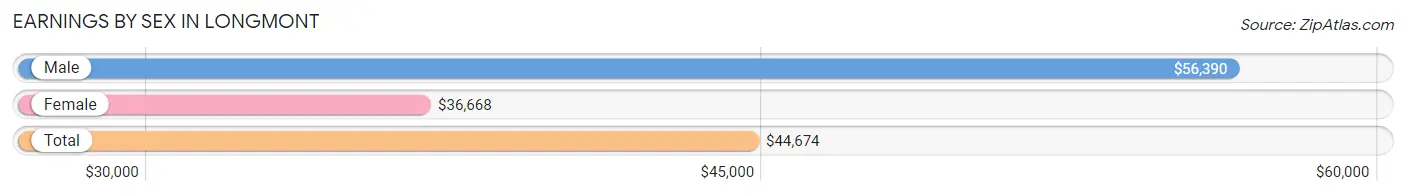
Earnings by Sex in Longmont
Average Earnings in Longmont are $44,674, $56,390 for men and $36,668 for women, a difference of 35.0%.
| Sex | Number | Average Earnings |
| Male | 30,610 (52.6%) | $56,390 |
| Female | 27,616 (47.4%) | $36,668 |
| Total | 58,226 (100.0%) | $44,674 |
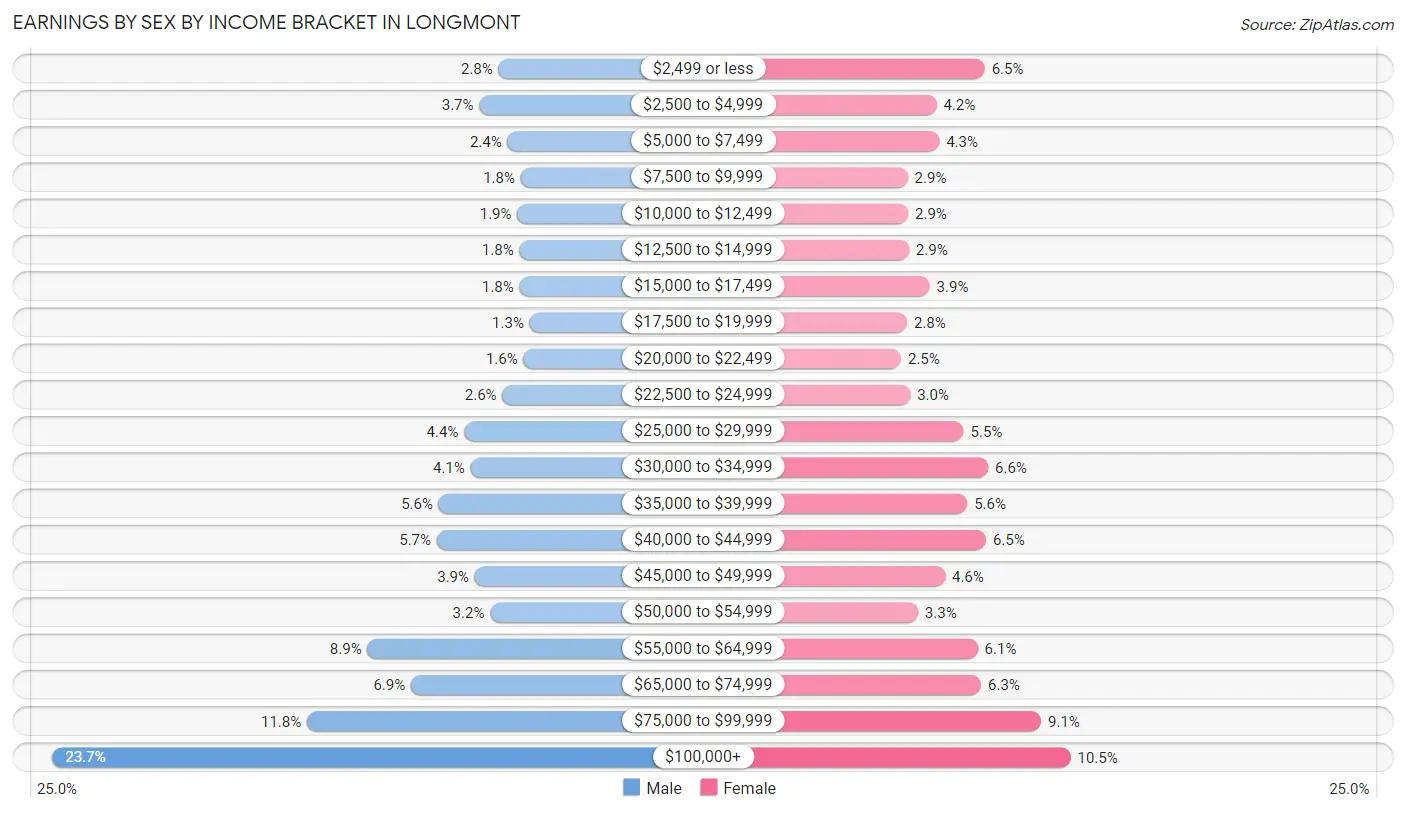
Earnings by Sex by Income Bracket in Longmont
The most common earnings brackets in Longmont are $100,000+ for men (7,256 | 23.7%) and $100,000+ for women (2,895 | 10.5%).
| Income | Male | Female |
| $2,499 or less | 856 (2.8%) | 1,784 (6.5%) |
| $2,500 to $4,999 | 1,134 (3.7%) | 1,159 (4.2%) |
| $5,000 to $7,499 | 729 (2.4%) | 1,195 (4.3%) |
| $7,500 to $9,999 | 540 (1.8%) | 786 (2.9%) |
| $10,000 to $12,499 | 588 (1.9%) | 792 (2.9%) |
| $12,500 to $14,999 | 557 (1.8%) | 805 (2.9%) |
| $15,000 to $17,499 | 556 (1.8%) | 1,072 (3.9%) |
| $17,500 to $19,999 | 410 (1.3%) | 778 (2.8%) |
| $20,000 to $22,499 | 499 (1.6%) | 701 (2.5%) |
| $22,500 to $24,999 | 801 (2.6%) | 820 (3.0%) |
| $25,000 to $29,999 | 1,349 (4.4%) | 1,511 (5.5%) |
| $30,000 to $34,999 | 1,258 (4.1%) | 1,828 (6.6%) |
| $35,000 to $39,999 | 1,713 (5.6%) | 1,558 (5.6%) |
| $40,000 to $44,999 | 1,741 (5.7%) | 1,800 (6.5%) |
| $45,000 to $49,999 | 1,197 (3.9%) | 1,269 (4.6%) |
| $50,000 to $54,999 | 975 (3.2%) | 919 (3.3%) |
| $55,000 to $64,999 | 2,736 (8.9%) | 1,693 (6.1%) |
| $65,000 to $74,999 | 2,112 (6.9%) | 1,737 (6.3%) |
| $75,000 to $99,999 | 3,603 (11.8%) | 2,514 (9.1%) |
| $100,000+ | 7,256 (23.7%) | 2,895 (10.5%) |
| Total | 30,610 (100.0%) | 27,616 (100.0%) |
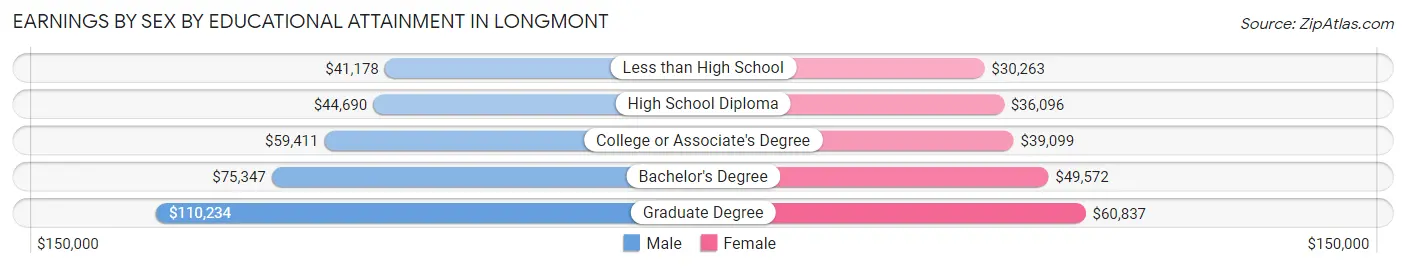
Earnings by Sex by Educational Attainment in Longmont
Average earnings in Longmont are $63,427 for men and $41,810 for women, a difference of 34.1%. Men with an educational attainment of graduate degree enjoy the highest average annual earnings of $110,234, while those with less than high school education earn the least with $41,178. Women with an educational attainment of graduate degree earn the most with the average annual earnings of $60,837, while those with less than high school education have the smallest earnings of $30,263.
| Educational Attainment | Male Income | Female Income |
| Less than High School | $41,178 | $30,263 |
| High School Diploma | $44,690 | $36,096 |
| College or Associate's Degree | $59,411 | $39,099 |
| Bachelor's Degree | $75,347 | $49,572 |
| Graduate Degree | $110,234 | $60,837 |
| Total | $63,427 | $41,810 |
Family Income in Longmont
Family Income Brackets in Longmont
According to the Longmont family income data, there are 6,732 families falling into the $100,000 to $149,999 income range, which is the most common income bracket and makes up 27.6% of all families. Conversely, the $10,000 to $14,999 income bracket is the least frequent group with only 195 families (0.8%) belonging to this category.
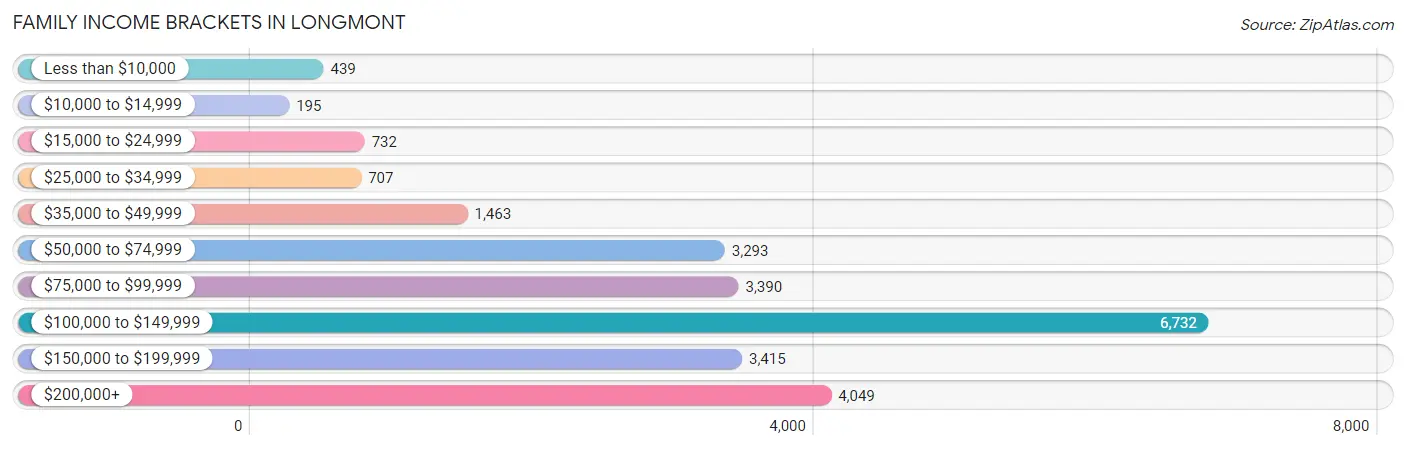
| Income Bracket | # Families | % Families |
| Less than $10,000 | 439 | 1.8% |
| $10,000 to $14,999 | 195 | 0.8% |
| $15,000 to $24,999 | 732 | 3.0% |
| $25,000 to $34,999 | 707 | 2.9% |
| $35,000 to $49,999 | 1,463 | 6.0% |
| $50,000 to $74,999 | 3,293 | 13.5% |
| $75,000 to $99,999 | 3,390 | 13.9% |
| $100,000 to $149,999 | 6,732 | 27.6% |
| $150,000 to $199,999 | 3,415 | 14.0% |
| $200,000+ | 4,049 | 16.6% |
Family Income by Famaliy Size in Longmont
4-person families (4,272 | 17.5%) account for the highest median family income in Longmont with $142,749 per family, while 2-person families (11,748 | 48.2%) have the highest median income of $48,884 per family member.
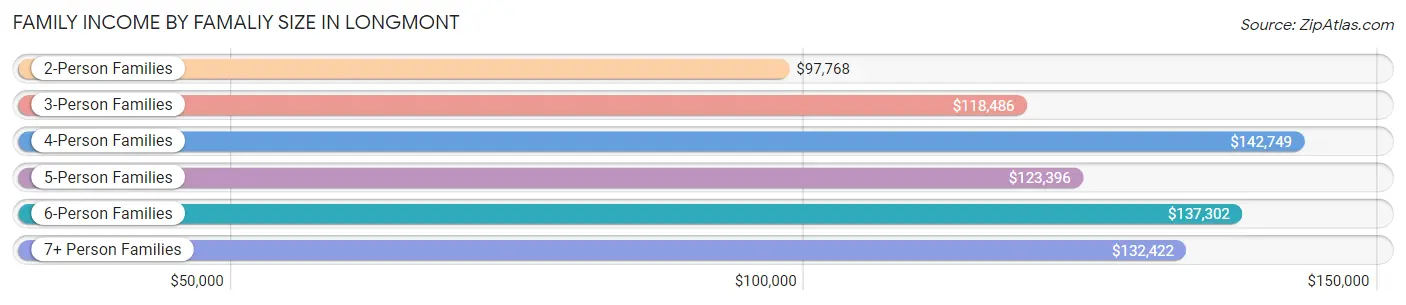
| Income Bracket | # Families | Median Income |
| 2-Person Families | 11,748 (48.2%) | $97,768 |
| 3-Person Families | 5,492 (22.5%) | $118,486 |
| 4-Person Families | 4,272 (17.5%) | $142,749 |
| 5-Person Families | 1,742 (7.1%) | $123,396 |
| 6-Person Families | 832 (3.4%) | $137,302 |
| 7+ Person Families | 305 (1.3%) | $132,422 |
| Total | 24,391 (100.0%) | $112,262 |
Family Income by Number of Earners in Longmont
The median family income in Longmont is $112,262, with families comprising 3+ earners (3,654) having the highest median family income of $152,466, while families with 1 earner (6,942) have the lowest median family income of $74,491, accounting for 15.0% and 28.5% of families, respectively.
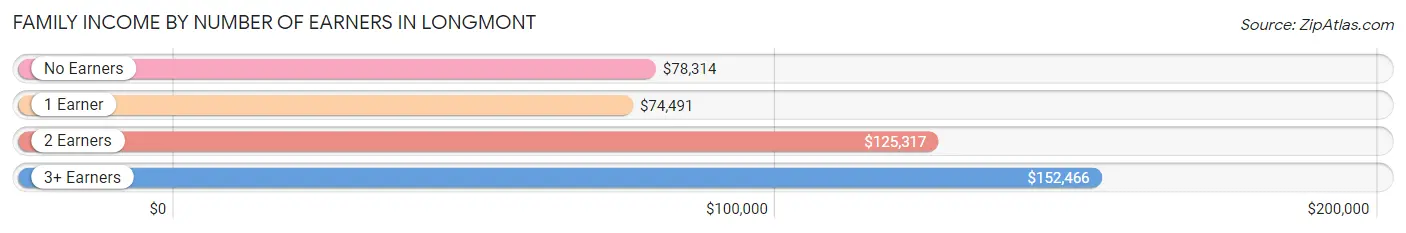
| Number of Earners | # Families | Median Income |
| No Earners | 2,690 (11.0%) | $78,314 |
| 1 Earner | 6,942 (28.5%) | $74,491 |
| 2 Earners | 11,105 (45.5%) | $125,317 |
| 3+ Earners | 3,654 (15.0%) | $152,466 |
| Total | 24,391 (100.0%) | $112,262 |
Household Income in Longmont
Household Income Brackets in Longmont
With 8,827 households falling in the category, the $100,000 to $149,999 income range is the most frequent in Longmont, accounting for 22.1% of all households. In contrast, only 959 households (2.4%) fall into the $10,000 to $14,999 income bracket, making it the least populous group.
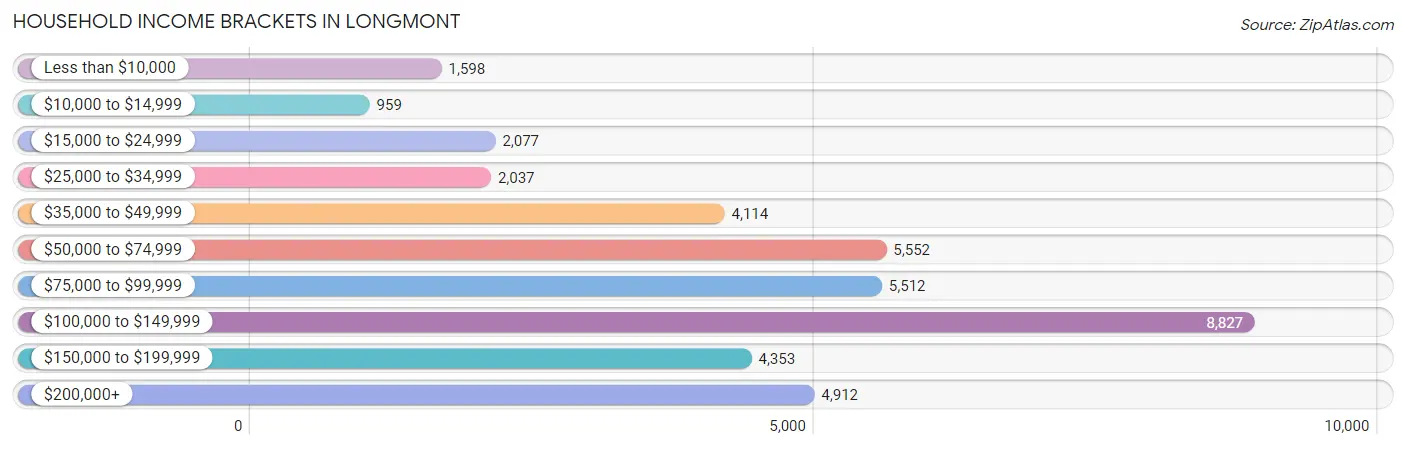
| Income Bracket | # Households | % Households |
| Less than $10,000 | 1,598 | 4.0% |
| $10,000 to $14,999 | 959 | 2.4% |
| $15,000 to $24,999 | 2,077 | 5.2% |
| $25,000 to $34,999 | 2,037 | 5.1% |
| $35,000 to $49,999 | 4,114 | 10.3% |
| $50,000 to $74,999 | 5,552 | 13.9% |
| $75,000 to $99,999 | 5,512 | 13.8% |
| $100,000 to $149,999 | 8,827 | 22.1% |
| $150,000 to $199,999 | 4,353 | 10.9% |
| $200,000+ | 4,912 | 12.3% |
Household Income by Householder Age in Longmont
The median household income in Longmont is $89,720, with the highest median household income of $111,237 found in the 45 to 64 years age bracket for the primary householder. A total of 13,848 households (34.7%) fall into this category. Meanwhile, the 15 to 24 years age bracket for the primary householder has the lowest median household income of $50,733, with 1,693 households (4.2%) in this group.
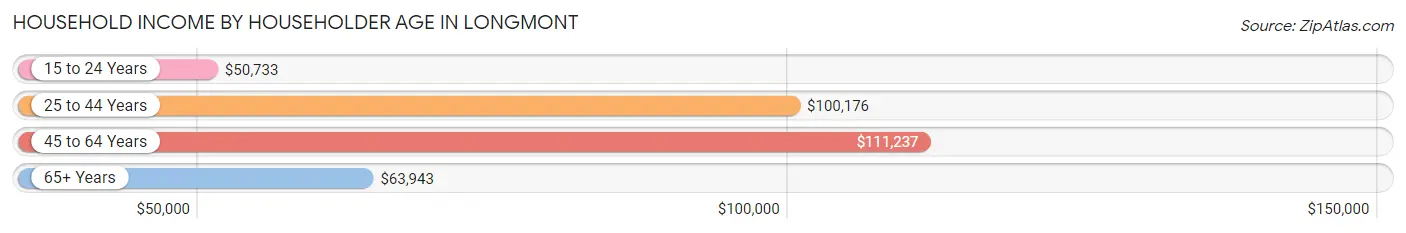
| Income Bracket | # Households | Median Income |
| 15 to 24 Years | 1,693 (4.2%) | $50,733 |
| 25 to 44 Years | 13,521 (33.9%) | $100,176 |
| 45 to 64 Years | 13,848 (34.7%) | $111,237 |
| 65+ Years | 10,877 (27.2%) | $63,943 |
| Total | 39,939 (100.0%) | $89,720 |
Poverty in Longmont
Income Below Poverty by Sex and Age in Longmont
With 7.3% poverty level for males and 8.2% for females among the residents of Longmont, under 5 year old males and 15 year old females are the most vulnerable to poverty, with 388 males (17.0%) and 125 females (13.2%) in their respective age groups living below the poverty level.
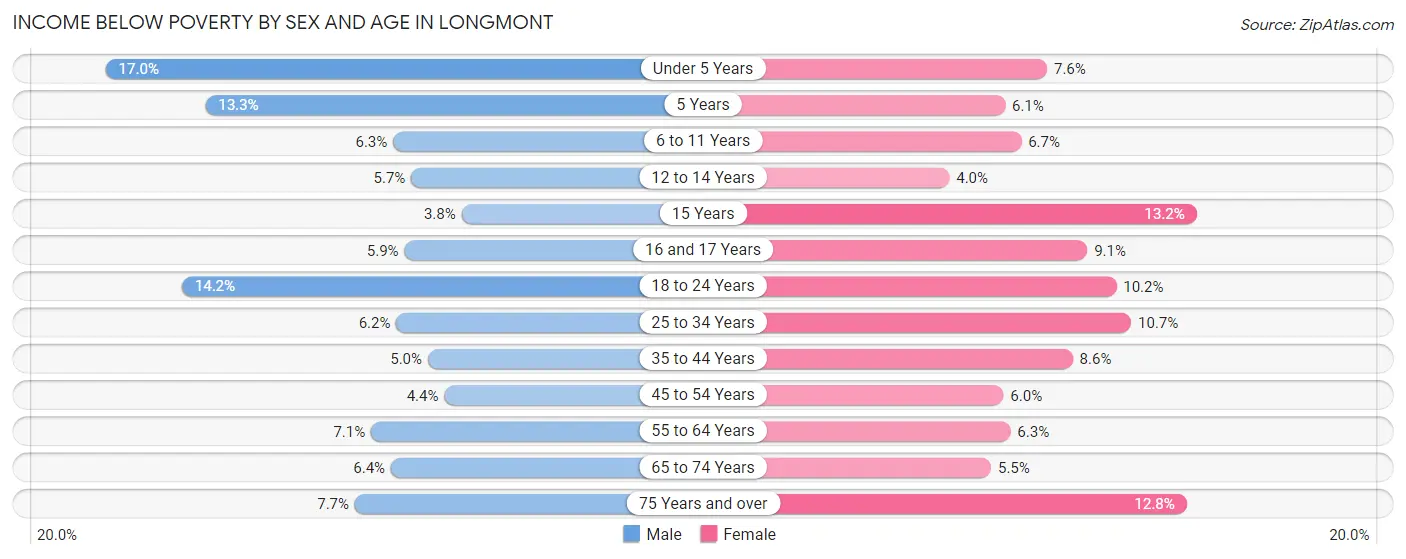
| Age Bracket | Male | Female |
| Under 5 Years | 388 (17.0%) | 200 (7.6%) |
| 5 Years | 93 (13.3%) | 32 (6.1%) |
| 6 to 11 Years | 217 (6.3%) | 168 (6.7%) |
| 12 to 14 Years | 115 (5.7%) | 58 (4.0%) |
| 15 Years | 27 (3.8%) | 125 (13.2%) |
| 16 and 17 Years | 84 (5.9%) | 106 (9.1%) |
| 18 to 24 Years | 637 (14.2%) | 449 (10.2%) |
| 25 to 34 Years | 422 (6.2%) | 726 (10.7%) |
| 35 to 44 Years | 354 (5.0%) | 548 (8.6%) |
| 45 to 54 Years | 281 (4.4%) | 355 (6.0%) |
| 55 to 64 Years | 444 (7.1%) | 424 (6.3%) |
| 65 to 74 Years | 296 (6.4%) | 297 (5.5%) |
| 75 Years and over | 188 (7.7%) | 520 (12.8%) |
| Total | 3,546 (7.3%) | 4,008 (8.2%) |
Income Above Poverty by Sex and Age in Longmont
According to the poverty statistics in Longmont, males aged 15 years and females aged 12 to 14 years are the age groups that are most secure financially, with 96.2% of males and 96.0% of females in these age groups living above the poverty line.
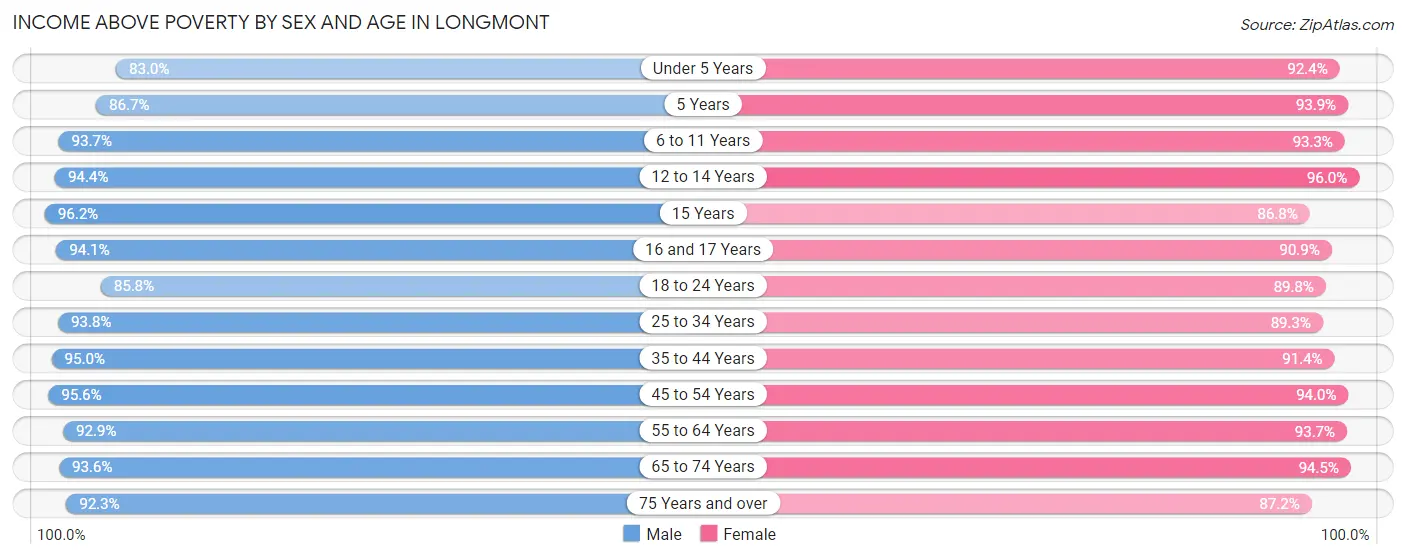
| Age Bracket | Male | Female |
| Under 5 Years | 1,896 (83.0%) | 2,425 (92.4%) |
| 5 Years | 607 (86.7%) | 496 (93.9%) |
| 6 to 11 Years | 3,214 (93.7%) | 2,356 (93.3%) |
| 12 to 14 Years | 1,921 (94.4%) | 1,397 (96.0%) |
| 15 Years | 688 (96.2%) | 824 (86.8%) |
| 16 and 17 Years | 1,339 (94.1%) | 1,057 (90.9%) |
| 18 to 24 Years | 3,862 (85.8%) | 3,956 (89.8%) |
| 25 to 34 Years | 6,384 (93.8%) | 6,034 (89.3%) |
| 35 to 44 Years | 6,684 (95.0%) | 5,845 (91.4%) |
| 45 to 54 Years | 6,075 (95.6%) | 5,565 (94.0%) |
| 55 to 64 Years | 5,772 (92.9%) | 6,346 (93.7%) |
| 65 to 74 Years | 4,331 (93.6%) | 5,061 (94.5%) |
| 75 Years and over | 2,240 (92.3%) | 3,542 (87.2%) |
| Total | 45,013 (92.7%) | 44,904 (91.8%) |
Income Below Poverty Among Married-Couple Families in Longmont
The poverty statistics for married-couple families in Longmont show that 1.8% or 335 of the total 18,694 families live below the poverty line. Families with 3 or 4 children have the highest poverty rate of 4.0%, comprising of 60 families. On the other hand, families with 5 or more children have the lowest poverty rate of 0.0%, which includes 0 families.
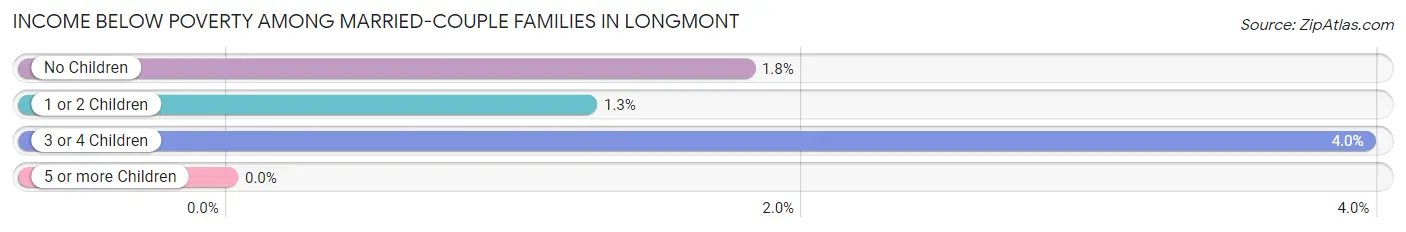
| Children | Above Poverty | Below Poverty |
| No Children | 10,868 (98.2%) | 199 (1.8%) |
| 1 or 2 Children | 5,981 (98.8%) | 76 (1.3%) |
| 3 or 4 Children | 1,454 (96.0%) | 60 (4.0%) |
| 5 or more Children | 56 (100.0%) | 0 (0.0%) |
| Total | 18,359 (98.2%) | 335 (1.8%) |
Income Below Poverty Among Single-Parent Households in Longmont
According to the poverty data in Longmont, 11.0% or 196 single-father households and 17.9% or 702 single-mother households are living below the poverty line. Among single-father households, those with 1 or 2 children have the highest poverty rate, with 118 households (12.7%) experiencing poverty. Likewise, among single-mother households, those with 1 or 2 children have the highest poverty rate, with 599 households (28.8%) falling below the poverty line.
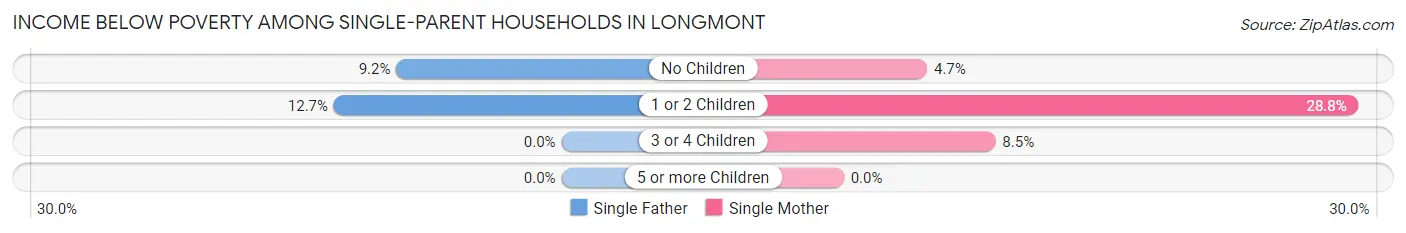
| Children | Single Father | Single Mother |
| No Children | 78 (9.2%) | 64 (4.7%) |
| 1 or 2 Children | 118 (12.7%) | 599 (28.8%) |
| 3 or 4 Children | 0 (0.0%) | 39 (8.5%) |
| 5 or more Children | 0 (0.0%) | 0 (0.0%) |
| Total | 196 (11.0%) | 702 (17.9%) |
Income Below Poverty Among Married-Couple vs Single-Parent Households in Longmont
The poverty data for Longmont shows that 335 of the married-couple family households (1.8%) and 898 of the single-parent households (15.8%) are living below the poverty level. Within the married-couple family households, those with 3 or 4 children have the highest poverty rate, with 60 households (4.0%) falling below the poverty line. Among the single-parent households, those with 1 or 2 children have the highest poverty rate, with 717 household (23.8%) living below poverty.
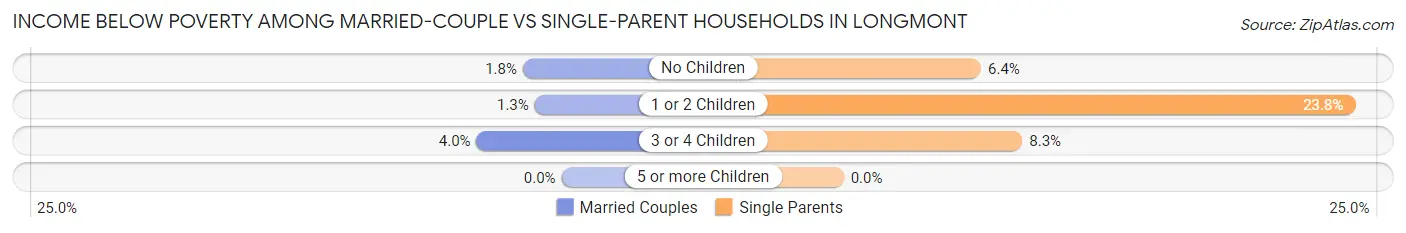
| Children | Married-Couple Families | Single-Parent Households |
| No Children | 199 (1.8%) | 142 (6.4%) |
| 1 or 2 Children | 76 (1.3%) | 717 (23.8%) |
| 3 or 4 Children | 60 (4.0%) | 39 (8.3%) |
| 5 or more Children | 0 (0.0%) | 0 (0.0%) |
| Total | 335 (1.8%) | 898 (15.8%) |
Race in Longmont
The most populous races in Longmont are White / Caucasian (79,404 | 80.8%), Hispanic or Latino (22,228 | 22.6%), and Two or more Races (9,708 | 9.9%).
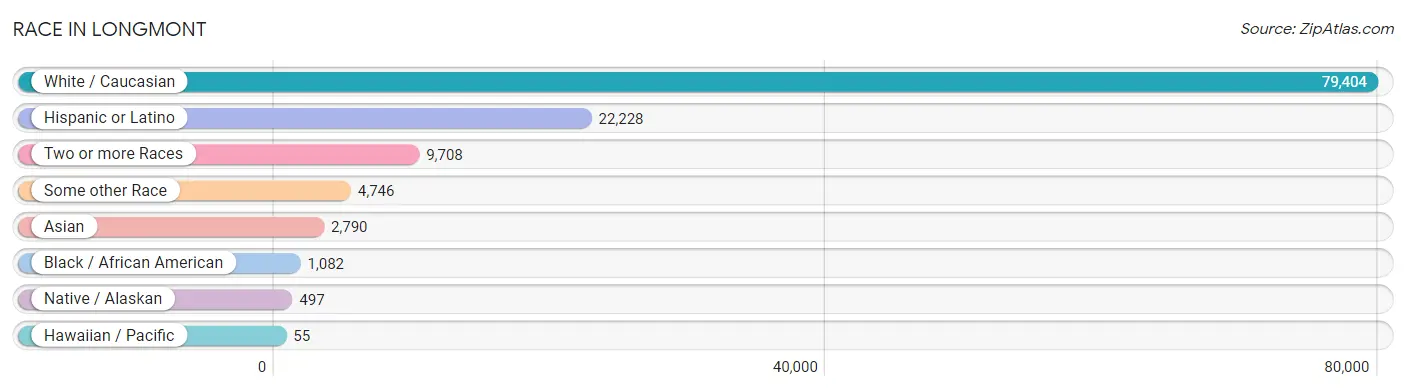
| Race | # Population | % Population |
| Asian | 2,790 | 2.8% |
| Black / African American | 1,082 | 1.1% |
| Hawaiian / Pacific | 55 | 0.1% |
| Hispanic or Latino | 22,228 | 22.6% |
| Native / Alaskan | 497 | 0.5% |
| White / Caucasian | 79,404 | 80.8% |
| Two or more Races | 9,708 | 9.9% |
| Some other Race | 4,746 | 4.8% |
| Total | 98,282 | 100.0% |
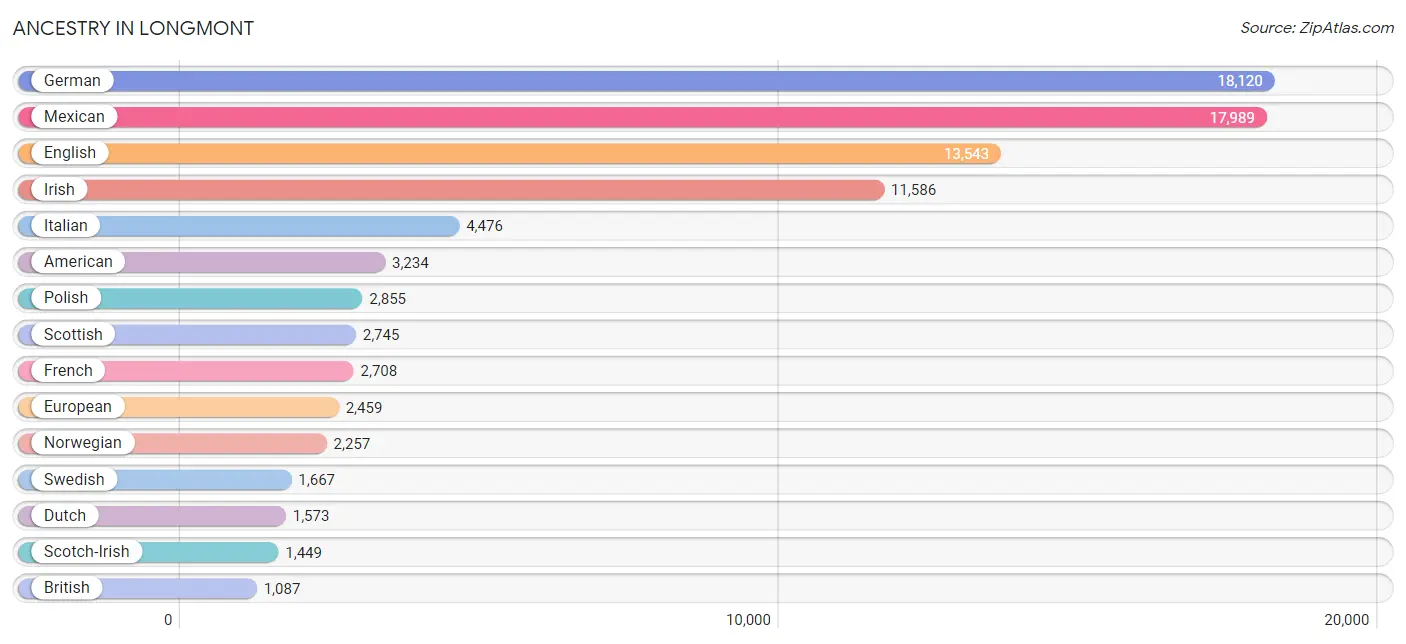
Ancestry in Longmont
The most populous ancestries reported in Longmont are German (18,120 | 18.4%), Mexican (17,989 | 18.3%), English (13,543 | 13.8%), Irish (11,586 | 11.8%), and Italian (4,476 | 4.5%), together accounting for 66.9% of all Longmont residents.
| Ancestry | # Population | % Population |
| African | 117 | 0.1% |
| Albanian | 10 | 0.0% |
| Alsatian | 13 | 0.0% |
| American | 3,234 | 3.3% |
| Apache | 204 | 0.2% |
| Arab | 339 | 0.3% |
| Argentinean | 27 | 0.0% |
| Armenian | 29 | 0.0% |
| Australian | 39 | 0.0% |
| Austrian | 310 | 0.3% |
| Bangladeshi | 19 | 0.0% |
| Basque | 36 | 0.0% |
| Belgian | 326 | 0.3% |
| Bhutanese | 384 | 0.4% |
| Blackfeet | 83 | 0.1% |
| Bolivian | 13 | 0.0% |
| Brazilian | 129 | 0.1% |
| British | 1,087 | 1.1% |
| Bulgarian | 50 | 0.1% |
| Burmese | 521 | 0.5% |
| Cajun | 5 | 0.0% |
| Canadian | 238 | 0.2% |
| Celtic | 123 | 0.1% |
| Central American | 820 | 0.8% |
| Central American Indian | 95 | 0.1% |
| Cherokee | 201 | 0.2% |
| Chilean | 117 | 0.1% |
| Chinese | 4 | 0.0% |
| Chippewa | 31 | 0.0% |
| Choctaw | 66 | 0.1% |
| Colombian | 163 | 0.2% |
| Comanche | 44 | 0.0% |
| Costa Rican | 48 | 0.1% |
| Creek | 10 | 0.0% |
| Croatian | 61 | 0.1% |
| Cuban | 220 | 0.2% |
| Czech | 448 | 0.5% |
| Czechoslovakian | 185 | 0.2% |
| Danish | 838 | 0.9% |
| Dominican | 21 | 0.0% |
| Dutch | 1,573 | 1.6% |
| Eastern European | 382 | 0.4% |
| Ecuadorian | 7 | 0.0% |
| Egyptian | 33 | 0.0% |
| English | 13,543 | 13.8% |
| Estonian | 28 | 0.0% |
| Ethiopian | 154 | 0.2% |
| European | 2,459 | 2.5% |
| Filipino | 7 | 0.0% |
| Finnish | 251 | 0.3% |
| French | 2,708 | 2.8% |
| French Canadian | 545 | 0.5% |
| German | 18,120 | 18.4% |
| German Russian | 10 | 0.0% |
| Greek | 443 | 0.4% |
| Guamanian / Chamorro | 17 | 0.0% |
| Guatemalan | 384 | 0.4% |
| Honduran | 342 | 0.4% |
| Hungarian | 423 | 0.4% |
| Icelander | 22 | 0.0% |
| Indian (Asian) | 961 | 1.0% |
| Iranian | 134 | 0.1% |
| Irish | 11,586 | 11.8% |
| Iroquois | 64 | 0.1% |
| Italian | 4,476 | 4.5% |
| Jamaican | 22 | 0.0% |
| Japanese | 128 | 0.1% |
| Jordanian | 17 | 0.0% |
| Korean | 729 | 0.7% |
| Laotian | 52 | 0.1% |
| Latvian | 10 | 0.0% |
| Lebanese | 112 | 0.1% |
| Lithuanian | 397 | 0.4% |
| Malaysian | 16 | 0.0% |
| Maltese | 28 | 0.0% |
| Mexican | 17,989 | 18.3% |
| Mexican American Indian | 223 | 0.2% |
| Mongolian | 8 | 0.0% |
| Moroccan | 170 | 0.2% |
| Native Hawaiian | 114 | 0.1% |
| Navajo | 98 | 0.1% |
| Nicaraguan | 8 | 0.0% |
| Nigerian | 16 | 0.0% |
| Northern European | 179 | 0.2% |
| Norwegian | 2,257 | 2.3% |
| Pakistani | 30 | 0.0% |
| Panamanian | 10 | 0.0% |
| Pennsylvania German | 64 | 0.1% |
| Peruvian | 228 | 0.2% |
| Polish | 2,855 | 2.9% |
| Portuguese | 217 | 0.2% |
| Potawatomi | 29 | 0.0% |
| Pueblo | 209 | 0.2% |
| Puerto Rican | 421 | 0.4% |
| Romanian | 122 | 0.1% |
| Russian | 942 | 1.0% |
| Salvadoran | 28 | 0.0% |
| Samoan | 14 | 0.0% |
| Scandinavian | 409 | 0.4% |
| Scotch-Irish | 1,449 | 1.5% |
| Scottish | 2,745 | 2.8% |
| Seminole | 10 | 0.0% |
| Senegalese | 5 | 0.0% |
| Serbian | 54 | 0.1% |
| Shoshone | 13 | 0.0% |
| Sioux | 171 | 0.2% |
| Slavic | 7 | 0.0% |
| Slovak | 134 | 0.1% |
| Slovene | 19 | 0.0% |
| South African | 77 | 0.1% |
| South American | 738 | 0.7% |
| South American Indian | 11 | 0.0% |
| Spaniard | 443 | 0.4% |
| Spanish | 724 | 0.7% |
| Spanish American | 28 | 0.0% |
| Sri Lankan | 441 | 0.4% |
| Subsaharan African | 376 | 0.4% |
| Swedish | 1,667 | 1.7% |
| Swiss | 445 | 0.4% |
| Thai | 348 | 0.4% |
| Turkish | 19 | 0.0% |
| Ukrainian | 429 | 0.4% |
| Uruguayan | 143 | 0.2% |
| Ute | 70 | 0.1% |
| Venezuelan | 40 | 0.0% |
| Welsh | 572 | 0.6% |
| West Indian | 21 | 0.0% |
| Yugoslavian | 113 | 0.1% | View All 128 Rows |
Immigrants in Longmont
The most numerous immigrant groups reported in Longmont came from Latin America (5,266 | 5.4%), Central America (4,547 | 4.6%), Mexico (4,237 | 4.3%), Asia (1,926 | 2.0%), and Europe (1,635 | 1.7%), together accounting for 17.9% of all Longmont residents.
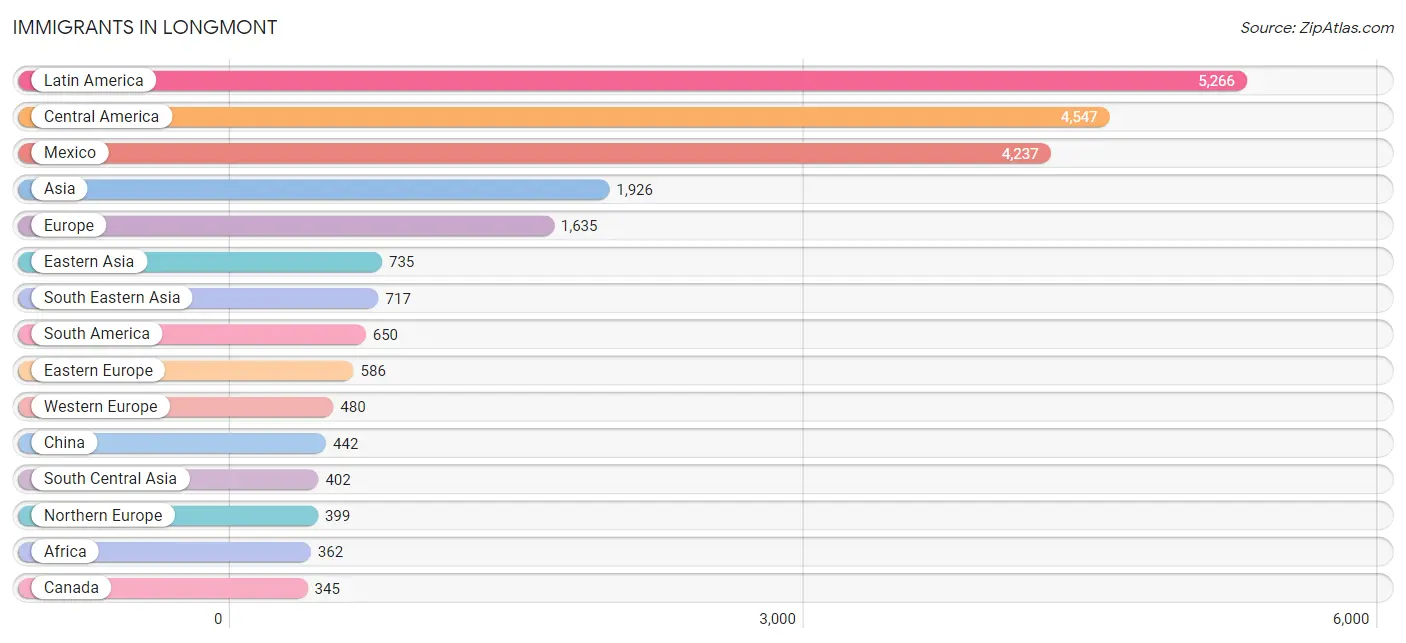
| Immigration Origin | # Population | % Population |
| Africa | 362 | 0.4% |
| Argentina | 27 | 0.0% |
| Asia | 1,926 | 2.0% |
| Bangladesh | 13 | 0.0% |
| Belgium | 24 | 0.0% |
| Bosnia and Herzegovina | 32 | 0.0% |
| Brazil | 62 | 0.1% |
| Bulgaria | 14 | 0.0% |
| Cambodia | 138 | 0.1% |
| Canada | 345 | 0.4% |
| Caribbean | 69 | 0.1% |
| Central America | 4,547 | 4.6% |
| Chile | 17 | 0.0% |
| China | 442 | 0.4% |
| Colombia | 151 | 0.2% |
| Costa Rica | 25 | 0.0% |
| Cuba | 18 | 0.0% |
| Czechoslovakia | 14 | 0.0% |
| Denmark | 20 | 0.0% |
| Dominican Republic | 29 | 0.0% |
| Eastern Africa | 205 | 0.2% |
| Eastern Asia | 735 | 0.7% |
| Eastern Europe | 586 | 0.6% |
| Ecuador | 14 | 0.0% |
| El Salvador | 9 | 0.0% |
| England | 132 | 0.1% |
| Ethiopia | 114 | 0.1% |
| Europe | 1,635 | 1.7% |
| France | 58 | 0.1% |
| Germany | 251 | 0.3% |
| Guatemala | 173 | 0.2% |
| Honduras | 103 | 0.1% |
| Hungary | 9 | 0.0% |
| India | 174 | 0.2% |
| Indonesia | 39 | 0.0% |
| Iran | 18 | 0.0% |
| Ireland | 15 | 0.0% |
| Italy | 9 | 0.0% |
| Jamaica | 22 | 0.0% |
| Japan | 50 | 0.1% |
| Kenya | 73 | 0.1% |
| Korea | 243 | 0.3% |
| Laos | 6 | 0.0% |
| Latin America | 5,266 | 5.4% |
| Lebanon | 72 | 0.1% |
| Lithuania | 7 | 0.0% |
| Malaysia | 82 | 0.1% |
| Mexico | 4,237 | 4.3% |
| Nepal | 172 | 0.2% |
| Netherlands | 41 | 0.0% |
| Northern Africa | 33 | 0.0% |
| Northern Europe | 399 | 0.4% |
| Norway | 14 | 0.0% |
| Oceania | 49 | 0.1% |
| Peru | 207 | 0.2% |
| Philippines | 124 | 0.1% |
| Poland | 20 | 0.0% |
| Russia | 186 | 0.2% |
| Singapore | 14 | 0.0% |
| South Africa | 107 | 0.1% |
| South America | 650 | 0.7% |
| South Central Asia | 402 | 0.4% |
| South Eastern Asia | 717 | 0.7% |
| Southern Europe | 170 | 0.2% |
| Spain | 161 | 0.2% |
| Sri Lanka | 13 | 0.0% |
| Sudan | 18 | 0.0% |
| Sweden | 36 | 0.0% |
| Switzerland | 106 | 0.1% |
| Taiwan | 22 | 0.0% |
| Thailand | 92 | 0.1% |
| Ukraine | 287 | 0.3% |
| Uruguay | 143 | 0.2% |
| Uzbekistan | 12 | 0.0% |
| Venezuela | 29 | 0.0% |
| Vietnam | 222 | 0.2% |
| Western Africa | 17 | 0.0% |
| Western Asia | 72 | 0.1% |
| Western Europe | 480 | 0.5% |
| Zimbabwe | 18 | 0.0% | View All 80 Rows |
Sex and Age in Longmont
Sex and Age in Longmont
The most populous age groups in Longmont are 35 to 39 Years (3,713 | 7.6%) for men and 55 to 59 Years (3,627 | 7.3%) for women.
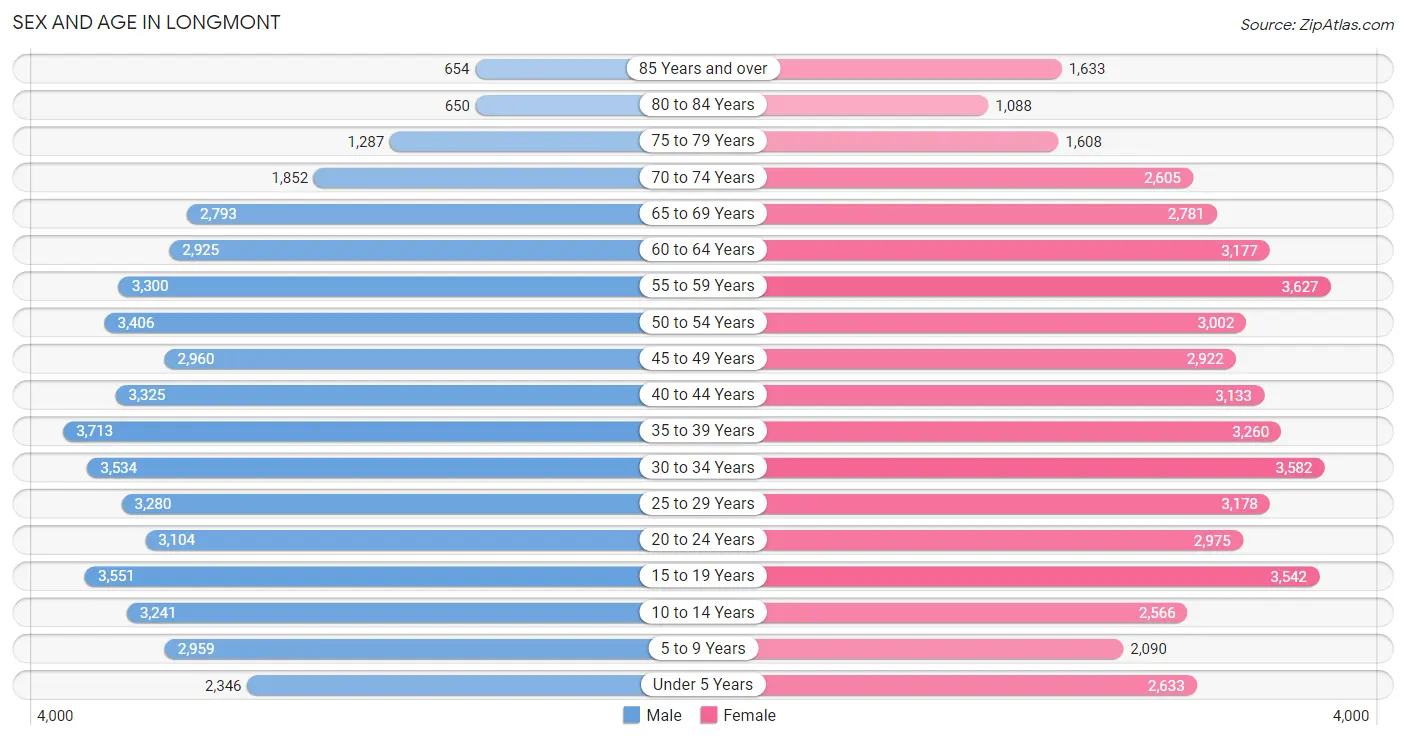
| Age Bracket | Male | Female |
| Under 5 Years | 2,346 (4.8%) | 2,633 (5.3%) |
| 5 to 9 Years | 2,959 (6.0%) | 2,090 (4.2%) |
| 10 to 14 Years | 3,241 (6.6%) | 2,566 (5.2%) |
| 15 to 19 Years | 3,551 (7.3%) | 3,542 (7.2%) |
| 20 to 24 Years | 3,104 (6.4%) | 2,975 (6.0%) |
| 25 to 29 Years | 3,280 (6.7%) | 3,178 (6.4%) |
| 30 to 34 Years | 3,534 (7.2%) | 3,582 (7.2%) |
| 35 to 39 Years | 3,713 (7.6%) | 3,260 (6.6%) |
| 40 to 44 Years | 3,325 (6.8%) | 3,133 (6.3%) |
| 45 to 49 Years | 2,960 (6.1%) | 2,922 (5.9%) |
| 50 to 54 Years | 3,406 (7.0%) | 3,002 (6.1%) |
| 55 to 59 Years | 3,300 (6.8%) | 3,627 (7.3%) |
| 60 to 64 Years | 2,925 (6.0%) | 3,177 (6.4%) |
| 65 to 69 Years | 2,793 (5.7%) | 2,781 (5.6%) |
| 70 to 74 Years | 1,852 (3.8%) | 2,605 (5.3%) |
| 75 to 79 Years | 1,287 (2.6%) | 1,608 (3.3%) |
| 80 to 84 Years | 650 (1.3%) | 1,088 (2.2%) |
| 85 Years and over | 654 (1.3%) | 1,633 (3.3%) |
| Total | 48,880 (100.0%) | 49,402 (100.0%) |
Families and Households in Longmont
Median Family Size in Longmont
The median family size in Longmont is 3.06 persons per family, with single female/mother families (3,915 | 16.1%) accounting for the largest median family size of 3.18 persons per family. On the other hand, single male/father families (1,782 | 7.3%) represent the smallest median family size with 2.71 persons per family.
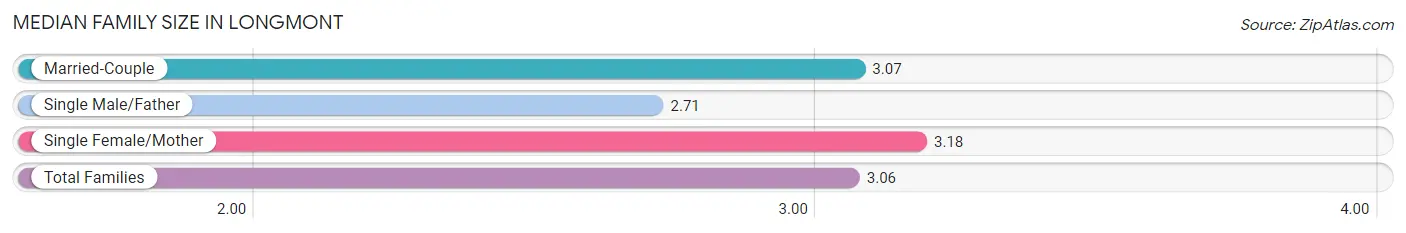
| Family Type | # Families | Family Size |
| Married-Couple | 18,694 (76.6%) | 3.07 |
| Single Male/Father | 1,782 (7.3%) | 2.71 |
| Single Female/Mother | 3,915 (16.1%) | 3.18 |
| Total Families | 24,391 (100.0%) | 3.06 |
Median Household Size in Longmont
The median household size in Longmont is 2.44 persons per household, with single female/mother households (3,915 | 9.8%) accounting for the largest median household size of 3.47 persons per household. non-family households (15,548 | 38.9%) represent the smallest median household size with 1.31 persons per household.
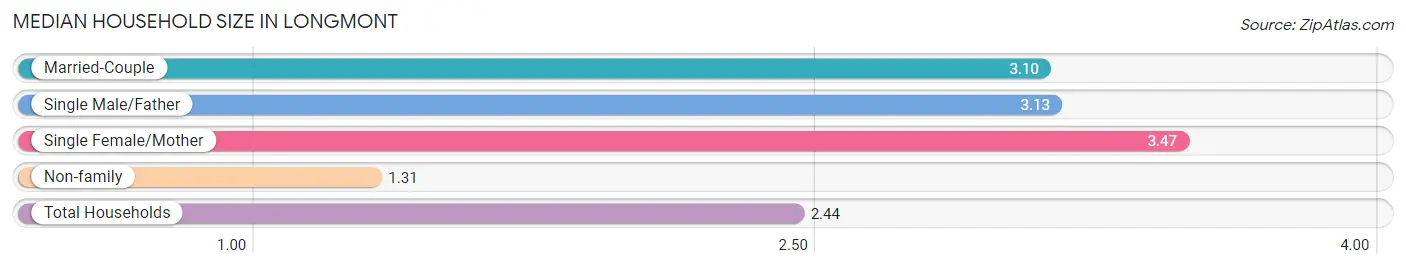
| Household Type | # Households | Household Size |
| Married-Couple | 18,694 (46.8%) | 3.10 |
| Single Male/Father | 1,782 (4.5%) | 3.13 |
| Single Female/Mother | 3,915 (9.8%) | 3.47 |
| Non-family | 15,548 (38.9%) | 1.31 |
| Total Households | 39,939 (100.0%) | 2.44 |
Household Size by Marriage Status in Longmont
Out of a total of 39,939 households in Longmont, 24,391 (61.1%) are family households, while 15,548 (38.9%) are nonfamily households. The most numerous type of family households are 2-person households, comprising 10,756, and the most common type of nonfamily households are 1-person households, comprising 11,886.
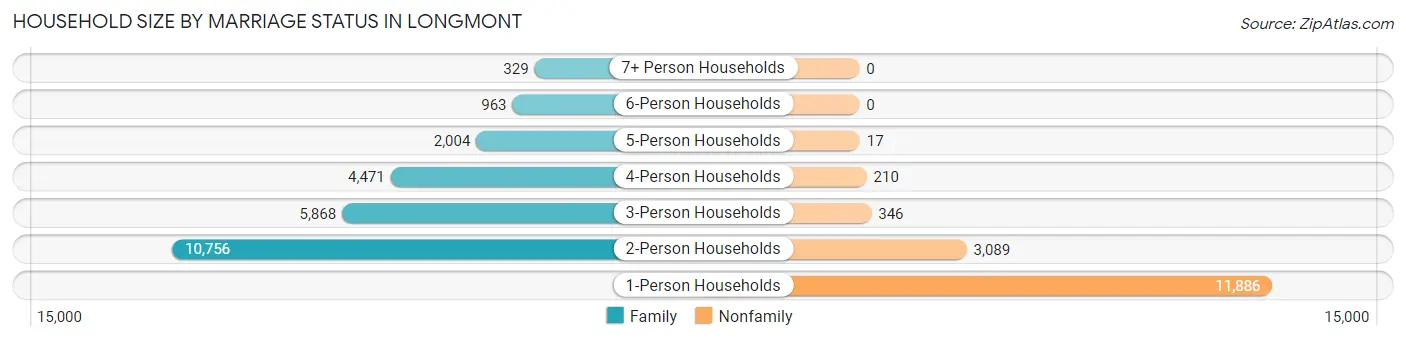
| Household Size | Family Households | Nonfamily Households |
| 1-Person Households | - | 11,886 (29.8%) |
| 2-Person Households | 10,756 (26.9%) | 3,089 (7.7%) |
| 3-Person Households | 5,868 (14.7%) | 346 (0.9%) |
| 4-Person Households | 4,471 (11.2%) | 210 (0.5%) |
| 5-Person Households | 2,004 (5.0%) | 17 (0.0%) |
| 6-Person Households | 963 (2.4%) | 0 (0.0%) |
| 7+ Person Households | 329 (0.8%) | 0 (0.0%) |
| Total | 24,391 (61.1%) | 15,548 (38.9%) |
Female Fertility in Longmont
Fertility by Age in Longmont
Average fertility rate in Longmont is 41.0 births per 1,000 women. Women in the age bracket of 20 to 34 years have the highest fertility rate with 56.0 births per 1,000 women. Women in the age bracket of 20 to 34 years acount for 57.0% of all women with births.
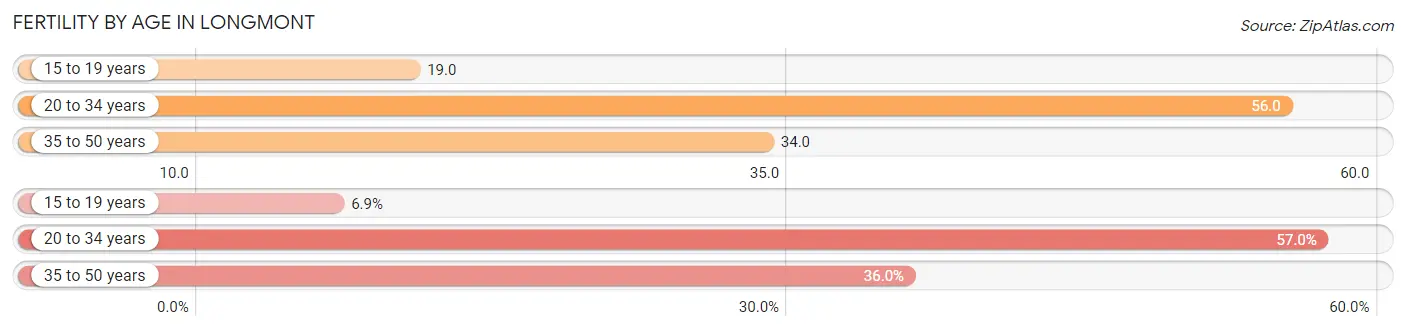
| Age Bracket | Women with Births | Births / 1,000 Women |
| 15 to 19 years | 66 (6.9%) | 19.0 |
| 20 to 34 years | 543 (57.0%) | 56.0 |
| 35 to 50 years | 343 (36.0%) | 34.0 |
| Total | 952 (100.0%) | 41.0 |
Fertility by Age by Marriage Status in Longmont
65.4% of women with births (952) in Longmont are married. The highest percentage of unmarried women with births falls into 15 to 19 years age bracket with 100.0% of them unmarried at the time of birth, while the lowest percentage of unmarried women with births belong to 35 to 50 years age bracket with 21.3% of them unmarried.
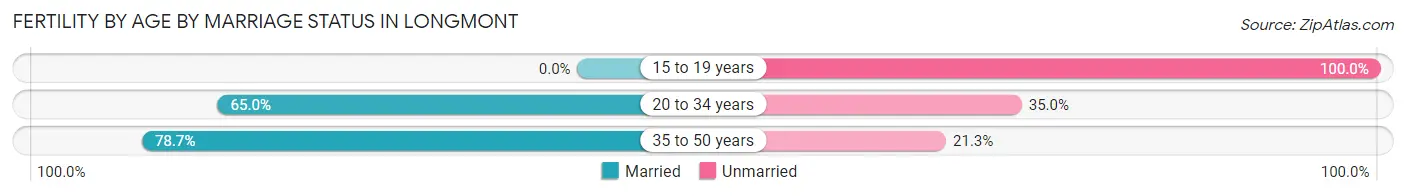
| Age Bracket | Married | Unmarried |
| 15 to 19 years | 0 (0.0%) | 66 (100.0%) |
| 20 to 34 years | 353 (65.0%) | 190 (35.0%) |
| 35 to 50 years | 270 (78.7%) | 73 (21.3%) |
| Total | 623 (65.4%) | 329 (34.6%) |
Fertility by Education in Longmont
Average fertility rate in Longmont is 41.0 births per 1,000 women. Women with the education attainment of college or associate's degree have the highest fertility rate of 62.0 births per 1,000 women, while women with the education attainment of less than high school have the lowest fertility at 14.0 births per 1,000 women. Women with the education attainment of college or associate's degree represent 35.5% of all women with births.
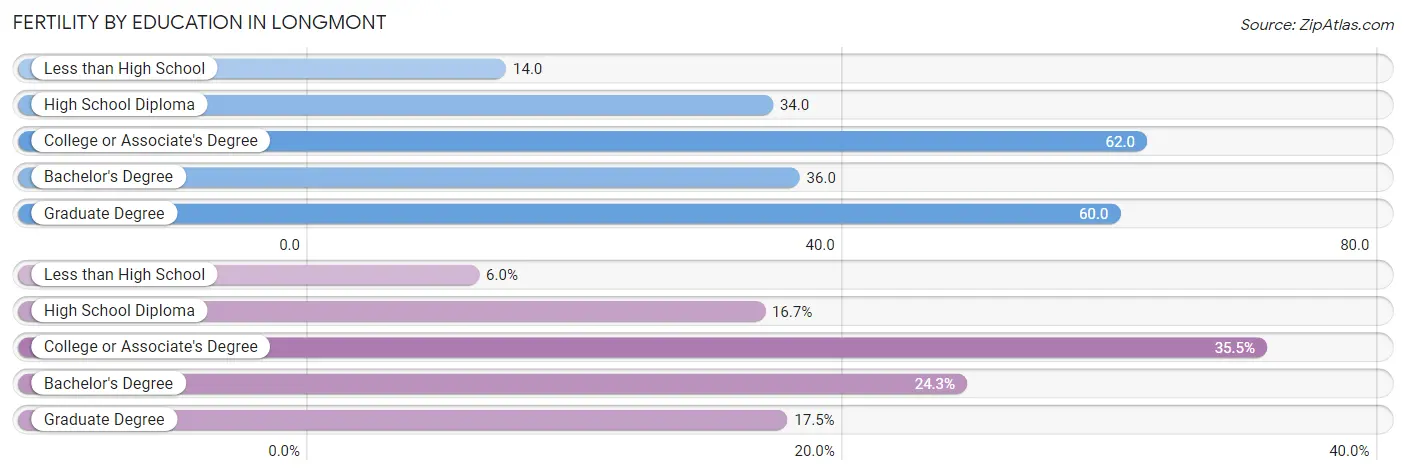
| Educational Attainment | Women with Births | Births / 1,000 Women |
| Less than High School | 57 (6.0%) | 14.0 |
| High School Diploma | 159 (16.7%) | 34.0 |
| College or Associate's Degree | 338 (35.5%) | 62.0 |
| Bachelor's Degree | 231 (24.3%) | 36.0 |
| Graduate Degree | 167 (17.5%) | 60.0 |
| Total | 952 (100.0%) | 41.0 |
Fertility by Education by Marriage Status in Longmont
34.6% of women with births in Longmont are unmarried. Women with the educational attainment of bachelor's degree are most likely to be married with 100.0% of them married at childbirth, while women with the educational attainment of college or associate's degree are least likely to be married with 64.2% of them unmarried at childbirth.
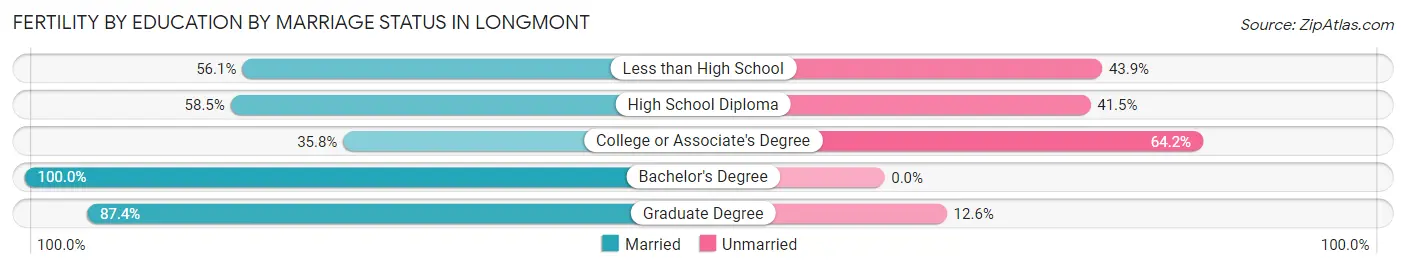
| Educational Attainment | Married | Unmarried |
| Less than High School | 32 (56.1%) | 25 (43.9%) |
| High School Diploma | 93 (58.5%) | 66 (41.5%) |
| College or Associate's Degree | 121 (35.8%) | 217 (64.2%) |
| Bachelor's Degree | 231 (100.0%) | 0 (0.0%) |
| Graduate Degree | 146 (87.4%) | 21 (12.6%) |
| Total | 623 (65.4%) | 329 (34.6%) |
Employment Characteristics in Longmont
Employment by Class of Employer in Longmont
Among the 52,174 employed individuals in Longmont, private company employees (34,422 | 66.0%), local government employees (4,641 | 8.9%), and not-for-profit organizations (3,716 | 7.1%) make up the most common classes of employment.
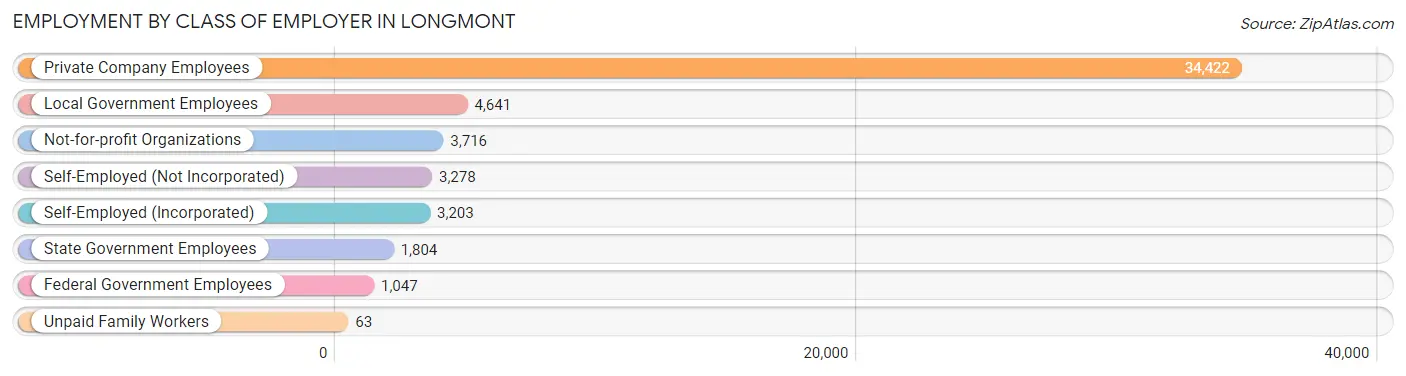
| Employer Class | # Employees | % Employees |
| Private Company Employees | 34,422 | 66.0% |
| Self-Employed (Incorporated) | 3,203 | 6.1% |
| Self-Employed (Not Incorporated) | 3,278 | 6.3% |
| Not-for-profit Organizations | 3,716 | 7.1% |
| Local Government Employees | 4,641 | 8.9% |
| State Government Employees | 1,804 | 3.5% |
| Federal Government Employees | 1,047 | 2.0% |
| Unpaid Family Workers | 63 | 0.1% |
| Total | 52,174 | 100.0% |
Employment Status by Age in Longmont
According to the labor force statistics for Longmont, out of the total population over 16 years of age (80,783), 68.6% or 55,417 individuals are in the labor force, with 4.1% or 2,272 of them unemployed. The age group with the highest labor force participation rate is 35 to 44 years, with 89.4% or 12,007 individuals in the labor force. Within the labor force, the 16 to 19 years age range has the highest percentage of unemployed individuals, with 15.9% or 413 of them being unemployed.
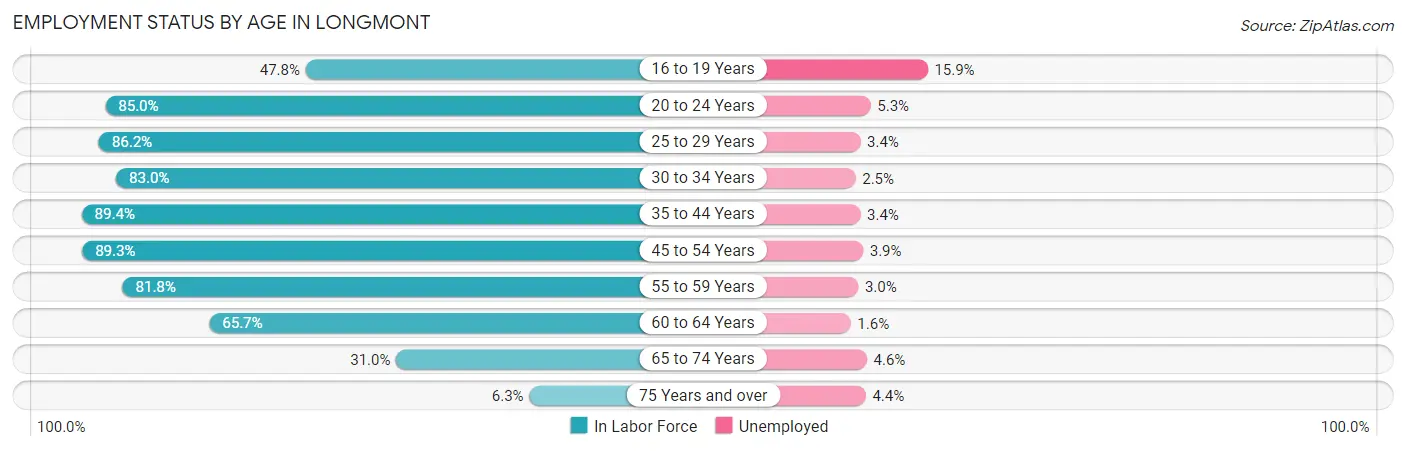
| Age Bracket | In Labor Force | Unemployed |
| 16 to 19 Years | 2,595 (47.8%) | 413 (15.9%) |
| 20 to 24 Years | 5,167 (85.0%) | 274 (5.3%) |
| 25 to 29 Years | 5,567 (86.2%) | 189 (3.4%) |
| 30 to 34 Years | 5,906 (83.0%) | 148 (2.5%) |
| 35 to 44 Years | 12,007 (89.4%) | 408 (3.4%) |
| 45 to 54 Years | 10,975 (89.3%) | 428 (3.9%) |
| 55 to 59 Years | 5,666 (81.8%) | 170 (3.0%) |
| 60 to 64 Years | 4,009 (65.7%) | 64 (1.6%) |
| 65 to 74 Years | 3,110 (31.0%) | 143 (4.6%) |
| 75 Years and over | 436 (6.3%) | 19 (4.4%) |
| Total | 55,417 (68.6%) | 2,272 (4.1%) |
Employment Status by Educational Attainment in Longmont
According to labor force statistics for Longmont, 84.4% of individuals (44,161) out of the total population between 25 and 64 years of age (52,324) are in the labor force, with 3.2% or 1,413 of them being unemployed. The group with the highest labor force participation rate are those with the educational attainment of bachelor's degree or higher, with 87.1% or 21,558 individuals in the labor force. Within the labor force, individuals with less than high school education have the highest percentage of unemployment, with 6.3% or 198 of them being unemployed.
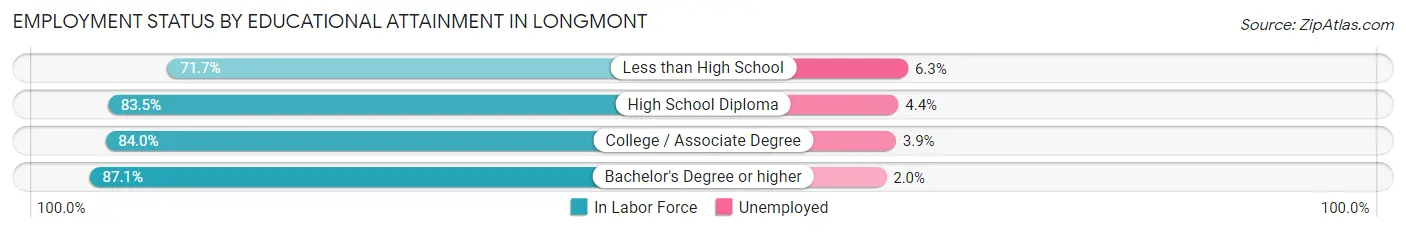
| Educational Attainment | In Labor Force | Unemployed |
| Less than High School | 3,150 (71.7%) | 277 (6.3%) |
| High School Diploma | 7,533 (83.5%) | 397 (4.4%) |
| College / Associate Degree | 11,893 (84.0%) | 552 (3.9%) |
| Bachelor's Degree or higher | 21,558 (87.1%) | 495 (2.0%) |
| Total | 44,161 (84.4%) | 1,674 (3.2%) |
Employment Occupations by Sex in Longmont
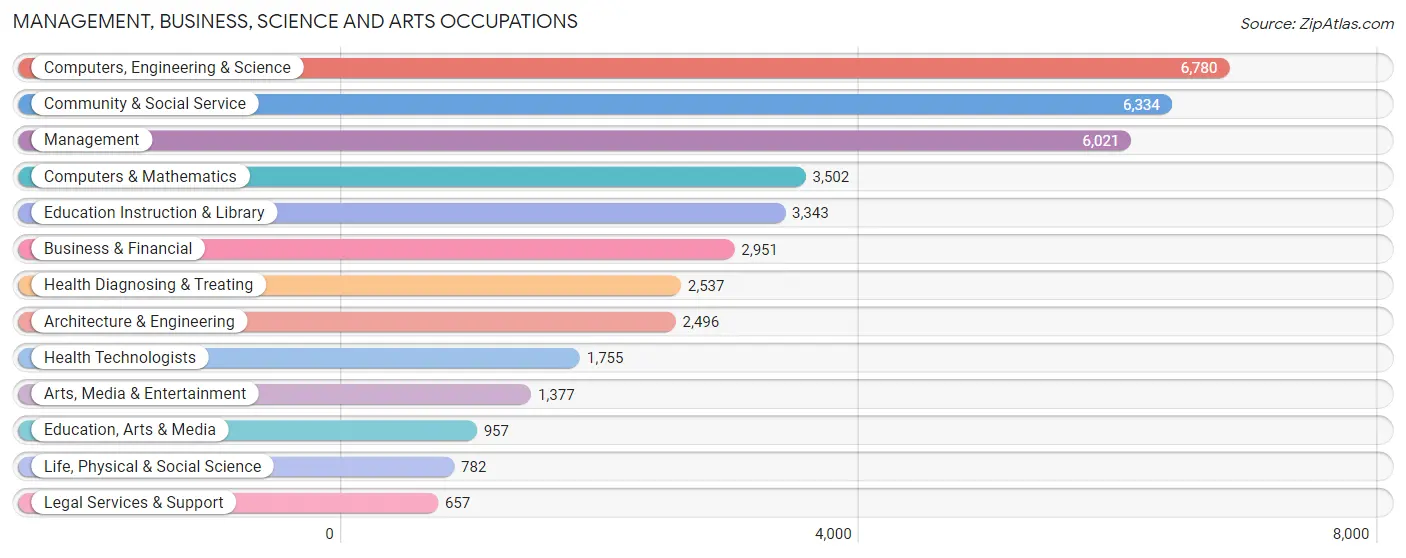
Management, Business, Science and Arts Occupations
The most common Management, Business, Science and Arts occupations in Longmont are Computers, Engineering & Science (6,780 | 12.8%), Community & Social Service (6,334 | 11.9%), Management (6,021 | 11.4%), Computers & Mathematics (3,502 | 6.6%), and Education Instruction & Library (3,343 | 6.3%).
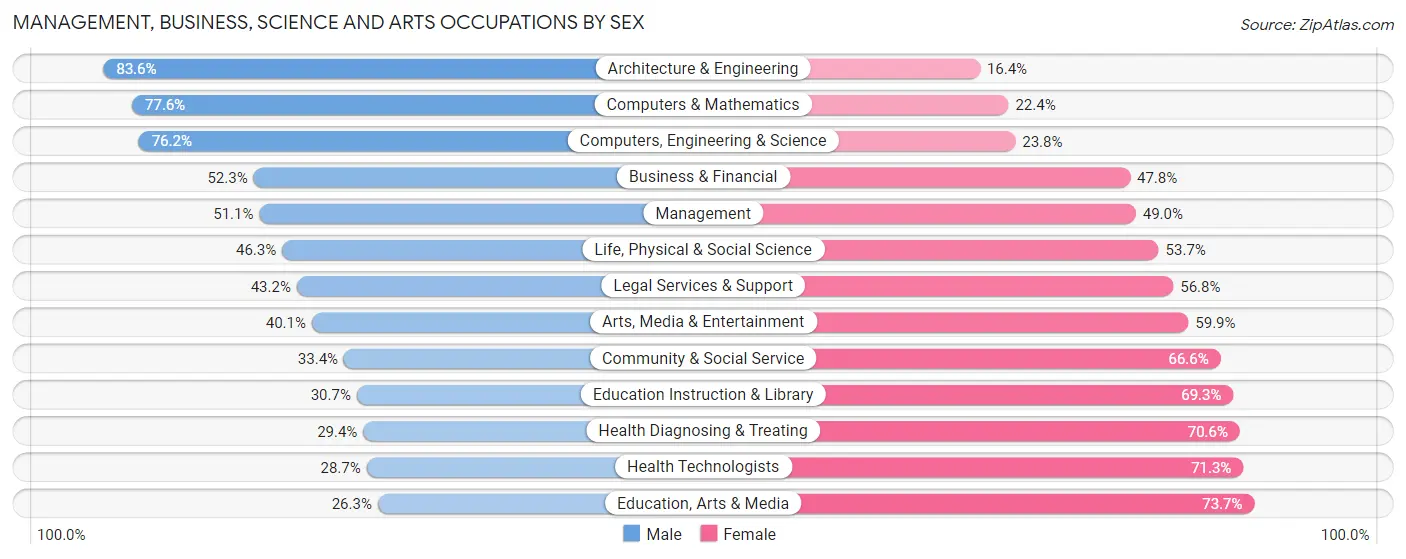
Management, Business, Science and Arts Occupations by Sex
Within the Management, Business, Science and Arts occupations in Longmont, the most male-oriented occupations are Architecture & Engineering (83.6%), Computers & Mathematics (77.6%), and Computers, Engineering & Science (76.2%), while the most female-oriented occupations are Education, Arts & Media (73.7%), Health Technologists (71.3%), and Health Diagnosing & Treating (70.6%).
| Occupation | Male | Female |
| Management | 3,074 (51.0%) | 2,947 (48.9%) |
| Business & Financial | 1,542 (52.2%) | 1,409 (47.7%) |
| Computers, Engineering & Science | 5,166 (76.2%) | 1,614 (23.8%) |
| Computers & Mathematics | 2,718 (77.6%) | 784 (22.4%) |
| Architecture & Engineering | 2,086 (83.6%) | 410 (16.4%) |
| Life, Physical & Social Science | 362 (46.3%) | 420 (53.7%) |
| Community & Social Service | 2,115 (33.4%) | 4,219 (66.6%) |
| Education, Arts & Media | 252 (26.3%) | 705 (73.7%) |
| Legal Services & Support | 284 (43.2%) | 373 (56.8%) |
| Education Instruction & Library | 1,027 (30.7%) | 2,316 (69.3%) |
| Arts, Media & Entertainment | 552 (40.1%) | 825 (59.9%) |
| Health Diagnosing & Treating | 745 (29.4%) | 1,792 (70.6%) |
| Health Technologists | 503 (28.7%) | 1,252 (71.3%) |
| Total (Category) | 12,642 (51.3%) | 11,981 (48.7%) |
| Total (Overall) | 28,053 (52.9%) | 24,957 (47.1%) |
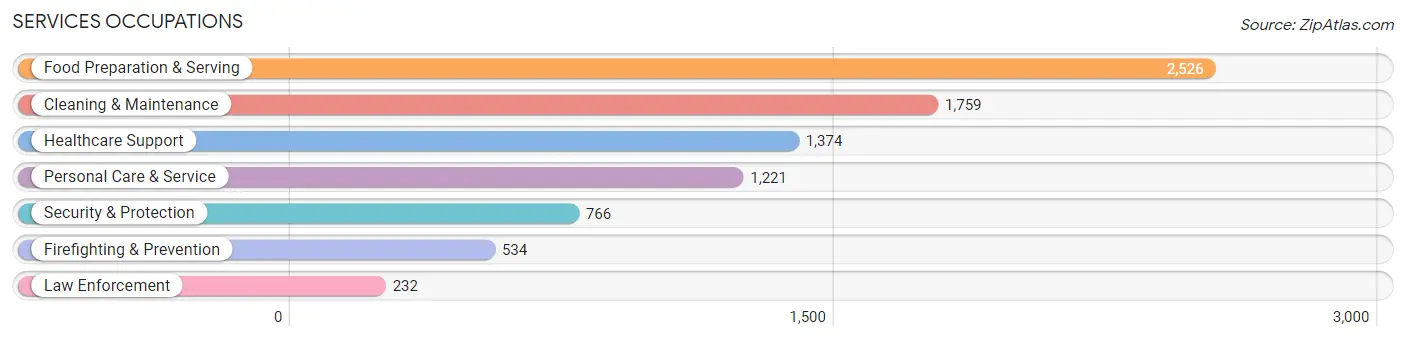
Services Occupations
The most common Services occupations in Longmont are Food Preparation & Serving (2,526 | 4.8%), Cleaning & Maintenance (1,759 | 3.3%), Healthcare Support (1,374 | 2.6%), Personal Care & Service (1,221 | 2.3%), and Security & Protection (766 | 1.5%).
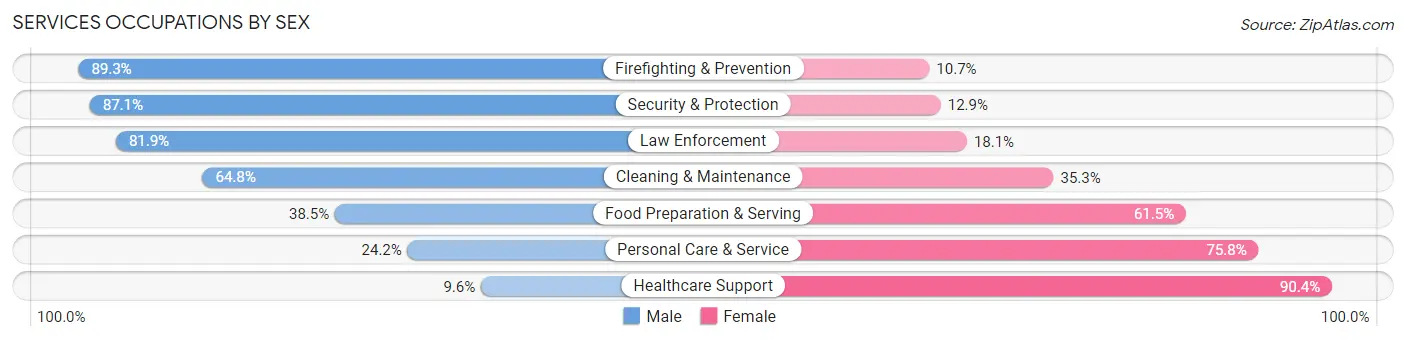
Services Occupations by Sex
Within the Services occupations in Longmont, the most male-oriented occupations are Firefighting & Prevention (89.3%), Security & Protection (87.1%), and Law Enforcement (81.9%), while the most female-oriented occupations are Healthcare Support (90.4%), Personal Care & Service (75.8%), and Food Preparation & Serving (61.5%).
| Occupation | Male | Female |
| Healthcare Support | 132 (9.6%) | 1,242 (90.4%) |
| Security & Protection | 667 (87.1%) | 99 (12.9%) |
| Firefighting & Prevention | 477 (89.3%) | 57 (10.7%) |
| Law Enforcement | 190 (81.9%) | 42 (18.1%) |
| Food Preparation & Serving | 973 (38.5%) | 1,553 (61.5%) |
| Cleaning & Maintenance | 1,139 (64.7%) | 620 (35.2%) |
| Personal Care & Service | 295 (24.2%) | 926 (75.8%) |
| Total (Category) | 3,206 (41.9%) | 4,440 (58.1%) |
| Total (Overall) | 28,053 (52.9%) | 24,957 (47.1%) |
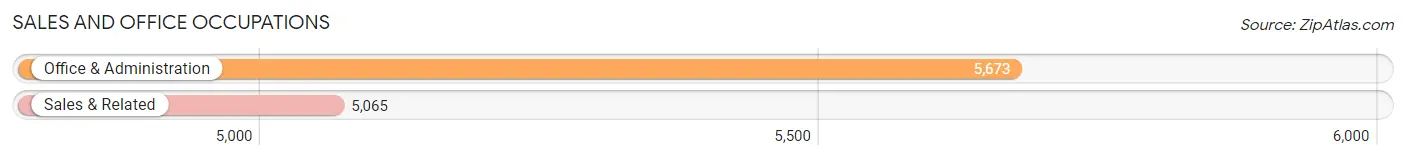
Sales and Office Occupations
The most common Sales and Office occupations in Longmont are Office & Administration (5,673 | 10.7%), and Sales & Related (5,065 | 9.6%).
Sales and Office Occupations by Sex
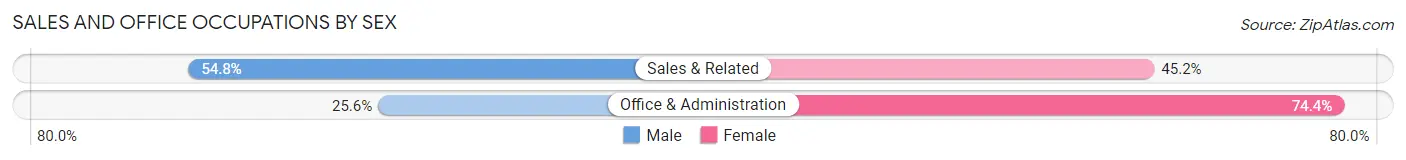
| Occupation | Male | Female |
| Sales & Related | 2,775 (54.8%) | 2,290 (45.2%) |
| Office & Administration | 1,454 (25.6%) | 4,219 (74.4%) |
| Total (Category) | 4,229 (39.4%) | 6,509 (60.6%) |
| Total (Overall) | 28,053 (52.9%) | 24,957 (47.1%) |
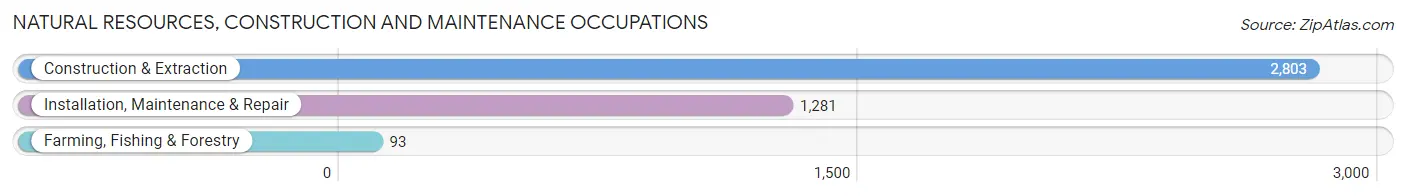
Natural Resources, Construction and Maintenance Occupations
The most common Natural Resources, Construction and Maintenance occupations in Longmont are Construction & Extraction (2,803 | 5.3%), Installation, Maintenance & Repair (1,281 | 2.4%), and Farming, Fishing & Forestry (93 | 0.2%).
Natural Resources, Construction and Maintenance Occupations by Sex
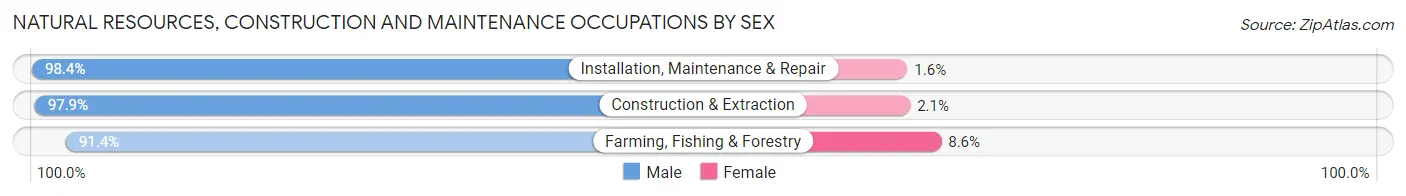
| Occupation | Male | Female |
| Farming, Fishing & Forestry | 85 (91.4%) | 8 (8.6%) |
| Construction & Extraction | 2,743 (97.9%) | 60 (2.1%) |
| Installation, Maintenance & Repair | 1,261 (98.4%) | 20 (1.6%) |
| Total (Category) | 4,089 (97.9%) | 88 (2.1%) |
| Total (Overall) | 28,053 (52.9%) | 24,957 (47.1%) |
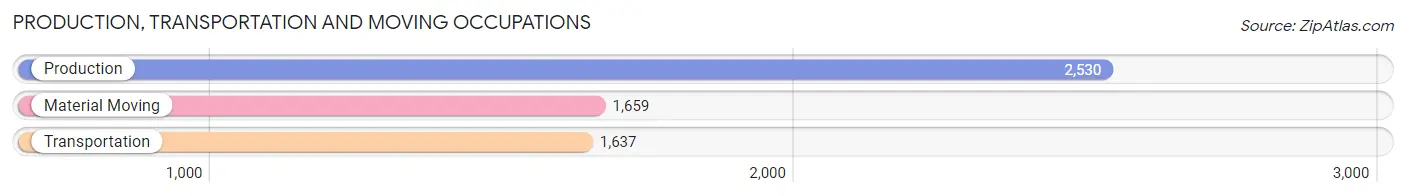
Production, Transportation and Moving Occupations
The most common Production, Transportation and Moving occupations in Longmont are Production (2,530 | 4.8%), Material Moving (1,659 | 3.1%), and Transportation (1,637 | 3.1%).
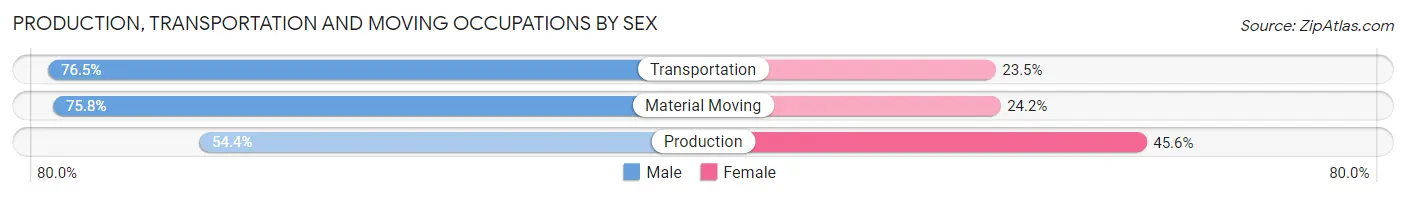
Production, Transportation and Moving Occupations by Sex
| Occupation | Male | Female |
| Production | 1,376 (54.4%) | 1,154 (45.6%) |
| Transportation | 1,253 (76.5%) | 384 (23.5%) |
| Material Moving | 1,258 (75.8%) | 401 (24.2%) |
| Total (Category) | 3,887 (66.7%) | 1,939 (33.3%) |
| Total (Overall) | 28,053 (52.9%) | 24,957 (47.1%) |
Employment Industries by Sex in Longmont
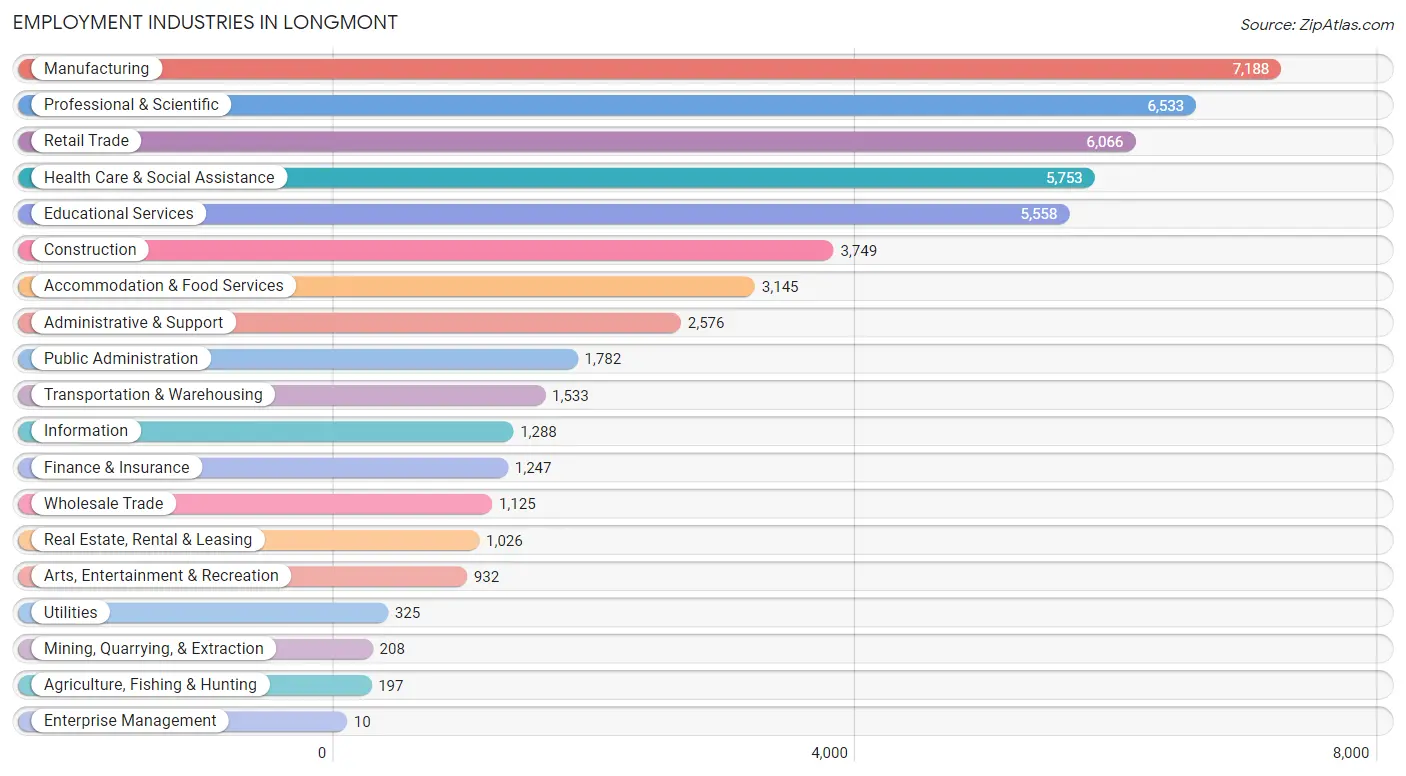
Employment Industries in Longmont
The major employment industries in Longmont include Manufacturing (7,188 | 13.6%), Professional & Scientific (6,533 | 12.3%), Retail Trade (6,066 | 11.4%), Health Care & Social Assistance (5,753 | 10.8%), and Educational Services (5,558 | 10.5%).
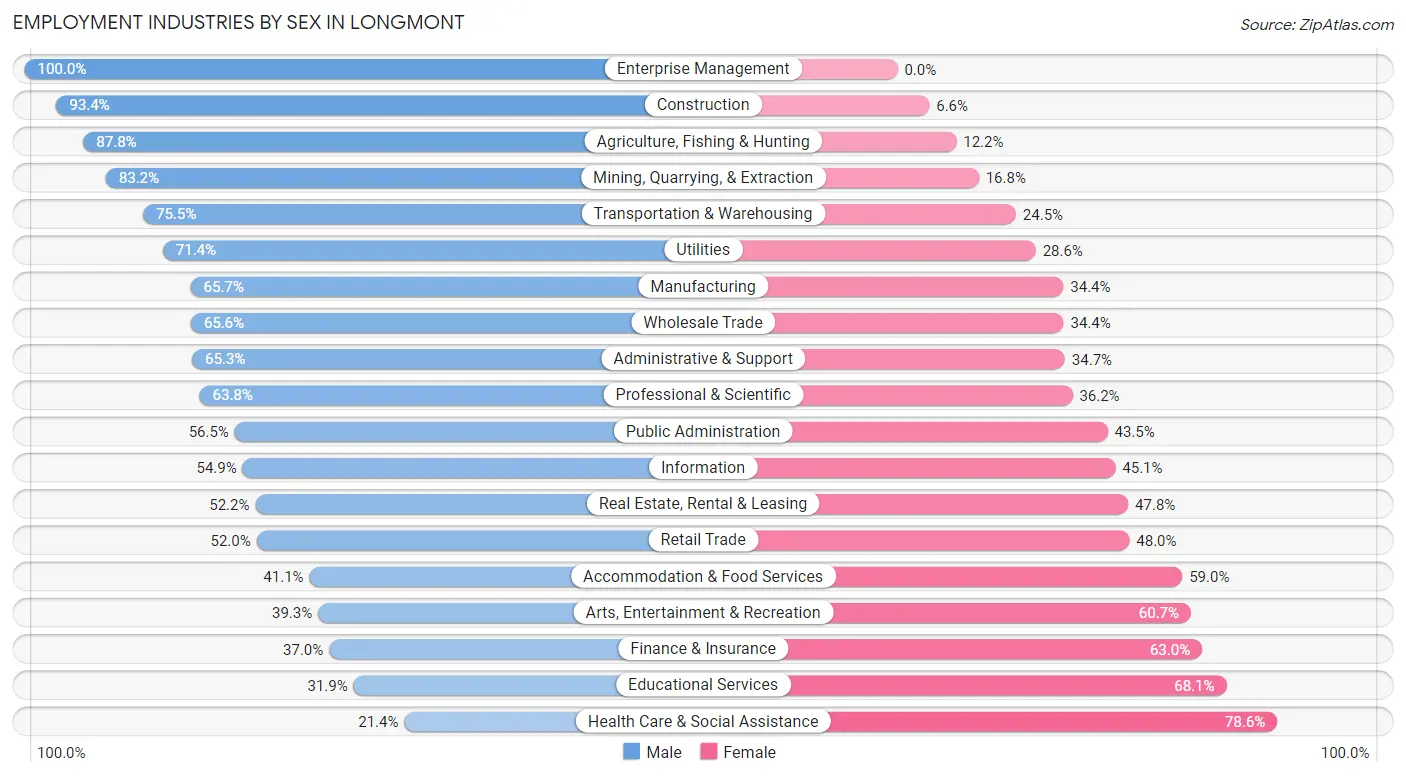
Employment Industries by Sex in Longmont
The Longmont industries that see more men than women are Enterprise Management (100.0%), Construction (93.4%), and Agriculture, Fishing & Hunting (87.8%), whereas the industries that tend to have a higher number of women are Health Care & Social Assistance (78.6%), Educational Services (68.1%), and Finance & Insurance (63.0%).
| Industry | Male | Female |
| Agriculture, Fishing & Hunting | 173 (87.8%) | 24 (12.2%) |
| Mining, Quarrying, & Extraction | 173 (83.2%) | 35 (16.8%) |
| Construction | 3,502 (93.4%) | 247 (6.6%) |
| Manufacturing | 4,719 (65.6%) | 2,469 (34.4%) |
| Wholesale Trade | 738 (65.6%) | 387 (34.4%) |
| Retail Trade | 3,154 (52.0%) | 2,912 (48.0%) |
| Transportation & Warehousing | 1,157 (75.5%) | 376 (24.5%) |
| Utilities | 232 (71.4%) | 93 (28.6%) |
| Information | 707 (54.9%) | 581 (45.1%) |
| Finance & Insurance | 461 (37.0%) | 786 (63.0%) |
| Real Estate, Rental & Leasing | 536 (52.2%) | 490 (47.8%) |
| Professional & Scientific | 4,166 (63.8%) | 2,367 (36.2%) |
| Enterprise Management | 10 (100.0%) | 0 (0.0%) |
| Administrative & Support | 1,683 (65.3%) | 893 (34.7%) |
| Educational Services | 1,774 (31.9%) | 3,784 (68.1%) |
| Health Care & Social Assistance | 1,232 (21.4%) | 4,521 (78.6%) |
| Arts, Entertainment & Recreation | 366 (39.3%) | 566 (60.7%) |
| Accommodation & Food Services | 1,291 (41.0%) | 1,854 (59.0%) |
| Public Administration | 1,007 (56.5%) | 775 (43.5%) |
| Total | 28,053 (52.9%) | 24,957 (47.1%) |
Education in Longmont
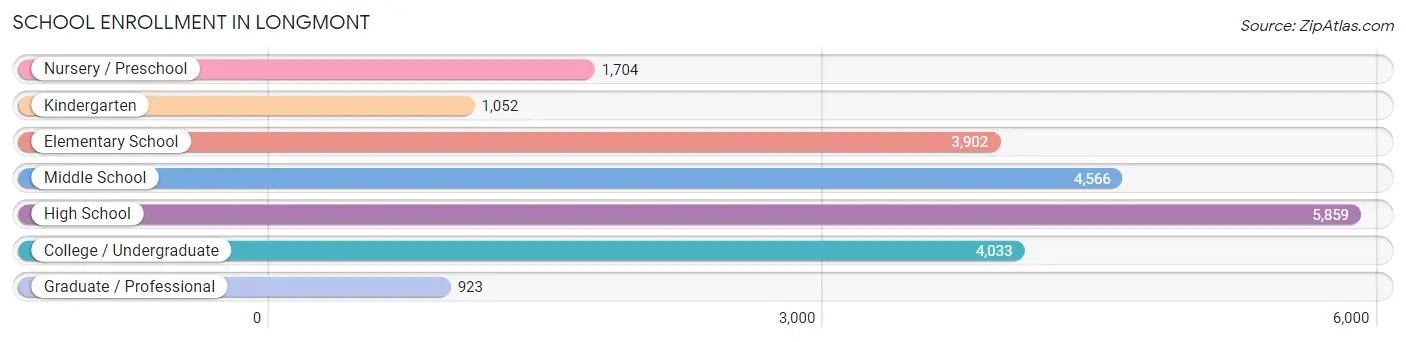
School Enrollment in Longmont
The most common levels of schooling among the 22,039 students in Longmont are high school (5,859 | 26.6%), middle school (4,566 | 20.7%), and college / undergraduate (4,033 | 18.3%).
| School Level | # Students | % Students |
| Nursery / Preschool | 1,704 | 7.7% |
| Kindergarten | 1,052 | 4.8% |
| Elementary School | 3,902 | 17.7% |
| Middle School | 4,566 | 20.7% |
| High School | 5,859 | 26.6% |
| College / Undergraduate | 4,033 | 18.3% |
| Graduate / Professional | 923 | 4.2% |
| Total | 22,039 | 100.0% |
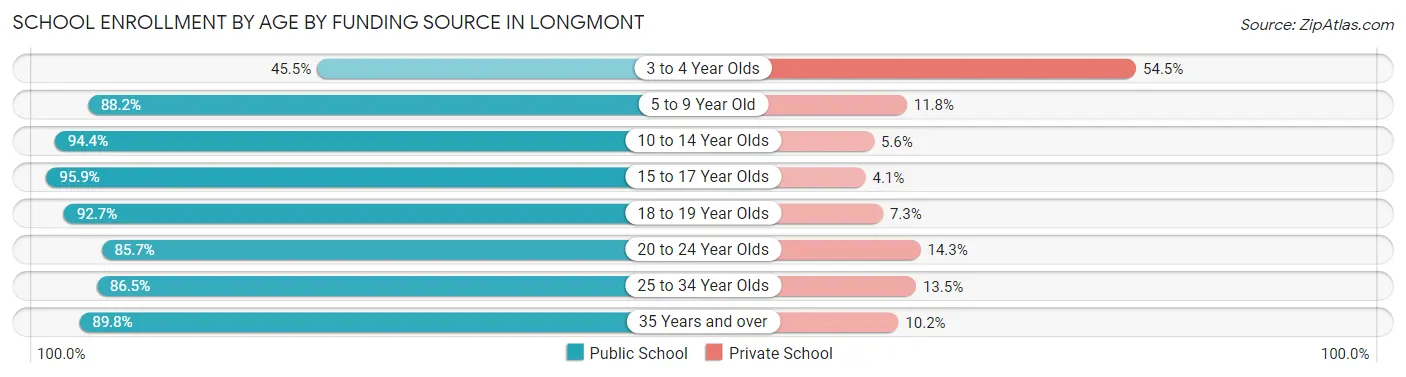
School Enrollment by Age by Funding Source in Longmont
Out of a total of 22,039 students who are enrolled in schools in Longmont, 2,446 (11.1%) attend a private institution, while the remaining 19,593 (88.9%) are enrolled in public schools. The age group of 3 to 4 year olds has the highest likelihood of being enrolled in private schools, with 701 (54.5% in the age bracket) enrolled. Conversely, the age group of 15 to 17 year olds has the lowest likelihood of being enrolled in a private school, with 4,035 (95.9% in the age bracket) attending a public institution.
| Age Bracket | Public School | Private School |
| 3 to 4 Year Olds | 586 (45.5%) | 701 (54.5%) |
| 5 to 9 Year Old | 4,309 (88.2%) | 574 (11.8%) |
| 10 to 14 Year Olds | 5,324 (94.4%) | 318 (5.6%) |
| 15 to 17 Year Olds | 4,035 (95.9%) | 171 (4.1%) |
| 18 to 19 Year Olds | 1,582 (92.7%) | 125 (7.3%) |
| 20 to 24 Year Olds | 1,610 (85.7%) | 269 (14.3%) |
| 25 to 34 Year Olds | 1,259 (86.5%) | 196 (13.5%) |
| 35 Years and over | 880 (89.8%) | 100 (10.2%) |
| Total | 19,593 (88.9%) | 2,446 (11.1%) |
Educational Attainment by Field of Study in Longmont
Business (4,818 | 13.9%), education (3,835 | 11.1%), engineering (3,477 | 10.0%), social sciences (3,188 | 9.2%), and literature & languages (2,551 | 7.4%) are the most common fields of study among 34,652 individuals in Longmont who have obtained a bachelor's degree or higher.
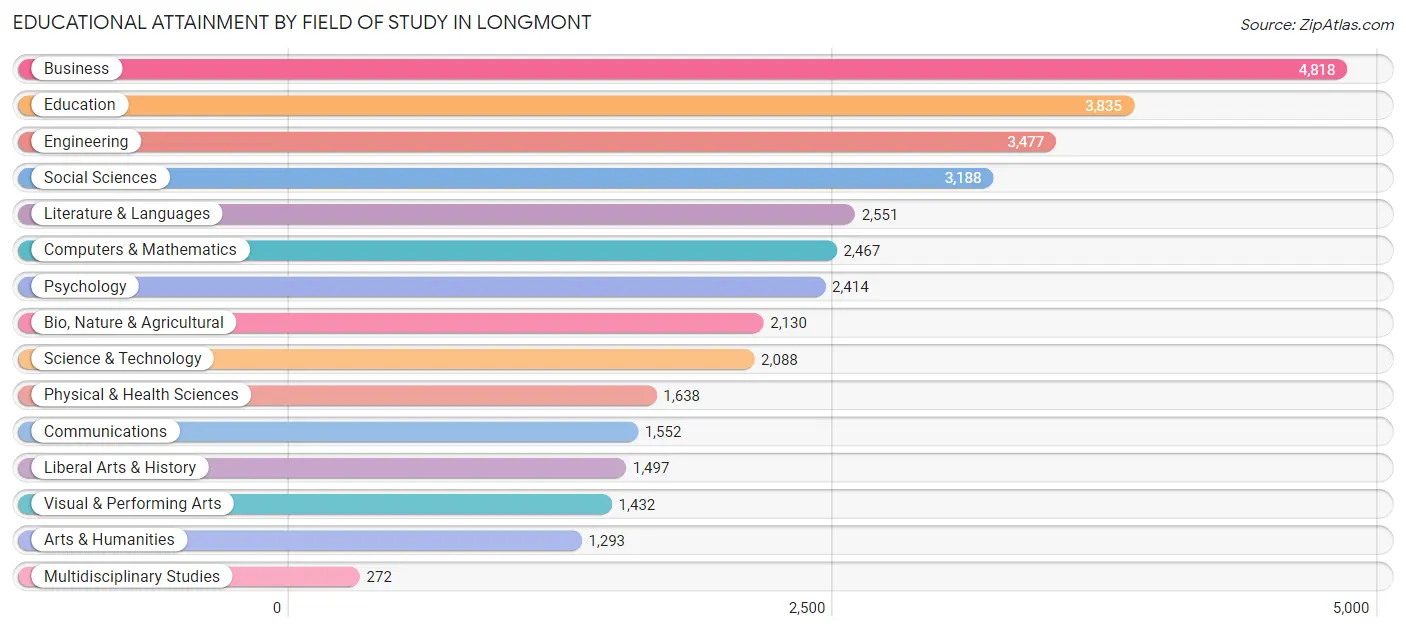
| Field of Study | # Graduates | % Graduates |
| Computers & Mathematics | 2,467 | 7.1% |
| Bio, Nature & Agricultural | 2,130 | 6.1% |
| Physical & Health Sciences | 1,638 | 4.7% |
| Psychology | 2,414 | 7.0% |
| Social Sciences | 3,188 | 9.2% |
| Engineering | 3,477 | 10.0% |
| Multidisciplinary Studies | 272 | 0.8% |
| Science & Technology | 2,088 | 6.0% |
| Business | 4,818 | 13.9% |
| Education | 3,835 | 11.1% |
| Literature & Languages | 2,551 | 7.4% |
| Liberal Arts & History | 1,497 | 4.3% |
| Visual & Performing Arts | 1,432 | 4.1% |
| Communications | 1,552 | 4.5% |
| Arts & Humanities | 1,293 | 3.7% |
| Total | 34,652 | 100.0% |
Transportation & Commute in Longmont
Vehicle Availability by Sex in Longmont
The most prevalent vehicle ownership categories in Longmont are males with 2 vehicles (12,332, accounting for 44.9%) and females with 2 vehicles (10,576, making up 50.3%).
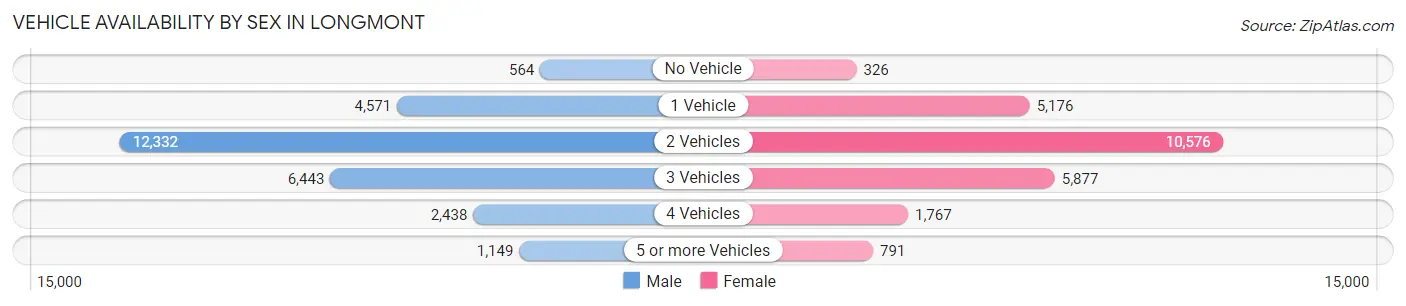
| Vehicles Available | Male | Female |
| No Vehicle | 564 (2.1%) | 326 (1.3%) |
| 1 Vehicle | 4,571 (16.6%) | 5,176 (21.1%) |
| 2 Vehicles | 12,332 (44.9%) | 10,576 (43.1%) |
| 3 Vehicles | 6,443 (23.4%) | 5,877 (24.0%) |
| 4 Vehicles | 2,438 (8.9%) | 1,767 (7.2%) |
| 5 or more Vehicles | 1,149 (4.2%) | 791 (3.2%) |
| Total | 27,497 (100.0%) | 24,513 (100.0%) |
Commute Time in Longmont
The most frequently occuring commute durations in Longmont are 10 to 14 minutes (7,199 commuters, 16.7%), 30 to 34 minutes (6,431 commuters, 14.9%), and 15 to 19 minutes (5,554 commuters, 12.9%).
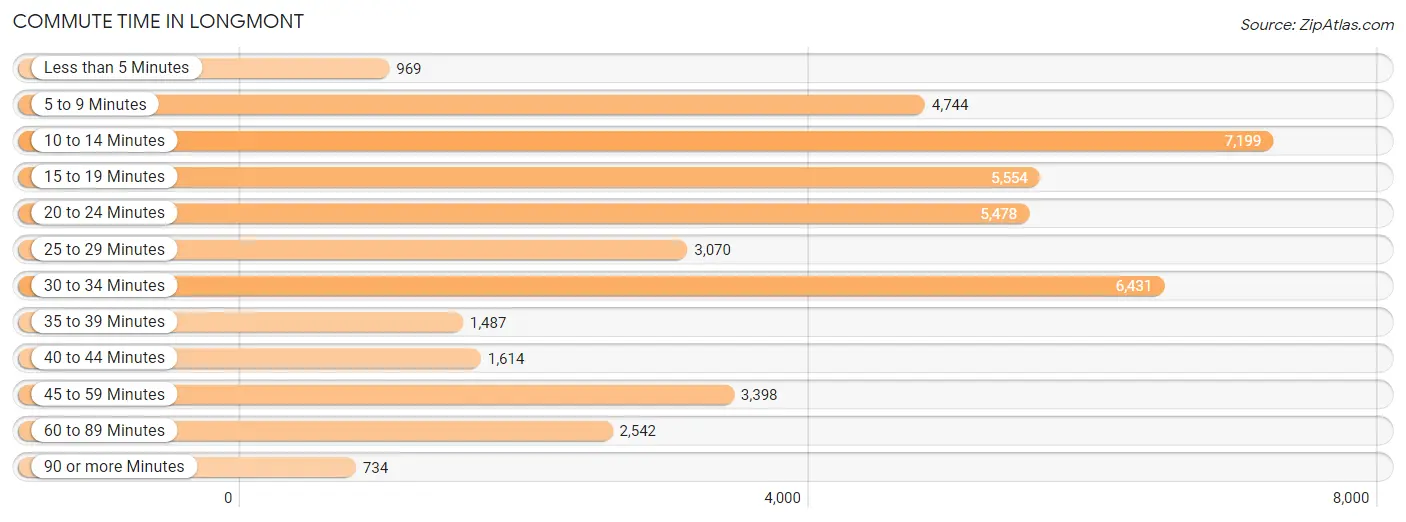
| Commute Time | # Commuters | % Commuters |
| Less than 5 Minutes | 969 | 2.2% |
| 5 to 9 Minutes | 4,744 | 11.0% |
| 10 to 14 Minutes | 7,199 | 16.7% |
| 15 to 19 Minutes | 5,554 | 12.9% |
| 20 to 24 Minutes | 5,478 | 12.7% |
| 25 to 29 Minutes | 3,070 | 7.1% |
| 30 to 34 Minutes | 6,431 | 14.9% |
| 35 to 39 Minutes | 1,487 | 3.4% |
| 40 to 44 Minutes | 1,614 | 3.7% |
| 45 to 59 Minutes | 3,398 | 7.9% |
| 60 to 89 Minutes | 2,542 | 5.9% |
| 90 or more Minutes | 734 | 1.7% |
Commute Time by Sex in Longmont
The most common commute times in Longmont are 10 to 14 minutes (3,555 commuters, 15.6%) for males and 10 to 14 minutes (3,644 commuters, 17.8%) for females.
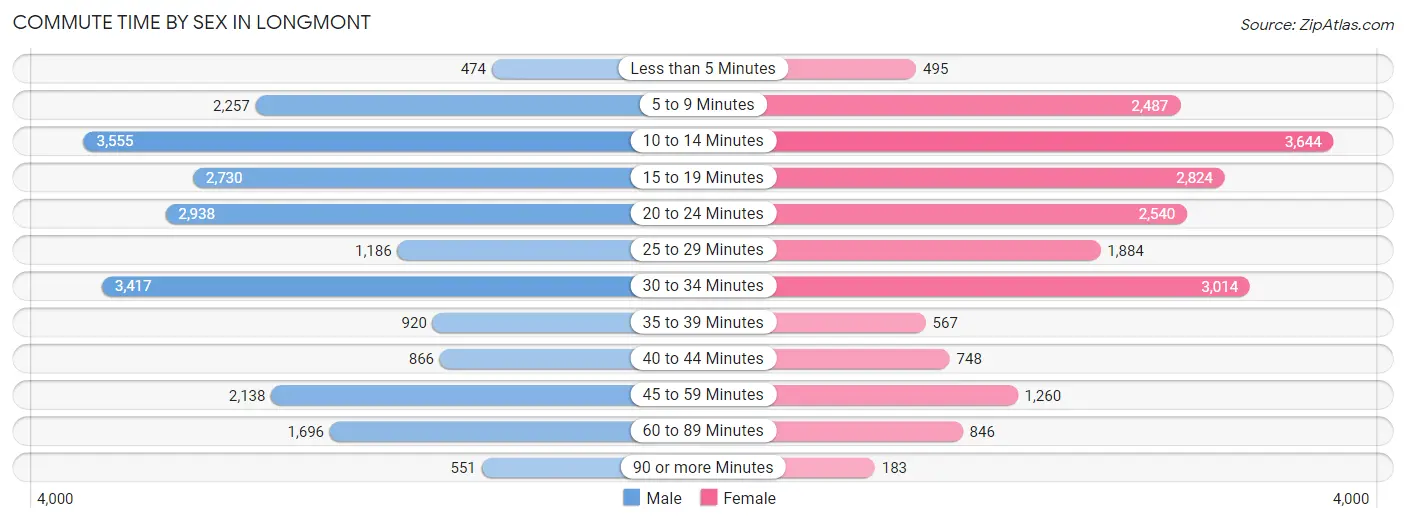
| Commute Time | Male | Female |
| Less than 5 Minutes | 474 (2.1%) | 495 (2.4%) |
| 5 to 9 Minutes | 2,257 (9.9%) | 2,487 (12.1%) |
| 10 to 14 Minutes | 3,555 (15.6%) | 3,644 (17.8%) |
| 15 to 19 Minutes | 2,730 (12.0%) | 2,824 (13.8%) |
| 20 to 24 Minutes | 2,938 (12.9%) | 2,540 (12.4%) |
| 25 to 29 Minutes | 1,186 (5.2%) | 1,884 (9.2%) |
| 30 to 34 Minutes | 3,417 (15.0%) | 3,014 (14.7%) |
| 35 to 39 Minutes | 920 (4.1%) | 567 (2.8%) |
| 40 to 44 Minutes | 866 (3.8%) | 748 (3.6%) |
| 45 to 59 Minutes | 2,138 (9.4%) | 1,260 (6.1%) |
| 60 to 89 Minutes | 1,696 (7.5%) | 846 (4.1%) |
| 90 or more Minutes | 551 (2.4%) | 183 (0.9%) |
Time of Departure to Work by Sex in Longmont
The most frequent times of departure to work in Longmont are 7:00 AM to 7:29 AM (3,147, 13.9%) for males and 7:30 AM to 7:59 AM (3,705, 18.1%) for females.
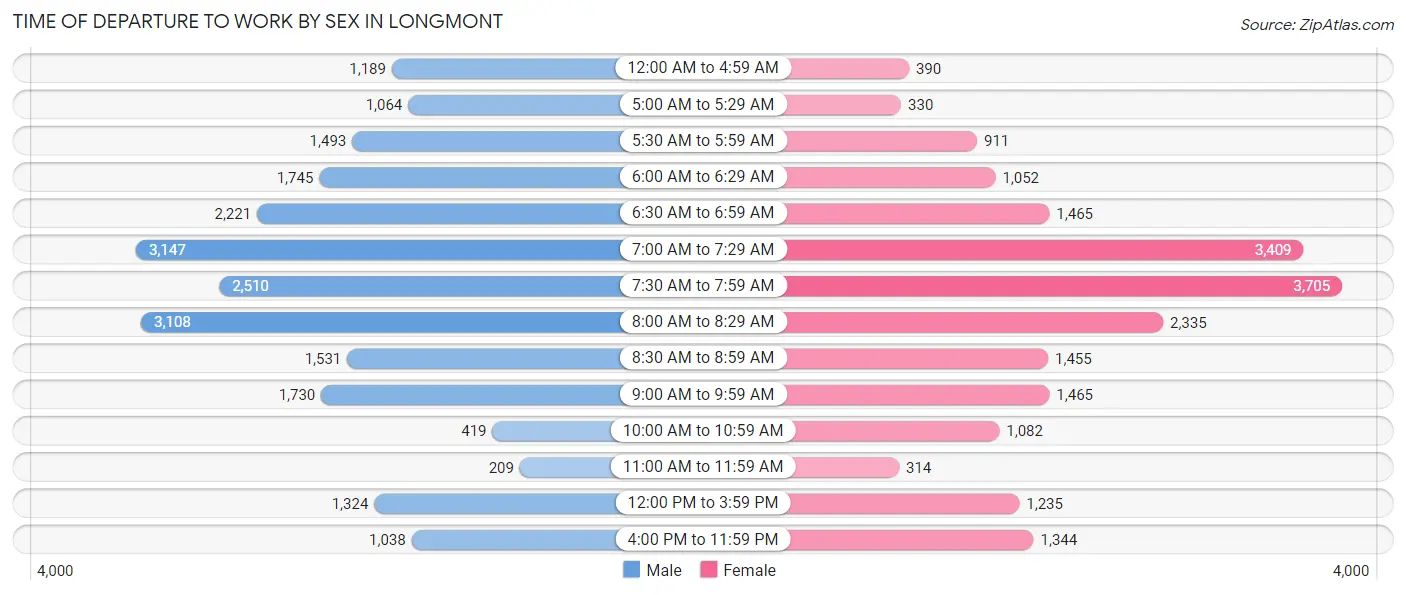
| Time of Departure | Male | Female |
| 12:00 AM to 4:59 AM | 1,189 (5.2%) | 390 (1.9%) |
| 5:00 AM to 5:29 AM | 1,064 (4.7%) | 330 (1.6%) |
| 5:30 AM to 5:59 AM | 1,493 (6.6%) | 911 (4.4%) |
| 6:00 AM to 6:29 AM | 1,745 (7.7%) | 1,052 (5.1%) |
| 6:30 AM to 6:59 AM | 2,221 (9.8%) | 1,465 (7.1%) |
| 7:00 AM to 7:29 AM | 3,147 (13.9%) | 3,409 (16.6%) |
| 7:30 AM to 7:59 AM | 2,510 (11.0%) | 3,705 (18.1%) |
| 8:00 AM to 8:29 AM | 3,108 (13.7%) | 2,335 (11.4%) |
| 8:30 AM to 8:59 AM | 1,531 (6.7%) | 1,455 (7.1%) |
| 9:00 AM to 9:59 AM | 1,730 (7.6%) | 1,465 (7.1%) |
| 10:00 AM to 10:59 AM | 419 (1.8%) | 1,082 (5.3%) |
| 11:00 AM to 11:59 AM | 209 (0.9%) | 314 (1.5%) |
| 12:00 PM to 3:59 PM | 1,324 (5.8%) | 1,235 (6.0%) |
| 4:00 PM to 11:59 PM | 1,038 (4.6%) | 1,344 (6.6%) |
| Total | 22,728 (100.0%) | 20,492 (100.0%) |
Housing Occupancy in Longmont
Occupancy by Ownership in Longmont
Of the total 39,939 dwellings in Longmont, owner-occupied units account for 25,270 (63.3%), while renter-occupied units make up 14,669 (36.7%).
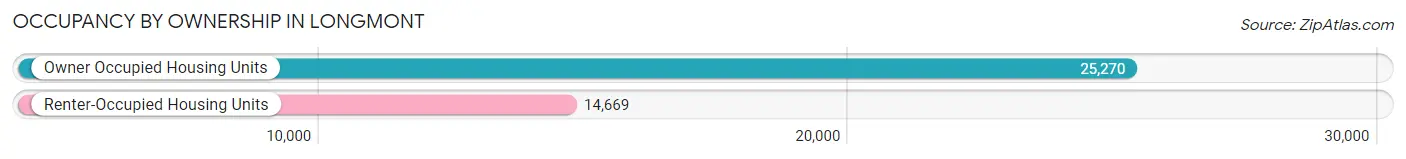
| Occupancy | # Housing Units | % Housing Units |
| Owner Occupied Housing Units | 25,270 | 63.3% |
| Renter-Occupied Housing Units | 14,669 | 36.7% |
| Total Occupied Housing Units | 39,939 | 100.0% |
Occupancy by Household Size in Longmont
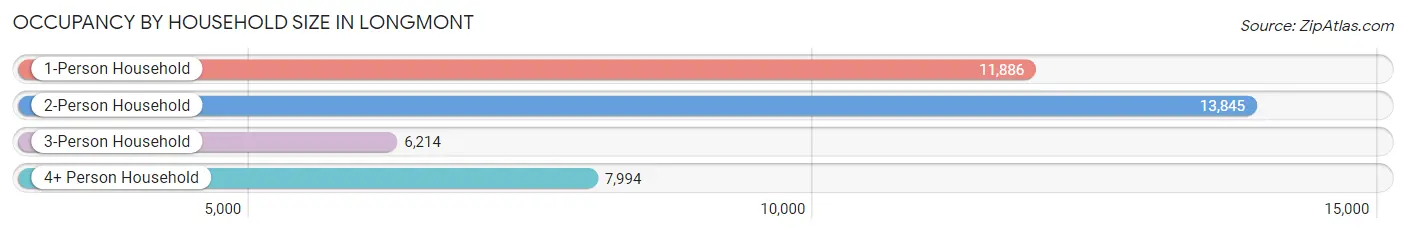
| Household Size | # Housing Units | % Housing Units |
| 1-Person Household | 11,886 | 29.8% |
| 2-Person Household | 13,845 | 34.7% |
| 3-Person Household | 6,214 | 15.6% |
| 4+ Person Household | 7,994 | 20.0% |
| Total Housing Units | 39,939 | 100.0% |
Occupancy by Ownership by Household Size in Longmont
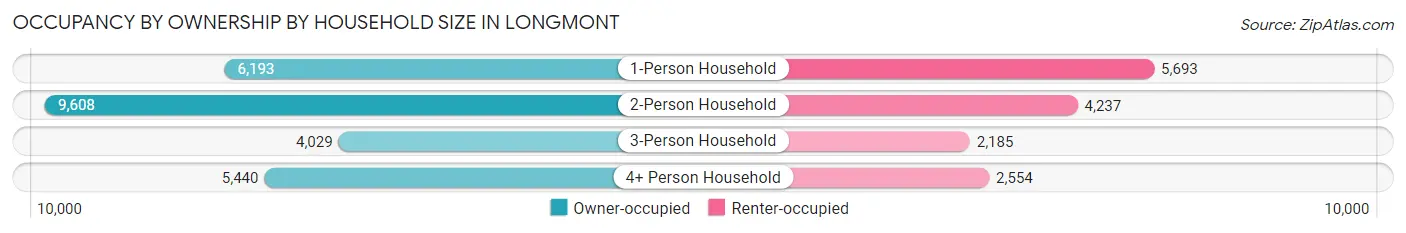
| Household Size | Owner-occupied | Renter-occupied |
| 1-Person Household | 6,193 (52.1%) | 5,693 (47.9%) |
| 2-Person Household | 9,608 (69.4%) | 4,237 (30.6%) |
| 3-Person Household | 4,029 (64.8%) | 2,185 (35.2%) |
| 4+ Person Household | 5,440 (68.0%) | 2,554 (32.0%) |
| Total Housing Units | 25,270 (63.3%) | 14,669 (36.7%) |
Occupancy by Educational Attainment in Longmont
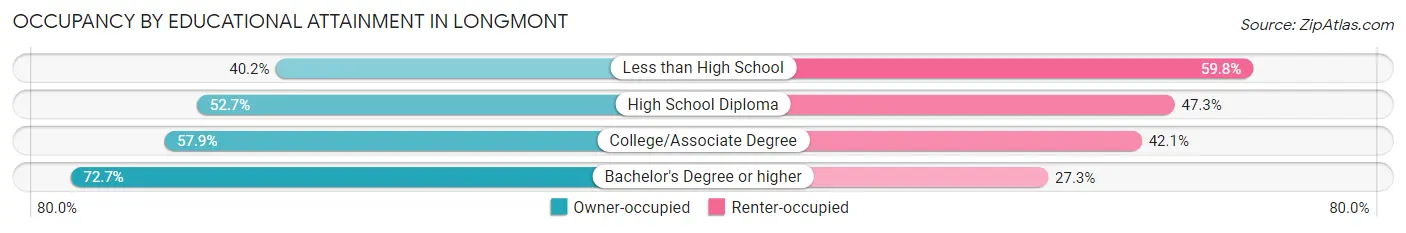
| Household Size | Owner-occupied | Renter-occupied |
| Less than High School | 999 (40.2%) | 1,484 (59.8%) |
| High School Diploma | 3,328 (52.7%) | 2,991 (47.3%) |
| College/Associate Degree | 6,640 (57.9%) | 4,832 (42.1%) |
| Bachelor's Degree or higher | 14,303 (72.7%) | 5,362 (27.3%) |
Occupancy by Age of Householder in Longmont
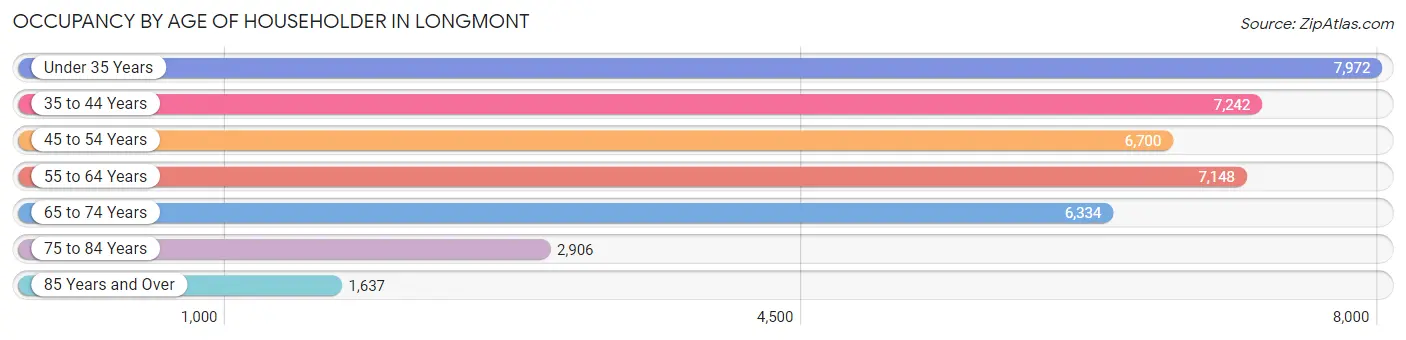
| Age Bracket | # Households | % Households |
| Under 35 Years | 7,972 | 20.0% |
| 35 to 44 Years | 7,242 | 18.1% |
| 45 to 54 Years | 6,700 | 16.8% |
| 55 to 64 Years | 7,148 | 17.9% |
| 65 to 74 Years | 6,334 | 15.9% |
| 75 to 84 Years | 2,906 | 7.3% |
| 85 Years and Over | 1,637 | 4.1% |
| Total | 39,939 | 100.0% |
Housing Finances in Longmont
Median Income by Occupancy in Longmont
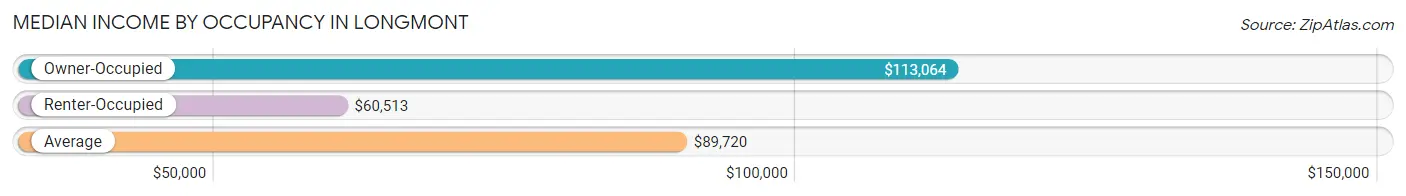
| Occupancy Type | # Households | Median Income |
| Owner-Occupied | 25,270 (63.3%) | $113,064 |
| Renter-Occupied | 14,669 (36.7%) | $60,513 |
| Average | 39,939 (100.0%) | $89,720 |
Occupancy by Householder Income Bracket in Longmont
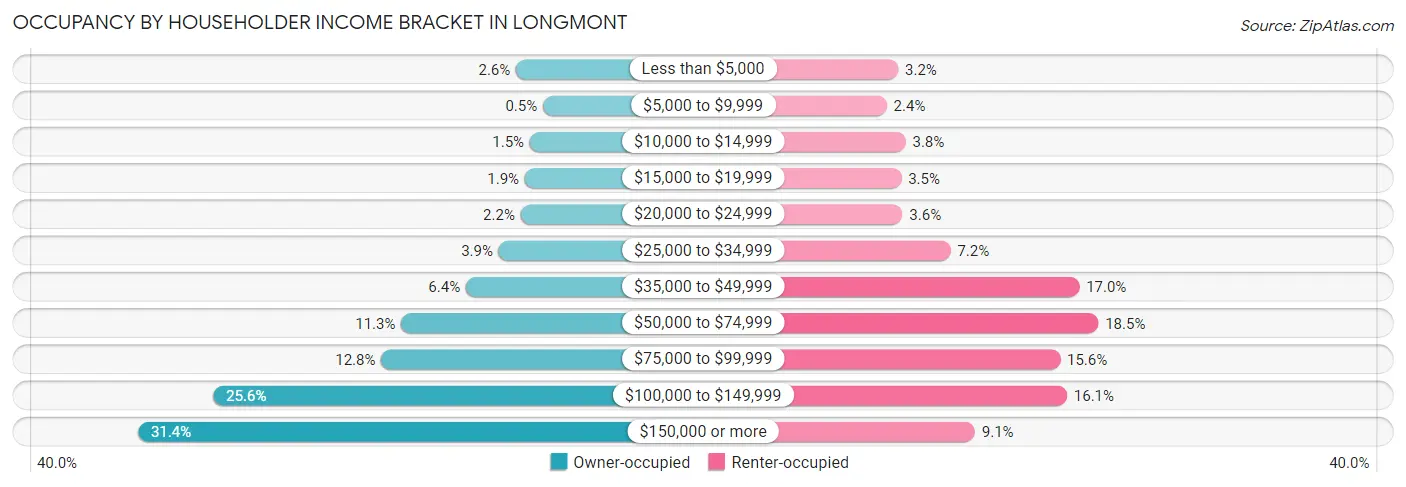
| Income Bracket | Owner-occupied | Renter-occupied |
| Less than $5,000 | 645 (2.5%) | 475 (3.2%) |
| $5,000 to $9,999 | 127 (0.5%) | 347 (2.4%) |
| $10,000 to $14,999 | 380 (1.5%) | 559 (3.8%) |
| $15,000 to $19,999 | 474 (1.9%) | 510 (3.5%) |
| $20,000 to $24,999 | 556 (2.2%) | 524 (3.6%) |
| $25,000 to $34,999 | 978 (3.9%) | 1,061 (7.2%) |
| $35,000 to $49,999 | 1,609 (6.4%) | 2,500 (17.0%) |
| $50,000 to $74,999 | 2,855 (11.3%) | 2,713 (18.5%) |
| $75,000 to $99,999 | 3,240 (12.8%) | 2,285 (15.6%) |
| $100,000 to $149,999 | 6,480 (25.6%) | 2,361 (16.1%) |
| $150,000 or more | 7,926 (31.4%) | 1,334 (9.1%) |
| Total | 25,270 (100.0%) | 14,669 (100.0%) |
Monthly Housing Cost Tiers in Longmont
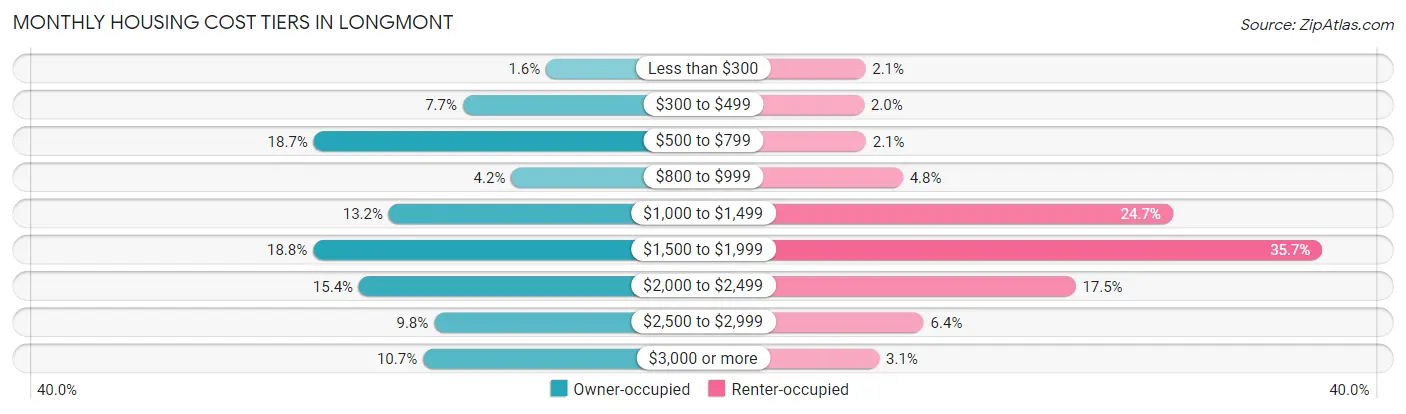
| Monthly Cost | Owner-occupied | Renter-occupied |
| Less than $300 | 402 (1.6%) | 301 (2.1%) |
| $300 to $499 | 1,954 (7.7%) | 286 (1.9%) |
| $500 to $799 | 4,727 (18.7%) | 307 (2.1%) |
| $800 to $999 | 1,051 (4.2%) | 706 (4.8%) |
| $1,000 to $1,499 | 3,330 (13.2%) | 3,622 (24.7%) |
| $1,500 to $1,999 | 4,740 (18.8%) | 5,237 (35.7%) |
| $2,000 to $2,499 | 3,886 (15.4%) | 2,572 (17.5%) |
| $2,500 to $2,999 | 2,486 (9.8%) | 931 (6.4%) |
| $3,000 or more | 2,694 (10.7%) | 451 (3.1%) |
| Total | 25,270 (100.0%) | 14,669 (100.0%) |
Physical Housing Characteristics in Longmont
Housing Structures in Longmont
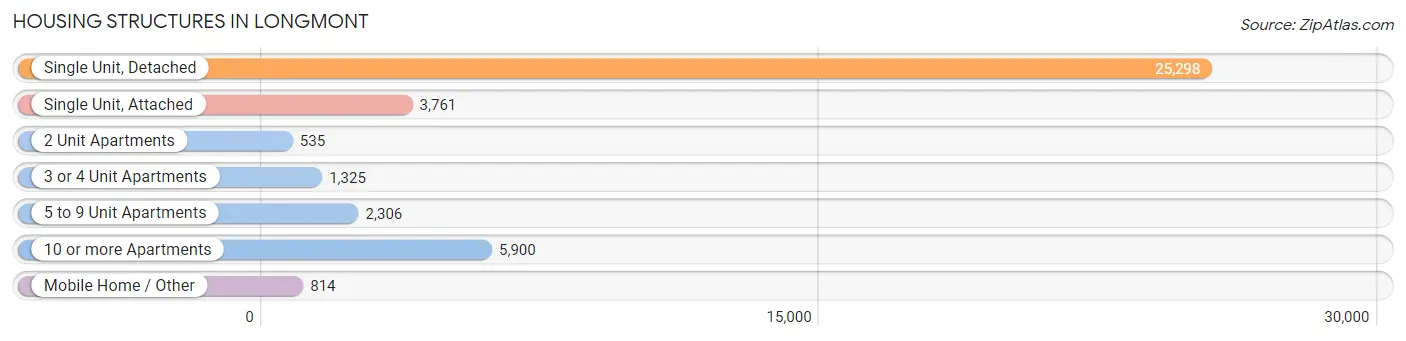
| Structure Type | # Housing Units | % Housing Units |
| Single Unit, Detached | 25,298 | 63.3% |
| Single Unit, Attached | 3,761 | 9.4% |
| 2 Unit Apartments | 535 | 1.3% |
| 3 or 4 Unit Apartments | 1,325 | 3.3% |
| 5 to 9 Unit Apartments | 2,306 | 5.8% |
| 10 or more Apartments | 5,900 | 14.8% |
| Mobile Home / Other | 814 | 2.0% |
| Total | 39,939 | 100.0% |
Housing Structures by Occupancy in Longmont
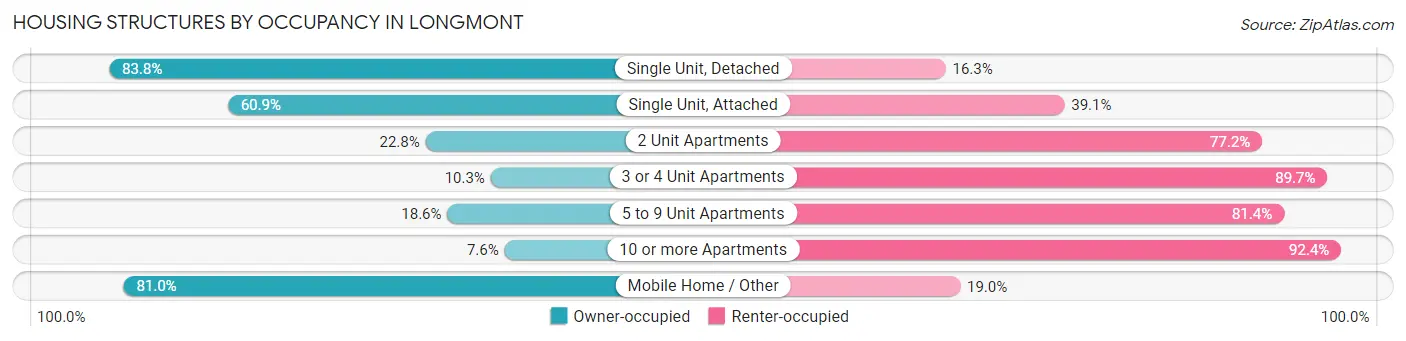
| Structure Type | Owner-occupied | Renter-occupied |
| Single Unit, Detached | 21,186 (83.8%) | 4,112 (16.3%) |
| Single Unit, Attached | 2,290 (60.9%) | 1,471 (39.1%) |
| 2 Unit Apartments | 122 (22.8%) | 413 (77.2%) |
| 3 or 4 Unit Apartments | 136 (10.3%) | 1,189 (89.7%) |
| 5 to 9 Unit Apartments | 429 (18.6%) | 1,877 (81.4%) |
| 10 or more Apartments | 448 (7.6%) | 5,452 (92.4%) |
| Mobile Home / Other | 659 (81.0%) | 155 (19.0%) |
| Total | 25,270 (63.3%) | 14,669 (36.7%) |
Housing Structures by Number of Rooms in Longmont
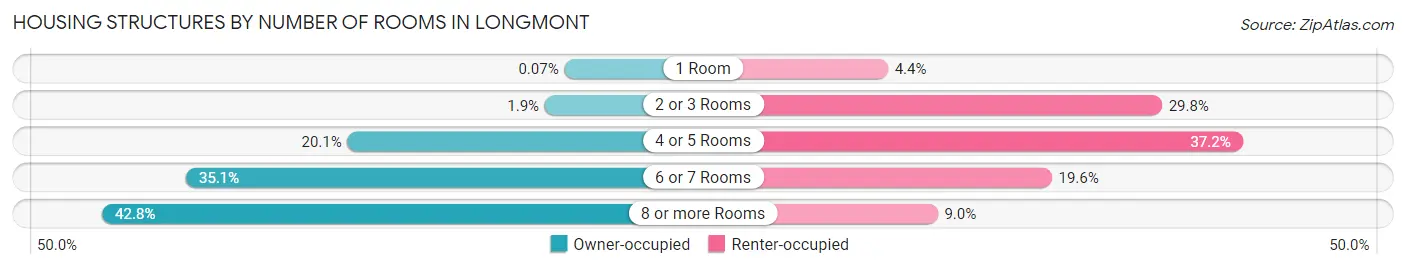
| Number of Rooms | Owner-occupied | Renter-occupied |
| 1 Room | 17 (0.1%) | 648 (4.4%) |
| 2 or 3 Rooms | 476 (1.9%) | 4,366 (29.8%) |
| 4 or 5 Rooms | 5,087 (20.1%) | 5,462 (37.2%) |
| 6 or 7 Rooms | 8,865 (35.1%) | 2,870 (19.6%) |
| 8 or more Rooms | 10,825 (42.8%) | 1,323 (9.0%) |
| Total | 25,270 (100.0%) | 14,669 (100.0%) |
Housing Structure by Heating Type in Longmont
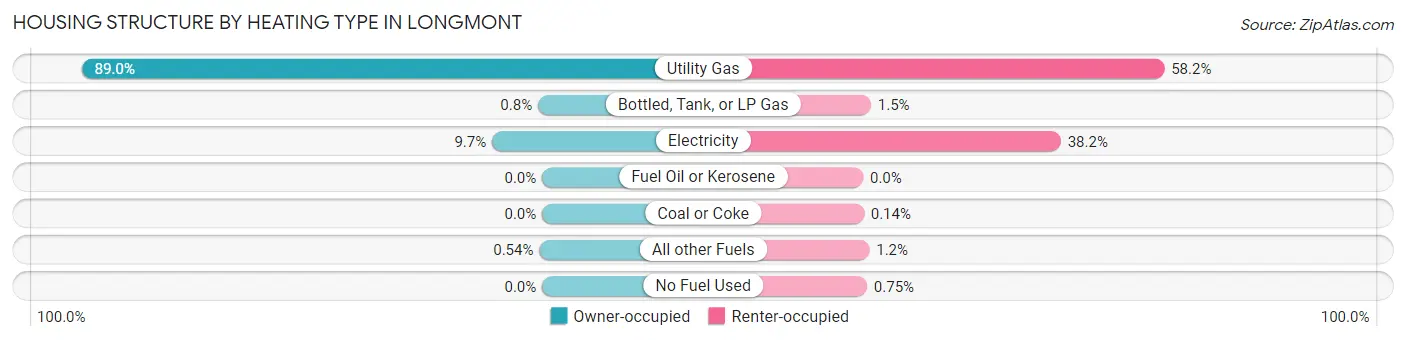
| Heating Type | Owner-occupied | Renter-occupied |
| Utility Gas | 22,487 (89.0%) | 8,538 (58.2%) |
| Bottled, Tank, or LP Gas | 201 (0.8%) | 221 (1.5%) |
| Electricity | 2,445 (9.7%) | 5,603 (38.2%) |
| Fuel Oil or Kerosene | 0 (0.0%) | 0 (0.0%) |
| Coal or Coke | 0 (0.0%) | 20 (0.1%) |
| All other Fuels | 137 (0.5%) | 177 (1.2%) |
| No Fuel Used | 0 (0.0%) | 110 (0.7%) |
| Total | 25,270 (100.0%) | 14,669 (100.0%) |
Household Vehicle Usage in Longmont
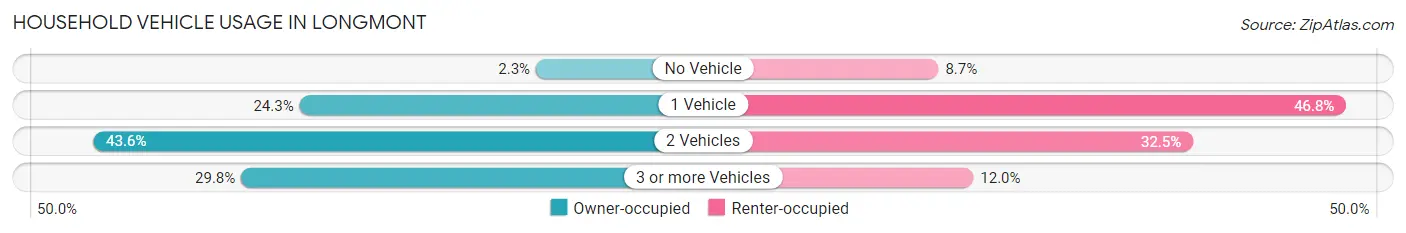
| Vehicles per Household | Owner-occupied | Renter-occupied |
| No Vehicle | 573 (2.3%) | 1,281 (8.7%) |
| 1 Vehicle | 6,151 (24.3%) | 6,863 (46.8%) |
| 2 Vehicles | 11,018 (43.6%) | 4,766 (32.5%) |
| 3 or more Vehicles | 7,528 (29.8%) | 1,759 (12.0%) |
| Total | 25,270 (100.0%) | 14,669 (100.0%) |
Real Estate & Mortgages in Longmont
Real Estate and Mortgage Overview in Longmont
| Characteristic | Without Mortgage | With Mortgage |
| Housing Units | 7,696 | 17,574 |
| Median Property Value | $475,900 | $493,300 |
| Median Household Income | $86,849 | $6,297 |
| Monthly Housing Costs | $593 | $2,670 |
| Real Estate Taxes | $2,488 | $204 |
Property Value by Mortgage Status in Longmont
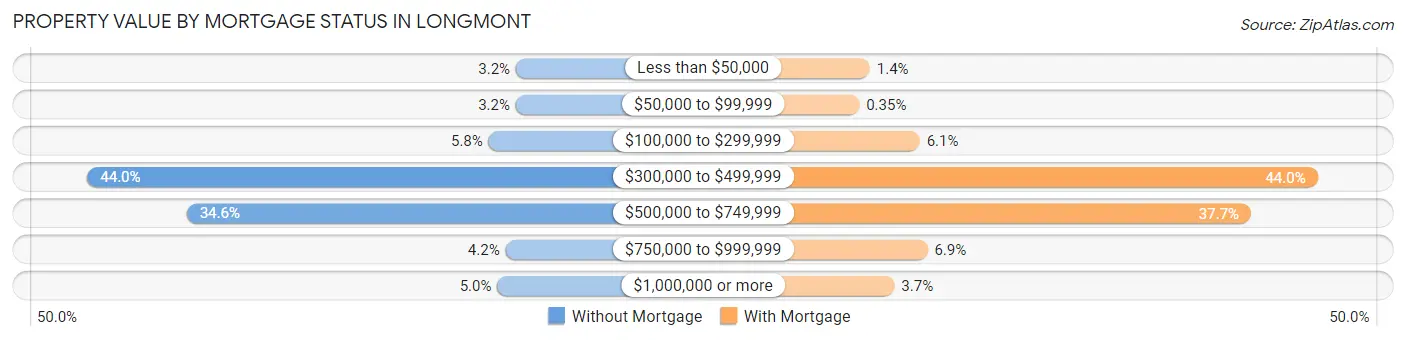
| Property Value | Without Mortgage | With Mortgage |
| Less than $50,000 | 247 (3.2%) | 239 (1.4%) |
| $50,000 to $99,999 | 248 (3.2%) | 61 (0.4%) |
| $100,000 to $299,999 | 447 (5.8%) | 1,073 (6.1%) |
| $300,000 to $499,999 | 3,388 (44.0%) | 7,731 (44.0%) |
| $500,000 to $749,999 | 2,660 (34.6%) | 6,617 (37.7%) |
| $750,000 to $999,999 | 323 (4.2%) | 1,203 (6.9%) |
| $1,000,000 or more | 383 (5.0%) | 650 (3.7%) |
| Total | 7,696 (100.0%) | 17,574 (100.0%) |
Household Income by Mortgage Status in Longmont
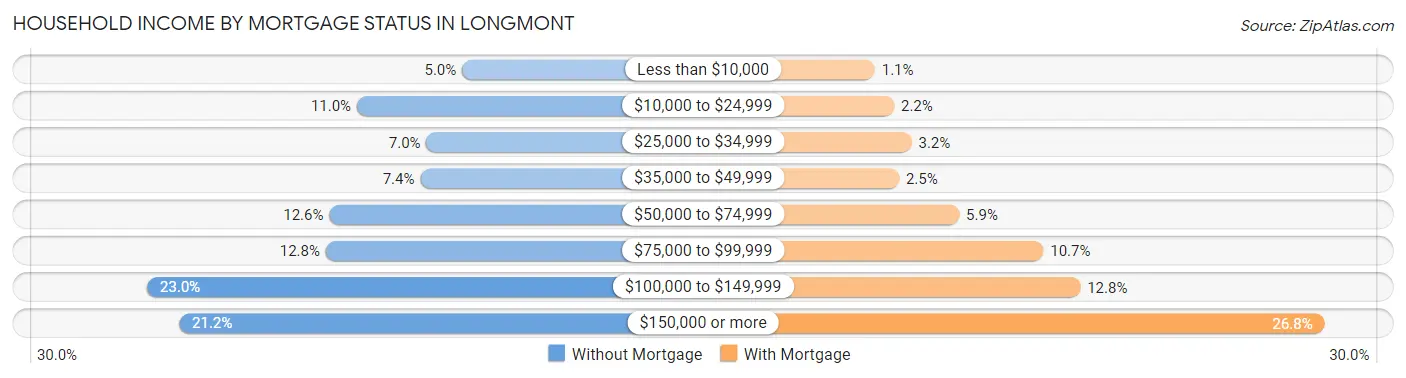
| Household Income | Without Mortgage | With Mortgage |
| Less than $10,000 | 385 (5.0%) | 193 (1.1%) |
| $10,000 to $24,999 | 847 (11.0%) | 387 (2.2%) |
| $25,000 to $34,999 | 542 (7.0%) | 563 (3.2%) |
| $35,000 to $49,999 | 569 (7.4%) | 436 (2.5%) |
| $50,000 to $74,999 | 969 (12.6%) | 1,040 (5.9%) |
| $75,000 to $99,999 | 984 (12.8%) | 1,886 (10.7%) |
| $100,000 to $149,999 | 1,771 (23.0%) | 2,256 (12.8%) |
| $150,000 or more | 1,629 (21.2%) | 4,709 (26.8%) |
| Total | 7,696 (100.0%) | 17,574 (100.0%) |
Property Value to Household Income Ratio in Longmont
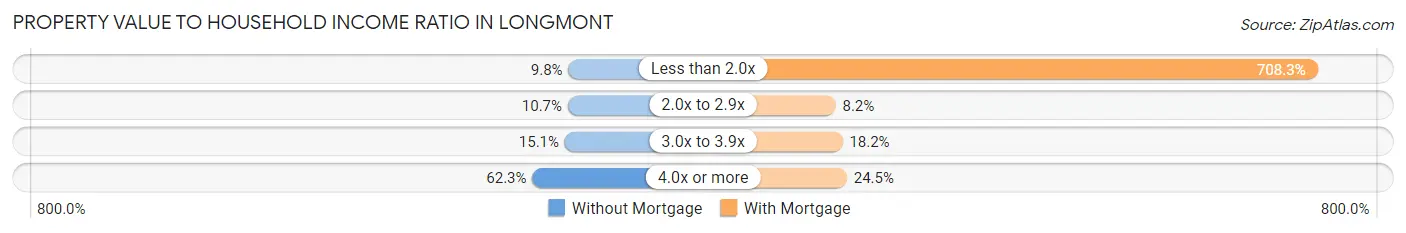
| Value-to-Income Ratio | Without Mortgage | With Mortgage |
| Less than 2.0x | 756 (9.8%) | 124,477 (708.3%) |
| 2.0x to 2.9x | 825 (10.7%) | 1,441 (8.2%) |
| 3.0x to 3.9x | 1,159 (15.1%) | 3,200 (18.2%) |
| 4.0x or more | 4,793 (62.3%) | 4,310 (24.5%) |
| Total | 7,696 (100.0%) | 17,574 (100.0%) |
Real Estate Taxes by Mortgage Status in Longmont
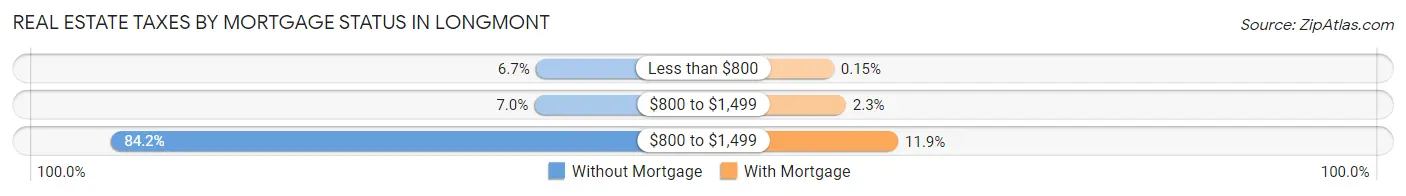
| Property Taxes | Without Mortgage | With Mortgage |
| Less than $800 | 515 (6.7%) | 27 (0.2%) |
| $800 to $1,499 | 535 (7.0%) | 411 (2.3%) |
| $800 to $1,499 | 6,476 (84.2%) | 2,088 (11.9%) |
| Total | 7,696 (100.0%) | 17,574 (100.0%) |
Health & Disability in Longmont
Health Insurance Coverage by Age in Longmont
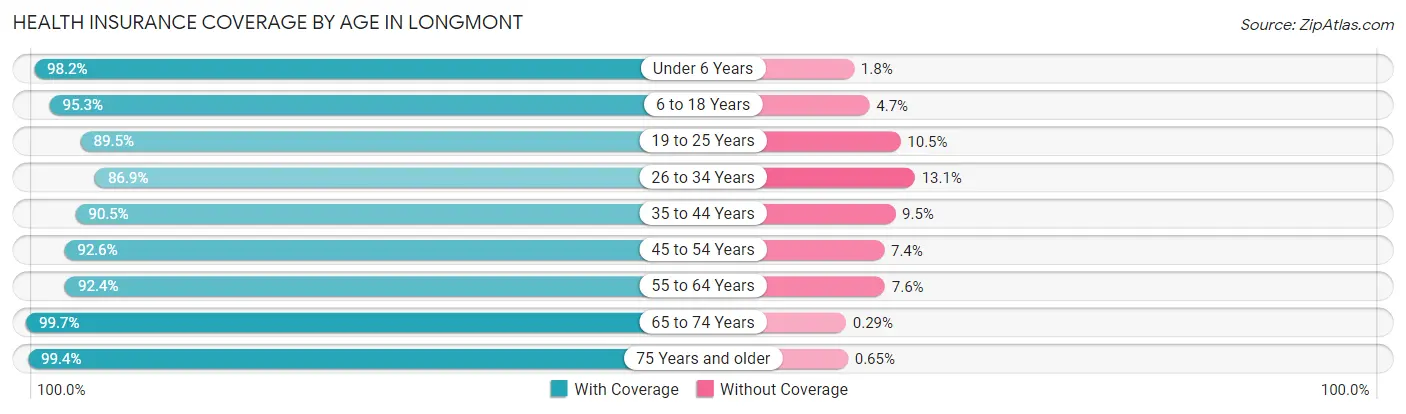
| Age Bracket | With Coverage | Without Coverage |
| Under 6 Years | 6,103 (98.2%) | 111 (1.8%) |
| 6 to 18 Years | 14,838 (95.3%) | 729 (4.7%) |
| 19 to 25 Years | 7,295 (89.5%) | 852 (10.5%) |
| 26 to 34 Years | 10,836 (86.9%) | 1,638 (13.1%) |
| 35 to 44 Years | 12,159 (90.5%) | 1,272 (9.5%) |
| 45 to 54 Years | 11,343 (92.6%) | 908 (7.4%) |
| 55 to 64 Years | 12,004 (92.4%) | 982 (7.6%) |
| 65 to 74 Years | 9,956 (99.7%) | 29 (0.3%) |
| 75 Years and older | 6,448 (99.4%) | 42 (0.6%) |
| Total | 90,982 (93.3%) | 6,563 (6.7%) |
Health Insurance Coverage by Citizenship Status in Longmont
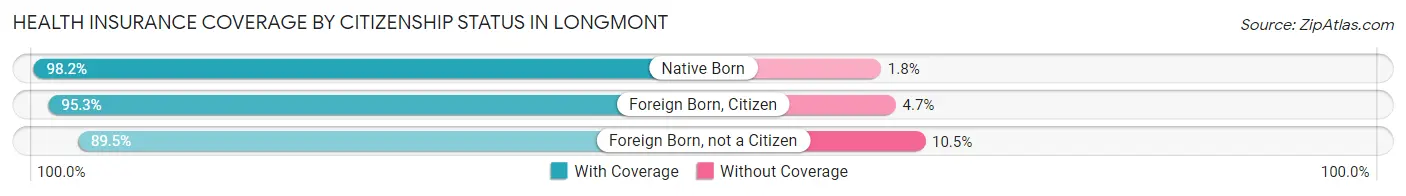
| Citizenship Status | With Coverage | Without Coverage |
| Native Born | 6,103 (98.2%) | 111 (1.8%) |
| Foreign Born, Citizen | 14,838 (95.3%) | 729 (4.7%) |
| Foreign Born, not a Citizen | 7,295 (89.5%) | 852 (10.5%) |
Health Insurance Coverage by Household Income in Longmont
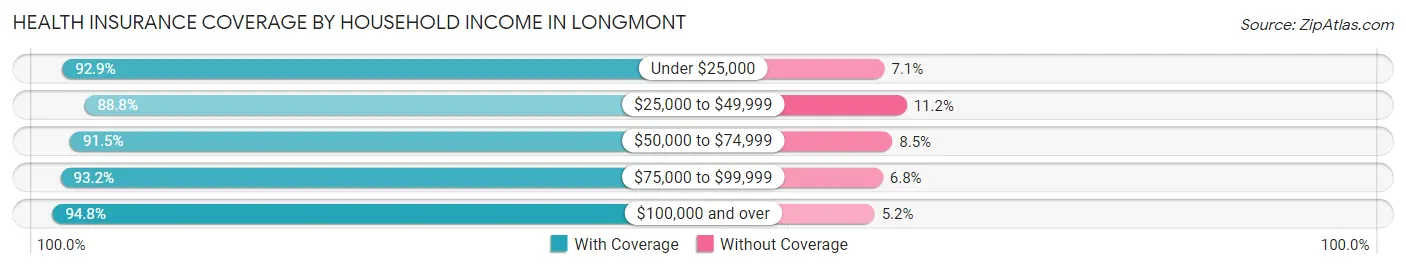
| Household Income | With Coverage | Without Coverage |
| Under $25,000 | 6,255 (92.9%) | 476 (7.1%) |
| $25,000 to $49,999 | 9,623 (88.8%) | 1,217 (11.2%) |
| $50,000 to $74,999 | 11,512 (91.5%) | 1,074 (8.5%) |
| $75,000 to $99,999 | 12,899 (93.2%) | 935 (6.8%) |
| $100,000 and over | 50,459 (94.8%) | 2,787 (5.2%) |
Public vs Private Health Insurance Coverage by Age in Longmont
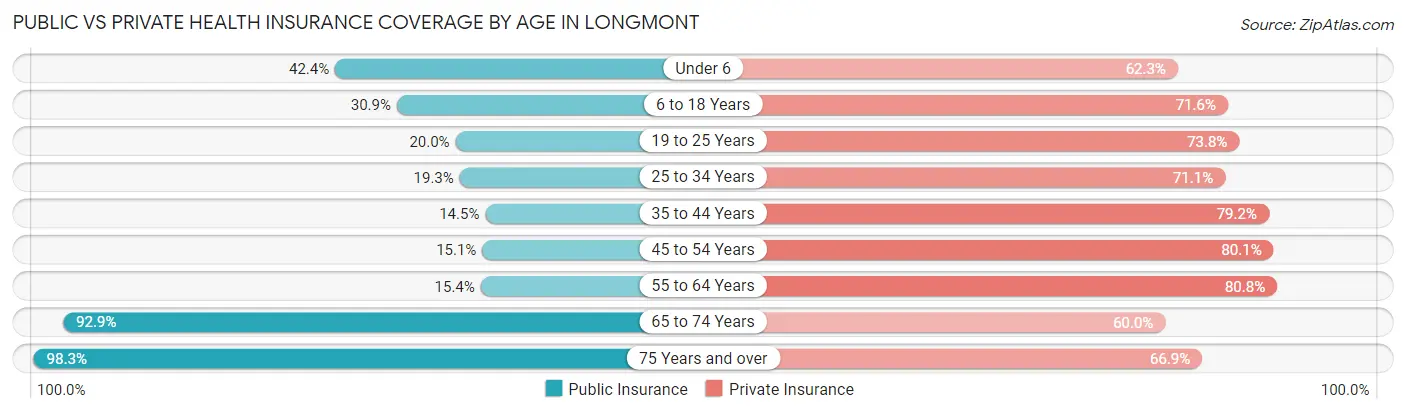
| Age Bracket | Public Insurance | Private Insurance |
| Under 6 | 2,633 (42.4%) | 3,874 (62.3%) |
| 6 to 18 Years | 4,811 (30.9%) | 11,150 (71.6%) |
| 19 to 25 Years | 1,632 (20.0%) | 6,009 (73.8%) |
| 25 to 34 Years | 2,402 (19.3%) | 8,872 (71.1%) |
| 35 to 44 Years | 1,948 (14.5%) | 10,643 (79.2%) |
| 45 to 54 Years | 1,845 (15.1%) | 9,816 (80.1%) |
| 55 to 64 Years | 1,995 (15.4%) | 10,489 (80.8%) |
| 65 to 74 Years | 9,271 (92.8%) | 5,993 (60.0%) |
| 75 Years and over | 6,380 (98.3%) | 4,339 (66.9%) |
| Total | 32,917 (33.8%) | 71,185 (73.0%) |
Disability Status by Sex by Age in Longmont
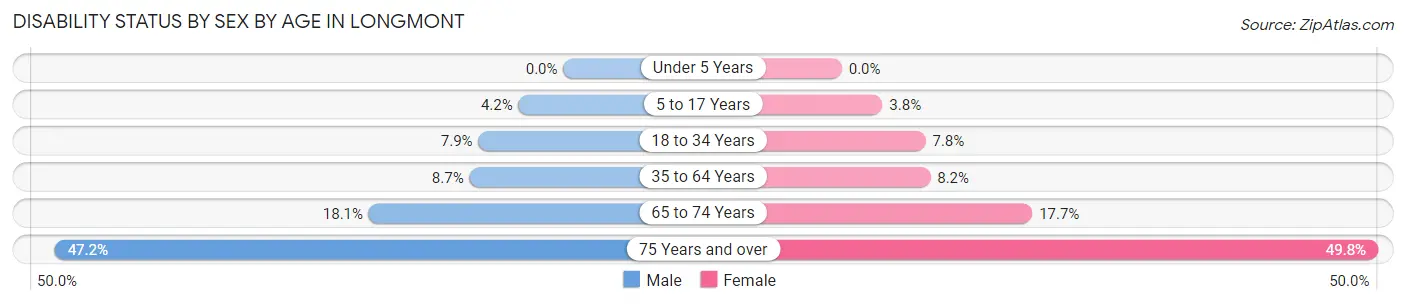
| Age Bracket | Male | Female |
| Under 5 Years | 0 (0.0%) | 0 (0.0%) |
| 5 to 17 Years | 347 (4.2%) | 255 (3.8%) |
| 18 to 34 Years | 879 (7.9%) | 868 (7.8%) |
| 35 to 64 Years | 1,709 (8.7%) | 1,564 (8.2%) |
| 65 to 74 Years | 835 (18.0%) | 947 (17.7%) |
| 75 Years and over | 1,146 (47.2%) | 2,021 (49.7%) |
Disability Class by Sex by Age in Longmont
Disability Class: Hearing Difficulty
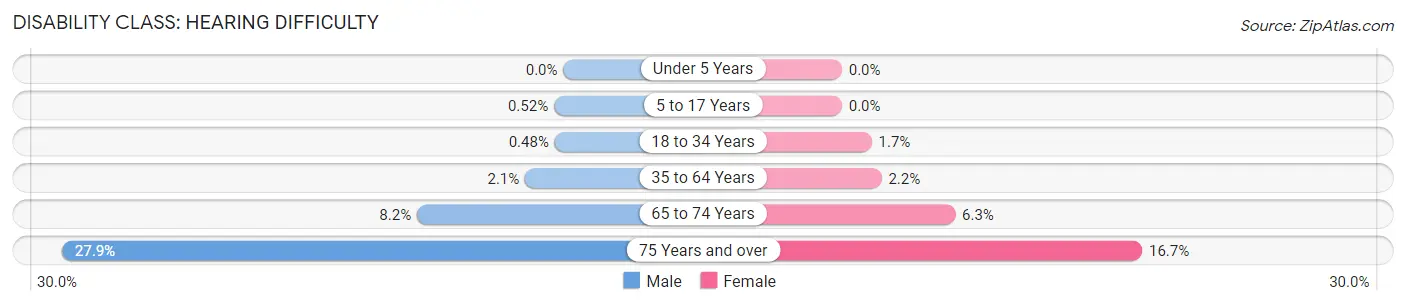
| Age Bracket | Male | Female |
| Under 5 Years | 0 (0.0%) | 0 (0.0%) |
| 5 to 17 Years | 43 (0.5%) | 0 (0.0%) |
| 18 to 34 Years | 53 (0.5%) | 185 (1.7%) |
| 35 to 64 Years | 418 (2.1%) | 422 (2.2%) |
| 65 to 74 Years | 377 (8.2%) | 338 (6.3%) |
| 75 Years and over | 678 (27.9%) | 679 (16.7%) |
Disability Class: Vision Difficulty
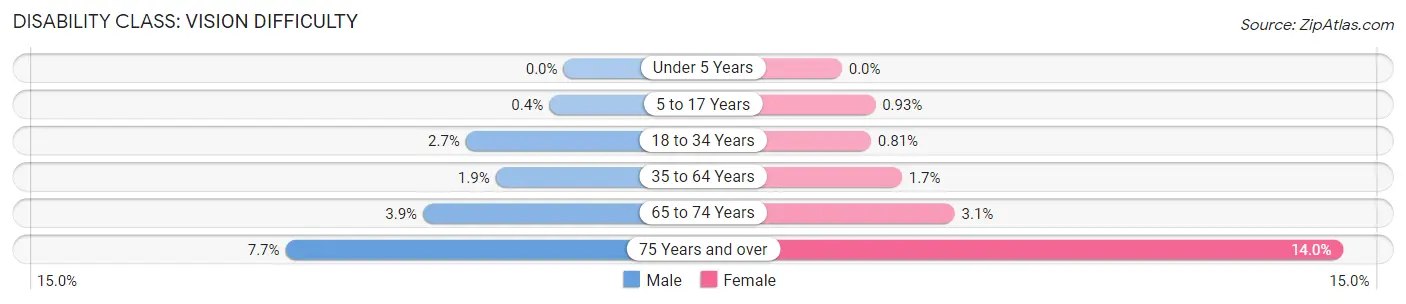
| Age Bracket | Male | Female |
| Under 5 Years | 0 (0.0%) | 0 (0.0%) |
| 5 to 17 Years | 33 (0.4%) | 63 (0.9%) |
| 18 to 34 Years | 303 (2.7%) | 90 (0.8%) |
| 35 to 64 Years | 370 (1.9%) | 319 (1.7%) |
| 65 to 74 Years | 181 (3.9%) | 168 (3.1%) |
| 75 Years and over | 188 (7.7%) | 567 (14.0%) |
Disability Class: Cognitive Difficulty
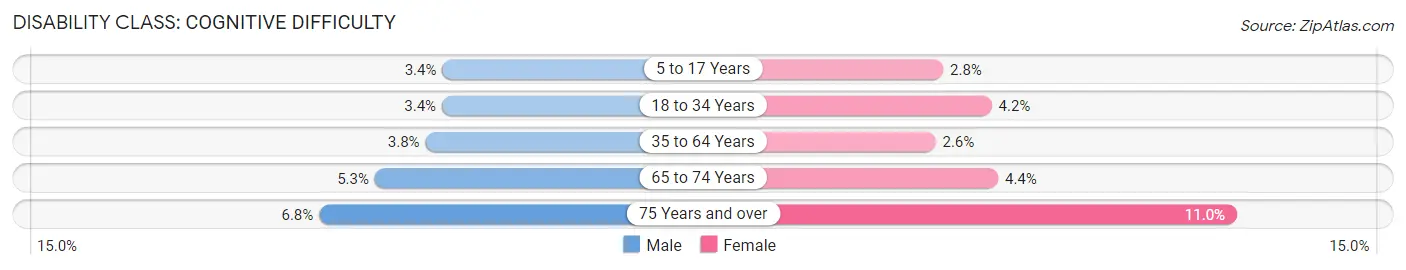
| Age Bracket | Male | Female |
| 5 to 17 Years | 281 (3.4%) | 191 (2.8%) |
| 18 to 34 Years | 377 (3.4%) | 466 (4.2%) |
| 35 to 64 Years | 753 (3.8%) | 497 (2.6%) |
| 65 to 74 Years | 243 (5.2%) | 233 (4.3%) |
| 75 Years and over | 165 (6.8%) | 447 (11.0%) |
Disability Class: Ambulatory Difficulty
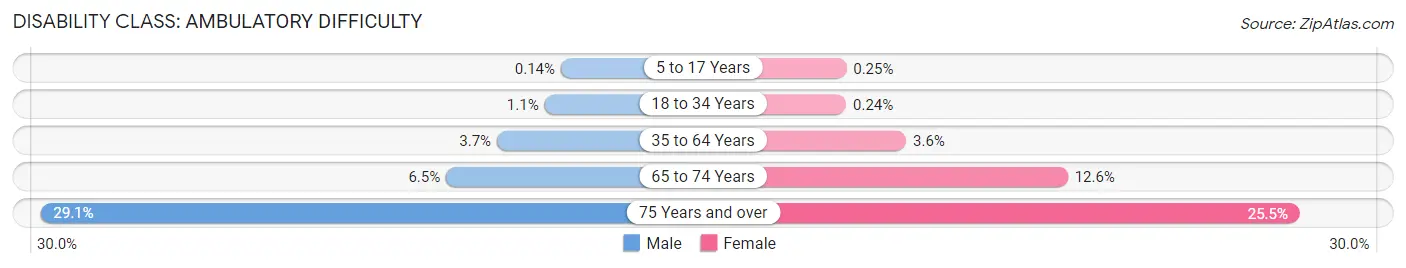
| Age Bracket | Male | Female |
| 5 to 17 Years | 12 (0.1%) | 17 (0.3%) |
| 18 to 34 Years | 117 (1.1%) | 27 (0.2%) |
| 35 to 64 Years | 725 (3.7%) | 682 (3.6%) |
| 65 to 74 Years | 302 (6.5%) | 674 (12.6%) |
| 75 Years and over | 707 (29.1%) | 1,036 (25.5%) |
Disability Class: Self-Care Difficulty
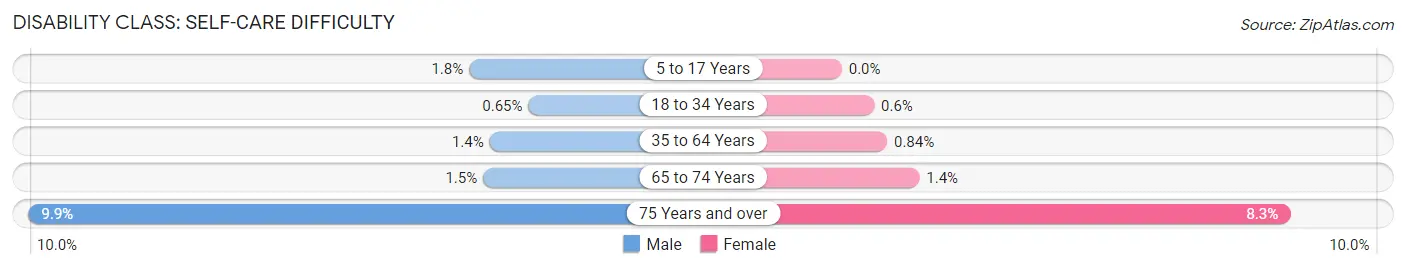
| Age Bracket | Male | Female |
| 5 to 17 Years | 146 (1.8%) | 0 (0.0%) |
| 18 to 34 Years | 72 (0.6%) | 67 (0.6%) |
| 35 to 64 Years | 269 (1.4%) | 160 (0.8%) |
| 65 to 74 Years | 69 (1.5%) | 77 (1.4%) |
| 75 Years and over | 241 (9.9%) | 338 (8.3%) |
Technology Access in Longmont
Computing Device Access in Longmont
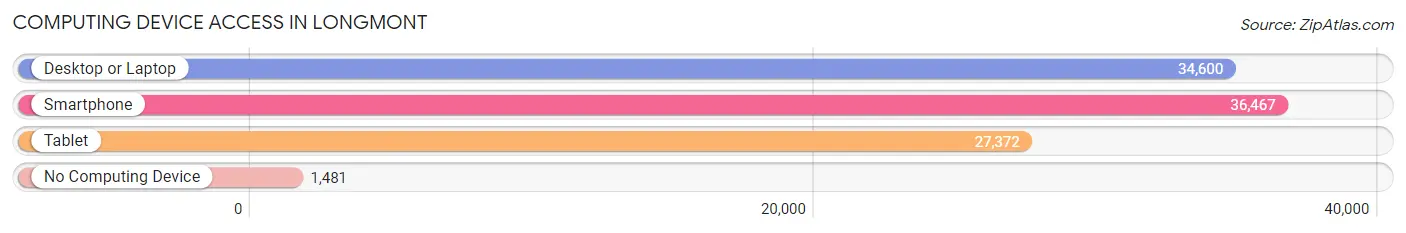
| Device Type | # Households | % Households |
| Desktop or Laptop | 34,600 | 86.6% |
| Smartphone | 36,467 | 91.3% |
| Tablet | 27,372 | 68.5% |
| No Computing Device | 1,481 | 3.7% |
| Total | 39,939 | 100.0% |
Internet Access in Longmont
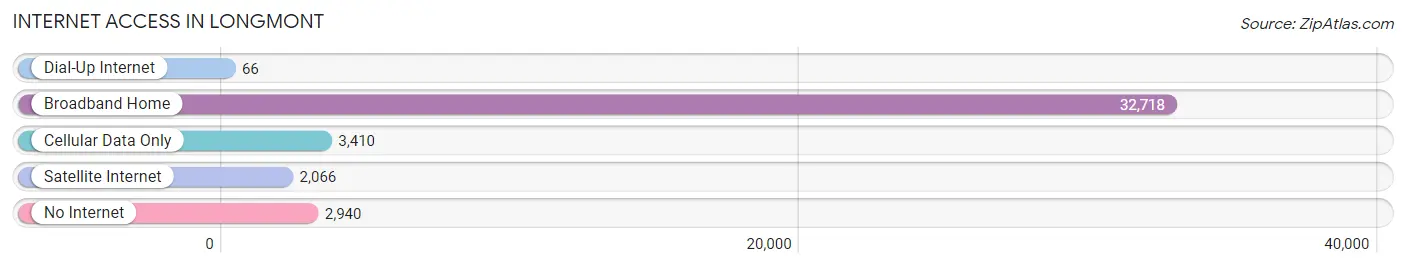
| Internet Type | # Households | % Households |
| Dial-Up Internet | 66 | 0.2% |
| Broadband Home | 32,718 | 81.9% |
| Cellular Data Only | 3,410 | 8.5% |
| Satellite Internet | 2,066 | 5.2% |
| No Internet | 2,940 | 7.4% |
| Total | 39,939 | 100.0% |
Longmont Summary
Longmont, Colorado is a city located in Boulder County, Colorado, United States. The city is situated in the foothills of the Rocky Mountains, approximately 30 miles (48 km) north of the state capital of Denver. Longmont is the 13th most populous city in the state of Colorado, with a population of 92,567 as of the 2020 census.
History
Longmont was founded in 1871 by a group of settlers from Chicago, Illinois. The city was named after Longs Peak, a prominent mountain in the area. The city was originally a farming community, and the first settlers were primarily of German and Irish descent. The city was incorporated in 1884, and the first mayor was elected in 1886.
In the early 1900s, Longmont experienced a period of rapid growth, due to the arrival of the railroad and the development of the sugar beet industry. The city was also home to a number of coal mines, which provided employment for many of the city's residents.
Geography
Longmont is located in the foothills of the Rocky Mountains, at an elevation of 4,979 feet (1,519 m). The city is situated on the banks of the St. Vrain River, which flows through the city from east to west. The city is surrounded by several mountain ranges, including the Front Range, the Indian Peaks, and the Longs Peak Range.
The city has a total area of 27.2 square miles (70.5 km2), of which 26.9 square miles (69.6 km2) is land and 0.3 square miles (0.8 km2) is water.
Economy
Longmont's economy is largely based on agriculture, technology, and manufacturing. The city is home to several large companies, including Seagate Technology, Amgen, and DigitalGlobe. The city is also home to a number of smaller businesses, including craft breweries, restaurants, and retail stores.
The city is also home to a number of educational institutions, including the University of Colorado Boulder, Front Range Community College, and the Longmont campus of the University of Northern Colorado.
Demographics
As of the 2020 census, Longmont had a population of 92,567. The racial makeup of the city was 79.2% White, 4.2% African American, 0.7% Native American, 5.2% Asian, 0.2% Pacific Islander, 6.7% from other races, and 3.8% from two or more races. Hispanic or Latino of any race were 18.2% of the population.
The median income for a household in Longmont was $63,945, and the median income for a family was $76,945. The per capita income for the city was $30,945. About 8.2% of families and 11.2% of the population were below the poverty line, including 15.2% of those under age 18 and 6.2% of those age 65 or over.
Common Questions
What is Per Capita Income in Longmont?
Per Capita income in Longmont is $45,482.
What is the Median Family Income in Longmont?
Median Family Income in Longmont is $112,262.
What is the Median Household income in Longmont?
Median Household Income in Longmont is $89,720.
What is Income or Wage Gap in Longmont?
Income or Wage Gap in Longmont is 35.0%.
Women in Longmont earn 65.0 cents for every dollar earned by a man.
What is Family Income Deficit in Longmont?
Family Income Deficit in Longmont is $9,118.
Families that are below poverty line in Longmont earn $9,118 less on average than the poverty threshold level.
What is Inequality or Gini Index in Longmont?
Inequality or Gini Index in Longmont is 0.42.
What is the Total Population of Longmont?
Total Population of Longmont is 98,282.
What is the Total Male Population of Longmont?
Total Male Population of Longmont is 48,880.
What is the Total Female Population of Longmont?
Total Female Population of Longmont is 49,402.
What is the Ratio of Males per 100 Females in Longmont?
There are 98.94 Males per 100 Females in Longmont.
What is the Ratio of Females per 100 Males in Longmont?
There are 101.07 Females per 100 Males in Longmont.
What is the Median Population Age in Longmont?
Median Population Age in Longmont is 39.7 Years.
What is the Average Family Size in Longmont
Average Family Size in Longmont is 3.1 People.
What is the Average Household Size in Longmont
Average Household Size in Longmont is 2.4 People.
How Large is the Labor Force in Longmont?
There are 55,417 People in the Labor Forcein in Longmont.
What is the Percentage of People in the Labor Force in Longmont?
68.6% of People are in the Labor Force in Longmont.
What is the Unemployment Rate in Longmont?
Unemployment Rate in Longmont is 4.1%.