Ken Caryl, CO Map & Demographics
Ken Caryl Map
Ken Caryl Overview
$55,735
PER CAPITA INCOME
$133,750
AVG FAMILY INCOME
$113,459
AVG HOUSEHOLD INCOME
22.3%
WAGE / INCOME GAP [ % ]
77.7¢/ $1
WAGE / INCOME GAP [ $ ]
$7,917
FAMILY INCOME DEFICIT
0.38
INEQUALITY / GINI INDEX
33,505
TOTAL POPULATION
16,924
MALE POPULATION
16,581
FEMALE POPULATION
102.07
MALES / 100 FEMALES
97.97
FEMALES / 100 MALES
41.5
MEDIAN AGE
3.0
AVG FAMILY SIZE
2.5
AVG HOUSEHOLD SIZE
19,852
LABOR FORCE [ PEOPLE ]
72.7%
PERCENT IN LABOR FORCE
3.5%
UNEMPLOYMENT RATE
Income in Ken Caryl
Income Overview in Ken Caryl
Per Capita Income in Ken Caryl is $55,735, while median incomes of families and households are $133,750 and $113,459 respectively.
| Characteristic | Number | Measure |
| Per Capita Income | 33,505 | $55,735 |
| Median Family Income | 9,286 | $133,750 |
| Mean Family Income | 9,286 | $155,531 |
| Median Household Income | 13,647 | $113,459 |
| Mean Household Income | 13,647 | $136,057 |
| Income Deficit | 9,286 | $7,917 |
| Wage / Income Gap (%) | 33,505 | 22.34% |
| Wage / Income Gap ($) | 33,505 | 77.66¢ per $1 |
| Gini / Inequality Index | 33,505 | 0.38 |
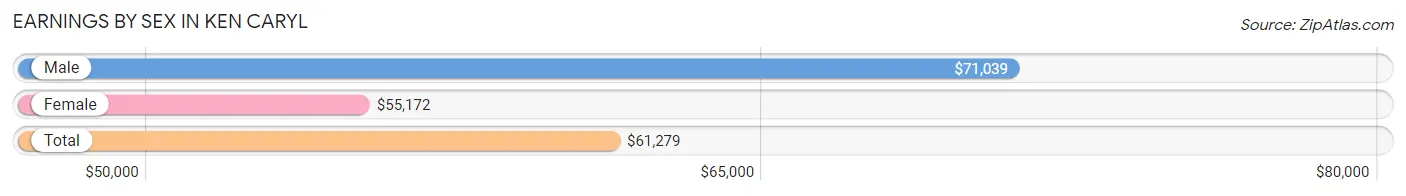
Earnings by Sex in Ken Caryl
Average Earnings in Ken Caryl are $61,279, $71,039 for men and $55,172 for women, a difference of 22.3%.
| Sex | Number | Average Earnings |
| Male | 10,906 (52.7%) | $71,039 |
| Female | 9,791 (47.3%) | $55,172 |
| Total | 20,697 (100.0%) | $61,279 |
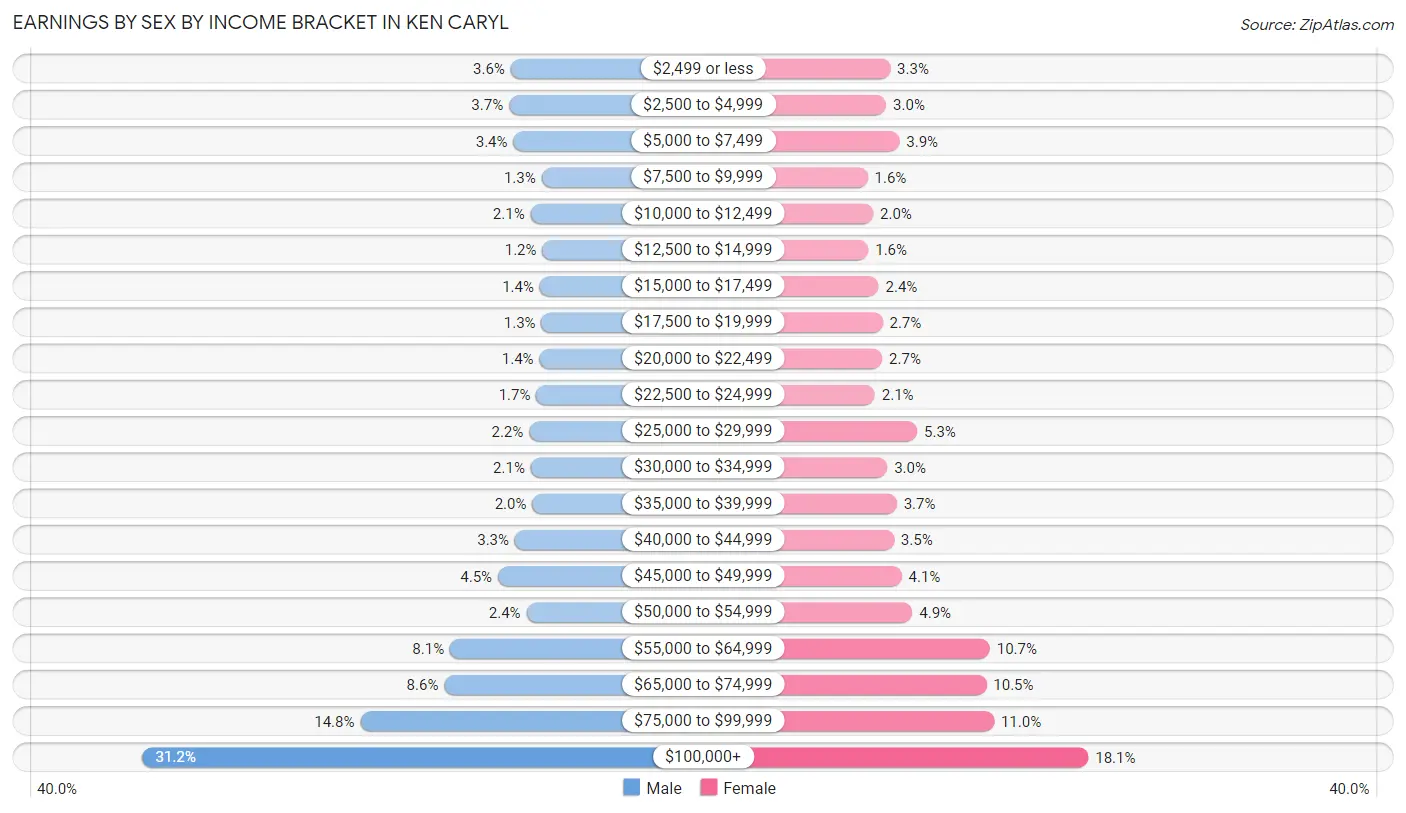
Earnings by Sex by Income Bracket in Ken Caryl
The most common earnings brackets in Ken Caryl are $100,000+ for men (3,398 | 31.2%) and $100,000+ for women (1,772 | 18.1%).
| Income | Male | Female |
| $2,499 or less | 389 (3.6%) | 318 (3.3%) |
| $2,500 to $4,999 | 403 (3.7%) | 289 (2.9%) |
| $5,000 to $7,499 | 368 (3.4%) | 386 (3.9%) |
| $7,500 to $9,999 | 137 (1.3%) | 153 (1.6%) |
| $10,000 to $12,499 | 228 (2.1%) | 193 (2.0%) |
| $12,500 to $14,999 | 131 (1.2%) | 158 (1.6%) |
| $15,000 to $17,499 | 152 (1.4%) | 233 (2.4%) |
| $17,500 to $19,999 | 139 (1.3%) | 262 (2.7%) |
| $20,000 to $22,499 | 155 (1.4%) | 259 (2.6%) |
| $22,500 to $24,999 | 180 (1.7%) | 206 (2.1%) |
| $25,000 to $29,999 | 239 (2.2%) | 516 (5.3%) |
| $30,000 to $34,999 | 226 (2.1%) | 297 (3.0%) |
| $35,000 to $39,999 | 213 (1.9%) | 366 (3.7%) |
| $40,000 to $44,999 | 356 (3.3%) | 346 (3.5%) |
| $45,000 to $49,999 | 494 (4.5%) | 402 (4.1%) |
| $50,000 to $54,999 | 261 (2.4%) | 481 (4.9%) |
| $55,000 to $64,999 | 886 (8.1%) | 1,050 (10.7%) |
| $65,000 to $74,999 | 933 (8.6%) | 1,024 (10.5%) |
| $75,000 to $99,999 | 1,618 (14.8%) | 1,080 (11.0%) |
| $100,000+ | 3,398 (31.2%) | 1,772 (18.1%) |
| Total | 10,906 (100.0%) | 9,791 (100.0%) |
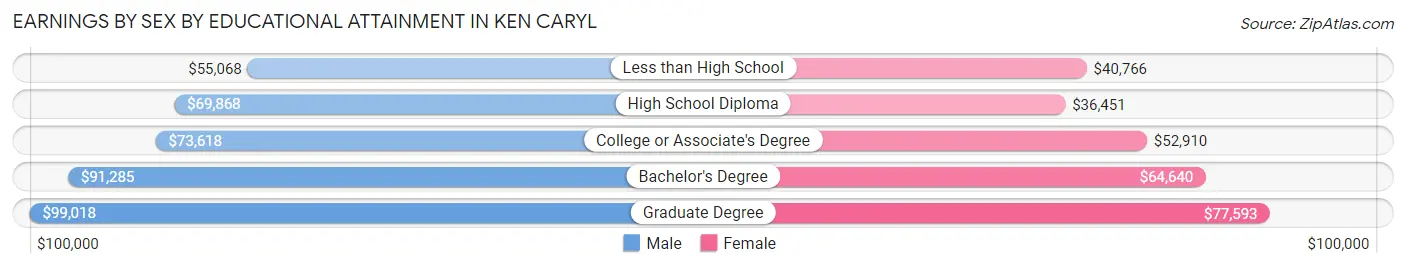
Earnings by Sex by Educational Attainment in Ken Caryl
Average earnings in Ken Caryl are $78,971 for men and $57,941 for women, a difference of 26.6%. Men with an educational attainment of graduate degree enjoy the highest average annual earnings of $99,018, while those with less than high school education earn the least with $55,068. Women with an educational attainment of graduate degree earn the most with the average annual earnings of $77,593, while those with high school diploma education have the smallest earnings of $36,451.
| Educational Attainment | Male Income | Female Income |
| Less than High School | $55,068 | $40,766 |
| High School Diploma | $69,868 | $36,451 |
| College or Associate's Degree | $73,618 | $52,910 |
| Bachelor's Degree | $91,285 | $64,640 |
| Graduate Degree | $99,018 | $77,593 |
| Total | $78,971 | $57,941 |
Family Income in Ken Caryl
Family Income Brackets in Ken Caryl
According to the Ken Caryl family income data, there are 2,424 families falling into the $100,000 to $149,999 income range, which is the most common income bracket and makes up 26.1% of all families. Conversely, the $15,000 to $24,999 income bracket is the least frequent group with only 65 families (0.7%) belonging to this category.
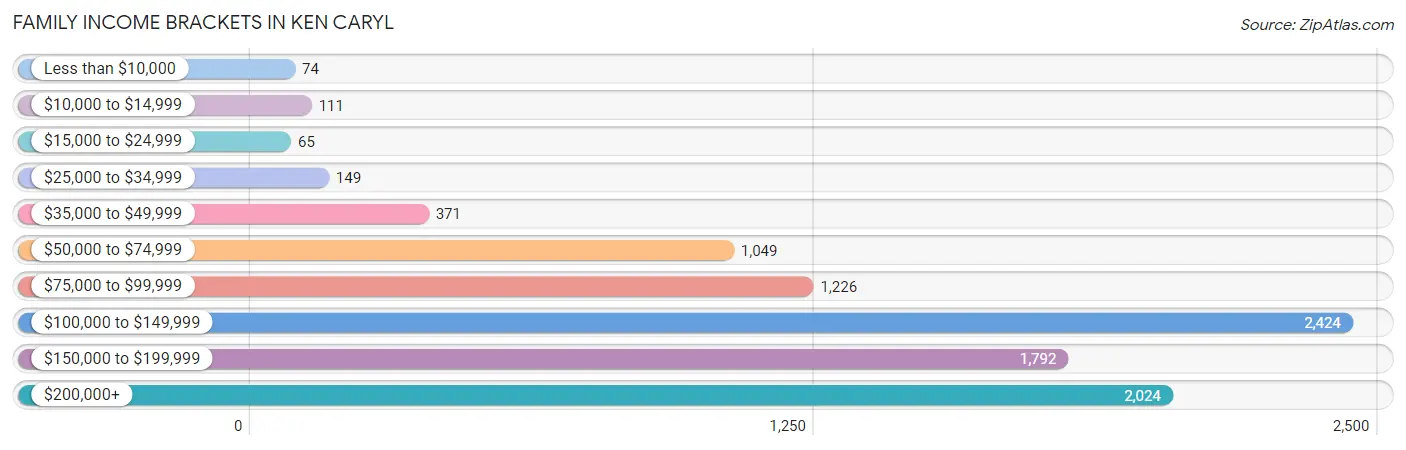
| Income Bracket | # Families | % Families |
| Less than $10,000 | 74 | 0.8% |
| $10,000 to $14,999 | 111 | 1.2% |
| $15,000 to $24,999 | 65 | 0.7% |
| $25,000 to $34,999 | 149 | 1.6% |
| $35,000 to $49,999 | 371 | 4.0% |
| $50,000 to $74,999 | 1,049 | 11.3% |
| $75,000 to $99,999 | 1,226 | 13.2% |
| $100,000 to $149,999 | 2,424 | 26.1% |
| $150,000 to $199,999 | 1,792 | 19.3% |
| $200,000+ | 2,024 | 21.8% |
Family Income by Famaliy Size in Ken Caryl
4-person families (1,731 | 18.6%) account for the highest median family income in Ken Caryl with $158,390 per family, while 2-person families (4,494 | 48.4%) have the highest median income of $57,557 per family member.
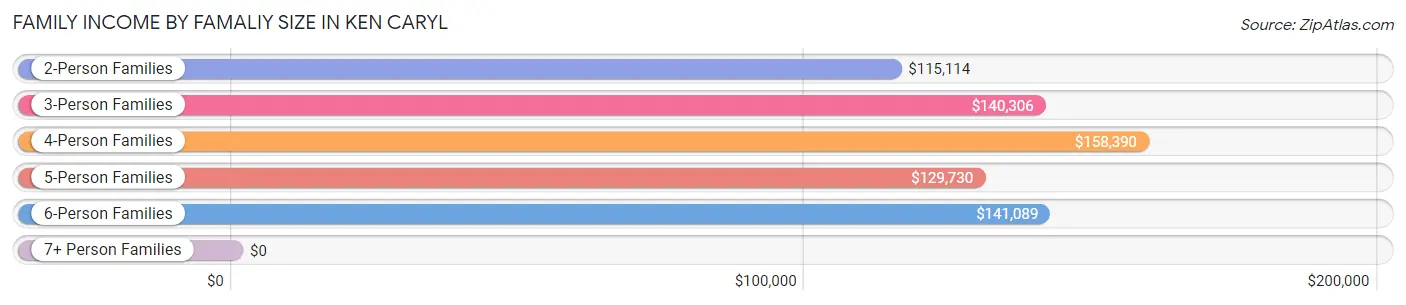
| Income Bracket | # Families | Median Income |
| 2-Person Families | 4,494 (48.4%) | $115,114 |
| 3-Person Families | 2,110 (22.7%) | $140,306 |
| 4-Person Families | 1,731 (18.6%) | $158,390 |
| 5-Person Families | 664 (7.1%) | $129,730 |
| 6-Person Families | 257 (2.8%) | $141,089 |
| 7+ Person Families | 30 (0.3%) | $0 |
| Total | 9,286 (100.0%) | $133,750 |
Family Income by Number of Earners in Ken Caryl
The median family income in Ken Caryl is $133,750, with families comprising 3+ earners (1,476) having the highest median family income of $187,941, while families with no earners (967) have the lowest median family income of $69,757, accounting for 15.9% and 10.4% of families, respectively.
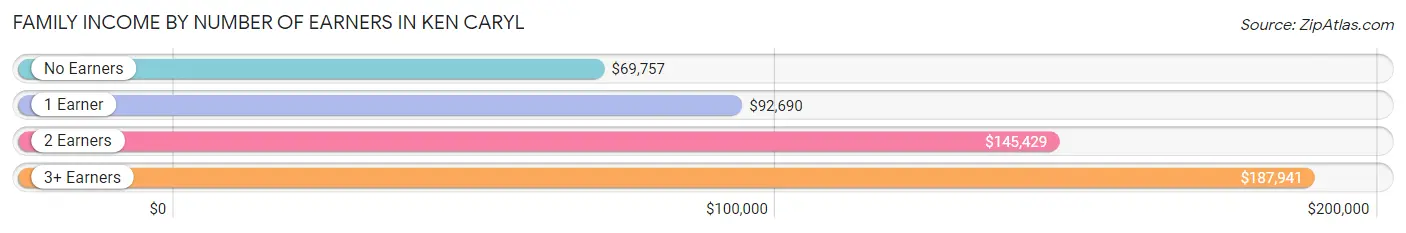
| Number of Earners | # Families | Median Income |
| No Earners | 967 (10.4%) | $69,757 |
| 1 Earner | 2,341 (25.2%) | $92,690 |
| 2 Earners | 4,502 (48.5%) | $145,429 |
| 3+ Earners | 1,476 (15.9%) | $187,941 |
| Total | 9,286 (100.0%) | $133,750 |
Household Income in Ken Caryl
Household Income Brackets in Ken Caryl
With 3,357 households falling in the category, the $100,000 to $149,999 income range is the most frequent in Ken Caryl, accounting for 24.6% of all households. In contrast, only 191 households (1.4%) fall into the $10,000 to $14,999 income bracket, making it the least populous group.
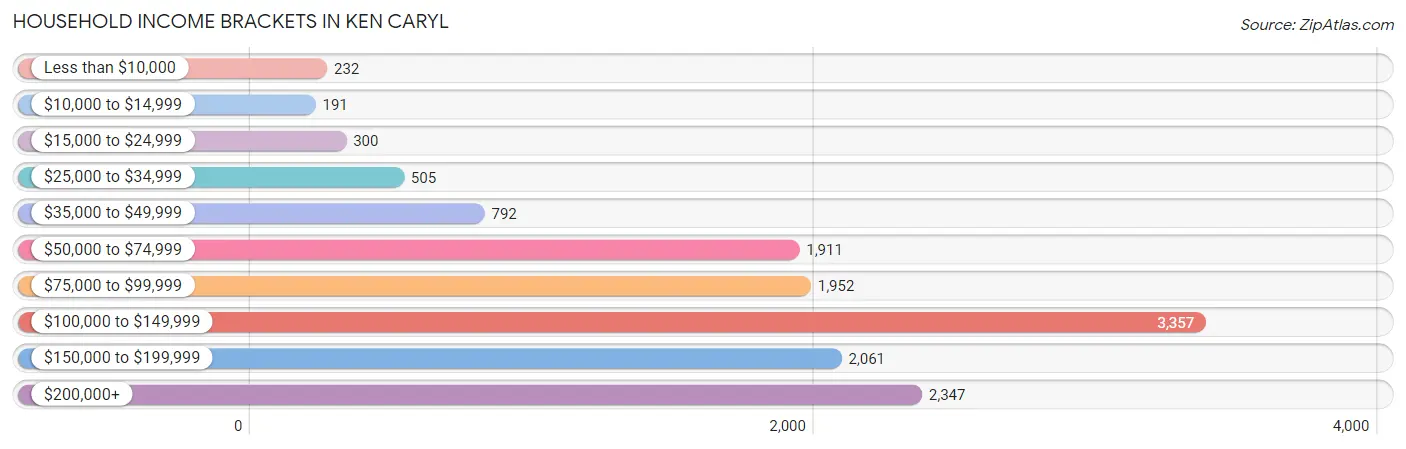
| Income Bracket | # Households | % Households |
| Less than $10,000 | 232 | 1.7% |
| $10,000 to $14,999 | 191 | 1.4% |
| $15,000 to $24,999 | 300 | 2.2% |
| $25,000 to $34,999 | 505 | 3.7% |
| $35,000 to $49,999 | 792 | 5.8% |
| $50,000 to $74,999 | 1,911 | 14.0% |
| $75,000 to $99,999 | 1,952 | 14.3% |
| $100,000 to $149,999 | 3,357 | 24.6% |
| $150,000 to $199,999 | 2,061 | 15.1% |
| $200,000+ | 2,347 | 17.2% |
Household Income by Householder Age in Ken Caryl
The median household income in Ken Caryl is $113,459, with the highest median household income of $139,575 found in the 45 to 64 years age bracket for the primary householder. A total of 5,357 households (39.3%) fall into this category. Meanwhile, the 65+ years age bracket for the primary householder has the lowest median household income of $67,558, with 3,451 households (25.3%) in this group.
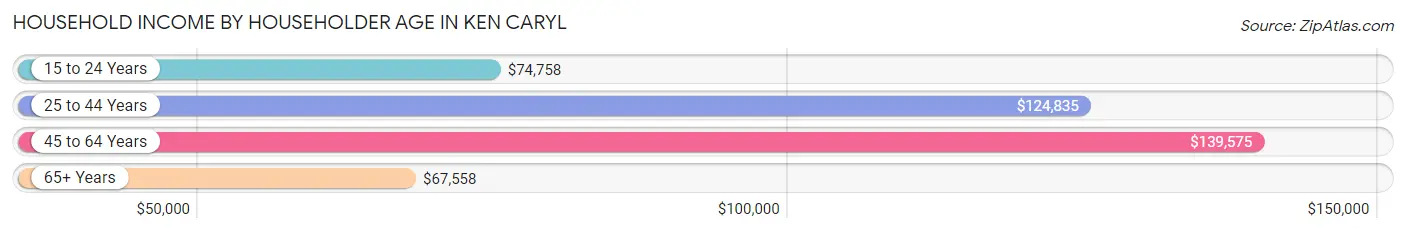
| Income Bracket | # Households | Median Income |
| 15 to 24 Years | 316 (2.3%) | $74,758 |
| 25 to 44 Years | 4,523 (33.1%) | $124,835 |
| 45 to 64 Years | 5,357 (39.3%) | $139,575 |
| 65+ Years | 3,451 (25.3%) | $67,558 |
| Total | 13,647 (100.0%) | $113,459 |
Poverty in Ken Caryl
Income Below Poverty by Sex and Age in Ken Caryl
With 3.0% poverty level for males and 3.5% for females among the residents of Ken Caryl, 75 year old and over males and 5 year old females are the most vulnerable to poverty, with 42 males (6.5%) and 16 females (10.7%) in their respective age groups living below the poverty level.
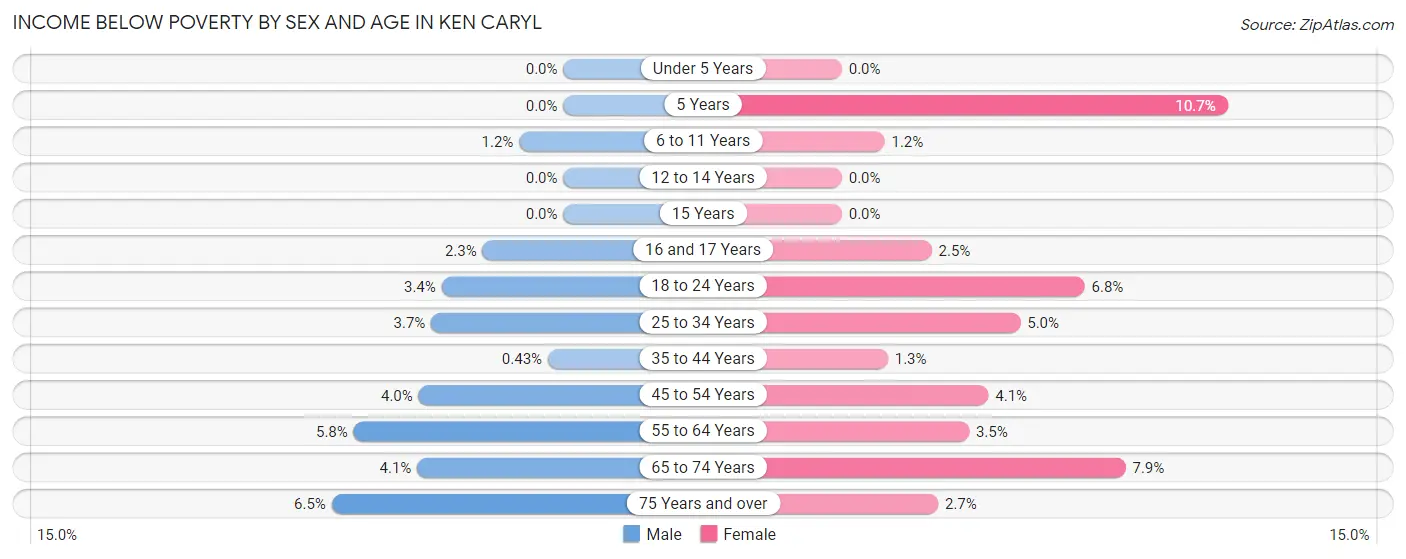
| Age Bracket | Male | Female |
| Under 5 Years | 0 (0.0%) | 0 (0.0%) |
| 5 Years | 0 (0.0%) | 16 (10.7%) |
| 6 to 11 Years | 15 (1.2%) | 14 (1.2%) |
| 12 to 14 Years | 0 (0.0%) | 0 (0.0%) |
| 15 Years | 0 (0.0%) | 0 (0.0%) |
| 16 and 17 Years | 11 (2.2%) | 12 (2.5%) |
| 18 to 24 Years | 41 (3.4%) | 78 (6.8%) |
| 25 to 34 Years | 80 (3.7%) | 87 (5.0%) |
| 35 to 44 Years | 12 (0.4%) | 34 (1.3%) |
| 45 to 54 Years | 95 (4.0%) | 87 (4.1%) |
| 55 to 64 Years | 136 (5.8%) | 86 (3.5%) |
| 65 to 74 Years | 77 (4.1%) | 146 (7.9%) |
| 75 Years and over | 42 (6.5%) | 26 (2.7%) |
| Total | 509 (3.0%) | 586 (3.5%) |
Income Above Poverty by Sex and Age in Ken Caryl
According to the poverty statistics in Ken Caryl, males aged under 5 years and females aged under 5 years are the age groups that are most secure financially, with 100.0% of males and 100.0% of females in these age groups living above the poverty line.
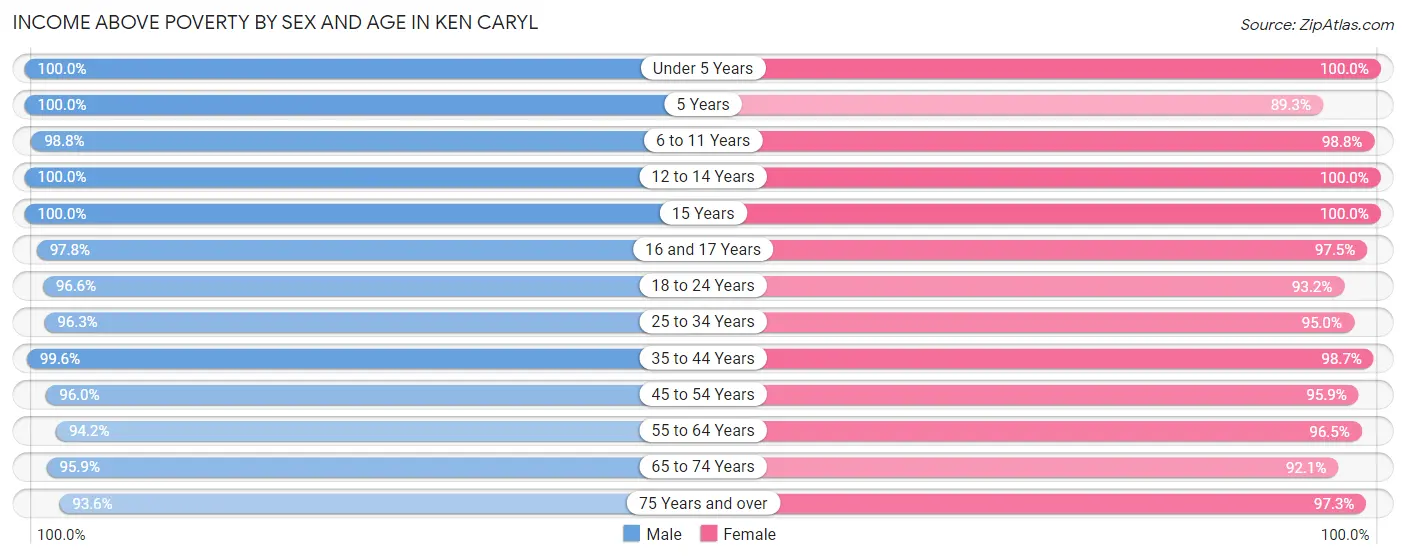
| Age Bracket | Male | Female |
| Under 5 Years | 744 (100.0%) | 829 (100.0%) |
| 5 Years | 155 (100.0%) | 133 (89.3%) |
| 6 to 11 Years | 1,205 (98.8%) | 1,158 (98.8%) |
| 12 to 14 Years | 661 (100.0%) | 654 (100.0%) |
| 15 Years | 242 (100.0%) | 298 (100.0%) |
| 16 and 17 Years | 478 (97.8%) | 468 (97.5%) |
| 18 to 24 Years | 1,169 (96.6%) | 1,075 (93.2%) |
| 25 to 34 Years | 2,091 (96.3%) | 1,662 (95.0%) |
| 35 to 44 Years | 2,759 (99.6%) | 2,630 (98.7%) |
| 45 to 54 Years | 2,264 (96.0%) | 2,045 (95.9%) |
| 55 to 64 Years | 2,194 (94.2%) | 2,345 (96.5%) |
| 65 to 74 Years | 1,814 (95.9%) | 1,702 (92.1%) |
| 75 Years and over | 609 (93.5%) | 945 (97.3%) |
| Total | 16,385 (97.0%) | 15,944 (96.5%) |
Income Below Poverty Among Married-Couple Families in Ken Caryl
The poverty statistics for married-couple families in Ken Caryl show that 1.2% or 87 of the total 7,496 families live below the poverty line. Families with no children have the highest poverty rate of 2.0%, comprising of 87 families. On the other hand, families with 1 or 2 children have the lowest poverty rate of 0.0%, which includes 0 families.
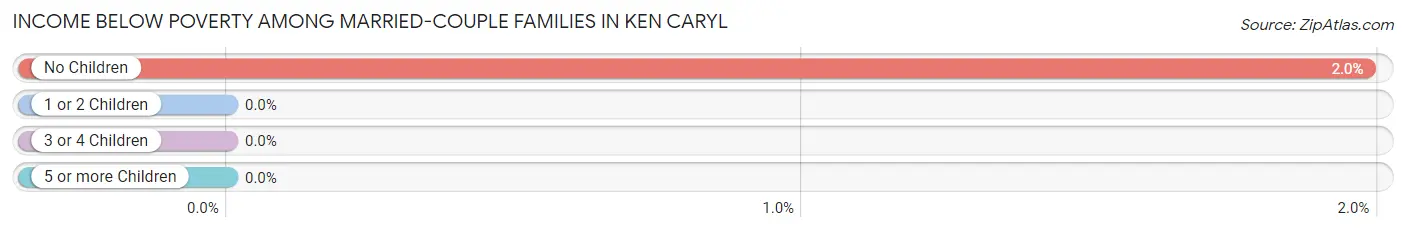
| Children | Above Poverty | Below Poverty |
| No Children | 4,317 (98.0%) | 87 (2.0%) |
| 1 or 2 Children | 2,436 (100.0%) | 0 (0.0%) |
| 3 or 4 Children | 632 (100.0%) | 0 (0.0%) |
| 5 or more Children | 24 (100.0%) | 0 (0.0%) |
| Total | 7,409 (98.8%) | 87 (1.2%) |
Income Below Poverty Among Single-Parent Households in Ken Caryl
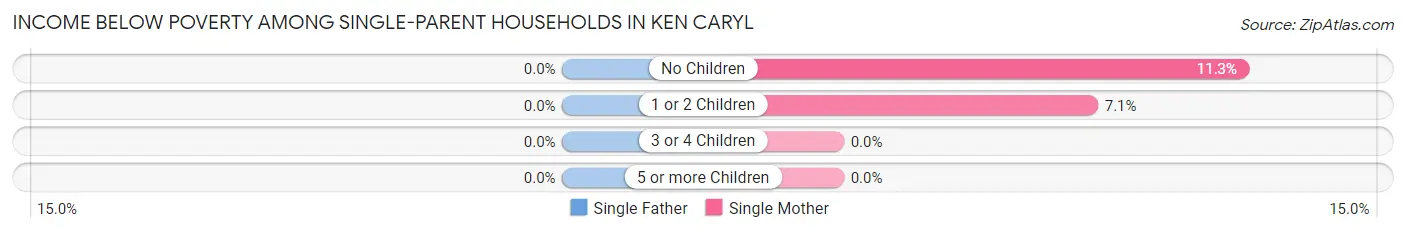
| Children | Single Father | Single Mother |
| No Children | 0 (0.0%) | 79 (11.3%) |
| 1 or 2 Children | 0 (0.0%) | 36 (7.1%) |
| 3 or 4 Children | 0 (0.0%) | 0 (0.0%) |
| 5 or more Children | 0 (0.0%) | 0 (0.0%) |
| Total | 0 (0.0%) | 115 (9.1%) |
Income Below Poverty Among Married-Couple vs Single-Parent Households in Ken Caryl
The poverty data for Ken Caryl shows that 87 of the married-couple family households (1.2%) and 115 of the single-parent households (6.4%) are living below the poverty level. Within the married-couple family households, those with no children have the highest poverty rate, with 87 households (2.0%) falling below the poverty line. Among the single-parent households, those with no children have the highest poverty rate, with 79 household (8.6%) living below poverty.
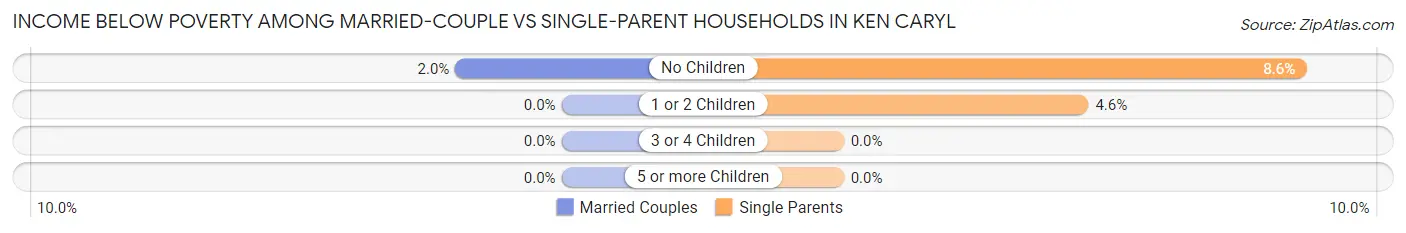
| Children | Married-Couple Families | Single-Parent Households |
| No Children | 87 (2.0%) | 79 (8.6%) |
| 1 or 2 Children | 0 (0.0%) | 36 (4.6%) |
| 3 or 4 Children | 0 (0.0%) | 0 (0.0%) |
| 5 or more Children | 0 (0.0%) | 0 (0.0%) |
| Total | 87 (1.2%) | 115 (6.4%) |
Race in Ken Caryl
The most populous races in Ken Caryl are White / Caucasian (28,473 | 85.0%), Hispanic or Latino (3,846 | 11.5%), and Two or more Races (2,696 | 8.1%).
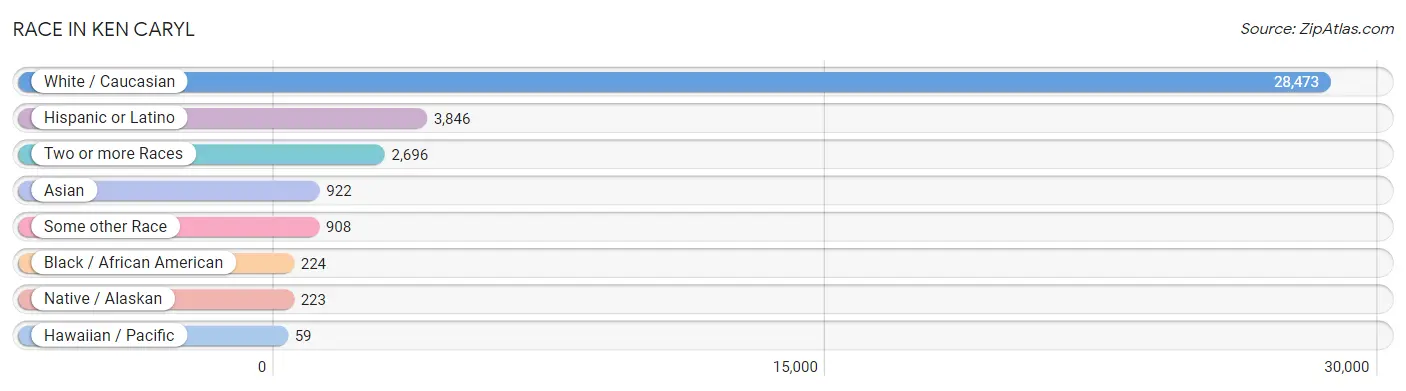
| Race | # Population | % Population |
| Asian | 922 | 2.8% |
| Black / African American | 224 | 0.7% |
| Hawaiian / Pacific | 59 | 0.2% |
| Hispanic or Latino | 3,846 | 11.5% |
| Native / Alaskan | 223 | 0.7% |
| White / Caucasian | 28,473 | 85.0% |
| Two or more Races | 2,696 | 8.1% |
| Some other Race | 908 | 2.7% |
| Total | 33,505 | 100.0% |
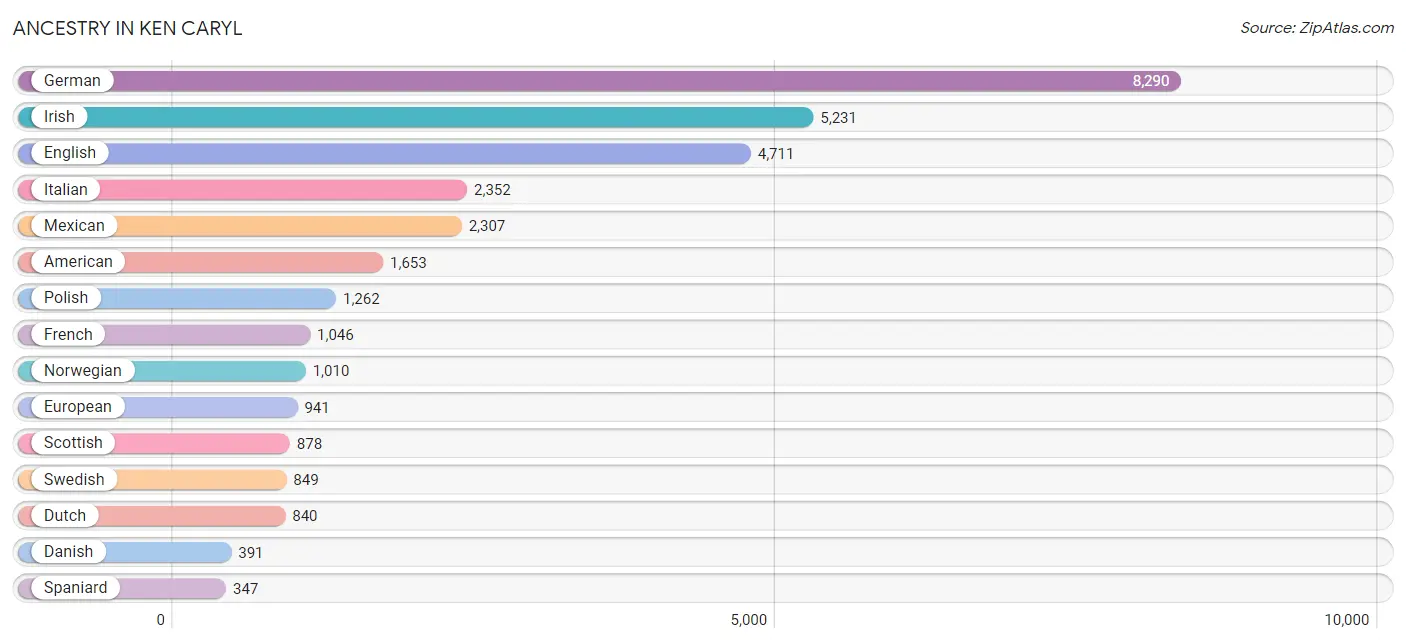
Ancestry in Ken Caryl
The most populous ancestries reported in Ken Caryl are German (8,290 | 24.7%), Irish (5,231 | 15.6%), English (4,711 | 14.1%), Italian (2,352 | 7.0%), and Mexican (2,307 | 6.9%), together accounting for 68.3% of all Ken Caryl residents.
| Ancestry | # Population | % Population |
| African | 62 | 0.2% |
| American | 1,653 | 4.9% |
| Apache | 51 | 0.2% |
| Arab | 135 | 0.4% |
| Argentinean | 15 | 0.0% |
| Armenian | 15 | 0.0% |
| Australian | 45 | 0.1% |
| Austrian | 73 | 0.2% |
| Basque | 48 | 0.1% |
| Belgian | 8 | 0.0% |
| Bhutanese | 273 | 0.8% |
| Blackfeet | 30 | 0.1% |
| Brazilian | 18 | 0.1% |
| British | 313 | 0.9% |
| Bulgarian | 22 | 0.1% |
| Burmese | 248 | 0.7% |
| Canadian | 47 | 0.1% |
| Central American | 41 | 0.1% |
| Cherokee | 172 | 0.5% |
| Chilean | 52 | 0.2% |
| Chinese | 26 | 0.1% |
| Choctaw | 7 | 0.0% |
| Colombian | 30 | 0.1% |
| Croatian | 74 | 0.2% |
| Cuban | 47 | 0.1% |
| Czech | 219 | 0.6% |
| Czechoslovakian | 7 | 0.0% |
| Danish | 391 | 1.2% |
| Delaware | 12 | 0.0% |
| Dutch | 840 | 2.5% |
| Eastern European | 99 | 0.3% |
| Egyptian | 15 | 0.0% |
| English | 4,711 | 14.1% |
| European | 941 | 2.8% |
| Finnish | 46 | 0.1% |
| French | 1,046 | 3.1% |
| French Canadian | 73 | 0.2% |
| German | 8,290 | 24.7% |
| Greek | 53 | 0.2% |
| Guamanian / Chamorro | 23 | 0.1% |
| Guatemalan | 17 | 0.1% |
| Hungarian | 68 | 0.2% |
| Indian (Asian) | 101 | 0.3% |
| Iranian | 17 | 0.1% |
| Irish | 5,231 | 15.6% |
| Iroquois | 19 | 0.1% |
| Italian | 2,352 | 7.0% |
| Japanese | 1 | 0.0% |
| Korean | 66 | 0.2% |
| Laotian | 25 | 0.1% |
| Latvian | 20 | 0.1% |
| Lebanese | 66 | 0.2% |
| Lithuanian | 102 | 0.3% |
| Luxembourger | 6 | 0.0% |
| Malaysian | 52 | 0.2% |
| Mexican | 2,307 | 6.9% |
| Native Hawaiian | 36 | 0.1% |
| Navajo | 3 | 0.0% |
| Nicaraguan | 10 | 0.0% |
| Nigerian | 2 | 0.0% |
| Northern European | 45 | 0.1% |
| Norwegian | 1,010 | 3.0% |
| Pakistani | 6 | 0.0% |
| Panamanian | 14 | 0.0% |
| Peruvian | 190 | 0.6% |
| Polish | 1,262 | 3.8% |
| Portuguese | 304 | 0.9% |
| Pueblo | 14 | 0.0% |
| Puerto Rican | 167 | 0.5% |
| Romanian | 38 | 0.1% |
| Russian | 213 | 0.6% |
| Scandinavian | 300 | 0.9% |
| Scotch-Irish | 324 | 1.0% |
| Scottish | 878 | 2.6% |
| Serbian | 149 | 0.4% |
| Sioux | 28 | 0.1% |
| Slavic | 47 | 0.1% |
| Slovak | 35 | 0.1% |
| Slovene | 97 | 0.3% |
| South African | 19 | 0.1% |
| South American | 320 | 1.0% |
| Spaniard | 347 | 1.0% |
| Spanish | 238 | 0.7% |
| Spanish American | 12 | 0.0% |
| Sri Lankan | 331 | 1.0% |
| Subsaharan African | 83 | 0.3% |
| Swedish | 849 | 2.5% |
| Swiss | 150 | 0.4% |
| Syrian | 54 | 0.2% |
| Thai | 224 | 0.7% |
| Turkish | 25 | 0.1% |
| Ukrainian | 217 | 0.6% |
| Uruguayan | 16 | 0.1% |
| Venezuelan | 17 | 0.1% |
| Welsh | 234 | 0.7% |
| West Indian | 7 | 0.0% | View All 96 Rows |
Immigrants in Ken Caryl
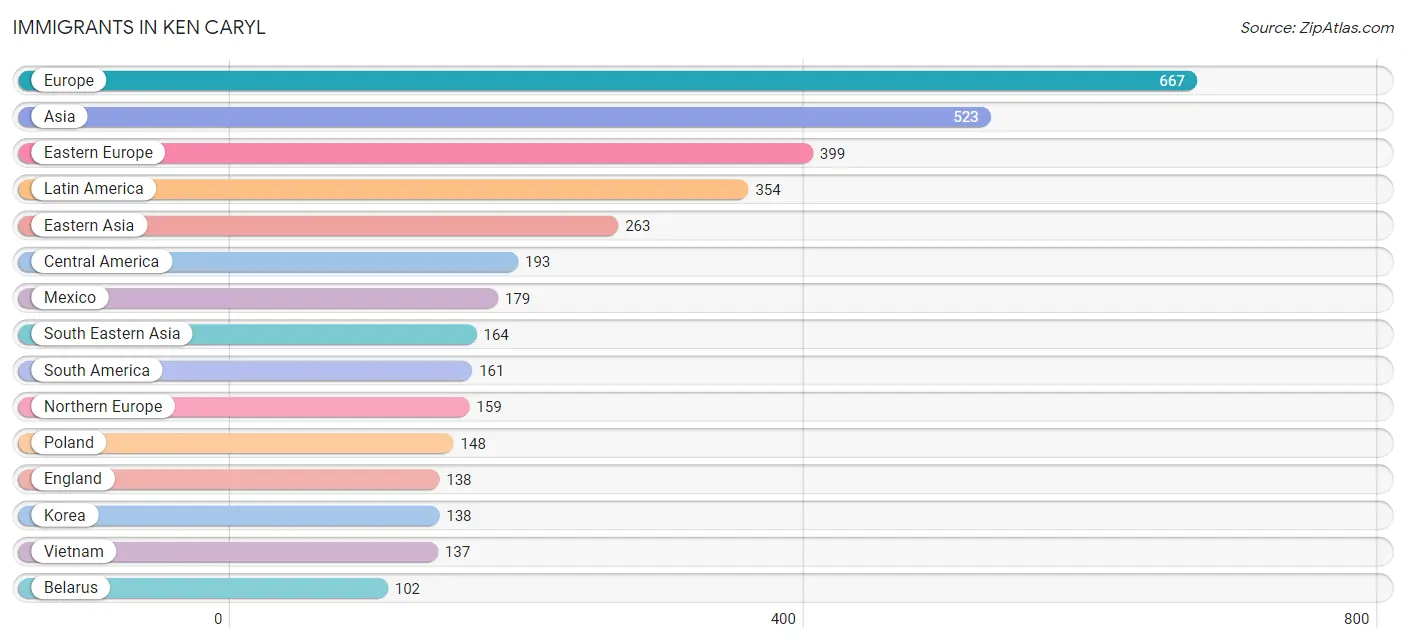
The most numerous immigrant groups reported in Ken Caryl came from Europe (667 | 2.0%), Asia (523 | 1.6%), Eastern Europe (399 | 1.2%), Latin America (354 | 1.1%), and Eastern Asia (263 | 0.8%), together accounting for 6.6% of all Ken Caryl residents.
| Immigration Origin | # Population | % Population |
| Asia | 523 | 1.6% |
| Australia | 33 | 0.1% |
| Austria | 9 | 0.0% |
| Belarus | 102 | 0.3% |
| Brazil | 18 | 0.1% |
| Canada | 96 | 0.3% |
| Central America | 193 | 0.6% |
| Chile | 23 | 0.1% |
| China | 60 | 0.2% |
| Colombia | 25 | 0.1% |
| Croatia | 13 | 0.0% |
| Czechoslovakia | 6 | 0.0% |
| Eastern Asia | 263 | 0.8% |
| Eastern Europe | 399 | 1.2% |
| England | 138 | 0.4% |
| Europe | 667 | 2.0% |
| France | 3 | 0.0% |
| Germany | 38 | 0.1% |
| India | 57 | 0.2% |
| Italy | 8 | 0.0% |
| Japan | 65 | 0.2% |
| Korea | 138 | 0.4% |
| Latin America | 354 | 1.1% |
| Lithuania | 8 | 0.0% |
| Mexico | 179 | 0.5% |
| Netherlands | 51 | 0.2% |
| Northern Europe | 159 | 0.5% |
| Norway | 8 | 0.0% |
| Oceania | 33 | 0.1% |
| Panama | 14 | 0.0% |
| Peru | 86 | 0.3% |
| Philippines | 21 | 0.1% |
| Poland | 148 | 0.4% |
| Romania | 53 | 0.2% |
| Saudi Arabia | 8 | 0.0% |
| South America | 161 | 0.5% |
| South Central Asia | 57 | 0.2% |
| South Eastern Asia | 164 | 0.5% |
| Southern Europe | 8 | 0.0% |
| Syria | 6 | 0.0% |
| Taiwan | 32 | 0.1% |
| Thailand | 6 | 0.0% |
| Turkey | 25 | 0.1% |
| Ukraine | 16 | 0.1% |
| Venezuela | 9 | 0.0% |
| Vietnam | 137 | 0.4% |
| Western Asia | 39 | 0.1% |
| Western Europe | 101 | 0.3% | View All 48 Rows |
Sex and Age in Ken Caryl
Sex and Age in Ken Caryl
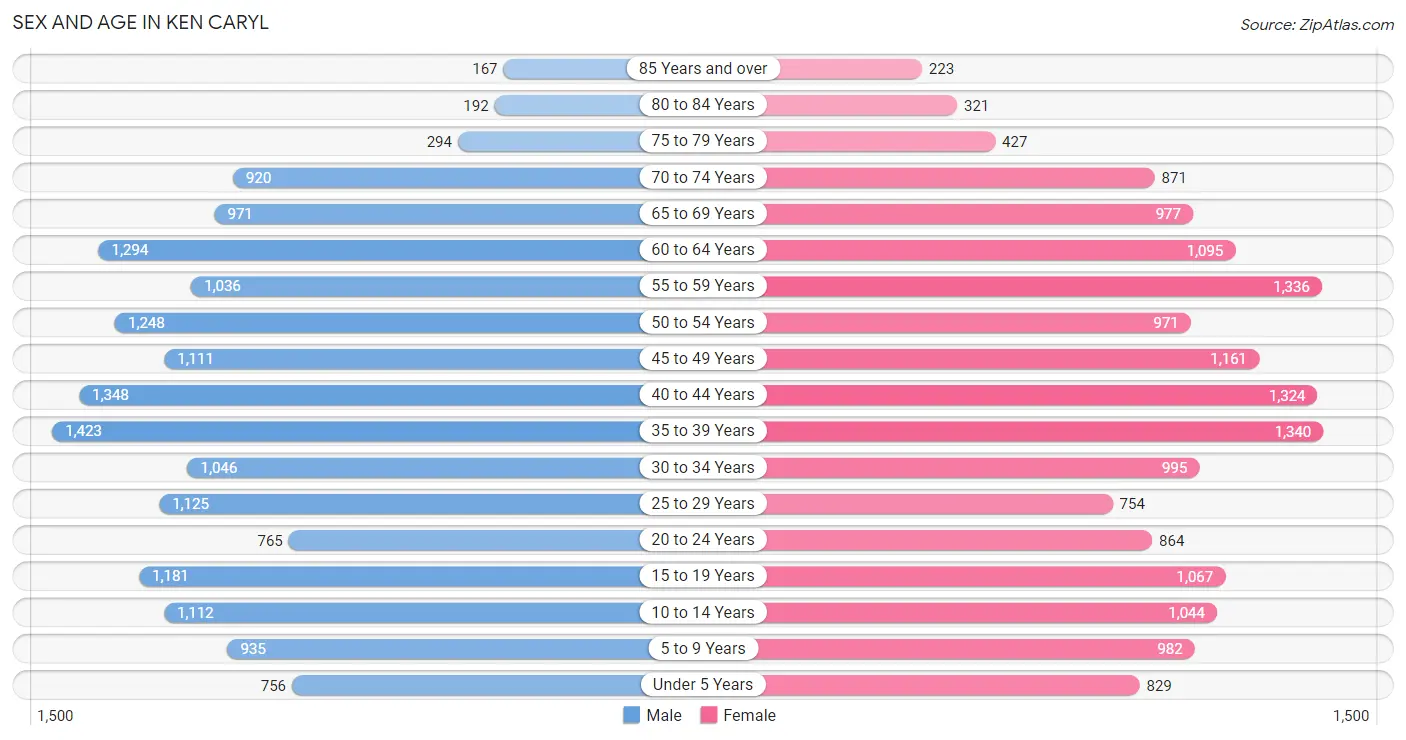
The most populous age groups in Ken Caryl are 35 to 39 Years (1,423 | 8.4%) for men and 35 to 39 Years (1,340 | 8.1%) for women.
| Age Bracket | Male | Female |
| Under 5 Years | 756 (4.5%) | 829 (5.0%) |
| 5 to 9 Years | 935 (5.5%) | 982 (5.9%) |
| 10 to 14 Years | 1,112 (6.6%) | 1,044 (6.3%) |
| 15 to 19 Years | 1,181 (7.0%) | 1,067 (6.4%) |
| 20 to 24 Years | 765 (4.5%) | 864 (5.2%) |
| 25 to 29 Years | 1,125 (6.7%) | 754 (4.5%) |
| 30 to 34 Years | 1,046 (6.2%) | 995 (6.0%) |
| 35 to 39 Years | 1,423 (8.4%) | 1,340 (8.1%) |
| 40 to 44 Years | 1,348 (8.0%) | 1,324 (8.0%) |
| 45 to 49 Years | 1,111 (6.6%) | 1,161 (7.0%) |
| 50 to 54 Years | 1,248 (7.4%) | 971 (5.9%) |
| 55 to 59 Years | 1,036 (6.1%) | 1,336 (8.1%) |
| 60 to 64 Years | 1,294 (7.6%) | 1,095 (6.6%) |
| 65 to 69 Years | 971 (5.7%) | 977 (5.9%) |
| 70 to 74 Years | 920 (5.4%) | 871 (5.2%) |
| 75 to 79 Years | 294 (1.7%) | 427 (2.6%) |
| 80 to 84 Years | 192 (1.1%) | 321 (1.9%) |
| 85 Years and over | 167 (1.0%) | 223 (1.3%) |
| Total | 16,924 (100.0%) | 16,581 (100.0%) |
Families and Households in Ken Caryl
Median Family Size in Ken Caryl
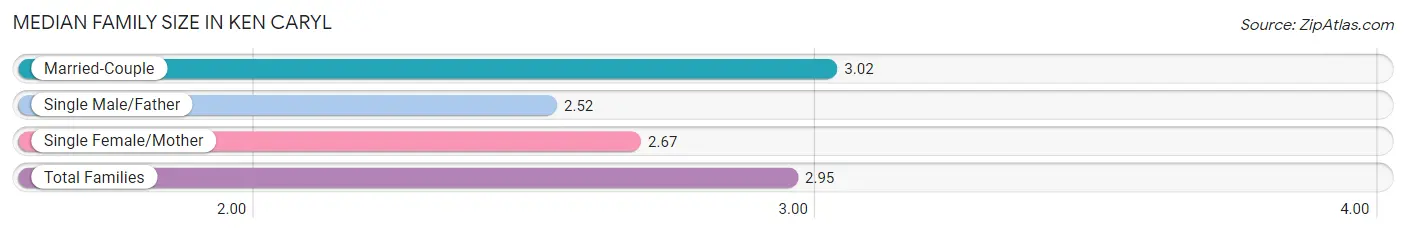
The median family size in Ken Caryl is 2.95 persons per family, with married-couple families (7,496 | 80.7%) accounting for the largest median family size of 3.02 persons per family. On the other hand, single male/father families (522 | 5.6%) represent the smallest median family size with 2.52 persons per family.
| Family Type | # Families | Family Size |
| Married-Couple | 7,496 (80.7%) | 3.02 |
| Single Male/Father | 522 (5.6%) | 2.52 |
| Single Female/Mother | 1,268 (13.7%) | 2.67 |
| Total Families | 9,286 (100.0%) | 2.95 |
Median Household Size in Ken Caryl
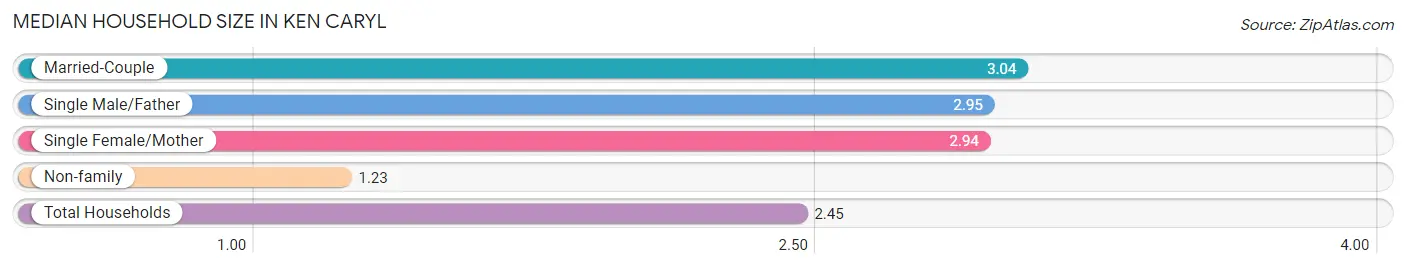
The median household size in Ken Caryl is 2.45 persons per household, with married-couple households (7,496 | 54.9%) accounting for the largest median household size of 3.04 persons per household. non-family households (4,361 | 32.0%) represent the smallest median household size with 1.23 persons per household.
| Household Type | # Households | Household Size |
| Married-Couple | 7,496 (54.9%) | 3.04 |
| Single Male/Father | 522 (3.8%) | 2.95 |
| Single Female/Mother | 1,268 (9.3%) | 2.94 |
| Non-family | 4,361 (32.0%) | 1.23 |
| Total Households | 13,647 (100.0%) | 2.45 |
Household Size by Marriage Status in Ken Caryl
Out of a total of 13,647 households in Ken Caryl, 9,286 (68.0%) are family households, while 4,361 (32.0%) are nonfamily households. The most numerous type of family households are 2-person households, comprising 4,189, and the most common type of nonfamily households are 1-person households, comprising 3,538.
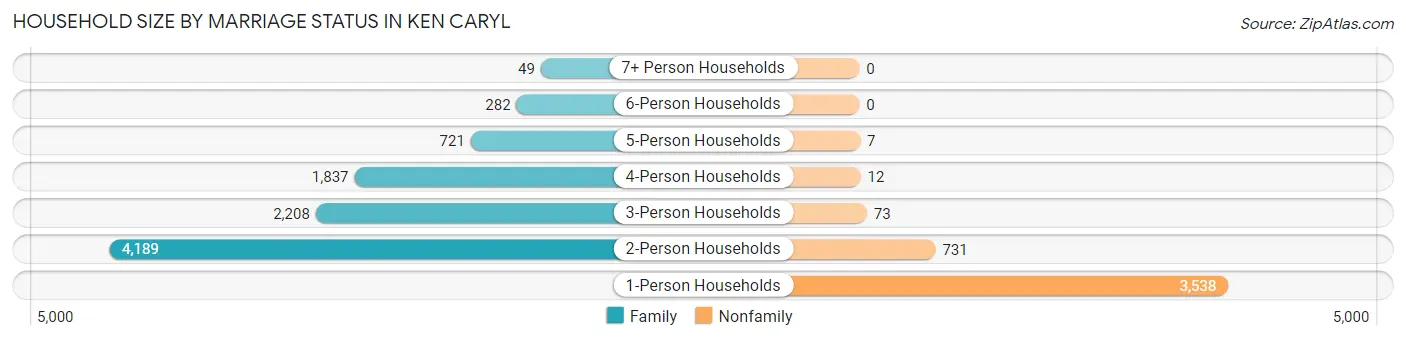
| Household Size | Family Households | Nonfamily Households |
| 1-Person Households | - | 3,538 (25.9%) |
| 2-Person Households | 4,189 (30.7%) | 731 (5.4%) |
| 3-Person Households | 2,208 (16.2%) | 73 (0.5%) |
| 4-Person Households | 1,837 (13.5%) | 12 (0.1%) |
| 5-Person Households | 721 (5.3%) | 7 (0.1%) |
| 6-Person Households | 282 (2.1%) | 0 (0.0%) |
| 7+ Person Households | 49 (0.4%) | 0 (0.0%) |
| Total | 9,286 (68.0%) | 4,361 (32.0%) |
Female Fertility in Ken Caryl
Fertility by Age in Ken Caryl
Average fertility rate in Ken Caryl is 28.0 births per 1,000 women. Women in the age bracket of 20 to 34 years have the highest fertility rate with 54.0 births per 1,000 women. Women in the age bracket of 20 to 34 years acount for 64.8% of all women with births.
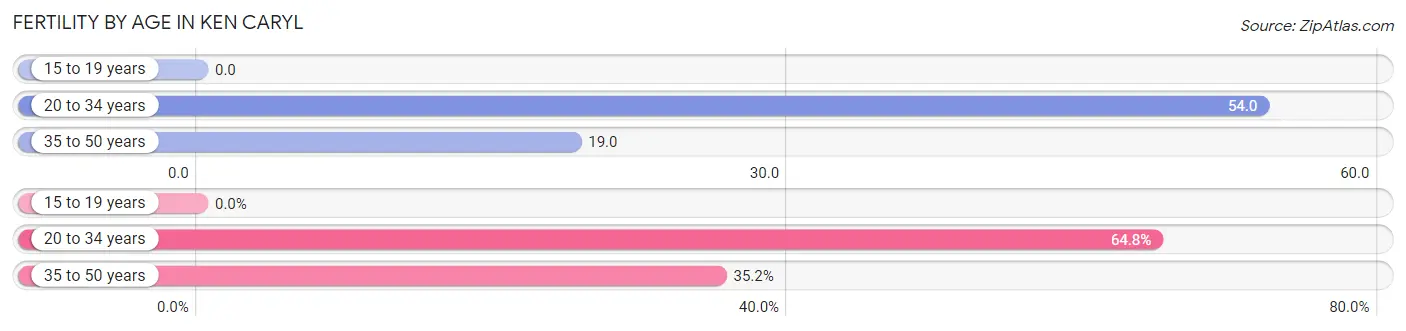
| Age Bracket | Women with Births | Births / 1,000 Women |
| 15 to 19 years | 0 (0.0%) | 0.0 |
| 20 to 34 years | 140 (64.8%) | 54.0 |
| 35 to 50 years | 76 (35.2%) | 19.0 |
| Total | 216 (100.0%) | 28.0 |
Fertility by Age by Marriage Status in Ken Caryl
86.1% of women with births (216) in Ken Caryl are married. The highest percentage of unmarried women with births falls into 35 to 50 years age bracket with 39.5% of them unmarried at the time of birth, while the lowest percentage of unmarried women with births belong to 20 to 34 years age bracket with 0.0% of them unmarried.
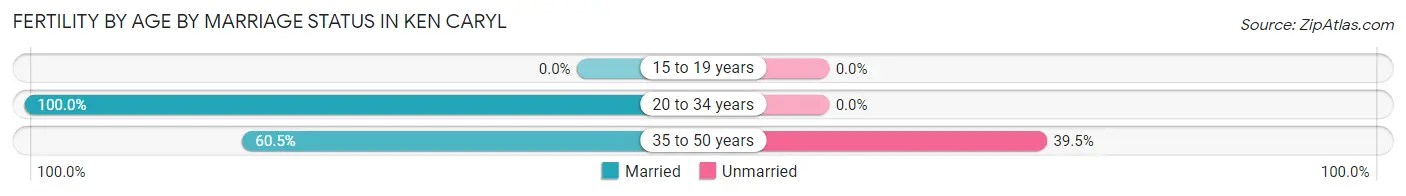
| Age Bracket | Married | Unmarried |
| 15 to 19 years | 0 (0.0%) | 0 (0.0%) |
| 20 to 34 years | 140 (100.0%) | 0 (0.0%) |
| 35 to 50 years | 46 (60.5%) | 30 (39.5%) |
| Total | 186 (86.1%) | 30 (13.9%) |
Fertility by Education in Ken Caryl
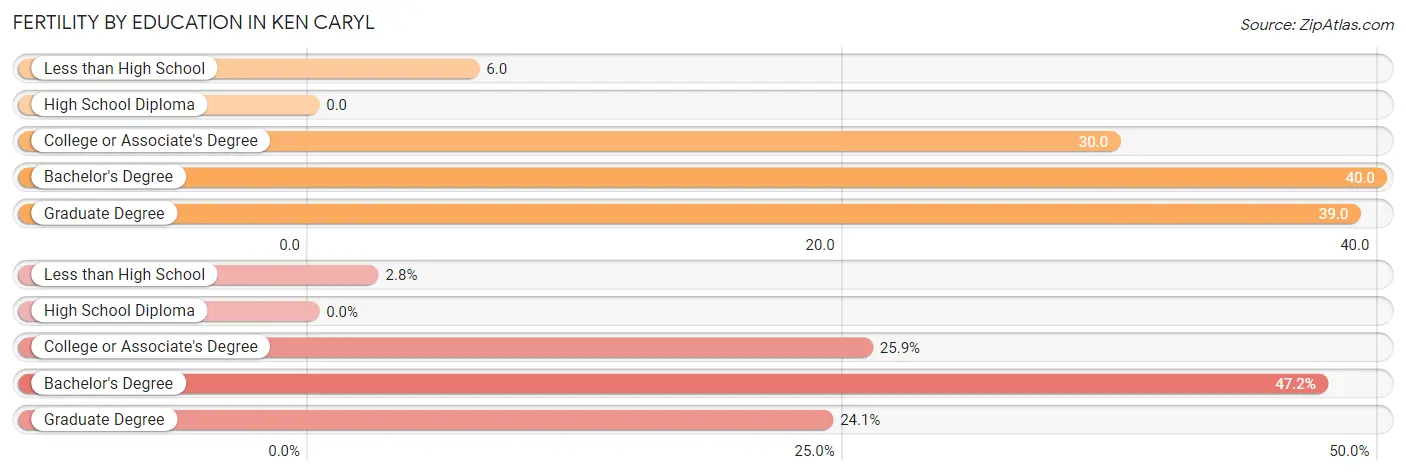
| Educational Attainment | Women with Births | Births / 1,000 Women |
| Less than High School | 6 (2.8%) | 6.0 |
| High School Diploma | 0 (0.0%) | 0.0 |
| College or Associate's Degree | 56 (25.9%) | 30.0 |
| Bachelor's Degree | 102 (47.2%) | 40.0 |
| Graduate Degree | 52 (24.1%) | 39.0 |
| Total | 216 (100.0%) | 28.0 |
Fertility by Education by Marriage Status in Ken Caryl
13.9% of women with births in Ken Caryl are unmarried. Women with the educational attainment of less than high school are most likely to be married with 100.0% of them married at childbirth, while women with the educational attainment of bachelor's degree are least likely to be married with 29.4% of them unmarried at childbirth.
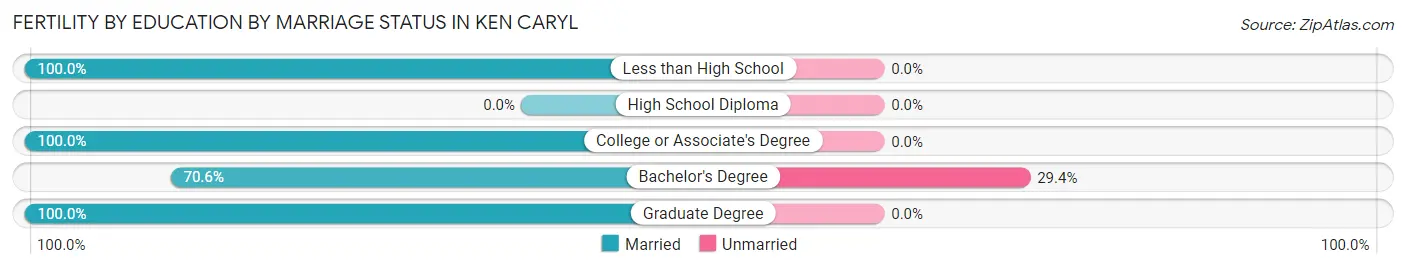
| Educational Attainment | Married | Unmarried |
| Less than High School | 6 (100.0%) | 0 (0.0%) |
| High School Diploma | 0 (0.0%) | 0 (0.0%) |
| College or Associate's Degree | 56 (100.0%) | 0 (0.0%) |
| Bachelor's Degree | 72 (70.6%) | 30 (29.4%) |
| Graduate Degree | 52 (100.0%) | 0 (0.0%) |
| Total | 186 (86.1%) | 30 (13.9%) |
Employment Characteristics in Ken Caryl
Employment by Class of Employer in Ken Caryl
Among the 18,979 employed individuals in Ken Caryl, private company employees (13,147 | 69.3%), local government employees (1,377 | 7.3%), and not-for-profit organizations (1,357 | 7.1%) make up the most common classes of employment.
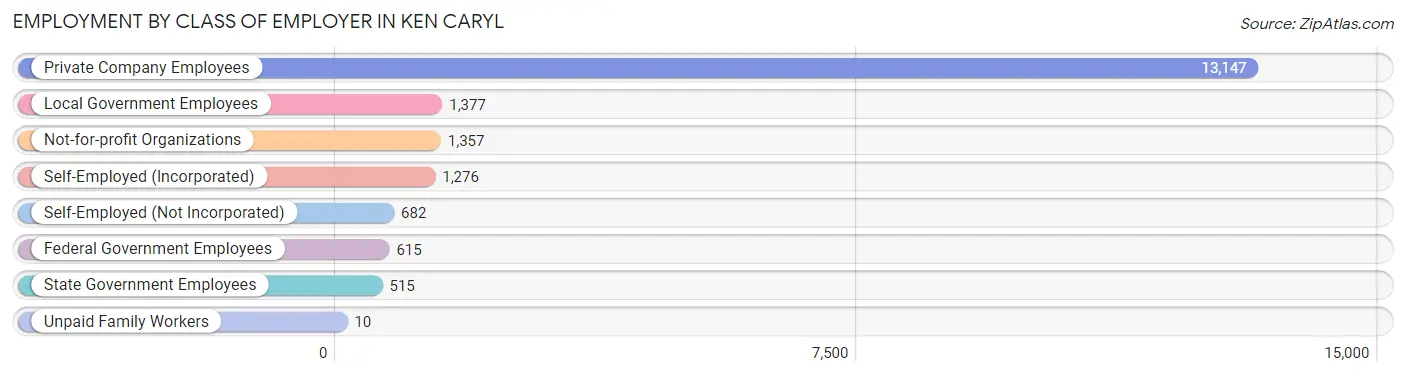
| Employer Class | # Employees | % Employees |
| Private Company Employees | 13,147 | 69.3% |
| Self-Employed (Incorporated) | 1,276 | 6.7% |
| Self-Employed (Not Incorporated) | 682 | 3.6% |
| Not-for-profit Organizations | 1,357 | 7.1% |
| Local Government Employees | 1,377 | 7.3% |
| State Government Employees | 515 | 2.7% |
| Federal Government Employees | 615 | 3.2% |
| Unpaid Family Workers | 10 | 0.1% |
| Total | 18,979 | 100.0% |
Employment Status by Age in Ken Caryl
According to the labor force statistics for Ken Caryl, out of the total population over 16 years of age (27,307), 72.7% or 19,852 individuals are in the labor force, with 3.5% or 695 of them unemployed. The age group with the highest labor force participation rate is 30 to 34 years, with 94.0% or 1,919 individuals in the labor force. Within the labor force, the 75 years and over age range has the highest percentage of unemployed individuals, with 8.8% or 10 of them being unemployed.
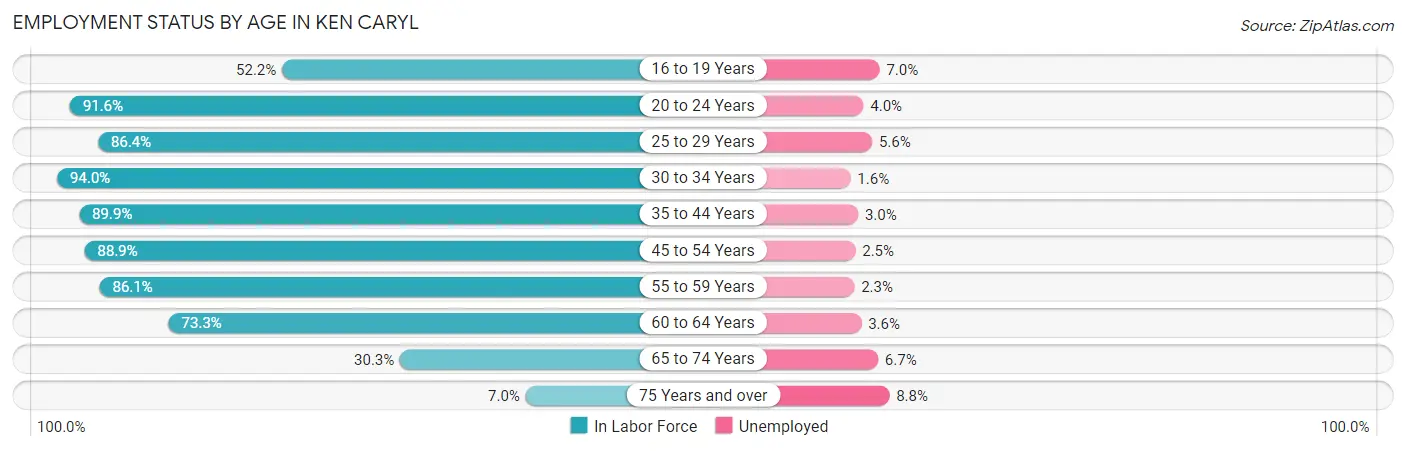
| Age Bracket | In Labor Force | Unemployed |
| 16 to 19 Years | 892 (52.2%) | 62 (7.0%) |
| 20 to 24 Years | 1,492 (91.6%) | 60 (4.0%) |
| 25 to 29 Years | 1,623 (86.4%) | 91 (5.6%) |
| 30 to 34 Years | 1,919 (94.0%) | 31 (1.6%) |
| 35 to 44 Years | 4,886 (89.9%) | 147 (3.0%) |
| 45 to 54 Years | 3,992 (88.9%) | 100 (2.5%) |
| 55 to 59 Years | 2,042 (86.1%) | 47 (2.3%) |
| 60 to 64 Years | 1,751 (73.3%) | 63 (3.6%) |
| 65 to 74 Years | 1,133 (30.3%) | 76 (6.7%) |
| 75 Years and over | 114 (7.0%) | 10 (8.8%) |
| Total | 19,852 (72.7%) | 695 (3.5%) |
Employment Status by Educational Attainment in Ken Caryl
According to labor force statistics for Ken Caryl, 87.1% of individuals (16,207) out of the total population between 25 and 64 years of age (18,607) are in the labor force, with 2.9% or 470 of them being unemployed. The group with the highest labor force participation rate are those with the educational attainment of bachelor's degree or higher, with 90.6% or 8,458 individuals in the labor force. Within the labor force, individuals with high school diploma education have the highest percentage of unemployment, with 3.9% or 91 of them being unemployed.
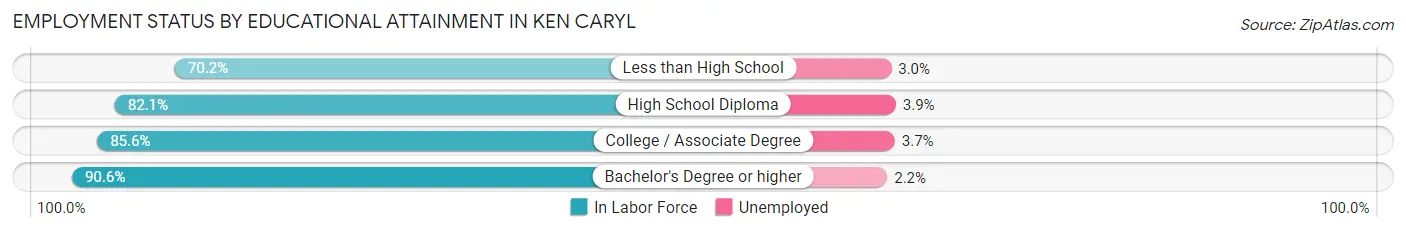
| Educational Attainment | In Labor Force | Unemployed |
| Less than High School | 366 (70.2%) | 16 (3.0%) |
| High School Diploma | 2,344 (82.1%) | 111 (3.9%) |
| College / Associate Degree | 5,046 (85.6%) | 218 (3.7%) |
| Bachelor's Degree or higher | 8,458 (90.6%) | 205 (2.2%) |
| Total | 16,207 (87.1%) | 540 (2.9%) |
Employment Occupations by Sex in Ken Caryl
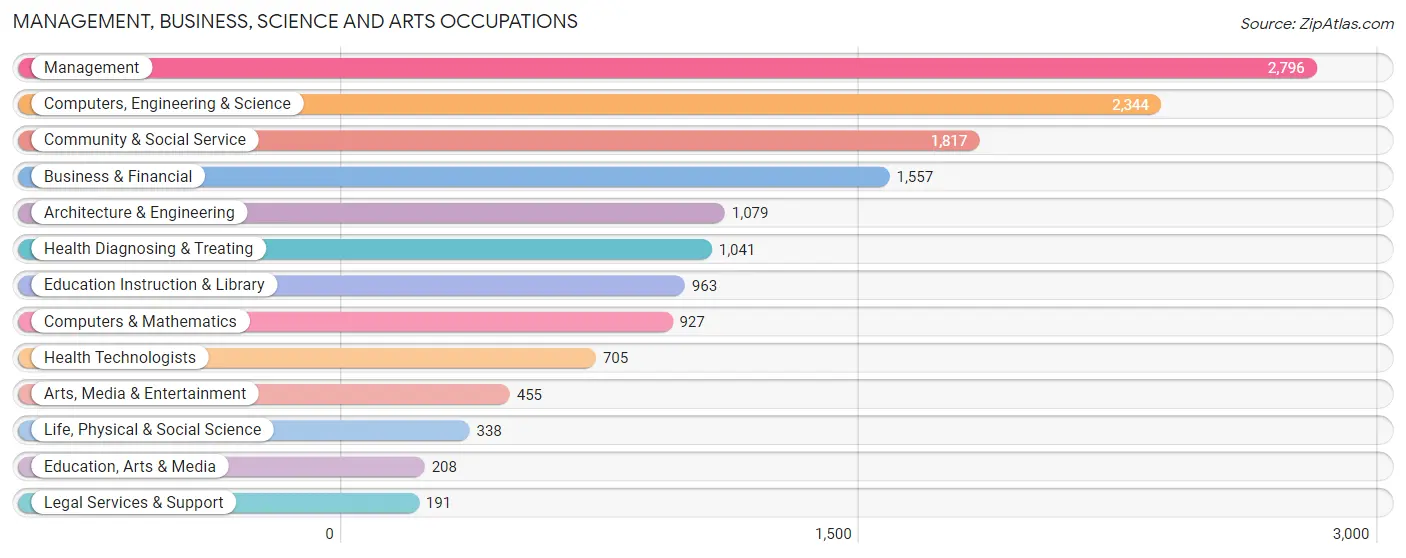
Management, Business, Science and Arts Occupations
The most common Management, Business, Science and Arts occupations in Ken Caryl are Management (2,796 | 14.6%), Computers, Engineering & Science (2,344 | 12.2%), Community & Social Service (1,817 | 9.5%), Business & Financial (1,557 | 8.1%), and Architecture & Engineering (1,079 | 5.6%).
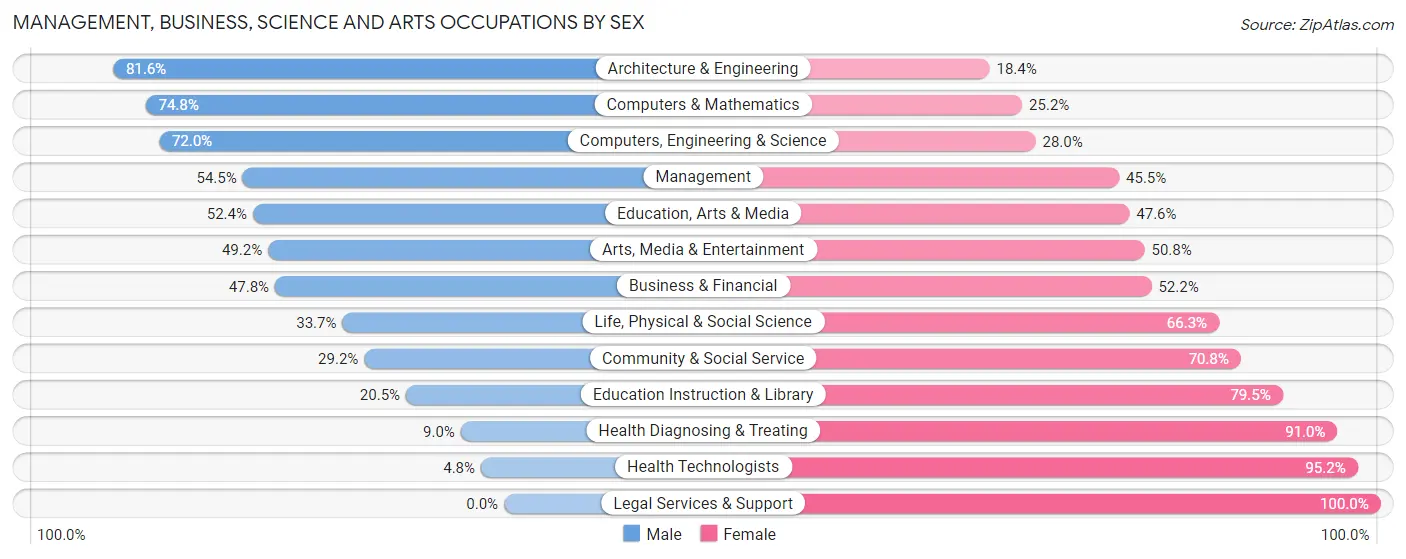
Management, Business, Science and Arts Occupations by Sex
Within the Management, Business, Science and Arts occupations in Ken Caryl, the most male-oriented occupations are Architecture & Engineering (81.6%), Computers & Mathematics (74.8%), and Computers, Engineering & Science (72.0%), while the most female-oriented occupations are Legal Services & Support (100.0%), Health Technologists (95.2%), and Health Diagnosing & Treating (91.0%).
| Occupation | Male | Female |
| Management | 1,525 (54.5%) | 1,271 (45.5%) |
| Business & Financial | 744 (47.8%) | 813 (52.2%) |
| Computers, Engineering & Science | 1,687 (72.0%) | 657 (28.0%) |
| Computers & Mathematics | 693 (74.8%) | 234 (25.2%) |
| Architecture & Engineering | 880 (81.6%) | 199 (18.4%) |
| Life, Physical & Social Science | 114 (33.7%) | 224 (66.3%) |
| Community & Social Service | 530 (29.2%) | 1,287 (70.8%) |
| Education, Arts & Media | 109 (52.4%) | 99 (47.6%) |
| Legal Services & Support | 0 (0.0%) | 191 (100.0%) |
| Education Instruction & Library | 197 (20.5%) | 766 (79.5%) |
| Arts, Media & Entertainment | 224 (49.2%) | 231 (50.8%) |
| Health Diagnosing & Treating | 94 (9.0%) | 947 (91.0%) |
| Health Technologists | 34 (4.8%) | 671 (95.2%) |
| Total (Category) | 4,580 (47.9%) | 4,975 (52.1%) |
| Total (Overall) | 9,965 (52.0%) | 9,193 (48.0%) |
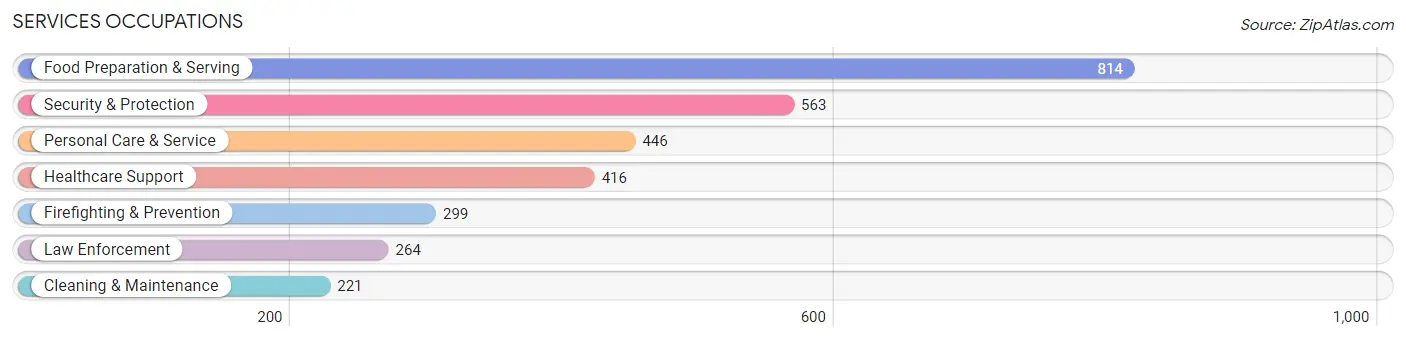
Services Occupations
The most common Services occupations in Ken Caryl are Food Preparation & Serving (814 | 4.3%), Security & Protection (563 | 2.9%), Personal Care & Service (446 | 2.3%), Healthcare Support (416 | 2.2%), and Firefighting & Prevention (299 | 1.6%).
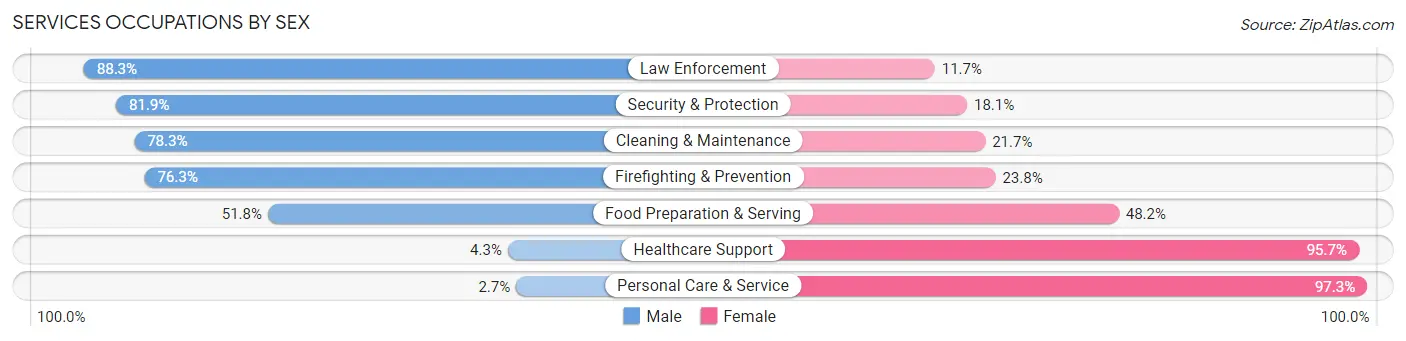
Services Occupations by Sex
Within the Services occupations in Ken Caryl, the most male-oriented occupations are Law Enforcement (88.3%), Security & Protection (81.9%), and Cleaning & Maintenance (78.3%), while the most female-oriented occupations are Personal Care & Service (97.3%), Healthcare Support (95.7%), and Food Preparation & Serving (48.2%).
| Occupation | Male | Female |
| Healthcare Support | 18 (4.3%) | 398 (95.7%) |
| Security & Protection | 461 (81.9%) | 102 (18.1%) |
| Firefighting & Prevention | 228 (76.2%) | 71 (23.7%) |
| Law Enforcement | 233 (88.3%) | 31 (11.7%) |
| Food Preparation & Serving | 422 (51.8%) | 392 (48.2%) |
| Cleaning & Maintenance | 173 (78.3%) | 48 (21.7%) |
| Personal Care & Service | 12 (2.7%) | 434 (97.3%) |
| Total (Category) | 1,086 (44.2%) | 1,374 (55.8%) |
| Total (Overall) | 9,965 (52.0%) | 9,193 (48.0%) |
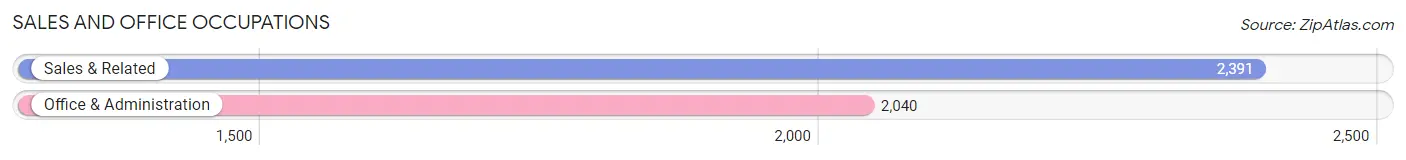
Sales and Office Occupations
The most common Sales and Office occupations in Ken Caryl are Sales & Related (2,391 | 12.5%), and Office & Administration (2,040 | 10.6%).
Sales and Office Occupations by Sex
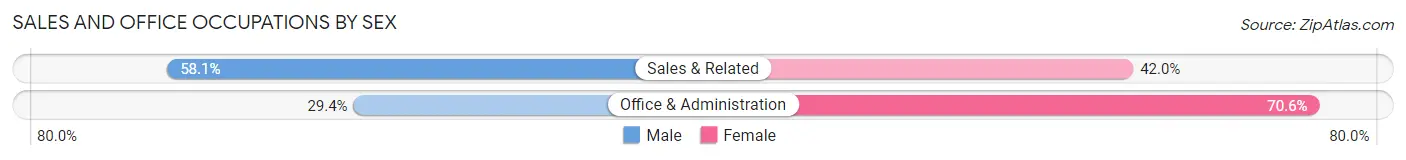
| Occupation | Male | Female |
| Sales & Related | 1,388 (58.1%) | 1,003 (41.9%) |
| Office & Administration | 600 (29.4%) | 1,440 (70.6%) |
| Total (Category) | 1,988 (44.9%) | 2,443 (55.1%) |
| Total (Overall) | 9,965 (52.0%) | 9,193 (48.0%) |
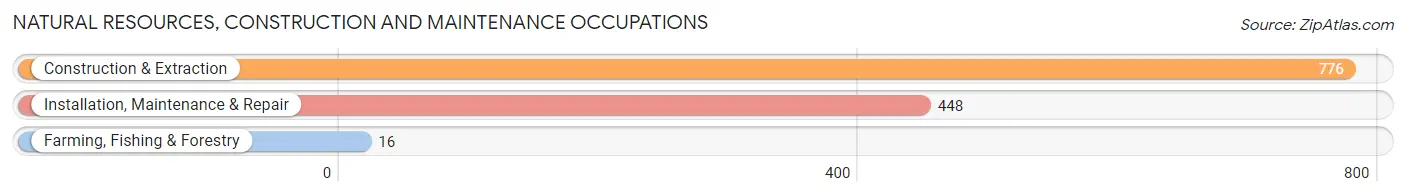
Natural Resources, Construction and Maintenance Occupations
The most common Natural Resources, Construction and Maintenance occupations in Ken Caryl are Construction & Extraction (776 | 4.1%), Installation, Maintenance & Repair (448 | 2.3%), and Farming, Fishing & Forestry (16 | 0.1%).
Natural Resources, Construction and Maintenance Occupations by Sex
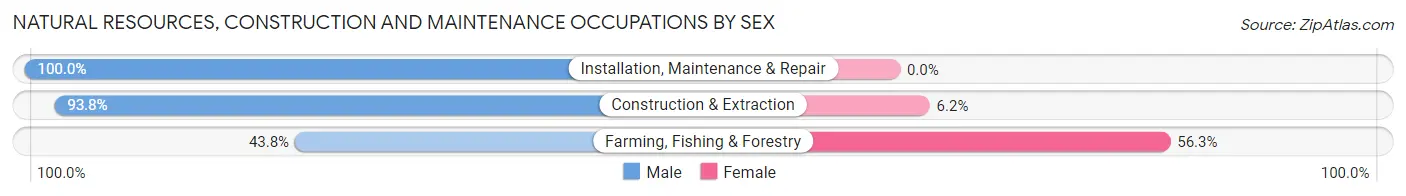
| Occupation | Male | Female |
| Farming, Fishing & Forestry | 7 (43.8%) | 9 (56.2%) |
| Construction & Extraction | 728 (93.8%) | 48 (6.2%) |
| Installation, Maintenance & Repair | 448 (100.0%) | 0 (0.0%) |
| Total (Category) | 1,183 (95.4%) | 57 (4.6%) |
| Total (Overall) | 9,965 (52.0%) | 9,193 (48.0%) |
Production, Transportation and Moving Occupations
The most common Production, Transportation and Moving occupations in Ken Caryl are Production (635 | 3.3%), Transportation (441 | 2.3%), and Material Moving (396 | 2.1%).
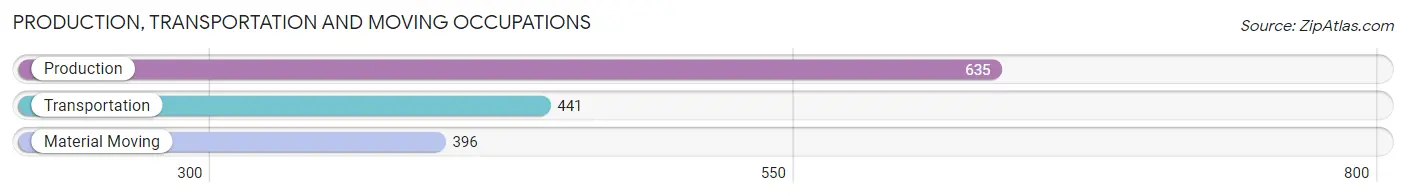
Production, Transportation and Moving Occupations by Sex
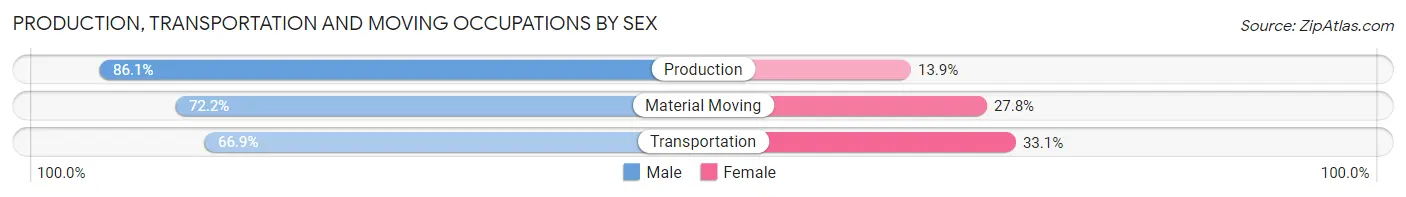
| Occupation | Male | Female |
| Production | 547 (86.1%) | 88 (13.9%) |
| Transportation | 295 (66.9%) | 146 (33.1%) |
| Material Moving | 286 (72.2%) | 110 (27.8%) |
| Total (Category) | 1,128 (76.6%) | 344 (23.4%) |
| Total (Overall) | 9,965 (52.0%) | 9,193 (48.0%) |
Employment Industries by Sex in Ken Caryl
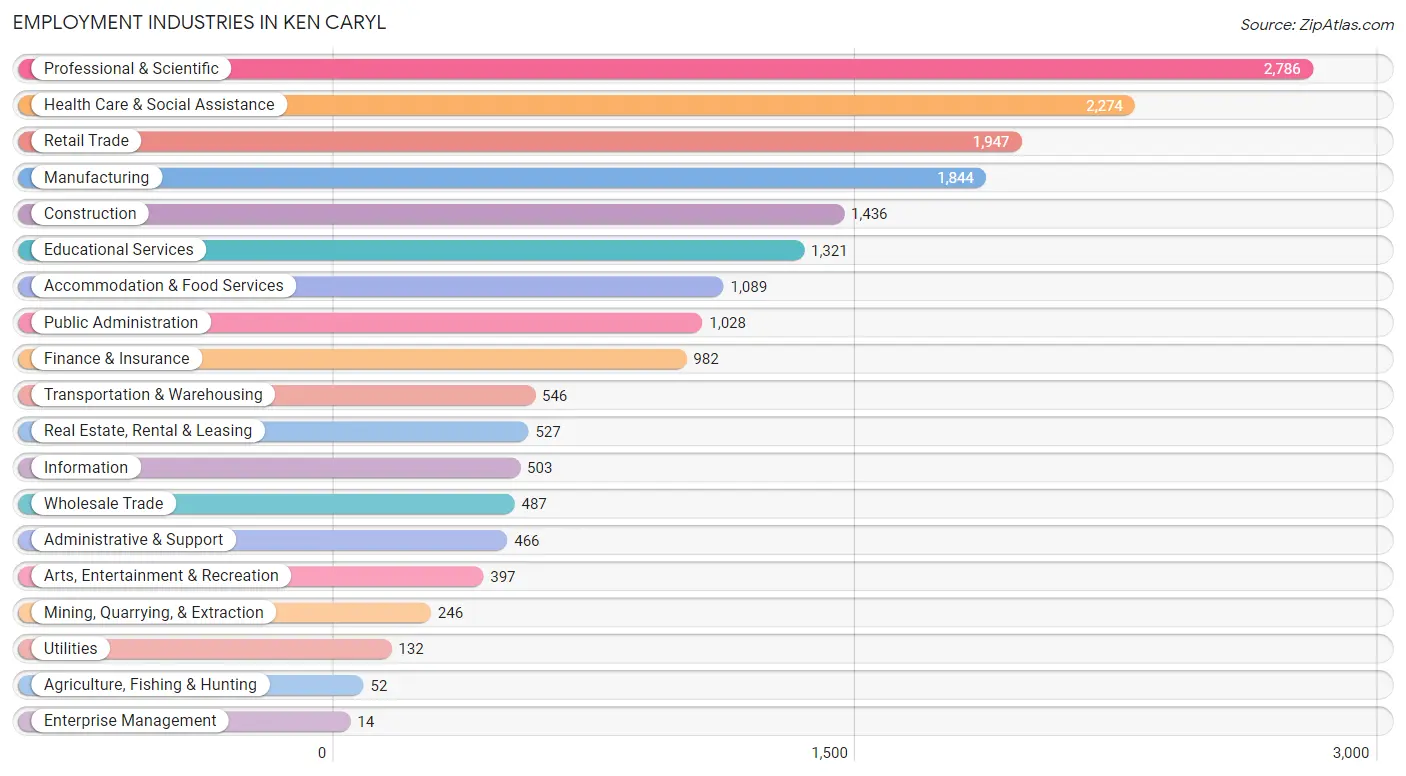
Employment Industries in Ken Caryl
The major employment industries in Ken Caryl include Professional & Scientific (2,786 | 14.5%), Health Care & Social Assistance (2,274 | 11.9%), Retail Trade (1,947 | 10.2%), Manufacturing (1,844 | 9.6%), and Construction (1,436 | 7.5%).
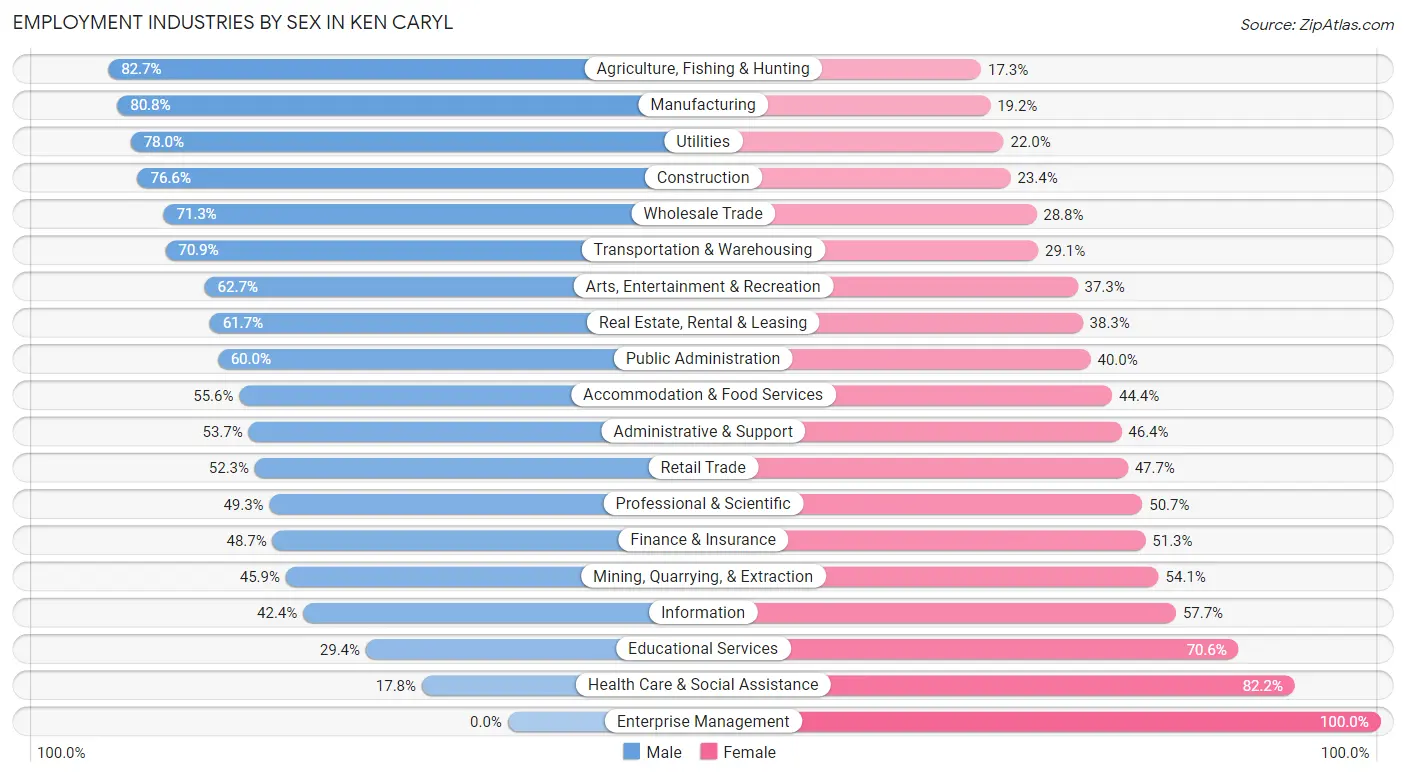
Employment Industries by Sex in Ken Caryl
The Ken Caryl industries that see more men than women are Agriculture, Fishing & Hunting (82.7%), Manufacturing (80.8%), and Utilities (78.0%), whereas the industries that tend to have a higher number of women are Enterprise Management (100.0%), Health Care & Social Assistance (82.2%), and Educational Services (70.6%).
| Industry | Male | Female |
| Agriculture, Fishing & Hunting | 43 (82.7%) | 9 (17.3%) |
| Mining, Quarrying, & Extraction | 113 (45.9%) | 133 (54.1%) |
| Construction | 1,100 (76.6%) | 336 (23.4%) |
| Manufacturing | 1,490 (80.8%) | 354 (19.2%) |
| Wholesale Trade | 347 (71.3%) | 140 (28.7%) |
| Retail Trade | 1,019 (52.3%) | 928 (47.7%) |
| Transportation & Warehousing | 387 (70.9%) | 159 (29.1%) |
| Utilities | 103 (78.0%) | 29 (22.0%) |
| Information | 213 (42.3%) | 290 (57.7%) |
| Finance & Insurance | 478 (48.7%) | 504 (51.3%) |
| Real Estate, Rental & Leasing | 325 (61.7%) | 202 (38.3%) |
| Professional & Scientific | 1,374 (49.3%) | 1,412 (50.7%) |
| Enterprise Management | 0 (0.0%) | 14 (100.0%) |
| Administrative & Support | 250 (53.6%) | 216 (46.4%) |
| Educational Services | 388 (29.4%) | 933 (70.6%) |
| Health Care & Social Assistance | 404 (17.8%) | 1,870 (82.2%) |
| Arts, Entertainment & Recreation | 249 (62.7%) | 148 (37.3%) |
| Accommodation & Food Services | 605 (55.6%) | 484 (44.4%) |
| Public Administration | 617 (60.0%) | 411 (40.0%) |
| Total | 9,965 (52.0%) | 9,193 (48.0%) |
Education in Ken Caryl
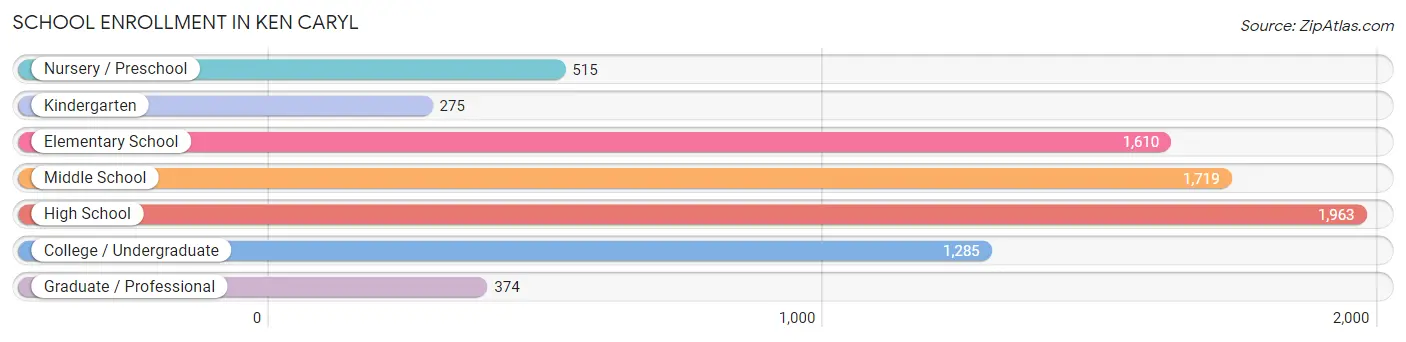
School Enrollment in Ken Caryl
The most common levels of schooling among the 7,741 students in Ken Caryl are high school (1,963 | 25.4%), middle school (1,719 | 22.2%), and elementary school (1,610 | 20.8%).
| School Level | # Students | % Students |
| Nursery / Preschool | 515 | 6.7% |
| Kindergarten | 275 | 3.5% |
| Elementary School | 1,610 | 20.8% |
| Middle School | 1,719 | 22.2% |
| High School | 1,963 | 25.4% |
| College / Undergraduate | 1,285 | 16.6% |
| Graduate / Professional | 374 | 4.8% |
| Total | 7,741 | 100.0% |
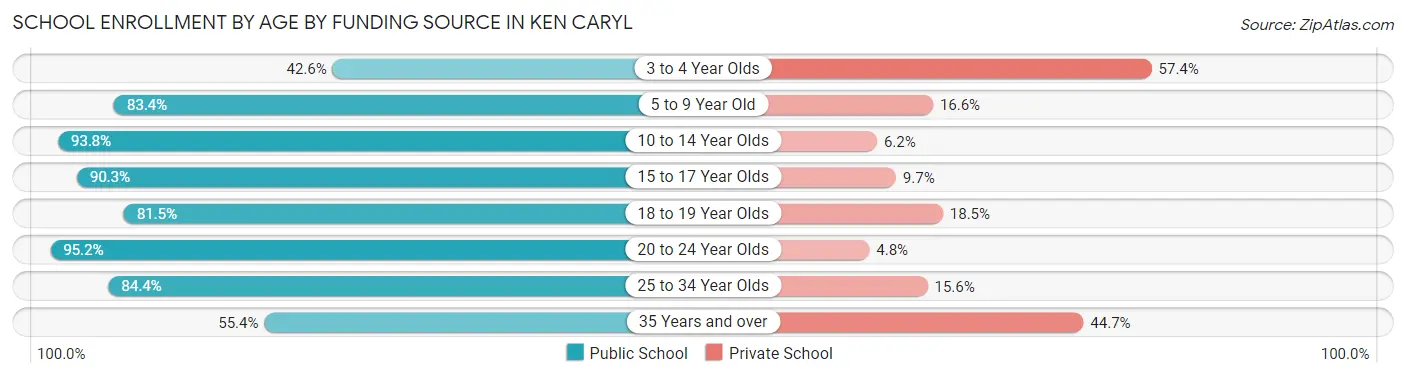
School Enrollment by Age by Funding Source in Ken Caryl
Out of a total of 7,741 students who are enrolled in schools in Ken Caryl, 1,169 (15.1%) attend a private institution, while the remaining 6,572 (84.9%) are enrolled in public schools. The age group of 3 to 4 year olds has the highest likelihood of being enrolled in private schools, with 230 (57.4% in the age bracket) enrolled. Conversely, the age group of 20 to 24 year olds has the lowest likelihood of being enrolled in a private school, with 518 (95.2% in the age bracket) attending a public institution.
| Age Bracket | Public School | Private School |
| 3 to 4 Year Olds | 171 (42.6%) | 230 (57.4%) |
| 5 to 9 Year Old | 1,559 (83.4%) | 311 (16.6%) |
| 10 to 14 Year Olds | 1,997 (93.8%) | 132 (6.2%) |
| 15 to 17 Year Olds | 1,364 (90.3%) | 147 (9.7%) |
| 18 to 19 Year Olds | 397 (81.5%) | 90 (18.5%) |
| 20 to 24 Year Olds | 518 (95.2%) | 26 (4.8%) |
| 25 to 34 Year Olds | 351 (84.4%) | 65 (15.6%) |
| 35 Years and over | 212 (55.3%) | 171 (44.7%) |
| Total | 6,572 (84.9%) | 1,169 (15.1%) |
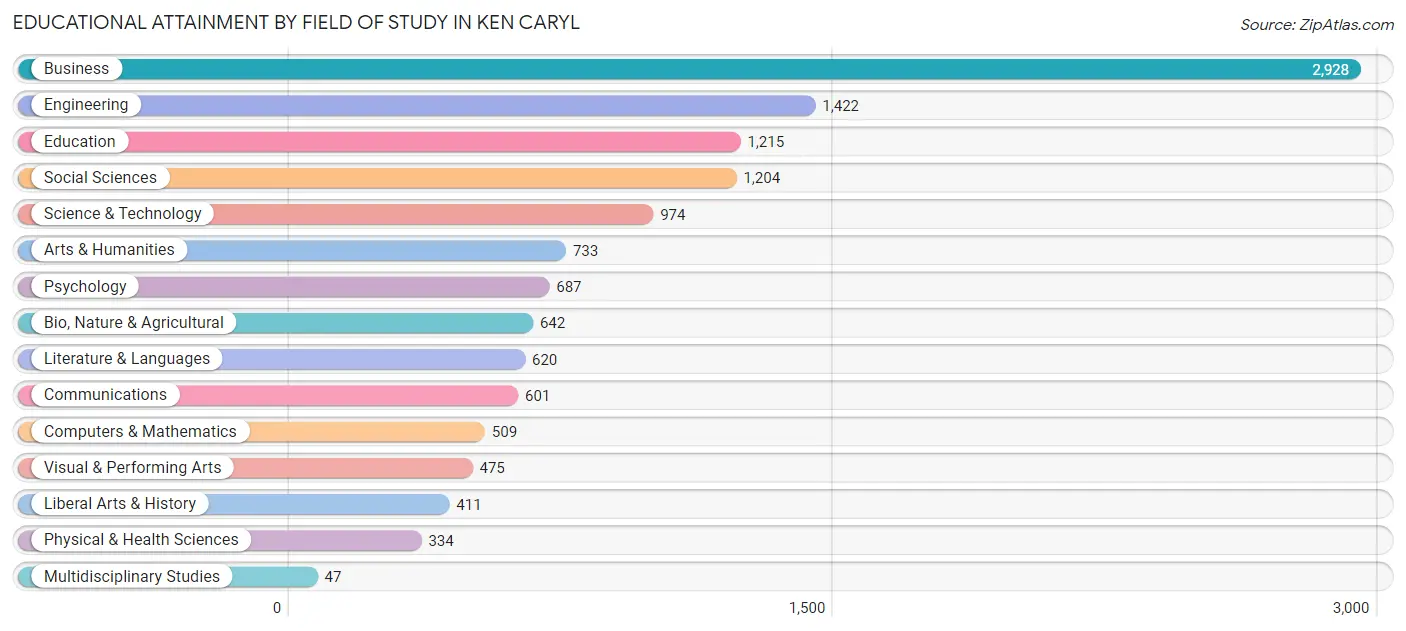
Educational Attainment by Field of Study in Ken Caryl
Business (2,928 | 22.9%), engineering (1,422 | 11.1%), education (1,215 | 9.5%), social sciences (1,204 | 9.4%), and science & technology (974 | 7.6%) are the most common fields of study among 12,802 individuals in Ken Caryl who have obtained a bachelor's degree or higher.
| Field of Study | # Graduates | % Graduates |
| Computers & Mathematics | 509 | 4.0% |
| Bio, Nature & Agricultural | 642 | 5.0% |
| Physical & Health Sciences | 334 | 2.6% |
| Psychology | 687 | 5.4% |
| Social Sciences | 1,204 | 9.4% |
| Engineering | 1,422 | 11.1% |
| Multidisciplinary Studies | 47 | 0.4% |
| Science & Technology | 974 | 7.6% |
| Business | 2,928 | 22.9% |
| Education | 1,215 | 9.5% |
| Literature & Languages | 620 | 4.8% |
| Liberal Arts & History | 411 | 3.2% |
| Visual & Performing Arts | 475 | 3.7% |
| Communications | 601 | 4.7% |
| Arts & Humanities | 733 | 5.7% |
| Total | 12,802 | 100.0% |
Transportation & Commute in Ken Caryl
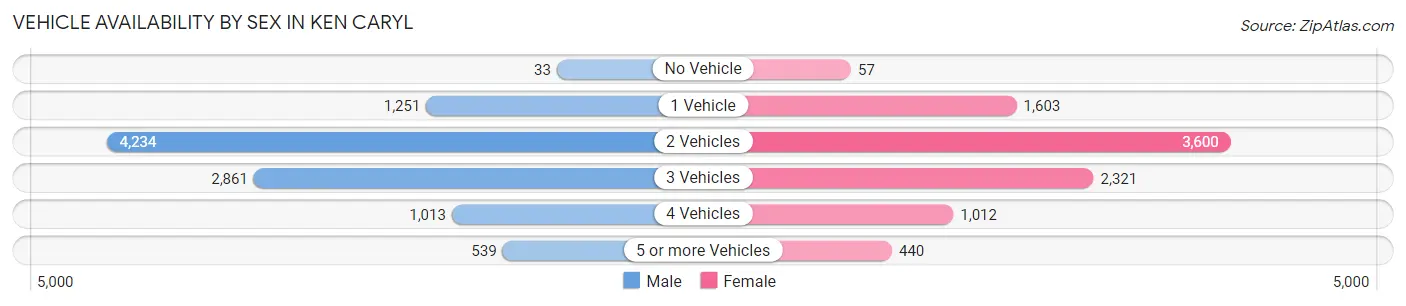
Vehicle Availability by Sex in Ken Caryl
The most prevalent vehicle ownership categories in Ken Caryl are males with 2 vehicles (4,234, accounting for 42.6%) and females with 2 vehicles (3,600, making up 46.9%).
| Vehicles Available | Male | Female |
| No Vehicle | 33 (0.3%) | 57 (0.6%) |
| 1 Vehicle | 1,251 (12.6%) | 1,603 (17.7%) |
| 2 Vehicles | 4,234 (42.6%) | 3,600 (39.9%) |
| 3 Vehicles | 2,861 (28.8%) | 2,321 (25.7%) |
| 4 Vehicles | 1,013 (10.2%) | 1,012 (11.2%) |
| 5 or more Vehicles | 539 (5.4%) | 440 (4.9%) |
| Total | 9,931 (100.0%) | 9,033 (100.0%) |
Commute Time in Ken Caryl
The most frequently occuring commute durations in Ken Caryl are 30 to 34 minutes (2,485 commuters, 16.4%), 20 to 24 minutes (2,300 commuters, 15.2%), and 45 to 59 minutes (1,950 commuters, 12.9%).
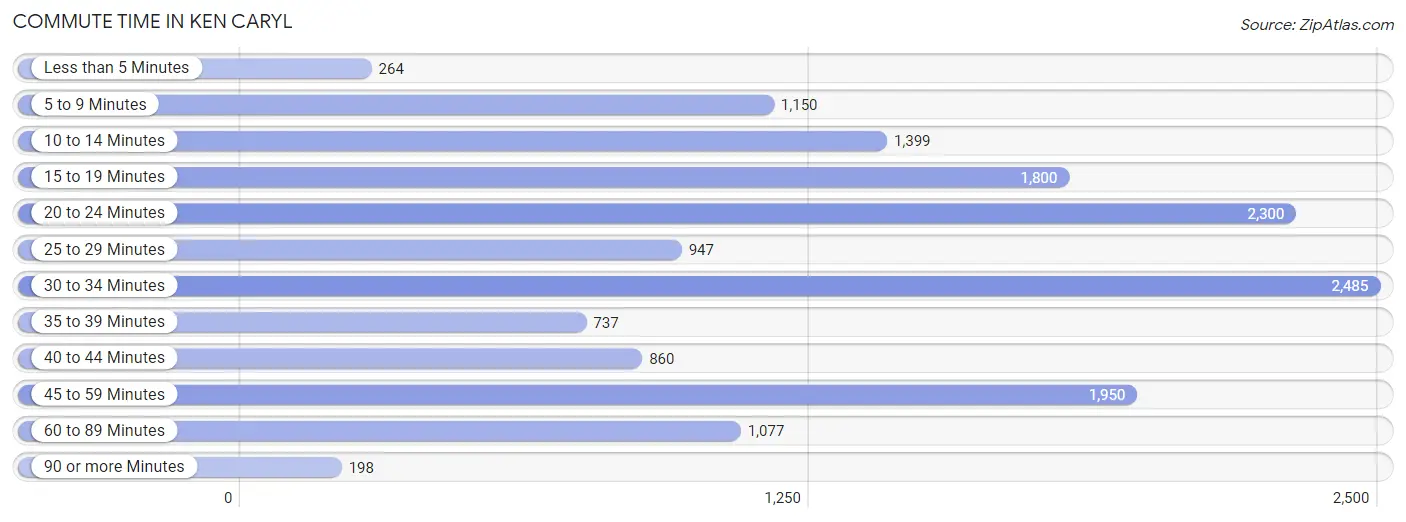
| Commute Time | # Commuters | % Commuters |
| Less than 5 Minutes | 264 | 1.7% |
| 5 to 9 Minutes | 1,150 | 7.6% |
| 10 to 14 Minutes | 1,399 | 9.2% |
| 15 to 19 Minutes | 1,800 | 11.9% |
| 20 to 24 Minutes | 2,300 | 15.2% |
| 25 to 29 Minutes | 947 | 6.2% |
| 30 to 34 Minutes | 2,485 | 16.4% |
| 35 to 39 Minutes | 737 | 4.9% |
| 40 to 44 Minutes | 860 | 5.7% |
| 45 to 59 Minutes | 1,950 | 12.9% |
| 60 to 89 Minutes | 1,077 | 7.1% |
| 90 or more Minutes | 198 | 1.3% |
Commute Time by Sex in Ken Caryl
The most common commute times in Ken Caryl are 30 to 34 minutes (1,306 commuters, 16.0%) for males and 30 to 34 minutes (1,179 commuters, 16.8%) for females.
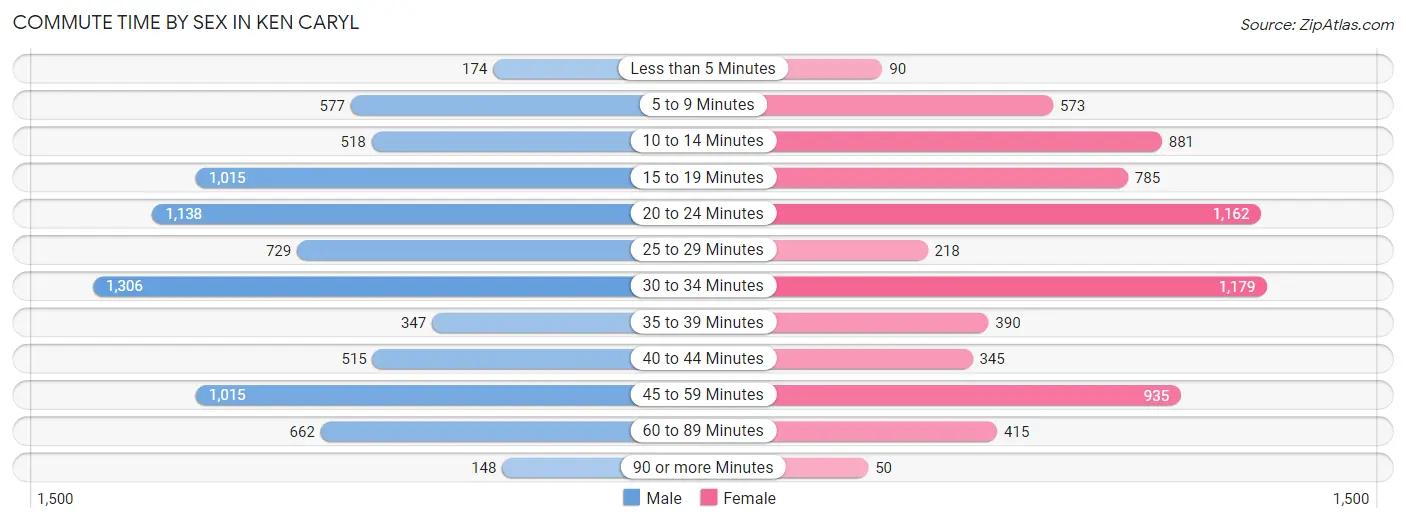
| Commute Time | Male | Female |
| Less than 5 Minutes | 174 (2.1%) | 90 (1.3%) |
| 5 to 9 Minutes | 577 (7.1%) | 573 (8.2%) |
| 10 to 14 Minutes | 518 (6.4%) | 881 (12.5%) |
| 15 to 19 Minutes | 1,015 (12.5%) | 785 (11.2%) |
| 20 to 24 Minutes | 1,138 (14.0%) | 1,162 (16.6%) |
| 25 to 29 Minutes | 729 (8.9%) | 218 (3.1%) |
| 30 to 34 Minutes | 1,306 (16.0%) | 1,179 (16.8%) |
| 35 to 39 Minutes | 347 (4.3%) | 390 (5.6%) |
| 40 to 44 Minutes | 515 (6.3%) | 345 (4.9%) |
| 45 to 59 Minutes | 1,015 (12.5%) | 935 (13.3%) |
| 60 to 89 Minutes | 662 (8.1%) | 415 (5.9%) |
| 90 or more Minutes | 148 (1.8%) | 50 (0.7%) |
Time of Departure to Work by Sex in Ken Caryl
The most frequent times of departure to work in Ken Caryl are 7:00 AM to 7:29 AM (1,505, 18.5%) for males and 7:00 AM to 7:29 AM (1,271, 18.1%) for females.
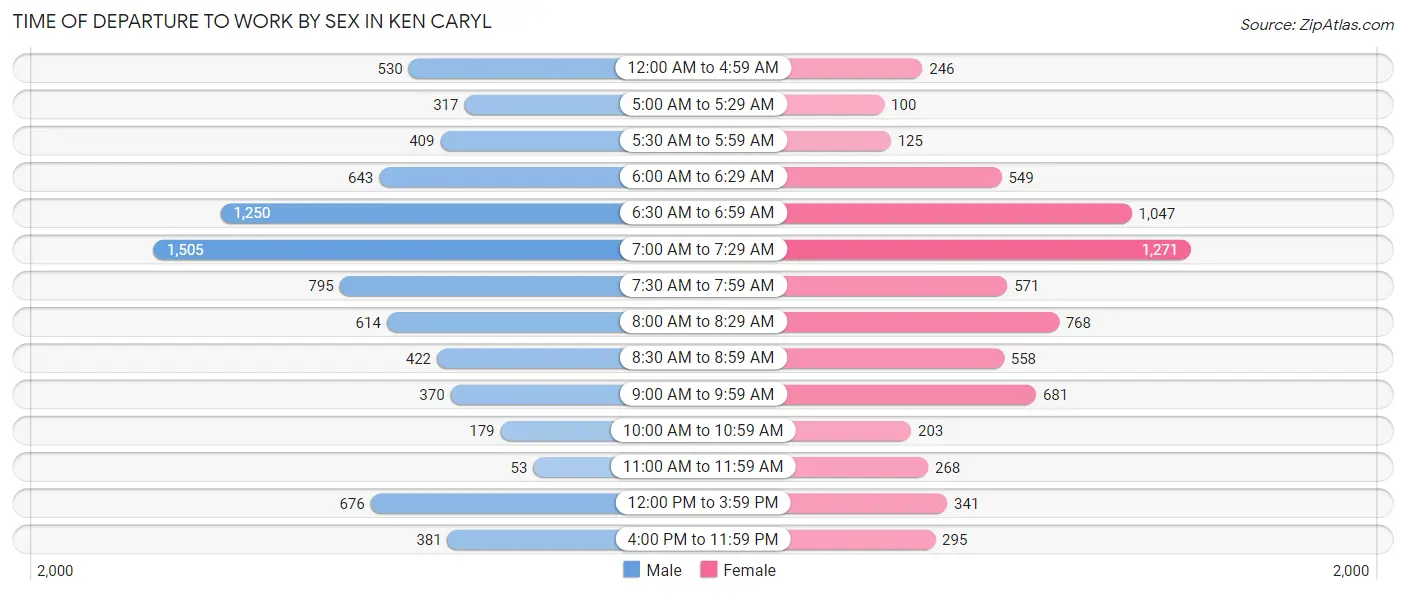
| Time of Departure | Male | Female |
| 12:00 AM to 4:59 AM | 530 (6.5%) | 246 (3.5%) |
| 5:00 AM to 5:29 AM | 317 (3.9%) | 100 (1.4%) |
| 5:30 AM to 5:59 AM | 409 (5.0%) | 125 (1.8%) |
| 6:00 AM to 6:29 AM | 643 (7.9%) | 549 (7.8%) |
| 6:30 AM to 6:59 AM | 1,250 (15.3%) | 1,047 (14.9%) |
| 7:00 AM to 7:29 AM | 1,505 (18.5%) | 1,271 (18.1%) |
| 7:30 AM to 7:59 AM | 795 (9.8%) | 571 (8.1%) |
| 8:00 AM to 8:29 AM | 614 (7.5%) | 768 (10.9%) |
| 8:30 AM to 8:59 AM | 422 (5.2%) | 558 (8.0%) |
| 9:00 AM to 9:59 AM | 370 (4.5%) | 681 (9.7%) |
| 10:00 AM to 10:59 AM | 179 (2.2%) | 203 (2.9%) |
| 11:00 AM to 11:59 AM | 53 (0.6%) | 268 (3.8%) |
| 12:00 PM to 3:59 PM | 676 (8.3%) | 341 (4.9%) |
| 4:00 PM to 11:59 PM | 381 (4.7%) | 295 (4.2%) |
| Total | 8,144 (100.0%) | 7,023 (100.0%) |
Housing Occupancy in Ken Caryl
Occupancy by Ownership in Ken Caryl
Of the total 13,647 dwellings in Ken Caryl, owner-occupied units account for 11,338 (83.1%), while renter-occupied units make up 2,309 (16.9%).
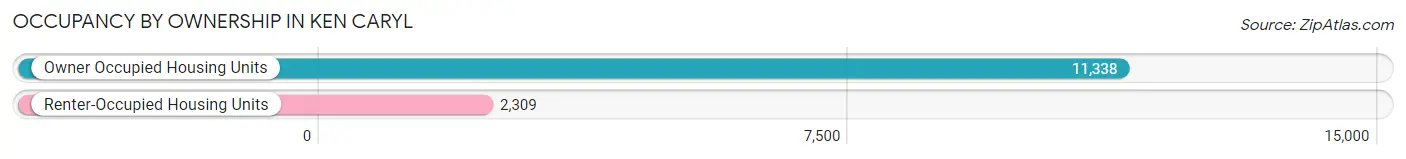
| Occupancy | # Housing Units | % Housing Units |
| Owner Occupied Housing Units | 11,338 | 83.1% |
| Renter-Occupied Housing Units | 2,309 | 16.9% |
| Total Occupied Housing Units | 13,647 | 100.0% |
Occupancy by Household Size in Ken Caryl
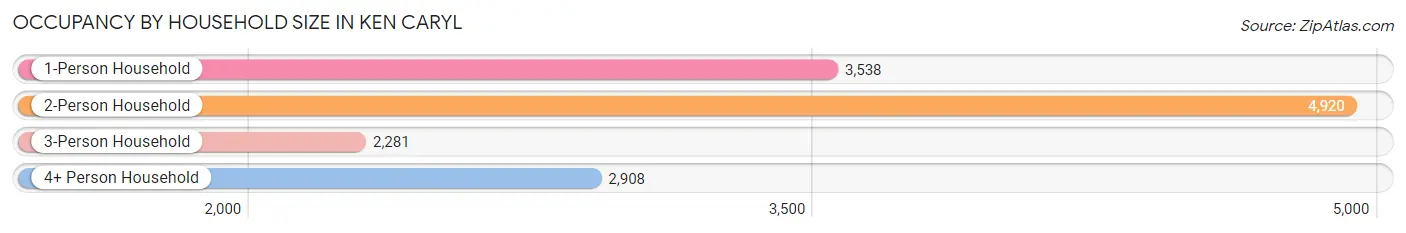
| Household Size | # Housing Units | % Housing Units |
| 1-Person Household | 3,538 | 25.9% |
| 2-Person Household | 4,920 | 36.0% |
| 3-Person Household | 2,281 | 16.7% |
| 4+ Person Household | 2,908 | 21.3% |
| Total Housing Units | 13,647 | 100.0% |
Occupancy by Ownership by Household Size in Ken Caryl
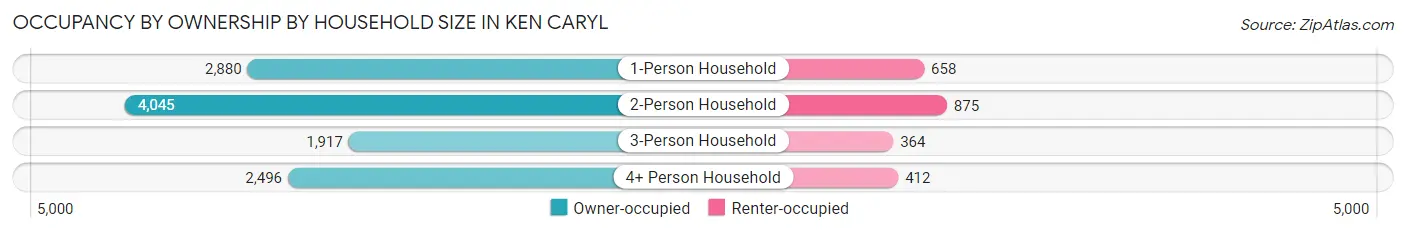
| Household Size | Owner-occupied | Renter-occupied |
| 1-Person Household | 2,880 (81.4%) | 658 (18.6%) |
| 2-Person Household | 4,045 (82.2%) | 875 (17.8%) |
| 3-Person Household | 1,917 (84.0%) | 364 (16.0%) |
| 4+ Person Household | 2,496 (85.8%) | 412 (14.2%) |
| Total Housing Units | 11,338 (83.1%) | 2,309 (16.9%) |
Occupancy by Educational Attainment in Ken Caryl
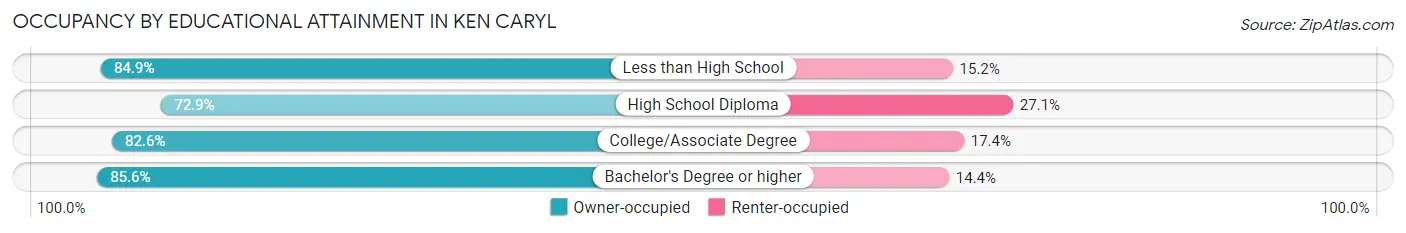
| Household Size | Owner-occupied | Renter-occupied |
| Less than High School | 224 (84.9%) | 40 (15.1%) |
| High School Diploma | 1,175 (72.9%) | 437 (27.1%) |
| College/Associate Degree | 3,796 (82.6%) | 798 (17.4%) |
| Bachelor's Degree or higher | 6,143 (85.6%) | 1,034 (14.4%) |
Occupancy by Age of Householder in Ken Caryl
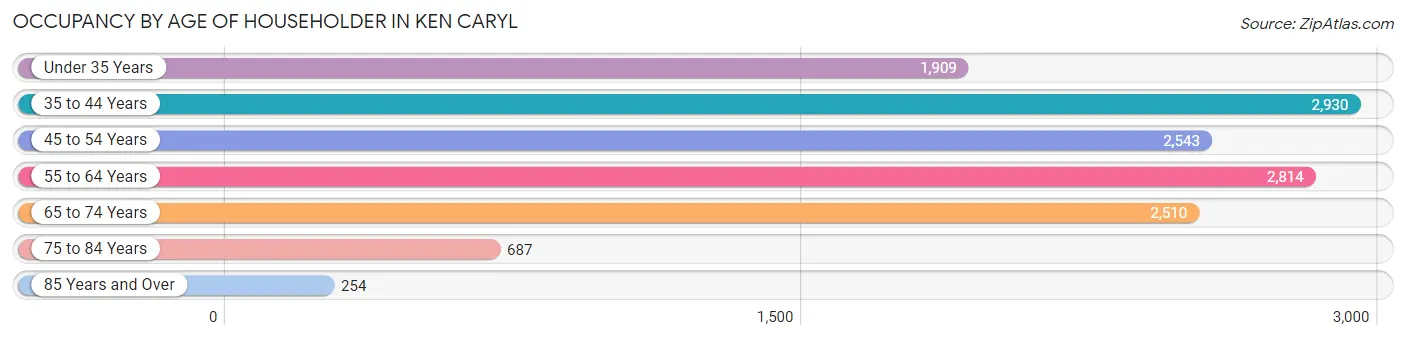
| Age Bracket | # Households | % Households |
| Under 35 Years | 1,909 | 14.0% |
| 35 to 44 Years | 2,930 | 21.5% |
| 45 to 54 Years | 2,543 | 18.6% |
| 55 to 64 Years | 2,814 | 20.6% |
| 65 to 74 Years | 2,510 | 18.4% |
| 75 to 84 Years | 687 | 5.0% |
| 85 Years and Over | 254 | 1.9% |
| Total | 13,647 | 100.0% |
Housing Finances in Ken Caryl
Median Income by Occupancy in Ken Caryl
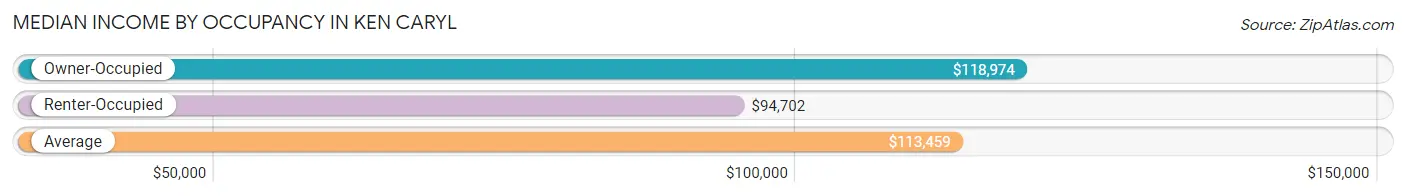
| Occupancy Type | # Households | Median Income |
| Owner-Occupied | 11,338 (83.1%) | $118,974 |
| Renter-Occupied | 2,309 (16.9%) | $94,702 |
| Average | 13,647 (100.0%) | $113,459 |
Occupancy by Householder Income Bracket in Ken Caryl
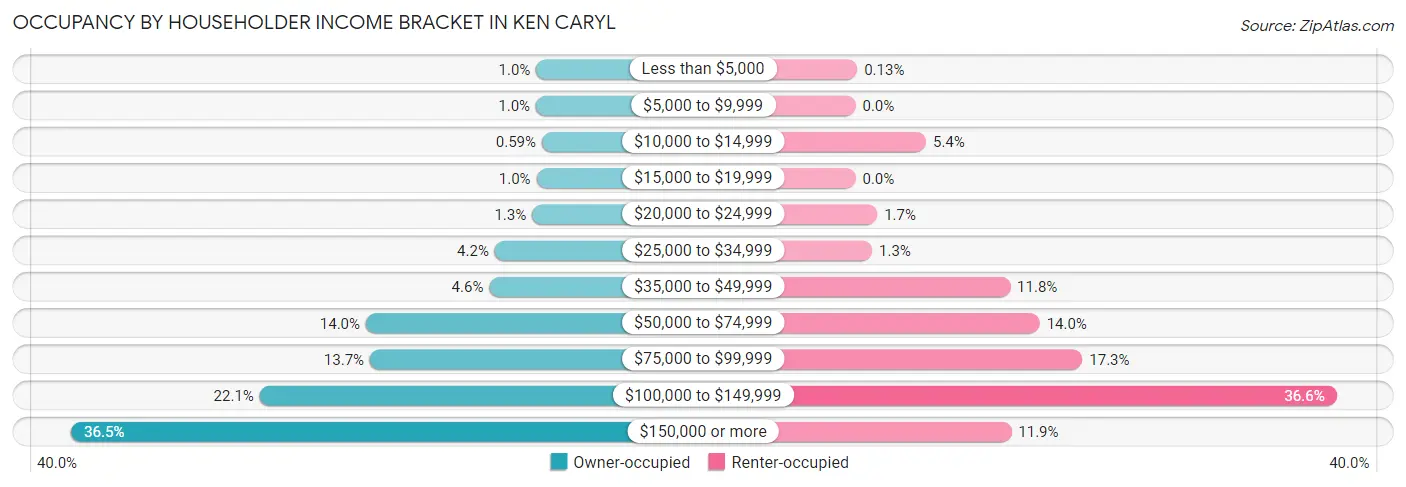
| Income Bracket | Owner-occupied | Renter-occupied |
| Less than $5,000 | 116 (1.0%) | 3 (0.1%) |
| $5,000 to $9,999 | 118 (1.0%) | 0 (0.0%) |
| $10,000 to $14,999 | 67 (0.6%) | 124 (5.4%) |
| $15,000 to $19,999 | 113 (1.0%) | 0 (0.0%) |
| $20,000 to $24,999 | 152 (1.3%) | 38 (1.7%) |
| $25,000 to $34,999 | 474 (4.2%) | 29 (1.3%) |
| $35,000 to $49,999 | 521 (4.6%) | 272 (11.8%) |
| $50,000 to $74,999 | 1,587 (14.0%) | 324 (14.0%) |
| $75,000 to $99,999 | 1,552 (13.7%) | 399 (17.3%) |
| $100,000 to $149,999 | 2,505 (22.1%) | 846 (36.6%) |
| $150,000 or more | 4,133 (36.4%) | 274 (11.9%) |
| Total | 11,338 (100.0%) | 2,309 (100.0%) |
Monthly Housing Cost Tiers in Ken Caryl
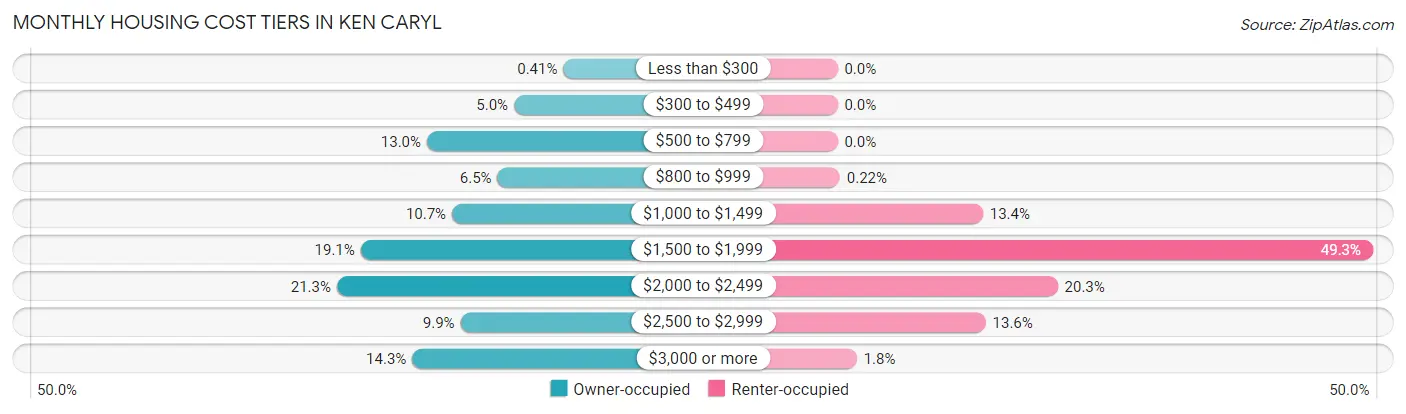
| Monthly Cost | Owner-occupied | Renter-occupied |
| Less than $300 | 47 (0.4%) | 0 (0.0%) |
| $300 to $499 | 561 (5.0%) | 0 (0.0%) |
| $500 to $799 | 1,470 (13.0%) | 0 (0.0%) |
| $800 to $999 | 734 (6.5%) | 5 (0.2%) |
| $1,000 to $1,499 | 1,209 (10.7%) | 309 (13.4%) |
| $1,500 to $1,999 | 2,162 (19.1%) | 1,138 (49.3%) |
| $2,000 to $2,499 | 2,411 (21.3%) | 468 (20.3%) |
| $2,500 to $2,999 | 1,120 (9.9%) | 315 (13.6%) |
| $3,000 or more | 1,624 (14.3%) | 41 (1.8%) |
| Total | 11,338 (100.0%) | 2,309 (100.0%) |
Physical Housing Characteristics in Ken Caryl
Housing Structures in Ken Caryl
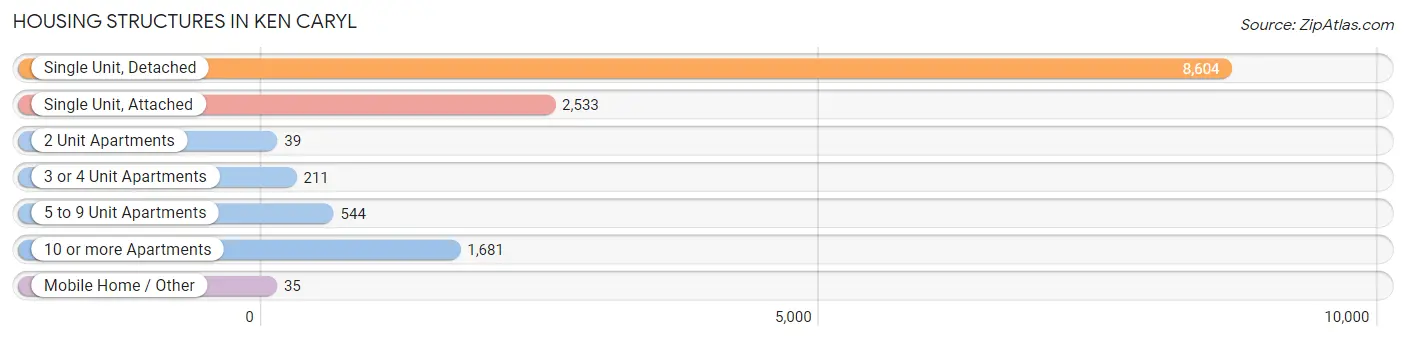
| Structure Type | # Housing Units | % Housing Units |
| Single Unit, Detached | 8,604 | 63.0% |
| Single Unit, Attached | 2,533 | 18.6% |
| 2 Unit Apartments | 39 | 0.3% |
| 3 or 4 Unit Apartments | 211 | 1.5% |
| 5 to 9 Unit Apartments | 544 | 4.0% |
| 10 or more Apartments | 1,681 | 12.3% |
| Mobile Home / Other | 35 | 0.3% |
| Total | 13,647 | 100.0% |
Housing Structures by Occupancy in Ken Caryl
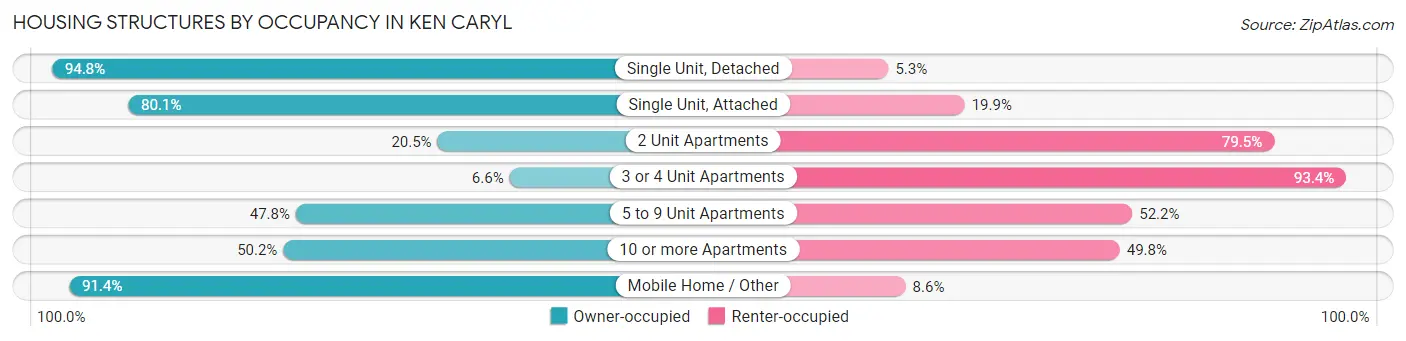
| Structure Type | Owner-occupied | Renter-occupied |
| Single Unit, Detached | 8,152 (94.8%) | 452 (5.2%) |
| Single Unit, Attached | 2,028 (80.1%) | 505 (19.9%) |
| 2 Unit Apartments | 8 (20.5%) | 31 (79.5%) |
| 3 or 4 Unit Apartments | 14 (6.6%) | 197 (93.4%) |
| 5 to 9 Unit Apartments | 260 (47.8%) | 284 (52.2%) |
| 10 or more Apartments | 844 (50.2%) | 837 (49.8%) |
| Mobile Home / Other | 32 (91.4%) | 3 (8.6%) |
| Total | 11,338 (83.1%) | 2,309 (16.9%) |
Housing Structures by Number of Rooms in Ken Caryl
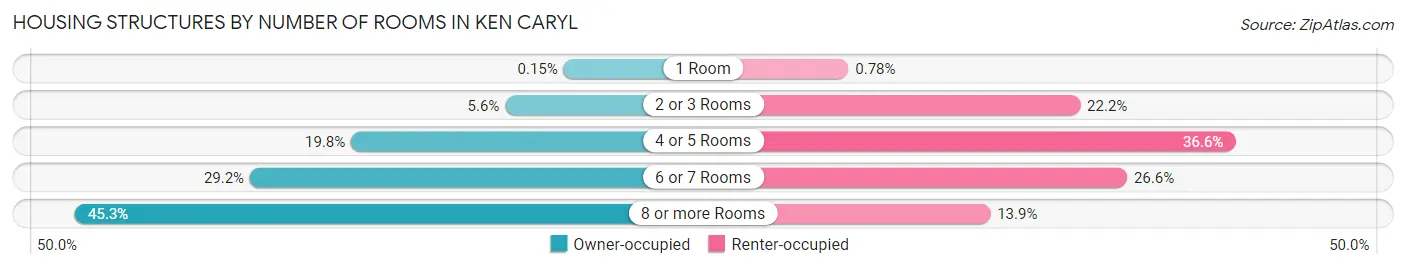
| Number of Rooms | Owner-occupied | Renter-occupied |
| 1 Room | 17 (0.2%) | 18 (0.8%) |
| 2 or 3 Rooms | 629 (5.6%) | 513 (22.2%) |
| 4 or 5 Rooms | 2,245 (19.8%) | 844 (36.5%) |
| 6 or 7 Rooms | 3,306 (29.2%) | 613 (26.6%) |
| 8 or more Rooms | 5,141 (45.3%) | 321 (13.9%) |
| Total | 11,338 (100.0%) | 2,309 (100.0%) |
Housing Structure by Heating Type in Ken Caryl
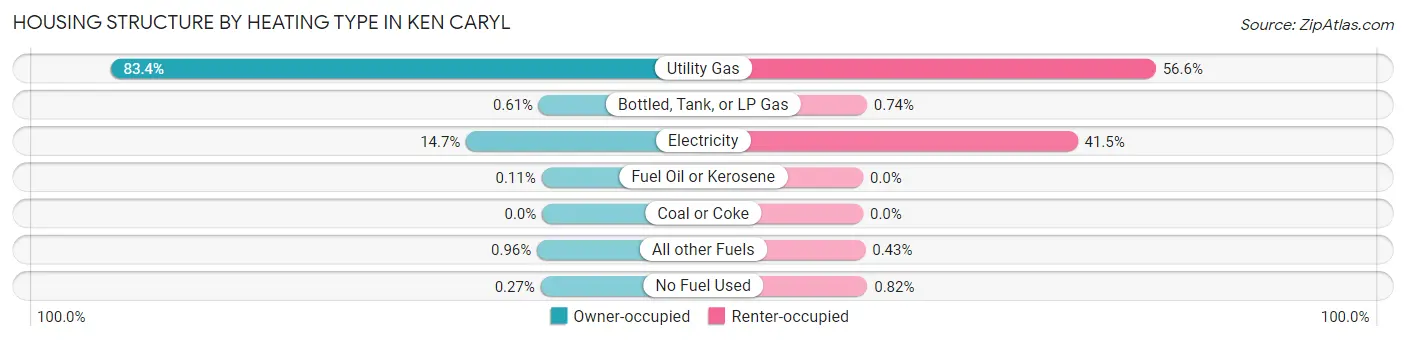
| Heating Type | Owner-occupied | Renter-occupied |
| Utility Gas | 9,453 (83.4%) | 1,306 (56.6%) |
| Bottled, Tank, or LP Gas | 69 (0.6%) | 17 (0.7%) |
| Electricity | 1,663 (14.7%) | 957 (41.4%) |
| Fuel Oil or Kerosene | 13 (0.1%) | 0 (0.0%) |
| Coal or Coke | 0 (0.0%) | 0 (0.0%) |
| All other Fuels | 109 (1.0%) | 10 (0.4%) |
| No Fuel Used | 31 (0.3%) | 19 (0.8%) |
| Total | 11,338 (100.0%) | 2,309 (100.0%) |
Household Vehicle Usage in Ken Caryl
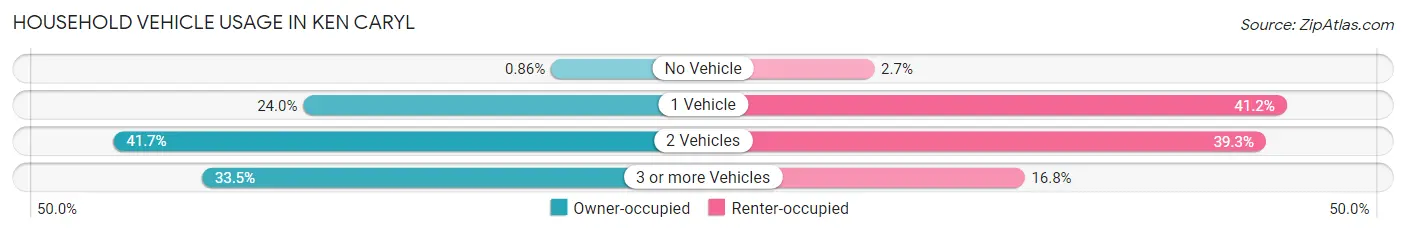
| Vehicles per Household | Owner-occupied | Renter-occupied |
| No Vehicle | 97 (0.9%) | 63 (2.7%) |
| 1 Vehicle | 2,720 (24.0%) | 952 (41.2%) |
| 2 Vehicles | 4,729 (41.7%) | 907 (39.3%) |
| 3 or more Vehicles | 3,792 (33.5%) | 387 (16.8%) |
| Total | 11,338 (100.0%) | 2,309 (100.0%) |
Real Estate & Mortgages in Ken Caryl
Real Estate and Mortgage Overview in Ken Caryl
| Characteristic | Without Mortgage | With Mortgage |
| Housing Units | 2,625 | 8,713 |
| Median Property Value | $494,300 | $500,700 |
| Median Household Income | $80,865 | $3,459 |
| Monthly Housing Costs | $635 | $1,624 |
| Real Estate Taxes | $2,865 | $165 |
Property Value by Mortgage Status in Ken Caryl
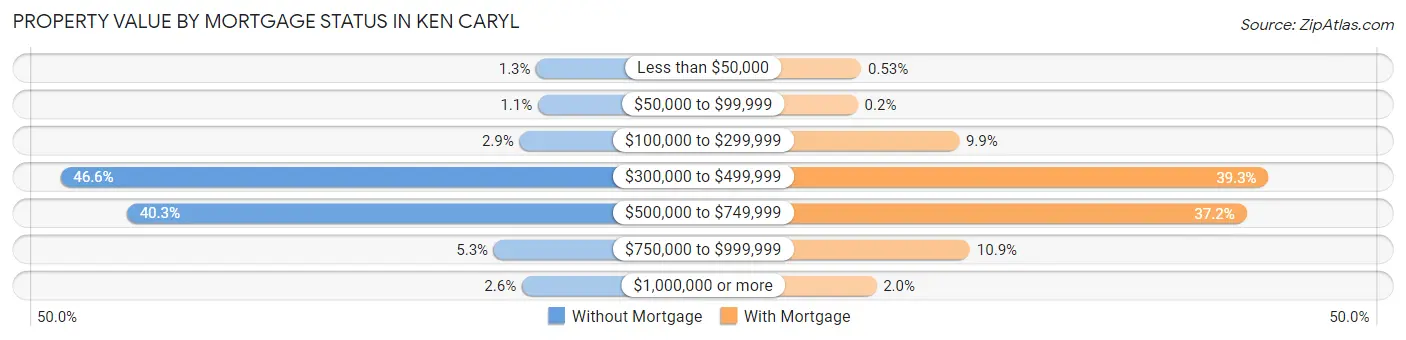
| Property Value | Without Mortgage | With Mortgage |
| Less than $50,000 | 33 (1.3%) | 46 (0.5%) |
| $50,000 to $99,999 | 29 (1.1%) | 17 (0.2%) |
| $100,000 to $299,999 | 75 (2.9%) | 858 (9.9%) |
| $300,000 to $499,999 | 1,223 (46.6%) | 3,426 (39.3%) |
| $500,000 to $749,999 | 1,057 (40.3%) | 3,245 (37.2%) |
| $750,000 to $999,999 | 139 (5.3%) | 949 (10.9%) |
| $1,000,000 or more | 69 (2.6%) | 172 (2.0%) |
| Total | 2,625 (100.0%) | 8,713 (100.0%) |
Household Income by Mortgage Status in Ken Caryl
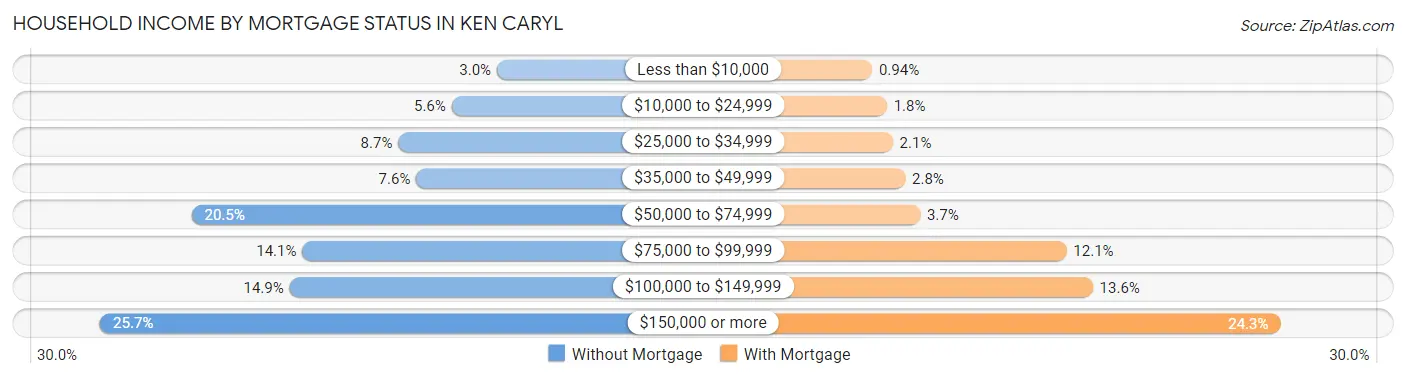
| Household Income | Without Mortgage | With Mortgage |
| Less than $10,000 | 79 (3.0%) | 82 (0.9%) |
| $10,000 to $24,999 | 147 (5.6%) | 155 (1.8%) |
| $25,000 to $34,999 | 227 (8.6%) | 185 (2.1%) |
| $35,000 to $49,999 | 200 (7.6%) | 247 (2.8%) |
| $50,000 to $74,999 | 537 (20.5%) | 321 (3.7%) |
| $75,000 to $99,999 | 371 (14.1%) | 1,050 (12.0%) |
| $100,000 to $149,999 | 390 (14.9%) | 1,181 (13.6%) |
| $150,000 or more | 674 (25.7%) | 2,115 (24.3%) |
| Total | 2,625 (100.0%) | 8,713 (100.0%) |
Property Value to Household Income Ratio in Ken Caryl
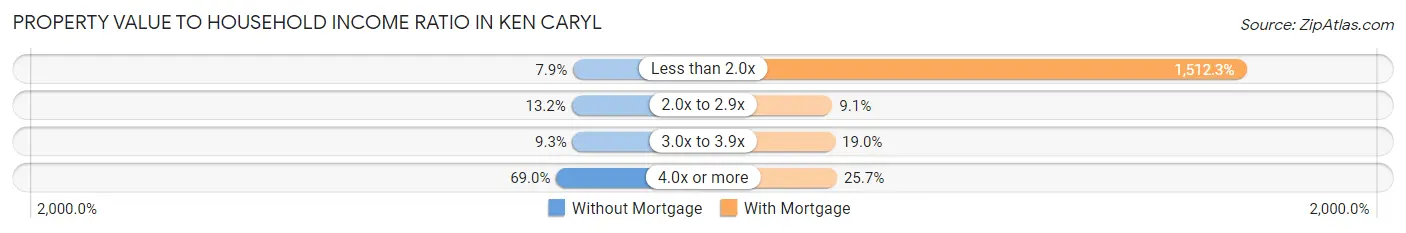
| Value-to-Income Ratio | Without Mortgage | With Mortgage |
| Less than 2.0x | 208 (7.9%) | 131,765 (1,512.3%) |
| 2.0x to 2.9x | 347 (13.2%) | 791 (9.1%) |
| 3.0x to 3.9x | 245 (9.3%) | 1,652 (19.0%) |
| 4.0x or more | 1,810 (69.0%) | 2,236 (25.7%) |
| Total | 2,625 (100.0%) | 8,713 (100.0%) |
Real Estate Taxes by Mortgage Status in Ken Caryl
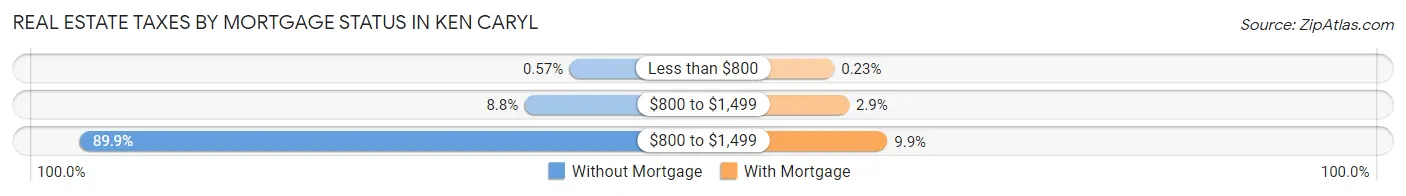
| Property Taxes | Without Mortgage | With Mortgage |
| Less than $800 | 15 (0.6%) | 20 (0.2%) |
| $800 to $1,499 | 230 (8.8%) | 254 (2.9%) |
| $800 to $1,499 | 2,360 (89.9%) | 864 (9.9%) |
| Total | 2,625 (100.0%) | 8,713 (100.0%) |
Health & Disability in Ken Caryl
Health Insurance Coverage by Age in Ken Caryl
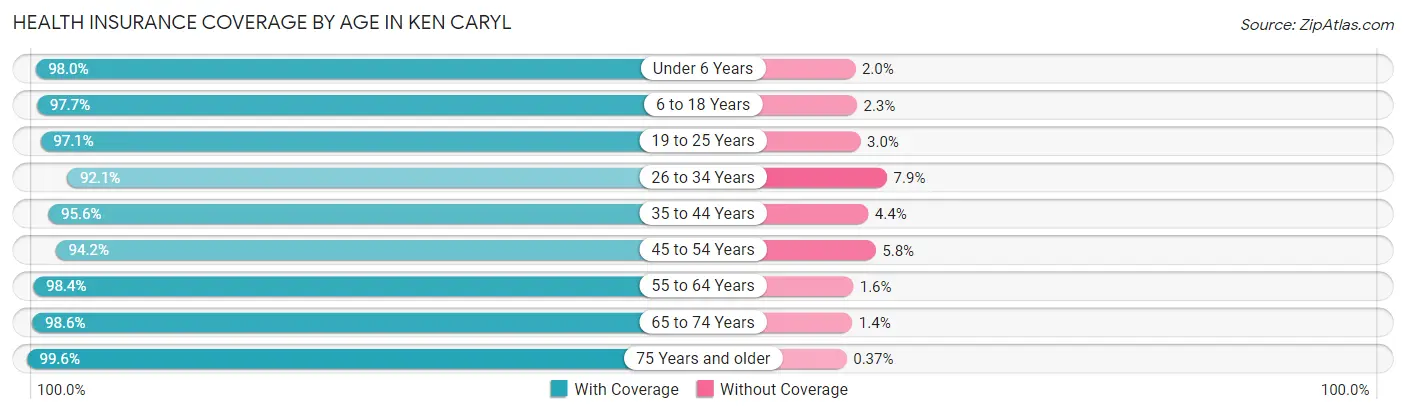
| Age Bracket | With Coverage | Without Coverage |
| Under 6 Years | 1,870 (98.0%) | 38 (2.0%) |
| 6 to 18 Years | 5,614 (97.7%) | 131 (2.3%) |
| 19 to 25 Years | 2,039 (97.1%) | 62 (2.9%) |
| 26 to 34 Years | 3,403 (92.1%) | 292 (7.9%) |
| 35 to 44 Years | 5,196 (95.6%) | 239 (4.4%) |
| 45 to 54 Years | 4,231 (94.2%) | 260 (5.8%) |
| 55 to 64 Years | 4,686 (98.4%) | 75 (1.6%) |
| 65 to 74 Years | 3,686 (98.6%) | 53 (1.4%) |
| 75 Years and older | 1,616 (99.6%) | 6 (0.4%) |
| Total | 32,341 (96.6%) | 1,156 (3.5%) |
Health Insurance Coverage by Citizenship Status in Ken Caryl
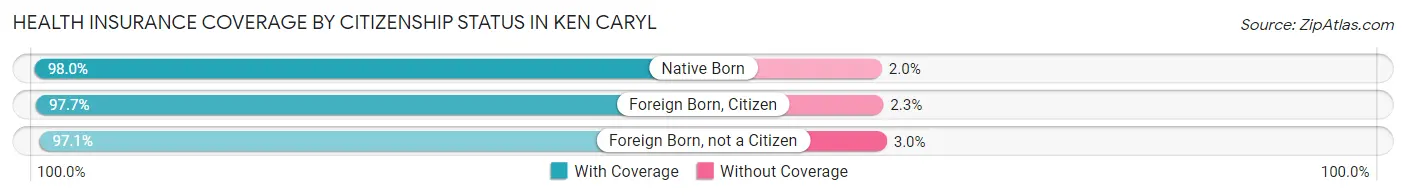
| Citizenship Status | With Coverage | Without Coverage |
| Native Born | 1,870 (98.0%) | 38 (2.0%) |
| Foreign Born, Citizen | 5,614 (97.7%) | 131 (2.3%) |
| Foreign Born, not a Citizen | 2,039 (97.1%) | 62 (2.9%) |
Health Insurance Coverage by Household Income in Ken Caryl
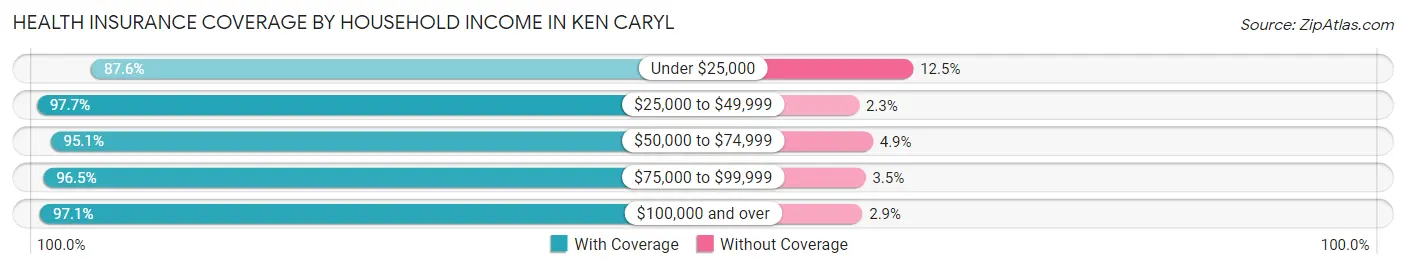
| Household Income | With Coverage | Without Coverage |
| Under $25,000 | 907 (87.5%) | 129 (12.4%) |
| $25,000 to $49,999 | 2,011 (97.7%) | 47 (2.3%) |
| $50,000 to $74,999 | 3,338 (95.1%) | 171 (4.9%) |
| $75,000 to $99,999 | 4,224 (96.5%) | 153 (3.5%) |
| $100,000 and over | 21,829 (97.1%) | 653 (2.9%) |
Public vs Private Health Insurance Coverage by Age in Ken Caryl
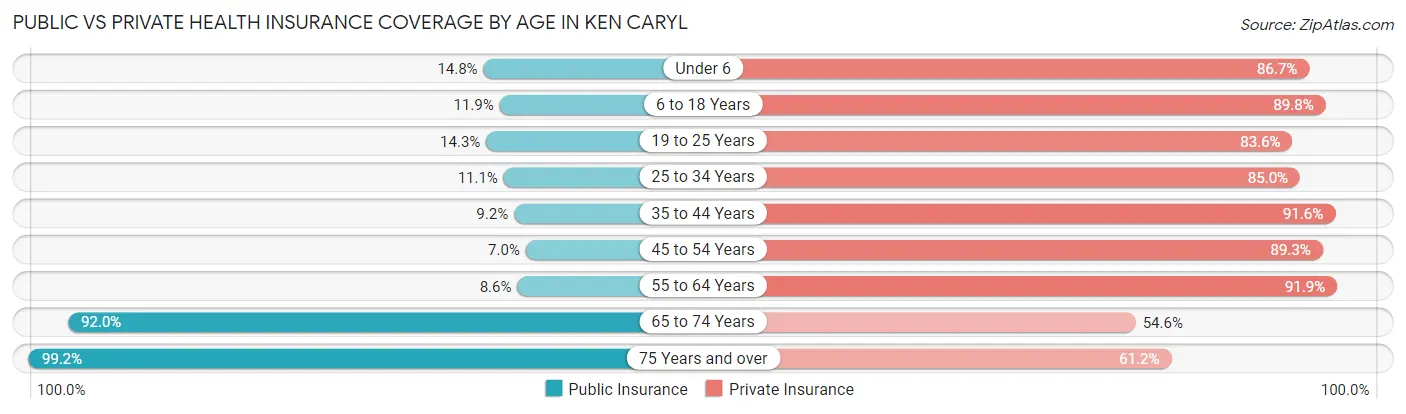
| Age Bracket | Public Insurance | Private Insurance |
| Under 6 | 283 (14.8%) | 1,655 (86.7%) |
| 6 to 18 Years | 681 (11.8%) | 5,157 (89.8%) |
| 19 to 25 Years | 301 (14.3%) | 1,757 (83.6%) |
| 25 to 34 Years | 409 (11.1%) | 3,142 (85.0%) |
| 35 to 44 Years | 498 (9.2%) | 4,976 (91.5%) |
| 45 to 54 Years | 314 (7.0%) | 4,008 (89.2%) |
| 55 to 64 Years | 407 (8.6%) | 4,377 (91.9%) |
| 65 to 74 Years | 3,438 (91.9%) | 2,040 (54.6%) |
| 75 Years and over | 1,609 (99.2%) | 992 (61.2%) |
| Total | 7,940 (23.7%) | 28,104 (83.9%) |
Disability Status by Sex by Age in Ken Caryl
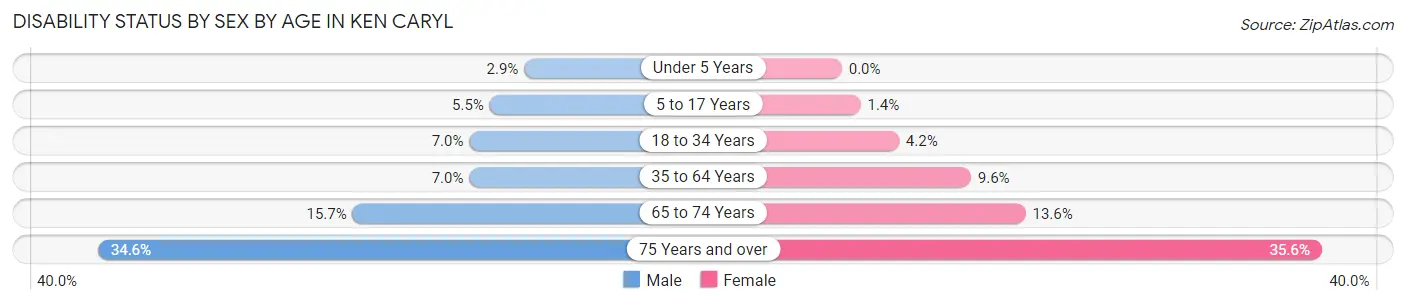
| Age Bracket | Male | Female |
| Under 5 Years | 22 (2.9%) | 0 (0.0%) |
| 5 to 17 Years | 152 (5.5%) | 39 (1.4%) |
| 18 to 34 Years | 236 (7.0%) | 123 (4.2%) |
| 35 to 64 Years | 521 (7.0%) | 692 (9.6%) |
| 65 to 74 Years | 296 (15.7%) | 252 (13.6%) |
| 75 Years and over | 225 (34.6%) | 346 (35.6%) |
Disability Class by Sex by Age in Ken Caryl
Disability Class: Hearing Difficulty
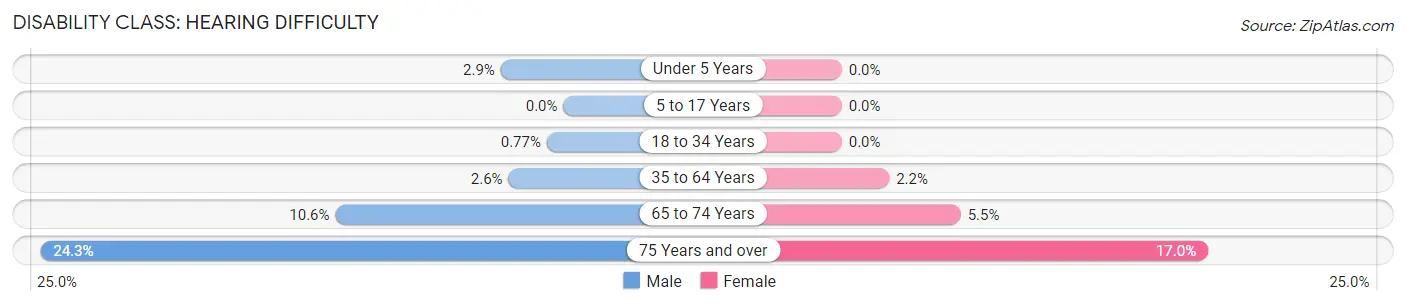
| Age Bracket | Male | Female |
| Under 5 Years | 22 (2.9%) | 0 (0.0%) |
| 5 to 17 Years | 0 (0.0%) | 0 (0.0%) |
| 18 to 34 Years | 26 (0.8%) | 0 (0.0%) |
| 35 to 64 Years | 190 (2.5%) | 159 (2.2%) |
| 65 to 74 Years | 200 (10.6%) | 102 (5.5%) |
| 75 Years and over | 158 (24.3%) | 165 (17.0%) |
Disability Class: Vision Difficulty
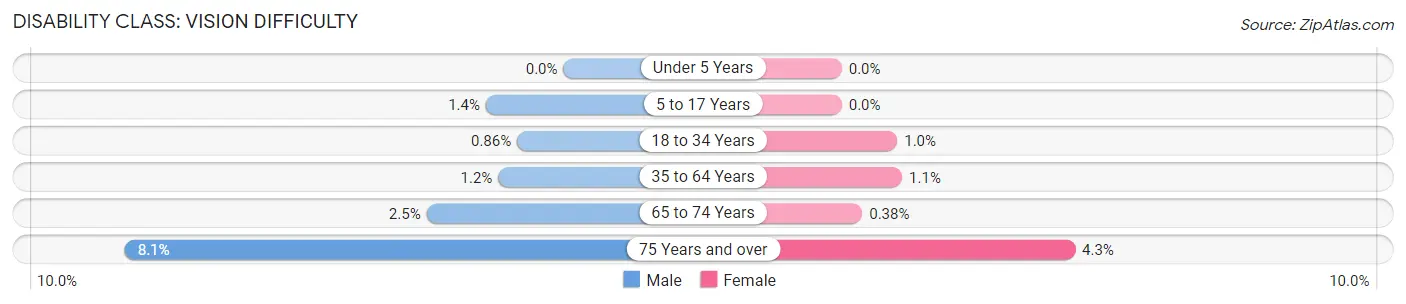
| Age Bracket | Male | Female |
| Under 5 Years | 0 (0.0%) | 0 (0.0%) |
| 5 to 17 Years | 40 (1.4%) | 0 (0.0%) |
| 18 to 34 Years | 29 (0.9%) | 30 (1.0%) |
| 35 to 64 Years | 90 (1.2%) | 81 (1.1%) |
| 65 to 74 Years | 48 (2.5%) | 7 (0.4%) |
| 75 Years and over | 53 (8.1%) | 42 (4.3%) |
Disability Class: Cognitive Difficulty
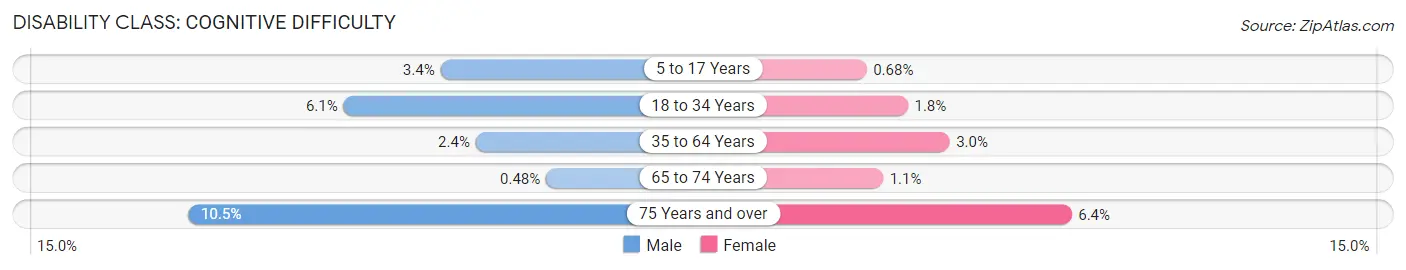
| Age Bracket | Male | Female |
| 5 to 17 Years | 95 (3.4%) | 19 (0.7%) |
| 18 to 34 Years | 207 (6.1%) | 53 (1.8%) |
| 35 to 64 Years | 182 (2.4%) | 216 (3.0%) |
| 65 to 74 Years | 9 (0.5%) | 21 (1.1%) |
| 75 Years and over | 68 (10.4%) | 62 (6.4%) |
Disability Class: Ambulatory Difficulty
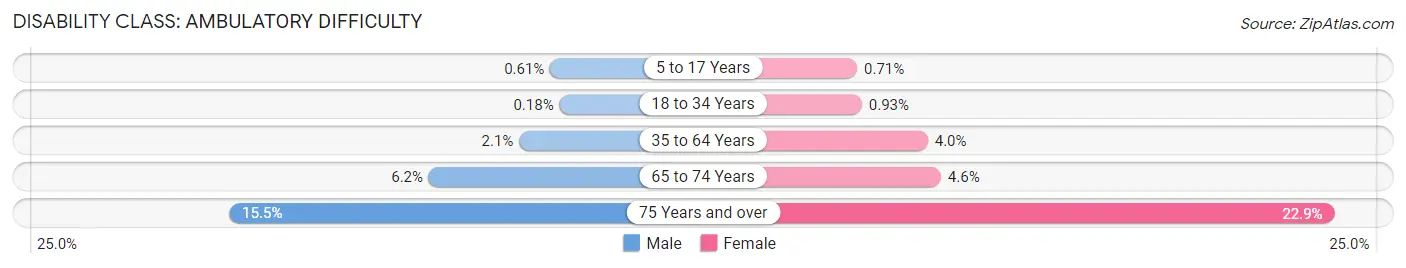
| Age Bracket | Male | Female |
| 5 to 17 Years | 17 (0.6%) | 20 (0.7%) |
| 18 to 34 Years | 6 (0.2%) | 27 (0.9%) |
| 35 to 64 Years | 153 (2.1%) | 288 (4.0%) |
| 65 to 74 Years | 118 (6.2%) | 85 (4.6%) |
| 75 Years and over | 101 (15.5%) | 222 (22.9%) |
Disability Class: Self-Care Difficulty
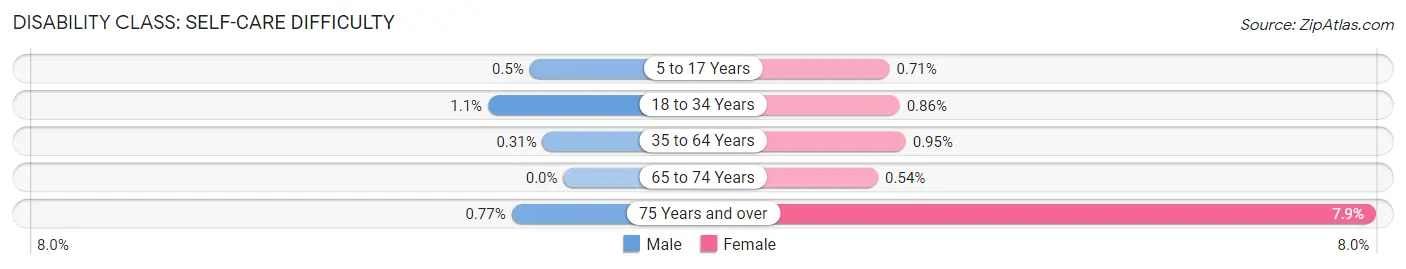
| Age Bracket | Male | Female |
| 5 to 17 Years | 14 (0.5%) | 20 (0.7%) |
| 18 to 34 Years | 38 (1.1%) | 25 (0.9%) |
| 35 to 64 Years | 23 (0.3%) | 69 (0.9%) |
| 65 to 74 Years | 0 (0.0%) | 10 (0.5%) |
| 75 Years and over | 5 (0.8%) | 77 (7.9%) |
Technology Access in Ken Caryl
Computing Device Access in Ken Caryl
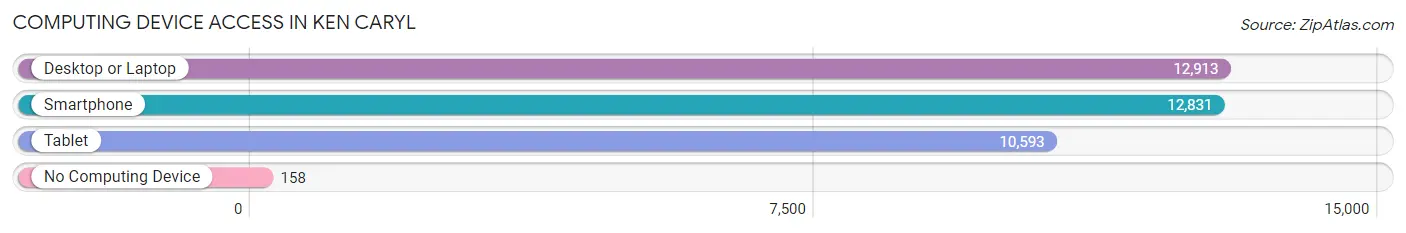
| Device Type | # Households | % Households |
| Desktop or Laptop | 12,913 | 94.6% |
| Smartphone | 12,831 | 94.0% |
| Tablet | 10,593 | 77.6% |
| No Computing Device | 158 | 1.2% |
| Total | 13,647 | 100.0% |
Internet Access in Ken Caryl
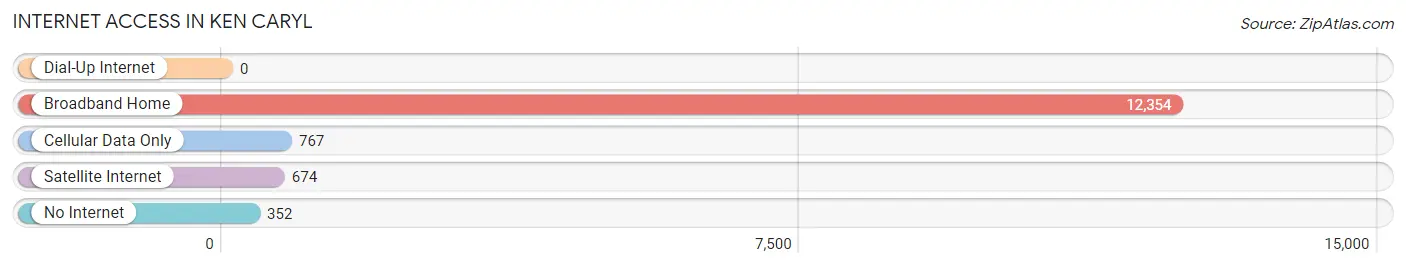
| Internet Type | # Households | % Households |
| Dial-Up Internet | 0 | 0.0% |
| Broadband Home | 12,354 | 90.5% |
| Cellular Data Only | 767 | 5.6% |
| Satellite Internet | 674 | 4.9% |
| No Internet | 352 | 2.6% |
| Total | 13,647 | 100.0% |
Ken Caryl Summary
History
Ken Caryl is a census-designated place located in Jefferson County, Colorado. It is situated in the foothills of the Rocky Mountains, approximately 20 miles southwest of Denver. The area was first settled in the late 1800s by homesteaders, and the community was officially established in the early 1900s. The name “Ken Caryl” is derived from the names of two of the original settlers, Kenneth and Caroline.
The area was primarily used for ranching and farming until the 1950s, when the population began to grow rapidly due to the development of the Denver metropolitan area. In the 1960s, the area was annexed by the City of Littleton, and the Ken Caryl Ranch was established. The ranch was developed as a residential community, and it quickly became one of the most desirable places to live in the Denver area.
In the 1970s, the Ken Caryl Valley was established as a master-planned community. The valley was designed to be a self-contained community, with its own shopping centers, schools, parks, and recreational facilities. The valley was also designed to be a safe and secure place to live, with strict building codes and a 24-hour security patrol.
In the 1980s, the Ken Caryl Ranch was annexed by the City of Littleton, and the area was officially designated as a census-designated place. The population of the area has continued to grow since then, and it is now home to over 20,000 people.
Geography
Ken Caryl is located in the foothills of the Rocky Mountains, approximately 20 miles southwest of Denver. The area is bordered by the cities of Littleton and Lakewood to the north, and the towns of Bow Mar and Columbine to the south. The area is situated at an elevation of 5,890 feet above sea level.
The area is characterized by rolling hills, open meadows, and dense forests. The area is home to a variety of wildlife, including deer, elk, coyotes, and mountain lions. The area is also home to a variety of birds, including hawks, eagles, and owls.
The climate in Ken Caryl is mild and temperate, with warm summers and cold winters. The average annual temperature is around 50 degrees Fahrenheit, and the average annual precipitation is around 18 inches.
Economy
The economy of Ken Caryl is primarily driven by the service industry. The area is home to a variety of retail stores, restaurants, and other businesses. The area is also home to a number of corporate offices, including those of Lockheed Martin, Raytheon, and United Launch Alliance.
The area is also home to a number of technology companies, including Oracle, IBM, and Microsoft. The area is also home to a number of medical facilities, including the Littleton Adventist Hospital and the Swedish Medical Center.
Demographics
As of the 2010 census, the population of Ken Caryl was 20,845. The population is primarily white (86.3%), followed by Hispanic or Latino (7.2%), Asian (2.7%), and African American (1.7%). The median household income is $90,845, and the median home value is $521,000.
The area is home to a variety of religious denominations, including Catholic (25.3%), Protestant (19.2%), and Jewish (2.2%). The area is also home to a variety of educational institutions, including the University of Colorado Denver, the University of Denver, and the Colorado School of Mines.
Common Questions
What is Per Capita Income in Ken Caryl?
Per Capita income in Ken Caryl is $55,735.
What is the Median Family Income in Ken Caryl?
Median Family Income in Ken Caryl is $133,750.
What is the Median Household income in Ken Caryl?
Median Household Income in Ken Caryl is $113,459.
What is Income or Wage Gap in Ken Caryl?
Income or Wage Gap in Ken Caryl is 22.3%.
Women in Ken Caryl earn 77.7 cents for every dollar earned by a man.
What is Family Income Deficit in Ken Caryl?
Family Income Deficit in Ken Caryl is $7,917.
Families that are below poverty line in Ken Caryl earn $7,917 less on average than the poverty threshold level.
What is Inequality or Gini Index in Ken Caryl?
Inequality or Gini Index in Ken Caryl is 0.38.
What is the Total Population of Ken Caryl?
Total Population of Ken Caryl is 33,505.
What is the Total Male Population of Ken Caryl?
Total Male Population of Ken Caryl is 16,924.
What is the Total Female Population of Ken Caryl?
Total Female Population of Ken Caryl is 16,581.
What is the Ratio of Males per 100 Females in Ken Caryl?
There are 102.07 Males per 100 Females in Ken Caryl.
What is the Ratio of Females per 100 Males in Ken Caryl?
There are 97.97 Females per 100 Males in Ken Caryl.
What is the Median Population Age in Ken Caryl?
Median Population Age in Ken Caryl is 41.5 Years.
What is the Average Family Size in Ken Caryl
Average Family Size in Ken Caryl is 3.0 People.
What is the Average Household Size in Ken Caryl
Average Household Size in Ken Caryl is 2.5 People.
How Large is the Labor Force in Ken Caryl?
There are 19,852 People in the Labor Forcein in Ken Caryl.
What is the Percentage of People in the Labor Force in Ken Caryl?
72.7% of People are in the Labor Force in Ken Caryl.
What is the Unemployment Rate in Ken Caryl?
Unemployment Rate in Ken Caryl is 3.5%.