Dakota Ridge, CO Map & Demographics
Dakota Ridge Map
Dakota Ridge Overview
$51,596
PER CAPITA INCOME
$131,677
AVG FAMILY INCOME
$116,683
AVG HOUSEHOLD INCOME
19.8%
WAGE / INCOME GAP [ % ]
80.2¢/ $1
WAGE / INCOME GAP [ $ ]
0.36
INEQUALITY / GINI INDEX
34,234
TOTAL POPULATION
17,193
MALE POPULATION
17,041
FEMALE POPULATION
100.89
MALES / 100 FEMALES
99.12
FEMALES / 100 MALES
40.0
MEDIAN AGE
3.1
AVG FAMILY SIZE
2.6
AVG HOUSEHOLD SIZE
20,105
LABOR FORCE [ PEOPLE ]
71.6%
PERCENT IN LABOR FORCE
3.4%
UNEMPLOYMENT RATE
Income in Dakota Ridge
Income Overview in Dakota Ridge
Per Capita Income in Dakota Ridge is $51,596, while median incomes of families and households are $131,677 and $116,683 respectively.
| Characteristic | Number | Measure |
| Per Capita Income | 34,234 | $51,596 |
| Median Family Income | 9,437 | $131,677 |
| Mean Family Income | 9,437 | $149,798 |
| Median Household Income | 12,963 | $116,683 |
| Mean Household Income | 12,963 | $135,074 |
| Income Deficit | 9,437 | $0 |
| Wage / Income Gap (%) | 34,234 | 19.83% |
| Wage / Income Gap ($) | 34,234 | 80.17¢ per $1 |
| Gini / Inequality Index | 34,234 | 0.36 |
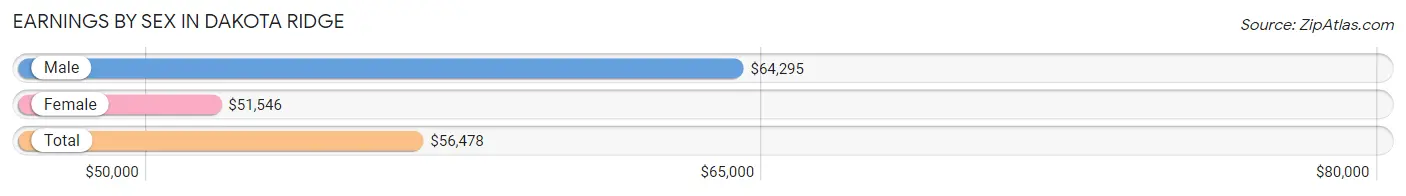
Earnings by Sex in Dakota Ridge
Average Earnings in Dakota Ridge are $56,478, $64,295 for men and $51,546 for women, a difference of 19.8%.
| Sex | Number | Average Earnings |
| Male | 11,117 (52.7%) | $64,295 |
| Female | 9,974 (47.3%) | $51,546 |
| Total | 21,091 (100.0%) | $56,478 |
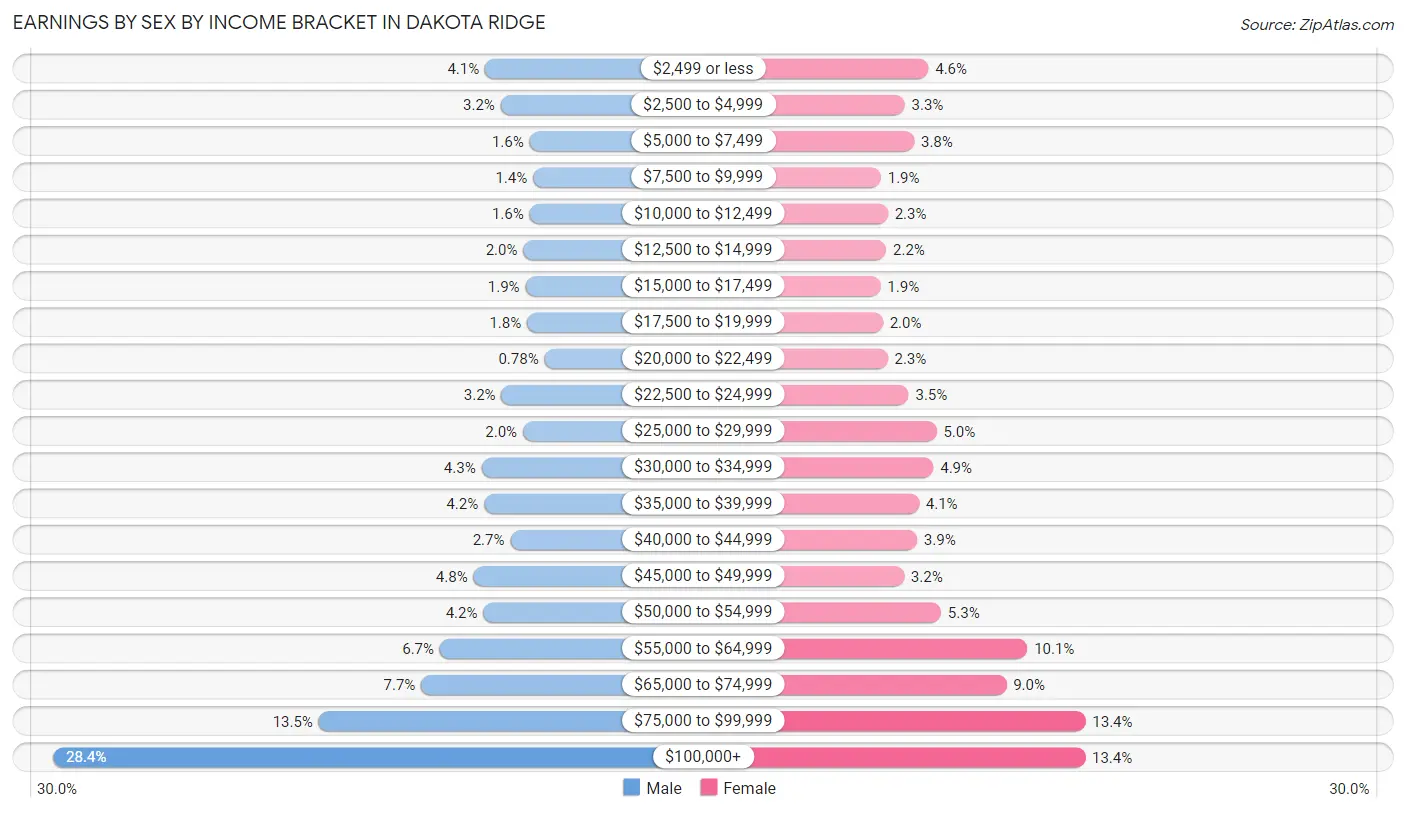
Earnings by Sex by Income Bracket in Dakota Ridge
The most common earnings brackets in Dakota Ridge are $100,000+ for men (3,157 | 28.4%) and $75,000 to $99,999 for women (1,338 | 13.4%).
| Income | Male | Female |
| $2,499 or less | 458 (4.1%) | 457 (4.6%) |
| $2,500 to $4,999 | 360 (3.2%) | 324 (3.3%) |
| $5,000 to $7,499 | 180 (1.6%) | 377 (3.8%) |
| $7,500 to $9,999 | 158 (1.4%) | 191 (1.9%) |
| $10,000 to $12,499 | 180 (1.6%) | 229 (2.3%) |
| $12,500 to $14,999 | 219 (2.0%) | 220 (2.2%) |
| $15,000 to $17,499 | 206 (1.8%) | 189 (1.9%) |
| $17,500 to $19,999 | 196 (1.8%) | 201 (2.0%) |
| $20,000 to $22,499 | 87 (0.8%) | 228 (2.3%) |
| $22,500 to $24,999 | 356 (3.2%) | 346 (3.5%) |
| $25,000 to $29,999 | 221 (2.0%) | 503 (5.0%) |
| $30,000 to $34,999 | 480 (4.3%) | 485 (4.9%) |
| $35,000 to $39,999 | 465 (4.2%) | 404 (4.1%) |
| $40,000 to $44,999 | 300 (2.7%) | 393 (3.9%) |
| $45,000 to $49,999 | 530 (4.8%) | 320 (3.2%) |
| $50,000 to $54,999 | 469 (4.2%) | 528 (5.3%) |
| $55,000 to $64,999 | 740 (6.7%) | 1,011 (10.1%) |
| $65,000 to $74,999 | 857 (7.7%) | 894 (9.0%) |
| $75,000 to $99,999 | 1,498 (13.5%) | 1,338 (13.4%) |
| $100,000+ | 3,157 (28.4%) | 1,336 (13.4%) |
| Total | 11,117 (100.0%) | 9,974 (100.0%) |
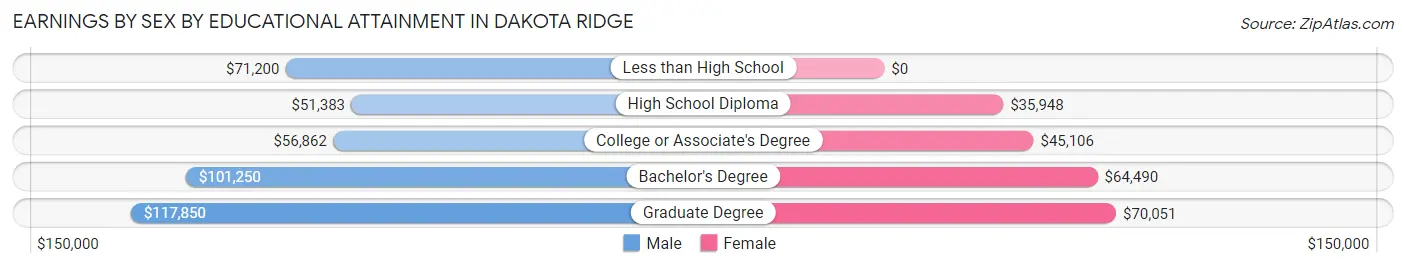
Earnings by Sex by Educational Attainment in Dakota Ridge
Average earnings in Dakota Ridge are $73,485 for men and $55,991 for women, a difference of 23.8%. Men with an educational attainment of graduate degree enjoy the highest average annual earnings of $117,850, while those with high school diploma education earn the least with $51,383. Women with an educational attainment of graduate degree earn the most with the average annual earnings of $70,051, while those with high school diploma education have the smallest earnings of $35,948.
| Educational Attainment | Male Income | Female Income |
| Less than High School | $71,200 | $0 |
| High School Diploma | $51,383 | $35,948 |
| College or Associate's Degree | $56,862 | $45,106 |
| Bachelor's Degree | $101,250 | $64,490 |
| Graduate Degree | $117,850 | $70,051 |
| Total | $73,485 | $55,991 |
Family Income in Dakota Ridge
Family Income Brackets in Dakota Ridge
According to the Dakota Ridge family income data, there are 2,690 families falling into the $100,000 to $149,999 income range, which is the most common income bracket and makes up 28.5% of all families. Conversely, the $15,000 to $24,999 income bracket is the least frequent group with only 47 families (0.5%) belonging to this category.
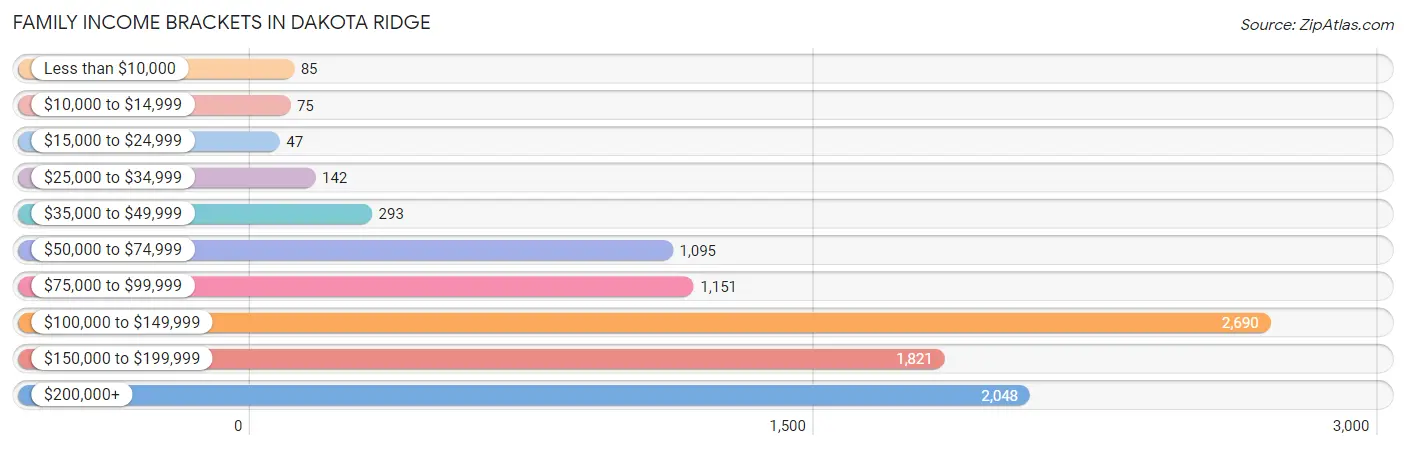
| Income Bracket | # Families | % Families |
| Less than $10,000 | 85 | 0.9% |
| $10,000 to $14,999 | 75 | 0.8% |
| $15,000 to $24,999 | 47 | 0.5% |
| $25,000 to $34,999 | 142 | 1.5% |
| $35,000 to $49,999 | 293 | 3.1% |
| $50,000 to $74,999 | 1,095 | 11.6% |
| $75,000 to $99,999 | 1,151 | 12.2% |
| $100,000 to $149,999 | 2,690 | 28.5% |
| $150,000 to $199,999 | 1,821 | 19.3% |
| $200,000+ | 2,048 | 21.7% |
Family Income by Famaliy Size in Dakota Ridge
6-person families (269 | 2.9%) account for the highest median family income in Dakota Ridge with $178,068 per family, while 2-person families (4,357 | 46.2%) have the highest median income of $58,233 per family member.
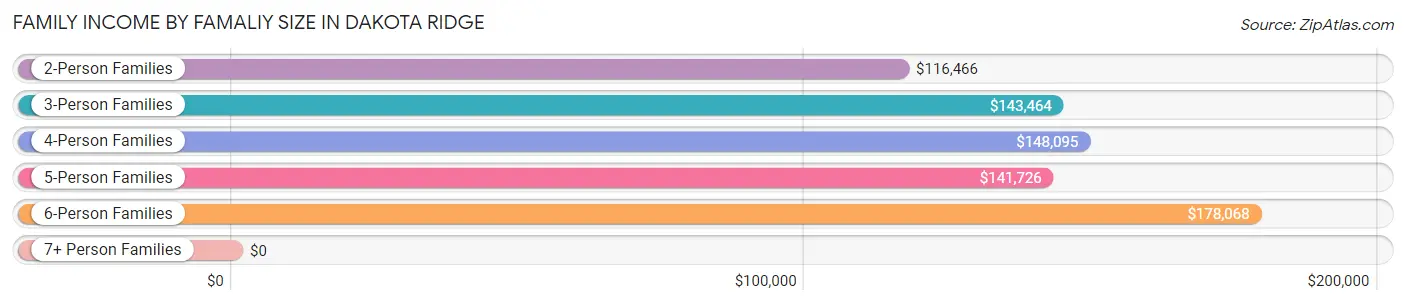
| Income Bracket | # Families | Median Income |
| 2-Person Families | 4,357 (46.2%) | $116,466 |
| 3-Person Families | 2,108 (22.3%) | $143,464 |
| 4-Person Families | 2,086 (22.1%) | $148,095 |
| 5-Person Families | 541 (5.7%) | $141,726 |
| 6-Person Families | 269 (2.9%) | $178,068 |
| 7+ Person Families | 76 (0.8%) | $0 |
| Total | 9,437 (100.0%) | $131,677 |
Family Income by Number of Earners in Dakota Ridge
The median family income in Dakota Ridge is $131,677, with families comprising 3+ earners (1,606) having the highest median family income of $163,376, while families with 1 earner (2,120) have the lowest median family income of $90,256, accounting for 17.0% and 22.5% of families, respectively.
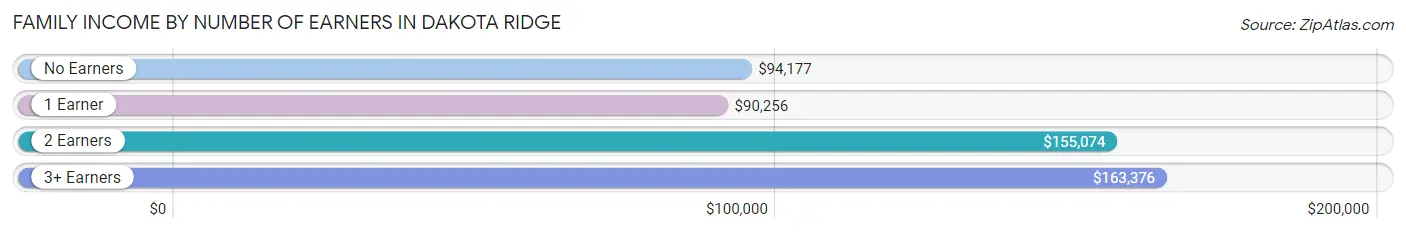
| Number of Earners | # Families | Median Income |
| No Earners | 1,139 (12.1%) | $94,177 |
| 1 Earner | 2,120 (22.5%) | $90,256 |
| 2 Earners | 4,572 (48.4%) | $155,074 |
| 3+ Earners | 1,606 (17.0%) | $163,376 |
| Total | 9,437 (100.0%) | $131,677 |
Household Income in Dakota Ridge
Household Income Brackets in Dakota Ridge
With 3,409 households falling in the category, the $100,000 to $149,999 income range is the most frequent in Dakota Ridge, accounting for 26.3% of all households. In contrast, only 169 households (1.3%) fall into the $10,000 to $14,999 income bracket, making it the least populous group.
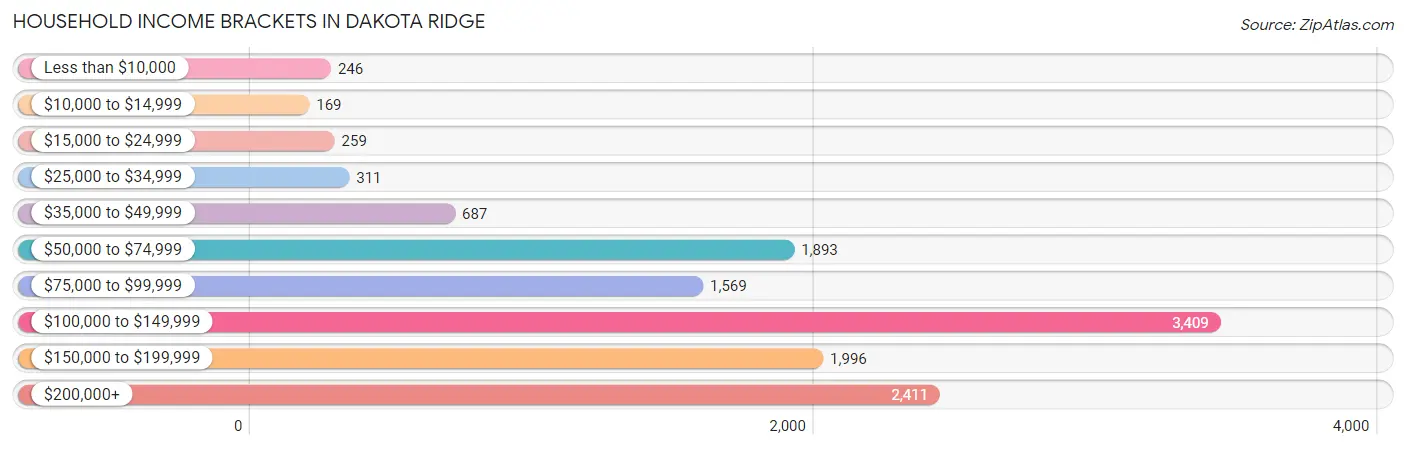
| Income Bracket | # Households | % Households |
| Less than $10,000 | 246 | 1.9% |
| $10,000 to $14,999 | 169 | 1.3% |
| $15,000 to $24,999 | 259 | 2.0% |
| $25,000 to $34,999 | 311 | 2.4% |
| $35,000 to $49,999 | 687 | 5.3% |
| $50,000 to $74,999 | 1,893 | 14.6% |
| $75,000 to $99,999 | 1,569 | 12.1% |
| $100,000 to $149,999 | 3,409 | 26.3% |
| $150,000 to $199,999 | 1,996 | 15.4% |
| $200,000+ | 2,411 | 18.6% |
Household Income by Householder Age in Dakota Ridge
The median household income in Dakota Ridge is $116,683, with the highest median household income of $133,750 found in the 45 to 64 years age bracket for the primary householder. A total of 5,591 households (43.1%) fall into this category. Meanwhile, the 15 to 24 years age bracket for the primary householder has the lowest median household income of $53,393, with 125 households (1.0%) in this group.
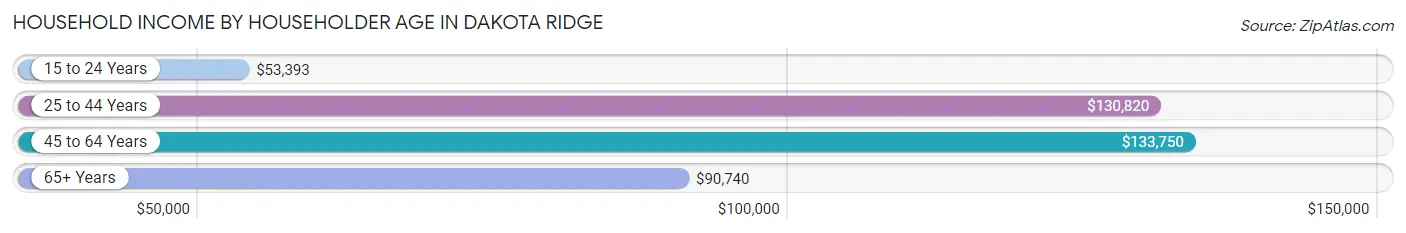
| Income Bracket | # Households | Median Income |
| 15 to 24 Years | 125 (1.0%) | $53,393 |
| 25 to 44 Years | 4,189 (32.3%) | $130,820 |
| 45 to 64 Years | 5,591 (43.1%) | $133,750 |
| 65+ Years | 3,058 (23.6%) | $90,740 |
| Total | 12,963 (100.0%) | $116,683 |
Poverty in Dakota Ridge
Income Below Poverty by Sex and Age in Dakota Ridge
With 3.3% poverty level for males and 4.5% for females among the residents of Dakota Ridge, 18 to 24 year old males and 15 year old females are the most vulnerable to poverty, with 103 males (7.1%) and 38 females (16.4%) in their respective age groups living below the poverty level.
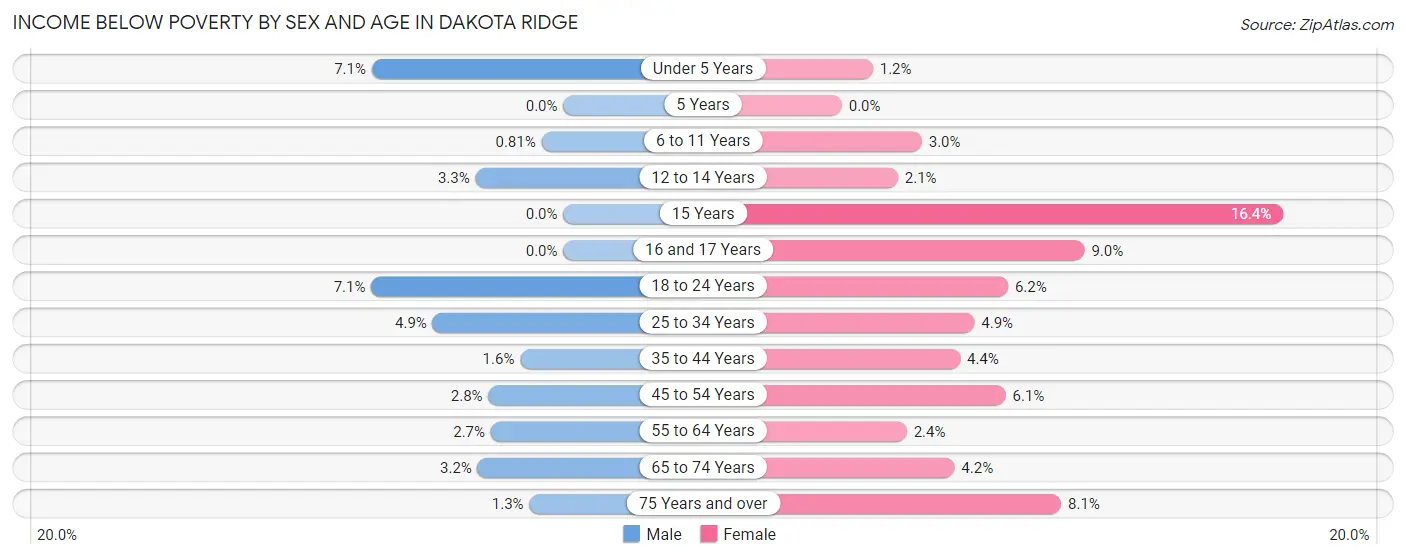
| Age Bracket | Male | Female |
| Under 5 Years | 73 (7.1%) | 8 (1.1%) |
| 5 Years | 0 (0.0%) | 0 (0.0%) |
| 6 to 11 Years | 8 (0.8%) | 36 (3.0%) |
| 12 to 14 Years | 17 (3.3%) | 17 (2.1%) |
| 15 Years | 0 (0.0%) | 38 (16.4%) |
| 16 and 17 Years | 0 (0.0%) | 32 (9.0%) |
| 18 to 24 Years | 103 (7.1%) | 63 (6.2%) |
| 25 to 34 Years | 120 (4.9%) | 118 (4.9%) |
| 35 to 44 Years | 38 (1.6%) | 109 (4.4%) |
| 45 to 54 Years | 67 (2.8%) | 128 (6.1%) |
| 55 to 64 Years | 68 (2.7%) | 73 (2.4%) |
| 65 to 74 Years | 58 (3.2%) | 66 (4.2%) |
| 75 Years and over | 8 (1.3%) | 72 (8.1%) |
| Total | 560 (3.3%) | 760 (4.5%) |
Income Above Poverty by Sex and Age in Dakota Ridge
According to the poverty statistics in Dakota Ridge, males aged 5 years and females aged 5 years are the age groups that are most secure financially, with 100.0% of males and 100.0% of females in these age groups living above the poverty line.
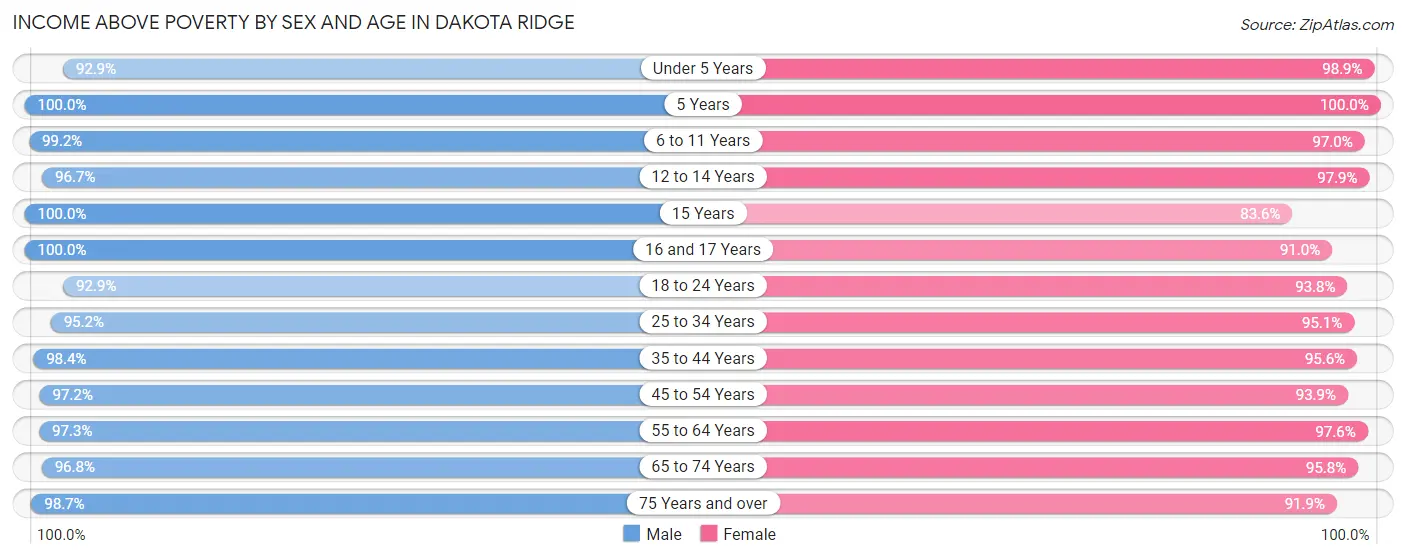
| Age Bracket | Male | Female |
| Under 5 Years | 954 (92.9%) | 690 (98.9%) |
| 5 Years | 234 (100.0%) | 198 (100.0%) |
| 6 to 11 Years | 985 (99.2%) | 1,178 (97.0%) |
| 12 to 14 Years | 505 (96.7%) | 802 (97.9%) |
| 15 Years | 143 (100.0%) | 194 (83.6%) |
| 16 and 17 Years | 527 (100.0%) | 323 (91.0%) |
| 18 to 24 Years | 1,341 (92.9%) | 958 (93.8%) |
| 25 to 34 Years | 2,353 (95.2%) | 2,281 (95.1%) |
| 35 to 44 Years | 2,335 (98.4%) | 2,374 (95.6%) |
| 45 to 54 Years | 2,340 (97.2%) | 1,977 (93.9%) |
| 55 to 64 Years | 2,460 (97.3%) | 2,960 (97.6%) |
| 65 to 74 Years | 1,767 (96.8%) | 1,513 (95.8%) |
| 75 Years and over | 629 (98.7%) | 813 (91.9%) |
| Total | 16,573 (96.7%) | 16,261 (95.5%) |
Income Below Poverty Among Married-Couple Families in Dakota Ridge
The poverty statistics for married-couple families in Dakota Ridge show that 0.8% or 62 of the total 7,795 families live below the poverty line. Families with no children have the highest poverty rate of 1.3%, comprising of 62 families. On the other hand, families with 1 or 2 children have the lowest poverty rate of 0.0%, which includes 0 families.
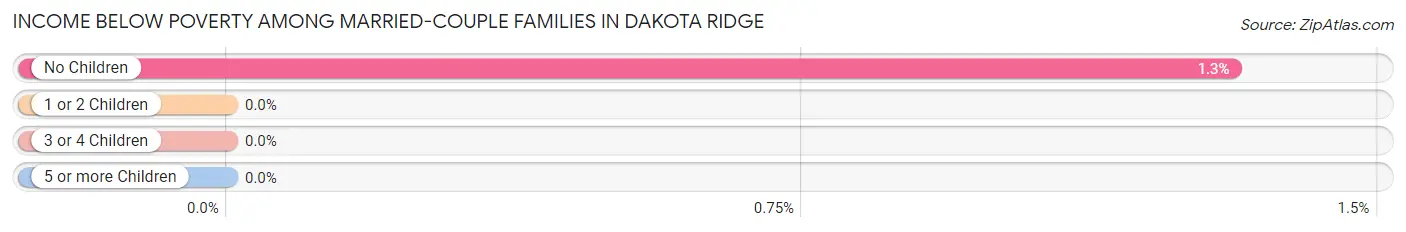
| Children | Above Poverty | Below Poverty |
| No Children | 4,683 (98.7%) | 62 (1.3%) |
| 1 or 2 Children | 2,549 (100.0%) | 0 (0.0%) |
| 3 or 4 Children | 487 (100.0%) | 0 (0.0%) |
| 5 or more Children | 14 (100.0%) | 0 (0.0%) |
| Total | 7,733 (99.2%) | 62 (0.8%) |
Income Below Poverty Among Single-Parent Households in Dakota Ridge
According to the poverty data in Dakota Ridge, 1.3% or 8 single-father households and 9.7% or 100 single-mother households are living below the poverty line. Among single-father households, those with 1 or 2 children have the highest poverty rate, with 8 households (2.5%) experiencing poverty. Likewise, among single-mother households, those with 1 or 2 children have the highest poverty rate, with 88 households (21.3%) falling below the poverty line.
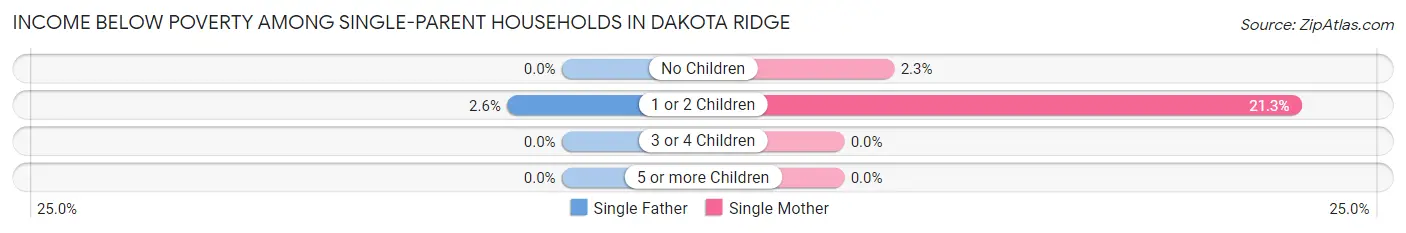
| Children | Single Father | Single Mother |
| No Children | 0 (0.0%) | 12 (2.3%) |
| 1 or 2 Children | 8 (2.5%) | 88 (21.3%) |
| 3 or 4 Children | 0 (0.0%) | 0 (0.0%) |
| 5 or more Children | 0 (0.0%) | 0 (0.0%) |
| Total | 8 (1.3%) | 100 (9.7%) |
Income Below Poverty Among Married-Couple vs Single-Parent Households in Dakota Ridge
The poverty data for Dakota Ridge shows that 62 of the married-couple family households (0.8%) and 108 of the single-parent households (6.6%) are living below the poverty level. Within the married-couple family households, those with no children have the highest poverty rate, with 62 households (1.3%) falling below the poverty line. Among the single-parent households, those with 1 or 2 children have the highest poverty rate, with 96 household (13.2%) living below poverty.
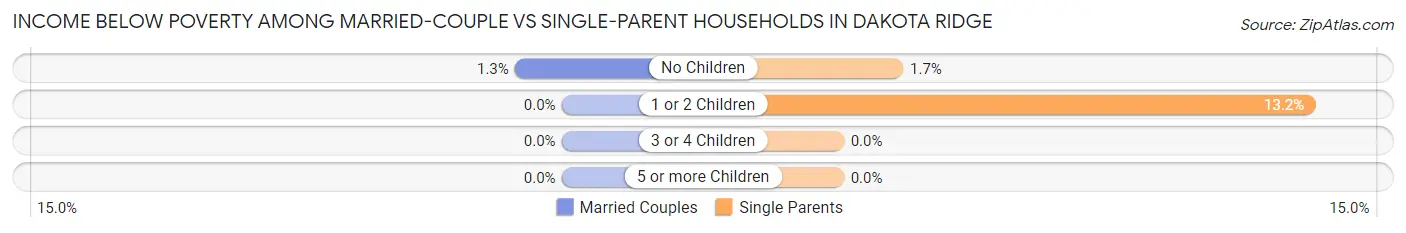
| Children | Married-Couple Families | Single-Parent Households |
| No Children | 62 (1.3%) | 12 (1.7%) |
| 1 or 2 Children | 0 (0.0%) | 96 (13.2%) |
| 3 or 4 Children | 0 (0.0%) | 0 (0.0%) |
| 5 or more Children | 0 (0.0%) | 0 (0.0%) |
| Total | 62 (0.8%) | 108 (6.6%) |
Race in Dakota Ridge
The most populous races in Dakota Ridge are White / Caucasian (27,642 | 80.7%), Hispanic or Latino (5,550 | 16.2%), and Two or more Races (4,026 | 11.8%).
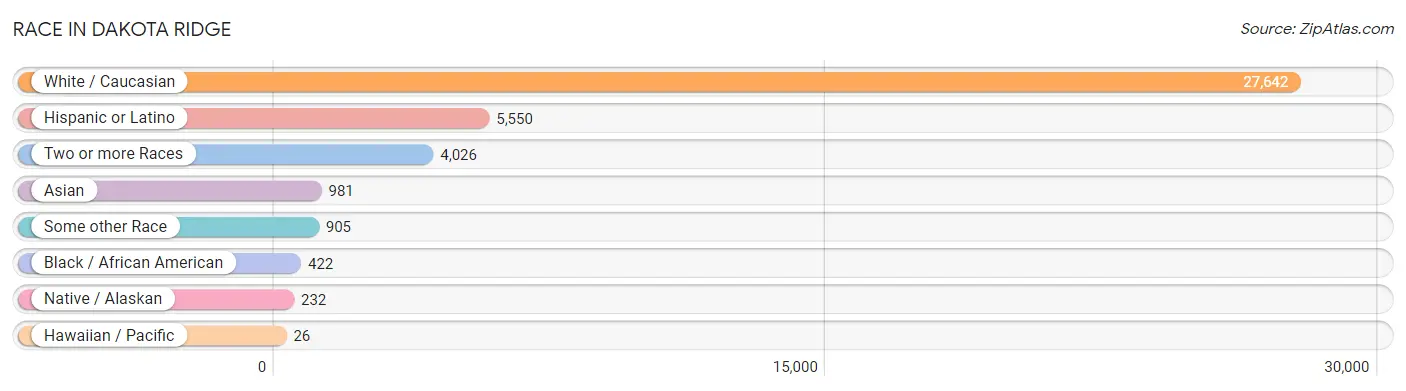
| Race | # Population | % Population |
| Asian | 981 | 2.9% |
| Black / African American | 422 | 1.2% |
| Hawaiian / Pacific | 26 | 0.1% |
| Hispanic or Latino | 5,550 | 16.2% |
| Native / Alaskan | 232 | 0.7% |
| White / Caucasian | 27,642 | 80.7% |
| Two or more Races | 4,026 | 11.8% |
| Some other Race | 905 | 2.6% |
| Total | 34,234 | 100.0% |
Ancestry in Dakota Ridge
The most populous ancestries reported in Dakota Ridge are German (7,999 | 23.4%), English (5,092 | 14.9%), Irish (4,492 | 13.1%), Mexican (3,372 | 9.9%), and Italian (2,019 | 5.9%), together accounting for 67.1% of all Dakota Ridge residents.
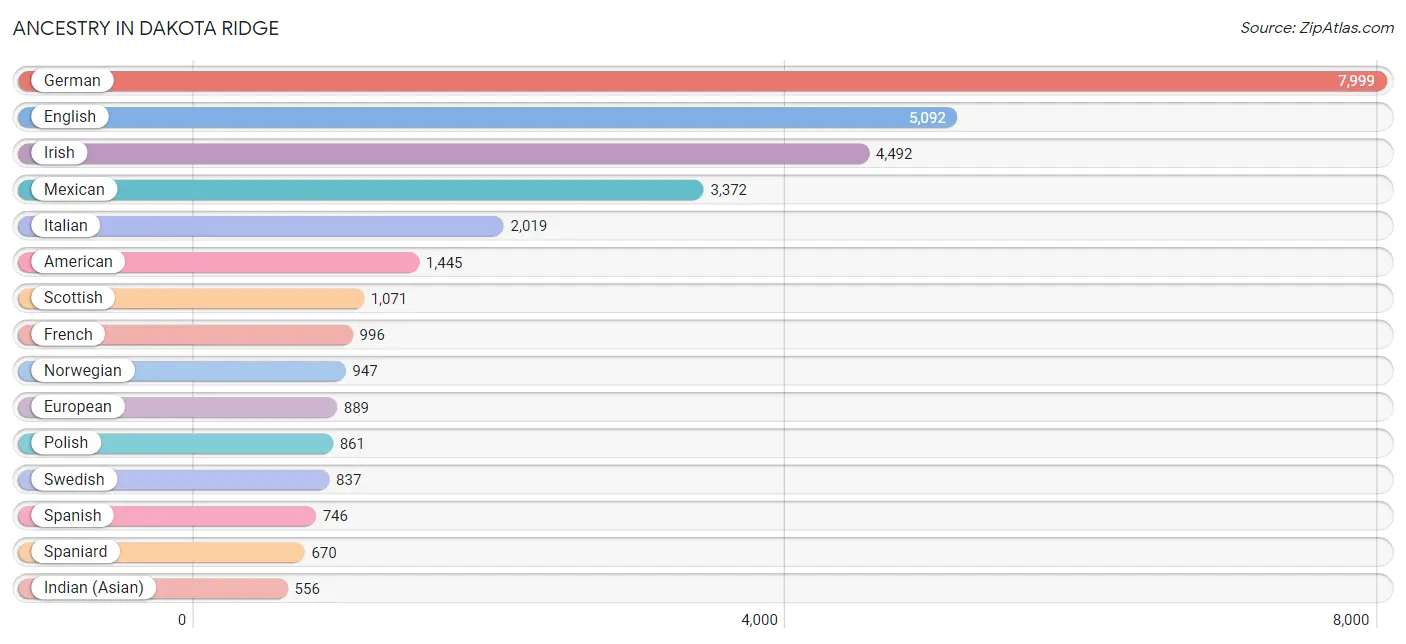
| Ancestry | # Population | % Population |
| African | 83 | 0.2% |
| American | 1,445 | 4.2% |
| Apache | 113 | 0.3% |
| Arab | 265 | 0.8% |
| Argentinean | 6 | 0.0% |
| Armenian | 12 | 0.0% |
| Assyrian / Chaldean / Syriac | 13 | 0.0% |
| Australian | 65 | 0.2% |
| Austrian | 103 | 0.3% |
| Basque | 28 | 0.1% |
| Belgian | 17 | 0.1% |
| Bhutanese | 128 | 0.4% |
| Brazilian | 35 | 0.1% |
| British | 234 | 0.7% |
| Burmese | 67 | 0.2% |
| Cajun | 56 | 0.2% |
| Canadian | 101 | 0.3% |
| Central American | 260 | 0.8% |
| Cherokee | 107 | 0.3% |
| Chippewa | 17 | 0.1% |
| Colombian | 44 | 0.1% |
| Cree | 8 | 0.0% |
| Croatian | 39 | 0.1% |
| Crow | 21 | 0.1% |
| Cuban | 70 | 0.2% |
| Czech | 259 | 0.8% |
| Czechoslovakian | 8 | 0.0% |
| Danish | 295 | 0.9% |
| Dominican | 29 | 0.1% |
| Dutch | 549 | 1.6% |
| Eastern European | 186 | 0.5% |
| Ecuadorian | 28 | 0.1% |
| English | 5,092 | 14.9% |
| European | 889 | 2.6% |
| Filipino | 79 | 0.2% |
| Finnish | 42 | 0.1% |
| French | 996 | 2.9% |
| French Canadian | 192 | 0.6% |
| German | 7,999 | 23.4% |
| Greek | 31 | 0.1% |
| Guatemalan | 39 | 0.1% |
| Hungarian | 115 | 0.3% |
| Icelander | 29 | 0.1% |
| Indian (Asian) | 556 | 1.6% |
| Irish | 4,492 | 13.1% |
| Iroquois | 6 | 0.0% |
| Italian | 2,019 | 5.9% |
| Jordanian | 37 | 0.1% |
| Korean | 373 | 1.1% |
| Lebanese | 24 | 0.1% |
| Lithuanian | 19 | 0.1% |
| Mexican | 3,372 | 9.9% |
| Mexican American Indian | 19 | 0.1% |
| Native Hawaiian | 102 | 0.3% |
| Navajo | 84 | 0.3% |
| Nicaraguan | 207 | 0.6% |
| Northern European | 154 | 0.4% |
| Norwegian | 947 | 2.8% |
| Osage | 29 | 0.1% |
| Pakistani | 160 | 0.5% |
| Palestinian | 204 | 0.6% |
| Polish | 861 | 2.5% |
| Portuguese | 29 | 0.1% |
| Pueblo | 197 | 0.6% |
| Puerto Rican | 128 | 0.4% |
| Romanian | 26 | 0.1% |
| Russian | 279 | 0.8% |
| Salvadoran | 14 | 0.0% |
| Scandinavian | 79 | 0.2% |
| Scotch-Irish | 395 | 1.1% |
| Scottish | 1,071 | 3.1% |
| Serbian | 27 | 0.1% |
| Shoshone | 22 | 0.1% |
| Slavic | 22 | 0.1% |
| Slovene | 37 | 0.1% |
| South American | 101 | 0.3% |
| Spaniard | 670 | 2.0% |
| Spanish | 746 | 2.2% |
| Sri Lankan | 135 | 0.4% |
| Subsaharan African | 83 | 0.2% |
| Swedish | 837 | 2.4% |
| Swiss | 79 | 0.2% |
| Thai | 114 | 0.3% |
| Turkish | 26 | 0.1% |
| Ukrainian | 40 | 0.1% |
| Venezuelan | 23 | 0.1% |
| Welsh | 382 | 1.1% |
| West Indian | 13 | 0.0% |
| Yugoslavian | 22 | 0.1% |
| Yup'ik | 7 | 0.0% | View All 90 Rows |
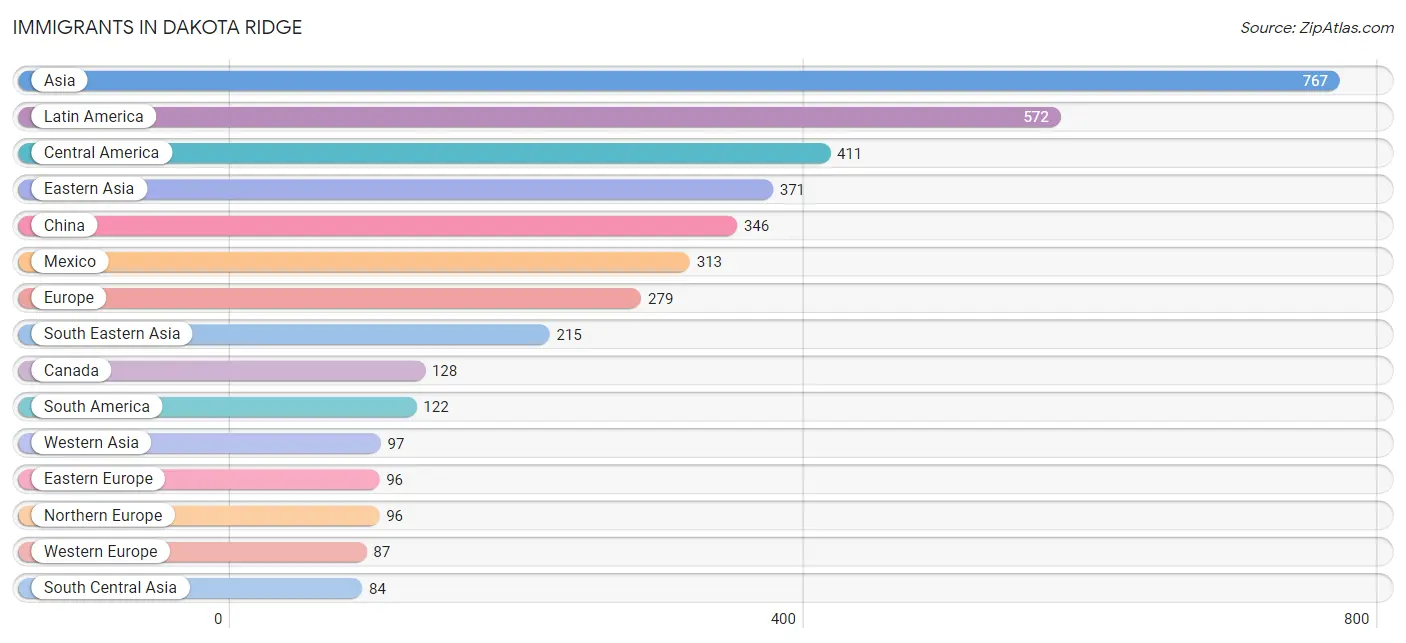
Immigrants in Dakota Ridge
The most numerous immigrant groups reported in Dakota Ridge came from Asia (767 | 2.2%), Latin America (572 | 1.7%), Central America (411 | 1.2%), Eastern Asia (371 | 1.1%), and China (346 | 1.0%), together accounting for 7.2% of all Dakota Ridge residents.
| Immigration Origin | # Population | % Population |
| Africa | 36 | 0.1% |
| Argentina | 6 | 0.0% |
| Asia | 767 | 2.2% |
| Australia | 49 | 0.1% |
| Austria | 9 | 0.0% |
| Bosnia and Herzegovina | 19 | 0.1% |
| Brazil | 31 | 0.1% |
| Bulgaria | 16 | 0.1% |
| Canada | 128 | 0.4% |
| Caribbean | 39 | 0.1% |
| Central America | 411 | 1.2% |
| China | 346 | 1.0% |
| Colombia | 44 | 0.1% |
| Cuba | 10 | 0.0% |
| Czechoslovakia | 26 | 0.1% |
| Dominican Republic | 29 | 0.1% |
| Eastern Africa | 19 | 0.1% |
| Eastern Asia | 371 | 1.1% |
| Eastern Europe | 96 | 0.3% |
| Ecuador | 28 | 0.1% |
| England | 9 | 0.0% |
| Europe | 279 | 0.8% |
| France | 18 | 0.1% |
| Germany | 60 | 0.2% |
| Guatemala | 26 | 0.1% |
| Hong Kong | 7 | 0.0% |
| India | 78 | 0.2% |
| Indonesia | 26 | 0.1% |
| Ireland | 30 | 0.1% |
| Israel | 50 | 0.2% |
| Japan | 16 | 0.1% |
| Jordan | 22 | 0.1% |
| Korea | 9 | 0.0% |
| Latin America | 572 | 1.7% |
| Latvia | 3 | 0.0% |
| Mexico | 313 | 0.9% |
| Nicaragua | 72 | 0.2% |
| Northern Europe | 96 | 0.3% |
| Oceania | 49 | 0.1% |
| Peru | 13 | 0.0% |
| Philippines | 32 | 0.1% |
| Poland | 19 | 0.1% |
| South Africa | 17 | 0.1% |
| South America | 122 | 0.4% |
| South Central Asia | 84 | 0.3% |
| South Eastern Asia | 215 | 0.6% |
| Sri Lanka | 6 | 0.0% |
| Sweden | 6 | 0.0% |
| Syria | 25 | 0.1% |
| Taiwan | 74 | 0.2% |
| Thailand | 84 | 0.3% |
| Vietnam | 73 | 0.2% |
| Western Asia | 97 | 0.3% |
| Western Europe | 87 | 0.3% | View All 54 Rows |
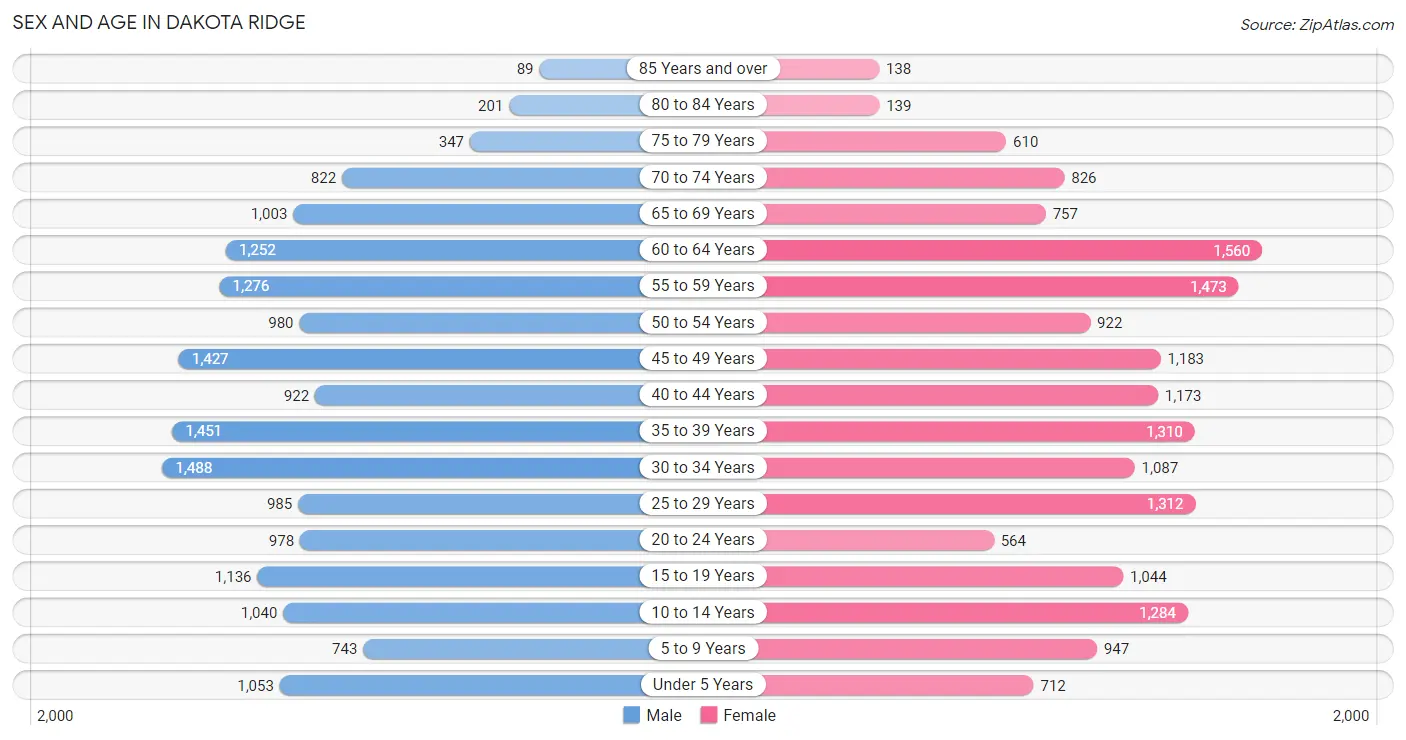
Sex and Age in Dakota Ridge
Sex and Age in Dakota Ridge
The most populous age groups in Dakota Ridge are 30 to 34 Years (1,488 | 8.6%) for men and 60 to 64 Years (1,560 | 9.1%) for women.
| Age Bracket | Male | Female |
| Under 5 Years | 1,053 (6.1%) | 712 (4.2%) |
| 5 to 9 Years | 743 (4.3%) | 947 (5.6%) |
| 10 to 14 Years | 1,040 (6.0%) | 1,284 (7.5%) |
| 15 to 19 Years | 1,136 (6.6%) | 1,044 (6.1%) |
| 20 to 24 Years | 978 (5.7%) | 564 (3.3%) |
| 25 to 29 Years | 985 (5.7%) | 1,312 (7.7%) |
| 30 to 34 Years | 1,488 (8.6%) | 1,087 (6.4%) |
| 35 to 39 Years | 1,451 (8.4%) | 1,310 (7.7%) |
| 40 to 44 Years | 922 (5.4%) | 1,173 (6.9%) |
| 45 to 49 Years | 1,427 (8.3%) | 1,183 (6.9%) |
| 50 to 54 Years | 980 (5.7%) | 922 (5.4%) |
| 55 to 59 Years | 1,276 (7.4%) | 1,473 (8.6%) |
| 60 to 64 Years | 1,252 (7.3%) | 1,560 (9.1%) |
| 65 to 69 Years | 1,003 (5.8%) | 757 (4.4%) |
| 70 to 74 Years | 822 (4.8%) | 826 (4.9%) |
| 75 to 79 Years | 347 (2.0%) | 610 (3.6%) |
| 80 to 84 Years | 201 (1.2%) | 139 (0.8%) |
| 85 Years and over | 89 (0.5%) | 138 (0.8%) |
| Total | 17,193 (100.0%) | 17,041 (100.0%) |
Families and Households in Dakota Ridge
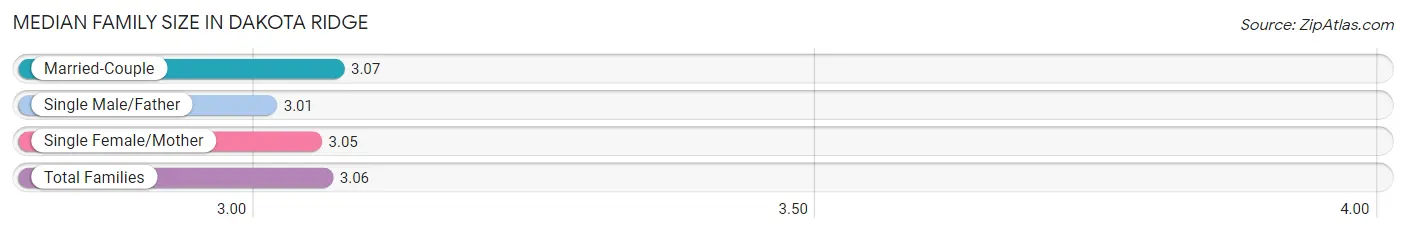
Median Family Size in Dakota Ridge
The median family size in Dakota Ridge is 3.06 persons per family, with married-couple families (7,795 | 82.6%) accounting for the largest median family size of 3.07 persons per family. On the other hand, single male/father families (610 | 6.5%) represent the smallest median family size with 3.01 persons per family.
| Family Type | # Families | Family Size |
| Married-Couple | 7,795 (82.6%) | 3.07 |
| Single Male/Father | 610 (6.5%) | 3.01 |
| Single Female/Mother | 1,032 (10.9%) | 3.05 |
| Total Families | 9,437 (100.0%) | 3.06 |
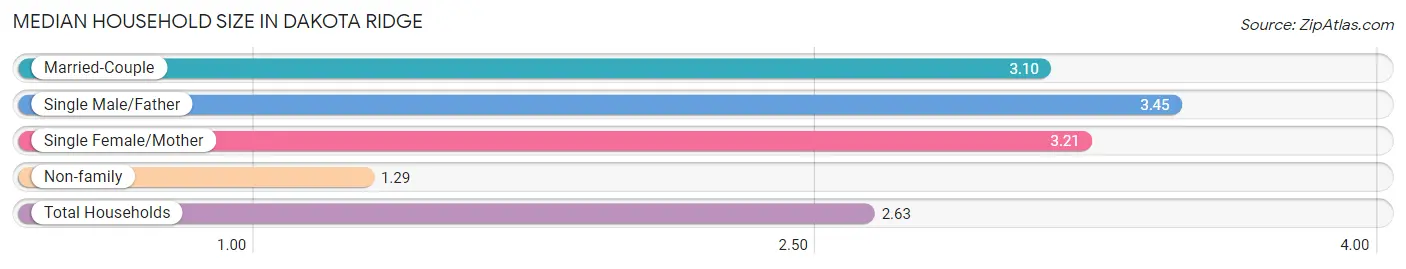
Median Household Size in Dakota Ridge
The median household size in Dakota Ridge is 2.63 persons per household, with single male/father households (610 | 4.7%) accounting for the largest median household size of 3.45 persons per household. non-family households (3,526 | 27.2%) represent the smallest median household size with 1.29 persons per household.
| Household Type | # Households | Household Size |
| Married-Couple | 7,795 (60.1%) | 3.10 |
| Single Male/Father | 610 (4.7%) | 3.45 |
| Single Female/Mother | 1,032 (8.0%) | 3.21 |
| Non-family | 3,526 (27.2%) | 1.29 |
| Total Households | 12,963 (100.0%) | 2.63 |
Household Size by Marriage Status in Dakota Ridge
Out of a total of 12,963 households in Dakota Ridge, 9,437 (72.8%) are family households, while 3,526 (27.2%) are nonfamily households. The most numerous type of family households are 2-person households, comprising 4,154, and the most common type of nonfamily households are 1-person households, comprising 2,691.
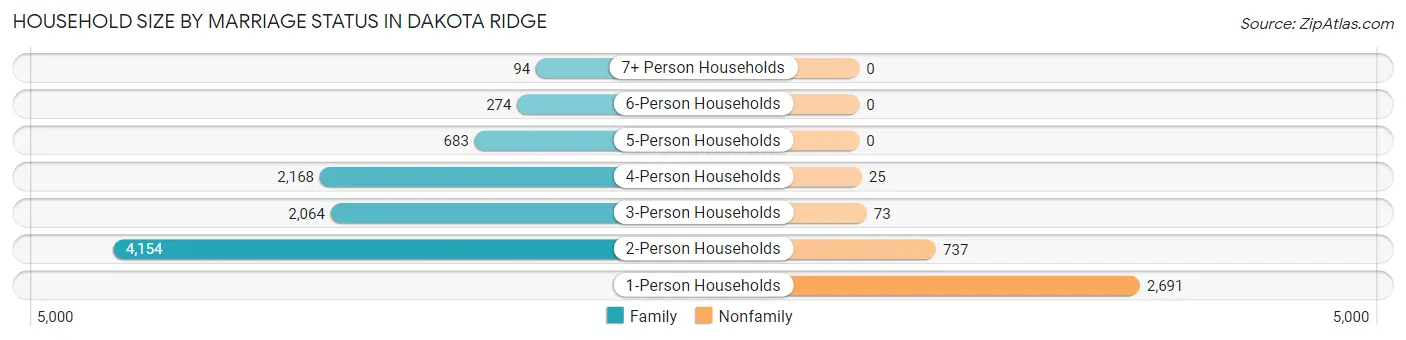
| Household Size | Family Households | Nonfamily Households |
| 1-Person Households | - | 2,691 (20.8%) |
| 2-Person Households | 4,154 (32.1%) | 737 (5.7%) |
| 3-Person Households | 2,064 (15.9%) | 73 (0.6%) |
| 4-Person Households | 2,168 (16.7%) | 25 (0.2%) |
| 5-Person Households | 683 (5.3%) | 0 (0.0%) |
| 6-Person Households | 274 (2.1%) | 0 (0.0%) |
| 7+ Person Households | 94 (0.7%) | 0 (0.0%) |
| Total | 9,437 (72.8%) | 3,526 (27.2%) |
Female Fertility in Dakota Ridge
Fertility by Age in Dakota Ridge
Average fertility rate in Dakota Ridge is 52.0 births per 1,000 women. Women in the age bracket of 20 to 34 years have the highest fertility rate with 76.0 births per 1,000 women. Women in the age bracket of 20 to 34 years acount for 55.6% of all women with births.
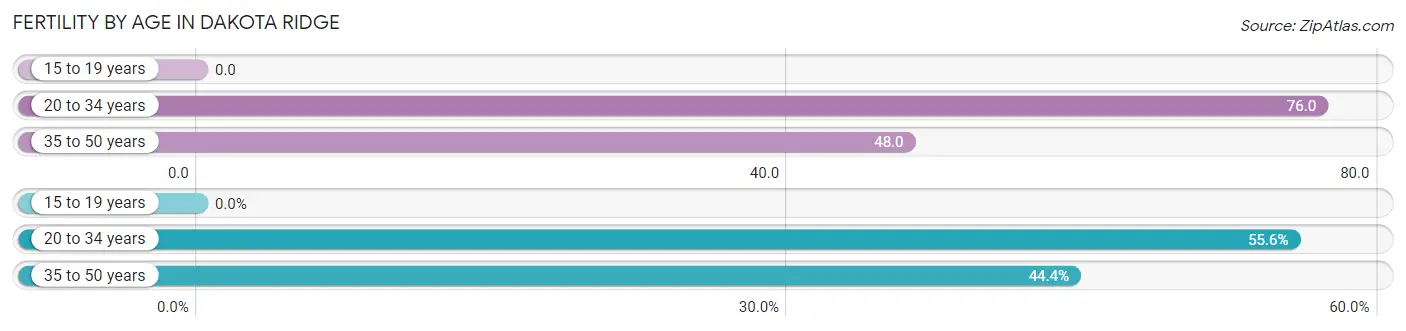
| Age Bracket | Women with Births | Births / 1,000 Women |
| 15 to 19 years | 0 (0.0%) | 0.0 |
| 20 to 34 years | 224 (55.6%) | 76.0 |
| 35 to 50 years | 179 (44.4%) | 48.0 |
| Total | 403 (100.0%) | 52.0 |
Fertility by Age by Marriage Status in Dakota Ridge
94.0% of women with births (403) in Dakota Ridge are married. The highest percentage of unmarried women with births falls into 35 to 50 years age bracket with 8.4% of them unmarried at the time of birth, while the lowest percentage of unmarried women with births belong to 20 to 34 years age bracket with 4.0% of them unmarried.
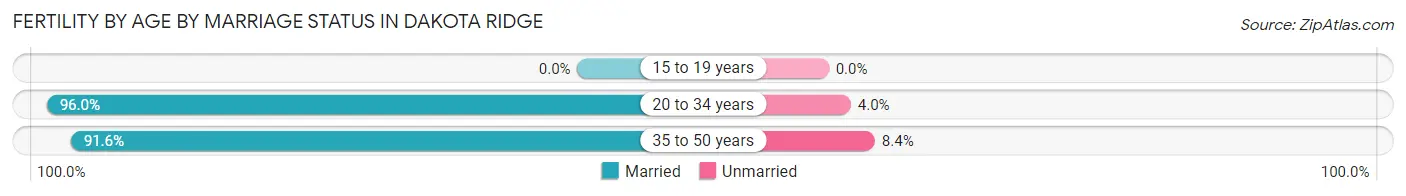
| Age Bracket | Married | Unmarried |
| 15 to 19 years | 0 (0.0%) | 0 (0.0%) |
| 20 to 34 years | 215 (96.0%) | 9 (4.0%) |
| 35 to 50 years | 164 (91.6%) | 15 (8.4%) |
| Total | 379 (94.0%) | 24 (6.0%) |
Fertility by Education in Dakota Ridge
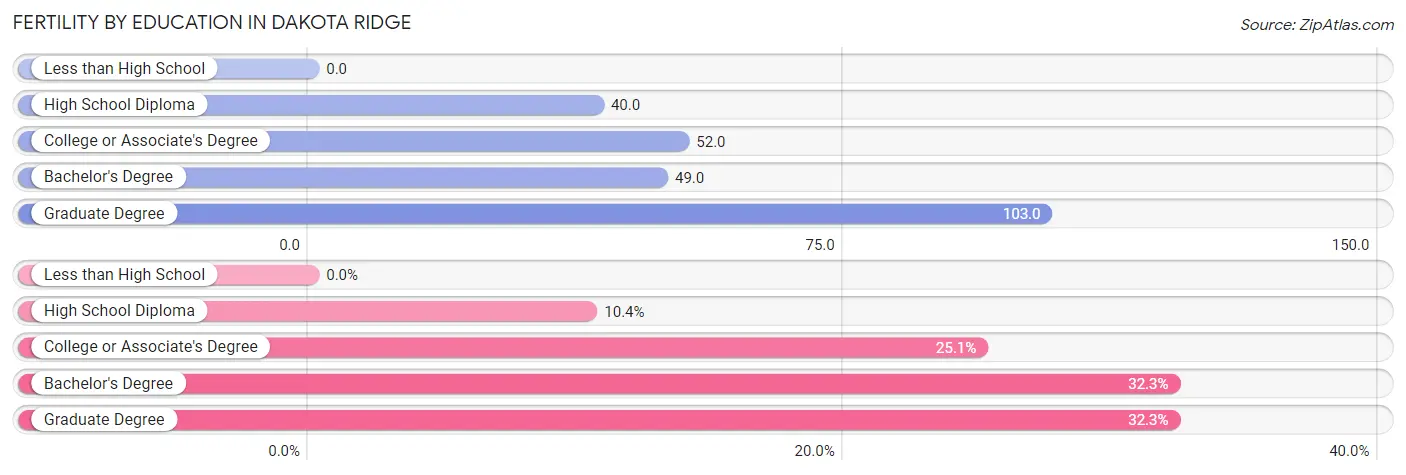
| Educational Attainment | Women with Births | Births / 1,000 Women |
| Less than High School | 0 (0.0%) | 0.0 |
| High School Diploma | 42 (10.4%) | 40.0 |
| College or Associate's Degree | 101 (25.1%) | 52.0 |
| Bachelor's Degree | 130 (32.3%) | 49.0 |
| Graduate Degree | 130 (32.3%) | 103.0 |
| Total | 403 (100.0%) | 52.0 |
Fertility by Education by Marriage Status in Dakota Ridge
6.0% of women with births in Dakota Ridge are unmarried. Women with the educational attainment of bachelor's degree are most likely to be married with 100.0% of them married at childbirth, while women with the educational attainment of high school diploma are least likely to be married with 21.4% of them unmarried at childbirth.
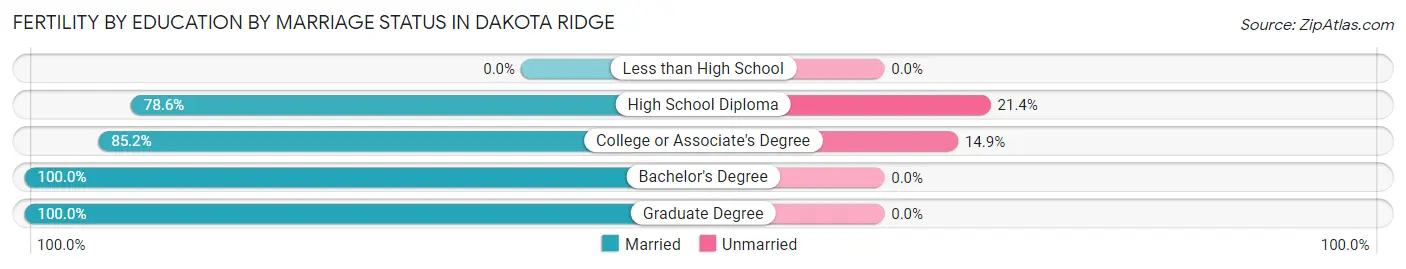
| Educational Attainment | Married | Unmarried |
| Less than High School | 0 (0.0%) | 0 (0.0%) |
| High School Diploma | 33 (78.6%) | 9 (21.4%) |
| College or Associate's Degree | 86 (85.2%) | 15 (14.8%) |
| Bachelor's Degree | 130 (100.0%) | 0 (0.0%) |
| Graduate Degree | 130 (100.0%) | 0 (0.0%) |
| Total | 379 (94.0%) | 24 (6.0%) |
Employment Characteristics in Dakota Ridge
Employment by Class of Employer in Dakota Ridge
Among the 19,145 employed individuals in Dakota Ridge, private company employees (12,354 | 64.5%), local government employees (1,996 | 10.4%), and not-for-profit organizations (1,501 | 7.8%) make up the most common classes of employment.
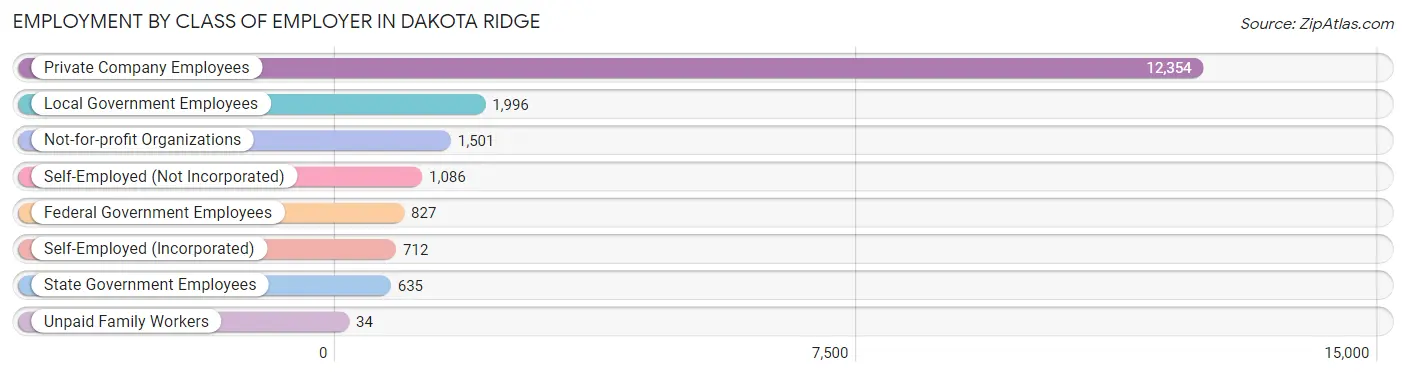
| Employer Class | # Employees | % Employees |
| Private Company Employees | 12,354 | 64.5% |
| Self-Employed (Incorporated) | 712 | 3.7% |
| Self-Employed (Not Incorporated) | 1,086 | 5.7% |
| Not-for-profit Organizations | 1,501 | 7.8% |
| Local Government Employees | 1,996 | 10.4% |
| State Government Employees | 635 | 3.3% |
| Federal Government Employees | 827 | 4.3% |
| Unpaid Family Workers | 34 | 0.2% |
| Total | 19,145 | 100.0% |
Employment Status by Age in Dakota Ridge
According to the labor force statistics for Dakota Ridge, out of the total population over 16 years of age (28,080), 71.6% or 20,105 individuals are in the labor force, with 3.4% or 684 of them unemployed. The age group with the highest labor force participation rate is 35 to 44 years, with 89.6% or 4,351 individuals in the labor force. Within the labor force, the 16 to 19 years age range has the highest percentage of unemployed individuals, with 15.9% or 140 of them being unemployed.
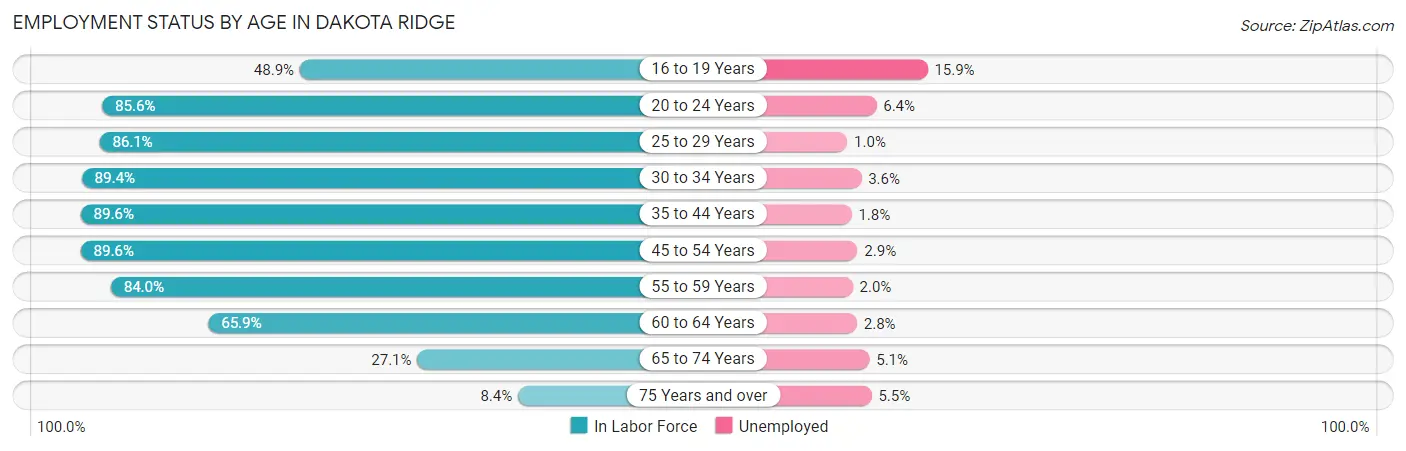
| Age Bracket | In Labor Force | Unemployed |
| 16 to 19 Years | 883 (48.9%) | 140 (15.9%) |
| 20 to 24 Years | 1,320 (85.6%) | 84 (6.4%) |
| 25 to 29 Years | 1,978 (86.1%) | 20 (1.0%) |
| 30 to 34 Years | 2,302 (89.4%) | 83 (3.6%) |
| 35 to 44 Years | 4,351 (89.6%) | 78 (1.8%) |
| 45 to 54 Years | 4,043 (89.6%) | 117 (2.9%) |
| 55 to 59 Years | 2,309 (84.0%) | 46 (2.0%) |
| 60 to 64 Years | 1,853 (65.9%) | 52 (2.8%) |
| 65 to 74 Years | 924 (27.1%) | 47 (5.1%) |
| 75 Years and over | 128 (8.4%) | 7 (5.5%) |
| Total | 20,105 (71.6%) | 684 (3.4%) |
Employment Status by Educational Attainment in Dakota Ridge
According to labor force statistics for Dakota Ridge, 85.0% of individuals (16,831) out of the total population between 25 and 64 years of age (19,801) are in the labor force, with 2.4% or 404 of them being unemployed. The group with the highest labor force participation rate are those with the educational attainment of bachelor's degree or higher, with 90.6% or 9,140 individuals in the labor force. Within the labor force, individuals with high school diploma education have the highest percentage of unemployment, with 3.9% or 119 of them being unemployed.
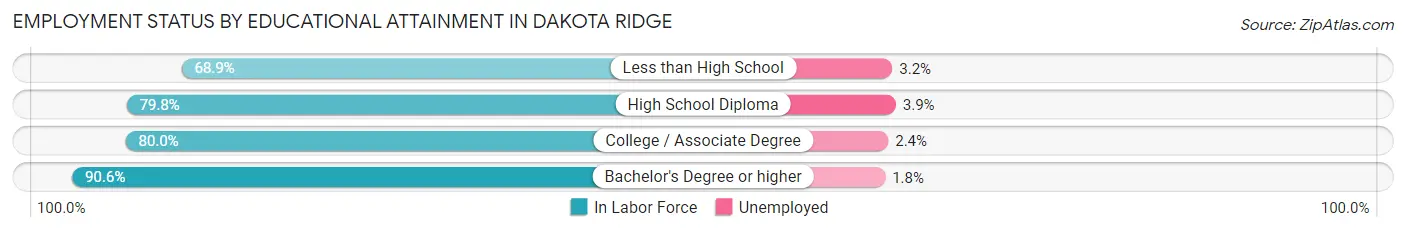
| Educational Attainment | In Labor Force | Unemployed |
| Less than High School | 376 (68.9%) | 17 (3.2%) |
| High School Diploma | 3,063 (79.8%) | 150 (3.9%) |
| College / Associate Degree | 4,263 (80.0%) | 128 (2.4%) |
| Bachelor's Degree or higher | 9,140 (90.6%) | 182 (1.8%) |
| Total | 16,831 (85.0%) | 475 (2.4%) |
Employment Occupations by Sex in Dakota Ridge
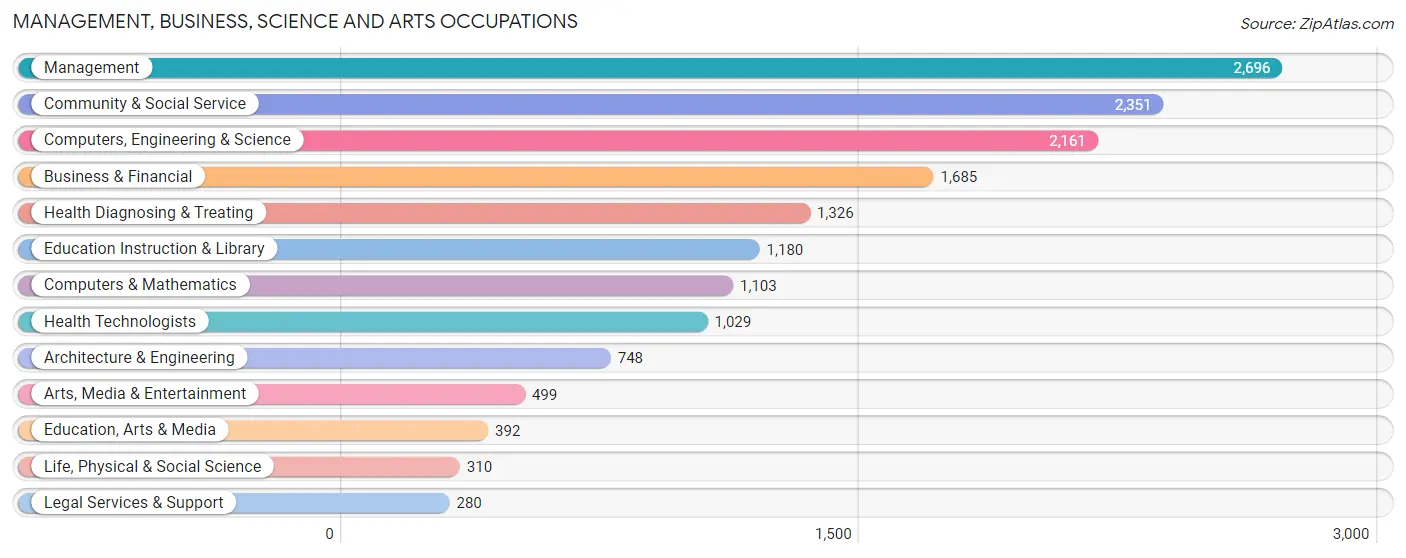
Management, Business, Science and Arts Occupations
The most common Management, Business, Science and Arts occupations in Dakota Ridge are Management (2,696 | 13.9%), Community & Social Service (2,351 | 12.1%), Computers, Engineering & Science (2,161 | 11.1%), Business & Financial (1,685 | 8.7%), and Health Diagnosing & Treating (1,326 | 6.8%).
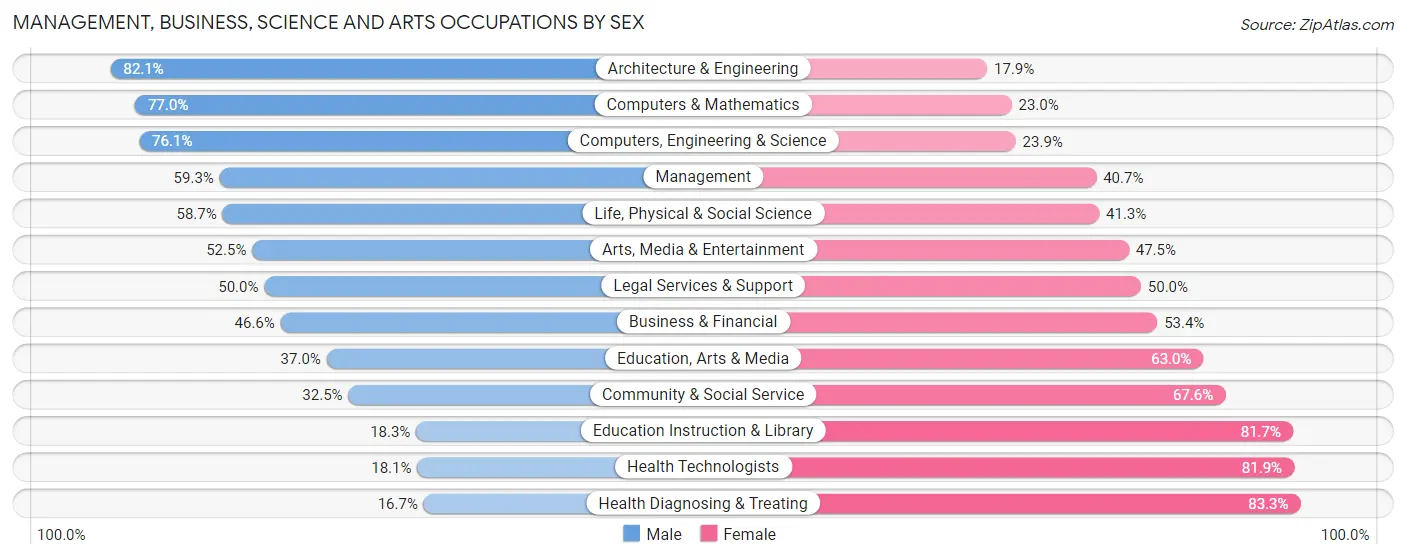
Management, Business, Science and Arts Occupations by Sex
Within the Management, Business, Science and Arts occupations in Dakota Ridge, the most male-oriented occupations are Architecture & Engineering (82.1%), Computers & Mathematics (77.0%), and Computers, Engineering & Science (76.1%), while the most female-oriented occupations are Health Diagnosing & Treating (83.3%), Health Technologists (81.9%), and Education Instruction & Library (81.7%).
| Occupation | Male | Female |
| Management | 1,599 (59.3%) | 1,097 (40.7%) |
| Business & Financial | 785 (46.6%) | 900 (53.4%) |
| Computers, Engineering & Science | 1,645 (76.1%) | 516 (23.9%) |
| Computers & Mathematics | 849 (77.0%) | 254 (23.0%) |
| Architecture & Engineering | 614 (82.1%) | 134 (17.9%) |
| Life, Physical & Social Science | 182 (58.7%) | 128 (41.3%) |
| Community & Social Service | 763 (32.5%) | 1,588 (67.5%) |
| Education, Arts & Media | 145 (37.0%) | 247 (63.0%) |
| Legal Services & Support | 140 (50.0%) | 140 (50.0%) |
| Education Instruction & Library | 216 (18.3%) | 964 (81.7%) |
| Arts, Media & Entertainment | 262 (52.5%) | 237 (47.5%) |
| Health Diagnosing & Treating | 222 (16.7%) | 1,104 (83.3%) |
| Health Technologists | 186 (18.1%) | 843 (81.9%) |
| Total (Category) | 5,014 (49.1%) | 5,205 (50.9%) |
| Total (Overall) | 10,223 (52.7%) | 9,177 (47.3%) |
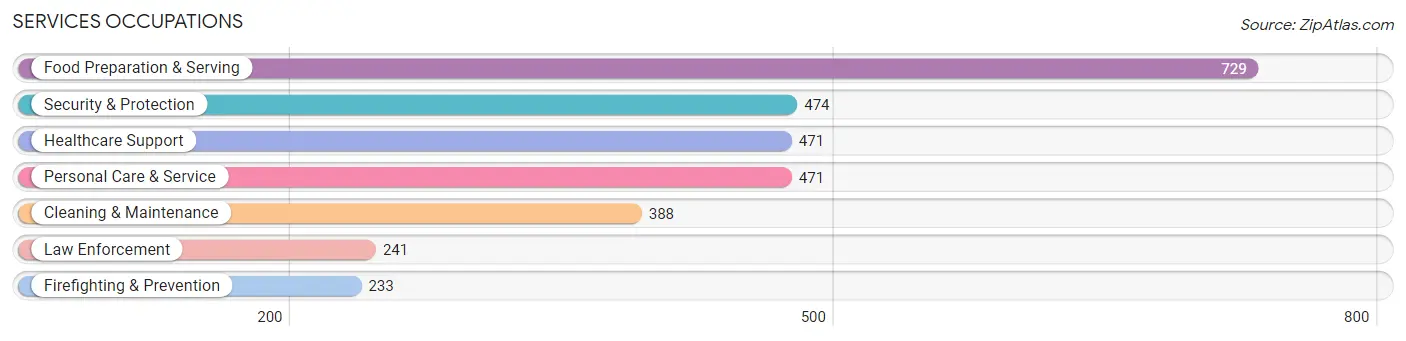
Services Occupations
The most common Services occupations in Dakota Ridge are Food Preparation & Serving (729 | 3.8%), Security & Protection (474 | 2.4%), Healthcare Support (471 | 2.4%), Personal Care & Service (471 | 2.4%), and Cleaning & Maintenance (388 | 2.0%).
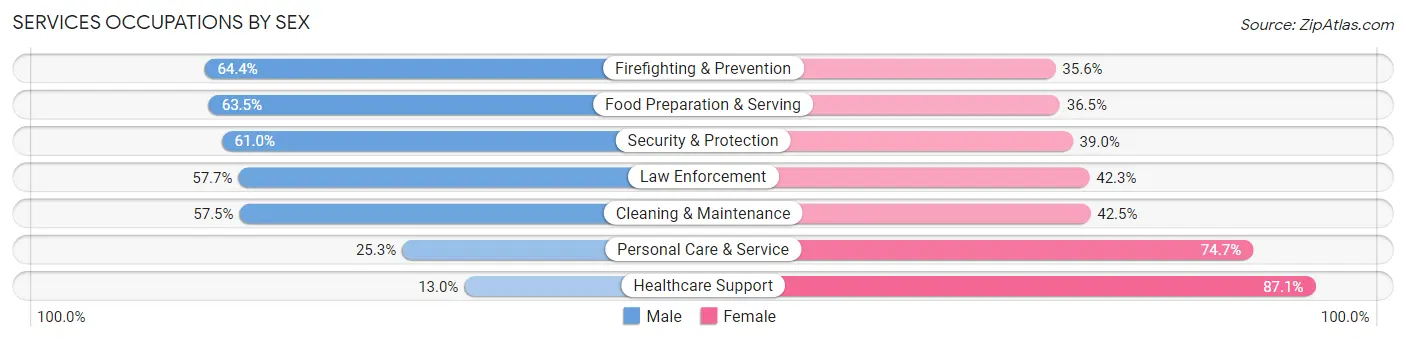
Services Occupations by Sex
Within the Services occupations in Dakota Ridge, the most male-oriented occupations are Firefighting & Prevention (64.4%), Food Preparation & Serving (63.5%), and Security & Protection (61.0%), while the most female-oriented occupations are Healthcare Support (87.1%), Personal Care & Service (74.7%), and Cleaning & Maintenance (42.5%).
| Occupation | Male | Female |
| Healthcare Support | 61 (13.0%) | 410 (87.1%) |
| Security & Protection | 289 (61.0%) | 185 (39.0%) |
| Firefighting & Prevention | 150 (64.4%) | 83 (35.6%) |
| Law Enforcement | 139 (57.7%) | 102 (42.3%) |
| Food Preparation & Serving | 463 (63.5%) | 266 (36.5%) |
| Cleaning & Maintenance | 223 (57.5%) | 165 (42.5%) |
| Personal Care & Service | 119 (25.3%) | 352 (74.7%) |
| Total (Category) | 1,155 (45.6%) | 1,378 (54.4%) |
| Total (Overall) | 10,223 (52.7%) | 9,177 (47.3%) |
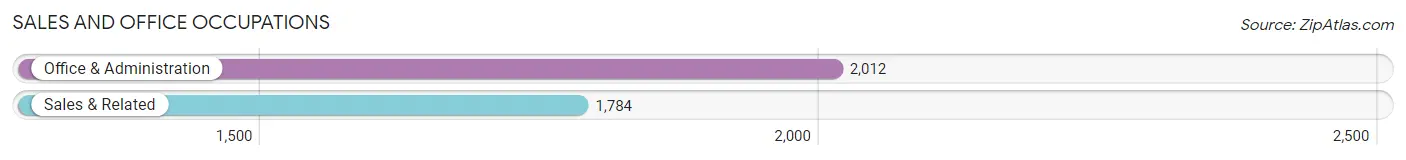
Sales and Office Occupations
The most common Sales and Office occupations in Dakota Ridge are Office & Administration (2,012 | 10.4%), and Sales & Related (1,784 | 9.2%).
Sales and Office Occupations by Sex
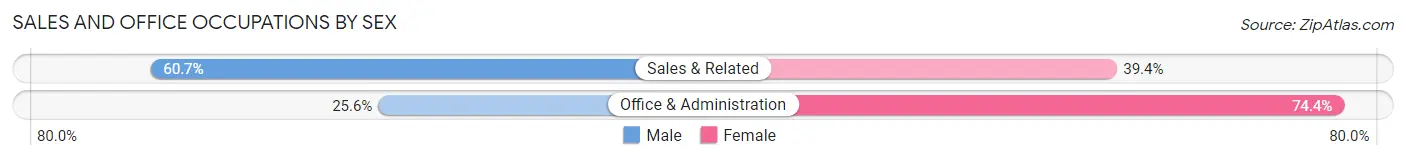
| Occupation | Male | Female |
| Sales & Related | 1,082 (60.7%) | 702 (39.4%) |
| Office & Administration | 515 (25.6%) | 1,497 (74.4%) |
| Total (Category) | 1,597 (42.1%) | 2,199 (57.9%) |
| Total (Overall) | 10,223 (52.7%) | 9,177 (47.3%) |
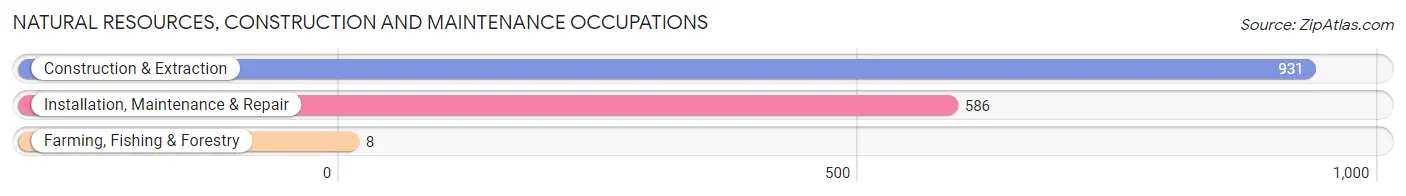
Natural Resources, Construction and Maintenance Occupations
The most common Natural Resources, Construction and Maintenance occupations in Dakota Ridge are Construction & Extraction (931 | 4.8%), Installation, Maintenance & Repair (586 | 3.0%), and Farming, Fishing & Forestry (8 | 0.0%).
Natural Resources, Construction and Maintenance Occupations by Sex
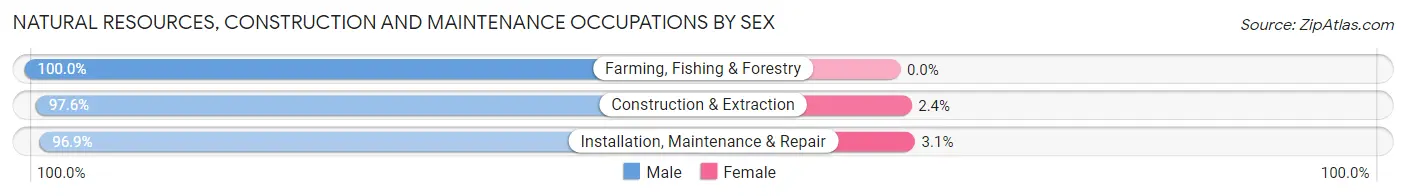
| Occupation | Male | Female |
| Farming, Fishing & Forestry | 8 (100.0%) | 0 (0.0%) |
| Construction & Extraction | 909 (97.6%) | 22 (2.4%) |
| Installation, Maintenance & Repair | 568 (96.9%) | 18 (3.1%) |
| Total (Category) | 1,485 (97.4%) | 40 (2.6%) |
| Total (Overall) | 10,223 (52.7%) | 9,177 (47.3%) |
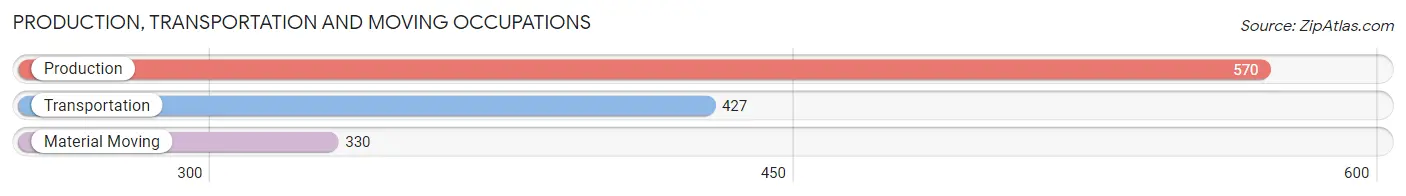
Production, Transportation and Moving Occupations
The most common Production, Transportation and Moving occupations in Dakota Ridge are Production (570 | 2.9%), Transportation (427 | 2.2%), and Material Moving (330 | 1.7%).
Production, Transportation and Moving Occupations by Sex
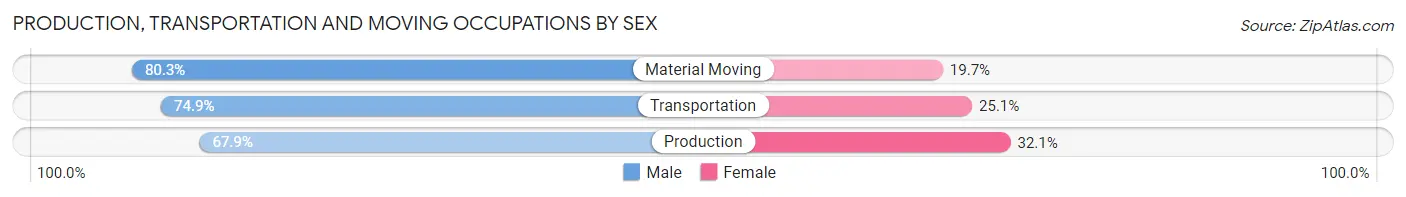
| Occupation | Male | Female |
| Production | 387 (67.9%) | 183 (32.1%) |
| Transportation | 320 (74.9%) | 107 (25.1%) |
| Material Moving | 265 (80.3%) | 65 (19.7%) |
| Total (Category) | 972 (73.3%) | 355 (26.8%) |
| Total (Overall) | 10,223 (52.7%) | 9,177 (47.3%) |
Employment Industries by Sex in Dakota Ridge
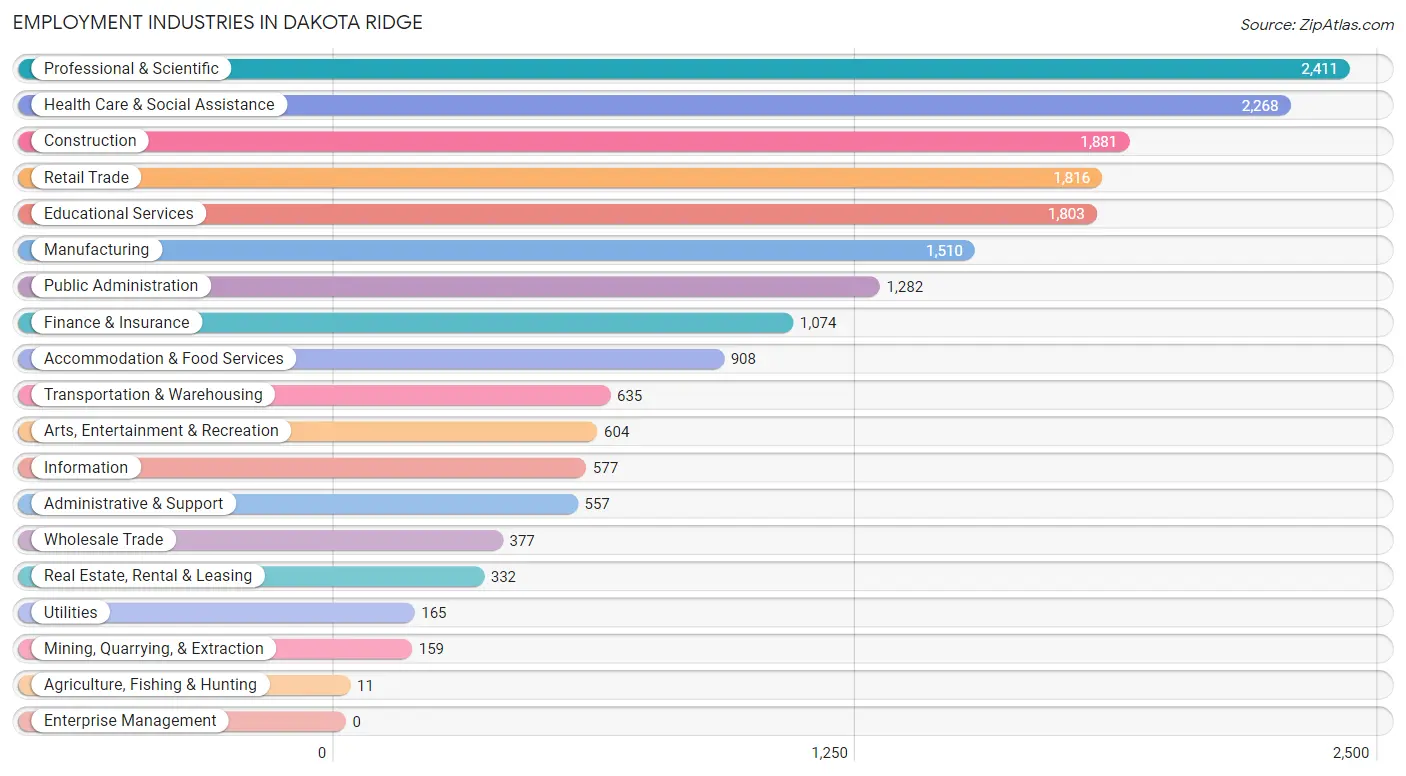
Employment Industries in Dakota Ridge
The major employment industries in Dakota Ridge include Professional & Scientific (2,411 | 12.4%), Health Care & Social Assistance (2,268 | 11.7%), Construction (1,881 | 9.7%), Retail Trade (1,816 | 9.4%), and Educational Services (1,803 | 9.3%).
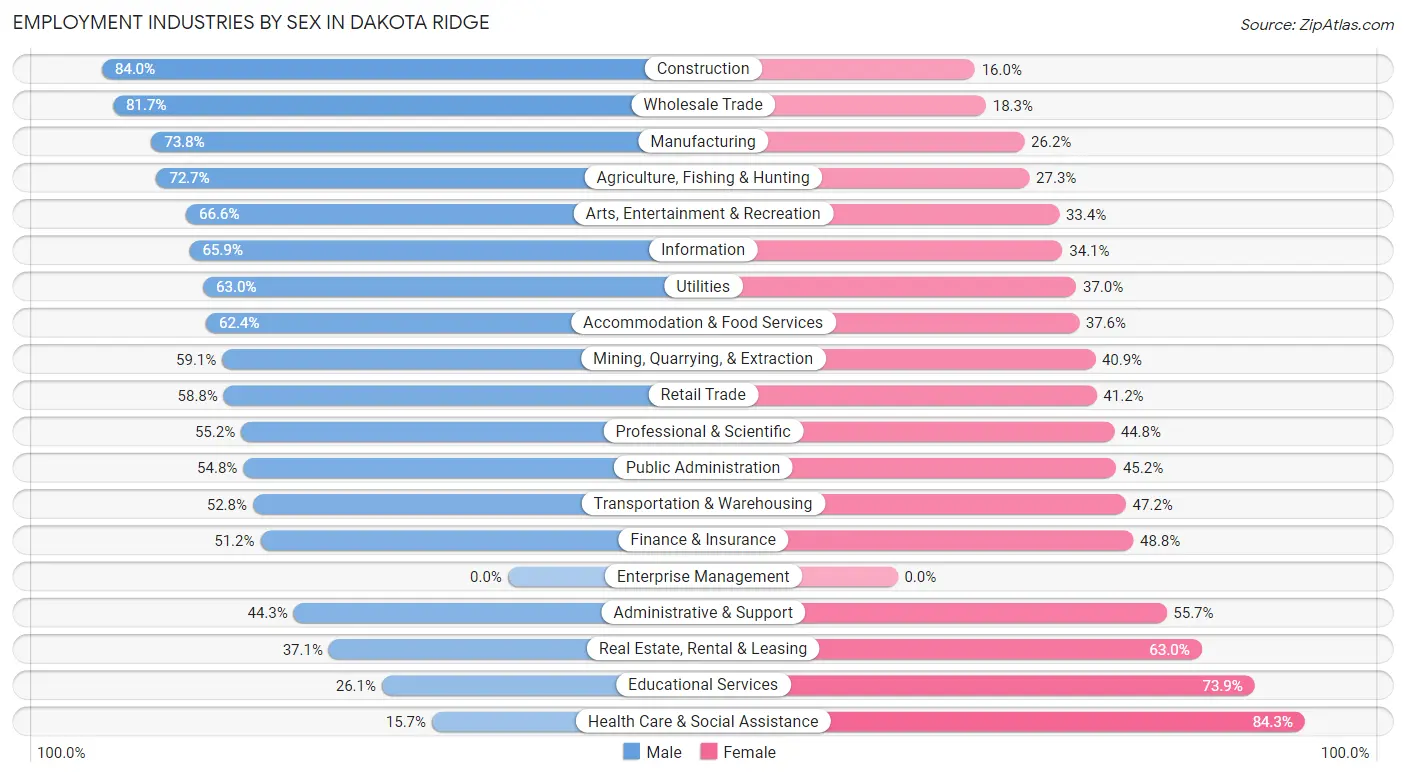
Employment Industries by Sex in Dakota Ridge
The Dakota Ridge industries that see more men than women are Construction (84.0%), Wholesale Trade (81.7%), and Manufacturing (73.8%), whereas the industries that tend to have a higher number of women are Health Care & Social Assistance (84.3%), Educational Services (73.9%), and Real Estate, Rental & Leasing (62.9%).
| Industry | Male | Female |
| Agriculture, Fishing & Hunting | 8 (72.7%) | 3 (27.3%) |
| Mining, Quarrying, & Extraction | 94 (59.1%) | 65 (40.9%) |
| Construction | 1,580 (84.0%) | 301 (16.0%) |
| Manufacturing | 1,114 (73.8%) | 396 (26.2%) |
| Wholesale Trade | 308 (81.7%) | 69 (18.3%) |
| Retail Trade | 1,068 (58.8%) | 748 (41.2%) |
| Transportation & Warehousing | 335 (52.8%) | 300 (47.2%) |
| Utilities | 104 (63.0%) | 61 (37.0%) |
| Information | 380 (65.9%) | 197 (34.1%) |
| Finance & Insurance | 550 (51.2%) | 524 (48.8%) |
| Real Estate, Rental & Leasing | 123 (37.0%) | 209 (62.9%) |
| Professional & Scientific | 1,331 (55.2%) | 1,080 (44.8%) |
| Enterprise Management | 0 (0.0%) | 0 (0.0%) |
| Administrative & Support | 247 (44.3%) | 310 (55.7%) |
| Educational Services | 470 (26.1%) | 1,333 (73.9%) |
| Health Care & Social Assistance | 356 (15.7%) | 1,912 (84.3%) |
| Arts, Entertainment & Recreation | 402 (66.6%) | 202 (33.4%) |
| Accommodation & Food Services | 567 (62.4%) | 341 (37.6%) |
| Public Administration | 702 (54.8%) | 580 (45.2%) |
| Total | 10,223 (52.7%) | 9,177 (47.3%) |
Education in Dakota Ridge
School Enrollment in Dakota Ridge
The most common levels of schooling among the 7,767 students in Dakota Ridge are middle school (1,916 | 24.7%), high school (1,653 | 21.3%), and college / undergraduate (1,523 | 19.6%).
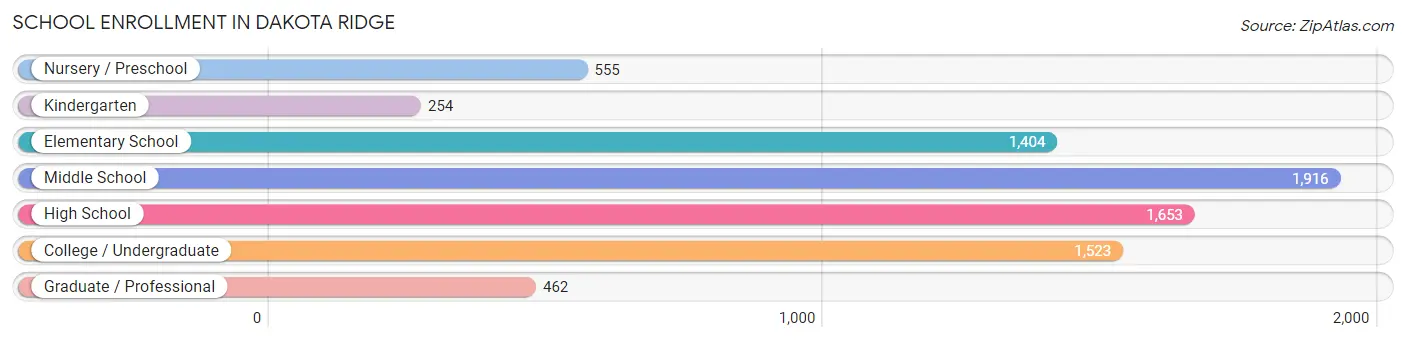
| School Level | # Students | % Students |
| Nursery / Preschool | 555 | 7.1% |
| Kindergarten | 254 | 3.3% |
| Elementary School | 1,404 | 18.1% |
| Middle School | 1,916 | 24.7% |
| High School | 1,653 | 21.3% |
| College / Undergraduate | 1,523 | 19.6% |
| Graduate / Professional | 462 | 5.9% |
| Total | 7,767 | 100.0% |
School Enrollment by Age by Funding Source in Dakota Ridge
Out of a total of 7,767 students who are enrolled in schools in Dakota Ridge, 901 (11.6%) attend a private institution, while the remaining 6,866 (88.4%) are enrolled in public schools. The age group of 3 to 4 year olds has the highest likelihood of being enrolled in private schools, with 175 (45.2% in the age bracket) enrolled. Conversely, the age group of 15 to 17 year olds has the lowest likelihood of being enrolled in a private school, with 1,159 (96.3% in the age bracket) attending a public institution.
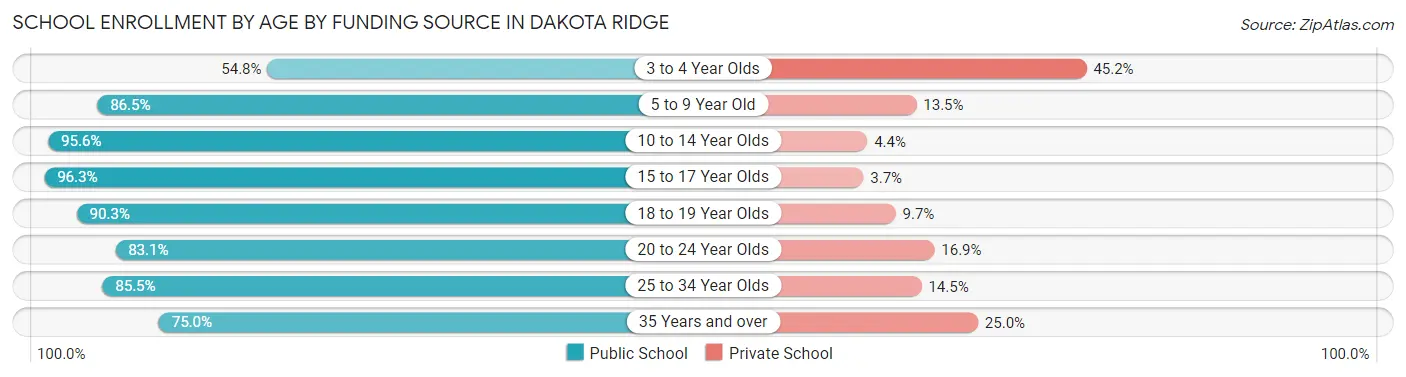
| Age Bracket | Public School | Private School |
| 3 to 4 Year Olds | 212 (54.8%) | 175 (45.2%) |
| 5 to 9 Year Old | 1,367 (86.5%) | 214 (13.5%) |
| 10 to 14 Year Olds | 2,177 (95.6%) | 100 (4.4%) |
| 15 to 17 Year Olds | 1,159 (96.3%) | 44 (3.7%) |
| 18 to 19 Year Olds | 588 (90.3%) | 63 (9.7%) |
| 20 to 24 Year Olds | 566 (83.1%) | 115 (16.9%) |
| 25 to 34 Year Olds | 478 (85.5%) | 81 (14.5%) |
| 35 Years and over | 321 (75.0%) | 107 (25.0%) |
| Total | 6,866 (88.4%) | 901 (11.6%) |
Educational Attainment by Field of Study in Dakota Ridge
Business (2,422 | 17.9%), science & technology (1,468 | 10.8%), engineering (1,361 | 10.0%), bio, nature & agricultural (1,139 | 8.4%), and education (1,130 | 8.3%) are the most common fields of study among 13,554 individuals in Dakota Ridge who have obtained a bachelor's degree or higher.
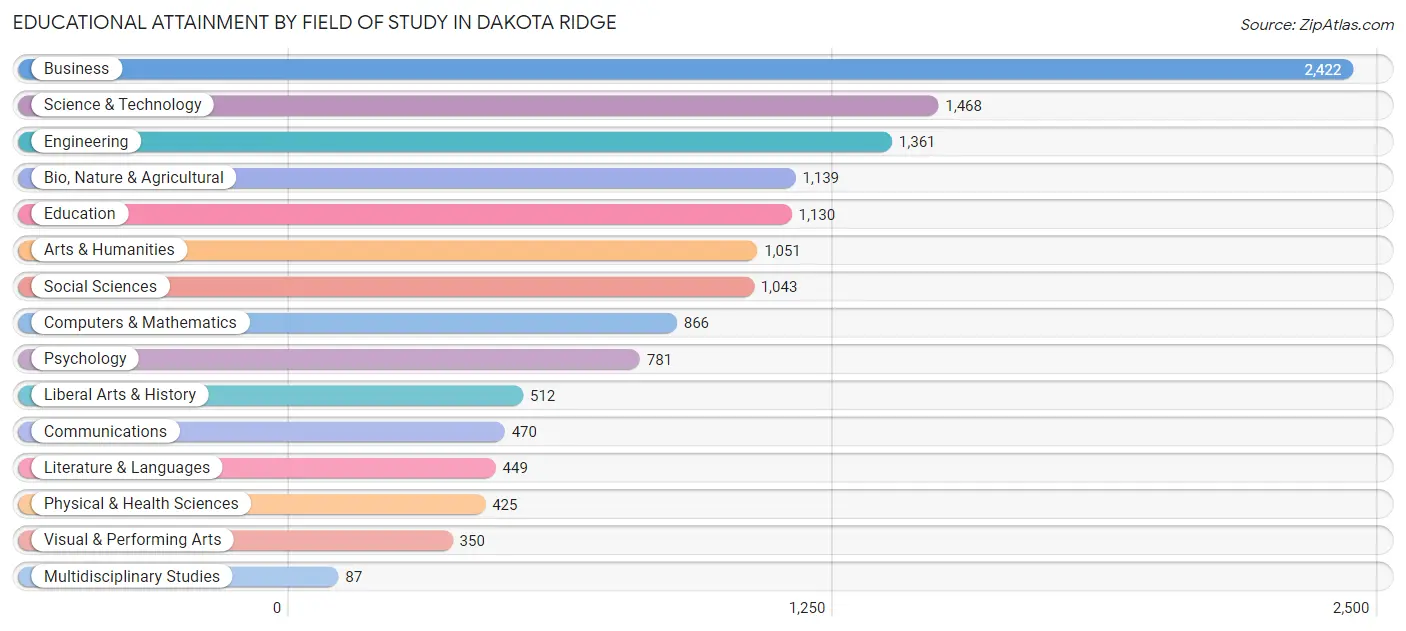
| Field of Study | # Graduates | % Graduates |
| Computers & Mathematics | 866 | 6.4% |
| Bio, Nature & Agricultural | 1,139 | 8.4% |
| Physical & Health Sciences | 425 | 3.1% |
| Psychology | 781 | 5.8% |
| Social Sciences | 1,043 | 7.7% |
| Engineering | 1,361 | 10.0% |
| Multidisciplinary Studies | 87 | 0.6% |
| Science & Technology | 1,468 | 10.8% |
| Business | 2,422 | 17.9% |
| Education | 1,130 | 8.3% |
| Literature & Languages | 449 | 3.3% |
| Liberal Arts & History | 512 | 3.8% |
| Visual & Performing Arts | 350 | 2.6% |
| Communications | 470 | 3.5% |
| Arts & Humanities | 1,051 | 7.7% |
| Total | 13,554 | 100.0% |
Transportation & Commute in Dakota Ridge
Vehicle Availability by Sex in Dakota Ridge
The most prevalent vehicle ownership categories in Dakota Ridge are males with 2 vehicles (4,723, accounting for 47.1%) and females with 2 vehicles (4,043, making up 51.8%).
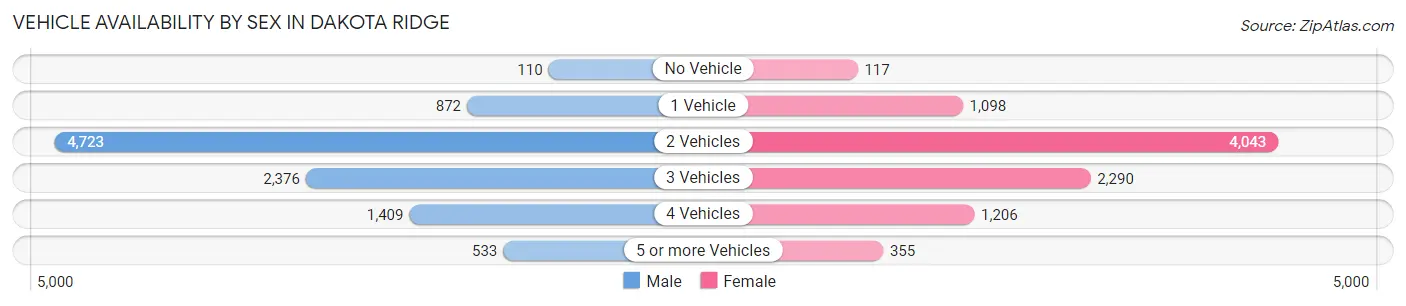
| Vehicles Available | Male | Female |
| No Vehicle | 110 (1.1%) | 117 (1.3%) |
| 1 Vehicle | 872 (8.7%) | 1,098 (12.0%) |
| 2 Vehicles | 4,723 (47.1%) | 4,043 (44.4%) |
| 3 Vehicles | 2,376 (23.7%) | 2,290 (25.1%) |
| 4 Vehicles | 1,409 (14.1%) | 1,206 (13.2%) |
| 5 or more Vehicles | 533 (5.3%) | 355 (3.9%) |
| Total | 10,023 (100.0%) | 9,109 (100.0%) |
Commute Time in Dakota Ridge
The most frequently occuring commute durations in Dakota Ridge are 20 to 24 minutes (2,831 commuters, 17.9%), 30 to 34 minutes (2,425 commuters, 15.3%), and 15 to 19 minutes (2,176 commuters, 13.8%).
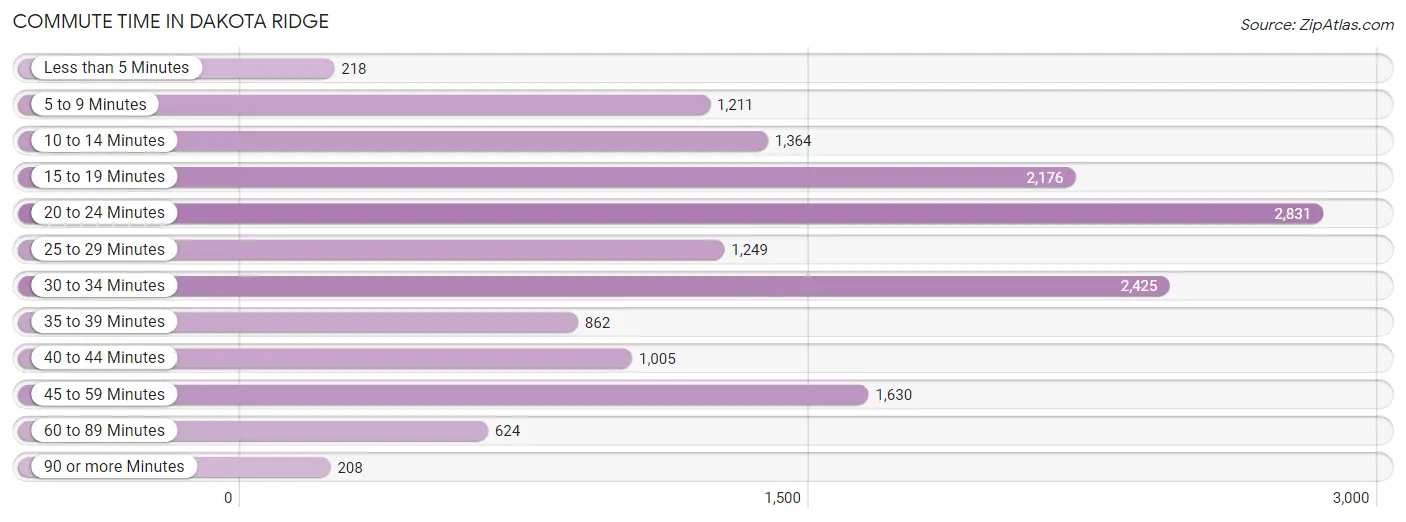
| Commute Time | # Commuters | % Commuters |
| Less than 5 Minutes | 218 | 1.4% |
| 5 to 9 Minutes | 1,211 | 7.7% |
| 10 to 14 Minutes | 1,364 | 8.6% |
| 15 to 19 Minutes | 2,176 | 13.8% |
| 20 to 24 Minutes | 2,831 | 17.9% |
| 25 to 29 Minutes | 1,249 | 7.9% |
| 30 to 34 Minutes | 2,425 | 15.3% |
| 35 to 39 Minutes | 862 | 5.4% |
| 40 to 44 Minutes | 1,005 | 6.4% |
| 45 to 59 Minutes | 1,630 | 10.3% |
| 60 to 89 Minutes | 624 | 4.0% |
| 90 or more Minutes | 208 | 1.3% |
Commute Time by Sex in Dakota Ridge
The most common commute times in Dakota Ridge are 20 to 24 minutes (1,474 commuters, 17.6%) for males and 20 to 24 minutes (1,357 commuters, 18.2%) for females.
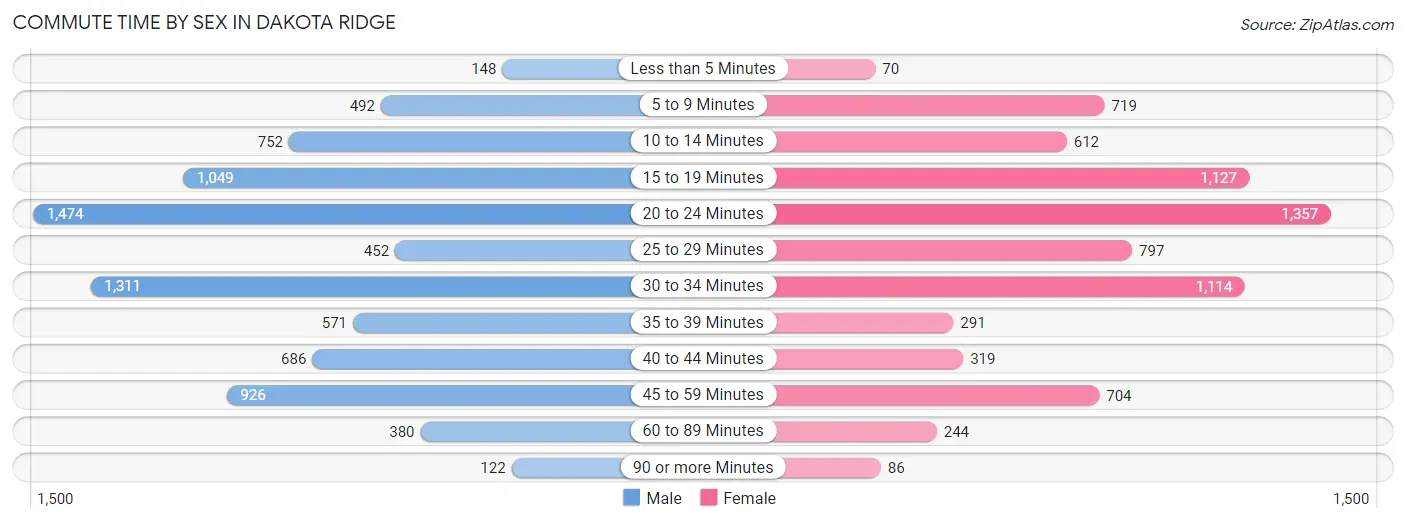
| Commute Time | Male | Female |
| Less than 5 Minutes | 148 (1.8%) | 70 (0.9%) |
| 5 to 9 Minutes | 492 (5.9%) | 719 (9.7%) |
| 10 to 14 Minutes | 752 (9.0%) | 612 (8.2%) |
| 15 to 19 Minutes | 1,049 (12.5%) | 1,127 (15.1%) |
| 20 to 24 Minutes | 1,474 (17.6%) | 1,357 (18.2%) |
| 25 to 29 Minutes | 452 (5.4%) | 797 (10.7%) |
| 30 to 34 Minutes | 1,311 (15.7%) | 1,114 (15.0%) |
| 35 to 39 Minutes | 571 (6.8%) | 291 (3.9%) |
| 40 to 44 Minutes | 686 (8.2%) | 319 (4.3%) |
| 45 to 59 Minutes | 926 (11.1%) | 704 (9.5%) |
| 60 to 89 Minutes | 380 (4.5%) | 244 (3.3%) |
| 90 or more Minutes | 122 (1.5%) | 86 (1.2%) |
Time of Departure to Work by Sex in Dakota Ridge
The most frequent times of departure to work in Dakota Ridge are 7:00 AM to 7:29 AM (1,310, 15.7%) for males and 7:00 AM to 7:29 AM (1,691, 22.7%) for females.
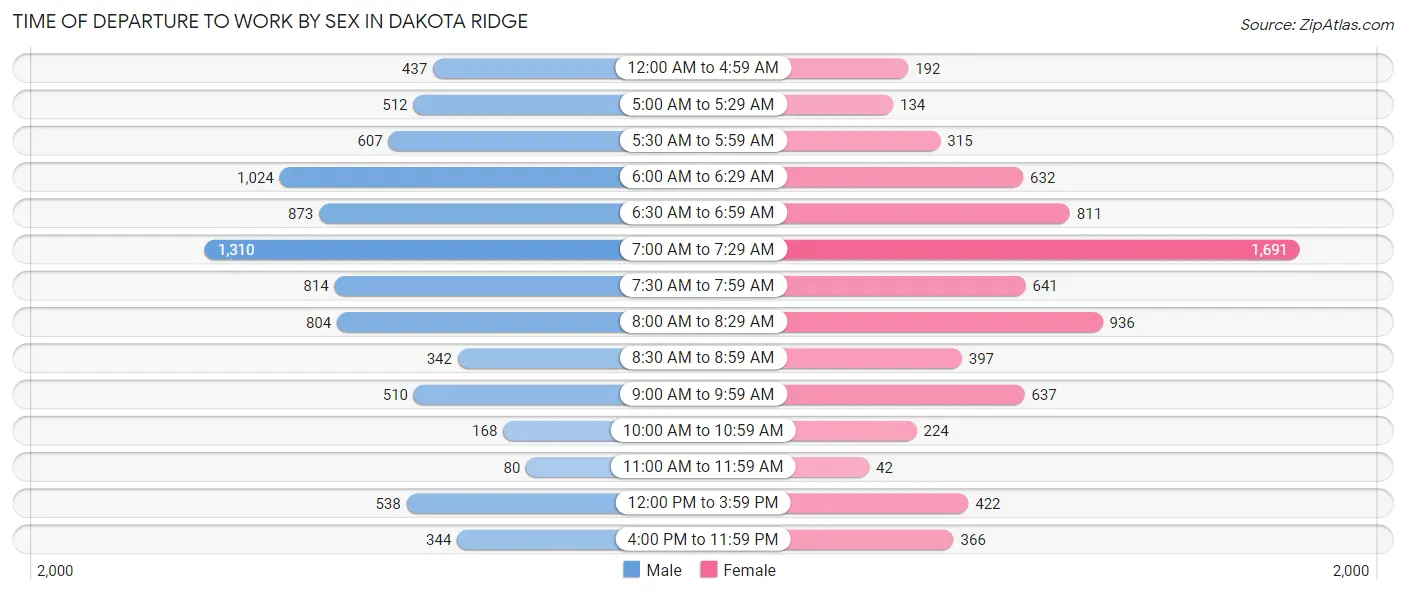
| Time of Departure | Male | Female |
| 12:00 AM to 4:59 AM | 437 (5.2%) | 192 (2.6%) |
| 5:00 AM to 5:29 AM | 512 (6.1%) | 134 (1.8%) |
| 5:30 AM to 5:59 AM | 607 (7.3%) | 315 (4.2%) |
| 6:00 AM to 6:29 AM | 1,024 (12.2%) | 632 (8.5%) |
| 6:30 AM to 6:59 AM | 873 (10.4%) | 811 (10.9%) |
| 7:00 AM to 7:29 AM | 1,310 (15.7%) | 1,691 (22.7%) |
| 7:30 AM to 7:59 AM | 814 (9.7%) | 641 (8.6%) |
| 8:00 AM to 8:29 AM | 804 (9.6%) | 936 (12.6%) |
| 8:30 AM to 8:59 AM | 342 (4.1%) | 397 (5.3%) |
| 9:00 AM to 9:59 AM | 510 (6.1%) | 637 (8.6%) |
| 10:00 AM to 10:59 AM | 168 (2.0%) | 224 (3.0%) |
| 11:00 AM to 11:59 AM | 80 (1.0%) | 42 (0.6%) |
| 12:00 PM to 3:59 PM | 538 (6.4%) | 422 (5.7%) |
| 4:00 PM to 11:59 PM | 344 (4.1%) | 366 (4.9%) |
| Total | 8,363 (100.0%) | 7,440 (100.0%) |
Housing Occupancy in Dakota Ridge
Occupancy by Ownership in Dakota Ridge
Of the total 12,963 dwellings in Dakota Ridge, owner-occupied units account for 10,822 (83.5%), while renter-occupied units make up 2,141 (16.5%).
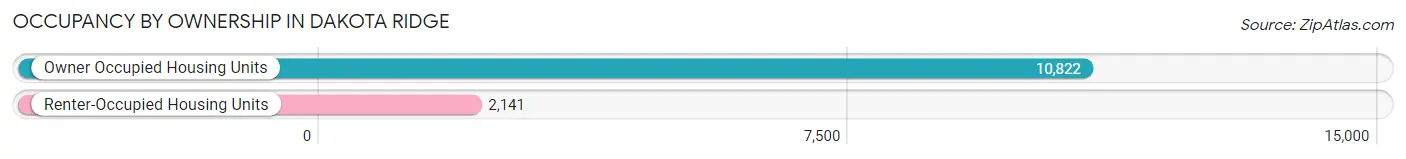
| Occupancy | # Housing Units | % Housing Units |
| Owner Occupied Housing Units | 10,822 | 83.5% |
| Renter-Occupied Housing Units | 2,141 | 16.5% |
| Total Occupied Housing Units | 12,963 | 100.0% |
Occupancy by Household Size in Dakota Ridge
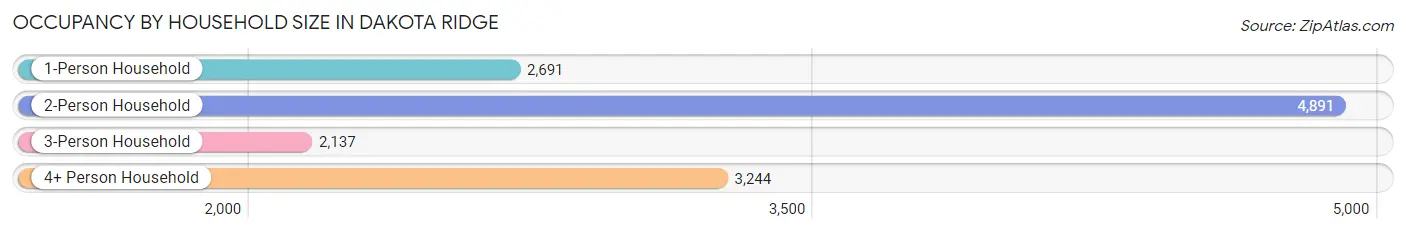
| Household Size | # Housing Units | % Housing Units |
| 1-Person Household | 2,691 | 20.8% |
| 2-Person Household | 4,891 | 37.7% |
| 3-Person Household | 2,137 | 16.5% |
| 4+ Person Household | 3,244 | 25.0% |
| Total Housing Units | 12,963 | 100.0% |
Occupancy by Ownership by Household Size in Dakota Ridge
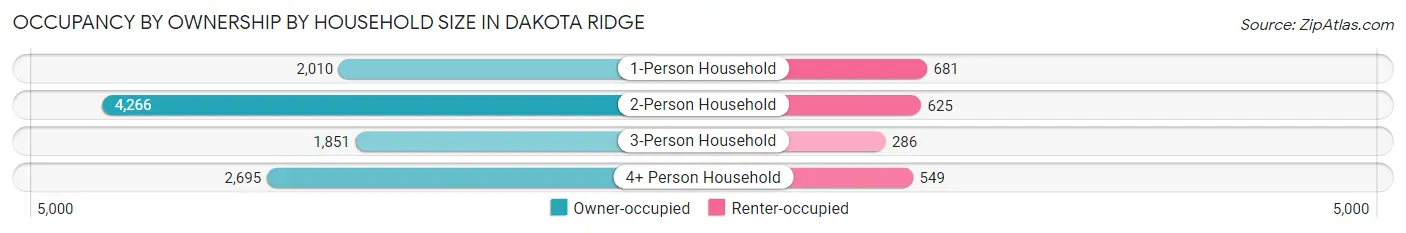
| Household Size | Owner-occupied | Renter-occupied |
| 1-Person Household | 2,010 (74.7%) | 681 (25.3%) |
| 2-Person Household | 4,266 (87.2%) | 625 (12.8%) |
| 3-Person Household | 1,851 (86.6%) | 286 (13.4%) |
| 4+ Person Household | 2,695 (83.1%) | 549 (16.9%) |
| Total Housing Units | 10,822 (83.5%) | 2,141 (16.5%) |
Occupancy by Educational Attainment in Dakota Ridge
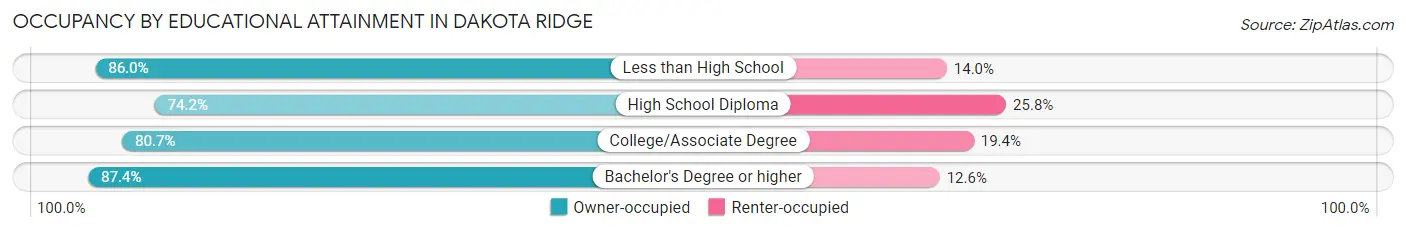
| Household Size | Owner-occupied | Renter-occupied |
| Less than High School | 276 (86.0%) | 45 (14.0%) |
| High School Diploma | 1,466 (74.2%) | 509 (25.8%) |
| College/Associate Degree | 2,901 (80.6%) | 696 (19.4%) |
| Bachelor's Degree or higher | 6,179 (87.4%) | 891 (12.6%) |
Occupancy by Age of Householder in Dakota Ridge
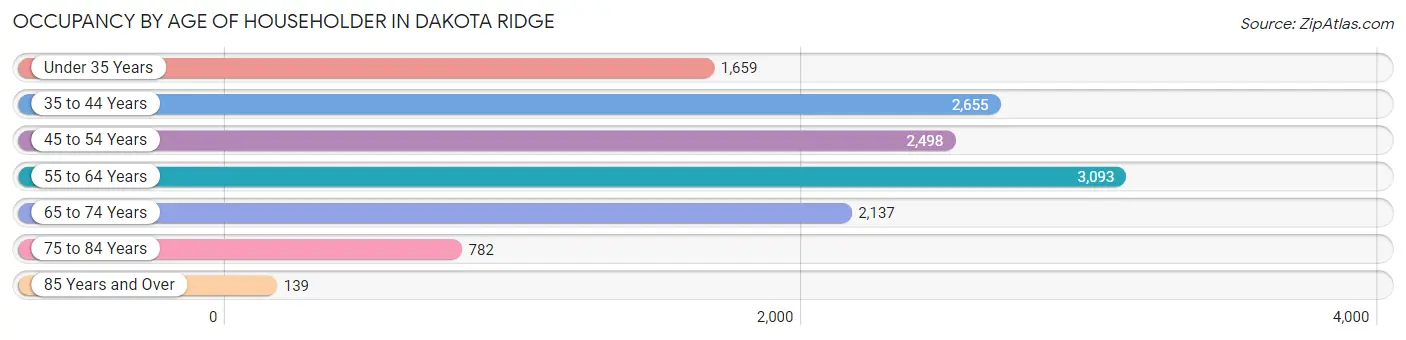
| Age Bracket | # Households | % Households |
| Under 35 Years | 1,659 | 12.8% |
| 35 to 44 Years | 2,655 | 20.5% |
| 45 to 54 Years | 2,498 | 19.3% |
| 55 to 64 Years | 3,093 | 23.9% |
| 65 to 74 Years | 2,137 | 16.5% |
| 75 to 84 Years | 782 | 6.0% |
| 85 Years and Over | 139 | 1.1% |
| Total | 12,963 | 100.0% |
Housing Finances in Dakota Ridge
Median Income by Occupancy in Dakota Ridge
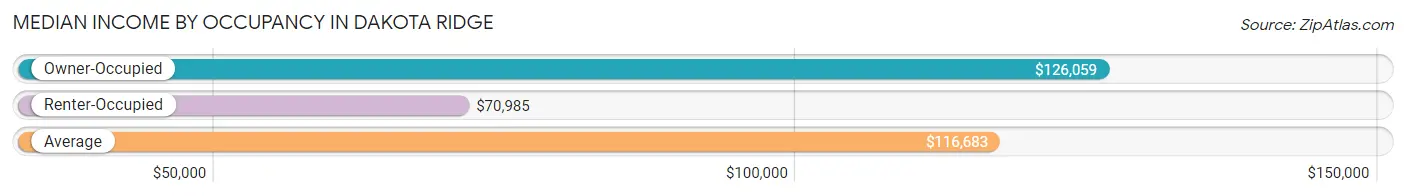
| Occupancy Type | # Households | Median Income |
| Owner-Occupied | 10,822 (83.5%) | $126,059 |
| Renter-Occupied | 2,141 (16.5%) | $70,985 |
| Average | 12,963 (100.0%) | $116,683 |
Occupancy by Householder Income Bracket in Dakota Ridge
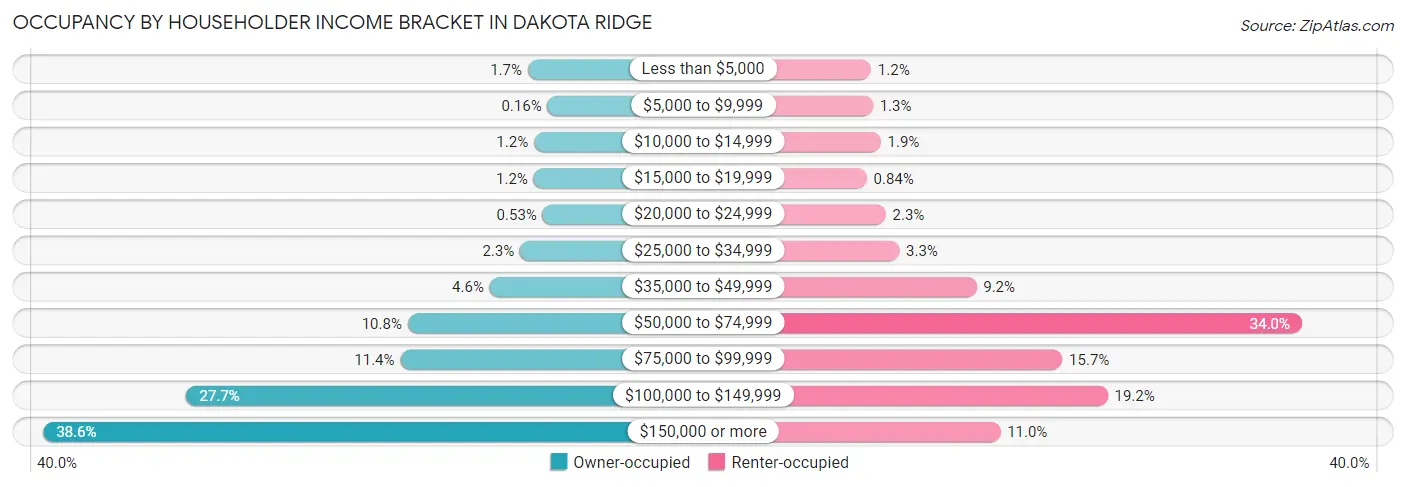
| Income Bracket | Owner-occupied | Renter-occupied |
| Less than $5,000 | 180 (1.7%) | 25 (1.2%) |
| $5,000 to $9,999 | 17 (0.2%) | 28 (1.3%) |
| $10,000 to $14,999 | 129 (1.2%) | 41 (1.9%) |
| $15,000 to $19,999 | 131 (1.2%) | 18 (0.8%) |
| $20,000 to $24,999 | 57 (0.5%) | 49 (2.3%) |
| $25,000 to $34,999 | 244 (2.2%) | 71 (3.3%) |
| $35,000 to $49,999 | 494 (4.6%) | 197 (9.2%) |
| $50,000 to $74,999 | 1,170 (10.8%) | 728 (34.0%) |
| $75,000 to $99,999 | 1,231 (11.4%) | 337 (15.7%) |
| $100,000 to $149,999 | 2,994 (27.7%) | 411 (19.2%) |
| $150,000 or more | 4,175 (38.6%) | 236 (11.0%) |
| Total | 10,822 (100.0%) | 2,141 (100.0%) |
Monthly Housing Cost Tiers in Dakota Ridge
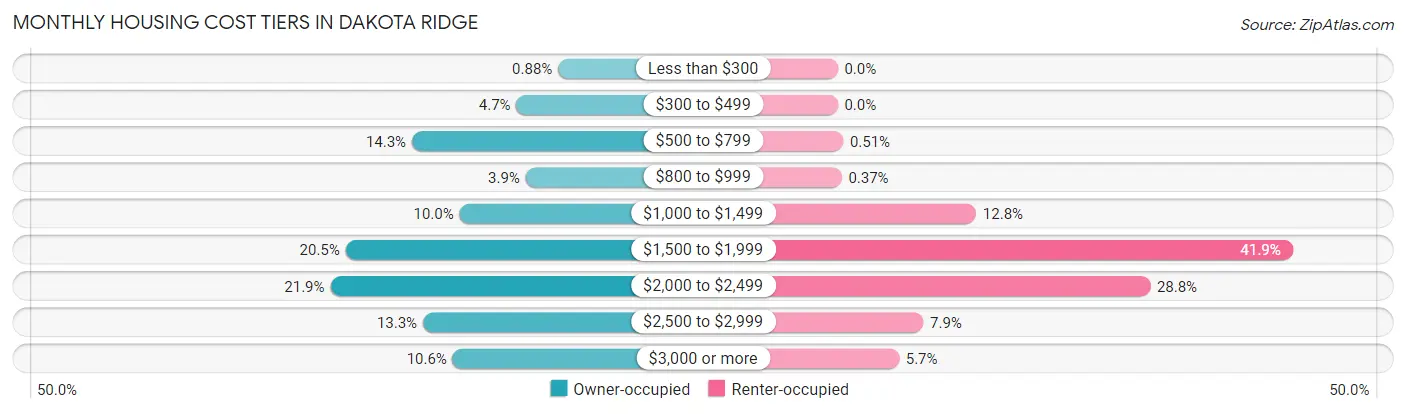
| Monthly Cost | Owner-occupied | Renter-occupied |
| Less than $300 | 95 (0.9%) | 0 (0.0%) |
| $300 to $499 | 511 (4.7%) | 0 (0.0%) |
| $500 to $799 | 1,552 (14.3%) | 11 (0.5%) |
| $800 to $999 | 419 (3.9%) | 8 (0.4%) |
| $1,000 to $1,499 | 1,078 (10.0%) | 273 (12.8%) |
| $1,500 to $1,999 | 2,213 (20.4%) | 897 (41.9%) |
| $2,000 to $2,499 | 2,365 (21.8%) | 616 (28.8%) |
| $2,500 to $2,999 | 1,443 (13.3%) | 169 (7.9%) |
| $3,000 or more | 1,146 (10.6%) | 121 (5.7%) |
| Total | 10,822 (100.0%) | 2,141 (100.0%) |
Physical Housing Characteristics in Dakota Ridge
Housing Structures in Dakota Ridge
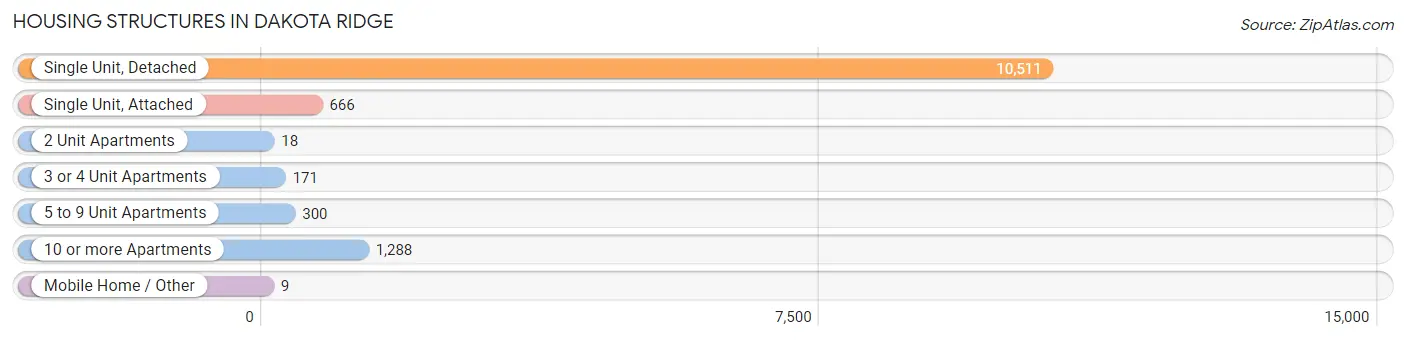
| Structure Type | # Housing Units | % Housing Units |
| Single Unit, Detached | 10,511 | 81.1% |
| Single Unit, Attached | 666 | 5.1% |
| 2 Unit Apartments | 18 | 0.1% |
| 3 or 4 Unit Apartments | 171 | 1.3% |
| 5 to 9 Unit Apartments | 300 | 2.3% |
| 10 or more Apartments | 1,288 | 9.9% |
| Mobile Home / Other | 9 | 0.1% |
| Total | 12,963 | 100.0% |
Housing Structures by Occupancy in Dakota Ridge
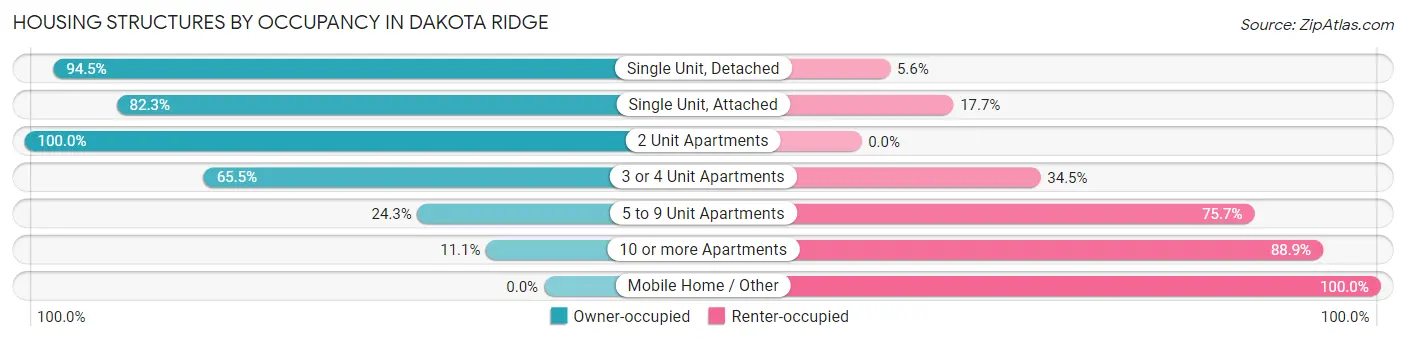
| Structure Type | Owner-occupied | Renter-occupied |
| Single Unit, Detached | 9,928 (94.5%) | 583 (5.6%) |
| Single Unit, Attached | 548 (82.3%) | 118 (17.7%) |
| 2 Unit Apartments | 18 (100.0%) | 0 (0.0%) |
| 3 or 4 Unit Apartments | 112 (65.5%) | 59 (34.5%) |
| 5 to 9 Unit Apartments | 73 (24.3%) | 227 (75.7%) |
| 10 or more Apartments | 143 (11.1%) | 1,145 (88.9%) |
| Mobile Home / Other | 0 (0.0%) | 9 (100.0%) |
| Total | 10,822 (83.5%) | 2,141 (16.5%) |
Housing Structures by Number of Rooms in Dakota Ridge
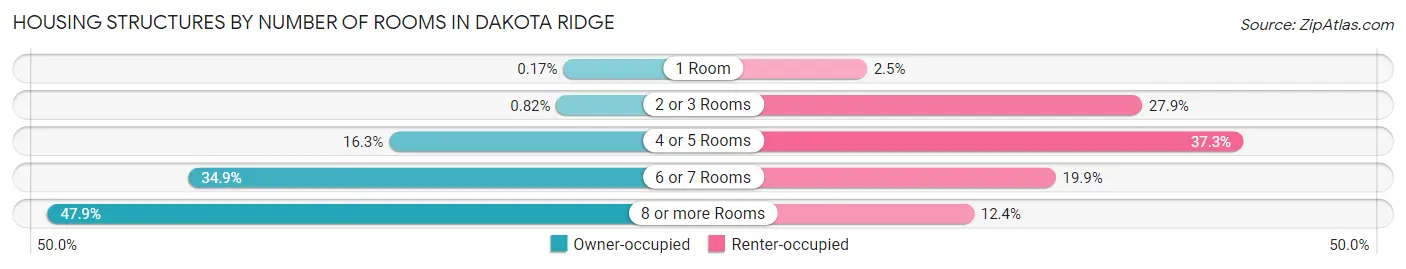
| Number of Rooms | Owner-occupied | Renter-occupied |
| 1 Room | 18 (0.2%) | 53 (2.5%) |
| 2 or 3 Rooms | 89 (0.8%) | 598 (27.9%) |
| 4 or 5 Rooms | 1,763 (16.3%) | 798 (37.3%) |
| 6 or 7 Rooms | 3,772 (34.8%) | 427 (19.9%) |
| 8 or more Rooms | 5,180 (47.9%) | 265 (12.4%) |
| Total | 10,822 (100.0%) | 2,141 (100.0%) |
Housing Structure by Heating Type in Dakota Ridge
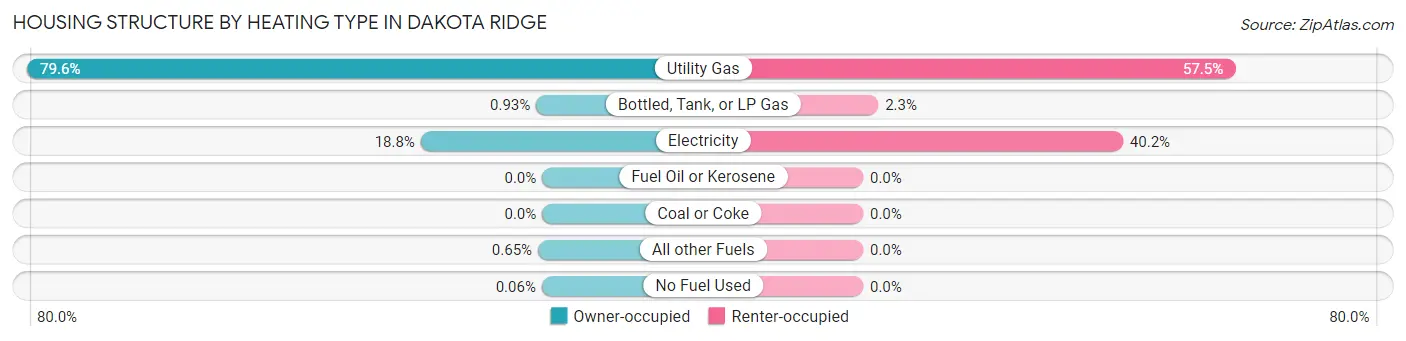
| Heating Type | Owner-occupied | Renter-occupied |
| Utility Gas | 8,614 (79.6%) | 1,231 (57.5%) |
| Bottled, Tank, or LP Gas | 101 (0.9%) | 50 (2.3%) |
| Electricity | 2,031 (18.8%) | 860 (40.2%) |
| Fuel Oil or Kerosene | 0 (0.0%) | 0 (0.0%) |
| Coal or Coke | 0 (0.0%) | 0 (0.0%) |
| All other Fuels | 70 (0.6%) | 0 (0.0%) |
| No Fuel Used | 6 (0.1%) | 0 (0.0%) |
| Total | 10,822 (100.0%) | 2,141 (100.0%) |
Household Vehicle Usage in Dakota Ridge
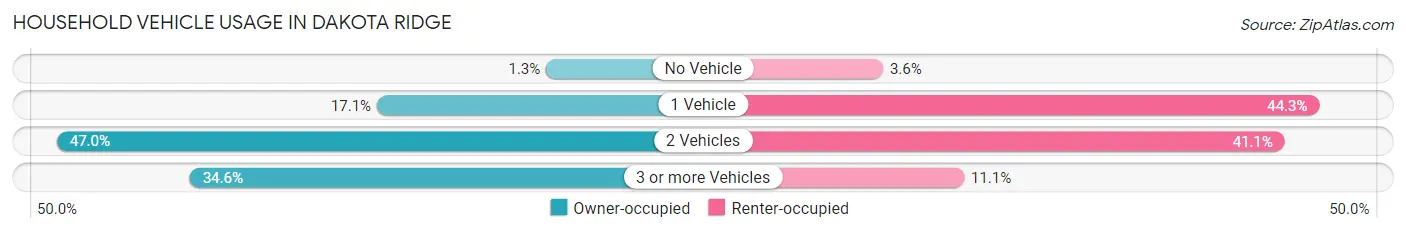
| Vehicles per Household | Owner-occupied | Renter-occupied |
| No Vehicle | 143 (1.3%) | 76 (3.5%) |
| 1 Vehicle | 1,852 (17.1%) | 948 (44.3%) |
| 2 Vehicles | 5,085 (47.0%) | 879 (41.1%) |
| 3 or more Vehicles | 3,742 (34.6%) | 238 (11.1%) |
| Total | 10,822 (100.0%) | 2,141 (100.0%) |
Real Estate & Mortgages in Dakota Ridge
Real Estate and Mortgage Overview in Dakota Ridge
| Characteristic | Without Mortgage | With Mortgage |
| Housing Units | 2,651 | 8,171 |
| Median Property Value | $510,500 | $512,100 |
| Median Household Income | $98,138 | $3,530 |
| Monthly Housing Costs | $600 | $1,143 |
| Real Estate Taxes | $2,628 | $204 |
Property Value by Mortgage Status in Dakota Ridge
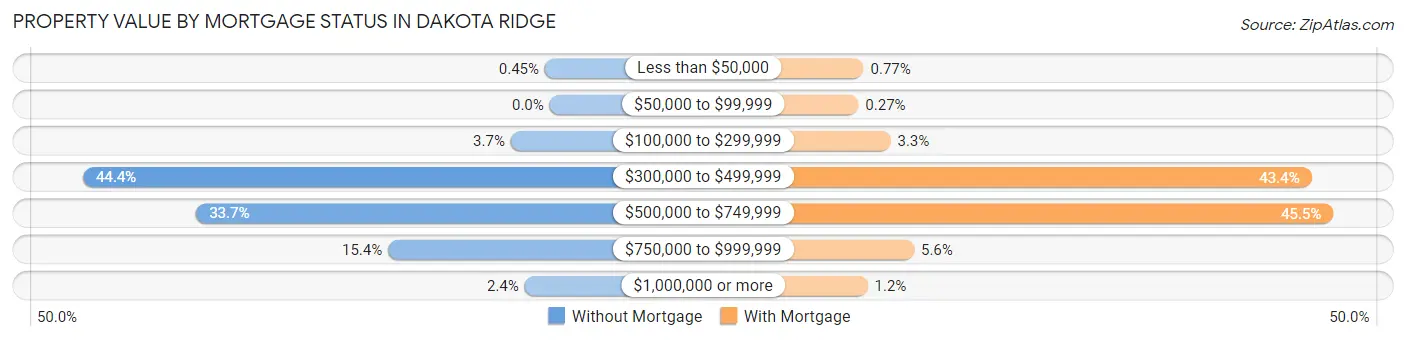
| Property Value | Without Mortgage | With Mortgage |
| Less than $50,000 | 12 (0.4%) | 63 (0.8%) |
| $50,000 to $99,999 | 0 (0.0%) | 22 (0.3%) |
| $100,000 to $299,999 | 98 (3.7%) | 272 (3.3%) |
| $300,000 to $499,999 | 1,178 (44.4%) | 3,548 (43.4%) |
| $500,000 to $749,999 | 892 (33.7%) | 3,717 (45.5%) |
| $750,000 to $999,999 | 408 (15.4%) | 455 (5.6%) |
| $1,000,000 or more | 63 (2.4%) | 94 (1.1%) |
| Total | 2,651 (100.0%) | 8,171 (100.0%) |
Household Income by Mortgage Status in Dakota Ridge
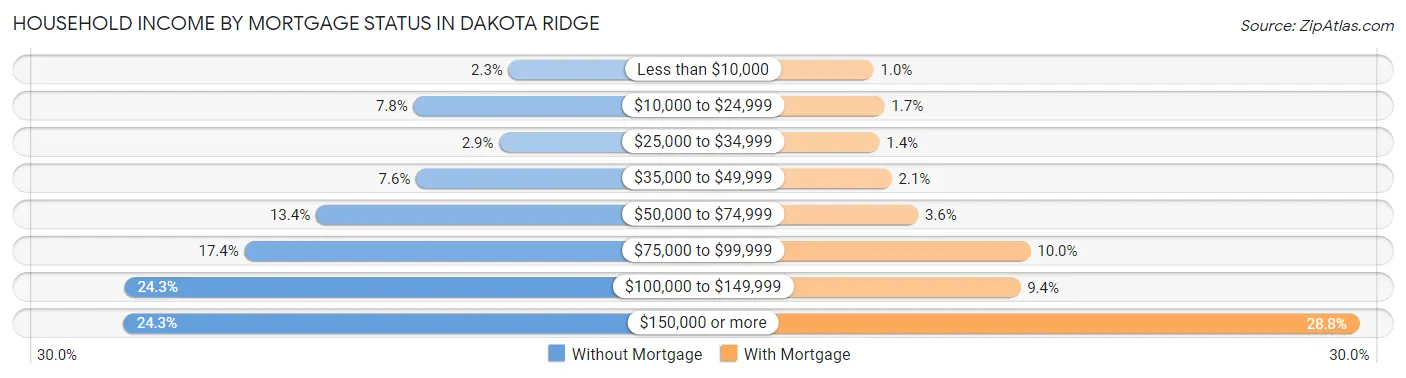
| Household Income | Without Mortgage | With Mortgage |
| Less than $10,000 | 62 (2.3%) | 84 (1.0%) |
| $10,000 to $24,999 | 206 (7.8%) | 135 (1.7%) |
| $25,000 to $34,999 | 76 (2.9%) | 111 (1.4%) |
| $35,000 to $49,999 | 202 (7.6%) | 168 (2.1%) |
| $50,000 to $74,999 | 354 (13.4%) | 292 (3.6%) |
| $75,000 to $99,999 | 462 (17.4%) | 816 (10.0%) |
| $100,000 to $149,999 | 644 (24.3%) | 769 (9.4%) |
| $150,000 or more | 645 (24.3%) | 2,350 (28.8%) |
| Total | 2,651 (100.0%) | 8,171 (100.0%) |
Property Value to Household Income Ratio in Dakota Ridge
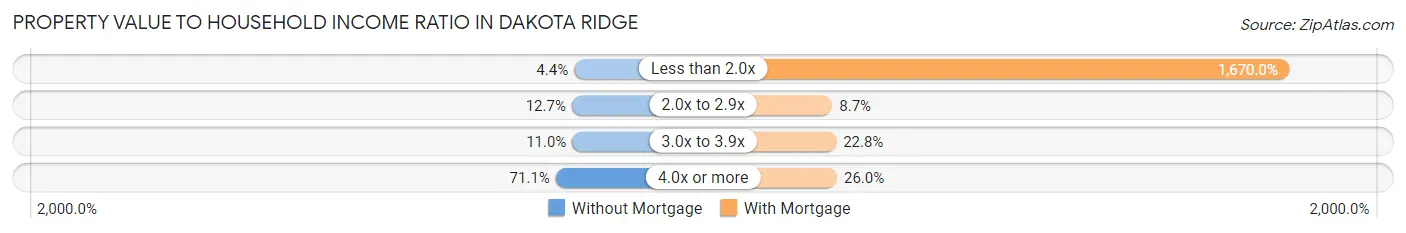
| Value-to-Income Ratio | Without Mortgage | With Mortgage |
| Less than 2.0x | 117 (4.4%) | 136,458 (1,670.0%) |
| 2.0x to 2.9x | 336 (12.7%) | 710 (8.7%) |
| 3.0x to 3.9x | 292 (11.0%) | 1,859 (22.8%) |
| 4.0x or more | 1,885 (71.1%) | 2,127 (26.0%) |
| Total | 2,651 (100.0%) | 8,171 (100.0%) |
Real Estate Taxes by Mortgage Status in Dakota Ridge
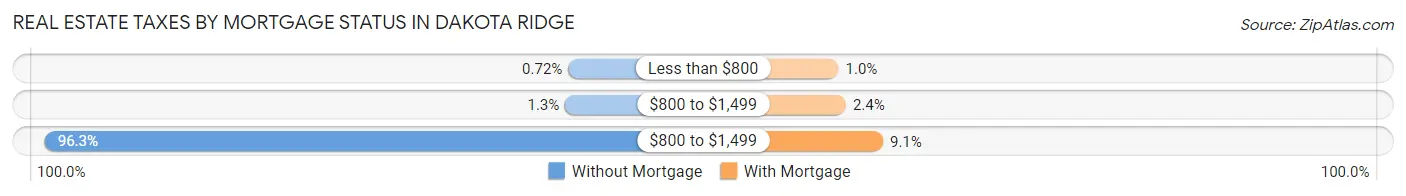
| Property Taxes | Without Mortgage | With Mortgage |
| Less than $800 | 19 (0.7%) | 83 (1.0%) |
| $800 to $1,499 | 34 (1.3%) | 193 (2.4%) |
| $800 to $1,499 | 2,553 (96.3%) | 746 (9.1%) |
| Total | 2,651 (100.0%) | 8,171 (100.0%) |
Health & Disability in Dakota Ridge
Health Insurance Coverage by Age in Dakota Ridge
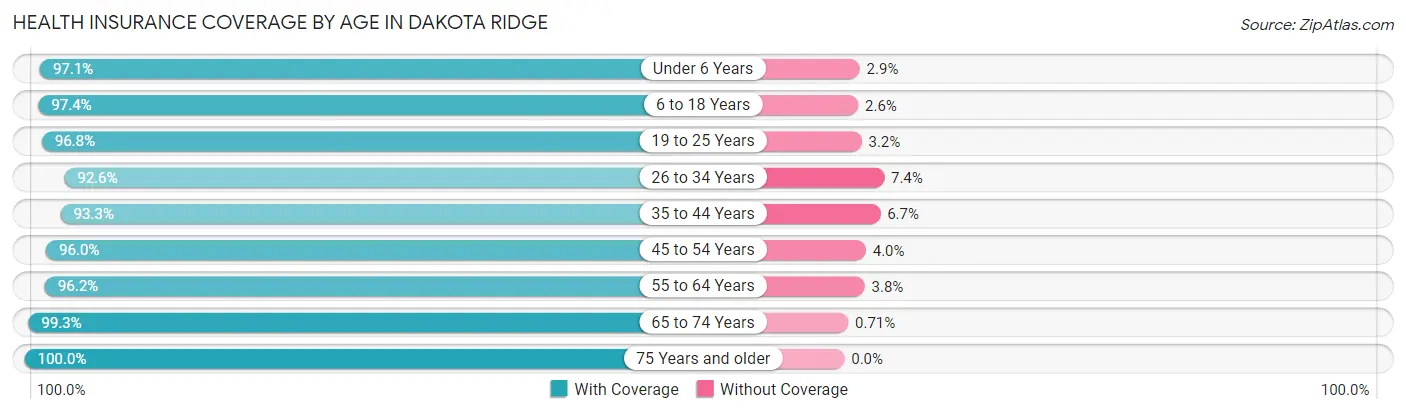
| Age Bracket | With Coverage | Without Coverage |
| Under 6 Years | 2,134 (97.1%) | 63 (2.9%) |
| 6 to 18 Years | 5,259 (97.4%) | 139 (2.6%) |
| 19 to 25 Years | 2,262 (96.8%) | 75 (3.2%) |
| 26 to 34 Years | 4,097 (92.6%) | 328 (7.4%) |
| 35 to 44 Years | 4,529 (93.3%) | 325 (6.7%) |
| 45 to 54 Years | 4,331 (96.0%) | 181 (4.0%) |
| 55 to 64 Years | 5,350 (96.2%) | 211 (3.8%) |
| 65 to 74 Years | 3,380 (99.3%) | 24 (0.7%) |
| 75 Years and older | 1,522 (100.0%) | 0 (0.0%) |
| Total | 32,864 (96.1%) | 1,346 (3.9%) |
Health Insurance Coverage by Citizenship Status in Dakota Ridge
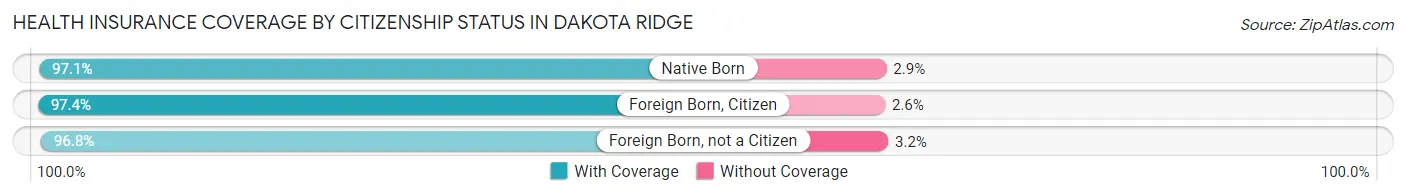
| Citizenship Status | With Coverage | Without Coverage |
| Native Born | 2,134 (97.1%) | 63 (2.9%) |
| Foreign Born, Citizen | 5,259 (97.4%) | 139 (2.6%) |
| Foreign Born, not a Citizen | 2,262 (96.8%) | 75 (3.2%) |
Health Insurance Coverage by Household Income in Dakota Ridge
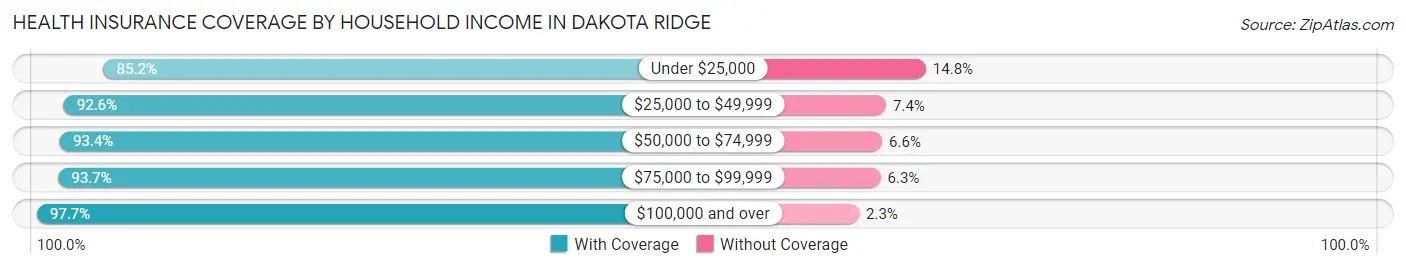
| Household Income | With Coverage | Without Coverage |
| Under $25,000 | 937 (85.2%) | 163 (14.8%) |
| $25,000 to $49,999 | 1,549 (92.6%) | 123 (7.4%) |
| $50,000 to $74,999 | 4,166 (93.4%) | 296 (6.6%) |
| $75,000 to $99,999 | 3,391 (93.7%) | 229 (6.3%) |
| $100,000 and over | 22,718 (97.7%) | 535 (2.3%) |
Public vs Private Health Insurance Coverage by Age in Dakota Ridge
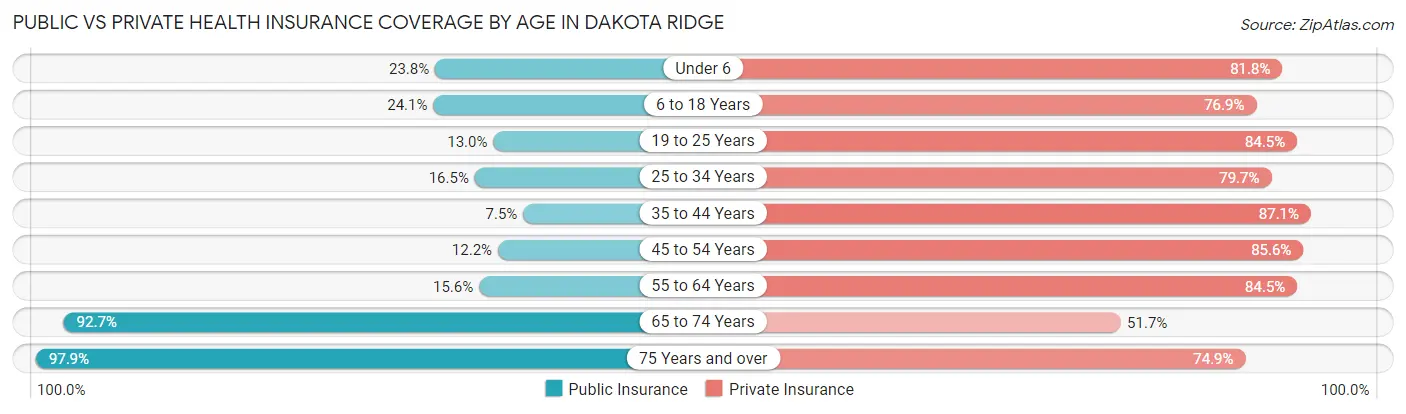
| Age Bracket | Public Insurance | Private Insurance |
| Under 6 | 523 (23.8%) | 1,796 (81.8%) |
| 6 to 18 Years | 1,303 (24.1%) | 4,152 (76.9%) |
| 19 to 25 Years | 304 (13.0%) | 1,975 (84.5%) |
| 25 to 34 Years | 728 (16.5%) | 3,527 (79.7%) |
| 35 to 44 Years | 362 (7.5%) | 4,226 (87.1%) |
| 45 to 54 Years | 548 (12.1%) | 3,864 (85.6%) |
| 55 to 64 Years | 870 (15.6%) | 4,700 (84.5%) |
| 65 to 74 Years | 3,157 (92.7%) | 1,759 (51.7%) |
| 75 Years and over | 1,490 (97.9%) | 1,140 (74.9%) |
| Total | 9,285 (27.1%) | 27,139 (79.3%) |
Disability Status by Sex by Age in Dakota Ridge
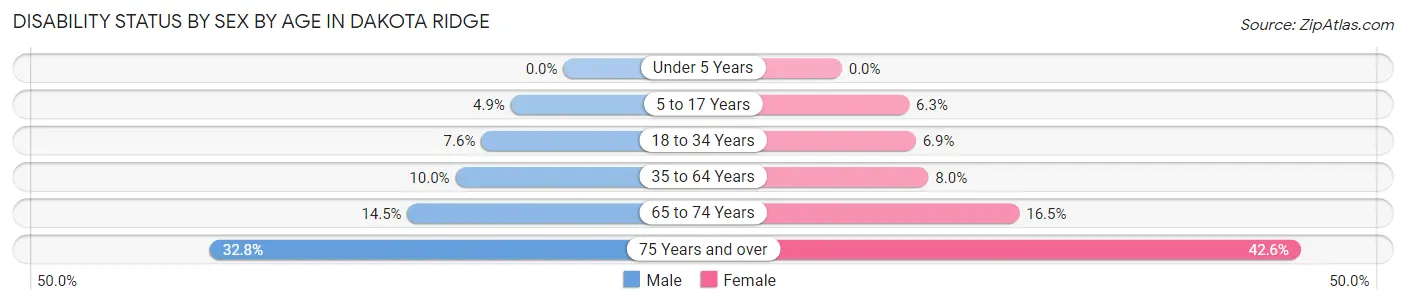
| Age Bracket | Male | Female |
| Under 5 Years | 0 (0.0%) | 0 (0.0%) |
| 5 to 17 Years | 120 (4.9%) | 176 (6.2%) |
| 18 to 34 Years | 298 (7.6%) | 234 (6.9%) |
| 35 to 64 Years | 732 (10.0%) | 613 (8.0%) |
| 65 to 74 Years | 264 (14.5%) | 260 (16.5%) |
| 75 Years and over | 209 (32.8%) | 377 (42.6%) |
Disability Class by Sex by Age in Dakota Ridge
Disability Class: Hearing Difficulty
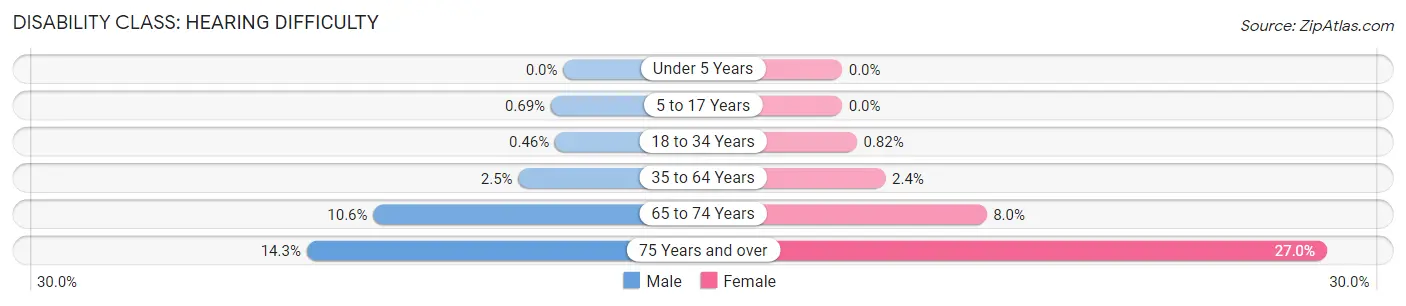
| Age Bracket | Male | Female |
| Under 5 Years | 0 (0.0%) | 0 (0.0%) |
| 5 to 17 Years | 17 (0.7%) | 0 (0.0%) |
| 18 to 34 Years | 18 (0.5%) | 28 (0.8%) |
| 35 to 64 Years | 183 (2.5%) | 184 (2.4%) |
| 65 to 74 Years | 193 (10.6%) | 127 (8.0%) |
| 75 Years and over | 91 (14.3%) | 239 (27.0%) |
Disability Class: Vision Difficulty
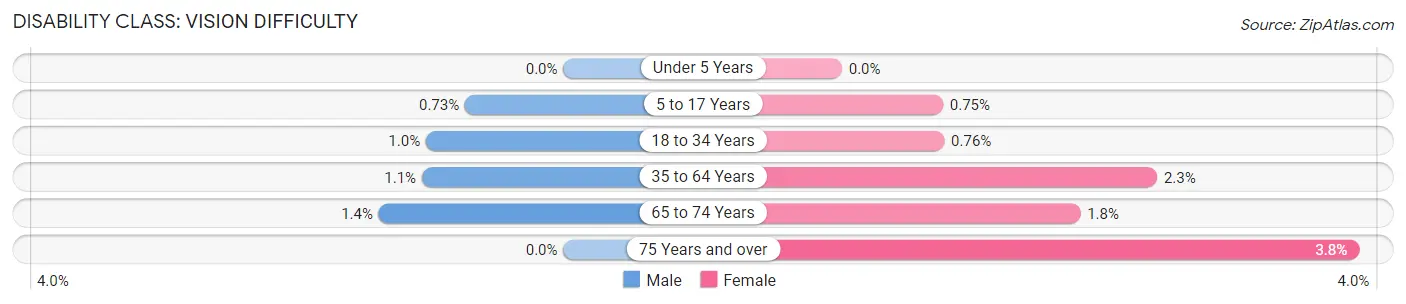
| Age Bracket | Male | Female |
| Under 5 Years | 0 (0.0%) | 0 (0.0%) |
| 5 to 17 Years | 18 (0.7%) | 21 (0.7%) |
| 18 to 34 Years | 40 (1.0%) | 26 (0.8%) |
| 35 to 64 Years | 77 (1.1%) | 178 (2.3%) |
| 65 to 74 Years | 25 (1.4%) | 28 (1.8%) |
| 75 Years and over | 0 (0.0%) | 34 (3.8%) |
Disability Class: Cognitive Difficulty
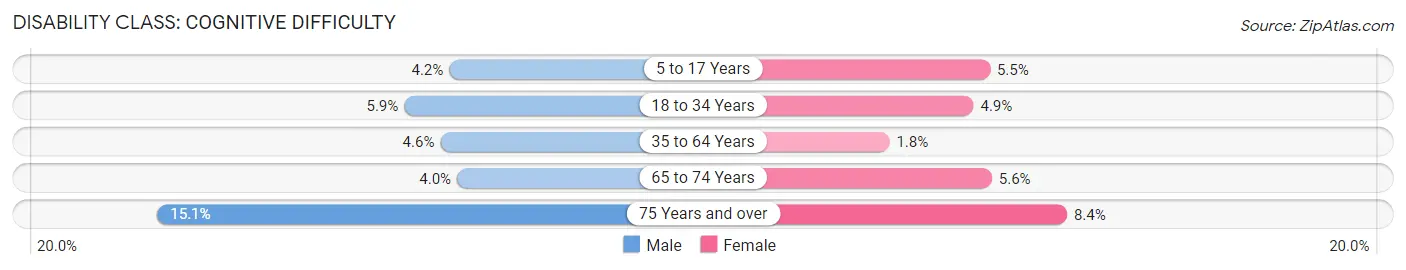
| Age Bracket | Male | Female |
| 5 to 17 Years | 104 (4.2%) | 155 (5.5%) |
| 18 to 34 Years | 231 (5.9%) | 167 (4.9%) |
| 35 to 64 Years | 334 (4.6%) | 135 (1.8%) |
| 65 to 74 Years | 72 (4.0%) | 88 (5.6%) |
| 75 Years and over | 96 (15.1%) | 74 (8.4%) |
Disability Class: Ambulatory Difficulty
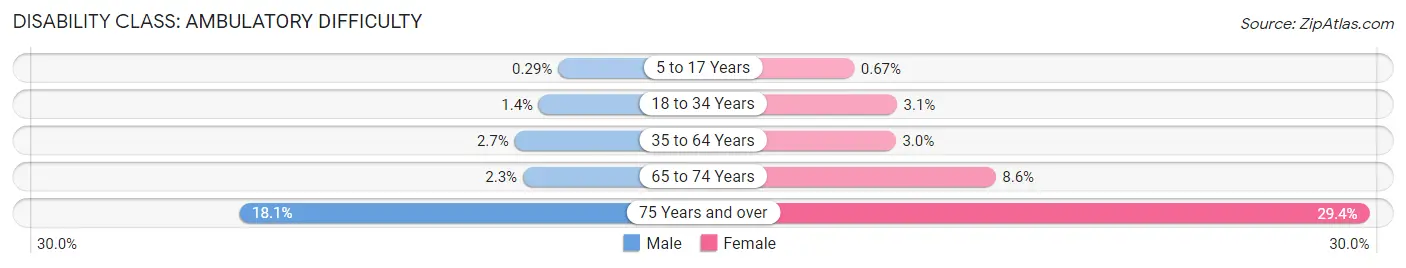
| Age Bracket | Male | Female |
| 5 to 17 Years | 7 (0.3%) | 19 (0.7%) |
| 18 to 34 Years | 53 (1.4%) | 104 (3.0%) |
| 35 to 64 Years | 199 (2.7%) | 228 (3.0%) |
| 65 to 74 Years | 41 (2.2%) | 135 (8.6%) |
| 75 Years and over | 115 (18.0%) | 260 (29.4%) |
Disability Class: Self-Care Difficulty
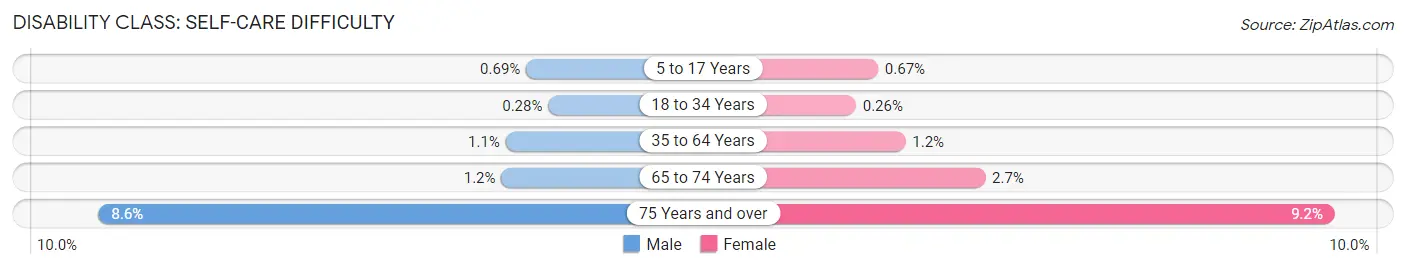
| Age Bracket | Male | Female |
| 5 to 17 Years | 17 (0.7%) | 19 (0.7%) |
| 18 to 34 Years | 11 (0.3%) | 9 (0.3%) |
| 35 to 64 Years | 78 (1.1%) | 90 (1.2%) |
| 65 to 74 Years | 21 (1.1%) | 42 (2.7%) |
| 75 Years and over | 55 (8.6%) | 81 (9.1%) |
Technology Access in Dakota Ridge
Computing Device Access in Dakota Ridge
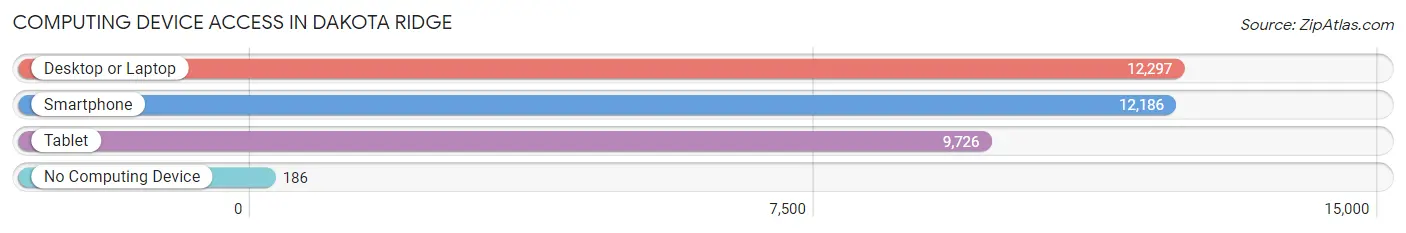
| Device Type | # Households | % Households |
| Desktop or Laptop | 12,297 | 94.9% |
| Smartphone | 12,186 | 94.0% |
| Tablet | 9,726 | 75.0% |
| No Computing Device | 186 | 1.4% |
| Total | 12,963 | 100.0% |
Internet Access in Dakota Ridge
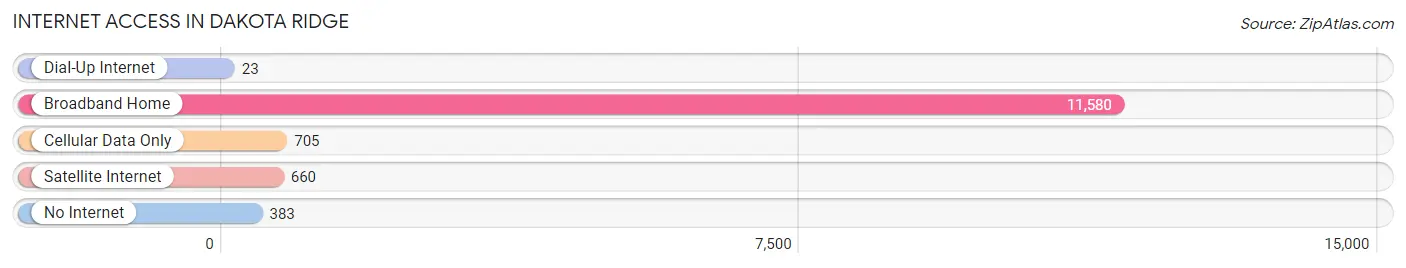
| Internet Type | # Households | % Households |
| Dial-Up Internet | 23 | 0.2% |
| Broadband Home | 11,580 | 89.3% |
| Cellular Data Only | 705 | 5.4% |
| Satellite Internet | 660 | 5.1% |
| No Internet | 383 | 2.9% |
| Total | 12,963 | 100.0% |
Dakota Ridge Summary
Dakota Ridge is a census-designated place (CDP) located in Jefferson County, Colorado, United States. The population was 8,945 at the 2010 census. It is located in the foothills of the Rocky Mountains, approximately 20 miles west of Denver.
History
The area that is now Dakota Ridge was originally inhabited by the Ute and Arapaho Native American tribes. The first European settlers arrived in the area in the late 1800s, and the area was officially incorporated as a town in 1874. The town was named after the Dakota Formation, a geological formation that runs through the area.
The town grew slowly over the next few decades, and by the early 1900s, it had become a popular destination for tourists and outdoor enthusiasts. The town was also home to several small businesses, including a general store, a post office, and a few restaurants.
In the 1950s, the town began to experience rapid growth as Denver's population increased and more people moved to the area. This growth continued into the 1960s and 1970s, and by the 1980s, the town had become a popular bedroom community for Denver.
Geography
Dakota Ridge is located in the foothills of the Rocky Mountains, approximately 20 miles west of Denver. The town is situated at an elevation of 6,400 feet above sea level. The town is bordered by the cities of Golden and Morrison to the north, and the towns of Evergreen and Conifer to the south.
The town is located in a valley surrounded by mountains, including Mount Evans, Mount Bierstadt, and Mount Goliath. The town is also located near several popular recreational areas, including the White Ranch Open Space Park, the Golden Gate Canyon State Park, and the Mount Evans Wilderness Area.
Economy
Dakota Ridge is primarily a residential community, and the majority of its residents are employed in the nearby cities of Denver and Golden. The town is also home to several small businesses, including restaurants, retail stores, and professional services.
The town is also home to several large employers, including the Coors Brewing Company, the Denver Federal Center, and the National Renewable Energy Laboratory.
Demographics
As of the 2010 census, there were 8,945 people, 3,541 households, and 2,541 families residing in the town. The population density was 1,845.3 people per square mile. The racial makeup of the town was 91.2% White, 2.2% African American, 0.7% Native American, 1.7% Asian, 0.1% Pacific Islander, 2.3% from other races, and 2.6% from two or more races. Hispanic or Latino of any race were 8.2% of the population.
The median income for a household in the town was $68,958, and the median income for a family was $77,945. The per capita income for the town was $31,945. About 4.2% of families and 5.7% of the population were below the poverty line, including 7.2% of those under age 18 and 4.2% of those age 65 or over.
Common Questions
What is Per Capita Income in Dakota Ridge?
Per Capita income in Dakota Ridge is $51,596.
What is the Median Family Income in Dakota Ridge?
Median Family Income in Dakota Ridge is $131,677.
What is the Median Household income in Dakota Ridge?
Median Household Income in Dakota Ridge is $116,683.
What is Income or Wage Gap in Dakota Ridge?
Income or Wage Gap in Dakota Ridge is 19.8%.
Women in Dakota Ridge earn 80.2 cents for every dollar earned by a man.
What is Inequality or Gini Index in Dakota Ridge?
Inequality or Gini Index in Dakota Ridge is 0.36.
What is the Total Population of Dakota Ridge?
Total Population of Dakota Ridge is 34,234.
What is the Total Male Population of Dakota Ridge?
Total Male Population of Dakota Ridge is 17,193.
What is the Total Female Population of Dakota Ridge?
Total Female Population of Dakota Ridge is 17,041.
What is the Ratio of Males per 100 Females in Dakota Ridge?
There are 100.89 Males per 100 Females in Dakota Ridge.
What is the Ratio of Females per 100 Males in Dakota Ridge?
There are 99.12 Females per 100 Males in Dakota Ridge.
What is the Median Population Age in Dakota Ridge?
Median Population Age in Dakota Ridge is 40.0 Years.
What is the Average Family Size in Dakota Ridge
Average Family Size in Dakota Ridge is 3.1 People.
What is the Average Household Size in Dakota Ridge
Average Household Size in Dakota Ridge is 2.6 People.
How Large is the Labor Force in Dakota Ridge?
There are 20,105 People in the Labor Forcein in Dakota Ridge.
What is the Percentage of People in the Labor Force in Dakota Ridge?
71.6% of People are in the Labor Force in Dakota Ridge.
What is the Unemployment Rate in Dakota Ridge?
Unemployment Rate in Dakota Ridge is 3.4%.