Arvada, CO Map & Demographics
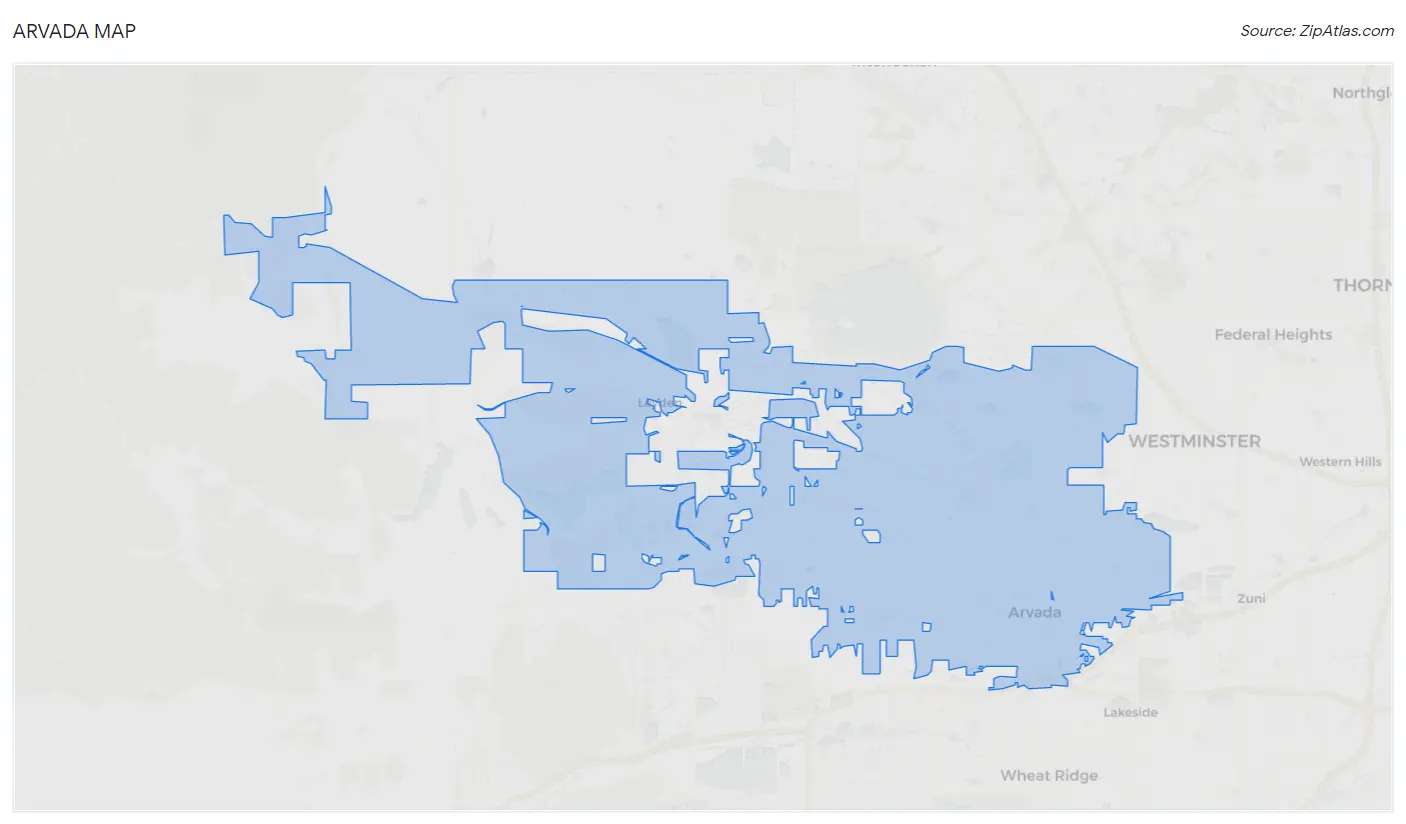
Arvada Map
Arvada Overview
$52,932
PER CAPITA INCOME
$131,766
AVG FAMILY INCOME
$106,014
AVG HOUSEHOLD INCOME
27.9%
WAGE / INCOME GAP [ % ]
72.1¢/ $1
WAGE / INCOME GAP [ $ ]
$11,503
FAMILY INCOME DEFICIT
0.39
INEQUALITY / GINI INDEX
123,066
TOTAL POPULATION
61,333
MALE POPULATION
61,733
FEMALE POPULATION
99.35
MALES / 100 FEMALES
100.65
FEMALES / 100 MALES
40.2
MEDIAN AGE
3.0
AVG FAMILY SIZE
2.4
AVG HOUSEHOLD SIZE
71,768
LABOR FORCE [ PEOPLE ]
70.9%
PERCENT IN LABOR FORCE
3.8%
UNEMPLOYMENT RATE
Income in Arvada
Income Overview in Arvada
Per Capita Income in Arvada is $52,932, while median incomes of families and households are $131,766 and $106,014 respectively.
| Characteristic | Number | Measure |
| Per Capita Income | 123,066 | $52,932 |
| Median Family Income | 32,622 | $131,766 |
| Mean Family Income | 32,622 | $151,400 |
| Median Household Income | 50,211 | $106,014 |
| Mean Household Income | 50,211 | $127,450 |
| Income Deficit | 32,622 | $11,503 |
| Wage / Income Gap (%) | 123,066 | 27.92% |
| Wage / Income Gap ($) | 123,066 | 72.08¢ per $1 |
| Gini / Inequality Index | 123,066 | 0.39 |
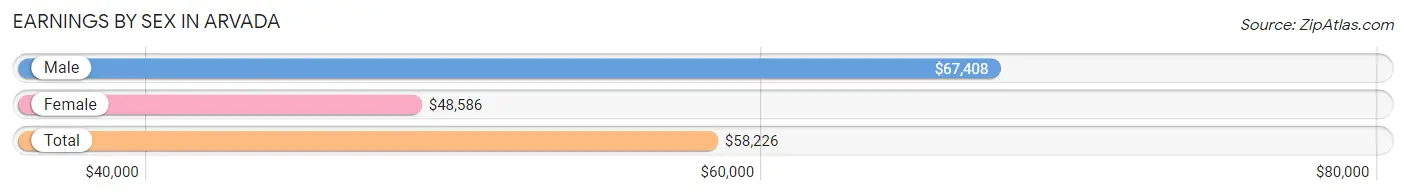
Earnings by Sex in Arvada
Average Earnings in Arvada are $58,226, $67,408 for men and $48,586 for women, a difference of 27.9%.
| Sex | Number | Average Earnings |
| Male | 39,099 (52.8%) | $67,408 |
| Female | 35,000 (47.2%) | $48,586 |
| Total | 74,099 (100.0%) | $58,226 |
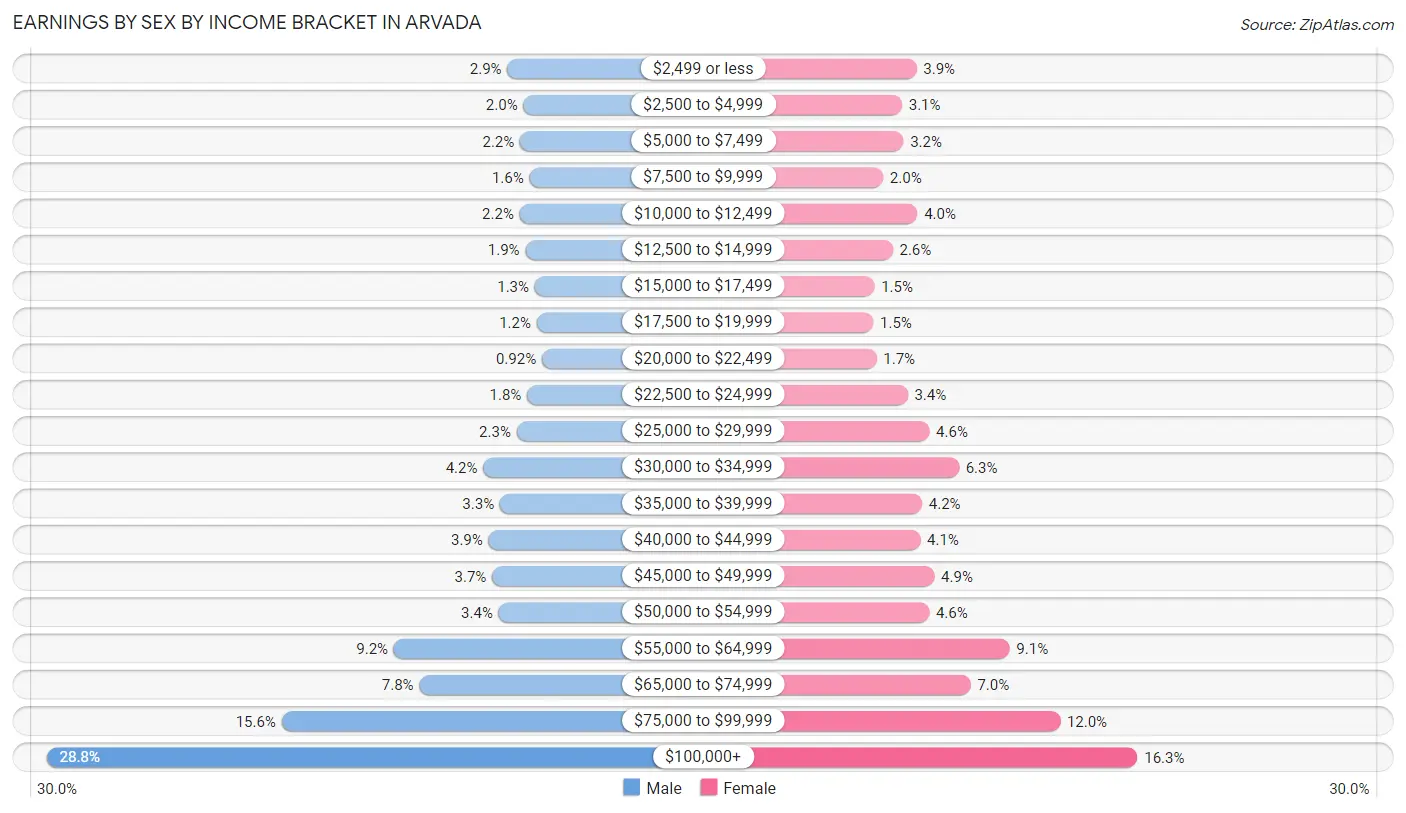
Earnings by Sex by Income Bracket in Arvada
The most common earnings brackets in Arvada are $100,000+ for men (11,243 | 28.8%) and $100,000+ for women (5,715 | 16.3%).
| Income | Male | Female |
| $2,499 or less | 1,118 (2.9%) | 1,368 (3.9%) |
| $2,500 to $4,999 | 765 (2.0%) | 1,082 (3.1%) |
| $5,000 to $7,499 | 842 (2.1%) | 1,108 (3.2%) |
| $7,500 to $9,999 | 633 (1.6%) | 709 (2.0%) |
| $10,000 to $12,499 | 849 (2.2%) | 1,386 (4.0%) |
| $12,500 to $14,999 | 725 (1.8%) | 900 (2.6%) |
| $15,000 to $17,499 | 516 (1.3%) | 540 (1.5%) |
| $17,500 to $19,999 | 474 (1.2%) | 518 (1.5%) |
| $20,000 to $22,499 | 360 (0.9%) | 580 (1.7%) |
| $22,500 to $24,999 | 683 (1.8%) | 1,193 (3.4%) |
| $25,000 to $29,999 | 914 (2.3%) | 1,621 (4.6%) |
| $30,000 to $34,999 | 1,651 (4.2%) | 2,200 (6.3%) |
| $35,000 to $39,999 | 1,282 (3.3%) | 1,477 (4.2%) |
| $40,000 to $44,999 | 1,533 (3.9%) | 1,442 (4.1%) |
| $45,000 to $49,999 | 1,455 (3.7%) | 1,720 (4.9%) |
| $50,000 to $54,999 | 1,311 (3.4%) | 1,616 (4.6%) |
| $55,000 to $64,999 | 3,612 (9.2%) | 3,200 (9.1%) |
| $65,000 to $74,999 | 3,052 (7.8%) | 2,432 (7.0%) |
| $75,000 to $99,999 | 6,081 (15.5%) | 4,193 (12.0%) |
| $100,000+ | 11,243 (28.8%) | 5,715 (16.3%) |
| Total | 39,099 (100.0%) | 35,000 (100.0%) |
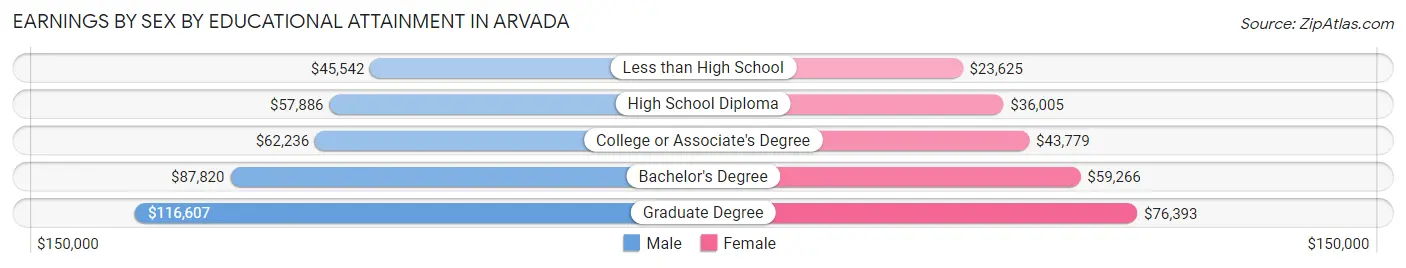
Earnings by Sex by Educational Attainment in Arvada
Average earnings in Arvada are $74,375 for men and $54,715 for women, a difference of 26.4%. Men with an educational attainment of graduate degree enjoy the highest average annual earnings of $116,607, while those with less than high school education earn the least with $45,542. Women with an educational attainment of graduate degree earn the most with the average annual earnings of $76,393, while those with less than high school education have the smallest earnings of $23,625.
| Educational Attainment | Male Income | Female Income |
| Less than High School | $45,542 | $23,625 |
| High School Diploma | $57,886 | $36,005 |
| College or Associate's Degree | $62,236 | $43,779 |
| Bachelor's Degree | $87,820 | $59,266 |
| Graduate Degree | $116,607 | $76,393 |
| Total | $74,375 | $54,715 |
Family Income in Arvada
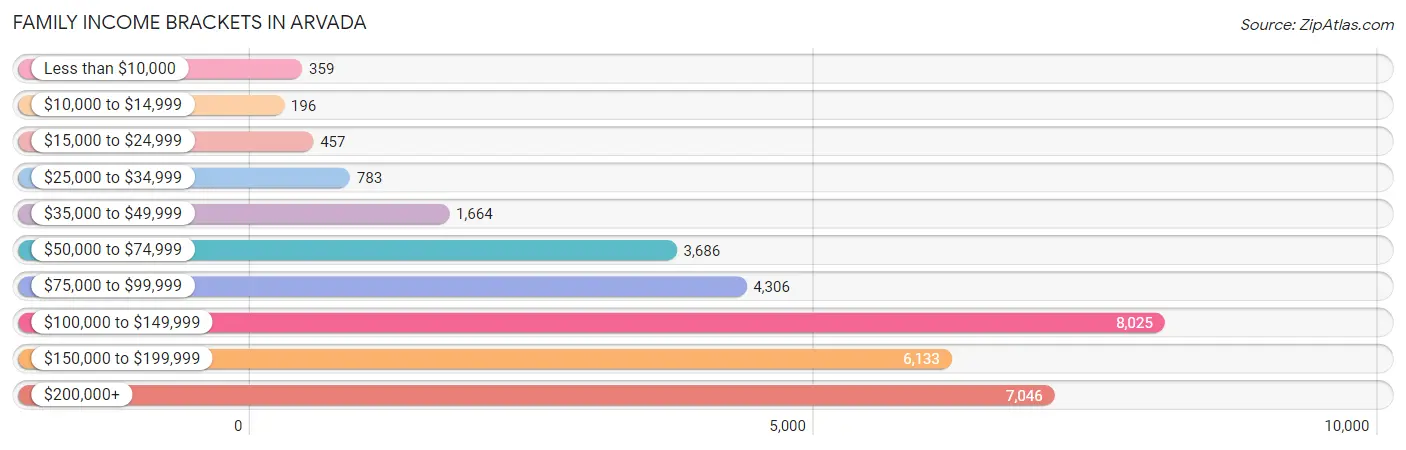
Family Income Brackets in Arvada
According to the Arvada family income data, there are 8,025 families falling into the $100,000 to $149,999 income range, which is the most common income bracket and makes up 24.6% of all families. Conversely, the $10,000 to $14,999 income bracket is the least frequent group with only 196 families (0.6%) belonging to this category.
| Income Bracket | # Families | % Families |
| Less than $10,000 | 359 | 1.1% |
| $10,000 to $14,999 | 196 | 0.6% |
| $15,000 to $24,999 | 457 | 1.4% |
| $25,000 to $34,999 | 783 | 2.4% |
| $35,000 to $49,999 | 1,664 | 5.1% |
| $50,000 to $74,999 | 3,686 | 11.3% |
| $75,000 to $99,999 | 4,306 | 13.2% |
| $100,000 to $149,999 | 8,025 | 24.6% |
| $150,000 to $199,999 | 6,133 | 18.8% |
| $200,000+ | 7,046 | 21.6% |
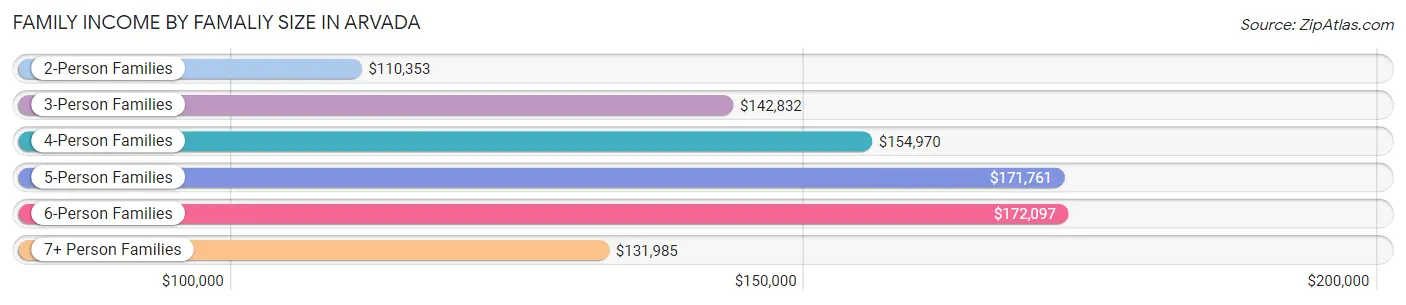
Family Income by Famaliy Size in Arvada
6-person families (826 | 2.5%) account for the highest median family income in Arvada with $172,097 per family, while 2-person families (16,168 | 49.6%) have the highest median income of $55,176 per family member.
| Income Bracket | # Families | Median Income |
| 2-Person Families | 16,168 (49.6%) | $110,353 |
| 3-Person Families | 7,677 (23.5%) | $142,832 |
| 4-Person Families | 5,627 (17.2%) | $154,970 |
| 5-Person Families | 1,965 (6.0%) | $171,761 |
| 6-Person Families | 826 (2.5%) | $172,097 |
| 7+ Person Families | 359 (1.1%) | $131,985 |
| Total | 32,622 (100.0%) | $131,766 |
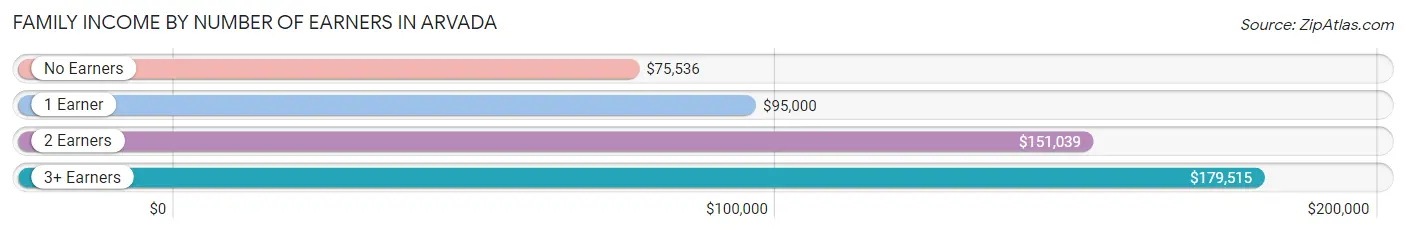
Family Income by Number of Earners in Arvada
The median family income in Arvada is $131,766, with families comprising 3+ earners (3,846) having the highest median family income of $179,515, while families with no earners (3,772) have the lowest median family income of $75,536, accounting for 11.8% and 11.6% of families, respectively.
| Number of Earners | # Families | Median Income |
| No Earners | 3,772 (11.6%) | $75,536 |
| 1 Earner | 8,746 (26.8%) | $95,000 |
| 2 Earners | 16,258 (49.8%) | $151,039 |
| 3+ Earners | 3,846 (11.8%) | $179,515 |
| Total | 32,622 (100.0%) | $131,766 |
Household Income in Arvada
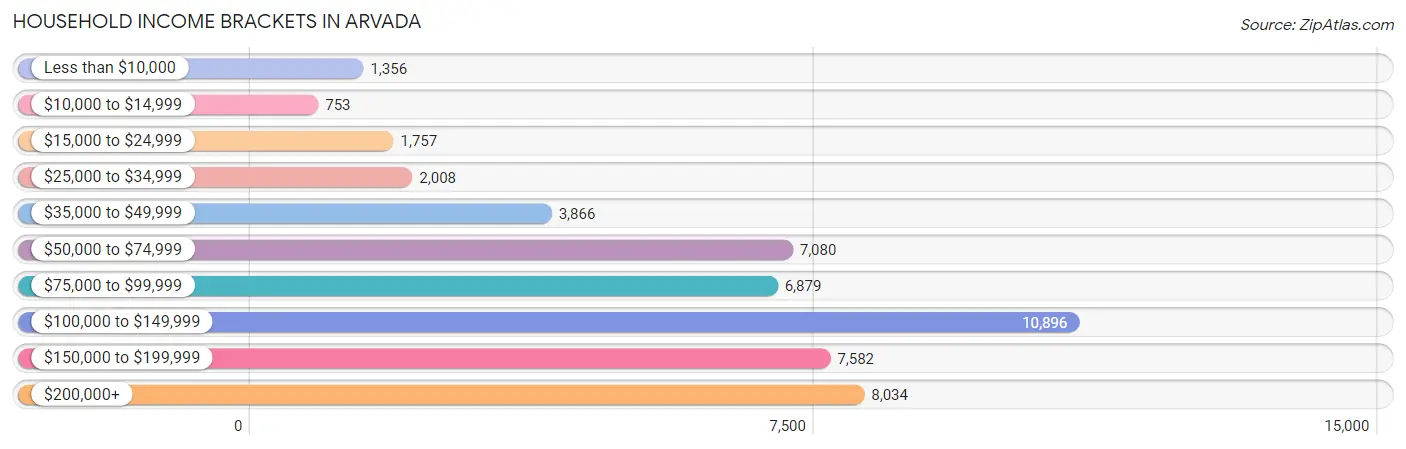
Household Income Brackets in Arvada
With 10,896 households falling in the category, the $100,000 to $149,999 income range is the most frequent in Arvada, accounting for 21.7% of all households. In contrast, only 753 households (1.5%) fall into the $10,000 to $14,999 income bracket, making it the least populous group.
| Income Bracket | # Households | % Households |
| Less than $10,000 | 1,356 | 2.7% |
| $10,000 to $14,999 | 753 | 1.5% |
| $15,000 to $24,999 | 1,757 | 3.5% |
| $25,000 to $34,999 | 2,008 | 4.0% |
| $35,000 to $49,999 | 3,866 | 7.7% |
| $50,000 to $74,999 | 7,080 | 14.1% |
| $75,000 to $99,999 | 6,879 | 13.7% |
| $100,000 to $149,999 | 10,896 | 21.7% |
| $150,000 to $199,999 | 7,582 | 15.1% |
| $200,000+ | 8,034 | 16.0% |
Household Income by Householder Age in Arvada
The median household income in Arvada is $106,014, with the highest median household income of $125,870 found in the 45 to 64 years age bracket for the primary householder. A total of 17,798 households (35.4%) fall into this category. Meanwhile, the 15 to 24 years age bracket for the primary householder has the lowest median household income of $69,048, with 1,166 households (2.3%) in this group.
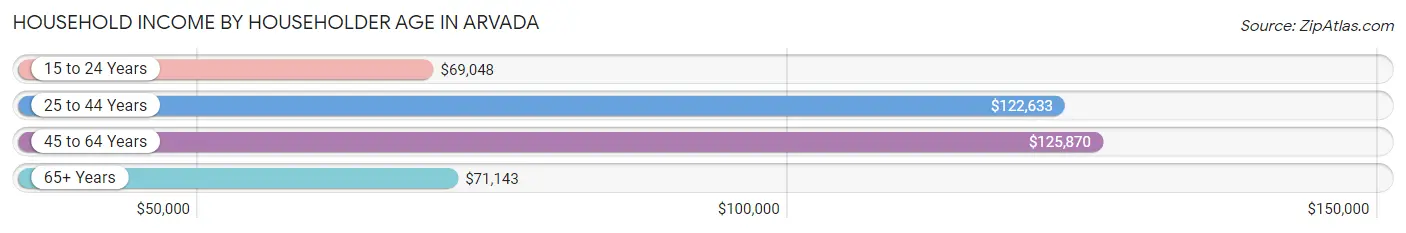
| Income Bracket | # Households | Median Income |
| 15 to 24 Years | 1,166 (2.3%) | $69,048 |
| 25 to 44 Years | 17,884 (35.6%) | $122,633 |
| 45 to 64 Years | 17,798 (35.4%) | $125,870 |
| 65+ Years | 13,363 (26.6%) | $71,143 |
| Total | 50,211 (100.0%) | $106,014 |
Poverty in Arvada
Income Below Poverty by Sex and Age in Arvada
With 5.2% poverty level for males and 6.4% for females among the residents of Arvada, under 5 year old males and 18 to 24 year old females are the most vulnerable to poverty, with 327 males (10.6%) and 630 females (14.9%) in their respective age groups living below the poverty level.
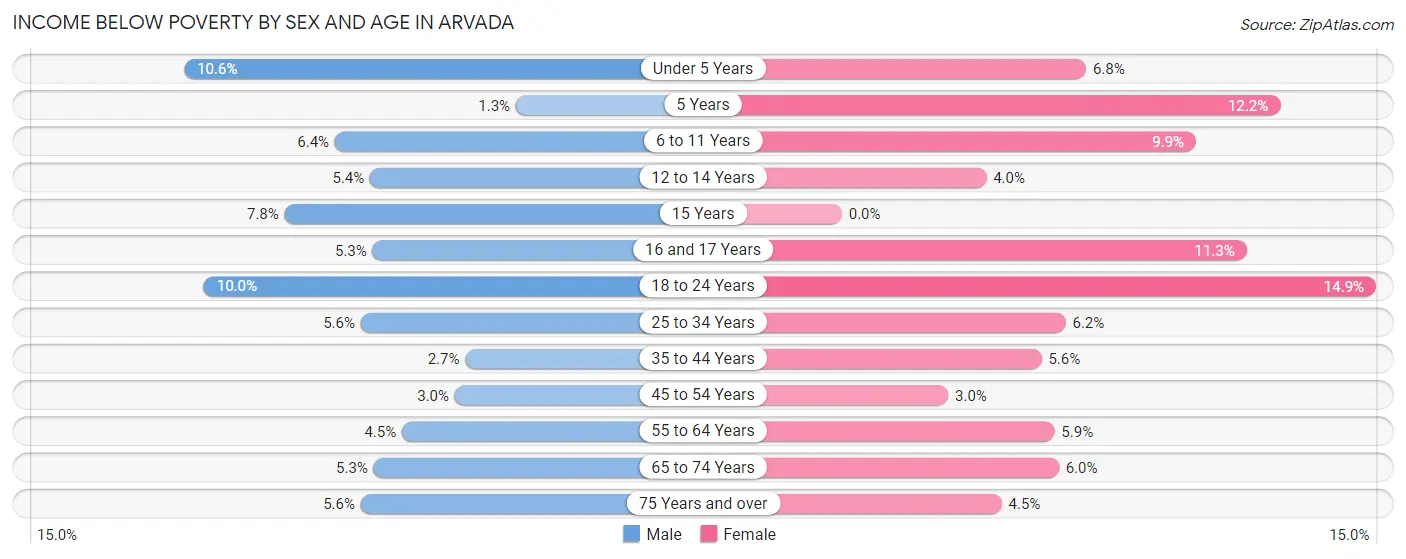
| Age Bracket | Male | Female |
| Under 5 Years | 327 (10.6%) | 220 (6.8%) |
| 5 Years | 10 (1.3%) | 98 (12.2%) |
| 6 to 11 Years | 305 (6.4%) | 381 (9.9%) |
| 12 to 14 Years | 109 (5.4%) | 72 (4.0%) |
| 15 Years | 57 (7.8%) | 0 (0.0%) |
| 16 and 17 Years | 79 (5.3%) | 161 (11.3%) |
| 18 to 24 Years | 442 (10.0%) | 630 (14.9%) |
| 25 to 34 Years | 539 (5.6%) | 535 (6.2%) |
| 35 to 44 Years | 250 (2.7%) | 517 (5.6%) |
| 45 to 54 Years | 253 (3.0%) | 241 (3.0%) |
| 55 to 64 Years | 323 (4.5%) | 454 (5.9%) |
| 65 to 74 Years | 333 (5.3%) | 422 (6.0%) |
| 75 Years and over | 180 (5.6%) | 209 (4.4%) |
| Total | 3,207 (5.2%) | 3,940 (6.4%) |
Income Above Poverty by Sex and Age in Arvada
According to the poverty statistics in Arvada, males aged 5 years and females aged 15 years are the age groups that are most secure financially, with 98.7% of males and 100.0% of females in these age groups living above the poverty line.
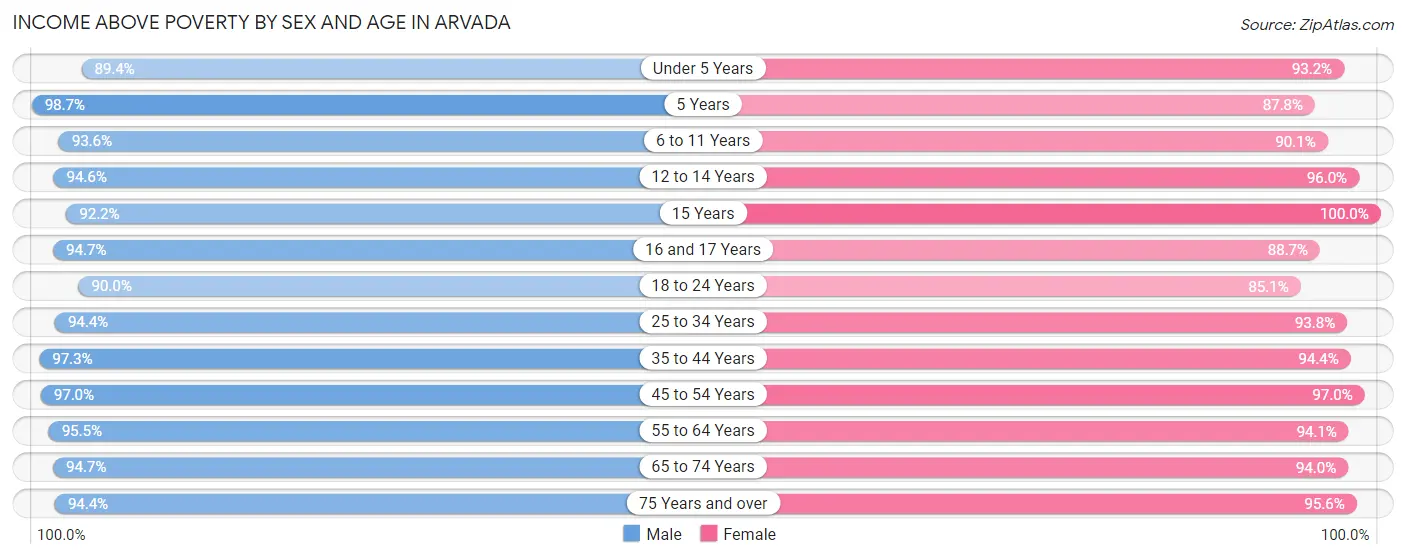
| Age Bracket | Male | Female |
| Under 5 Years | 2,769 (89.4%) | 3,015 (93.2%) |
| 5 Years | 747 (98.7%) | 705 (87.8%) |
| 6 to 11 Years | 4,491 (93.6%) | 3,485 (90.1%) |
| 12 to 14 Years | 1,917 (94.6%) | 1,721 (96.0%) |
| 15 Years | 678 (92.2%) | 565 (100.0%) |
| 16 and 17 Years | 1,410 (94.7%) | 1,267 (88.7%) |
| 18 to 24 Years | 3,975 (90.0%) | 3,608 (85.1%) |
| 25 to 34 Years | 9,023 (94.4%) | 8,058 (93.8%) |
| 35 to 44 Years | 8,915 (97.3%) | 8,784 (94.4%) |
| 45 to 54 Years | 8,135 (97.0%) | 7,911 (97.0%) |
| 55 to 64 Years | 6,870 (95.5%) | 7,219 (94.1%) |
| 65 to 74 Years | 5,979 (94.7%) | 6,561 (94.0%) |
| 75 Years and over | 3,009 (94.4%) | 4,490 (95.6%) |
| Total | 57,918 (94.8%) | 57,389 (93.6%) |
Income Below Poverty Among Married-Couple Families in Arvada
The poverty statistics for married-couple families in Arvada show that 1.4% or 363 of the total 26,455 families live below the poverty line. Families with 5 or more children have the highest poverty rate of 45.2%, comprising of 90 families. On the other hand, families with 1 or 2 children have the lowest poverty rate of 0.7%, which includes 59 families.
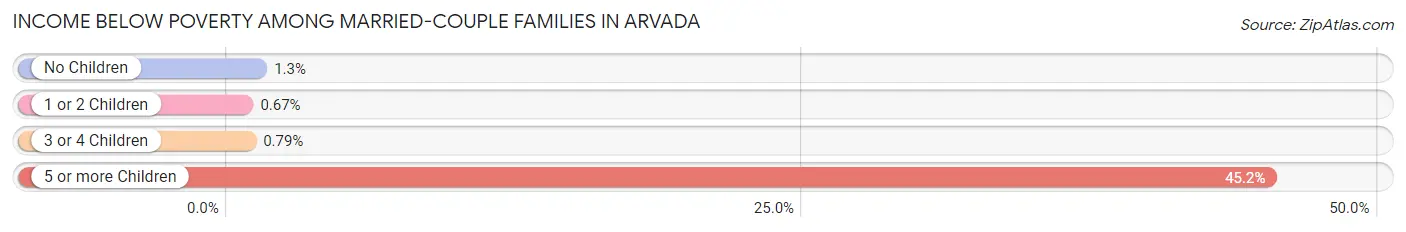
| Children | Above Poverty | Below Poverty |
| No Children | 15,583 (98.7%) | 201 (1.3%) |
| 1 or 2 Children | 8,764 (99.3%) | 59 (0.7%) |
| 3 or 4 Children | 1,636 (99.2%) | 13 (0.8%) |
| 5 or more Children | 109 (54.8%) | 90 (45.2%) |
| Total | 26,092 (98.6%) | 363 (1.4%) |
Income Below Poverty Among Single-Parent Households in Arvada
According to the poverty data in Arvada, 5.5% or 114 single-father households and 11.9% or 489 single-mother households are living below the poverty line. Among single-father households, those with 1 or 2 children have the highest poverty rate, with 92 households (9.4%) experiencing poverty. Likewise, among single-mother households, those with 5 or more children have the highest poverty rate, with 47 households (100.0%) falling below the poverty line.
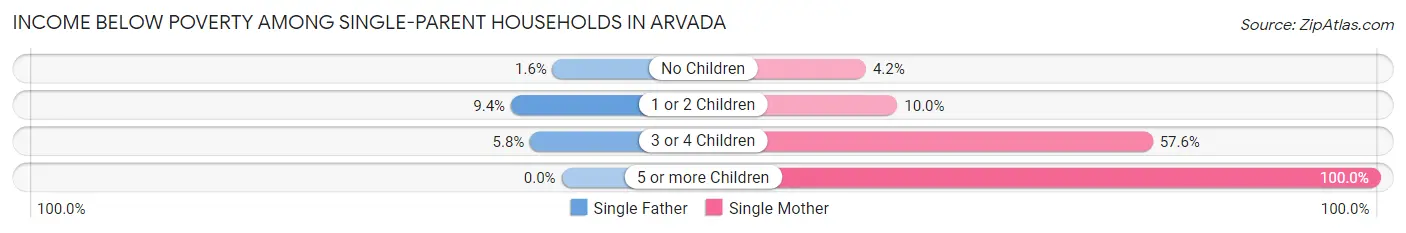
| Children | Single Father | Single Mother |
| No Children | 16 (1.6%) | 66 (4.2%) |
| 1 or 2 Children | 92 (9.4%) | 220 (10.0%) |
| 3 or 4 Children | 6 (5.8%) | 156 (57.6%) |
| 5 or more Children | 0 (0.0%) | 47 (100.0%) |
| Total | 114 (5.5%) | 489 (11.9%) |
Income Below Poverty Among Married-Couple vs Single-Parent Households in Arvada
The poverty data for Arvada shows that 363 of the married-couple family households (1.4%) and 603 of the single-parent households (9.8%) are living below the poverty level. Within the married-couple family households, those with 5 or more children have the highest poverty rate, with 90 households (45.2%) falling below the poverty line. Among the single-parent households, those with 5 or more children have the highest poverty rate, with 47 household (100.0%) living below poverty.
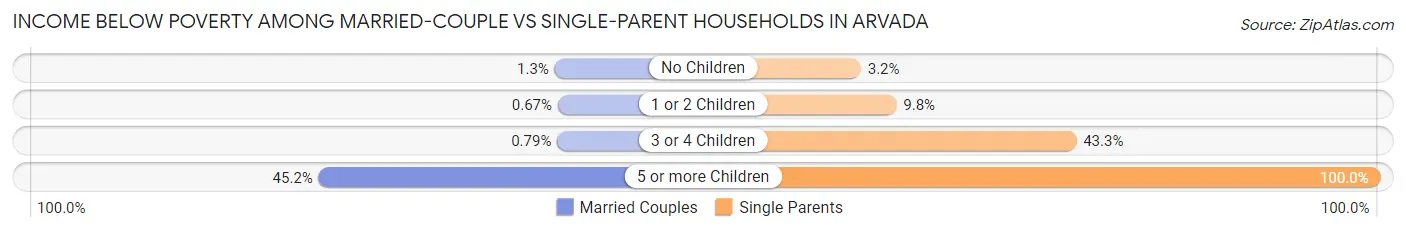
| Children | Married-Couple Families | Single-Parent Households |
| No Children | 201 (1.3%) | 82 (3.2%) |
| 1 or 2 Children | 59 (0.7%) | 312 (9.8%) |
| 3 or 4 Children | 13 (0.8%) | 162 (43.3%) |
| 5 or more Children | 90 (45.2%) | 47 (100.0%) |
| Total | 363 (1.4%) | 603 (9.8%) |
Race in Arvada
The most populous races in Arvada are White / Caucasian (103,986 | 84.5%), Hispanic or Latino (18,749 | 15.2%), and Two or more Races (10,581 | 8.6%).
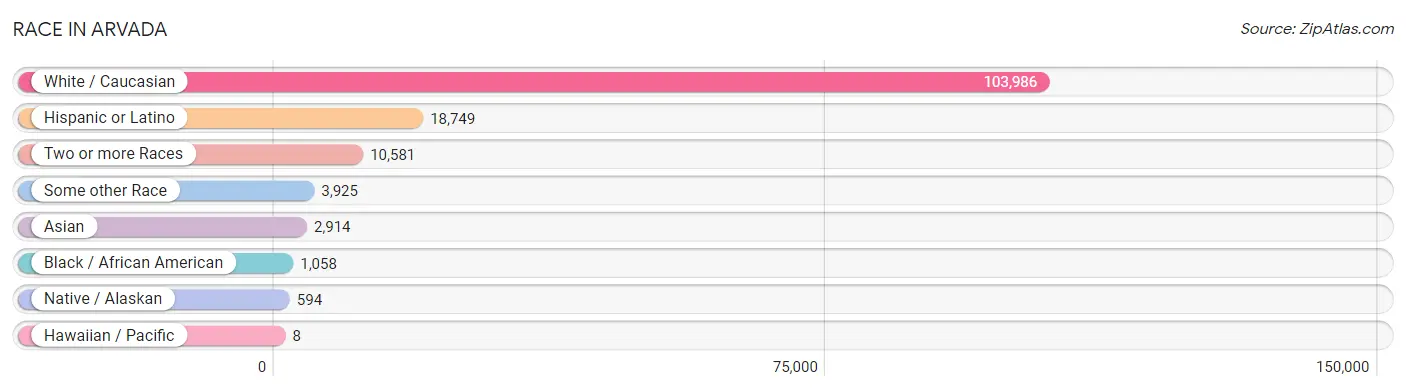
| Race | # Population | % Population |
| Asian | 2,914 | 2.4% |
| Black / African American | 1,058 | 0.9% |
| Hawaiian / Pacific | 8 | 0.0% |
| Hispanic or Latino | 18,749 | 15.2% |
| Native / Alaskan | 594 | 0.5% |
| White / Caucasian | 103,986 | 84.5% |
| Two or more Races | 10,581 | 8.6% |
| Some other Race | 3,925 | 3.2% |
| Total | 123,066 | 100.0% |
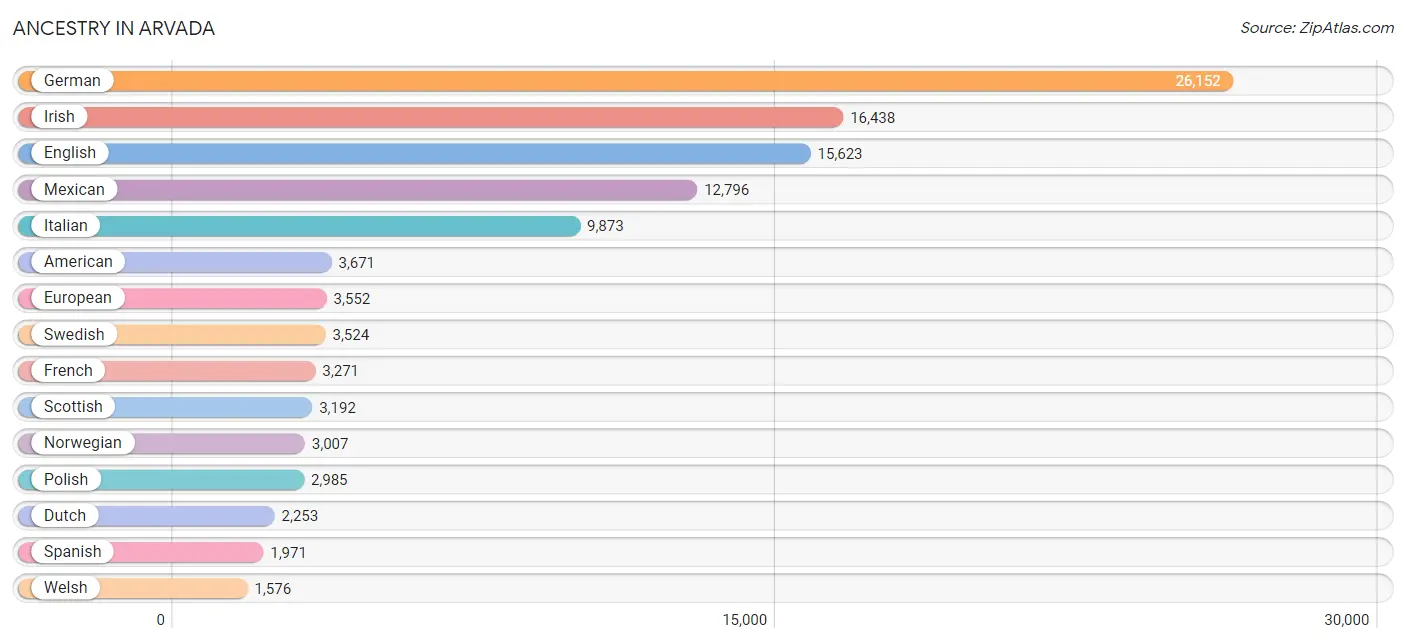
Ancestry in Arvada
The most populous ancestries reported in Arvada are German (26,152 | 21.2%), Irish (16,438 | 13.4%), English (15,623 | 12.7%), Mexican (12,796 | 10.4%), and Italian (9,873 | 8.0%), together accounting for 65.7% of all Arvada residents.
| Ancestry | # Population | % Population |
| Afghan | 68 | 0.1% |
| African | 160 | 0.1% |
| American | 3,671 | 3.0% |
| Apache | 159 | 0.1% |
| Arab | 805 | 0.6% |
| Argentinean | 56 | 0.1% |
| Armenian | 79 | 0.1% |
| Australian | 15 | 0.0% |
| Austrian | 310 | 0.3% |
| Bangladeshi | 248 | 0.2% |
| Basque | 24 | 0.0% |
| Belgian | 229 | 0.2% |
| Bhutanese | 524 | 0.4% |
| Blackfeet | 19 | 0.0% |
| Brazilian | 130 | 0.1% |
| British | 918 | 0.7% |
| Bulgarian | 38 | 0.0% |
| Burmese | 446 | 0.4% |
| Cajun | 7 | 0.0% |
| Canadian | 224 | 0.2% |
| Celtic | 31 | 0.0% |
| Central American | 539 | 0.4% |
| Central American Indian | 77 | 0.1% |
| Cherokee | 223 | 0.2% |
| Cheyenne | 32 | 0.0% |
| Chickasaw | 29 | 0.0% |
| Chilean | 39 | 0.0% |
| Chippewa | 8 | 0.0% |
| Choctaw | 348 | 0.3% |
| Colombian | 36 | 0.0% |
| Comanche | 39 | 0.0% |
| Creek | 60 | 0.1% |
| Croatian | 247 | 0.2% |
| Cuban | 137 | 0.1% |
| Czech | 1,250 | 1.0% |
| Czechoslovakian | 134 | 0.1% |
| Danish | 1,269 | 1.0% |
| Dominican | 247 | 0.2% |
| Dutch | 2,253 | 1.8% |
| Eastern European | 417 | 0.3% |
| Ecuadorian | 89 | 0.1% |
| Egyptian | 37 | 0.0% |
| English | 15,623 | 12.7% |
| Estonian | 11 | 0.0% |
| Ethiopian | 94 | 0.1% |
| European | 3,552 | 2.9% |
| Filipino | 78 | 0.1% |
| Finnish | 450 | 0.4% |
| French | 3,271 | 2.7% |
| French American Indian | 9 | 0.0% |
| French Canadian | 513 | 0.4% |
| German | 26,152 | 21.2% |
| Greek | 721 | 0.6% |
| Guamanian / Chamorro | 43 | 0.0% |
| Guatemalan | 155 | 0.1% |
| Honduran | 10 | 0.0% |
| Hopi | 46 | 0.0% |
| Hungarian | 438 | 0.4% |
| Icelander | 29 | 0.0% |
| Indian (Asian) | 681 | 0.5% |
| Inupiat | 27 | 0.0% |
| Iranian | 97 | 0.1% |
| Irish | 16,438 | 13.4% |
| Iroquois | 11 | 0.0% |
| Italian | 9,873 | 8.0% |
| Jamaican | 22 | 0.0% |
| Jordanian | 31 | 0.0% |
| Kenyan | 19 | 0.0% |
| Korean | 468 | 0.4% |
| Laotian | 74 | 0.1% |
| Latvian | 20 | 0.0% |
| Lebanese | 229 | 0.2% |
| Lithuanian | 200 | 0.2% |
| Macedonian | 120 | 0.1% |
| Malaysian | 115 | 0.1% |
| Mexican | 12,796 | 10.4% |
| Mexican American Indian | 67 | 0.1% |
| Mongolian | 3 | 0.0% |
| Moroccan | 29 | 0.0% |
| Native Hawaiian | 133 | 0.1% |
| Navajo | 351 | 0.3% |
| New Zealander | 36 | 0.0% |
| Nicaraguan | 30 | 0.0% |
| Northern European | 391 | 0.3% |
| Norwegian | 3,007 | 2.4% |
| Osage | 23 | 0.0% |
| Pakistani | 62 | 0.1% |
| Paraguayan | 17 | 0.0% |
| Pennsylvania German | 43 | 0.0% |
| Peruvian | 137 | 0.1% |
| Polish | 2,985 | 2.4% |
| Portuguese | 264 | 0.2% |
| Potawatomi | 8 | 0.0% |
| Pueblo | 70 | 0.1% |
| Puerto Rican | 406 | 0.3% |
| Romanian | 134 | 0.1% |
| Russian | 1,313 | 1.1% |
| Salvadoran | 344 | 0.3% |
| Scandinavian | 741 | 0.6% |
| Scotch-Irish | 1,239 | 1.0% |
| Scottish | 3,192 | 2.6% |
| Serbian | 151 | 0.1% |
| Sioux | 67 | 0.1% |
| Slavic | 151 | 0.1% |
| Slovak | 109 | 0.1% |
| Slovene | 79 | 0.1% |
| South African | 72 | 0.1% |
| South American | 383 | 0.3% |
| Spaniard | 1,079 | 0.9% |
| Spanish | 1,971 | 1.6% |
| Spanish American | 235 | 0.2% |
| Spanish American Indian | 13 | 0.0% |
| Sri Lankan | 610 | 0.5% |
| Subsaharan African | 385 | 0.3% |
| Sudanese | 14 | 0.0% |
| Swedish | 3,524 | 2.9% |
| Swiss | 331 | 0.3% |
| Syrian | 26 | 0.0% |
| Thai | 733 | 0.6% |
| Tlingit-Haida | 2 | 0.0% |
| Turkish | 60 | 0.1% |
| Ukrainian | 525 | 0.4% |
| Venezuelan | 9 | 0.0% |
| Welsh | 1,576 | 1.3% |
| Yugoslavian | 119 | 0.1% | View All 125 Rows |
Immigrants in Arvada
The most numerous immigrant groups reported in Arvada came from Asia (1,994 | 1.6%), Europe (1,913 | 1.5%), Latin America (1,842 | 1.5%), Central America (1,413 | 1.1%), and Mexico (1,202 | 1.0%), together accounting for 6.8% of all Arvada residents.
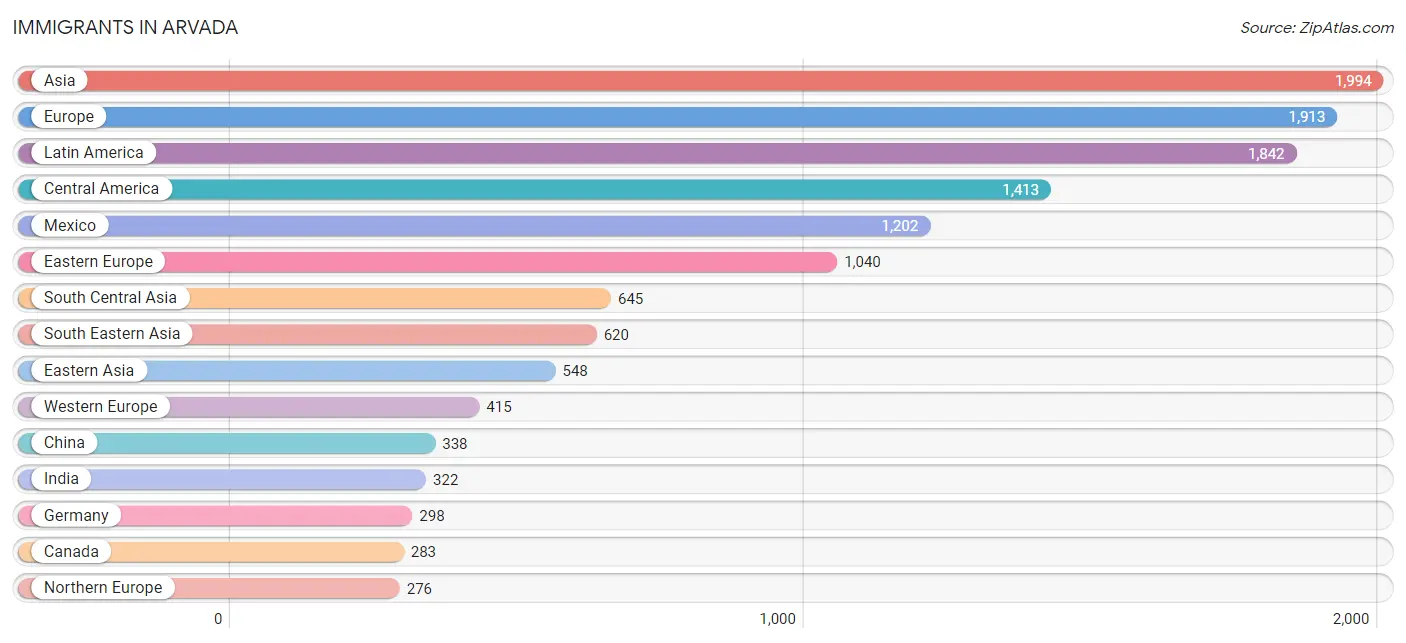
| Immigration Origin | # Population | % Population |
| Afghanistan | 68 | 0.1% |
| Africa | 259 | 0.2% |
| Argentina | 26 | 0.0% |
| Armenia | 2 | 0.0% |
| Asia | 1,994 | 1.6% |
| Australia | 38 | 0.0% |
| Austria | 4 | 0.0% |
| Belarus | 36 | 0.0% |
| Belgium | 23 | 0.0% |
| Bosnia and Herzegovina | 32 | 0.0% |
| Brazil | 96 | 0.1% |
| Bulgaria | 10 | 0.0% |
| Canada | 283 | 0.2% |
| Caribbean | 171 | 0.1% |
| Central America | 1,413 | 1.1% |
| Chile | 15 | 0.0% |
| China | 338 | 0.3% |
| Colombia | 21 | 0.0% |
| Congo | 10 | 0.0% |
| Cuba | 22 | 0.0% |
| Czechoslovakia | 102 | 0.1% |
| Denmark | 31 | 0.0% |
| Dominican Republic | 144 | 0.1% |
| Eastern Africa | 115 | 0.1% |
| Eastern Asia | 548 | 0.4% |
| Eastern Europe | 1,040 | 0.9% |
| Ecuador | 27 | 0.0% |
| Egypt | 32 | 0.0% |
| El Salvador | 110 | 0.1% |
| England | 97 | 0.1% |
| Ethiopia | 98 | 0.1% |
| Europe | 1,913 | 1.5% |
| France | 35 | 0.0% |
| Germany | 298 | 0.2% |
| Greece | 15 | 0.0% |
| Guatemala | 83 | 0.1% |
| Honduras | 6 | 0.0% |
| Hong Kong | 13 | 0.0% |
| Hungary | 22 | 0.0% |
| India | 322 | 0.3% |
| Iran | 77 | 0.1% |
| Ireland | 10 | 0.0% |
| Israel | 12 | 0.0% |
| Italy | 81 | 0.1% |
| Jamaica | 5 | 0.0% |
| Japan | 17 | 0.0% |
| Jordan | 132 | 0.1% |
| Korea | 193 | 0.2% |
| Laos | 70 | 0.1% |
| Latin America | 1,842 | 1.5% |
| Latvia | 34 | 0.0% |
| Lebanon | 23 | 0.0% |
| Malaysia | 5 | 0.0% |
| Mexico | 1,202 | 1.0% |
| Middle Africa | 10 | 0.0% |
| Moldova | 18 | 0.0% |
| Morocco | 27 | 0.0% |
| Nepal | 171 | 0.1% |
| Netherlands | 47 | 0.0% |
| Nicaragua | 12 | 0.0% |
| Northern Africa | 59 | 0.1% |
| Northern Europe | 276 | 0.2% |
| Norway | 5 | 0.0% |
| Oceania | 79 | 0.1% |
| Peru | 73 | 0.1% |
| Philippines | 234 | 0.2% |
| Poland | 231 | 0.2% |
| Portugal | 8 | 0.0% |
| Romania | 71 | 0.1% |
| Russia | 191 | 0.2% |
| Scotland | 11 | 0.0% |
| South Africa | 74 | 0.1% |
| South America | 258 | 0.2% |
| South Central Asia | 645 | 0.5% |
| South Eastern Asia | 620 | 0.5% |
| Southern Europe | 182 | 0.2% |
| Spain | 78 | 0.1% |
| Sweden | 26 | 0.0% |
| Switzerland | 8 | 0.0% |
| Taiwan | 62 | 0.1% |
| Thailand | 77 | 0.1% |
| Turkey | 12 | 0.0% |
| Ukraine | 197 | 0.2% |
| Vietnam | 234 | 0.2% |
| Western Asia | 181 | 0.2% |
| Western Europe | 415 | 0.3% | View All 86 Rows |
Sex and Age in Arvada
Sex and Age in Arvada
The most populous age groups in Arvada are 30 to 34 Years (5,146 | 8.4%) for men and 30 to 34 Years (5,042 | 8.2%) for women.
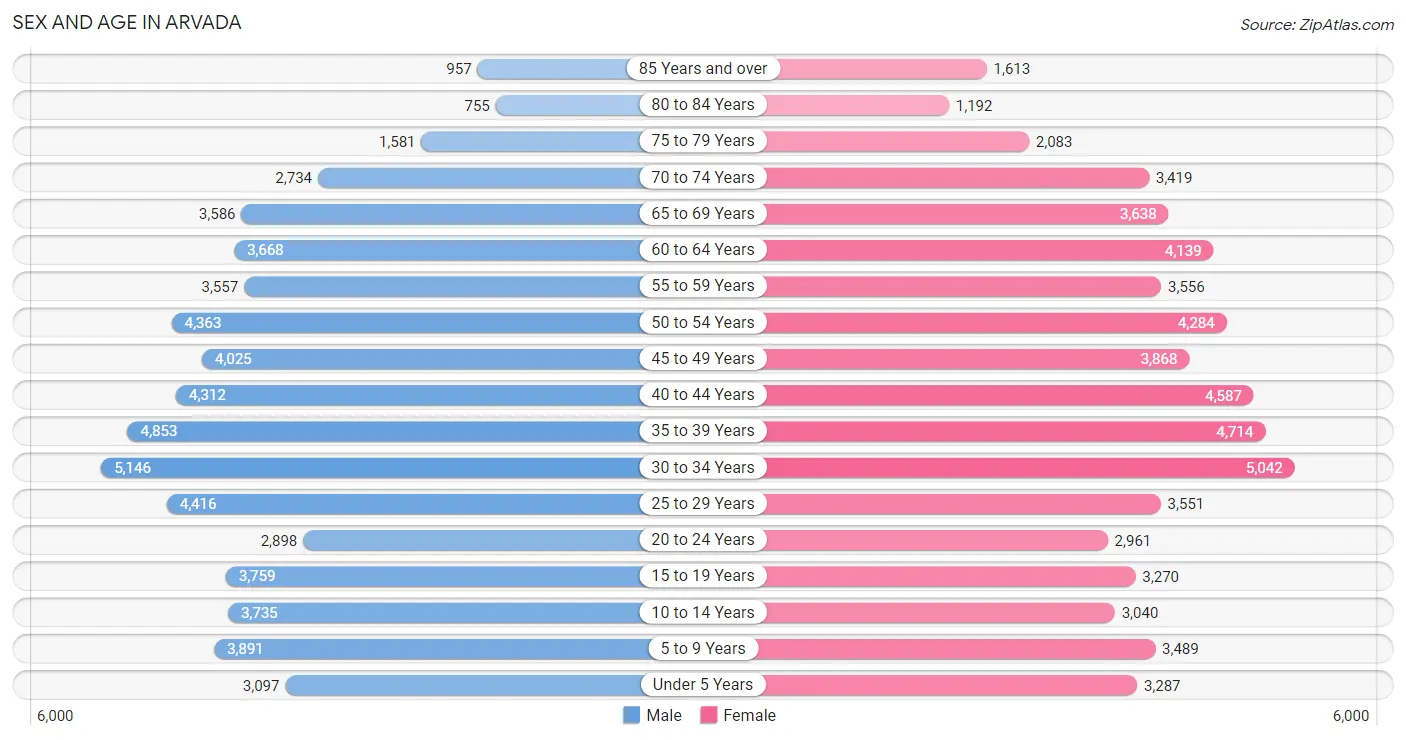
| Age Bracket | Male | Female |
| Under 5 Years | 3,097 (5.1%) | 3,287 (5.3%) |
| 5 to 9 Years | 3,891 (6.3%) | 3,489 (5.7%) |
| 10 to 14 Years | 3,735 (6.1%) | 3,040 (4.9%) |
| 15 to 19 Years | 3,759 (6.1%) | 3,270 (5.3%) |
| 20 to 24 Years | 2,898 (4.7%) | 2,961 (4.8%) |
| 25 to 29 Years | 4,416 (7.2%) | 3,551 (5.8%) |
| 30 to 34 Years | 5,146 (8.4%) | 5,042 (8.2%) |
| 35 to 39 Years | 4,853 (7.9%) | 4,714 (7.6%) |
| 40 to 44 Years | 4,312 (7.0%) | 4,587 (7.4%) |
| 45 to 49 Years | 4,025 (6.6%) | 3,868 (6.3%) |
| 50 to 54 Years | 4,363 (7.1%) | 4,284 (6.9%) |
| 55 to 59 Years | 3,557 (5.8%) | 3,556 (5.8%) |
| 60 to 64 Years | 3,668 (6.0%) | 4,139 (6.7%) |
| 65 to 69 Years | 3,586 (5.9%) | 3,638 (5.9%) |
| 70 to 74 Years | 2,734 (4.5%) | 3,419 (5.5%) |
| 75 to 79 Years | 1,581 (2.6%) | 2,083 (3.4%) |
| 80 to 84 Years | 755 (1.2%) | 1,192 (1.9%) |
| 85 Years and over | 957 (1.6%) | 1,613 (2.6%) |
| Total | 61,333 (100.0%) | 61,733 (100.0%) |
Families and Households in Arvada
Median Family Size in Arvada
The median family size in Arvada is 2.97 persons per family, with married-couple families (26,455 | 81.1%) accounting for the largest median family size of 2.99 persons per family. On the other hand, single male/father families (2,057 | 6.3%) represent the smallest median family size with 2.70 persons per family.
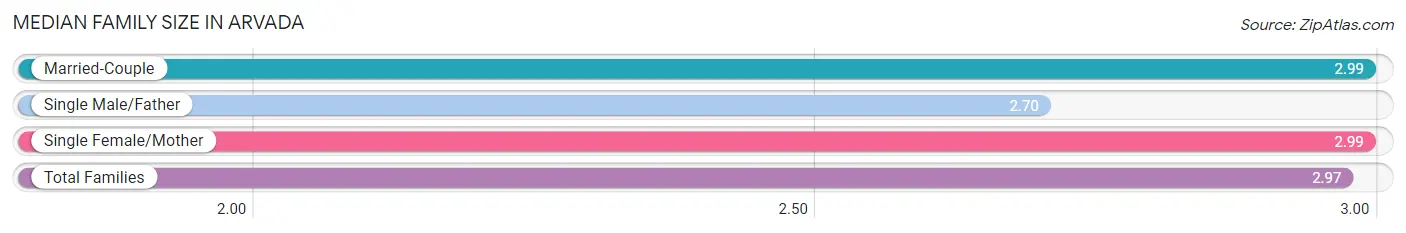
| Family Type | # Families | Family Size |
| Married-Couple | 26,455 (81.1%) | 2.99 |
| Single Male/Father | 2,057 (6.3%) | 2.70 |
| Single Female/Mother | 4,110 (12.6%) | 2.99 |
| Total Families | 32,622 (100.0%) | 2.97 |
Median Household Size in Arvada
The median household size in Arvada is 2.44 persons per household, with single female/mother households (4,110 | 8.2%) accounting for the largest median household size of 3.22 persons per household. non-family households (17,589 | 35.0%) represent the smallest median household size with 1.33 persons per household.
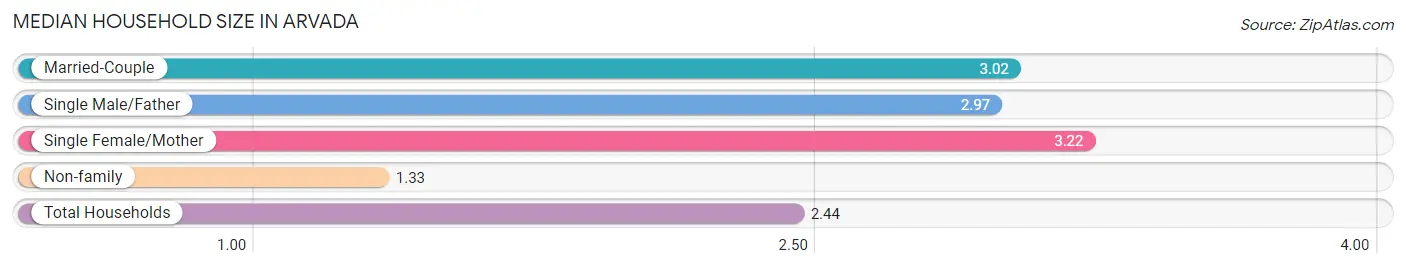
| Household Type | # Households | Household Size |
| Married-Couple | 26,455 (52.7%) | 3.02 |
| Single Male/Father | 2,057 (4.1%) | 2.97 |
| Single Female/Mother | 4,110 (8.2%) | 3.22 |
| Non-family | 17,589 (35.0%) | 1.33 |
| Total Households | 50,211 (100.0%) | 2.44 |
Household Size by Marriage Status in Arvada
Out of a total of 50,211 households in Arvada, 32,622 (65.0%) are family households, while 17,589 (35.0%) are nonfamily households. The most numerous type of family households are 2-person households, comprising 15,272, and the most common type of nonfamily households are 1-person households, comprising 13,314.
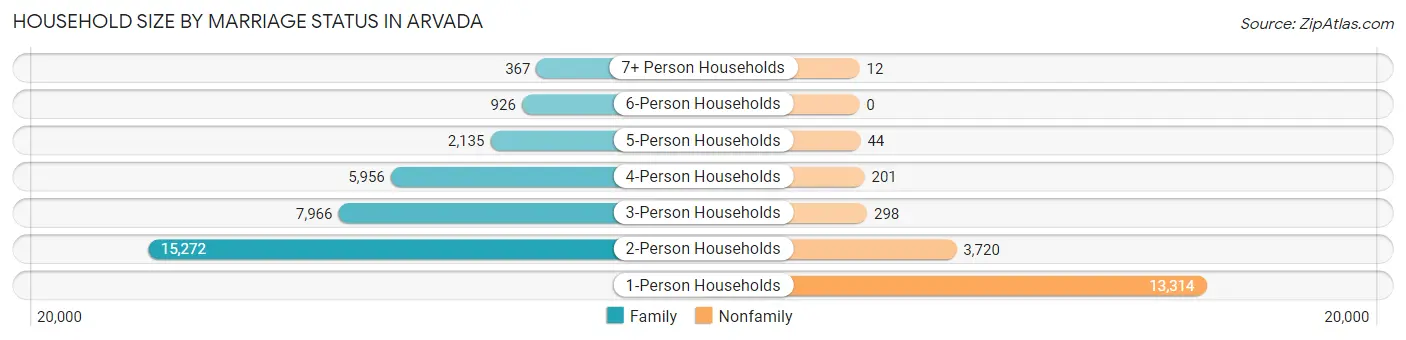
| Household Size | Family Households | Nonfamily Households |
| 1-Person Households | - | 13,314 (26.5%) |
| 2-Person Households | 15,272 (30.4%) | 3,720 (7.4%) |
| 3-Person Households | 7,966 (15.9%) | 298 (0.6%) |
| 4-Person Households | 5,956 (11.9%) | 201 (0.4%) |
| 5-Person Households | 2,135 (4.3%) | 44 (0.1%) |
| 6-Person Households | 926 (1.8%) | 0 (0.0%) |
| 7+ Person Households | 367 (0.7%) | 12 (0.0%) |
| Total | 32,622 (65.0%) | 17,589 (35.0%) |
Female Fertility in Arvada
Fertility by Age in Arvada
Average fertility rate in Arvada is 54.0 births per 1,000 women. Women in the age bracket of 20 to 34 years have the highest fertility rate with 80.0 births per 1,000 women. Women in the age bracket of 20 to 34 years acount for 59.7% of all women with births.
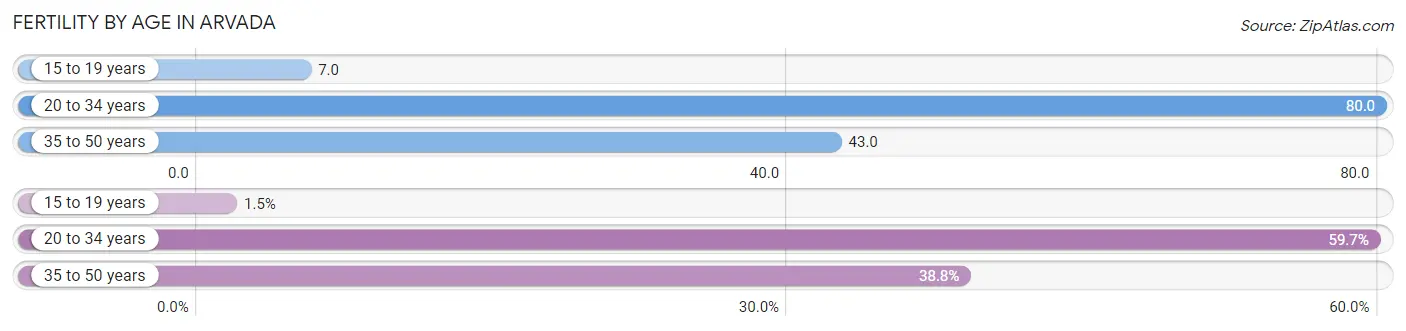
| Age Bracket | Women with Births | Births / 1,000 Women |
| 15 to 19 years | 23 (1.5%) | 7.0 |
| 20 to 34 years | 925 (59.7%) | 80.0 |
| 35 to 50 years | 602 (38.8%) | 43.0 |
| Total | 1,550 (100.0%) | 54.0 |
Fertility by Age by Marriage Status in Arvada
89.7% of women with births (1,550) in Arvada are married. The highest percentage of unmarried women with births falls into 15 to 19 years age bracket with 100.0% of them unmarried at the time of birth, while the lowest percentage of unmarried women with births belong to 35 to 50 years age bracket with 6.0% of them unmarried.
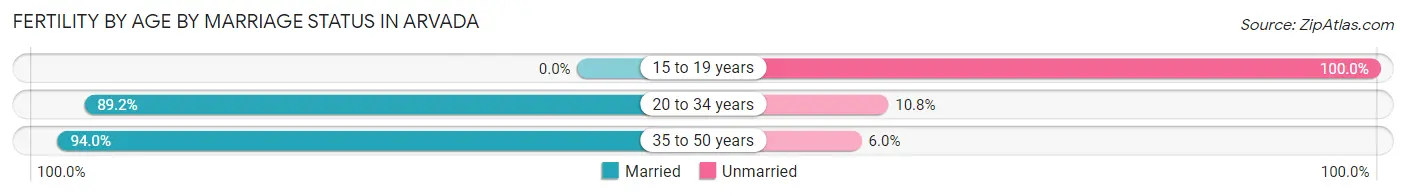
| Age Bracket | Married | Unmarried |
| 15 to 19 years | 0 (0.0%) | 23 (100.0%) |
| 20 to 34 years | 825 (89.2%) | 100 (10.8%) |
| 35 to 50 years | 566 (94.0%) | 36 (6.0%) |
| Total | 1,390 (89.7%) | 160 (10.3%) |
Fertility by Education in Arvada
Average fertility rate in Arvada is 54.0 births per 1,000 women. Women with the education attainment of graduate degree have the highest fertility rate of 112.0 births per 1,000 women, while women with the education attainment of less than high school have the lowest fertility at 3.0 births per 1,000 women. Women with the education attainment of bachelor's degree represent 46.1% of all women with births.
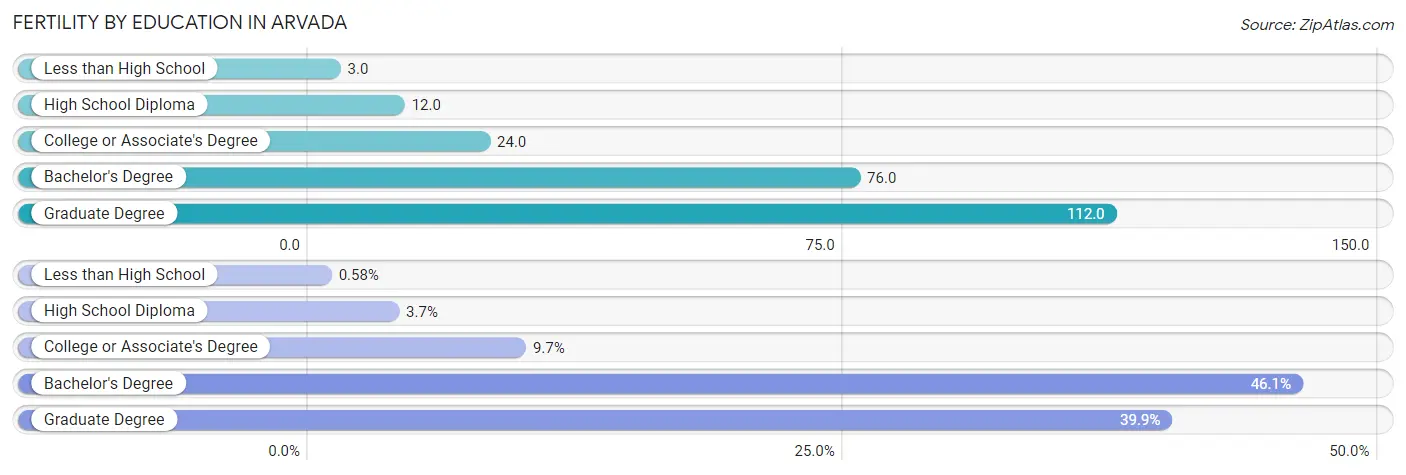
| Educational Attainment | Women with Births | Births / 1,000 Women |
| Less than High School | 9 (0.6%) | 3.0 |
| High School Diploma | 58 (3.7%) | 12.0 |
| College or Associate's Degree | 150 (9.7%) | 24.0 |
| Bachelor's Degree | 714 (46.1%) | 76.0 |
| Graduate Degree | 619 (39.9%) | 112.0 |
| Total | 1,550 (100.0%) | 54.0 |
Fertility by Education by Marriage Status in Arvada
10.3% of women with births in Arvada are unmarried. Women with the educational attainment of bachelor's degree are most likely to be married with 98.9% of them married at childbirth, while women with the educational attainment of less than high school are least likely to be married with 100.0% of them unmarried at childbirth.
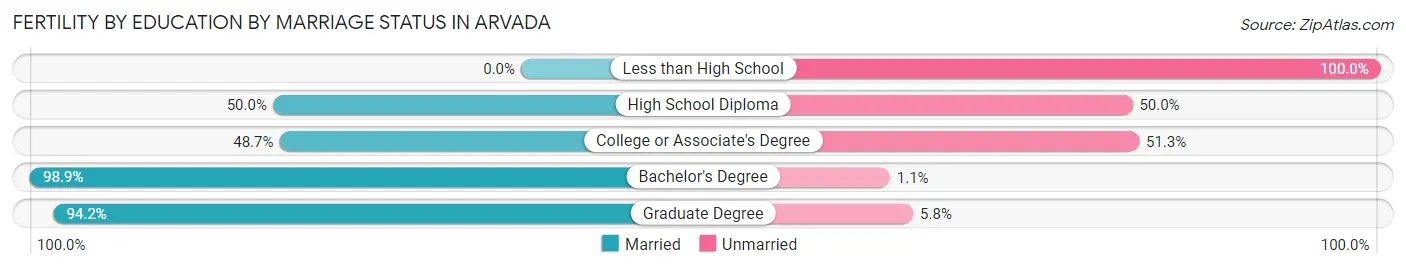
| Educational Attainment | Married | Unmarried |
| Less than High School | 0 (0.0%) | 9 (100.0%) |
| High School Diploma | 29 (50.0%) | 29 (50.0%) |
| College or Associate's Degree | 73 (48.7%) | 77 (51.3%) |
| Bachelor's Degree | 706 (98.9%) | 8 (1.1%) |
| Graduate Degree | 583 (94.2%) | 36 (5.8%) |
| Total | 1,390 (89.7%) | 160 (10.3%) |
Employment Characteristics in Arvada
Employment by Class of Employer in Arvada
Among the 67,855 employed individuals in Arvada, private company employees (46,119 | 68.0%), not-for-profit organizations (5,931 | 8.7%), and local government employees (4,565 | 6.7%) make up the most common classes of employment.
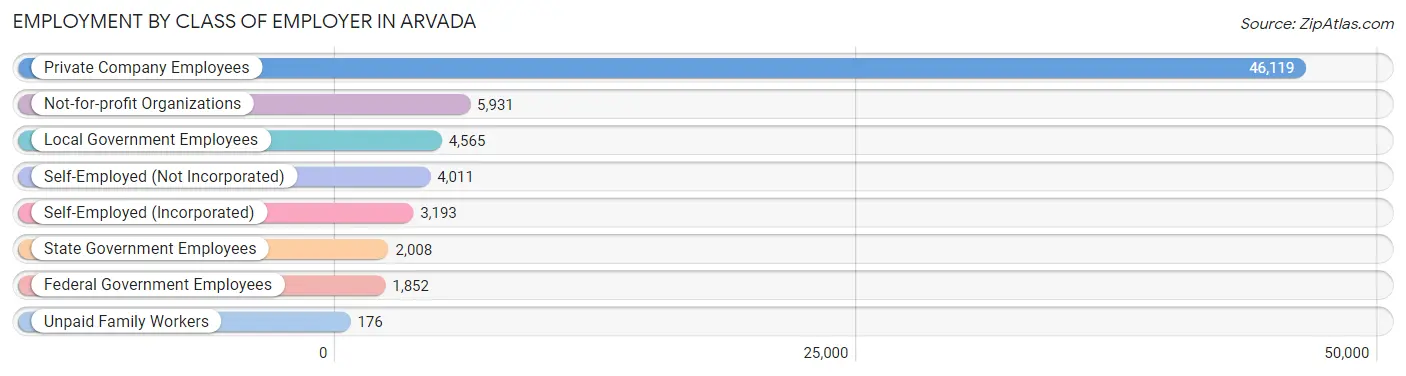
| Employer Class | # Employees | % Employees |
| Private Company Employees | 46,119 | 68.0% |
| Self-Employed (Incorporated) | 3,193 | 4.7% |
| Self-Employed (Not Incorporated) | 4,011 | 5.9% |
| Not-for-profit Organizations | 5,931 | 8.7% |
| Local Government Employees | 4,565 | 6.7% |
| State Government Employees | 2,008 | 3.0% |
| Federal Government Employees | 1,852 | 2.7% |
| Unpaid Family Workers | 176 | 0.3% |
| Total | 67,855 | 100.0% |
Employment Status by Age in Arvada
According to the labor force statistics for Arvada, out of the total population over 16 years of age (101,224), 70.9% or 71,768 individuals are in the labor force, with 3.8% or 2,727 of them unemployed. The age group with the highest labor force participation rate is 25 to 29 years, with 93.1% or 7,417 individuals in the labor force. Within the labor force, the 16 to 19 years age range has the highest percentage of unemployed individuals, with 15.4% or 455 of them being unemployed.
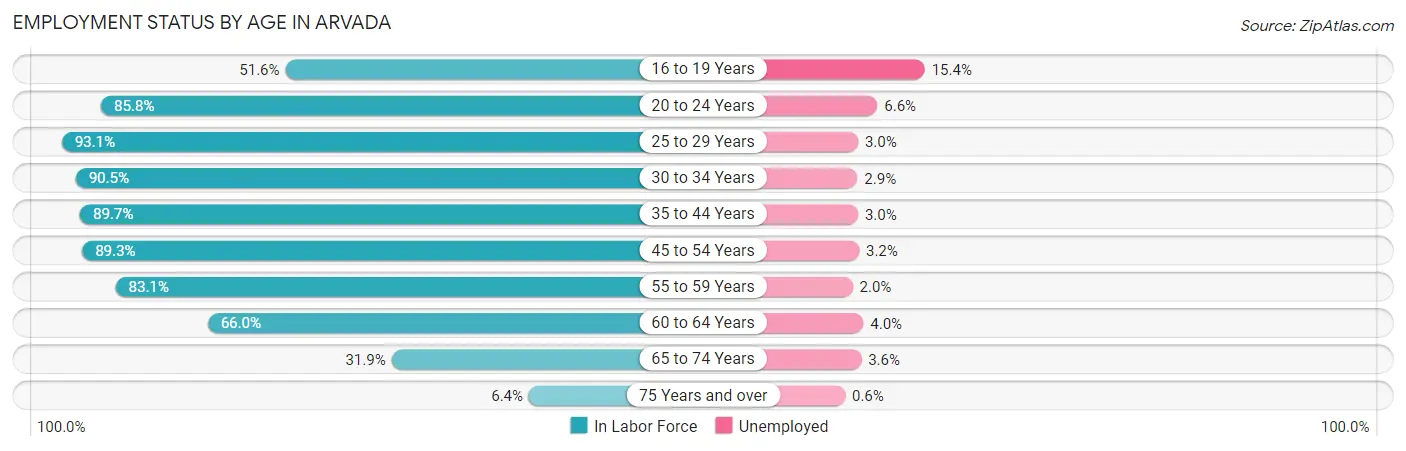
| Age Bracket | In Labor Force | Unemployed |
| 16 to 19 Years | 2,955 (51.6%) | 455 (15.4%) |
| 20 to 24 Years | 5,027 (85.8%) | 332 (6.6%) |
| 25 to 29 Years | 7,417 (93.1%) | 223 (3.0%) |
| 30 to 34 Years | 9,220 (90.5%) | 267 (2.9%) |
| 35 to 44 Years | 16,564 (89.7%) | 497 (3.0%) |
| 45 to 54 Years | 14,770 (89.3%) | 473 (3.2%) |
| 55 to 59 Years | 5,911 (83.1%) | 118 (2.0%) |
| 60 to 64 Years | 5,153 (66.0%) | 206 (4.0%) |
| 65 to 74 Years | 4,267 (31.9%) | 154 (3.6%) |
| 75 Years and over | 524 (6.4%) | 3 (0.6%) |
| Total | 71,768 (70.9%) | 2,727 (3.8%) |
Employment Status by Educational Attainment in Arvada
According to labor force statistics for Arvada, 86.7% of individuals (59,026) out of the total population between 25 and 64 years of age (68,081) are in the labor force, with 3.0% or 1,771 of them being unemployed. The group with the highest labor force participation rate are those with the educational attainment of bachelor's degree or higher, with 90.7% or 31,570 individuals in the labor force. Within the labor force, individuals with high school diploma education have the highest percentage of unemployment, with 4.6% or 484 of them being unemployed.
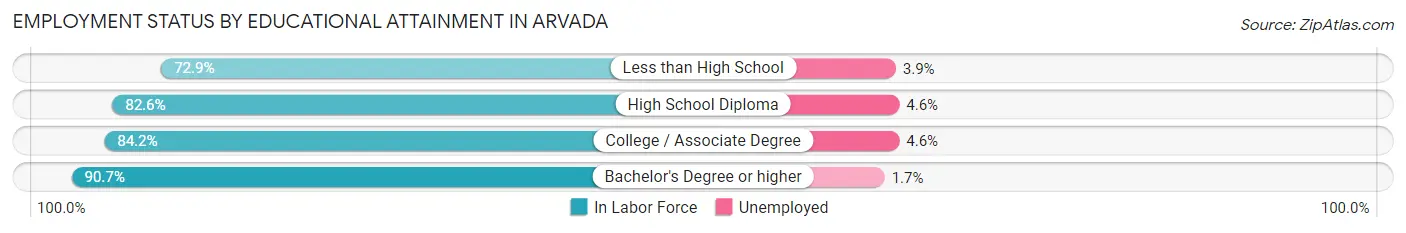
| Educational Attainment | In Labor Force | Unemployed |
| Less than High School | 2,213 (72.9%) | 118 (3.9%) |
| High School Diploma | 10,528 (82.6%) | 586 (4.6%) |
| College / Associate Degree | 14,729 (84.2%) | 805 (4.6%) |
| Bachelor's Degree or higher | 31,570 (90.7%) | 592 (1.7%) |
| Total | 59,026 (86.7%) | 2,042 (3.0%) |
Employment Occupations by Sex in Arvada
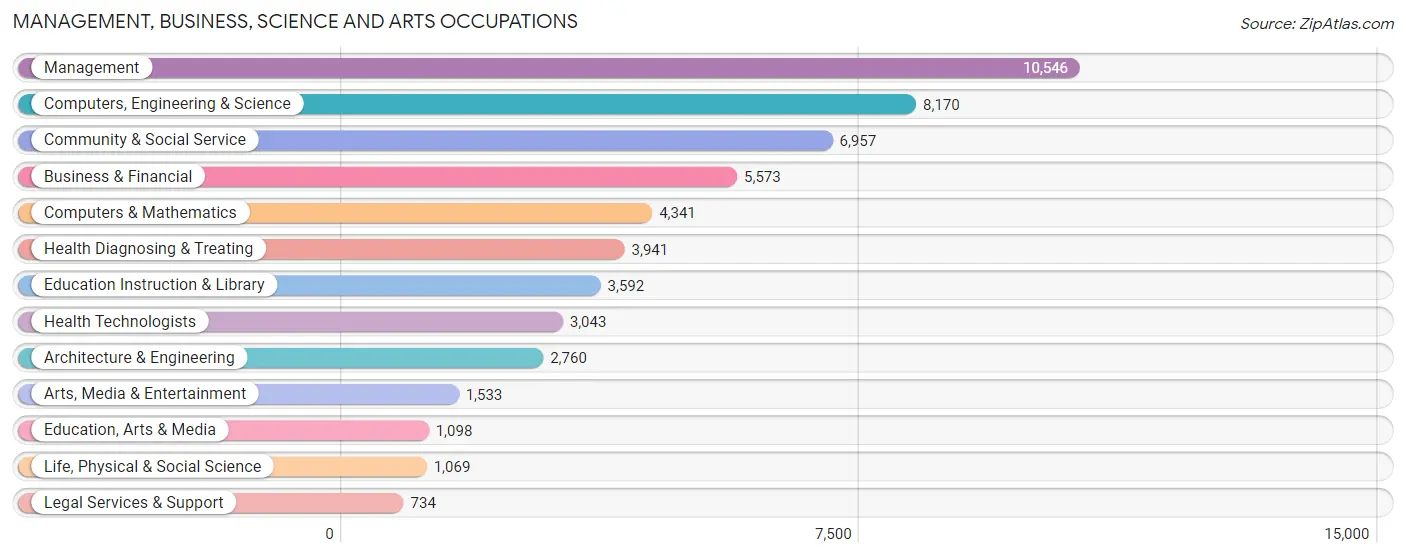
Management, Business, Science and Arts Occupations
The most common Management, Business, Science and Arts occupations in Arvada are Management (10,546 | 15.3%), Computers, Engineering & Science (8,170 | 11.8%), Community & Social Service (6,957 | 10.1%), Business & Financial (5,573 | 8.1%), and Computers & Mathematics (4,341 | 6.3%).
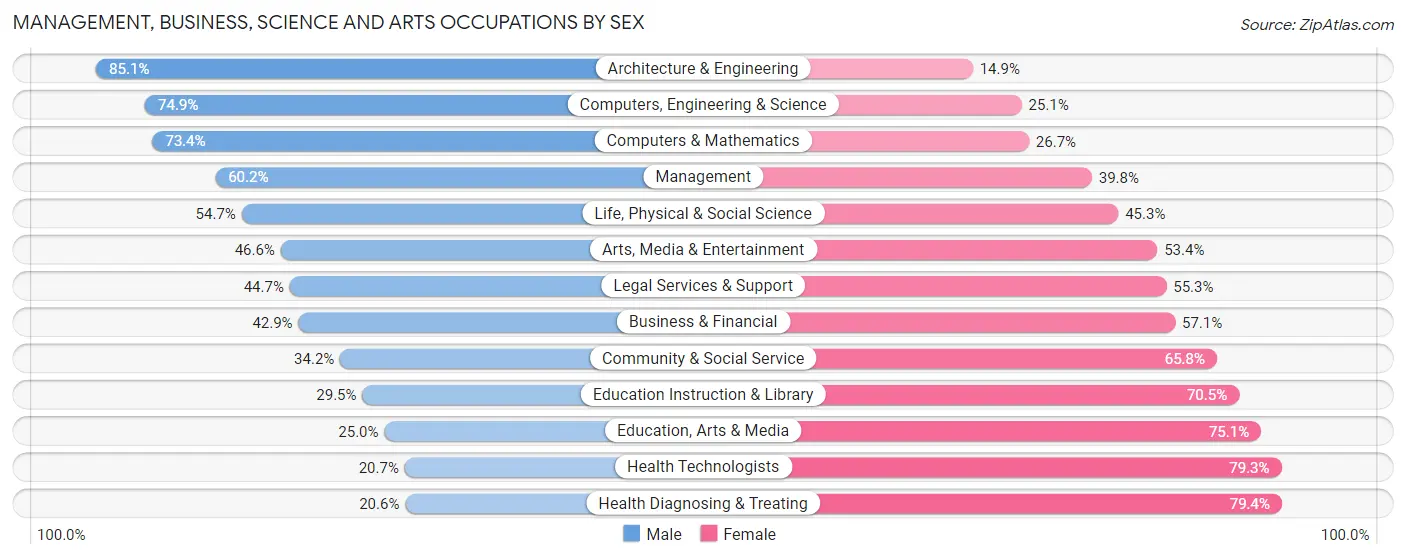
Management, Business, Science and Arts Occupations by Sex
Within the Management, Business, Science and Arts occupations in Arvada, the most male-oriented occupations are Architecture & Engineering (85.1%), Computers, Engineering & Science (74.9%), and Computers & Mathematics (73.4%), while the most female-oriented occupations are Health Diagnosing & Treating (79.4%), Health Technologists (79.3%), and Education, Arts & Media (75.0%).
| Occupation | Male | Female |
| Management | 6,352 (60.2%) | 4,194 (39.8%) |
| Business & Financial | 2,389 (42.9%) | 3,184 (57.1%) |
| Computers, Engineering & Science | 6,117 (74.9%) | 2,053 (25.1%) |
| Computers & Mathematics | 3,184 (73.4%) | 1,157 (26.7%) |
| Architecture & Engineering | 2,348 (85.1%) | 412 (14.9%) |
| Life, Physical & Social Science | 585 (54.7%) | 484 (45.3%) |
| Community & Social Service | 2,377 (34.2%) | 4,580 (65.8%) |
| Education, Arts & Media | 274 (24.9%) | 824 (75.0%) |
| Legal Services & Support | 328 (44.7%) | 406 (55.3%) |
| Education Instruction & Library | 1,061 (29.5%) | 2,531 (70.5%) |
| Arts, Media & Entertainment | 714 (46.6%) | 819 (53.4%) |
| Health Diagnosing & Treating | 812 (20.6%) | 3,129 (79.4%) |
| Health Technologists | 630 (20.7%) | 2,413 (79.3%) |
| Total (Category) | 18,047 (51.3%) | 17,140 (48.7%) |
| Total (Overall) | 36,497 (52.8%) | 32,574 (47.2%) |
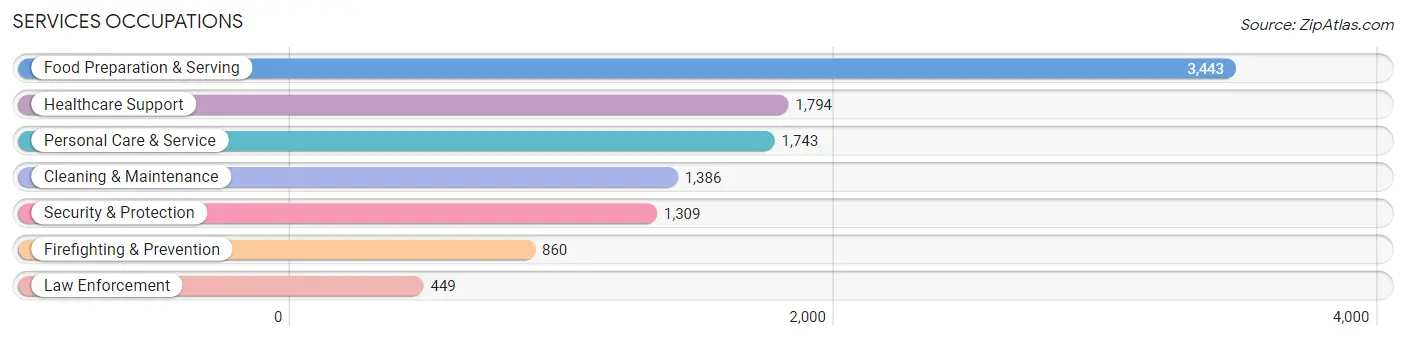
Services Occupations
The most common Services occupations in Arvada are Food Preparation & Serving (3,443 | 5.0%), Healthcare Support (1,794 | 2.6%), Personal Care & Service (1,743 | 2.5%), Cleaning & Maintenance (1,386 | 2.0%), and Security & Protection (1,309 | 1.9%).
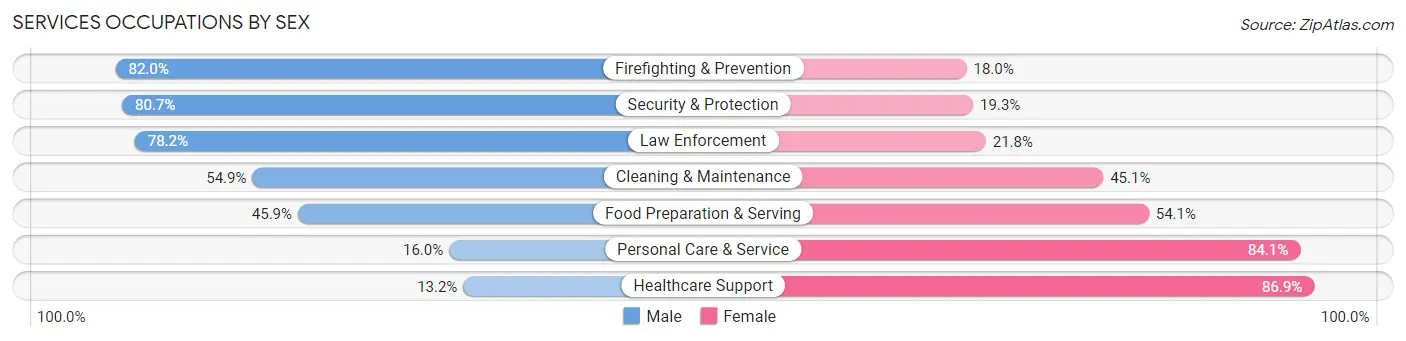
Services Occupations by Sex
Within the Services occupations in Arvada, the most male-oriented occupations are Firefighting & Prevention (82.0%), Security & Protection (80.7%), and Law Enforcement (78.2%), while the most female-oriented occupations are Healthcare Support (86.9%), Personal Care & Service (84.1%), and Food Preparation & Serving (54.1%).
| Occupation | Male | Female |
| Healthcare Support | 236 (13.2%) | 1,558 (86.9%) |
| Security & Protection | 1,056 (80.7%) | 253 (19.3%) |
| Firefighting & Prevention | 705 (82.0%) | 155 (18.0%) |
| Law Enforcement | 351 (78.2%) | 98 (21.8%) |
| Food Preparation & Serving | 1,580 (45.9%) | 1,863 (54.1%) |
| Cleaning & Maintenance | 761 (54.9%) | 625 (45.1%) |
| Personal Care & Service | 278 (16.0%) | 1,465 (84.1%) |
| Total (Category) | 3,911 (40.4%) | 5,764 (59.6%) |
| Total (Overall) | 36,497 (52.8%) | 32,574 (47.2%) |
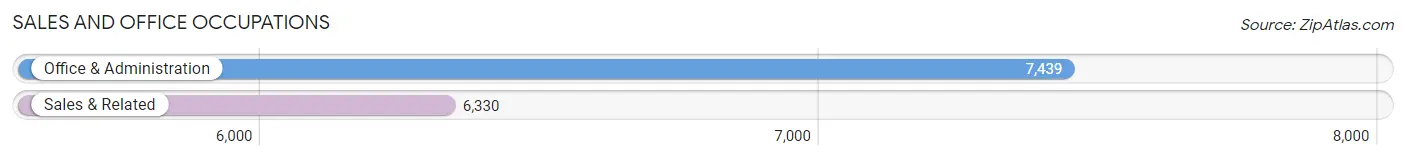
Sales and Office Occupations
The most common Sales and Office occupations in Arvada are Office & Administration (7,439 | 10.8%), and Sales & Related (6,330 | 9.2%).
Sales and Office Occupations by Sex
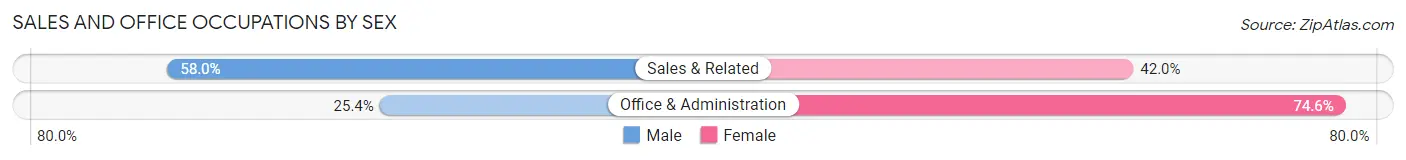
| Occupation | Male | Female |
| Sales & Related | 3,673 (58.0%) | 2,657 (42.0%) |
| Office & Administration | 1,888 (25.4%) | 5,551 (74.6%) |
| Total (Category) | 5,561 (40.4%) | 8,208 (59.6%) |
| Total (Overall) | 36,497 (52.8%) | 32,574 (47.2%) |
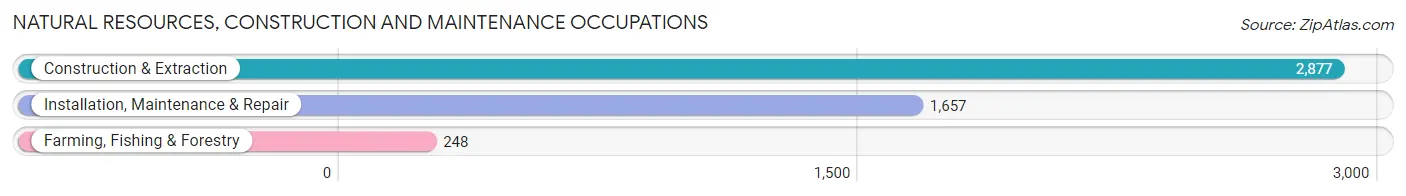
Natural Resources, Construction and Maintenance Occupations
The most common Natural Resources, Construction and Maintenance occupations in Arvada are Construction & Extraction (2,877 | 4.2%), Installation, Maintenance & Repair (1,657 | 2.4%), and Farming, Fishing & Forestry (248 | 0.4%).
Natural Resources, Construction and Maintenance Occupations by Sex
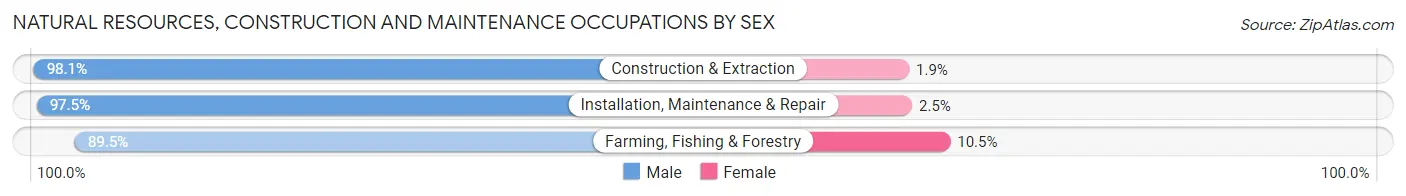
| Occupation | Male | Female |
| Farming, Fishing & Forestry | 222 (89.5%) | 26 (10.5%) |
| Construction & Extraction | 2,822 (98.1%) | 55 (1.9%) |
| Installation, Maintenance & Repair | 1,615 (97.5%) | 42 (2.5%) |
| Total (Category) | 4,659 (97.4%) | 123 (2.6%) |
| Total (Overall) | 36,497 (52.8%) | 32,574 (47.2%) |
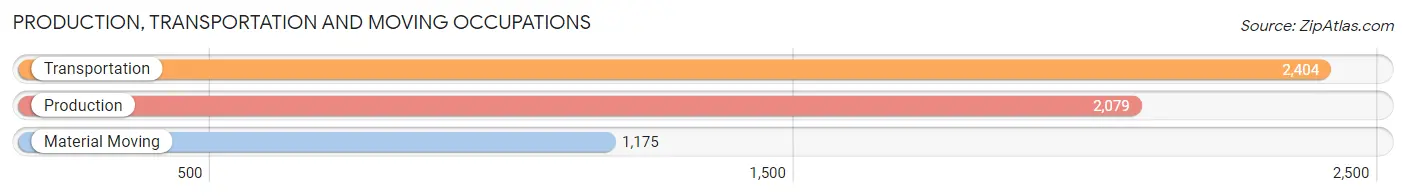
Production, Transportation and Moving Occupations
The most common Production, Transportation and Moving occupations in Arvada are Transportation (2,404 | 3.5%), Production (2,079 | 3.0%), and Material Moving (1,175 | 1.7%).
Production, Transportation and Moving Occupations by Sex
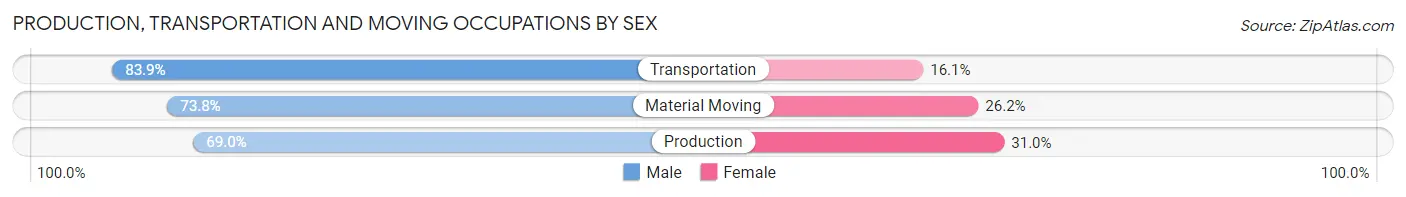
| Occupation | Male | Female |
| Production | 1,435 (69.0%) | 644 (31.0%) |
| Transportation | 2,017 (83.9%) | 387 (16.1%) |
| Material Moving | 867 (73.8%) | 308 (26.2%) |
| Total (Category) | 4,319 (76.3%) | 1,339 (23.7%) |
| Total (Overall) | 36,497 (52.8%) | 32,574 (47.2%) |
Employment Industries by Sex in Arvada
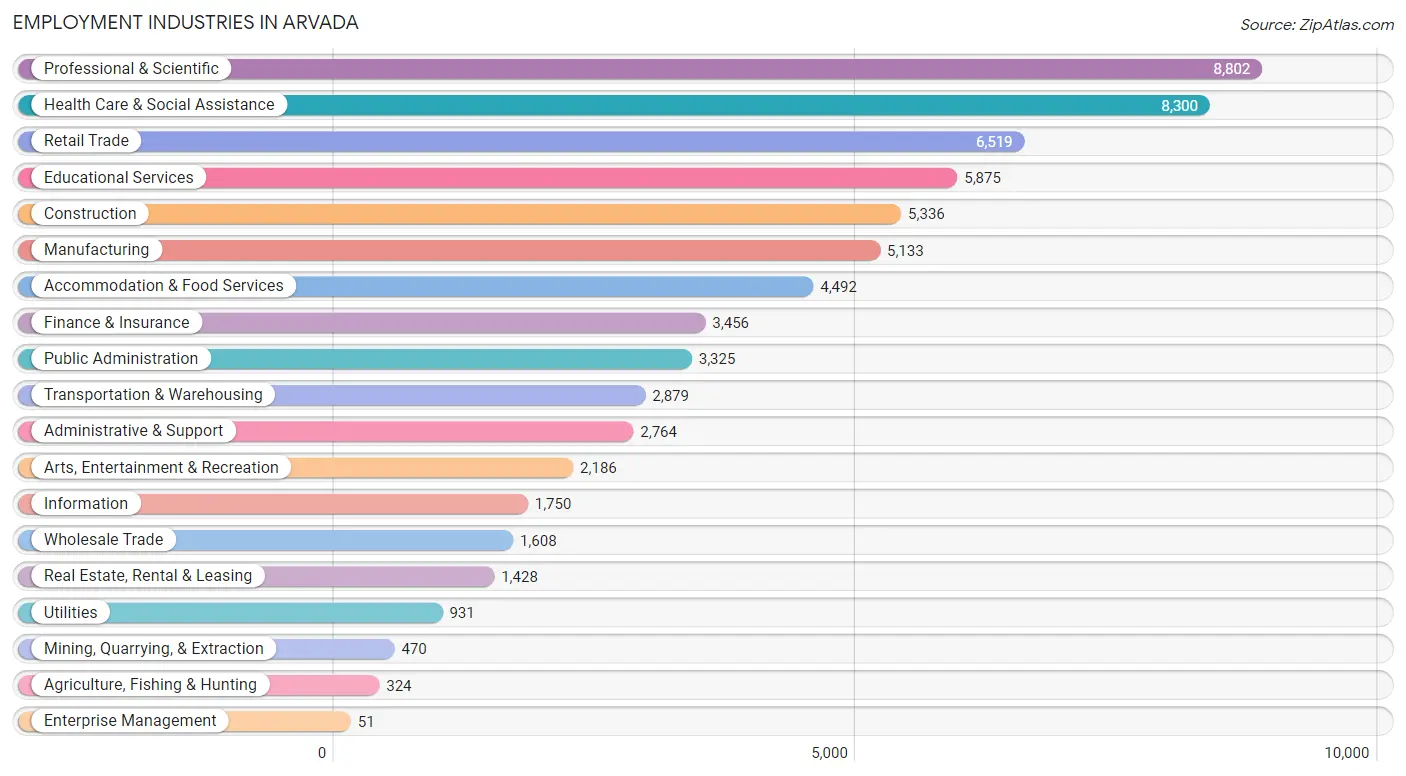
Employment Industries in Arvada
The major employment industries in Arvada include Professional & Scientific (8,802 | 12.7%), Health Care & Social Assistance (8,300 | 12.0%), Retail Trade (6,519 | 9.4%), Educational Services (5,875 | 8.5%), and Construction (5,336 | 7.7%).
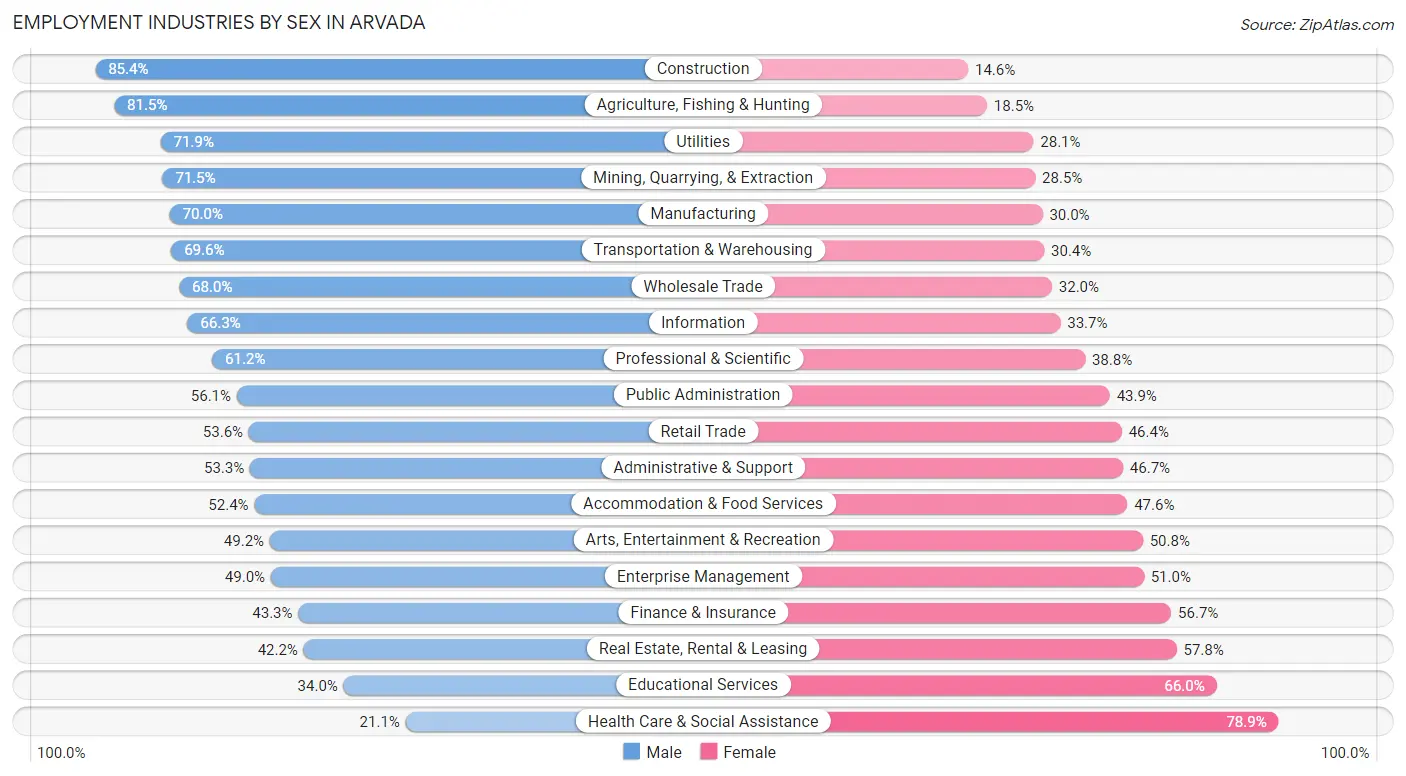
Employment Industries by Sex in Arvada
The Arvada industries that see more men than women are Construction (85.4%), Agriculture, Fishing & Hunting (81.5%), and Utilities (71.9%), whereas the industries that tend to have a higher number of women are Health Care & Social Assistance (78.9%), Educational Services (66.0%), and Real Estate, Rental & Leasing (57.8%).
| Industry | Male | Female |
| Agriculture, Fishing & Hunting | 264 (81.5%) | 60 (18.5%) |
| Mining, Quarrying, & Extraction | 336 (71.5%) | 134 (28.5%) |
| Construction | 4,556 (85.4%) | 780 (14.6%) |
| Manufacturing | 3,592 (70.0%) | 1,541 (30.0%) |
| Wholesale Trade | 1,094 (68.0%) | 514 (32.0%) |
| Retail Trade | 3,492 (53.6%) | 3,027 (46.4%) |
| Transportation & Warehousing | 2,005 (69.6%) | 874 (30.4%) |
| Utilities | 669 (71.9%) | 262 (28.1%) |
| Information | 1,160 (66.3%) | 590 (33.7%) |
| Finance & Insurance | 1,498 (43.3%) | 1,958 (56.7%) |
| Real Estate, Rental & Leasing | 603 (42.2%) | 825 (57.8%) |
| Professional & Scientific | 5,385 (61.2%) | 3,417 (38.8%) |
| Enterprise Management | 25 (49.0%) | 26 (51.0%) |
| Administrative & Support | 1,474 (53.3%) | 1,290 (46.7%) |
| Educational Services | 1,995 (34.0%) | 3,880 (66.0%) |
| Health Care & Social Assistance | 1,754 (21.1%) | 6,546 (78.9%) |
| Arts, Entertainment & Recreation | 1,076 (49.2%) | 1,110 (50.8%) |
| Accommodation & Food Services | 2,355 (52.4%) | 2,137 (47.6%) |
| Public Administration | 1,864 (56.1%) | 1,461 (43.9%) |
| Total | 36,497 (52.8%) | 32,574 (47.2%) |
Education in Arvada
School Enrollment in Arvada
The most common levels of schooling among the 25,992 students in Arvada are elementary school (5,841 | 22.5%), middle school (5,500 | 21.2%), and high school (5,364 | 20.6%).
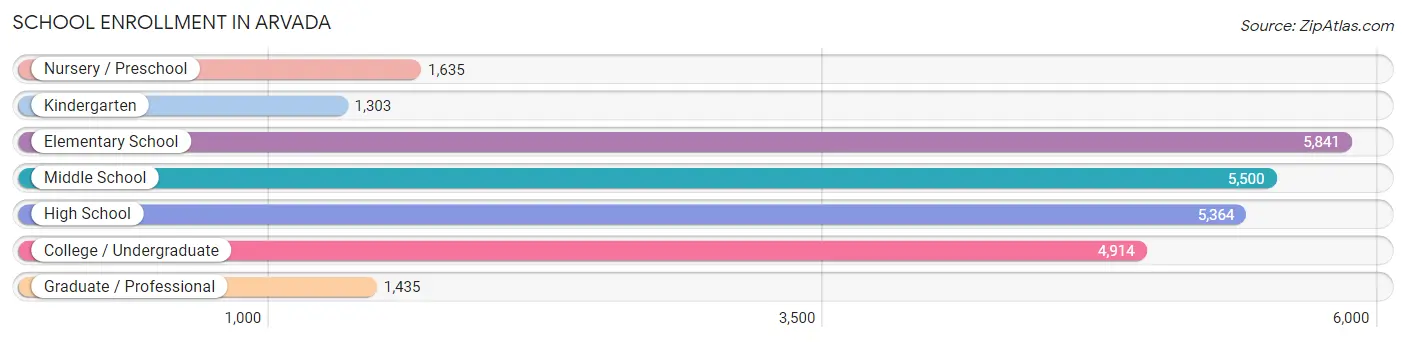
| School Level | # Students | % Students |
| Nursery / Preschool | 1,635 | 6.3% |
| Kindergarten | 1,303 | 5.0% |
| Elementary School | 5,841 | 22.5% |
| Middle School | 5,500 | 21.2% |
| High School | 5,364 | 20.6% |
| College / Undergraduate | 4,914 | 18.9% |
| Graduate / Professional | 1,435 | 5.5% |
| Total | 25,992 | 100.0% |
School Enrollment by Age by Funding Source in Arvada
Out of a total of 25,992 students who are enrolled in schools in Arvada, 3,379 (13.0%) attend a private institution, while the remaining 22,613 (87.0%) are enrolled in public schools. The age group of 3 to 4 year olds has the highest likelihood of being enrolled in private schools, with 559 (45.1% in the age bracket) enrolled. Conversely, the age group of 18 to 19 year olds has the lowest likelihood of being enrolled in a private school, with 1,786 (94.1% in the age bracket) attending a public institution.
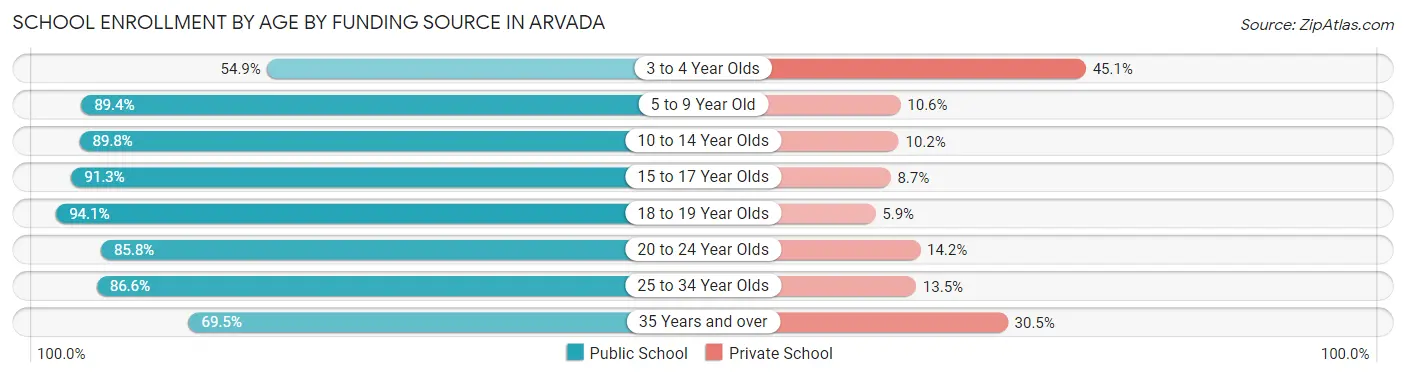
| Age Bracket | Public School | Private School |
| 3 to 4 Year Olds | 681 (54.9%) | 559 (45.1%) |
| 5 to 9 Year Old | 6,248 (89.4%) | 738 (10.6%) |
| 10 to 14 Year Olds | 5,964 (89.8%) | 679 (10.2%) |
| 15 to 17 Year Olds | 3,632 (91.3%) | 347 (8.7%) |
| 18 to 19 Year Olds | 1,786 (94.1%) | 112 (5.9%) |
| 20 to 24 Year Olds | 1,645 (85.8%) | 273 (14.2%) |
| 25 to 34 Year Olds | 1,693 (86.6%) | 263 (13.5%) |
| 35 Years and over | 953 (69.5%) | 419 (30.5%) |
| Total | 22,613 (87.0%) | 3,379 (13.0%) |
Educational Attainment by Field of Study in Arvada
Business (8,927 | 19.1%), science & technology (4,523 | 9.7%), engineering (4,219 | 9.0%), education (3,868 | 8.3%), and social sciences (3,807 | 8.1%) are the most common fields of study among 46,810 individuals in Arvada who have obtained a bachelor's degree or higher.
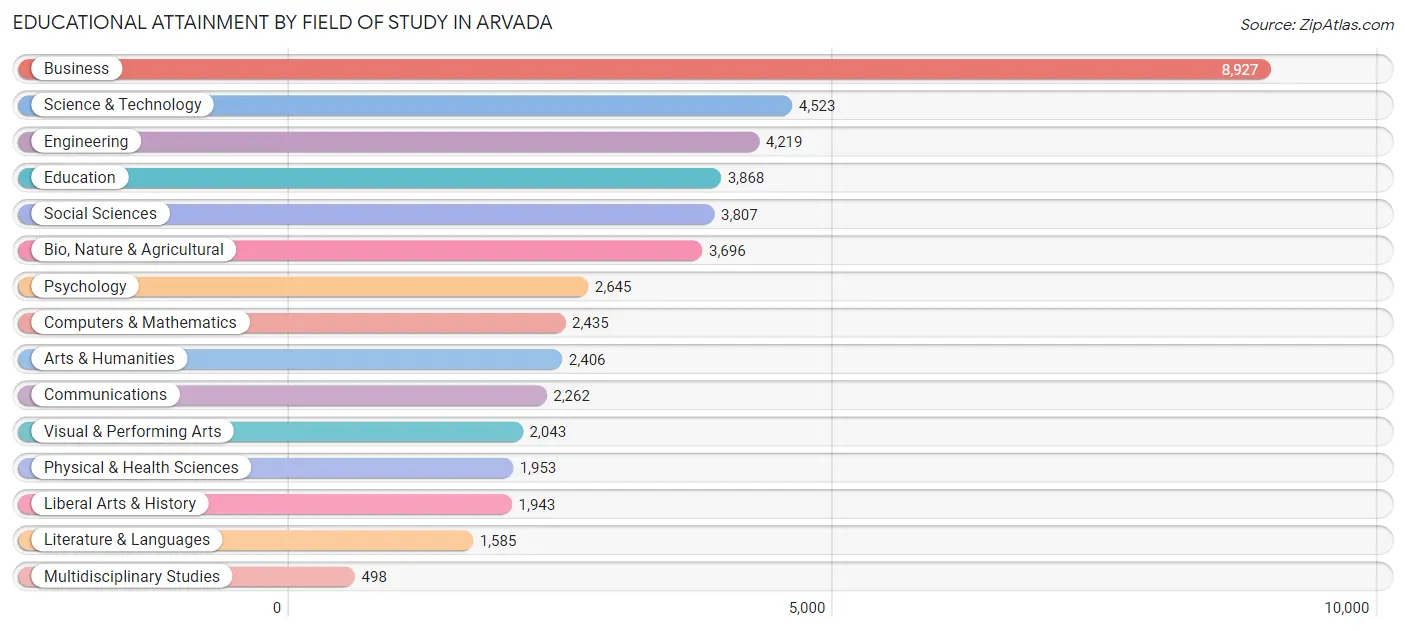
| Field of Study | # Graduates | % Graduates |
| Computers & Mathematics | 2,435 | 5.2% |
| Bio, Nature & Agricultural | 3,696 | 7.9% |
| Physical & Health Sciences | 1,953 | 4.2% |
| Psychology | 2,645 | 5.7% |
| Social Sciences | 3,807 | 8.1% |
| Engineering | 4,219 | 9.0% |
| Multidisciplinary Studies | 498 | 1.1% |
| Science & Technology | 4,523 | 9.7% |
| Business | 8,927 | 19.1% |
| Education | 3,868 | 8.3% |
| Literature & Languages | 1,585 | 3.4% |
| Liberal Arts & History | 1,943 | 4.2% |
| Visual & Performing Arts | 2,043 | 4.4% |
| Communications | 2,262 | 4.8% |
| Arts & Humanities | 2,406 | 5.1% |
| Total | 46,810 | 100.0% |
Transportation & Commute in Arvada
Vehicle Availability by Sex in Arvada
The most prevalent vehicle ownership categories in Arvada are males with 2 vehicles (16,137, accounting for 44.8%) and females with 2 vehicles (14,486, making up 50.8%).
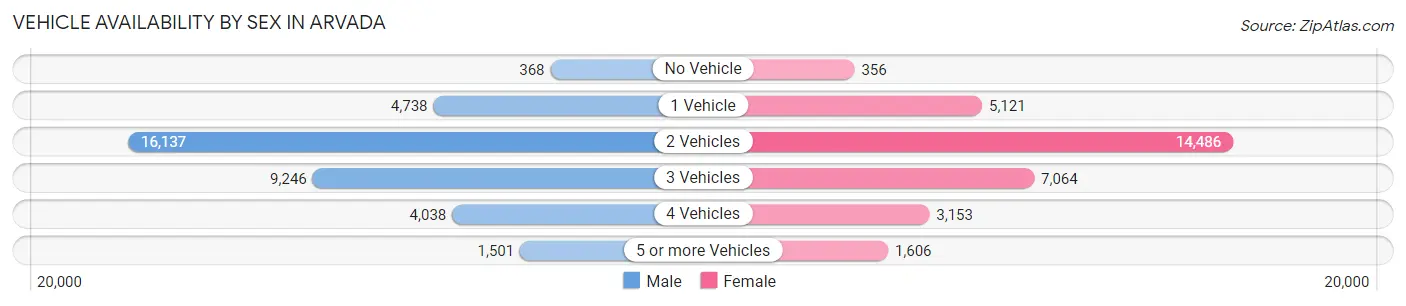
| Vehicles Available | Male | Female |
| No Vehicle | 368 (1.0%) | 356 (1.1%) |
| 1 Vehicle | 4,738 (13.2%) | 5,121 (16.1%) |
| 2 Vehicles | 16,137 (44.8%) | 14,486 (45.6%) |
| 3 Vehicles | 9,246 (25.7%) | 7,064 (22.2%) |
| 4 Vehicles | 4,038 (11.2%) | 3,153 (9.9%) |
| 5 or more Vehicles | 1,501 (4.2%) | 1,606 (5.1%) |
| Total | 36,028 (100.0%) | 31,786 (100.0%) |
Commute Time in Arvada
The most frequently occuring commute durations in Arvada are 20 to 24 minutes (9,098 commuters, 16.5%), 15 to 19 minutes (8,693 commuters, 15.8%), and 30 to 34 minutes (8,237 commuters, 14.9%).
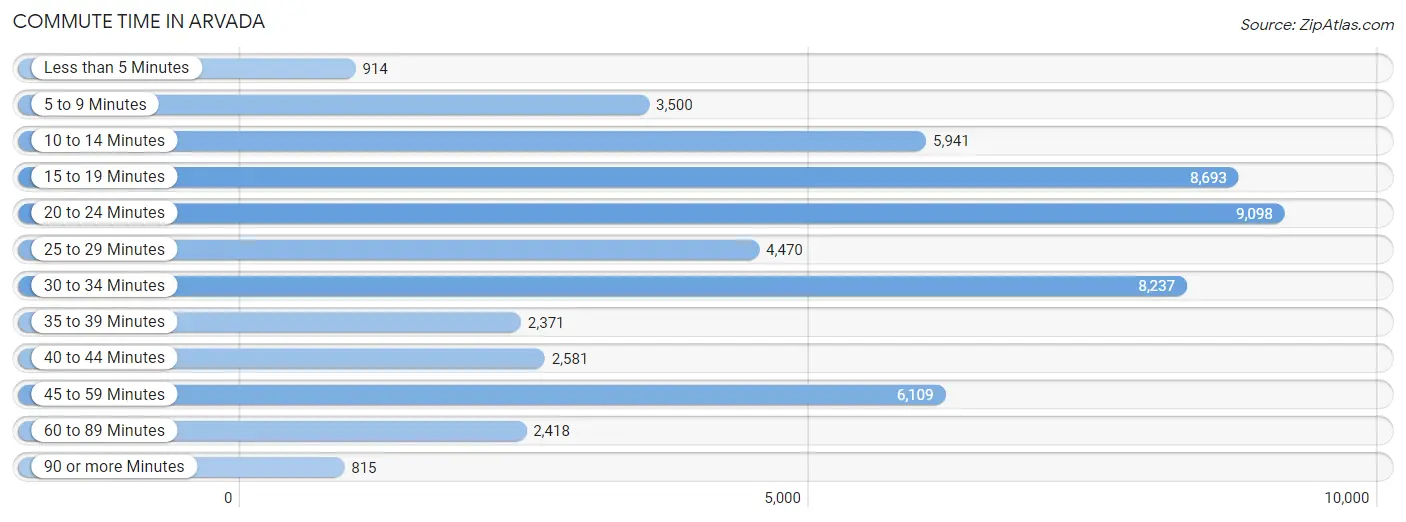
| Commute Time | # Commuters | % Commuters |
| Less than 5 Minutes | 914 | 1.7% |
| 5 to 9 Minutes | 3,500 | 6.4% |
| 10 to 14 Minutes | 5,941 | 10.8% |
| 15 to 19 Minutes | 8,693 | 15.8% |
| 20 to 24 Minutes | 9,098 | 16.5% |
| 25 to 29 Minutes | 4,470 | 8.1% |
| 30 to 34 Minutes | 8,237 | 14.9% |
| 35 to 39 Minutes | 2,371 | 4.3% |
| 40 to 44 Minutes | 2,581 | 4.7% |
| 45 to 59 Minutes | 6,109 | 11.1% |
| 60 to 89 Minutes | 2,418 | 4.4% |
| 90 or more Minutes | 815 | 1.5% |
Commute Time by Sex in Arvada
The most common commute times in Arvada are 20 to 24 minutes (4,988 commuters, 16.7%) for males and 15 to 19 minutes (4,111 commuters, 16.3%) for females.
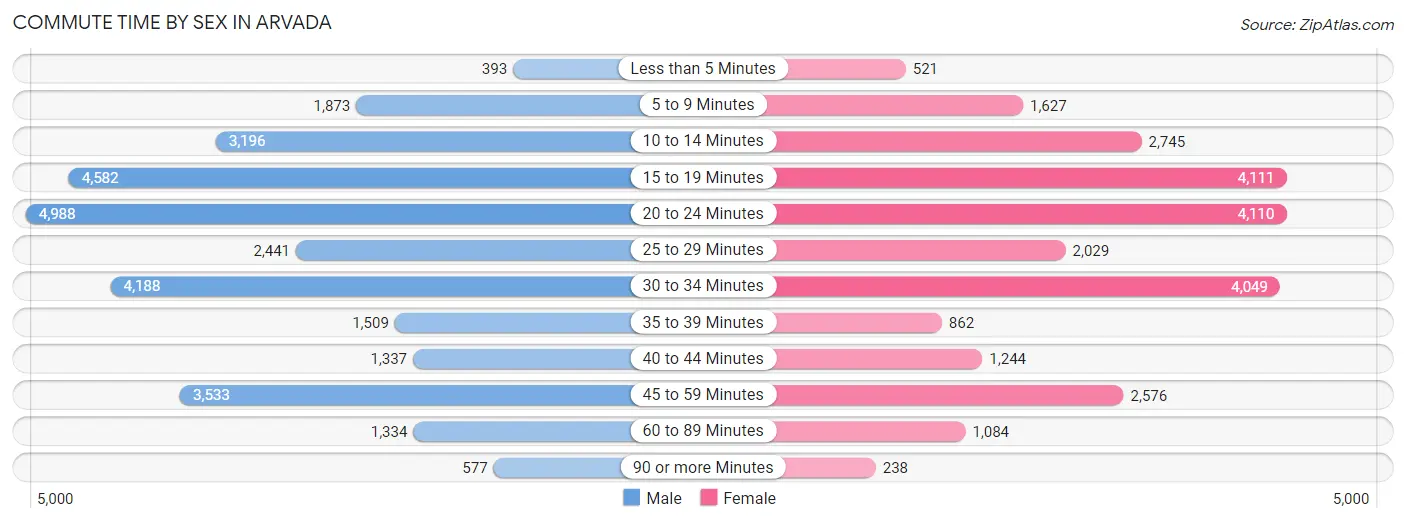
| Commute Time | Male | Female |
| Less than 5 Minutes | 393 (1.3%) | 521 (2.1%) |
| 5 to 9 Minutes | 1,873 (6.2%) | 1,627 (6.5%) |
| 10 to 14 Minutes | 3,196 (10.7%) | 2,745 (10.9%) |
| 15 to 19 Minutes | 4,582 (15.3%) | 4,111 (16.3%) |
| 20 to 24 Minutes | 4,988 (16.7%) | 4,110 (16.3%) |
| 25 to 29 Minutes | 2,441 (8.2%) | 2,029 (8.1%) |
| 30 to 34 Minutes | 4,188 (14.0%) | 4,049 (16.1%) |
| 35 to 39 Minutes | 1,509 (5.0%) | 862 (3.4%) |
| 40 to 44 Minutes | 1,337 (4.5%) | 1,244 (4.9%) |
| 45 to 59 Minutes | 3,533 (11.8%) | 2,576 (10.2%) |
| 60 to 89 Minutes | 1,334 (4.4%) | 1,084 (4.3%) |
| 90 or more Minutes | 577 (1.9%) | 238 (0.9%) |
Time of Departure to Work by Sex in Arvada
The most frequent times of departure to work in Arvada are 7:00 AM to 7:29 AM (4,434, 14.8%) for males and 7:00 AM to 7:29 AM (3,951, 15.7%) for females.
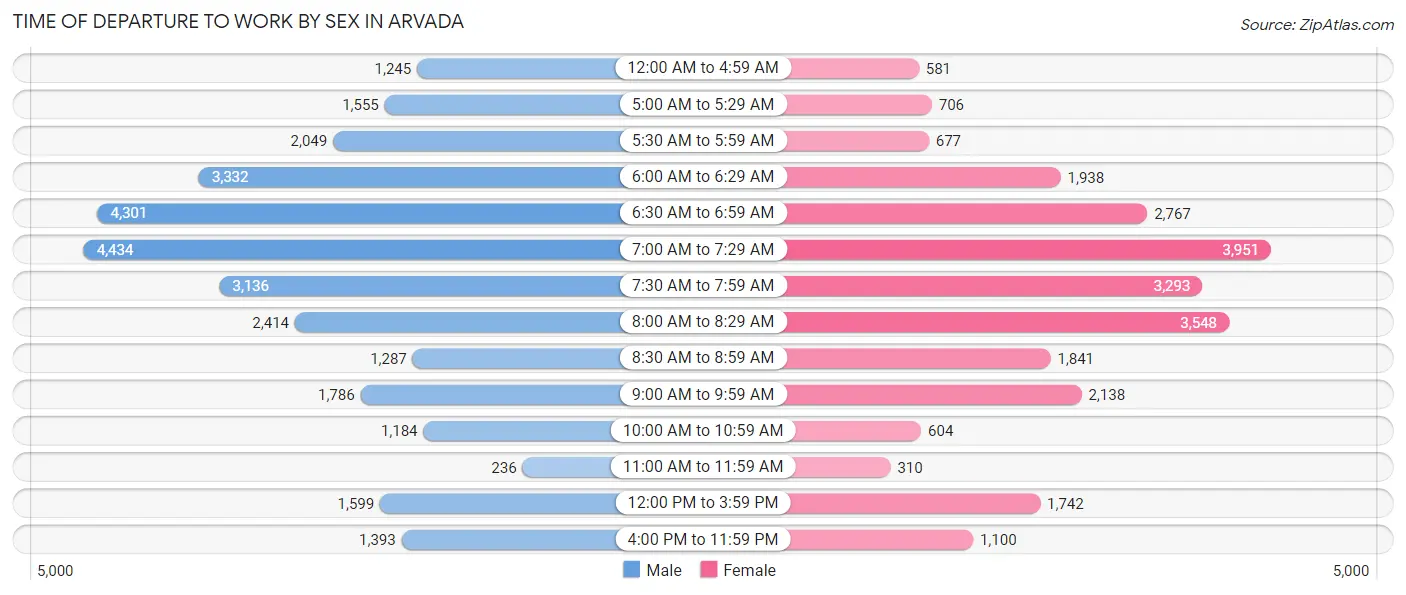
| Time of Departure | Male | Female |
| 12:00 AM to 4:59 AM | 1,245 (4.2%) | 581 (2.3%) |
| 5:00 AM to 5:29 AM | 1,555 (5.2%) | 706 (2.8%) |
| 5:30 AM to 5:59 AM | 2,049 (6.8%) | 677 (2.7%) |
| 6:00 AM to 6:29 AM | 3,332 (11.1%) | 1,938 (7.7%) |
| 6:30 AM to 6:59 AM | 4,301 (14.4%) | 2,767 (11.0%) |
| 7:00 AM to 7:29 AM | 4,434 (14.8%) | 3,951 (15.7%) |
| 7:30 AM to 7:59 AM | 3,136 (10.5%) | 3,293 (13.1%) |
| 8:00 AM to 8:29 AM | 2,414 (8.1%) | 3,548 (14.1%) |
| 8:30 AM to 8:59 AM | 1,287 (4.3%) | 1,841 (7.3%) |
| 9:00 AM to 9:59 AM | 1,786 (6.0%) | 2,138 (8.5%) |
| 10:00 AM to 10:59 AM | 1,184 (4.0%) | 604 (2.4%) |
| 11:00 AM to 11:59 AM | 236 (0.8%) | 310 (1.2%) |
| 12:00 PM to 3:59 PM | 1,599 (5.3%) | 1,742 (6.9%) |
| 4:00 PM to 11:59 PM | 1,393 (4.6%) | 1,100 (4.4%) |
| Total | 29,951 (100.0%) | 25,196 (100.0%) |
Housing Occupancy in Arvada
Occupancy by Ownership in Arvada
Of the total 50,211 dwellings in Arvada, owner-occupied units account for 37,271 (74.2%), while renter-occupied units make up 12,940 (25.8%).
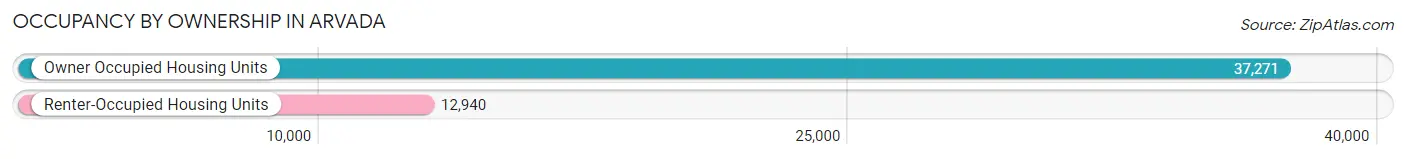
| Occupancy | # Housing Units | % Housing Units |
| Owner Occupied Housing Units | 37,271 | 74.2% |
| Renter-Occupied Housing Units | 12,940 | 25.8% |
| Total Occupied Housing Units | 50,211 | 100.0% |
Occupancy by Household Size in Arvada
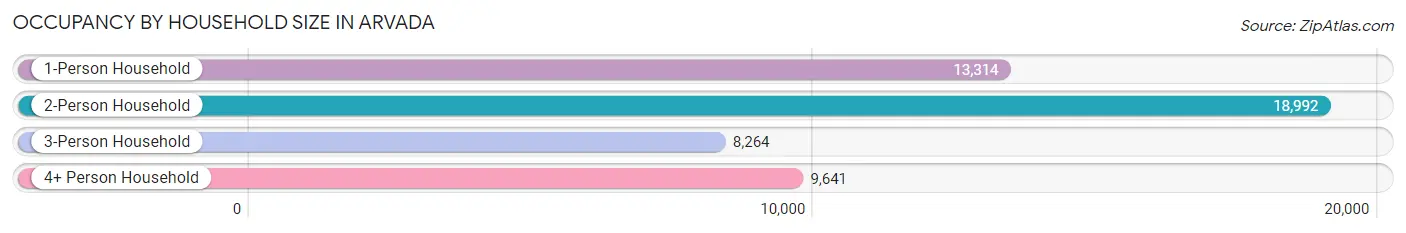
| Household Size | # Housing Units | % Housing Units |
| 1-Person Household | 13,314 | 26.5% |
| 2-Person Household | 18,992 | 37.8% |
| 3-Person Household | 8,264 | 16.5% |
| 4+ Person Household | 9,641 | 19.2% |
| Total Housing Units | 50,211 | 100.0% |
Occupancy by Ownership by Household Size in Arvada
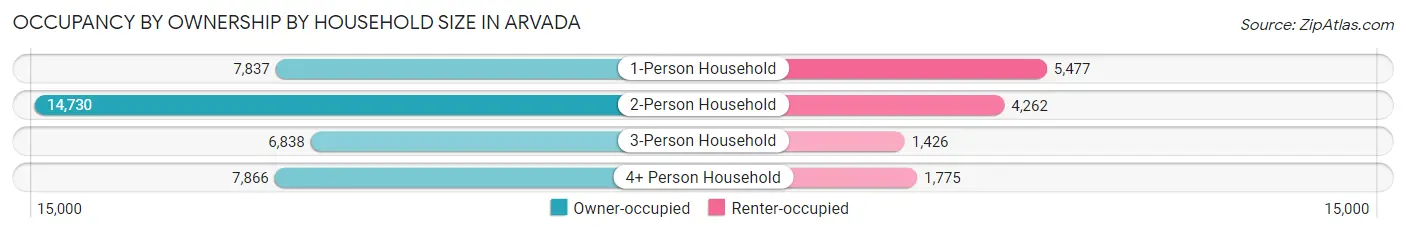
| Household Size | Owner-occupied | Renter-occupied |
| 1-Person Household | 7,837 (58.9%) | 5,477 (41.1%) |
| 2-Person Household | 14,730 (77.6%) | 4,262 (22.4%) |
| 3-Person Household | 6,838 (82.7%) | 1,426 (17.3%) |
| 4+ Person Household | 7,866 (81.6%) | 1,775 (18.4%) |
| Total Housing Units | 37,271 (74.2%) | 12,940 (25.8%) |
Occupancy by Educational Attainment in Arvada
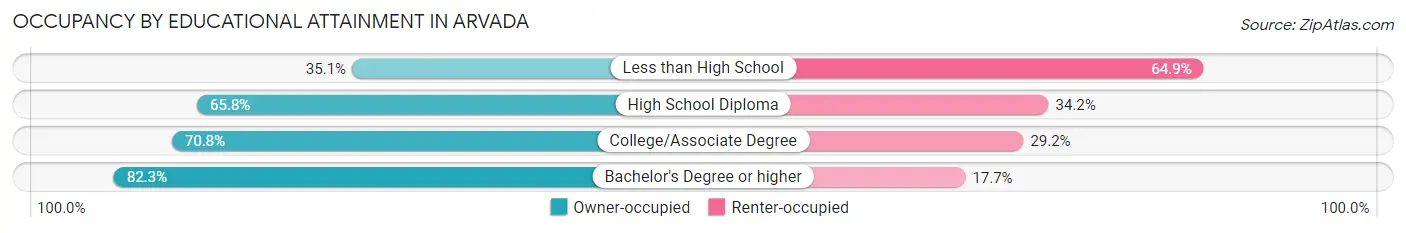
| Household Size | Owner-occupied | Renter-occupied |
| Less than High School | 703 (35.1%) | 1,299 (64.9%) |
| High School Diploma | 6,397 (65.8%) | 3,322 (34.2%) |
| College/Associate Degree | 9,270 (70.8%) | 3,823 (29.2%) |
| Bachelor's Degree or higher | 20,901 (82.3%) | 4,496 (17.7%) |
Occupancy by Age of Householder in Arvada
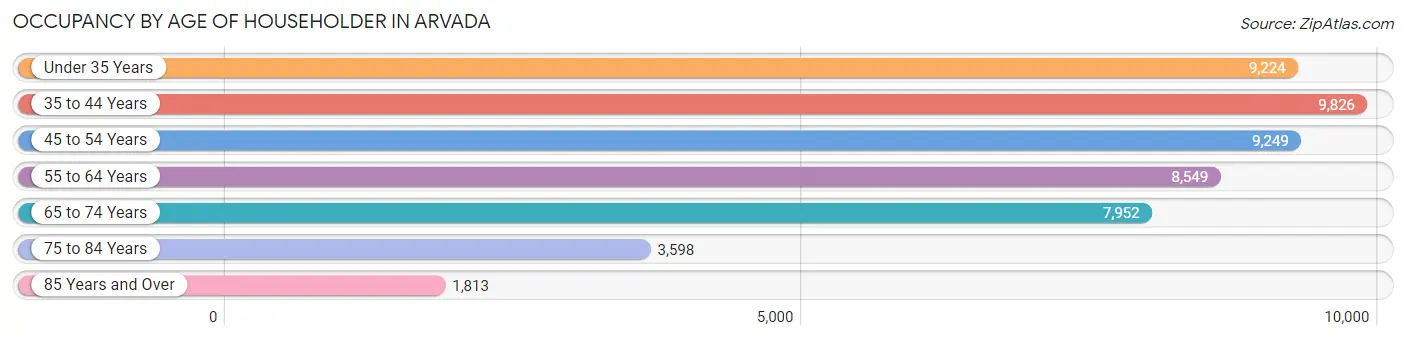
| Age Bracket | # Households | % Households |
| Under 35 Years | 9,224 | 18.4% |
| 35 to 44 Years | 9,826 | 19.6% |
| 45 to 54 Years | 9,249 | 18.4% |
| 55 to 64 Years | 8,549 | 17.0% |
| 65 to 74 Years | 7,952 | 15.8% |
| 75 to 84 Years | 3,598 | 7.2% |
| 85 Years and Over | 1,813 | 3.6% |
| Total | 50,211 | 100.0% |
Housing Finances in Arvada
Median Income by Occupancy in Arvada
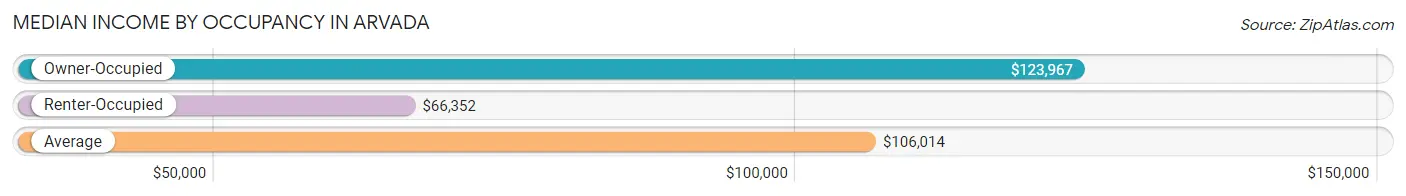
| Occupancy Type | # Households | Median Income |
| Owner-Occupied | 37,271 (74.2%) | $123,967 |
| Renter-Occupied | 12,940 (25.8%) | $66,352 |
| Average | 50,211 (100.0%) | $106,014 |
Occupancy by Householder Income Bracket in Arvada
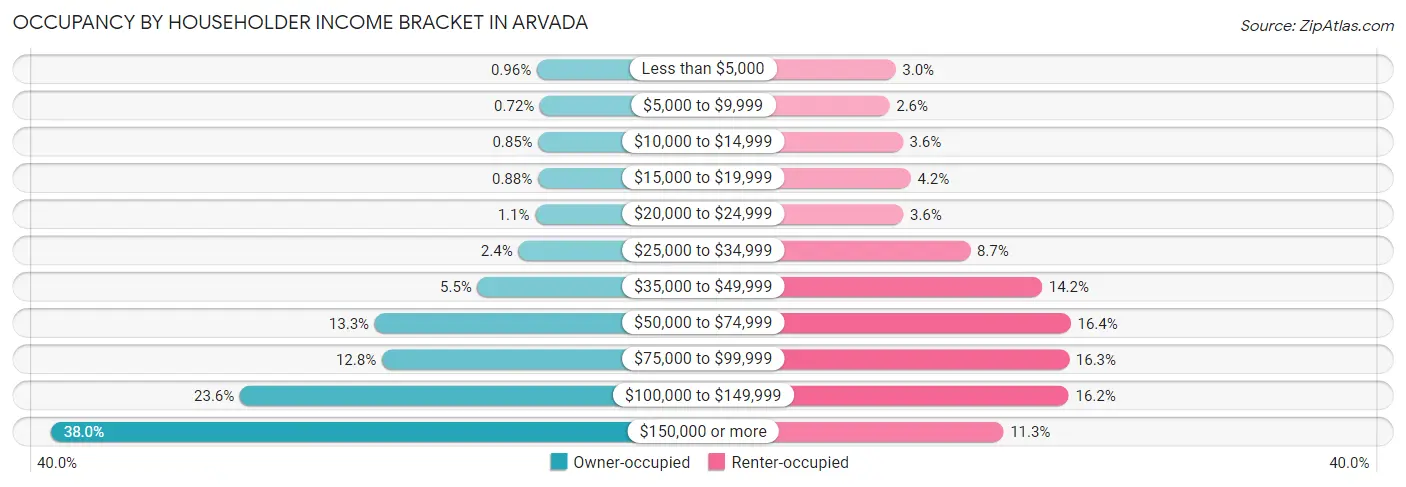
| Income Bracket | Owner-occupied | Renter-occupied |
| Less than $5,000 | 359 (1.0%) | 392 (3.0%) |
| $5,000 to $9,999 | 268 (0.7%) | 332 (2.6%) |
| $10,000 to $14,999 | 315 (0.9%) | 463 (3.6%) |
| $15,000 to $19,999 | 327 (0.9%) | 542 (4.2%) |
| $20,000 to $24,999 | 406 (1.1%) | 468 (3.6%) |
| $25,000 to $34,999 | 884 (2.4%) | 1,129 (8.7%) |
| $35,000 to $49,999 | 2,044 (5.5%) | 1,836 (14.2%) |
| $50,000 to $74,999 | 4,961 (13.3%) | 2,119 (16.4%) |
| $75,000 to $99,999 | 4,758 (12.8%) | 2,103 (16.3%) |
| $100,000 to $149,999 | 8,787 (23.6%) | 2,100 (16.2%) |
| $150,000 or more | 14,162 (38.0%) | 1,456 (11.3%) |
| Total | 37,271 (100.0%) | 12,940 (100.0%) |
Monthly Housing Cost Tiers in Arvada
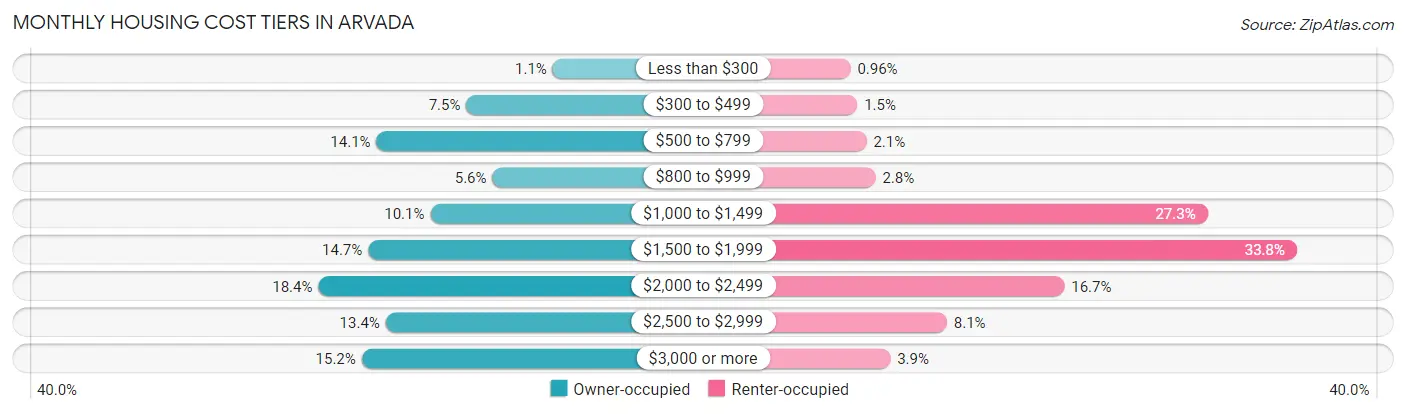
| Monthly Cost | Owner-occupied | Renter-occupied |
| Less than $300 | 415 (1.1%) | 124 (1.0%) |
| $300 to $499 | 2,783 (7.5%) | 189 (1.5%) |
| $500 to $799 | 5,252 (14.1%) | 277 (2.1%) |
| $800 to $999 | 2,068 (5.6%) | 362 (2.8%) |
| $1,000 to $1,499 | 3,771 (10.1%) | 3,526 (27.3%) |
| $1,500 to $1,999 | 5,478 (14.7%) | 4,378 (33.8%) |
| $2,000 to $2,499 | 6,848 (18.4%) | 2,162 (16.7%) |
| $2,500 to $2,999 | 4,997 (13.4%) | 1,043 (8.1%) |
| $3,000 or more | 5,659 (15.2%) | 504 (3.9%) |
| Total | 37,271 (100.0%) | 12,940 (100.0%) |
Physical Housing Characteristics in Arvada
Housing Structures in Arvada
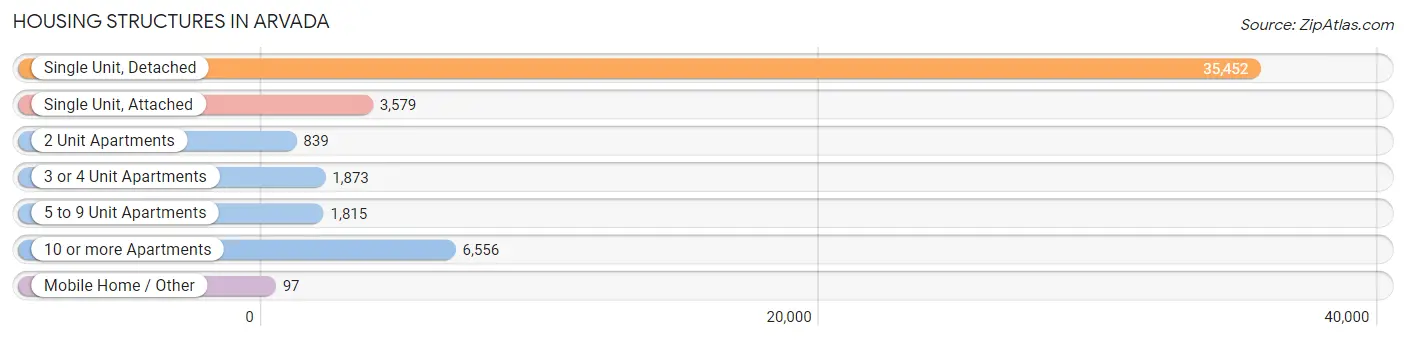
| Structure Type | # Housing Units | % Housing Units |
| Single Unit, Detached | 35,452 | 70.6% |
| Single Unit, Attached | 3,579 | 7.1% |
| 2 Unit Apartments | 839 | 1.7% |
| 3 or 4 Unit Apartments | 1,873 | 3.7% |
| 5 to 9 Unit Apartments | 1,815 | 3.6% |
| 10 or more Apartments | 6,556 | 13.1% |
| Mobile Home / Other | 97 | 0.2% |
| Total | 50,211 | 100.0% |
Housing Structures by Occupancy in Arvada
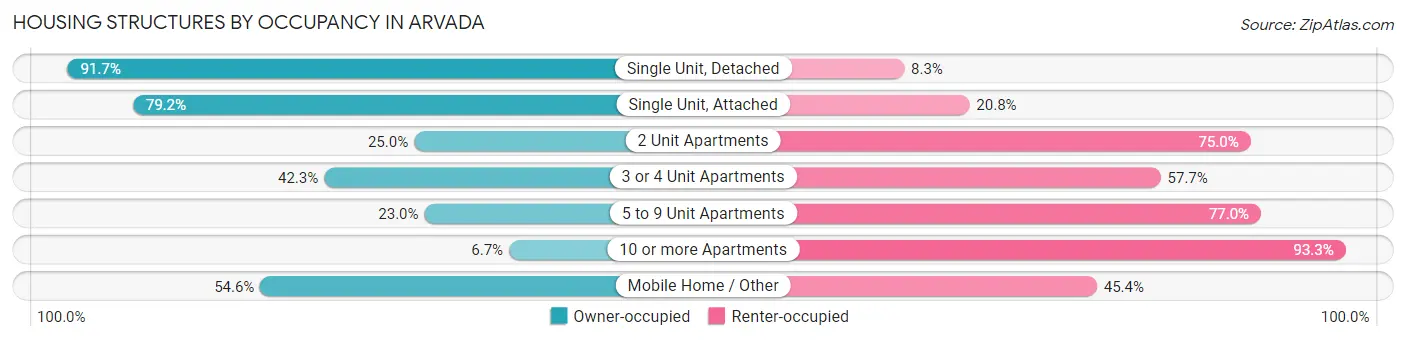
| Structure Type | Owner-occupied | Renter-occupied |
| Single Unit, Detached | 32,522 (91.7%) | 2,930 (8.3%) |
| Single Unit, Attached | 2,833 (79.2%) | 746 (20.8%) |
| 2 Unit Apartments | 210 (25.0%) | 629 (75.0%) |
| 3 or 4 Unit Apartments | 793 (42.3%) | 1,080 (57.7%) |
| 5 to 9 Unit Apartments | 418 (23.0%) | 1,397 (77.0%) |
| 10 or more Apartments | 442 (6.7%) | 6,114 (93.3%) |
| Mobile Home / Other | 53 (54.6%) | 44 (45.4%) |
| Total | 37,271 (74.2%) | 12,940 (25.8%) |
Housing Structures by Number of Rooms in Arvada
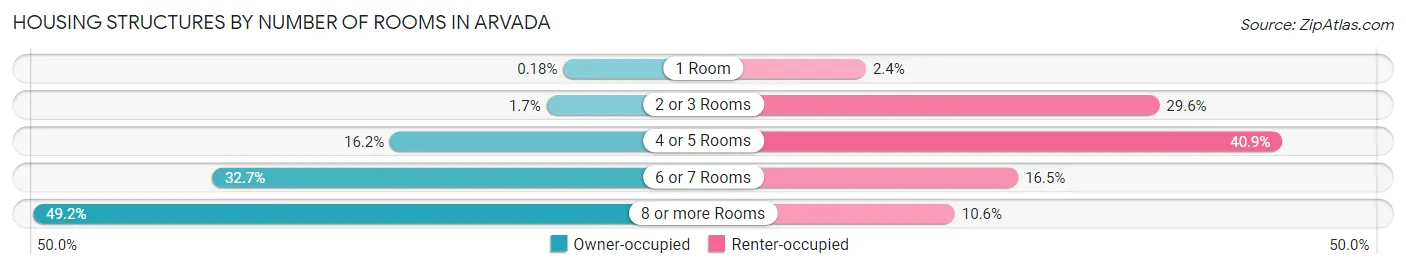
| Number of Rooms | Owner-occupied | Renter-occupied |
| 1 Room | 68 (0.2%) | 312 (2.4%) |
| 2 or 3 Rooms | 645 (1.7%) | 3,824 (29.5%) |
| 4 or 5 Rooms | 6,039 (16.2%) | 5,294 (40.9%) |
| 6 or 7 Rooms | 12,178 (32.7%) | 2,134 (16.5%) |
| 8 or more Rooms | 18,341 (49.2%) | 1,376 (10.6%) |
| Total | 37,271 (100.0%) | 12,940 (100.0%) |
Housing Structure by Heating Type in Arvada
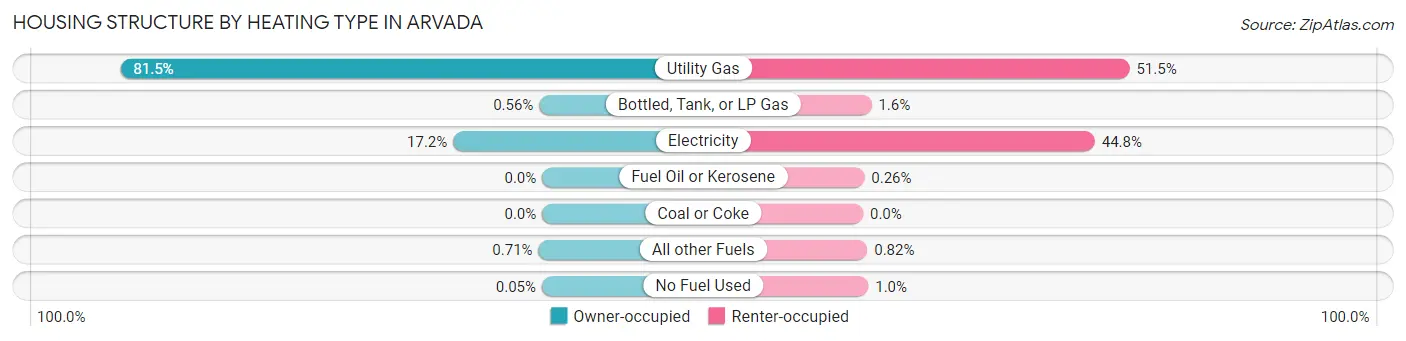
| Heating Type | Owner-occupied | Renter-occupied |
| Utility Gas | 30,367 (81.5%) | 6,663 (51.5%) |
| Bottled, Tank, or LP Gas | 210 (0.6%) | 211 (1.6%) |
| Electricity | 6,411 (17.2%) | 5,796 (44.8%) |
| Fuel Oil or Kerosene | 0 (0.0%) | 33 (0.3%) |
| Coal or Coke | 0 (0.0%) | 0 (0.0%) |
| All other Fuels | 266 (0.7%) | 106 (0.8%) |
| No Fuel Used | 17 (0.1%) | 131 (1.0%) |
| Total | 37,271 (100.0%) | 12,940 (100.0%) |
Household Vehicle Usage in Arvada
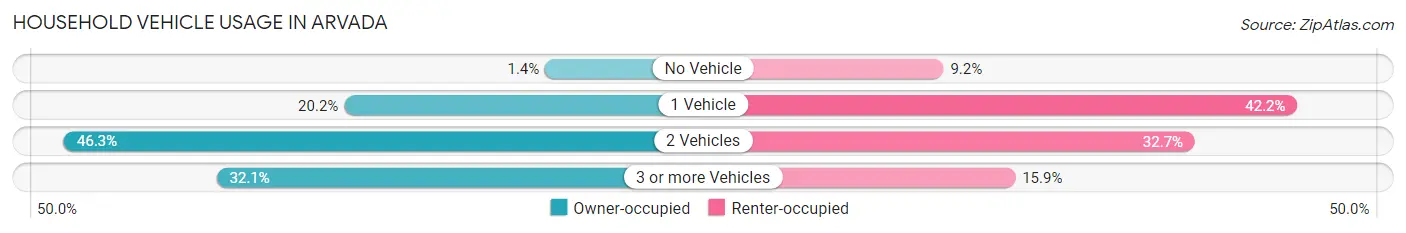
| Vehicles per Household | Owner-occupied | Renter-occupied |
| No Vehicle | 527 (1.4%) | 1,191 (9.2%) |
| 1 Vehicle | 7,517 (20.2%) | 5,465 (42.2%) |
| 2 Vehicles | 17,266 (46.3%) | 4,227 (32.7%) |
| 3 or more Vehicles | 11,961 (32.1%) | 2,057 (15.9%) |
| Total | 37,271 (100.0%) | 12,940 (100.0%) |
Real Estate & Mortgages in Arvada
Real Estate and Mortgage Overview in Arvada
| Characteristic | Without Mortgage | With Mortgage |
| Housing Units | 10,097 | 27,174 |
| Median Property Value | $513,600 | $565,000 |
| Median Household Income | $86,017 | $11,707 |
| Monthly Housing Costs | $607 | $5,659 |
| Real Estate Taxes | $2,672 | $377 |
Property Value by Mortgage Status in Arvada
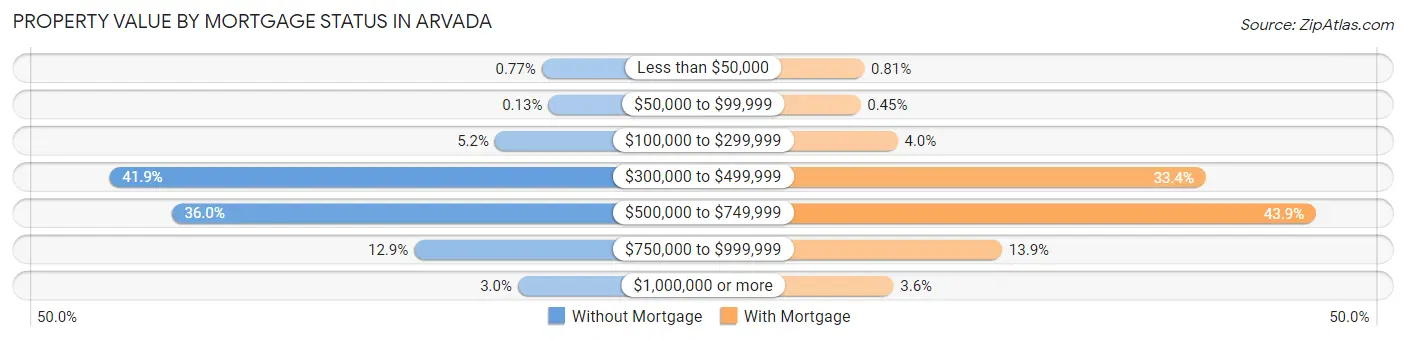
| Property Value | Without Mortgage | With Mortgage |
| Less than $50,000 | 78 (0.8%) | 219 (0.8%) |
| $50,000 to $99,999 | 13 (0.1%) | 121 (0.4%) |
| $100,000 to $299,999 | 527 (5.2%) | 1,088 (4.0%) |
| $300,000 to $499,999 | 4,233 (41.9%) | 9,062 (33.4%) |
| $500,000 to $749,999 | 3,636 (36.0%) | 11,918 (43.9%) |
| $750,000 to $999,999 | 1,304 (12.9%) | 3,788 (13.9%) |
| $1,000,000 or more | 306 (3.0%) | 978 (3.6%) |
| Total | 10,097 (100.0%) | 27,174 (100.0%) |
Household Income by Mortgage Status in Arvada
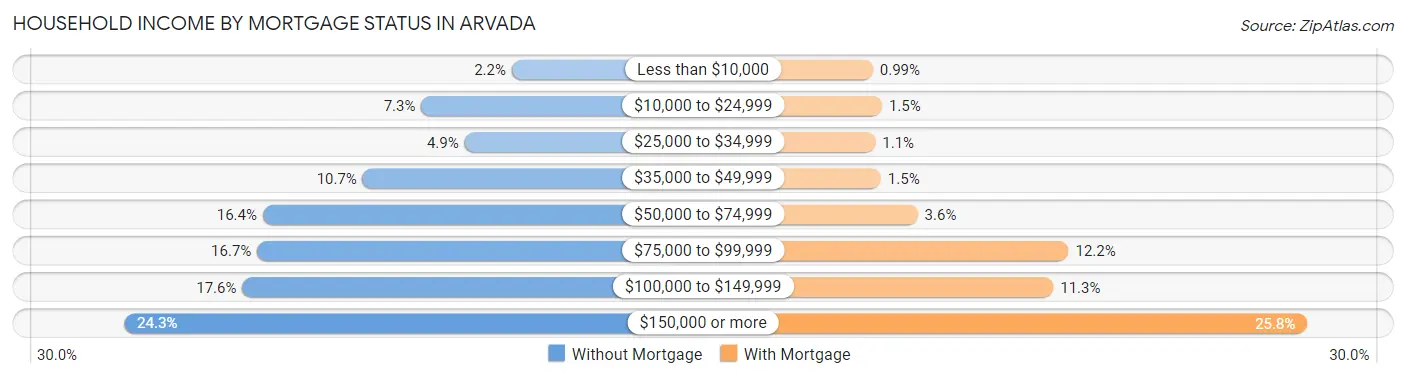
| Household Income | Without Mortgage | With Mortgage |
| Less than $10,000 | 218 (2.2%) | 270 (1.0%) |
| $10,000 to $24,999 | 740 (7.3%) | 409 (1.5%) |
| $25,000 to $34,999 | 491 (4.9%) | 308 (1.1%) |
| $35,000 to $49,999 | 1,078 (10.7%) | 393 (1.5%) |
| $50,000 to $74,999 | 1,655 (16.4%) | 966 (3.5%) |
| $75,000 to $99,999 | 1,687 (16.7%) | 3,306 (12.2%) |
| $100,000 to $149,999 | 1,773 (17.6%) | 3,071 (11.3%) |
| $150,000 or more | 2,455 (24.3%) | 7,014 (25.8%) |
| Total | 10,097 (100.0%) | 27,174 (100.0%) |
Property Value to Household Income Ratio in Arvada
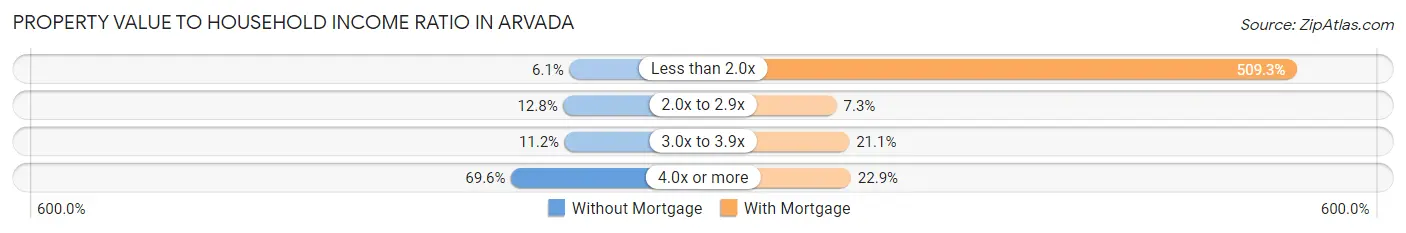
| Value-to-Income Ratio | Without Mortgage | With Mortgage |
| Less than 2.0x | 611 (6.0%) | 138,385 (509.3%) |
| 2.0x to 2.9x | 1,293 (12.8%) | 1,971 (7.2%) |
| 3.0x to 3.9x | 1,129 (11.2%) | 5,724 (21.1%) |
| 4.0x or more | 7,026 (69.6%) | 6,208 (22.9%) |
| Total | 10,097 (100.0%) | 27,174 (100.0%) |
Real Estate Taxes by Mortgage Status in Arvada
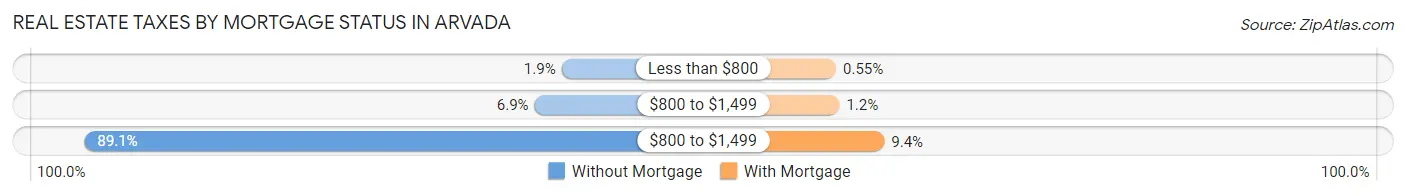
| Property Taxes | Without Mortgage | With Mortgage |
| Less than $800 | 196 (1.9%) | 149 (0.5%) |
| $800 to $1,499 | 695 (6.9%) | 320 (1.2%) |
| $800 to $1,499 | 8,993 (89.1%) | 2,546 (9.4%) |
| Total | 10,097 (100.0%) | 27,174 (100.0%) |
Health & Disability in Arvada
Health Insurance Coverage by Age in Arvada
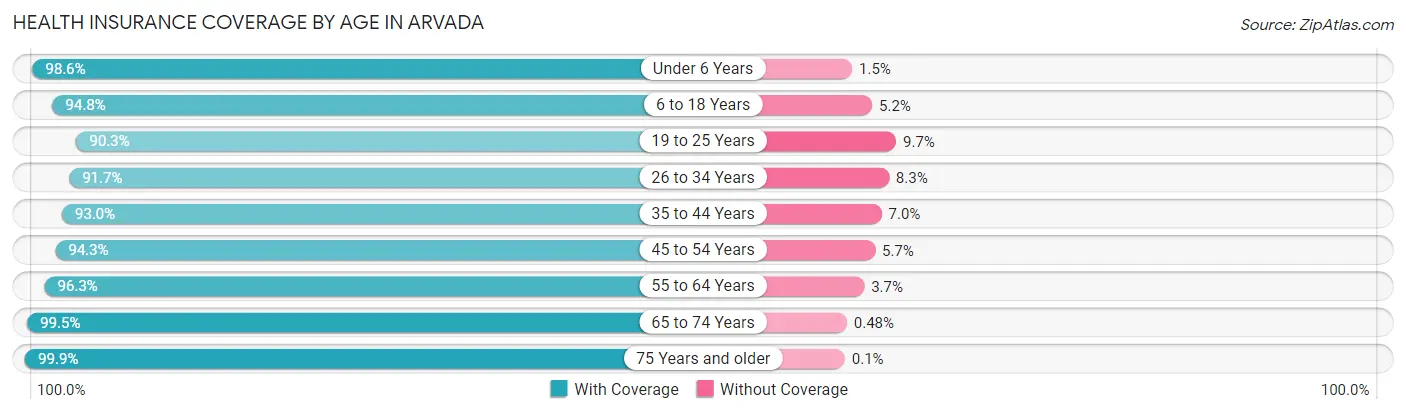
| Age Bracket | With Coverage | Without Coverage |
| Under 6 Years | 7,843 (98.6%) | 115 (1.5%) |
| 6 to 18 Years | 17,375 (94.8%) | 952 (5.2%) |
| 19 to 25 Years | 8,124 (90.3%) | 869 (9.7%) |
| 26 to 34 Years | 14,922 (91.7%) | 1,355 (8.3%) |
| 35 to 44 Years | 17,174 (93.0%) | 1,284 (7.0%) |
| 45 to 54 Years | 15,593 (94.3%) | 947 (5.7%) |
| 55 to 64 Years | 14,314 (96.3%) | 552 (3.7%) |
| 65 to 74 Years | 13,231 (99.5%) | 64 (0.5%) |
| 75 Years and older | 7,880 (99.9%) | 8 (0.1%) |
| Total | 116,456 (95.0%) | 6,146 (5.0%) |
Health Insurance Coverage by Citizenship Status in Arvada
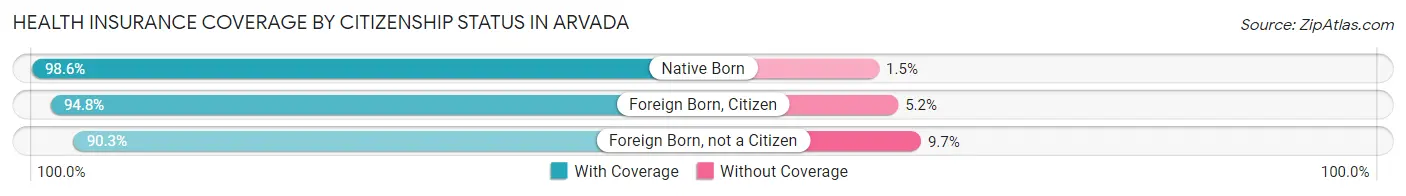
| Citizenship Status | With Coverage | Without Coverage |
| Native Born | 7,843 (98.6%) | 115 (1.5%) |
| Foreign Born, Citizen | 17,375 (94.8%) | 952 (5.2%) |
| Foreign Born, not a Citizen | 8,124 (90.3%) | 869 (9.7%) |
Health Insurance Coverage by Household Income in Arvada
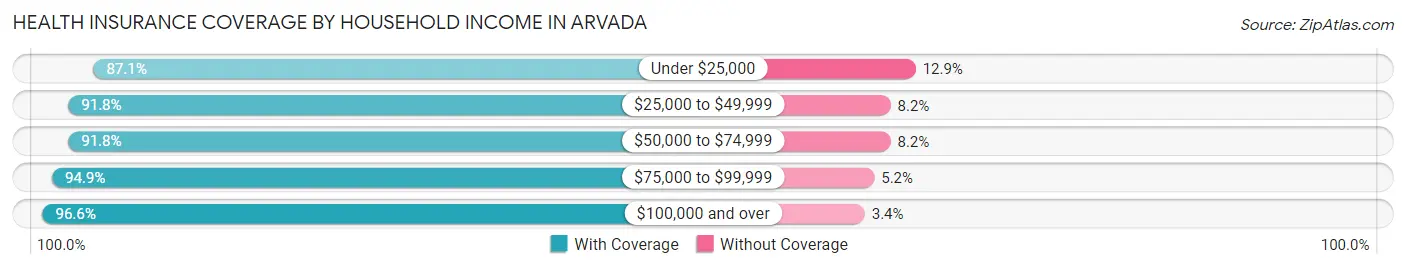
| Household Income | With Coverage | Without Coverage |
| Under $25,000 | 4,992 (87.1%) | 740 (12.9%) |
| $25,000 to $49,999 | 9,675 (91.8%) | 865 (8.2%) |
| $50,000 to $74,999 | 13,099 (91.8%) | 1,168 (8.2%) |
| $75,000 to $99,999 | 14,208 (94.9%) | 772 (5.1%) |
| $100,000 and over | 74,302 (96.6%) | 2,595 (3.4%) |
Public vs Private Health Insurance Coverage by Age in Arvada
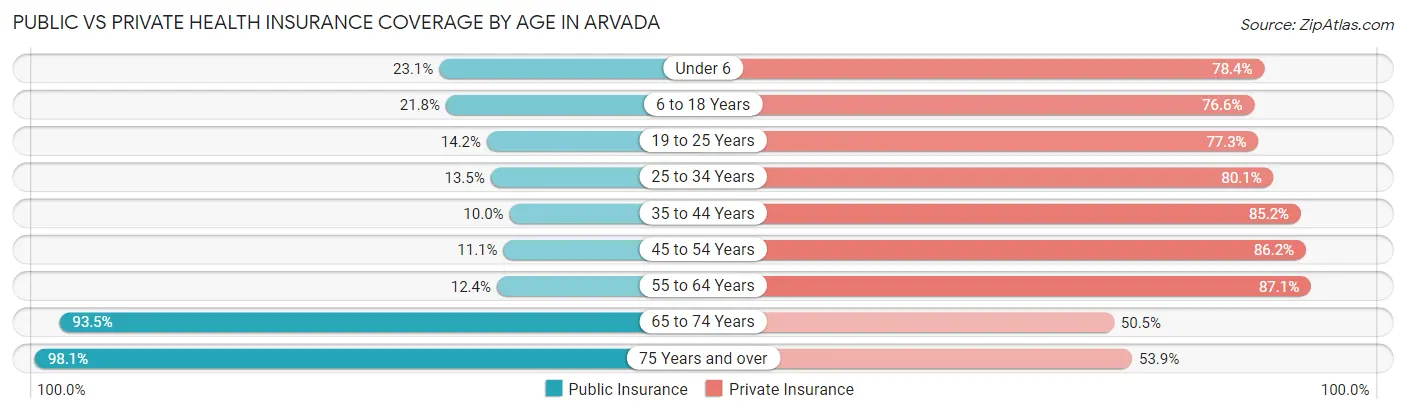
| Age Bracket | Public Insurance | Private Insurance |
| Under 6 | 1,835 (23.1%) | 6,240 (78.4%) |
| 6 to 18 Years | 3,997 (21.8%) | 14,029 (76.5%) |
| 19 to 25 Years | 1,277 (14.2%) | 6,954 (77.3%) |
| 25 to 34 Years | 2,200 (13.5%) | 13,044 (80.1%) |
| 35 to 44 Years | 1,847 (10.0%) | 15,729 (85.2%) |
| 45 to 54 Years | 1,842 (11.1%) | 14,250 (86.2%) |
| 55 to 64 Years | 1,837 (12.4%) | 12,945 (87.1%) |
| 65 to 74 Years | 12,436 (93.5%) | 6,714 (50.5%) |
| 75 Years and over | 7,737 (98.1%) | 4,250 (53.9%) |
| Total | 35,008 (28.5%) | 94,155 (76.8%) |
Disability Status by Sex by Age in Arvada
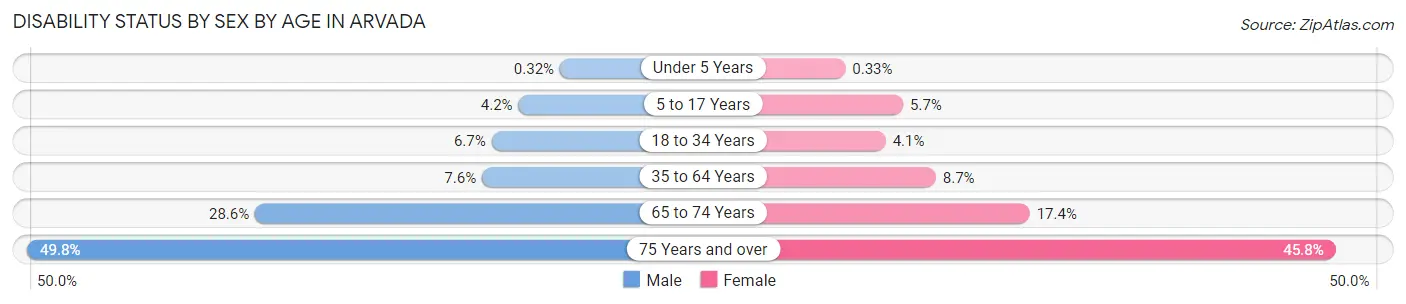
| Age Bracket | Male | Female |
| Under 5 Years | 10 (0.3%) | 11 (0.3%) |
| 5 to 17 Years | 411 (4.2%) | 485 (5.7%) |
| 18 to 34 Years | 931 (6.7%) | 523 (4.1%) |
| 35 to 64 Years | 1,868 (7.5%) | 2,194 (8.7%) |
| 65 to 74 Years | 1,806 (28.6%) | 1,218 (17.4%) |
| 75 Years and over | 1,587 (49.8%) | 2,153 (45.8%) |
Disability Class by Sex by Age in Arvada
Disability Class: Hearing Difficulty
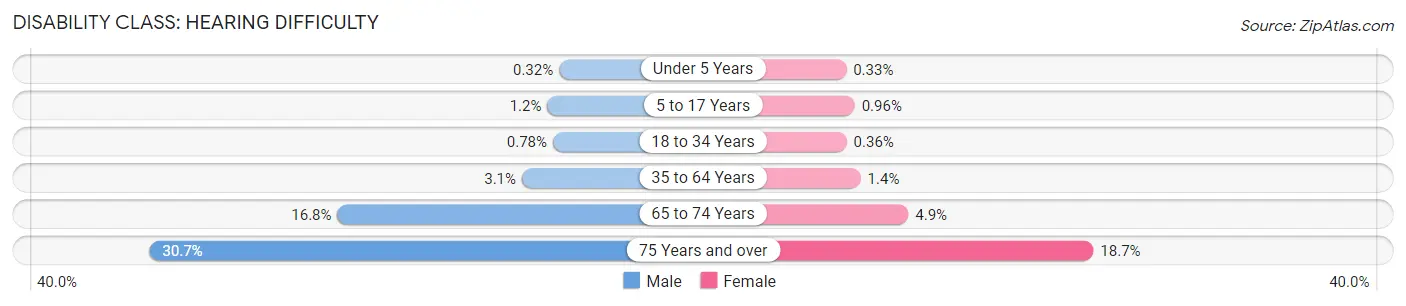
| Age Bracket | Male | Female |
| Under 5 Years | 10 (0.3%) | 11 (0.3%) |
| 5 to 17 Years | 117 (1.2%) | 82 (1.0%) |
| 18 to 34 Years | 109 (0.8%) | 46 (0.4%) |
| 35 to 64 Years | 762 (3.1%) | 351 (1.4%) |
| 65 to 74 Years | 1,059 (16.8%) | 345 (4.9%) |
| 75 Years and over | 980 (30.7%) | 878 (18.7%) |
Disability Class: Vision Difficulty
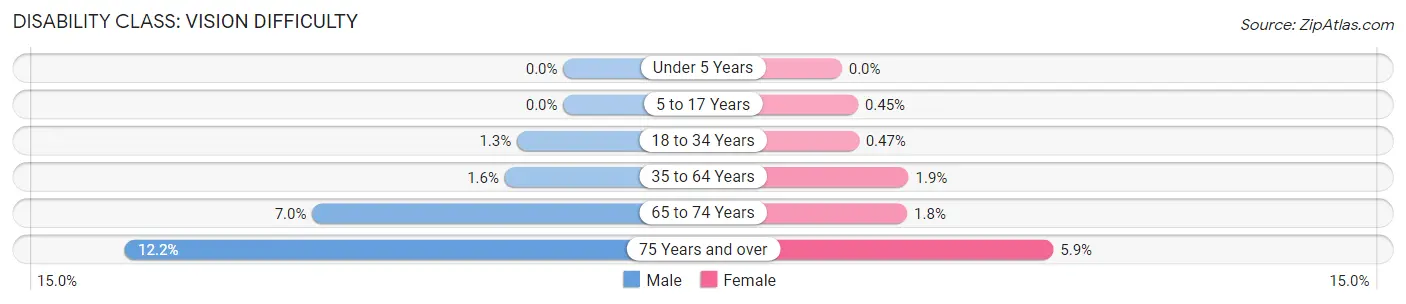
| Age Bracket | Male | Female |
| Under 5 Years | 0 (0.0%) | 0 (0.0%) |
| 5 to 17 Years | 0 (0.0%) | 38 (0.4%) |
| 18 to 34 Years | 180 (1.3%) | 60 (0.5%) |
| 35 to 64 Years | 403 (1.6%) | 467 (1.9%) |
| 65 to 74 Years | 441 (7.0%) | 127 (1.8%) |
| 75 Years and over | 389 (12.2%) | 277 (5.9%) |
Disability Class: Cognitive Difficulty
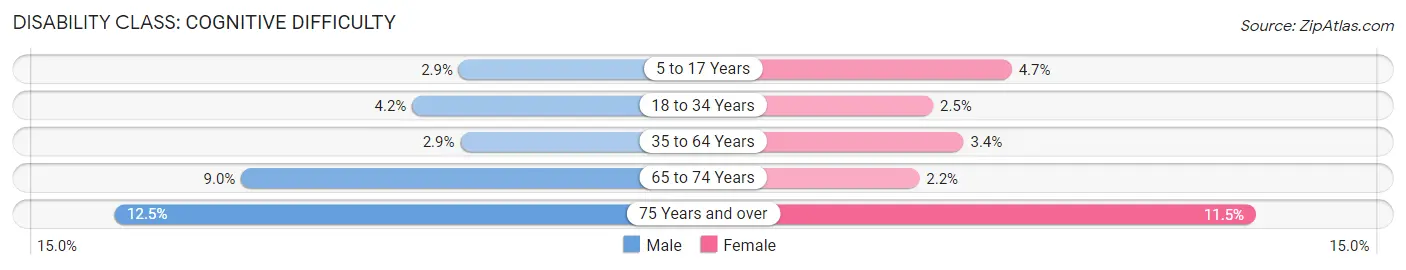
| Age Bracket | Male | Female |
| 5 to 17 Years | 287 (2.9%) | 403 (4.7%) |
| 18 to 34 Years | 589 (4.2%) | 326 (2.5%) |
| 35 to 64 Years | 710 (2.9%) | 851 (3.4%) |
| 65 to 74 Years | 566 (9.0%) | 151 (2.2%) |
| 75 Years and over | 399 (12.5%) | 542 (11.5%) |
Disability Class: Ambulatory Difficulty
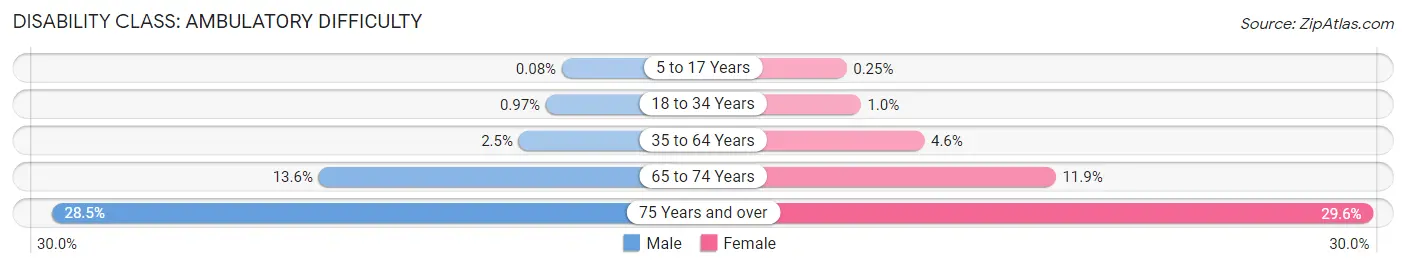
| Age Bracket | Male | Female |
| 5 to 17 Years | 8 (0.1%) | 21 (0.3%) |
| 18 to 34 Years | 135 (1.0%) | 134 (1.0%) |
| 35 to 64 Years | 614 (2.5%) | 1,152 (4.6%) |
| 65 to 74 Years | 860 (13.6%) | 831 (11.9%) |
| 75 Years and over | 909 (28.5%) | 1,391 (29.6%) |
Disability Class: Self-Care Difficulty
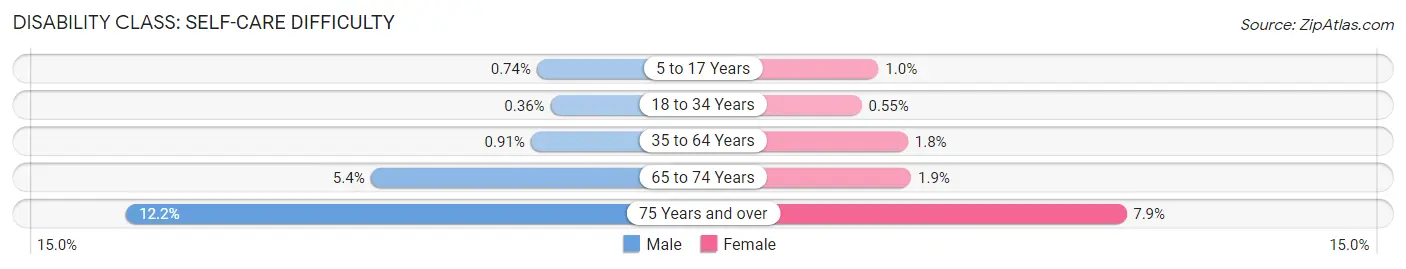
| Age Bracket | Male | Female |
| 5 to 17 Years | 73 (0.7%) | 87 (1.0%) |
| 18 to 34 Years | 51 (0.4%) | 71 (0.5%) |
| 35 to 64 Years | 225 (0.9%) | 462 (1.8%) |
| 65 to 74 Years | 339 (5.4%) | 135 (1.9%) |
| 75 Years and over | 388 (12.2%) | 372 (7.9%) |
Technology Access in Arvada
Computing Device Access in Arvada
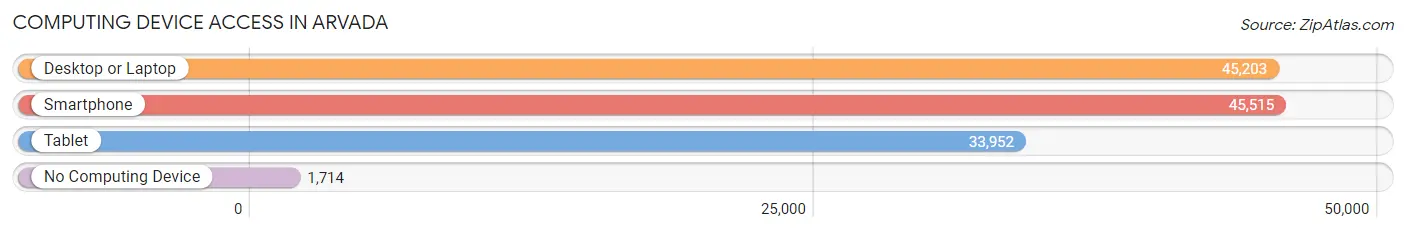
| Device Type | # Households | % Households |
| Desktop or Laptop | 45,203 | 90.0% |
| Smartphone | 45,515 | 90.6% |
| Tablet | 33,952 | 67.6% |
| No Computing Device | 1,714 | 3.4% |
| Total | 50,211 | 100.0% |
Internet Access in Arvada
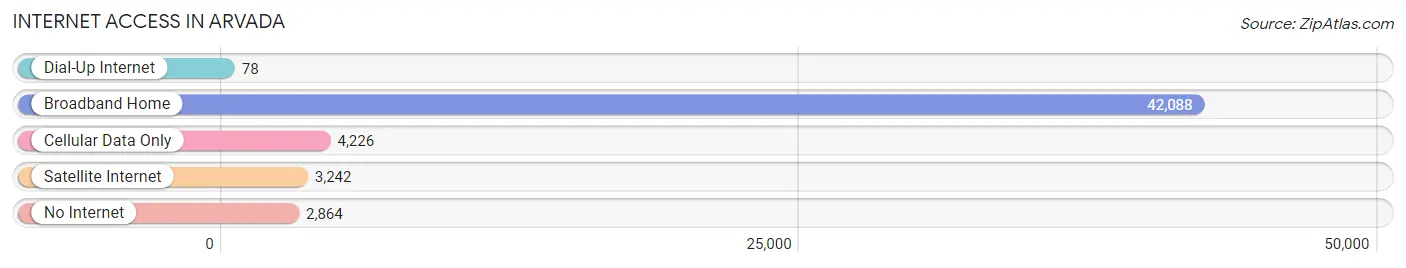
| Internet Type | # Households | % Households |
| Dial-Up Internet | 78 | 0.2% |
| Broadband Home | 42,088 | 83.8% |
| Cellular Data Only | 4,226 | 8.4% |
| Satellite Internet | 3,242 | 6.5% |
| No Internet | 2,864 | 5.7% |
| Total | 50,211 | 100.0% |
Arvada Summary
Arvada, Colorado is a city located in the Denver-Aurora-Lakewood metropolitan area in Jefferson County, Colorado. It is the seventh most populous city in the state, with a population of 106,433 as of the 2010 census. The city is located in the foothills of the Rocky Mountains, approximately 8 miles northwest of Denver.
History
Arvada was founded in 1870 by William A.H. Loveland, a former railroad president. The city was named after his wife, Mary, whose maiden name was Arvada. The city was incorporated in 1904 and has grown steadily since then.
Geography
Arvada is located in the foothills of the Rocky Mountains, approximately 8 miles northwest of Denver. The city is situated at an elevation of 5,430 feet above sea level. The city covers an area of 24.2 square miles, of which 0.1 square miles is water. The city is bordered by the cities of Westminster to the north, Broomfield to the northeast, Boulder to the east, Golden to the south, and Lakewood to the west.
Climate
Arvada has a semi-arid climate, with hot summers and cold winters. The average annual temperature is 52.2°F, with an average high of 79.2°F in July and an average low of 25.2°F in January. The average annual precipitation is 16.7 inches, with an average of 2.7 inches of snowfall per year.
Economy
Arvada’s economy is largely based on the service industry, with the largest employers being the Arvada Center for the Arts and Humanities, the Arvada Chamber of Commerce, and the Arvada Economic Development Corporation. Other major employers include the Jefferson County Public Schools, the City of Arvada, and the Arvada Fire Protection District.
Demographics
As of the 2010 census, Arvada had a population of 106,433. The racial makeup of the city was 81.3% White, 4.2% African American, 0.7% Native American, 5.2% Asian, 0.2% Pacific Islander, 5.3% from other races, and 3.1% from two or more races. Hispanic or Latino of any race were 14.6% of the population.
The median income for a household in the city was $60,945, and the median income for a family was $71,945. The per capita income for the city was $30,945. About 5.2% of families and 7.2% of the population were below the poverty line, including 9.2% of those under age 18 and 5.2% of those age 65 or over.
Arvada is a diverse city with a strong sense of community. The city is home to a variety of businesses, parks, and recreational activities, making it an ideal place to live and work. With its close proximity to Denver, Arvada is a great place to call home.
Common Questions
What is Per Capita Income in Arvada?
Per Capita income in Arvada is $52,932.
What is the Median Family Income in Arvada?
Median Family Income in Arvada is $131,766.
What is the Median Household income in Arvada?
Median Household Income in Arvada is $106,014.
What is Income or Wage Gap in Arvada?
Income or Wage Gap in Arvada is 27.9%.
Women in Arvada earn 72.1 cents for every dollar earned by a man.
What is Family Income Deficit in Arvada?
Family Income Deficit in Arvada is $11,503.
Families that are below poverty line in Arvada earn $11,503 less on average than the poverty threshold level.
What is Inequality or Gini Index in Arvada?
Inequality or Gini Index in Arvada is 0.39.
What is the Total Population of Arvada?
Total Population of Arvada is 123,066.
What is the Total Male Population of Arvada?
Total Male Population of Arvada is 61,333.
What is the Total Female Population of Arvada?
Total Female Population of Arvada is 61,733.
What is the Ratio of Males per 100 Females in Arvada?
There are 99.35 Males per 100 Females in Arvada.
What is the Ratio of Females per 100 Males in Arvada?
There are 100.65 Females per 100 Males in Arvada.
What is the Median Population Age in Arvada?
Median Population Age in Arvada is 40.2 Years.
What is the Average Family Size in Arvada
Average Family Size in Arvada is 3.0 People.
What is the Average Household Size in Arvada
Average Household Size in Arvada is 2.4 People.
How Large is the Labor Force in Arvada?
There are 71,768 People in the Labor Forcein in Arvada.
What is the Percentage of People in the Labor Force in Arvada?
70.9% of People are in the Labor Force in Arvada.
What is the Unemployment Rate in Arvada?
Unemployment Rate in Arvada is 3.8%.