Northglenn, CO Map & Demographics
Northglenn Map
Northglenn Overview
$35,595
PER CAPITA INCOME
$85,144
AVG FAMILY INCOME
$77,797
AVG HOUSEHOLD INCOME
19.7%
WAGE / INCOME GAP [ % ]
80.3¢/ $1
WAGE / INCOME GAP [ $ ]
$13,898
FAMILY INCOME DEFICIT
0.40
INEQUALITY / GINI INDEX
37,948
TOTAL POPULATION
19,406
MALE POPULATION
18,542
FEMALE POPULATION
104.66
MALES / 100 FEMALES
95.55
FEMALES / 100 MALES
34.4
MEDIAN AGE
3.2
AVG FAMILY SIZE
2.6
AVG HOUSEHOLD SIZE
21,459
LABOR FORCE [ PEOPLE ]
71.4%
PERCENT IN LABOR FORCE
4.1%
UNEMPLOYMENT RATE
Income in Northglenn
Income Overview in Northglenn
Per Capita Income in Northglenn is $35,595, while median incomes of families and households are $85,144 and $77,797 respectively.
| Characteristic | Number | Measure |
| Per Capita Income | 37,948 | $35,595 |
| Median Family Income | 9,342 | $85,144 |
| Mean Family Income | 9,342 | $94,521 |
| Median Household Income | 14,239 | $77,797 |
| Mean Household Income | 14,239 | $95,522 |
| Income Deficit | 9,342 | $13,898 |
| Wage / Income Gap (%) | 37,948 | 19.75% |
| Wage / Income Gap ($) | 37,948 | 80.25¢ per $1 |
| Gini / Inequality Index | 37,948 | 0.40 |
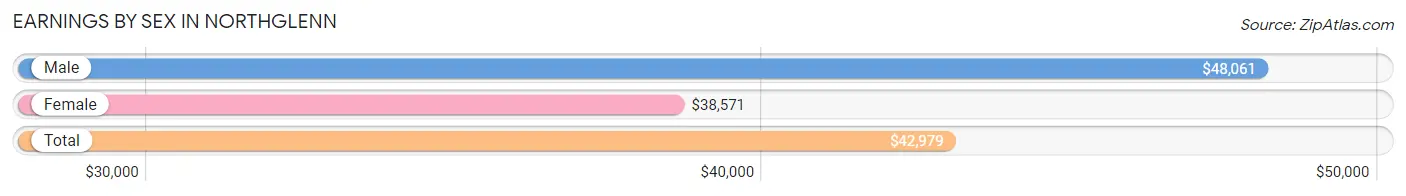
Earnings by Sex in Northglenn
Average Earnings in Northglenn are $42,979, $48,061 for men and $38,571 for women, a difference of 19.8%.
| Sex | Number | Average Earnings |
| Male | 11,889 (54.4%) | $48,061 |
| Female | 9,983 (45.6%) | $38,571 |
| Total | 21,872 (100.0%) | $42,979 |
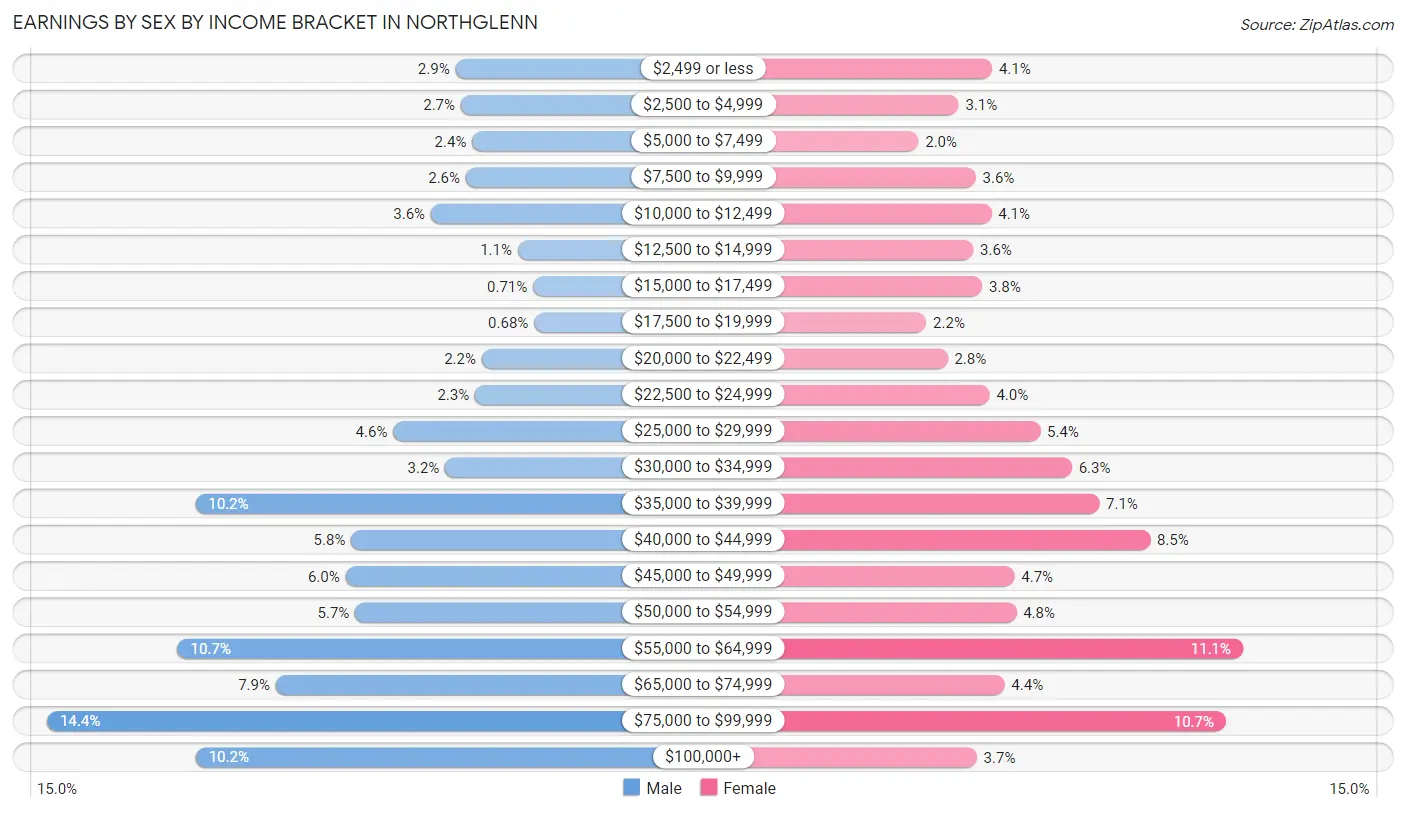
Earnings by Sex by Income Bracket in Northglenn
The most common earnings brackets in Northglenn are $75,000 to $99,999 for men (1,708 | 14.4%) and $55,000 to $64,999 for women (1,111 | 11.1%).
| Income | Male | Female |
| $2,499 or less | 344 (2.9%) | 407 (4.1%) |
| $2,500 to $4,999 | 326 (2.7%) | 313 (3.1%) |
| $5,000 to $7,499 | 288 (2.4%) | 201 (2.0%) |
| $7,500 to $9,999 | 309 (2.6%) | 361 (3.6%) |
| $10,000 to $12,499 | 426 (3.6%) | 405 (4.1%) |
| $12,500 to $14,999 | 135 (1.1%) | 354 (3.5%) |
| $15,000 to $17,499 | 85 (0.7%) | 379 (3.8%) |
| $17,500 to $19,999 | 81 (0.7%) | 223 (2.2%) |
| $20,000 to $22,499 | 256 (2.1%) | 283 (2.8%) |
| $22,500 to $24,999 | 278 (2.3%) | 400 (4.0%) |
| $25,000 to $29,999 | 552 (4.6%) | 542 (5.4%) |
| $30,000 to $34,999 | 378 (3.2%) | 631 (6.3%) |
| $35,000 to $39,999 | 1,213 (10.2%) | 708 (7.1%) |
| $40,000 to $44,999 | 692 (5.8%) | 851 (8.5%) |
| $45,000 to $49,999 | 711 (6.0%) | 470 (4.7%) |
| $50,000 to $54,999 | 679 (5.7%) | 475 (4.8%) |
| $55,000 to $64,999 | 1,272 (10.7%) | 1,111 (11.1%) |
| $65,000 to $74,999 | 944 (7.9%) | 442 (4.4%) |
| $75,000 to $99,999 | 1,708 (14.4%) | 1,063 (10.6%) |
| $100,000+ | 1,212 (10.2%) | 364 (3.6%) |
| Total | 11,889 (100.0%) | 9,983 (100.0%) |
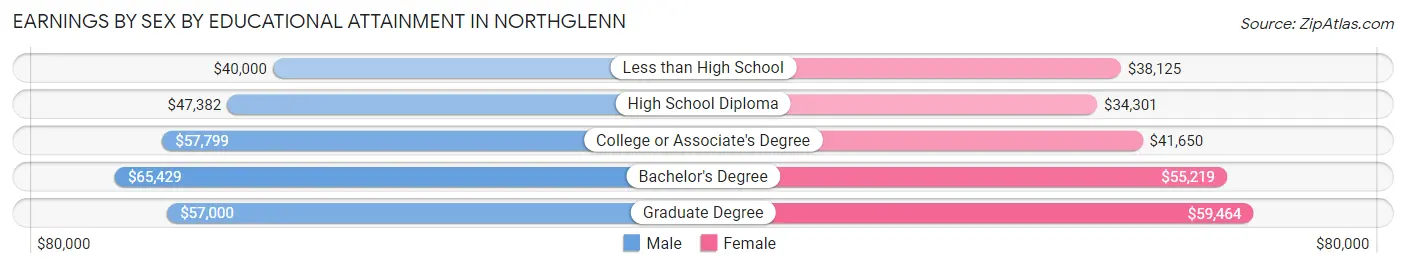
Earnings by Sex by Educational Attainment in Northglenn
Average earnings in Northglenn are $53,593 for men and $42,850 for women, a difference of 20.1%. Men with an educational attainment of bachelor's degree enjoy the highest average annual earnings of $65,429, while those with less than high school education earn the least with $40,000. Women with an educational attainment of graduate degree earn the most with the average annual earnings of $59,464, while those with high school diploma education have the smallest earnings of $34,301.
| Educational Attainment | Male Income | Female Income |
| Less than High School | $40,000 | $38,125 |
| High School Diploma | $47,382 | $34,301 |
| College or Associate's Degree | $57,799 | $41,650 |
| Bachelor's Degree | $65,429 | $55,219 |
| Graduate Degree | $57,000 | $59,464 |
| Total | $53,593 | $42,850 |
Family Income in Northglenn
Family Income Brackets in Northglenn
According to the Northglenn family income data, there are 2,560 families falling into the $100,000 to $149,999 income range, which is the most common income bracket and makes up 27.4% of all families. Conversely, the $10,000 to $14,999 income bracket is the least frequent group with only 112 families (1.2%) belonging to this category.
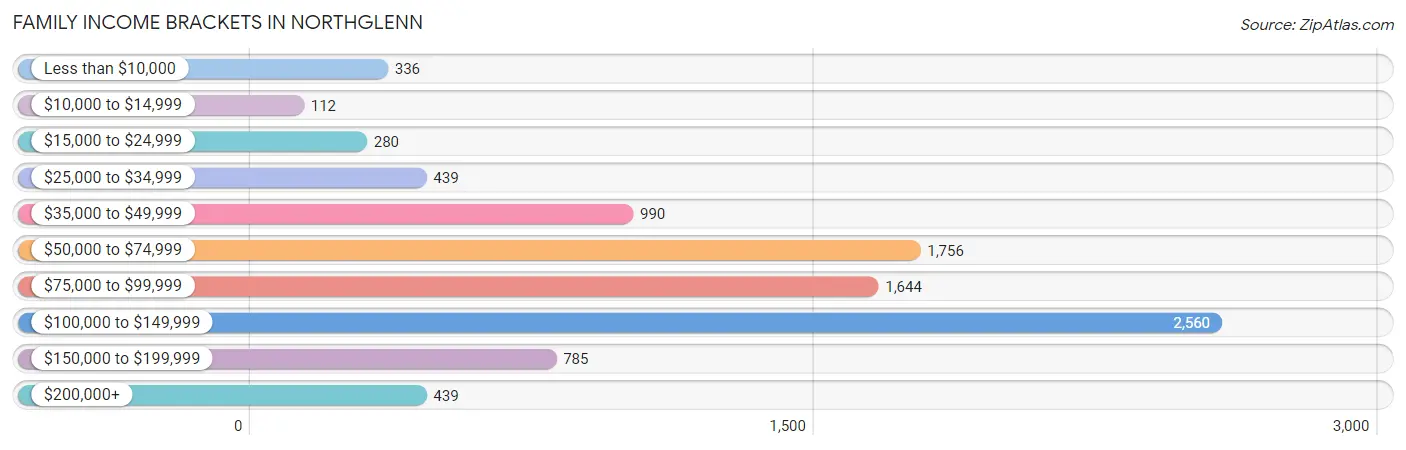
| Income Bracket | # Families | % Families |
| Less than $10,000 | 336 | 3.6% |
| $10,000 to $14,999 | 112 | 1.2% |
| $15,000 to $24,999 | 280 | 3.0% |
| $25,000 to $34,999 | 439 | 4.7% |
| $35,000 to $49,999 | 990 | 10.6% |
| $50,000 to $74,999 | 1,756 | 18.8% |
| $75,000 to $99,999 | 1,644 | 17.6% |
| $100,000 to $149,999 | 2,560 | 27.4% |
| $150,000 to $199,999 | 785 | 8.4% |
| $200,000+ | 439 | 4.7% |
Family Income by Famaliy Size in Northglenn
6-person families (418 | 4.5%) account for the highest median family income in Northglenn with $122,273 per family, while 2-person families (3,506 | 37.5%) have the highest median income of $37,463 per family member.
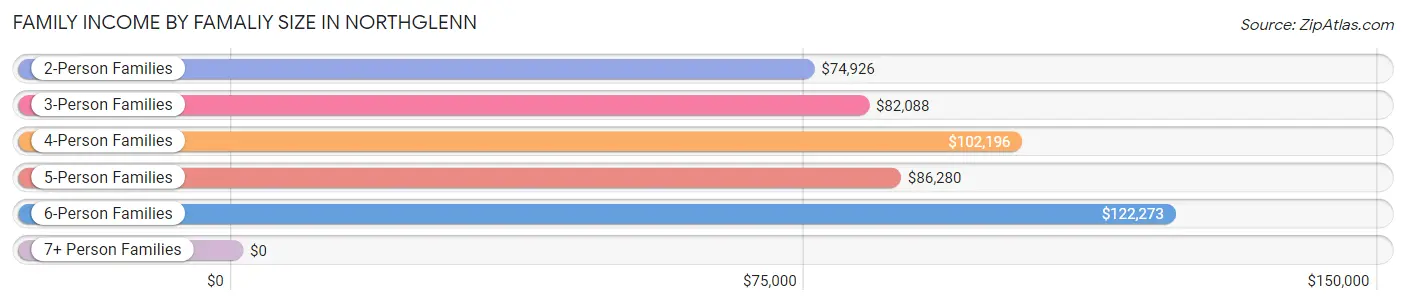
| Income Bracket | # Families | Median Income |
| 2-Person Families | 3,506 (37.5%) | $74,926 |
| 3-Person Families | 2,573 (27.5%) | $82,088 |
| 4-Person Families | 2,021 (21.6%) | $102,196 |
| 5-Person Families | 779 (8.3%) | $86,280 |
| 6-Person Families | 418 (4.5%) | $122,273 |
| 7+ Person Families | 45 (0.5%) | $0 |
| Total | 9,342 (100.0%) | $85,144 |
Family Income by Number of Earners in Northglenn
The median family income in Northglenn is $85,144, with families comprising 3+ earners (1,394) having the highest median family income of $138,900, while families with no earners (737) have the lowest median family income of $55,550, accounting for 14.9% and 7.9% of families, respectively.
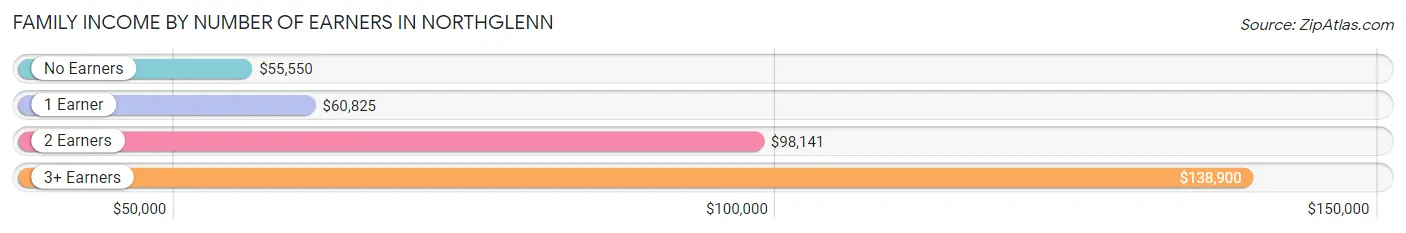
| Number of Earners | # Families | Median Income |
| No Earners | 737 (7.9%) | $55,550 |
| 1 Earner | 3,249 (34.8%) | $60,825 |
| 2 Earners | 3,962 (42.4%) | $98,141 |
| 3+ Earners | 1,394 (14.9%) | $138,900 |
| Total | 9,342 (100.0%) | $85,144 |
Household Income in Northglenn
Household Income Brackets in Northglenn
With 3,275 households falling in the category, the $100,000 to $149,999 income range is the most frequent in Northglenn, accounting for 23.0% of all households. In contrast, only 256 households (1.8%) fall into the $10,000 to $14,999 income bracket, making it the least populous group.
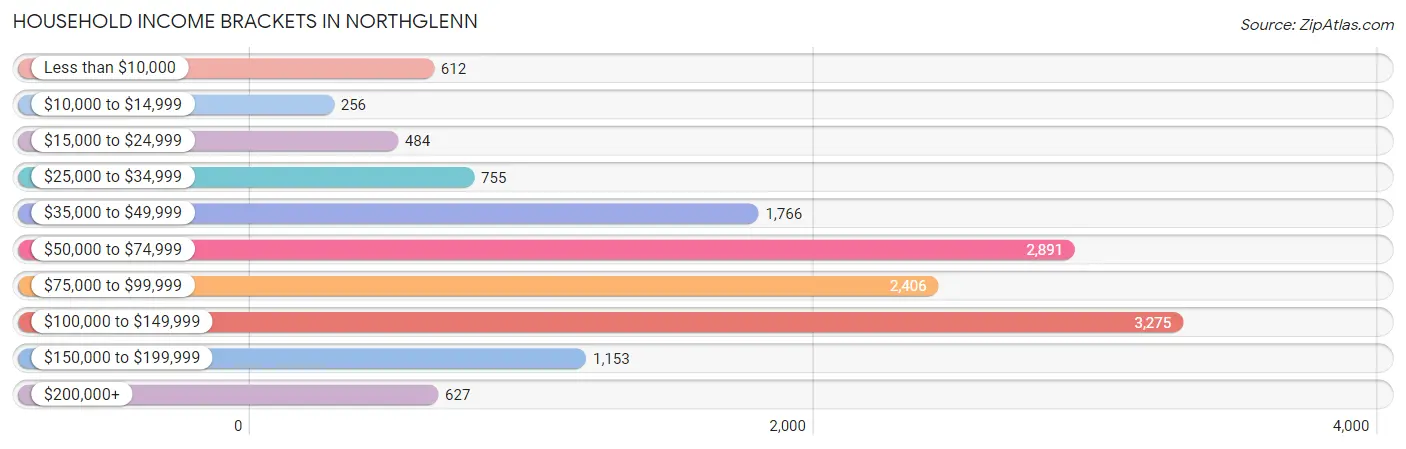
| Income Bracket | # Households | % Households |
| Less than $10,000 | 612 | 4.3% |
| $10,000 to $14,999 | 256 | 1.8% |
| $15,000 to $24,999 | 484 | 3.4% |
| $25,000 to $34,999 | 755 | 5.3% |
| $35,000 to $49,999 | 1,766 | 12.4% |
| $50,000 to $74,999 | 2,891 | 20.3% |
| $75,000 to $99,999 | 2,406 | 16.9% |
| $100,000 to $149,999 | 3,275 | 23.0% |
| $150,000 to $199,999 | 1,153 | 8.1% |
| $200,000+ | 627 | 4.4% |
Household Income by Householder Age in Northglenn
The median household income in Northglenn is $77,797, with the highest median household income of $86,975 found in the 45 to 64 years age bracket for the primary householder. A total of 4,969 households (34.9%) fall into this category. Meanwhile, the 65+ years age bracket for the primary householder has the lowest median household income of $58,113, with 2,705 households (19.0%) in this group.
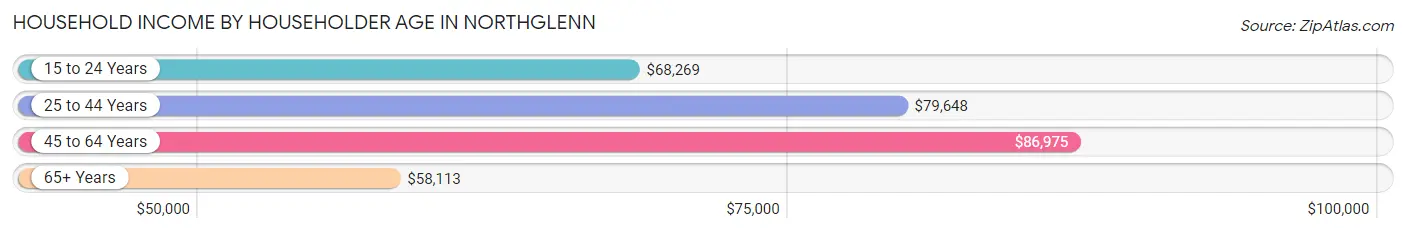
| Income Bracket | # Households | Median Income |
| 15 to 24 Years | 568 (4.0%) | $68,269 |
| 25 to 44 Years | 5,997 (42.1%) | $79,648 |
| 45 to 64 Years | 4,969 (34.9%) | $86,975 |
| 65+ Years | 2,705 (19.0%) | $58,113 |
| Total | 14,239 (100.0%) | $77,797 |
Poverty in Northglenn
Income Below Poverty by Sex and Age in Northglenn
With 10.3% poverty level for males and 10.4% for females among the residents of Northglenn, 5 year old males and 16 and 17 year old females are the most vulnerable to poverty, with 122 males (47.7%) and 141 females (32.2%) in their respective age groups living below the poverty level.
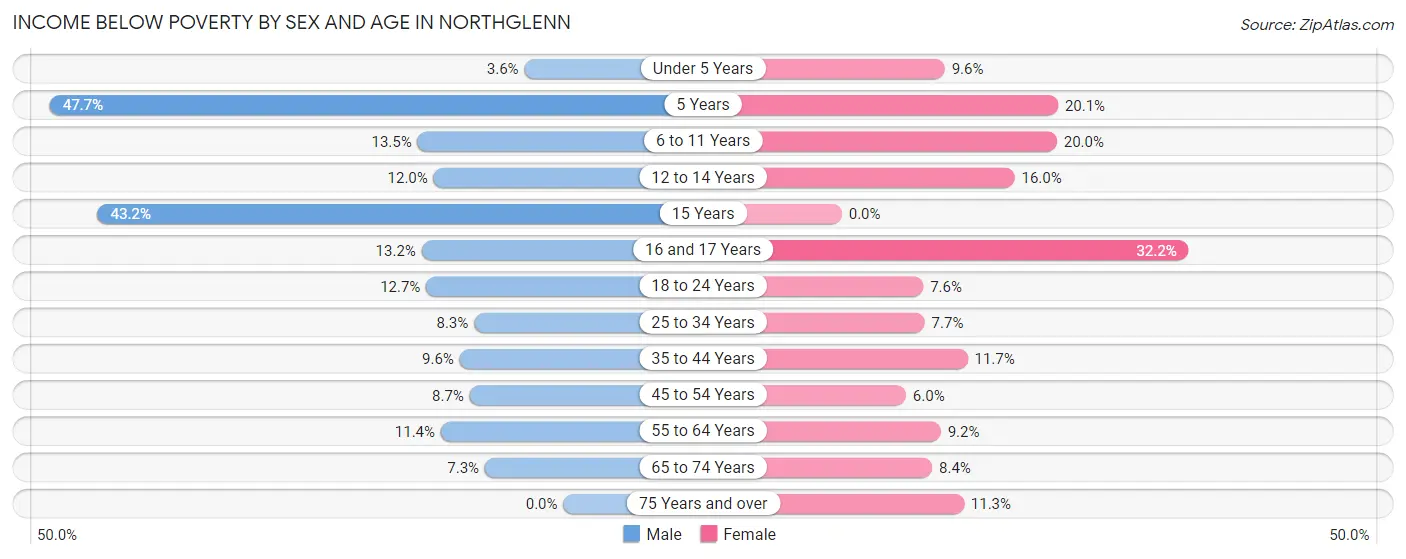
| Age Bracket | Male | Female |
| Under 5 Years | 39 (3.6%) | 100 (9.6%) |
| 5 Years | 122 (47.7%) | 65 (20.1%) |
| 6 to 11 Years | 199 (13.5%) | 245 (20.0%) |
| 12 to 14 Years | 149 (12.0%) | 125 (16.0%) |
| 15 Years | 86 (43.2%) | 0 (0.0%) |
| 16 and 17 Years | 58 (13.2%) | 141 (32.2%) |
| 18 to 24 Years | 220 (12.7%) | 143 (7.6%) |
| 25 to 34 Years | 291 (8.3%) | 275 (7.7%) |
| 35 to 44 Years | 293 (9.6%) | 282 (11.7%) |
| 45 to 54 Years | 197 (8.7%) | 133 (5.9%) |
| 55 to 64 Years | 251 (11.4%) | 170 (9.2%) |
| 65 to 74 Years | 78 (7.3%) | 101 (8.4%) |
| 75 Years and over | 0 (0.0%) | 139 (11.3%) |
| Total | 1,983 (10.3%) | 1,919 (10.4%) |
Income Above Poverty by Sex and Age in Northglenn
According to the poverty statistics in Northglenn, males aged 75 years and over and females aged 15 years are the age groups that are most secure financially, with 100.0% of males and 100.0% of females in these age groups living above the poverty line.
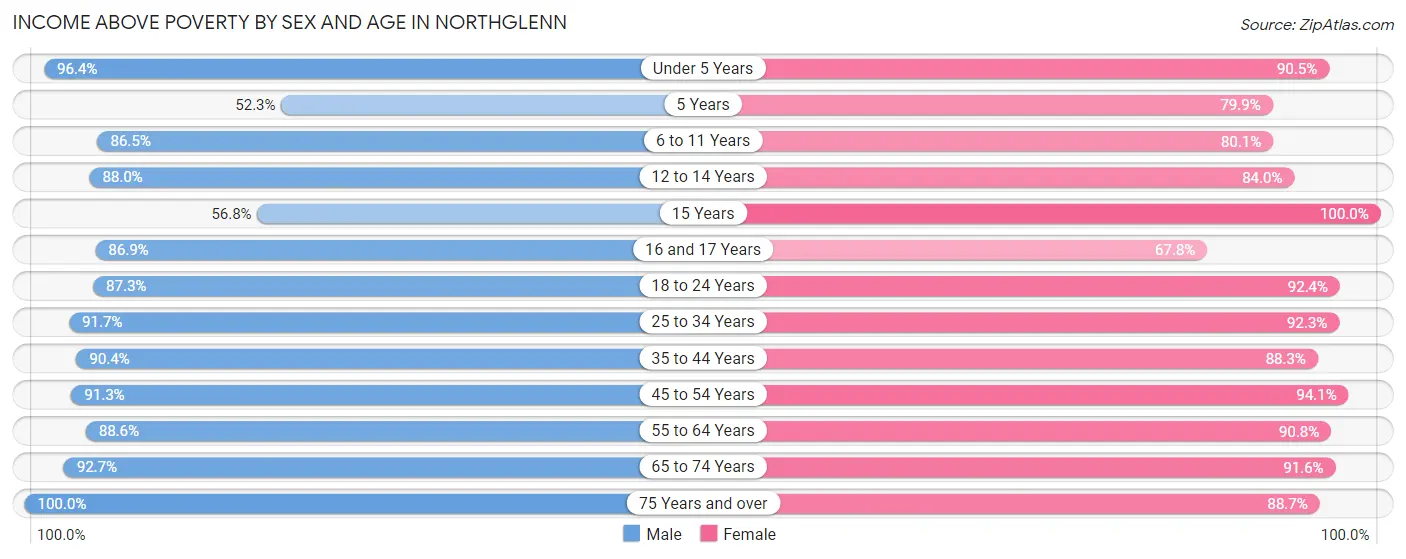
| Age Bracket | Male | Female |
| Under 5 Years | 1,040 (96.4%) | 947 (90.4%) |
| 5 Years | 134 (52.3%) | 259 (79.9%) |
| 6 to 11 Years | 1,272 (86.5%) | 983 (80.0%) |
| 12 to 14 Years | 1,089 (88.0%) | 655 (84.0%) |
| 15 Years | 113 (56.8%) | 222 (100.0%) |
| 16 and 17 Years | 383 (86.9%) | 297 (67.8%) |
| 18 to 24 Years | 1,508 (87.3%) | 1,748 (92.4%) |
| 25 to 34 Years | 3,225 (91.7%) | 3,300 (92.3%) |
| 35 to 44 Years | 2,752 (90.4%) | 2,135 (88.3%) |
| 45 to 54 Years | 2,070 (91.3%) | 2,104 (94.1%) |
| 55 to 64 Years | 1,957 (88.6%) | 1,682 (90.8%) |
| 65 to 74 Years | 994 (92.7%) | 1,104 (91.6%) |
| 75 Years and over | 776 (100.0%) | 1,088 (88.7%) |
| Total | 17,313 (89.7%) | 16,524 (89.6%) |
Income Below Poverty Among Married-Couple Families in Northglenn
The poverty statistics for married-couple families in Northglenn show that 5.5% or 358 of the total 6,533 families live below the poverty line. Families with 1 or 2 children have the highest poverty rate of 12.8%, comprising of 280 families. On the other hand, families with no children have the lowest poverty rate of 0.0%, which includes 0 families.
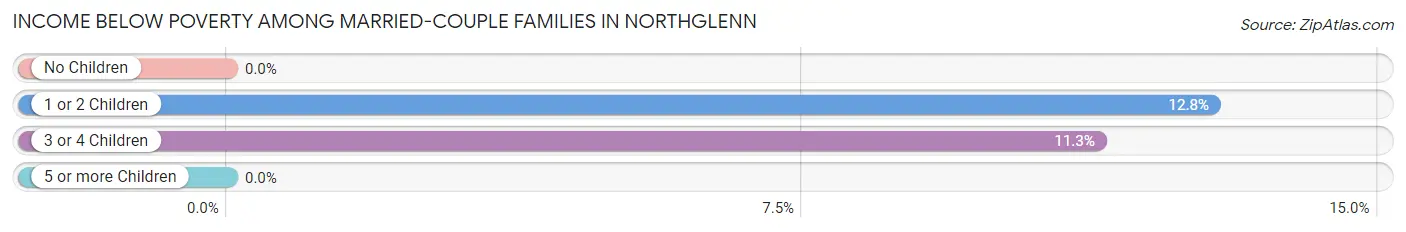
| Children | Above Poverty | Below Poverty |
| No Children | 3,662 (100.0%) | 0 (0.0%) |
| 1 or 2 Children | 1,903 (87.2%) | 280 (12.8%) |
| 3 or 4 Children | 610 (88.7%) | 78 (11.3%) |
| 5 or more Children | 0 (0.0%) | 0 (0.0%) |
| Total | 6,175 (94.5%) | 358 (5.5%) |
Income Below Poverty Among Single-Parent Households in Northglenn
According to the poverty data in Northglenn, 12.5% or 105 single-father households and 14.4% or 283 single-mother households are living below the poverty line. Among single-father households, those with no children have the highest poverty rate, with 67 households (16.9%) experiencing poverty. Likewise, among single-mother households, those with 5 or more children have the highest poverty rate, with 27 households (100.0%) falling below the poverty line.
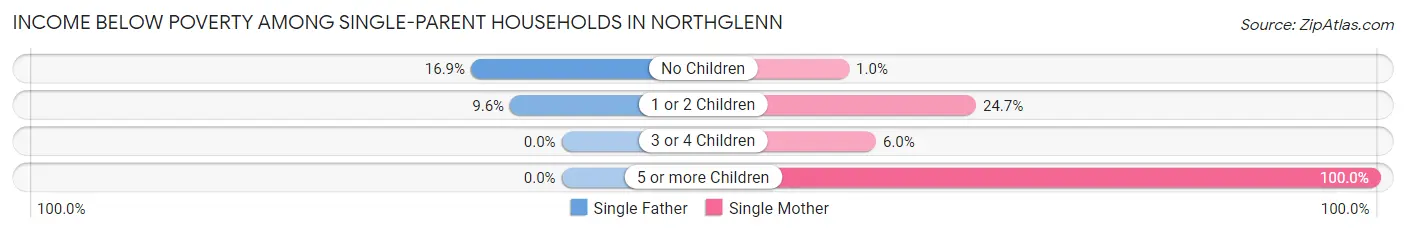
| Children | Single Father | Single Mother |
| No Children | 67 (16.9%) | 8 (1.0%) |
| 1 or 2 Children | 38 (9.6%) | 236 (24.7%) |
| 3 or 4 Children | 0 (0.0%) | 12 (6.0%) |
| 5 or more Children | 0 (0.0%) | 27 (100.0%) |
| Total | 105 (12.5%) | 283 (14.4%) |
Income Below Poverty Among Married-Couple vs Single-Parent Households in Northglenn
The poverty data for Northglenn shows that 358 of the married-couple family households (5.5%) and 388 of the single-parent households (13.8%) are living below the poverty level. Within the married-couple family households, those with 1 or 2 children have the highest poverty rate, with 280 households (12.8%) falling below the poverty line. Among the single-parent households, those with 5 or more children have the highest poverty rate, with 27 household (100.0%) living below poverty.
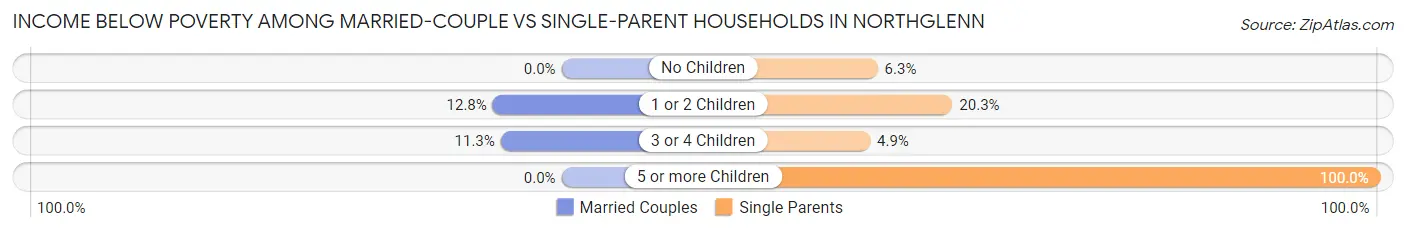
| Children | Married-Couple Families | Single-Parent Households |
| No Children | 0 (0.0%) | 75 (6.3%) |
| 1 or 2 Children | 280 (12.8%) | 274 (20.3%) |
| 3 or 4 Children | 78 (11.3%) | 12 (4.9%) |
| 5 or more Children | 0 (0.0%) | 27 (100.0%) |
| Total | 358 (5.5%) | 388 (13.8%) |
Race in Northglenn
The most populous races in Northglenn are White / Caucasian (26,860 | 70.8%), Hispanic or Latino (12,585 | 33.2%), and Two or more Races (5,846 | 15.4%).
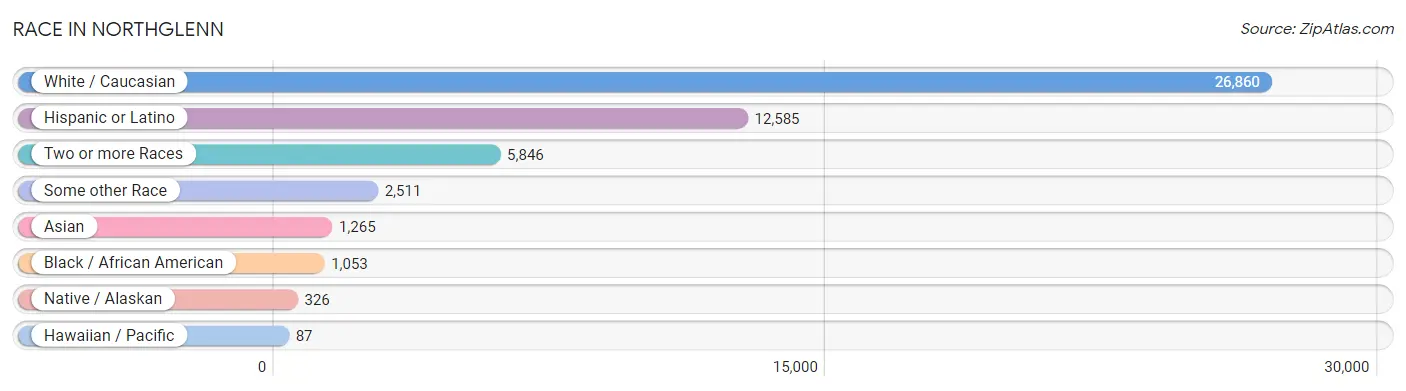
| Race | # Population | % Population |
| Asian | 1,265 | 3.3% |
| Black / African American | 1,053 | 2.8% |
| Hawaiian / Pacific | 87 | 0.2% |
| Hispanic or Latino | 12,585 | 33.2% |
| Native / Alaskan | 326 | 0.9% |
| White / Caucasian | 26,860 | 70.8% |
| Two or more Races | 5,846 | 15.4% |
| Some other Race | 2,511 | 6.6% |
| Total | 37,948 | 100.0% |
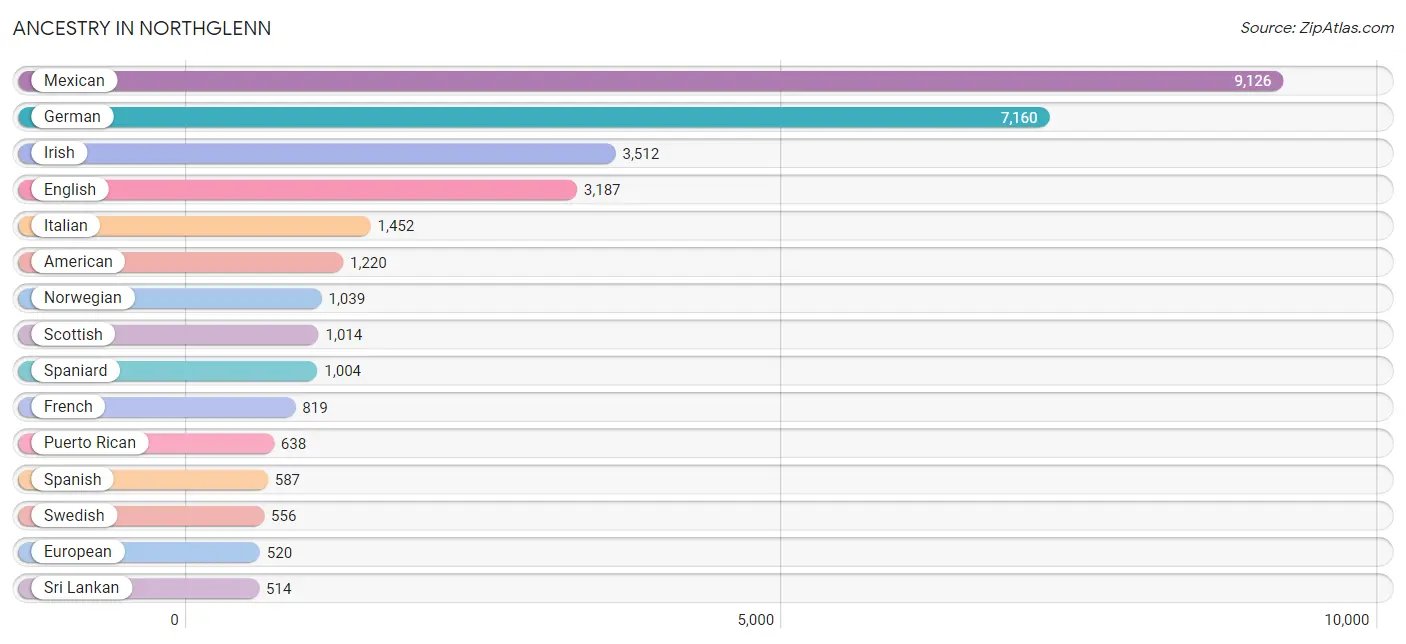
Ancestry in Northglenn
The most populous ancestries reported in Northglenn are Mexican (9,126 | 24.0%), German (7,160 | 18.9%), Irish (3,512 | 9.2%), English (3,187 | 8.4%), and Italian (1,452 | 3.8%), together accounting for 64.4% of all Northglenn residents.
| Ancestry | # Population | % Population |
| Afghan | 28 | 0.1% |
| African | 60 | 0.2% |
| Alaska Native | 10 | 0.0% |
| Albanian | 16 | 0.0% |
| American | 1,220 | 3.2% |
| Arab | 391 | 1.0% |
| Arapaho | 72 | 0.2% |
| Austrian | 98 | 0.3% |
| Bangladeshi | 153 | 0.4% |
| Barbadian | 9 | 0.0% |
| Bhutanese | 190 | 0.5% |
| Blackfeet | 51 | 0.1% |
| British | 489 | 1.3% |
| British West Indian | 11 | 0.0% |
| Bulgarian | 55 | 0.1% |
| Burmese | 91 | 0.2% |
| Canadian | 39 | 0.1% |
| Cape Verdean | 18 | 0.1% |
| Central American | 132 | 0.4% |
| Cherokee | 134 | 0.4% |
| Chilean | 83 | 0.2% |
| Choctaw | 15 | 0.0% |
| Colombian | 313 | 0.8% |
| Croatian | 11 | 0.0% |
| Cuban | 244 | 0.6% |
| Czech | 341 | 0.9% |
| Czechoslovakian | 235 | 0.6% |
| Danish | 287 | 0.8% |
| Dutch | 189 | 0.5% |
| Eastern European | 26 | 0.1% |
| Egyptian | 70 | 0.2% |
| English | 3,187 | 8.4% |
| European | 520 | 1.4% |
| Finnish | 16 | 0.0% |
| French | 819 | 2.2% |
| French Canadian | 84 | 0.2% |
| German | 7,160 | 18.9% |
| Greek | 11 | 0.0% |
| Guatemalan | 41 | 0.1% |
| Hungarian | 143 | 0.4% |
| Indian (Asian) | 298 | 0.8% |
| Iranian | 91 | 0.2% |
| Irish | 3,512 | 9.2% |
| Iroquois | 24 | 0.1% |
| Italian | 1,452 | 3.8% |
| Japanese | 23 | 0.1% |
| Jordanian | 22 | 0.1% |
| Korean | 259 | 0.7% |
| Laotian | 9 | 0.0% |
| Lebanese | 92 | 0.2% |
| Lithuanian | 32 | 0.1% |
| Luxembourger | 5 | 0.0% |
| Malaysian | 25 | 0.1% |
| Mexican | 9,126 | 24.0% |
| Moroccan | 88 | 0.2% |
| Native Hawaiian | 257 | 0.7% |
| Navajo | 269 | 0.7% |
| Norwegian | 1,039 | 2.7% |
| Pakistani | 37 | 0.1% |
| Palestinian | 7 | 0.0% |
| Pennsylvania German | 13 | 0.0% |
| Polish | 448 | 1.2% |
| Pueblo | 41 | 0.1% |
| Puerto Rican | 638 | 1.7% |
| Puget Sound Salish | 27 | 0.1% |
| Russian | 356 | 0.9% |
| Salvadoran | 91 | 0.2% |
| Scandinavian | 185 | 0.5% |
| Scotch-Irish | 256 | 0.7% |
| Scottish | 1,014 | 2.7% |
| Sioux | 82 | 0.2% |
| Slovak | 38 | 0.1% |
| Slovene | 20 | 0.1% |
| South African | 13 | 0.0% |
| South American | 437 | 1.1% |
| Spaniard | 1,004 | 2.6% |
| Spanish | 587 | 1.5% |
| Spanish American | 67 | 0.2% |
| Sri Lankan | 514 | 1.3% |
| Subsaharan African | 110 | 0.3% |
| Swedish | 556 | 1.5% |
| Swiss | 110 | 0.3% |
| Syrian | 13 | 0.0% |
| Thai | 38 | 0.1% |
| U.S. Virgin Islander | 90 | 0.2% |
| Ugandan | 60 | 0.2% |
| Ukrainian | 120 | 0.3% |
| Ute | 43 | 0.1% |
| Venezuelan | 38 | 0.1% |
| Welsh | 494 | 1.3% | View All 90 Rows |
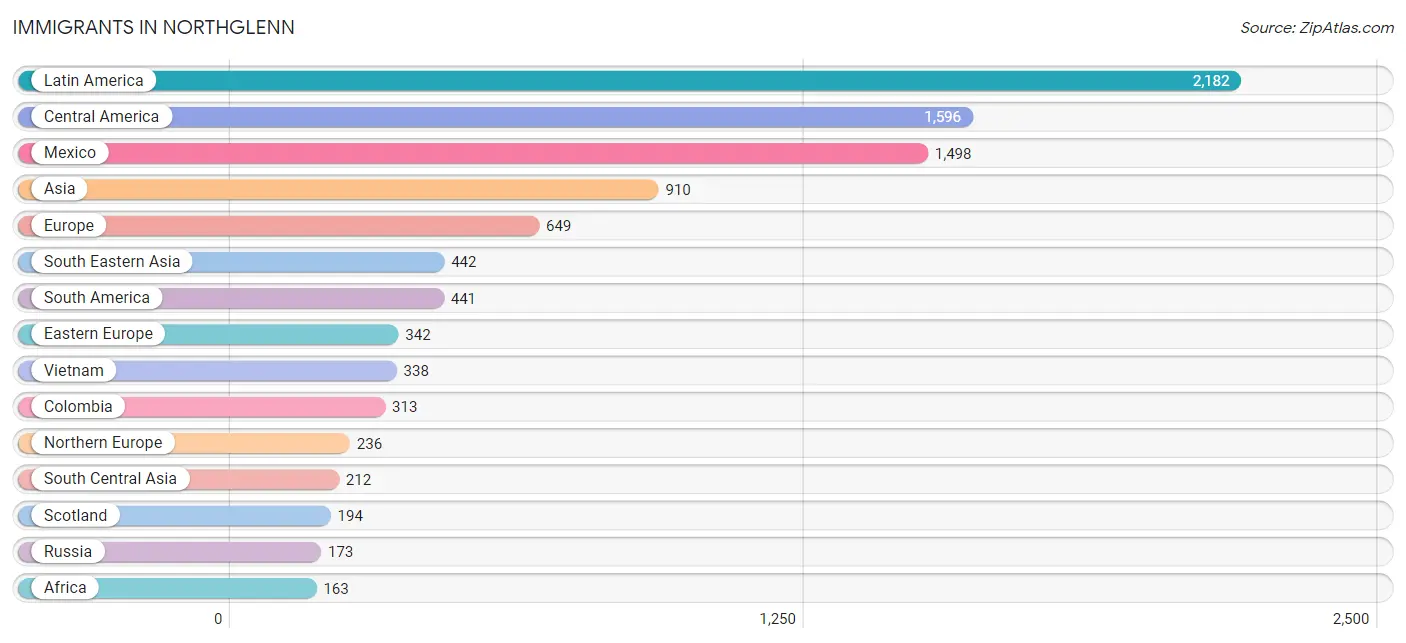
Immigrants in Northglenn
The most numerous immigrant groups reported in Northglenn came from Latin America (2,182 | 5.8%), Central America (1,596 | 4.2%), Mexico (1,498 | 4.0%), Asia (910 | 2.4%), and Europe (649 | 1.7%), together accounting for 18.0% of all Northglenn residents.
| Immigration Origin | # Population | % Population |
| Afghanistan | 67 | 0.2% |
| Africa | 163 | 0.4% |
| Asia | 910 | 2.4% |
| Barbados | 9 | 0.0% |
| Bulgaria | 32 | 0.1% |
| Cabo Verde | 20 | 0.1% |
| Canada | 51 | 0.1% |
| Caribbean | 145 | 0.4% |
| Central America | 1,596 | 4.2% |
| China | 100 | 0.3% |
| Colombia | 313 | 0.8% |
| Cuba | 125 | 0.3% |
| Czechoslovakia | 34 | 0.1% |
| Eastern Africa | 60 | 0.2% |
| Eastern Asia | 124 | 0.3% |
| Eastern Europe | 342 | 0.9% |
| Egypt | 70 | 0.2% |
| El Salvador | 68 | 0.2% |
| England | 4 | 0.0% |
| Europe | 649 | 1.7% |
| France | 9 | 0.0% |
| Germany | 62 | 0.2% |
| Guatemala | 30 | 0.1% |
| India | 19 | 0.1% |
| Indonesia | 9 | 0.0% |
| Iran | 91 | 0.2% |
| Iraq | 66 | 0.2% |
| Ireland | 22 | 0.1% |
| Japan | 17 | 0.0% |
| Korea | 7 | 0.0% |
| Laos | 38 | 0.1% |
| Latin America | 2,182 | 5.8% |
| Lebanon | 27 | 0.1% |
| Mexico | 1,498 | 4.0% |
| Nepal | 35 | 0.1% |
| Northern Africa | 70 | 0.2% |
| Northern Europe | 236 | 0.6% |
| Peru | 87 | 0.2% |
| Philippines | 46 | 0.1% |
| Poland | 10 | 0.0% |
| Russia | 173 | 0.5% |
| Saudi Arabia | 39 | 0.1% |
| Scotland | 194 | 0.5% |
| South Africa | 13 | 0.0% |
| South America | 441 | 1.2% |
| South Central Asia | 212 | 0.6% |
| South Eastern Asia | 442 | 1.2% |
| Taiwan | 19 | 0.1% |
| Thailand | 11 | 0.0% |
| Uganda | 60 | 0.2% |
| Ukraine | 93 | 0.3% |
| Venezuela | 41 | 0.1% |
| Vietnam | 338 | 0.9% |
| Western Africa | 20 | 0.1% |
| Western Asia | 132 | 0.4% |
| Western Europe | 71 | 0.2% | View All 56 Rows |
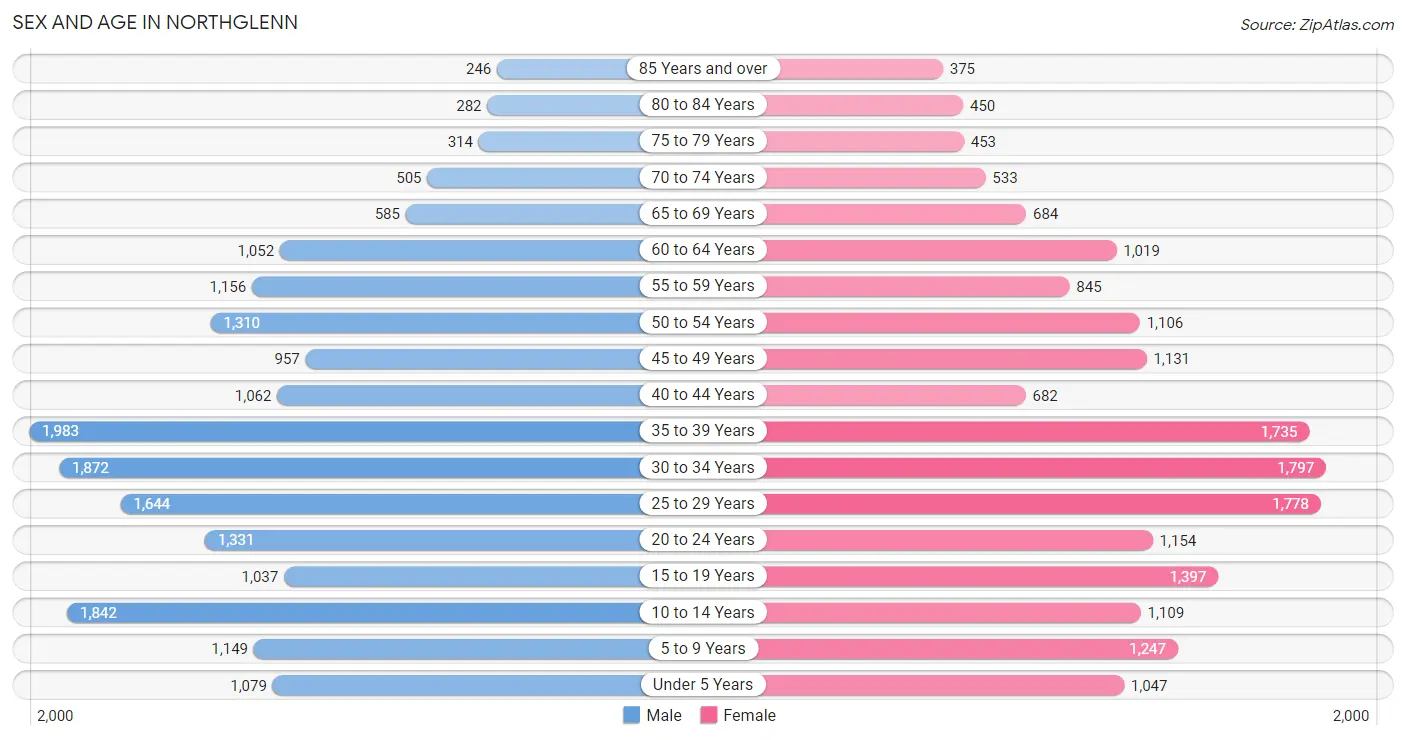
Sex and Age in Northglenn
Sex and Age in Northglenn
The most populous age groups in Northglenn are 35 to 39 Years (1,983 | 10.2%) for men and 30 to 34 Years (1,797 | 9.7%) for women.
| Age Bracket | Male | Female |
| Under 5 Years | 1,079 (5.6%) | 1,047 (5.7%) |
| 5 to 9 Years | 1,149 (5.9%) | 1,247 (6.7%) |
| 10 to 14 Years | 1,842 (9.5%) | 1,109 (6.0%) |
| 15 to 19 Years | 1,037 (5.3%) | 1,397 (7.5%) |
| 20 to 24 Years | 1,331 (6.9%) | 1,154 (6.2%) |
| 25 to 29 Years | 1,644 (8.5%) | 1,778 (9.6%) |
| 30 to 34 Years | 1,872 (9.7%) | 1,797 (9.7%) |
| 35 to 39 Years | 1,983 (10.2%) | 1,735 (9.4%) |
| 40 to 44 Years | 1,062 (5.5%) | 682 (3.7%) |
| 45 to 49 Years | 957 (4.9%) | 1,131 (6.1%) |
| 50 to 54 Years | 1,310 (6.8%) | 1,106 (6.0%) |
| 55 to 59 Years | 1,156 (6.0%) | 845 (4.6%) |
| 60 to 64 Years | 1,052 (5.4%) | 1,019 (5.5%) |
| 65 to 69 Years | 585 (3.0%) | 684 (3.7%) |
| 70 to 74 Years | 505 (2.6%) | 533 (2.9%) |
| 75 to 79 Years | 314 (1.6%) | 453 (2.4%) |
| 80 to 84 Years | 282 (1.5%) | 450 (2.4%) |
| 85 Years and over | 246 (1.3%) | 375 (2.0%) |
| Total | 19,406 (100.0%) | 18,542 (100.0%) |
Families and Households in Northglenn
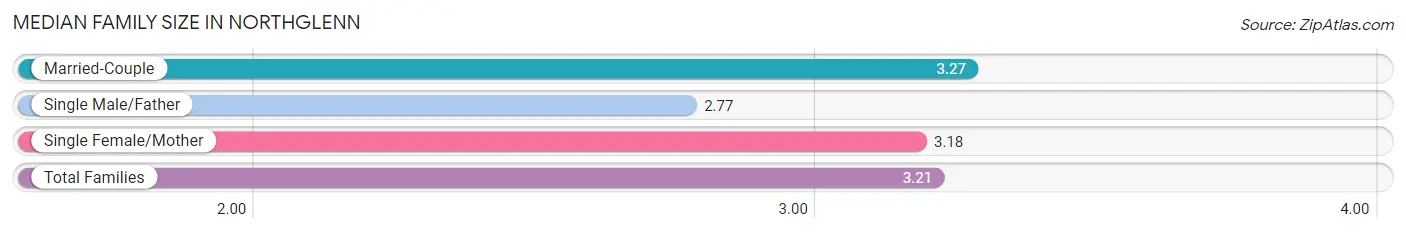
Median Family Size in Northglenn
The median family size in Northglenn is 3.21 persons per family, with married-couple families (6,533 | 69.9%) accounting for the largest median family size of 3.27 persons per family. On the other hand, single male/father families (838 | 9.0%) represent the smallest median family size with 2.77 persons per family.
| Family Type | # Families | Family Size |
| Married-Couple | 6,533 (69.9%) | 3.27 |
| Single Male/Father | 838 (9.0%) | 2.77 |
| Single Female/Mother | 1,971 (21.1%) | 3.18 |
| Total Families | 9,342 (100.0%) | 3.21 |
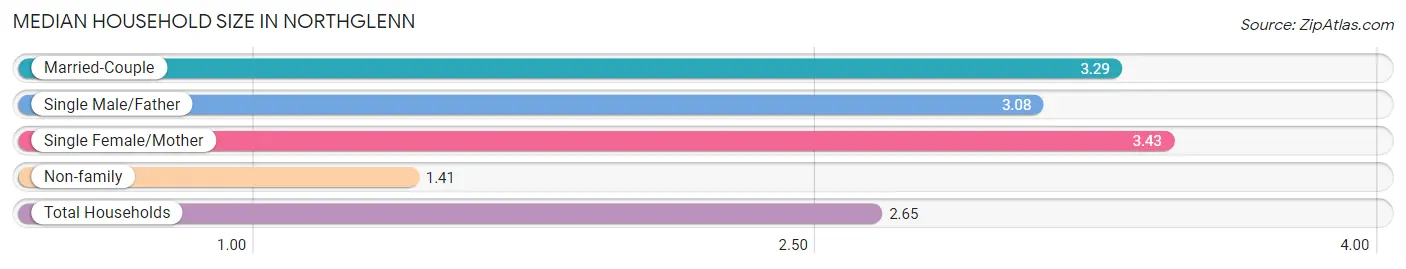
Median Household Size in Northglenn
The median household size in Northglenn is 2.65 persons per household, with single female/mother households (1,971 | 13.8%) accounting for the largest median household size of 3.43 persons per household. non-family households (4,897 | 34.4%) represent the smallest median household size with 1.41 persons per household.
| Household Type | # Households | Household Size |
| Married-Couple | 6,533 (45.9%) | 3.29 |
| Single Male/Father | 838 (5.9%) | 3.08 |
| Single Female/Mother | 1,971 (13.8%) | 3.43 |
| Non-family | 4,897 (34.4%) | 1.41 |
| Total Households | 14,239 (100.0%) | 2.65 |
Household Size by Marriage Status in Northglenn
Out of a total of 14,239 households in Northglenn, 9,342 (65.6%) are family households, while 4,897 (34.4%) are nonfamily households. The most numerous type of family households are 2-person households, comprising 3,201, and the most common type of nonfamily households are 1-person households, comprising 3,528.
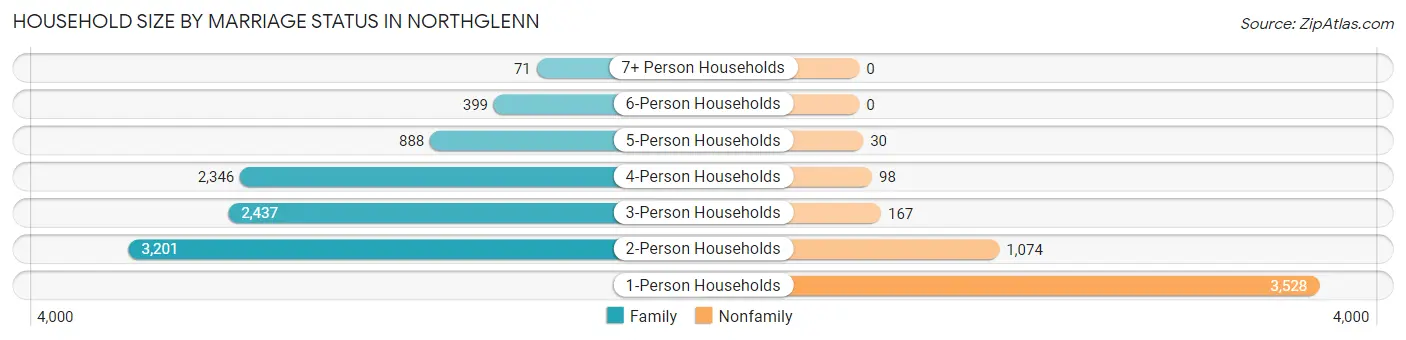
| Household Size | Family Households | Nonfamily Households |
| 1-Person Households | - | 3,528 (24.8%) |
| 2-Person Households | 3,201 (22.5%) | 1,074 (7.5%) |
| 3-Person Households | 2,437 (17.1%) | 167 (1.2%) |
| 4-Person Households | 2,346 (16.5%) | 98 (0.7%) |
| 5-Person Households | 888 (6.2%) | 30 (0.2%) |
| 6-Person Households | 399 (2.8%) | 0 (0.0%) |
| 7+ Person Households | 71 (0.5%) | 0 (0.0%) |
| Total | 9,342 (65.6%) | 4,897 (34.4%) |
Female Fertility in Northglenn
Fertility by Age in Northglenn
Average fertility rate in Northglenn is 64.0 births per 1,000 women. Women in the age bracket of 20 to 34 years have the highest fertility rate with 103.0 births per 1,000 women. Women in the age bracket of 20 to 34 years acount for 76.9% of all women with births.
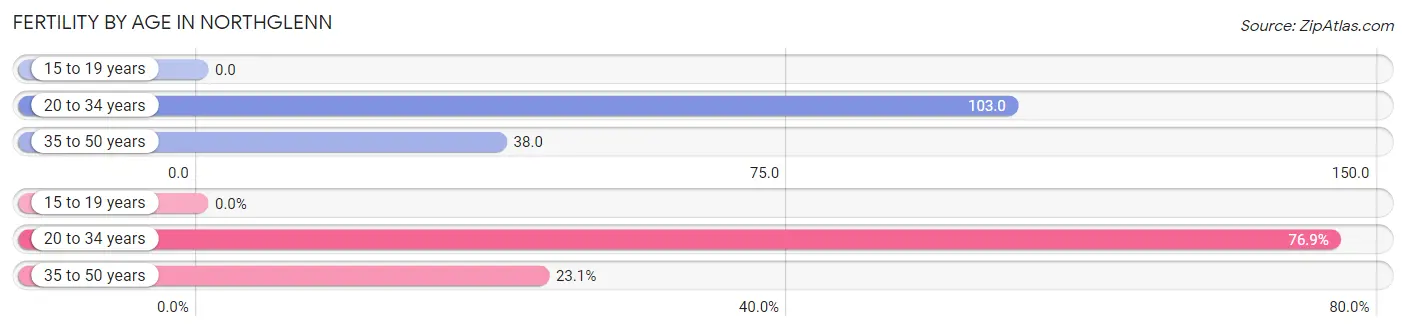
| Age Bracket | Women with Births | Births / 1,000 Women |
| 15 to 19 years | 0 (0.0%) | 0.0 |
| 20 to 34 years | 485 (76.9%) | 103.0 |
| 35 to 50 years | 146 (23.1%) | 38.0 |
| Total | 631 (100.0%) | 64.0 |
Fertility by Age by Marriage Status in Northglenn
66.9% of women with births (631) in Northglenn are married. The highest percentage of unmarried women with births falls into 20 to 34 years age bracket with 40.2% of them unmarried at the time of birth, while the lowest percentage of unmarried women with births belong to 35 to 50 years age bracket with 9.6% of them unmarried.
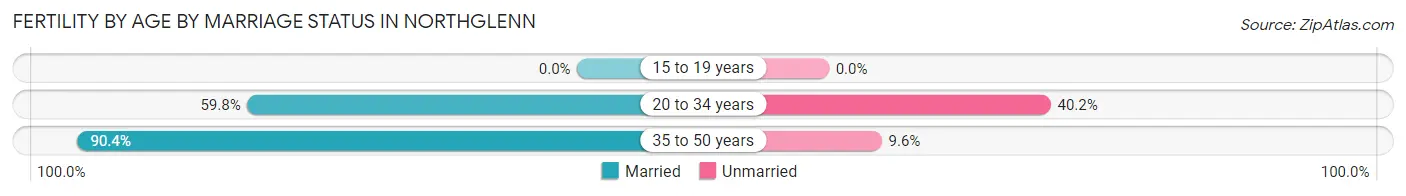
| Age Bracket | Married | Unmarried |
| 15 to 19 years | 0 (0.0%) | 0 (0.0%) |
| 20 to 34 years | 290 (59.8%) | 195 (40.2%) |
| 35 to 50 years | 132 (90.4%) | 14 (9.6%) |
| Total | 422 (66.9%) | 209 (33.1%) |
Fertility by Education in Northglenn
Average fertility rate in Northglenn is 64.0 births per 1,000 women. Women with the education attainment of graduate degree have the highest fertility rate of 129.0 births per 1,000 women, while women with the education attainment of high school diploma have the lowest fertility at 21.0 births per 1,000 women. Women with the education attainment of college or associate's degree represent 48.8% of all women with births.
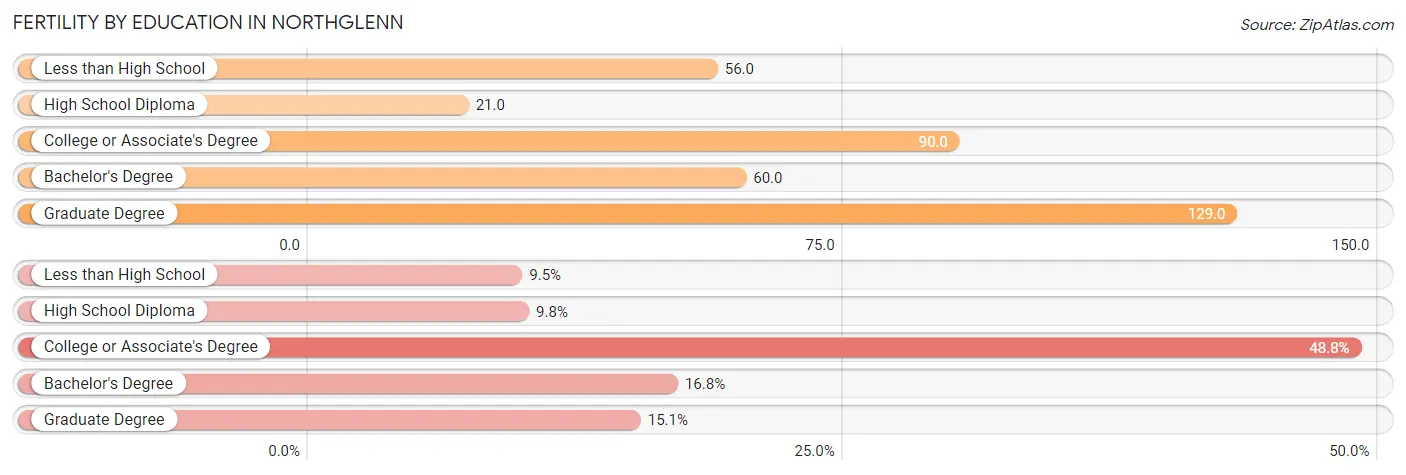
| Educational Attainment | Women with Births | Births / 1,000 Women |
| Less than High School | 60 (9.5%) | 56.0 |
| High School Diploma | 62 (9.8%) | 21.0 |
| College or Associate's Degree | 308 (48.8%) | 90.0 |
| Bachelor's Degree | 106 (16.8%) | 60.0 |
| Graduate Degree | 95 (15.1%) | 129.0 |
| Total | 631 (100.0%) | 64.0 |
Fertility by Education by Marriage Status in Northglenn
33.1% of women with births in Northglenn are unmarried. Women with the educational attainment of bachelor's degree are most likely to be married with 100.0% of them married at childbirth, while women with the educational attainment of high school diploma are least likely to be married with 91.9% of them unmarried at childbirth.
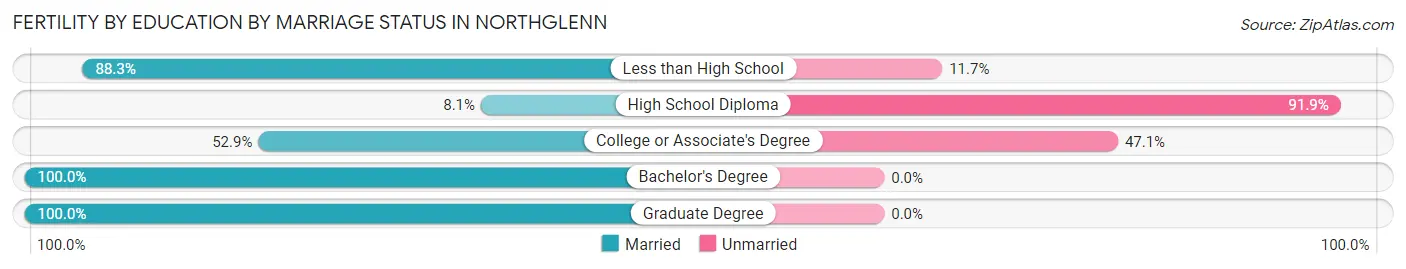
| Educational Attainment | Married | Unmarried |
| Less than High School | 53 (88.3%) | 7 (11.7%) |
| High School Diploma | 5 (8.1%) | 57 (91.9%) |
| College or Associate's Degree | 163 (52.9%) | 145 (47.1%) |
| Bachelor's Degree | 106 (100.0%) | 0 (0.0%) |
| Graduate Degree | 95 (100.0%) | 0 (0.0%) |
| Total | 422 (66.9%) | 209 (33.1%) |
Employment Characteristics in Northglenn
Employment by Class of Employer in Northglenn
Among the 20,026 employed individuals in Northglenn, private company employees (15,112 | 75.5%), local government employees (1,336 | 6.7%), and not-for-profit organizations (1,176 | 5.9%) make up the most common classes of employment.
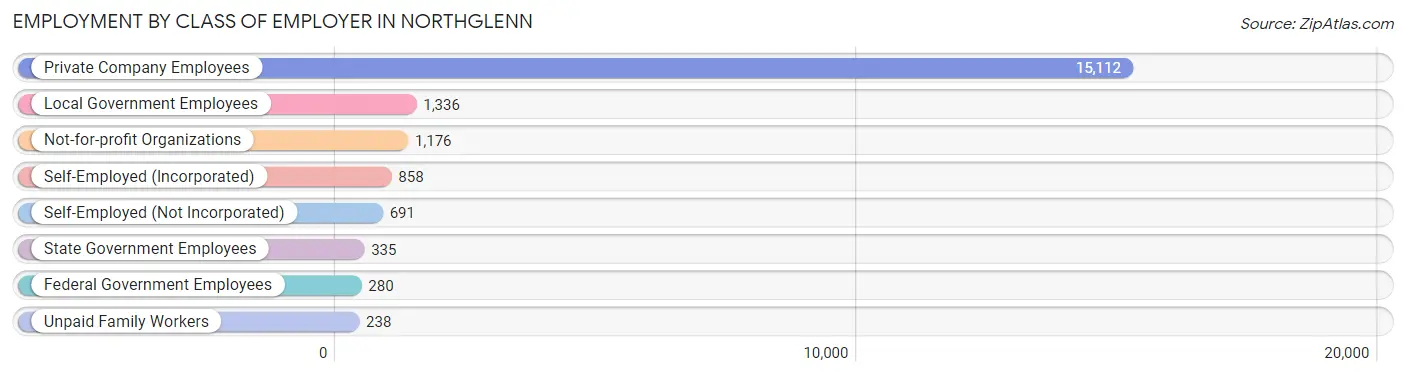
| Employer Class | # Employees | % Employees |
| Private Company Employees | 15,112 | 75.5% |
| Self-Employed (Incorporated) | 858 | 4.3% |
| Self-Employed (Not Incorporated) | 691 | 3.5% |
| Not-for-profit Organizations | 1,176 | 5.9% |
| Local Government Employees | 1,336 | 6.7% |
| State Government Employees | 335 | 1.7% |
| Federal Government Employees | 280 | 1.4% |
| Unpaid Family Workers | 238 | 1.2% |
| Total | 20,026 | 100.0% |
Employment Status by Age in Northglenn
According to the labor force statistics for Northglenn, out of the total population over 16 years of age (30,054), 71.4% or 21,459 individuals are in the labor force, with 4.1% or 880 of them unemployed. The age group with the highest labor force participation rate is 20 to 24 years, with 88.5% or 2,199 individuals in the labor force. Within the labor force, the 65 to 74 years age range has the highest percentage of unemployed individuals, with 13.9% or 79 of them being unemployed.
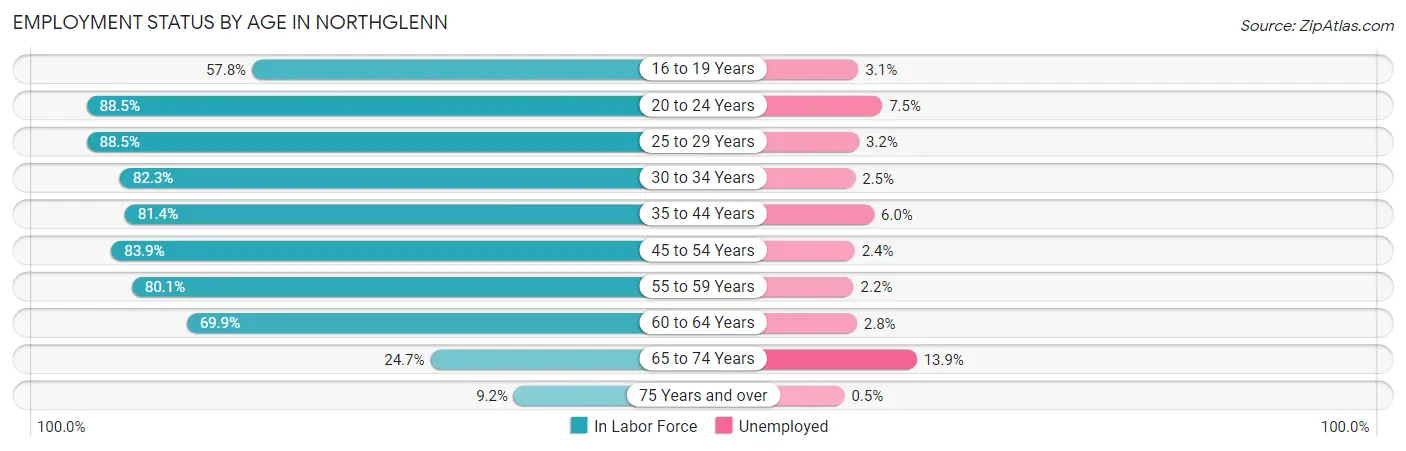
| Age Bracket | In Labor Force | Unemployed |
| 16 to 19 Years | 1,164 (57.8%) | 36 (3.1%) |
| 20 to 24 Years | 2,199 (88.5%) | 165 (7.5%) |
| 25 to 29 Years | 3,028 (88.5%) | 97 (3.2%) |
| 30 to 34 Years | 3,020 (82.3%) | 76 (2.5%) |
| 35 to 44 Years | 4,446 (81.4%) | 267 (6.0%) |
| 45 to 54 Years | 3,779 (83.9%) | 91 (2.4%) |
| 55 to 59 Years | 1,603 (80.1%) | 35 (2.2%) |
| 60 to 64 Years | 1,448 (69.9%) | 41 (2.8%) |
| 65 to 74 Years | 570 (24.7%) | 79 (13.9%) |
| 75 Years and over | 195 (9.2%) | 1 (0.5%) |
| Total | 21,459 (71.4%) | 880 (4.1%) |
Employment Status by Educational Attainment in Northglenn
According to labor force statistics for Northglenn, 82.0% of individuals (17,326) out of the total population between 25 and 64 years of age (21,129) are in the labor force, with 3.5% or 606 of them being unemployed. The group with the highest labor force participation rate are those with the educational attainment of bachelor's degree or higher, with 87.4% or 4,619 individuals in the labor force. Within the labor force, individuals with less than high school education have the highest percentage of unemployment, with 6.6% or 106 of them being unemployed.
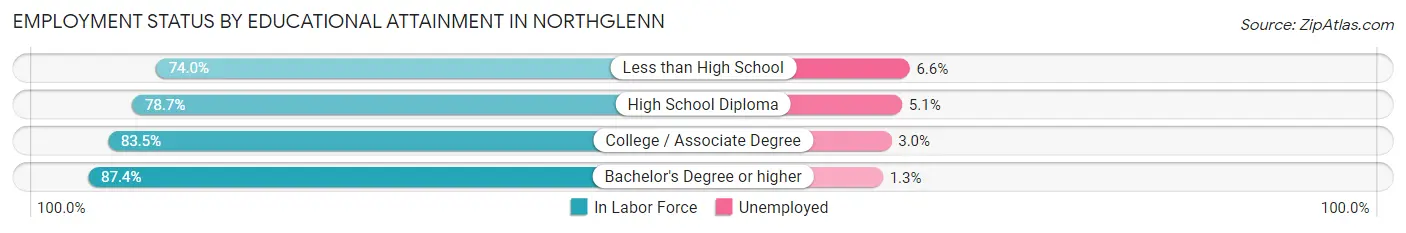
| Educational Attainment | In Labor Force | Unemployed |
| Less than High School | 1,609 (74.0%) | 143 (6.6%) |
| High School Diploma | 5,317 (78.7%) | 345 (5.1%) |
| College / Associate Degree | 5,773 (83.5%) | 207 (3.0%) |
| Bachelor's Degree or higher | 4,619 (87.4%) | 69 (1.3%) |
| Total | 17,326 (82.0%) | 740 (3.5%) |
Employment Occupations by Sex in Northglenn
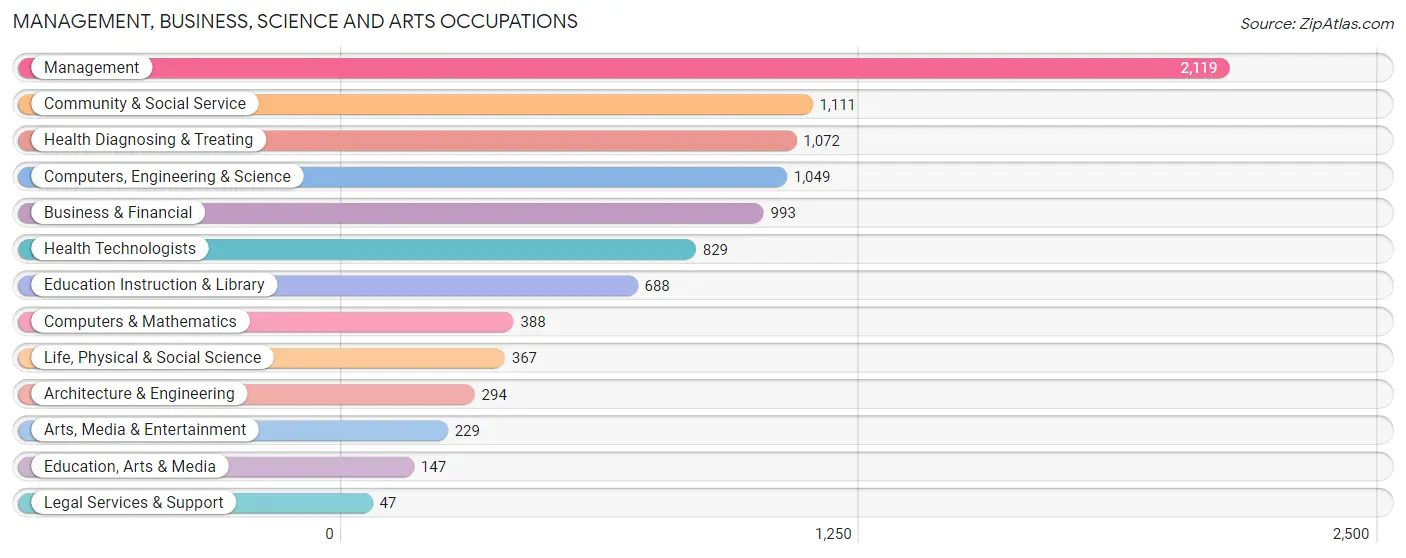
Management, Business, Science and Arts Occupations
The most common Management, Business, Science and Arts occupations in Northglenn are Management (2,119 | 10.3%), Community & Social Service (1,111 | 5.4%), Health Diagnosing & Treating (1,072 | 5.2%), Computers, Engineering & Science (1,049 | 5.1%), and Business & Financial (993 | 4.8%).
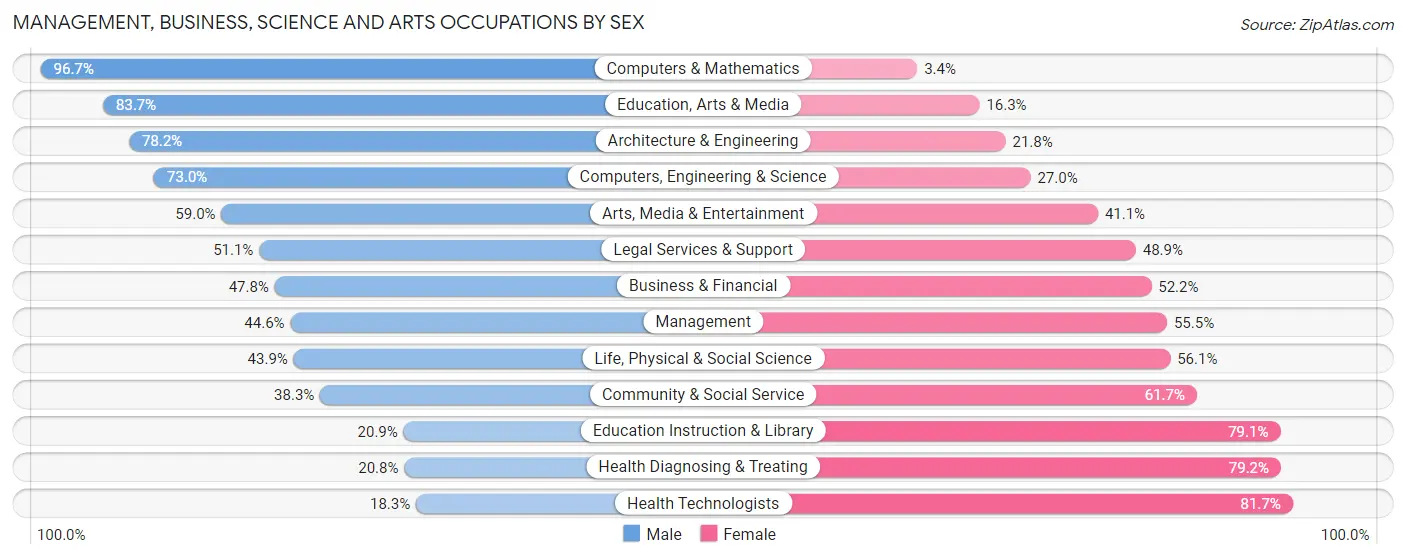
Management, Business, Science and Arts Occupations by Sex
Within the Management, Business, Science and Arts occupations in Northglenn, the most male-oriented occupations are Computers & Mathematics (96.7%), Education, Arts & Media (83.7%), and Architecture & Engineering (78.2%), while the most female-oriented occupations are Health Technologists (81.7%), Health Diagnosing & Treating (79.2%), and Education Instruction & Library (79.1%).
| Occupation | Male | Female |
| Management | 944 (44.6%) | 1,175 (55.4%) |
| Business & Financial | 475 (47.8%) | 518 (52.2%) |
| Computers, Engineering & Science | 766 (73.0%) | 283 (27.0%) |
| Computers & Mathematics | 375 (96.7%) | 13 (3.4%) |
| Architecture & Engineering | 230 (78.2%) | 64 (21.8%) |
| Life, Physical & Social Science | 161 (43.9%) | 206 (56.1%) |
| Community & Social Service | 426 (38.3%) | 685 (61.7%) |
| Education, Arts & Media | 123 (83.7%) | 24 (16.3%) |
| Legal Services & Support | 24 (51.1%) | 23 (48.9%) |
| Education Instruction & Library | 144 (20.9%) | 544 (79.1%) |
| Arts, Media & Entertainment | 135 (59.0%) | 94 (41.0%) |
| Health Diagnosing & Treating | 223 (20.8%) | 849 (79.2%) |
| Health Technologists | 152 (18.3%) | 677 (81.7%) |
| Total (Category) | 2,834 (44.7%) | 3,510 (55.3%) |
| Total (Overall) | 11,263 (54.8%) | 9,296 (45.2%) |
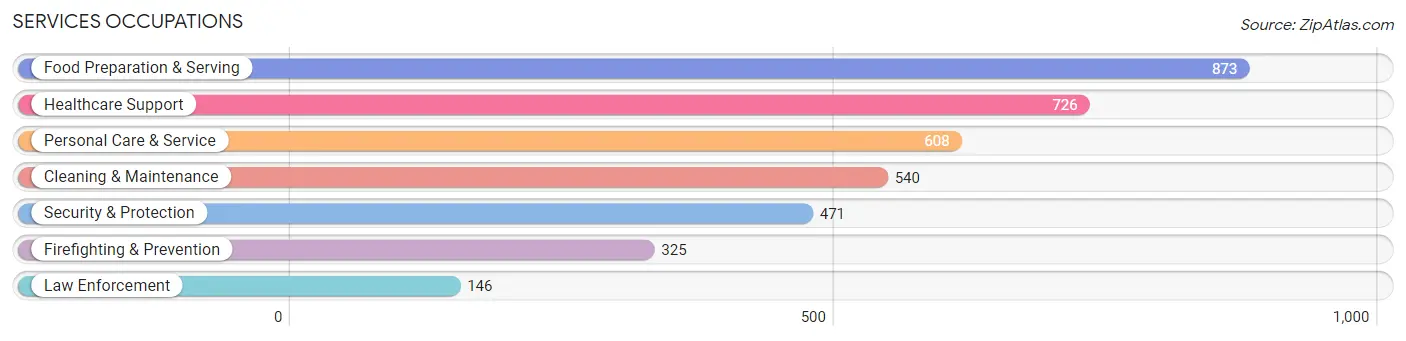
Services Occupations
The most common Services occupations in Northglenn are Food Preparation & Serving (873 | 4.3%), Healthcare Support (726 | 3.5%), Personal Care & Service (608 | 3.0%), Cleaning & Maintenance (540 | 2.6%), and Security & Protection (471 | 2.3%).
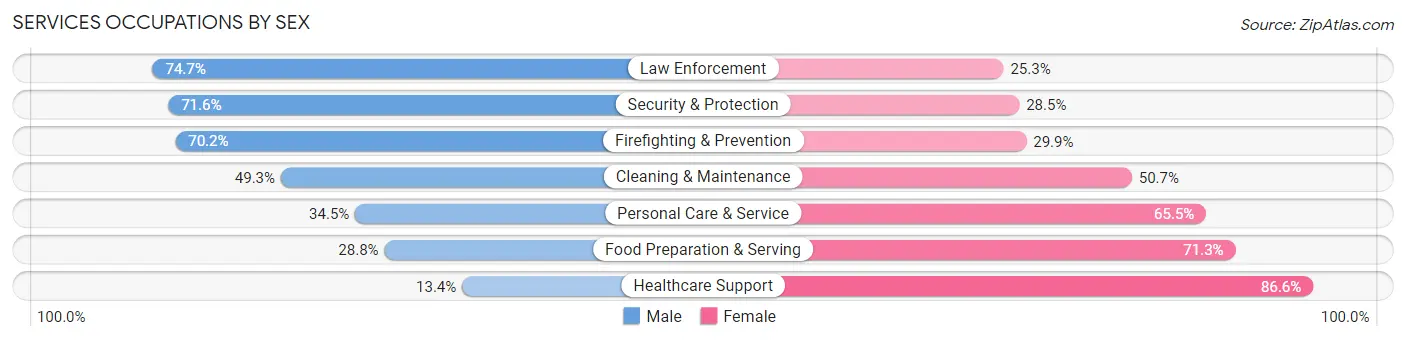
Services Occupations by Sex
Within the Services occupations in Northglenn, the most male-oriented occupations are Law Enforcement (74.7%), Security & Protection (71.6%), and Firefighting & Prevention (70.2%), while the most female-oriented occupations are Healthcare Support (86.6%), Food Preparation & Serving (71.3%), and Personal Care & Service (65.5%).
| Occupation | Male | Female |
| Healthcare Support | 97 (13.4%) | 629 (86.6%) |
| Security & Protection | 337 (71.6%) | 134 (28.4%) |
| Firefighting & Prevention | 228 (70.2%) | 97 (29.8%) |
| Law Enforcement | 109 (74.7%) | 37 (25.3%) |
| Food Preparation & Serving | 251 (28.7%) | 622 (71.3%) |
| Cleaning & Maintenance | 266 (49.3%) | 274 (50.7%) |
| Personal Care & Service | 210 (34.5%) | 398 (65.5%) |
| Total (Category) | 1,161 (36.1%) | 2,057 (63.9%) |
| Total (Overall) | 11,263 (54.8%) | 9,296 (45.2%) |
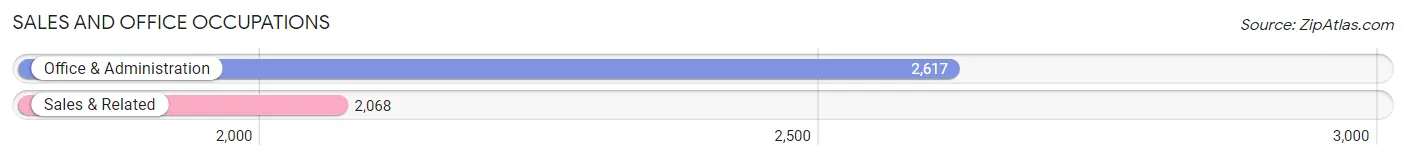
Sales and Office Occupations
The most common Sales and Office occupations in Northglenn are Office & Administration (2,617 | 12.7%), and Sales & Related (2,068 | 10.1%).
Sales and Office Occupations by Sex
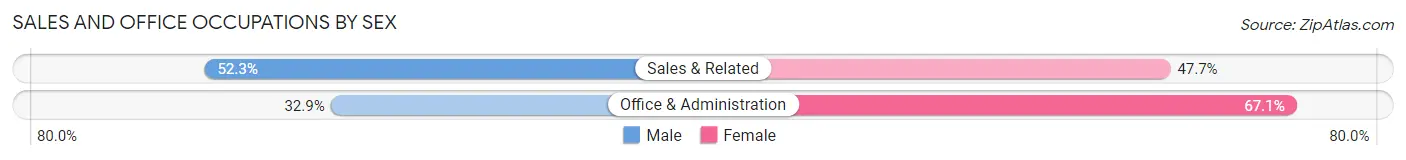
| Occupation | Male | Female |
| Sales & Related | 1,082 (52.3%) | 986 (47.7%) |
| Office & Administration | 862 (32.9%) | 1,755 (67.1%) |
| Total (Category) | 1,944 (41.5%) | 2,741 (58.5%) |
| Total (Overall) | 11,263 (54.8%) | 9,296 (45.2%) |
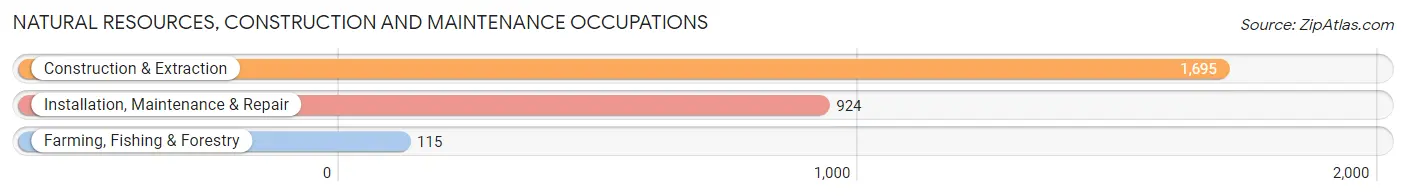
Natural Resources, Construction and Maintenance Occupations
The most common Natural Resources, Construction and Maintenance occupations in Northglenn are Construction & Extraction (1,695 | 8.2%), Installation, Maintenance & Repair (924 | 4.5%), and Farming, Fishing & Forestry (115 | 0.6%).
Natural Resources, Construction and Maintenance Occupations by Sex
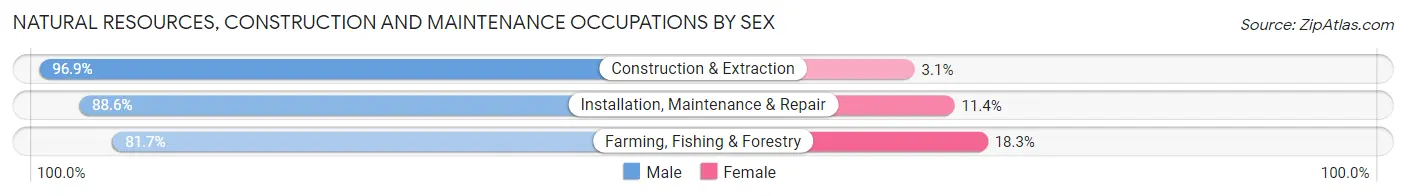
| Occupation | Male | Female |
| Farming, Fishing & Forestry | 94 (81.7%) | 21 (18.3%) |
| Construction & Extraction | 1,643 (96.9%) | 52 (3.1%) |
| Installation, Maintenance & Repair | 819 (88.6%) | 105 (11.4%) |
| Total (Category) | 2,556 (93.5%) | 178 (6.5%) |
| Total (Overall) | 11,263 (54.8%) | 9,296 (45.2%) |
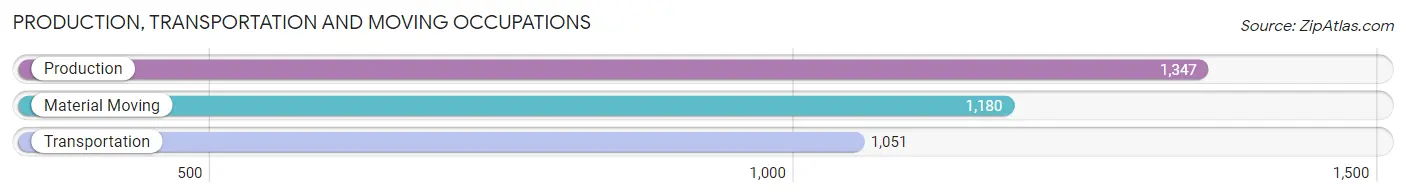
Production, Transportation and Moving Occupations
The most common Production, Transportation and Moving occupations in Northglenn are Production (1,347 | 6.6%), Material Moving (1,180 | 5.7%), and Transportation (1,051 | 5.1%).
Production, Transportation and Moving Occupations by Sex
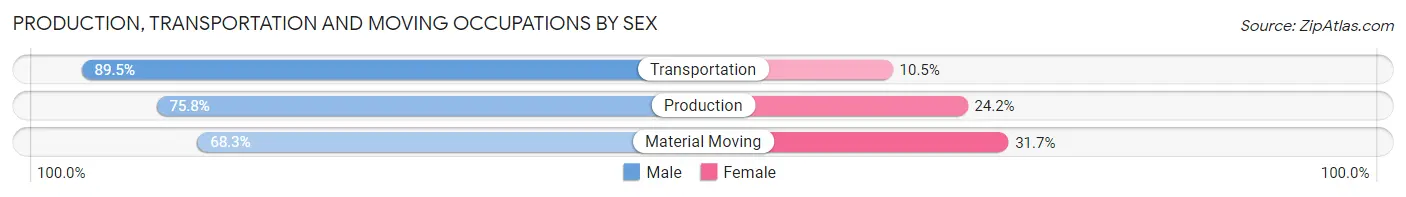
| Occupation | Male | Female |
| Production | 1,021 (75.8%) | 326 (24.2%) |
| Transportation | 941 (89.5%) | 110 (10.5%) |
| Material Moving | 806 (68.3%) | 374 (31.7%) |
| Total (Category) | 2,768 (77.4%) | 810 (22.6%) |
| Total (Overall) | 11,263 (54.8%) | 9,296 (45.2%) |
Employment Industries by Sex in Northglenn
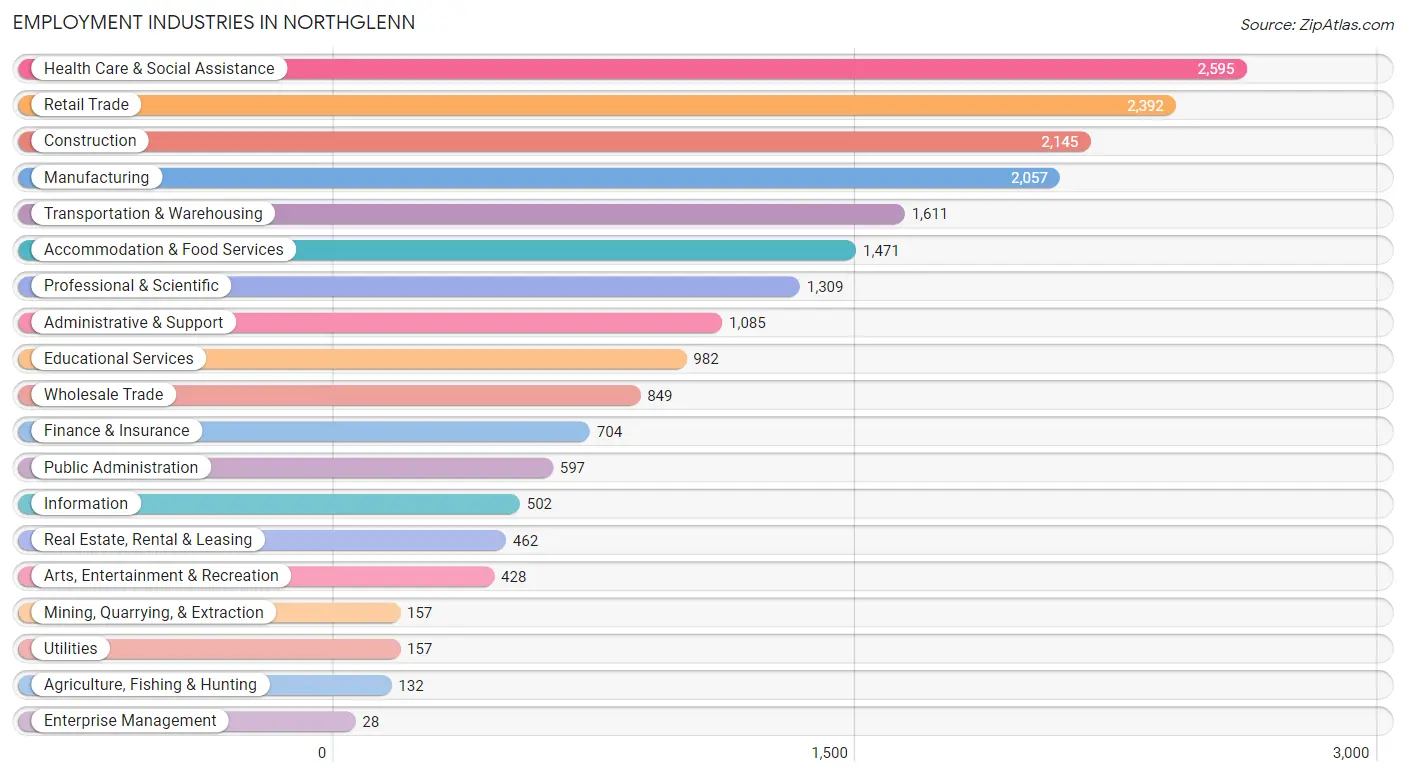
Employment Industries in Northglenn
The major employment industries in Northglenn include Health Care & Social Assistance (2,595 | 12.6%), Retail Trade (2,392 | 11.6%), Construction (2,145 | 10.4%), Manufacturing (2,057 | 10.0%), and Transportation & Warehousing (1,611 | 7.8%).
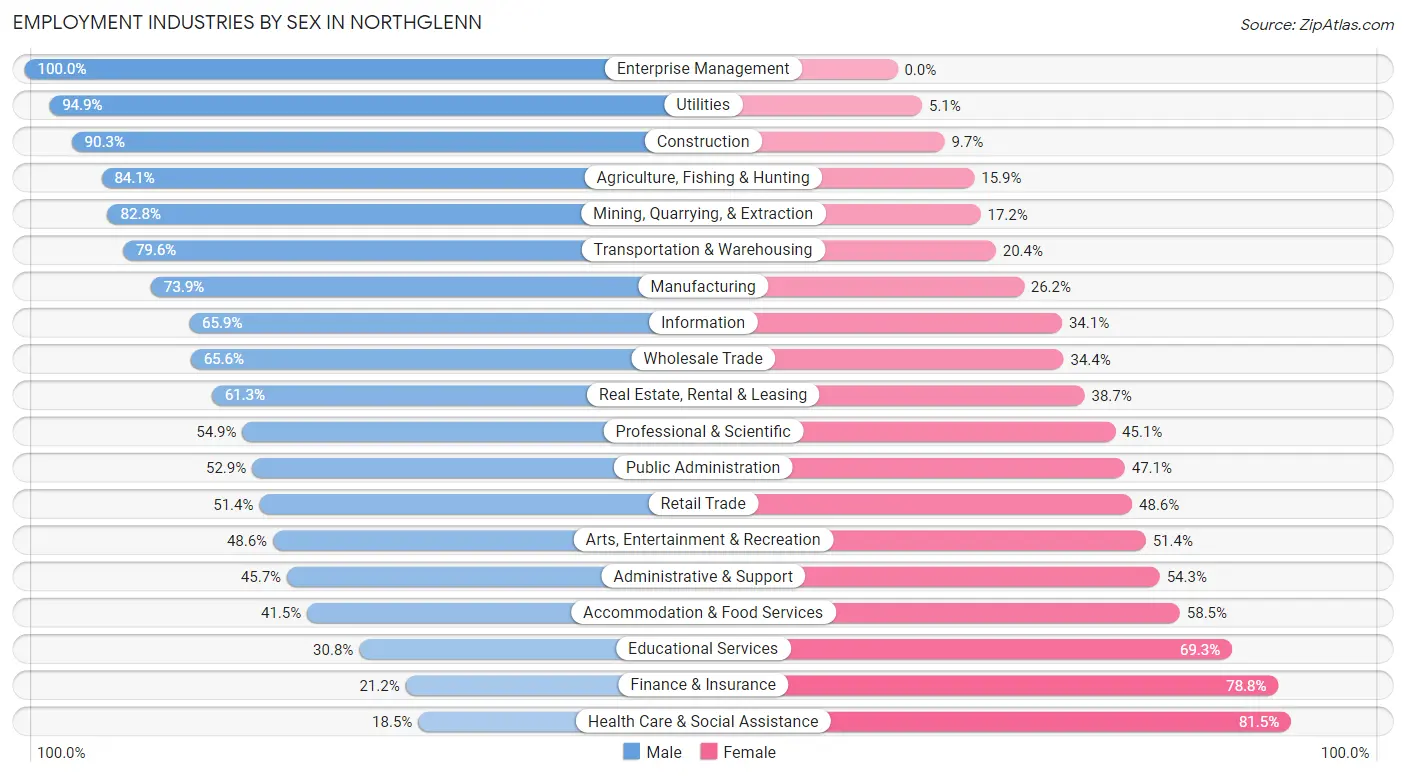
Employment Industries by Sex in Northglenn
The Northglenn industries that see more men than women are Enterprise Management (100.0%), Utilities (94.9%), and Construction (90.3%), whereas the industries that tend to have a higher number of women are Health Care & Social Assistance (81.5%), Finance & Insurance (78.8%), and Educational Services (69.3%).
| Industry | Male | Female |
| Agriculture, Fishing & Hunting | 111 (84.1%) | 21 (15.9%) |
| Mining, Quarrying, & Extraction | 130 (82.8%) | 27 (17.2%) |
| Construction | 1,936 (90.3%) | 209 (9.7%) |
| Manufacturing | 1,519 (73.9%) | 538 (26.2%) |
| Wholesale Trade | 557 (65.6%) | 292 (34.4%) |
| Retail Trade | 1,230 (51.4%) | 1,162 (48.6%) |
| Transportation & Warehousing | 1,283 (79.6%) | 328 (20.4%) |
| Utilities | 149 (94.9%) | 8 (5.1%) |
| Information | 331 (65.9%) | 171 (34.1%) |
| Finance & Insurance | 149 (21.2%) | 555 (78.8%) |
| Real Estate, Rental & Leasing | 283 (61.3%) | 179 (38.7%) |
| Professional & Scientific | 719 (54.9%) | 590 (45.1%) |
| Enterprise Management | 28 (100.0%) | 0 (0.0%) |
| Administrative & Support | 496 (45.7%) | 589 (54.3%) |
| Educational Services | 302 (30.7%) | 680 (69.3%) |
| Health Care & Social Assistance | 481 (18.5%) | 2,114 (81.5%) |
| Arts, Entertainment & Recreation | 208 (48.6%) | 220 (51.4%) |
| Accommodation & Food Services | 611 (41.5%) | 860 (58.5%) |
| Public Administration | 316 (52.9%) | 281 (47.1%) |
| Total | 11,263 (54.8%) | 9,296 (45.2%) |
Education in Northglenn
School Enrollment in Northglenn
The most common levels of schooling among the 8,870 students in Northglenn are middle school (2,455 | 27.7%), elementary school (1,860 | 21.0%), and high school (1,628 | 18.3%).
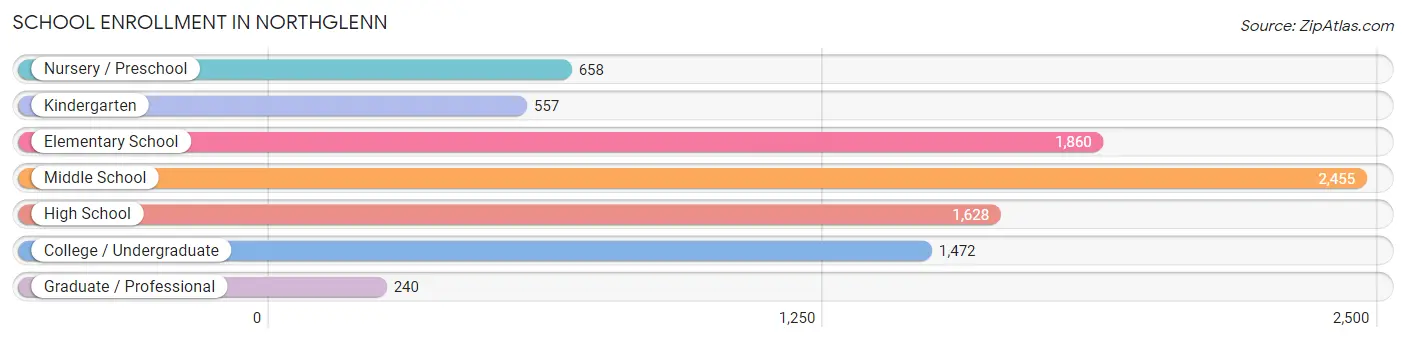
| School Level | # Students | % Students |
| Nursery / Preschool | 658 | 7.4% |
| Kindergarten | 557 | 6.3% |
| Elementary School | 1,860 | 21.0% |
| Middle School | 2,455 | 27.7% |
| High School | 1,628 | 18.3% |
| College / Undergraduate | 1,472 | 16.6% |
| Graduate / Professional | 240 | 2.7% |
| Total | 8,870 | 100.0% |
School Enrollment by Age by Funding Source in Northglenn
Out of a total of 8,870 students who are enrolled in schools in Northglenn, 1,135 (12.8%) attend a private institution, while the remaining 7,735 (87.2%) are enrolled in public schools. The age group of 3 to 4 year olds has the highest likelihood of being enrolled in private schools, with 278 (50.9% in the age bracket) enrolled. Conversely, the age group of 15 to 17 year olds has the lowest likelihood of being enrolled in a private school, with 1,179 (100.0% in the age bracket) attending a public institution.
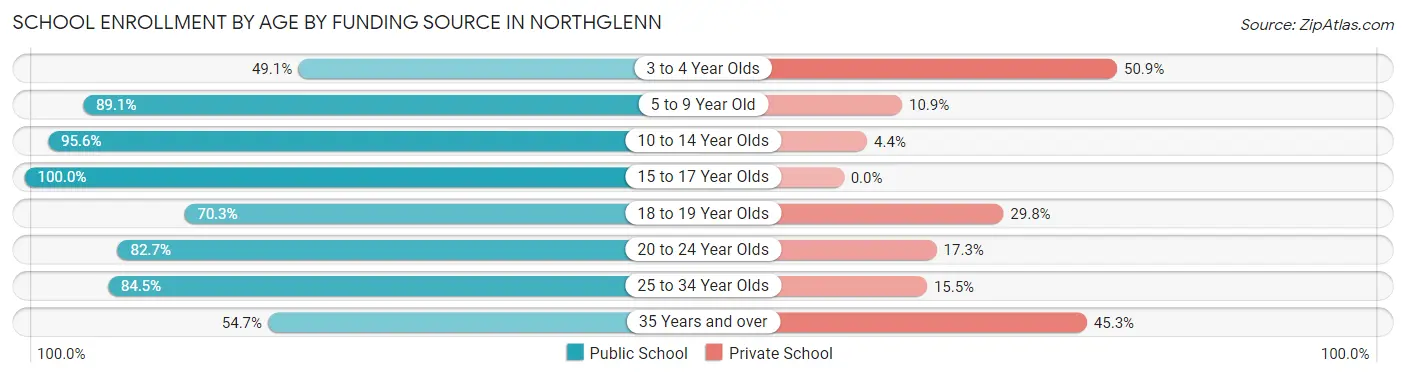
| Age Bracket | Public School | Private School |
| 3 to 4 Year Olds | 268 (49.1%) | 278 (50.9%) |
| 5 to 9 Year Old | 2,056 (89.1%) | 251 (10.9%) |
| 10 to 14 Year Olds | 2,734 (95.6%) | 125 (4.4%) |
| 15 to 17 Year Olds | 1,179 (100.0%) | 0 (0.0%) |
| 18 to 19 Year Olds | 425 (70.3%) | 180 (29.7%) |
| 20 to 24 Year Olds | 482 (82.7%) | 101 (17.3%) |
| 25 to 34 Year Olds | 452 (84.5%) | 83 (15.5%) |
| 35 Years and over | 140 (54.7%) | 116 (45.3%) |
| Total | 7,735 (87.2%) | 1,135 (12.8%) |
Educational Attainment by Field of Study in Northglenn
Business (1,155 | 16.7%), science & technology (773 | 11.2%), education (702 | 10.1%), social sciences (628 | 9.1%), and engineering (547 | 7.9%) are the most common fields of study among 6,921 individuals in Northglenn who have obtained a bachelor's degree or higher.
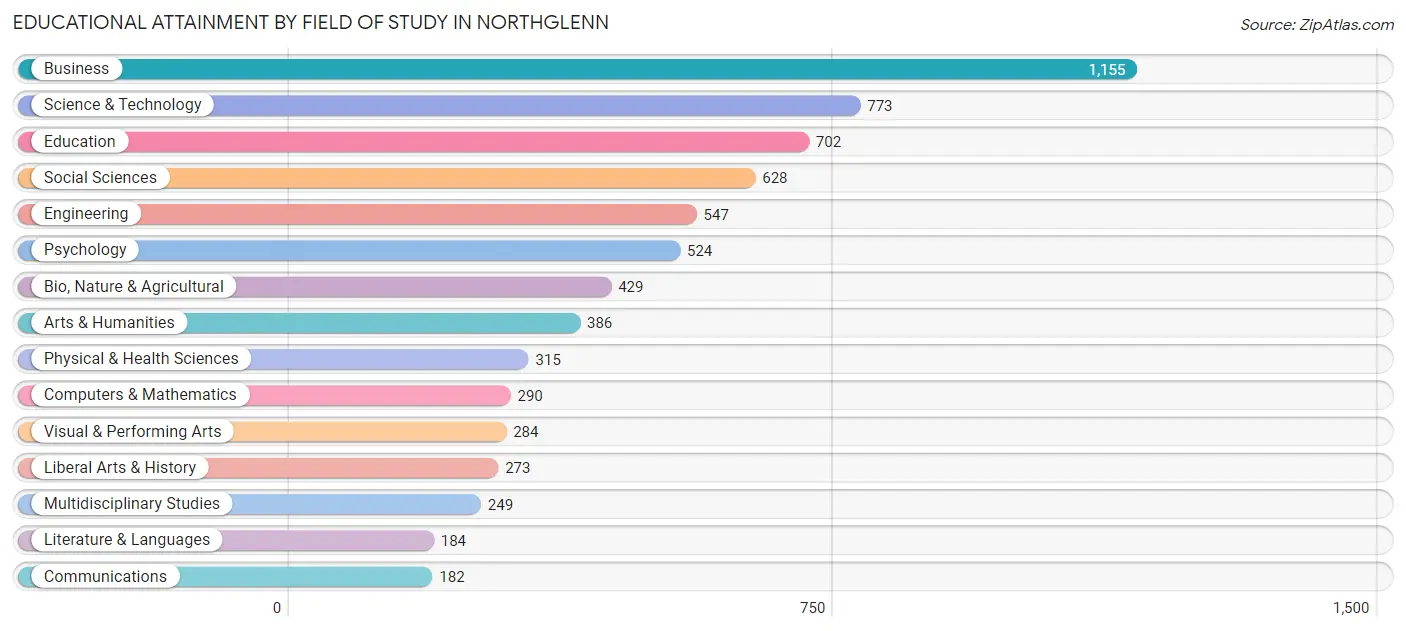
| Field of Study | # Graduates | % Graduates |
| Computers & Mathematics | 290 | 4.2% |
| Bio, Nature & Agricultural | 429 | 6.2% |
| Physical & Health Sciences | 315 | 4.5% |
| Psychology | 524 | 7.6% |
| Social Sciences | 628 | 9.1% |
| Engineering | 547 | 7.9% |
| Multidisciplinary Studies | 249 | 3.6% |
| Science & Technology | 773 | 11.2% |
| Business | 1,155 | 16.7% |
| Education | 702 | 10.1% |
| Literature & Languages | 184 | 2.7% |
| Liberal Arts & History | 273 | 3.9% |
| Visual & Performing Arts | 284 | 4.1% |
| Communications | 182 | 2.6% |
| Arts & Humanities | 386 | 5.6% |
| Total | 6,921 | 100.0% |
Transportation & Commute in Northglenn
Vehicle Availability by Sex in Northglenn
The most prevalent vehicle ownership categories in Northglenn are males with 2 vehicles (4,573, accounting for 41.8%) and females with 2 vehicles (3,544, making up 50.3%).
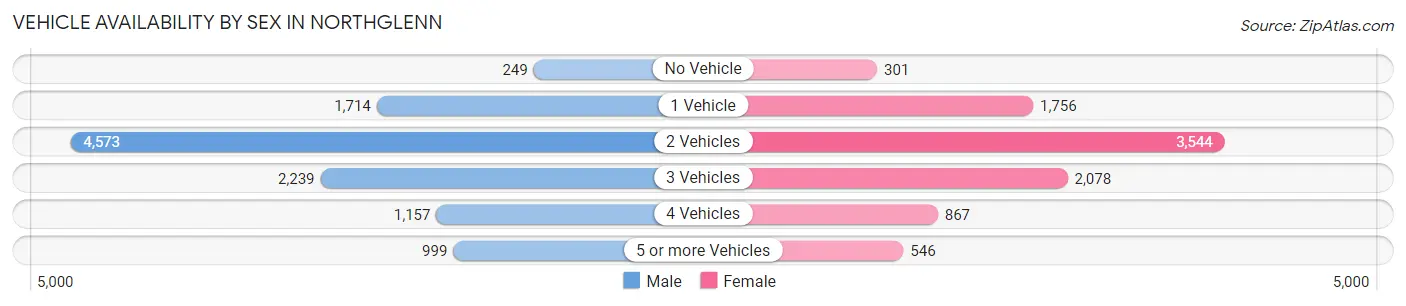
| Vehicles Available | Male | Female |
| No Vehicle | 249 (2.3%) | 301 (3.3%) |
| 1 Vehicle | 1,714 (15.7%) | 1,756 (19.3%) |
| 2 Vehicles | 4,573 (41.8%) | 3,544 (39.0%) |
| 3 Vehicles | 2,239 (20.5%) | 2,078 (22.9%) |
| 4 Vehicles | 1,157 (10.6%) | 867 (9.5%) |
| 5 or more Vehicles | 999 (9.1%) | 546 (6.0%) |
| Total | 10,931 (100.0%) | 9,092 (100.0%) |
Commute Time in Northglenn
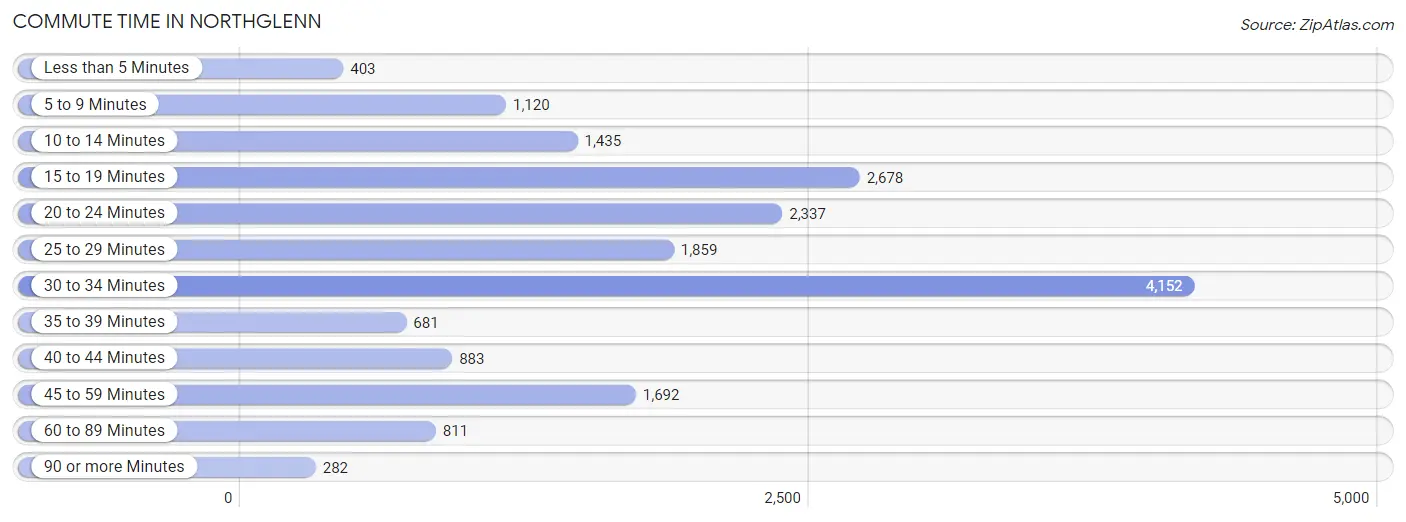
The most frequently occuring commute durations in Northglenn are 30 to 34 minutes (4,152 commuters, 22.7%), 15 to 19 minutes (2,678 commuters, 14.6%), and 20 to 24 minutes (2,337 commuters, 12.8%).
| Commute Time | # Commuters | % Commuters |
| Less than 5 Minutes | 403 | 2.2% |
| 5 to 9 Minutes | 1,120 | 6.1% |
| 10 to 14 Minutes | 1,435 | 7.8% |
| 15 to 19 Minutes | 2,678 | 14.6% |
| 20 to 24 Minutes | 2,337 | 12.8% |
| 25 to 29 Minutes | 1,859 | 10.1% |
| 30 to 34 Minutes | 4,152 | 22.7% |
| 35 to 39 Minutes | 681 | 3.7% |
| 40 to 44 Minutes | 883 | 4.8% |
| 45 to 59 Minutes | 1,692 | 9.2% |
| 60 to 89 Minutes | 811 | 4.4% |
| 90 or more Minutes | 282 | 1.5% |
Commute Time by Sex in Northglenn
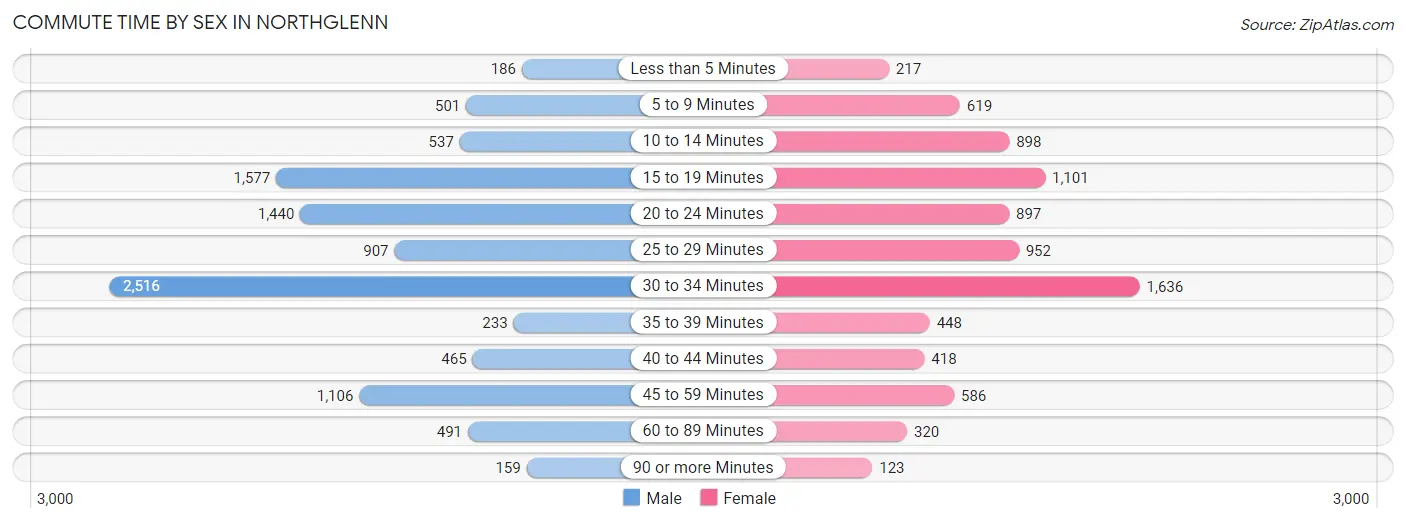
The most common commute times in Northglenn are 30 to 34 minutes (2,516 commuters, 24.9%) for males and 30 to 34 minutes (1,636 commuters, 19.9%) for females.
| Commute Time | Male | Female |
| Less than 5 Minutes | 186 (1.8%) | 217 (2.6%) |
| 5 to 9 Minutes | 501 (5.0%) | 619 (7.5%) |
| 10 to 14 Minutes | 537 (5.3%) | 898 (10.9%) |
| 15 to 19 Minutes | 1,577 (15.6%) | 1,101 (13.4%) |
| 20 to 24 Minutes | 1,440 (14.2%) | 897 (10.9%) |
| 25 to 29 Minutes | 907 (9.0%) | 952 (11.6%) |
| 30 to 34 Minutes | 2,516 (24.9%) | 1,636 (19.9%) |
| 35 to 39 Minutes | 233 (2.3%) | 448 (5.4%) |
| 40 to 44 Minutes | 465 (4.6%) | 418 (5.1%) |
| 45 to 59 Minutes | 1,106 (10.9%) | 586 (7.1%) |
| 60 to 89 Minutes | 491 (4.9%) | 320 (3.9%) |
| 90 or more Minutes | 159 (1.6%) | 123 (1.5%) |
Time of Departure to Work by Sex in Northglenn
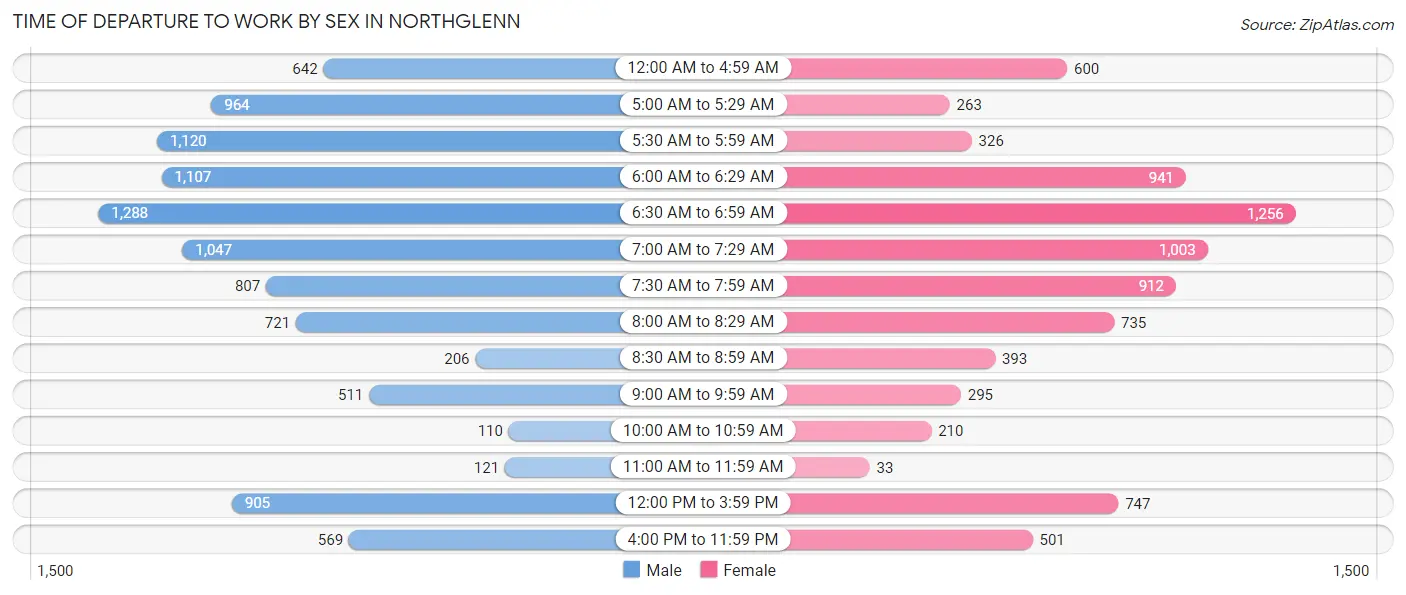
The most frequent times of departure to work in Northglenn are 6:30 AM to 6:59 AM (1,288, 12.7%) for males and 6:30 AM to 6:59 AM (1,256, 15.3%) for females.
| Time of Departure | Male | Female |
| 12:00 AM to 4:59 AM | 642 (6.4%) | 600 (7.3%) |
| 5:00 AM to 5:29 AM | 964 (9.5%) | 263 (3.2%) |
| 5:30 AM to 5:59 AM | 1,120 (11.1%) | 326 (4.0%) |
| 6:00 AM to 6:29 AM | 1,107 (10.9%) | 941 (11.5%) |
| 6:30 AM to 6:59 AM | 1,288 (12.7%) | 1,256 (15.3%) |
| 7:00 AM to 7:29 AM | 1,047 (10.3%) | 1,003 (12.2%) |
| 7:30 AM to 7:59 AM | 807 (8.0%) | 912 (11.1%) |
| 8:00 AM to 8:29 AM | 721 (7.1%) | 735 (8.9%) |
| 8:30 AM to 8:59 AM | 206 (2.0%) | 393 (4.8%) |
| 9:00 AM to 9:59 AM | 511 (5.1%) | 295 (3.6%) |
| 10:00 AM to 10:59 AM | 110 (1.1%) | 210 (2.6%) |
| 11:00 AM to 11:59 AM | 121 (1.2%) | 33 (0.4%) |
| 12:00 PM to 3:59 PM | 905 (8.9%) | 747 (9.1%) |
| 4:00 PM to 11:59 PM | 569 (5.6%) | 501 (6.1%) |
| Total | 10,118 (100.0%) | 8,215 (100.0%) |
Housing Occupancy in Northglenn
Occupancy by Ownership in Northglenn
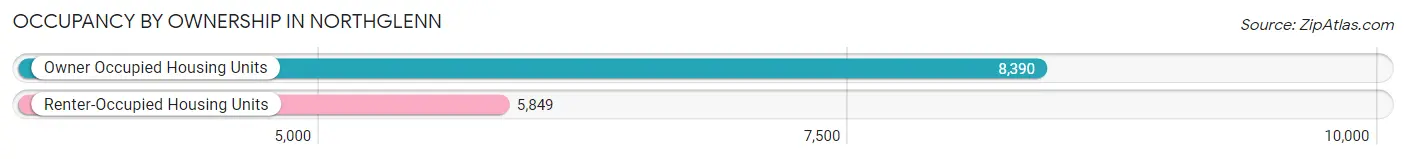
Of the total 14,239 dwellings in Northglenn, owner-occupied units account for 8,390 (58.9%), while renter-occupied units make up 5,849 (41.1%).
| Occupancy | # Housing Units | % Housing Units |
| Owner Occupied Housing Units | 8,390 | 58.9% |
| Renter-Occupied Housing Units | 5,849 | 41.1% |
| Total Occupied Housing Units | 14,239 | 100.0% |
Occupancy by Household Size in Northglenn
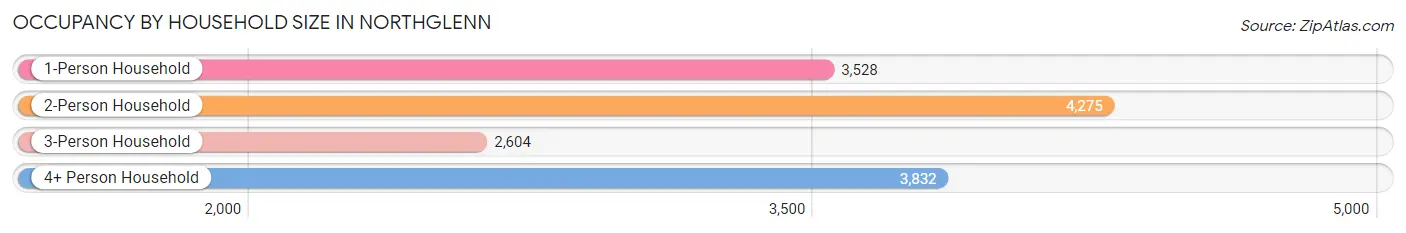
| Household Size | # Housing Units | % Housing Units |
| 1-Person Household | 3,528 | 24.8% |
| 2-Person Household | 4,275 | 30.0% |
| 3-Person Household | 2,604 | 18.3% |
| 4+ Person Household | 3,832 | 26.9% |
| Total Housing Units | 14,239 | 100.0% |
Occupancy by Ownership by Household Size in Northglenn
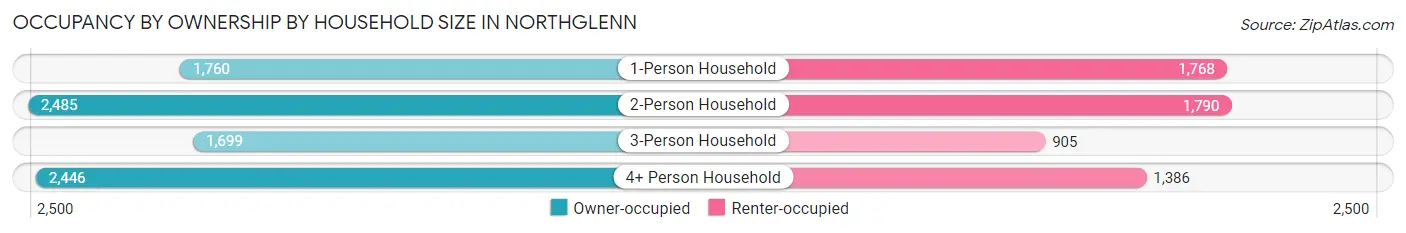
| Household Size | Owner-occupied | Renter-occupied |
| 1-Person Household | 1,760 (49.9%) | 1,768 (50.1%) |
| 2-Person Household | 2,485 (58.1%) | 1,790 (41.9%) |
| 3-Person Household | 1,699 (65.2%) | 905 (34.7%) |
| 4+ Person Household | 2,446 (63.8%) | 1,386 (36.2%) |
| Total Housing Units | 8,390 (58.9%) | 5,849 (41.1%) |
Occupancy by Educational Attainment in Northglenn
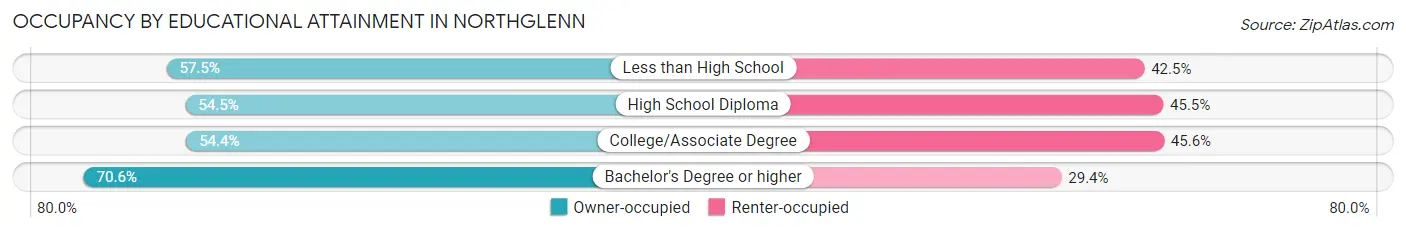
| Household Size | Owner-occupied | Renter-occupied |
| Less than High School | 561 (57.5%) | 415 (42.5%) |
| High School Diploma | 2,557 (54.5%) | 2,136 (45.5%) |
| College/Associate Degree | 2,608 (54.4%) | 2,190 (45.6%) |
| Bachelor's Degree or higher | 2,664 (70.6%) | 1,108 (29.4%) |
Occupancy by Age of Householder in Northglenn
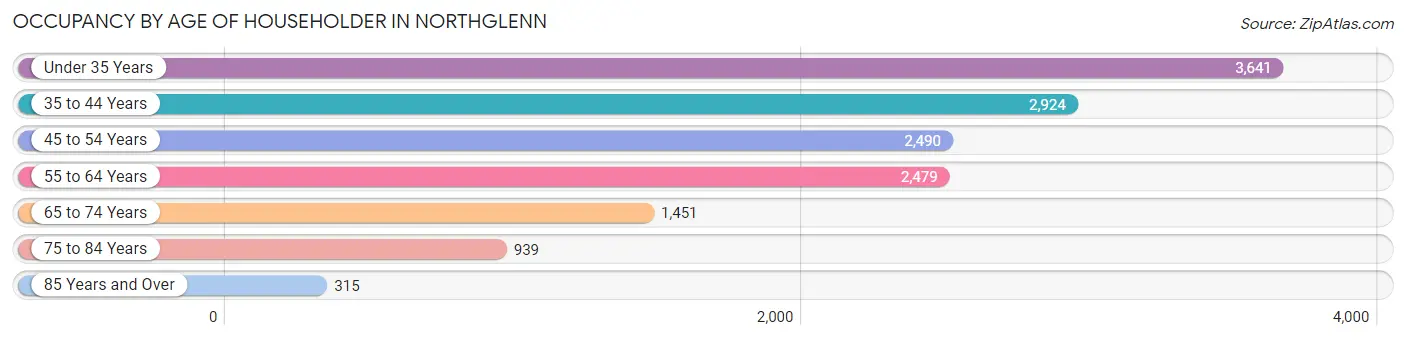
| Age Bracket | # Households | % Households |
| Under 35 Years | 3,641 | 25.6% |
| 35 to 44 Years | 2,924 | 20.5% |
| 45 to 54 Years | 2,490 | 17.5% |
| 55 to 64 Years | 2,479 | 17.4% |
| 65 to 74 Years | 1,451 | 10.2% |
| 75 to 84 Years | 939 | 6.6% |
| 85 Years and Over | 315 | 2.2% |
| Total | 14,239 | 100.0% |
Housing Finances in Northglenn
Median Income by Occupancy in Northglenn
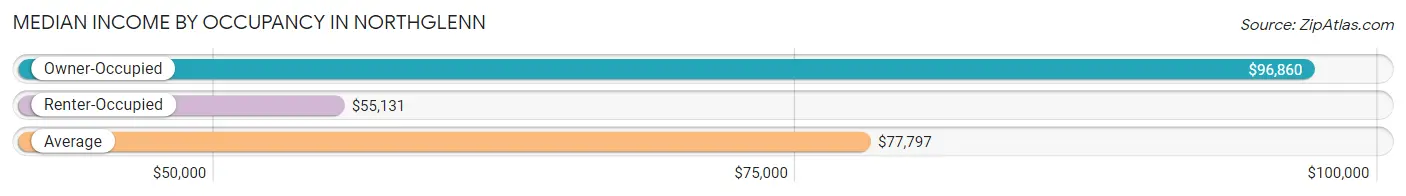
| Occupancy Type | # Households | Median Income |
| Owner-Occupied | 8,390 (58.9%) | $96,860 |
| Renter-Occupied | 5,849 (41.1%) | $55,131 |
| Average | 14,239 (100.0%) | $77,797 |
Occupancy by Householder Income Bracket in Northglenn
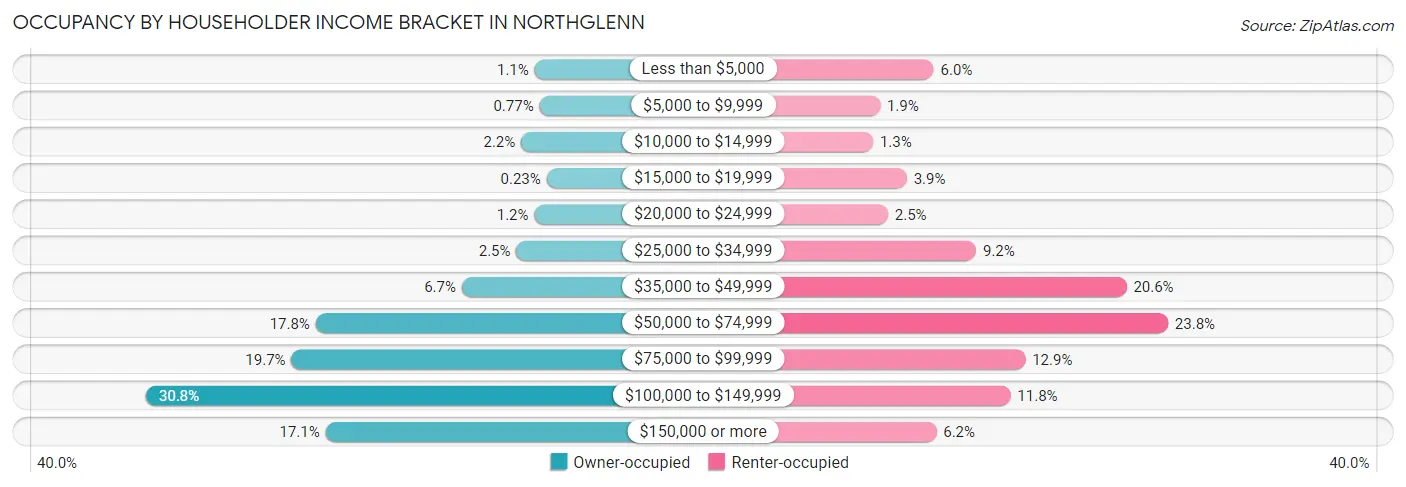
| Income Bracket | Owner-occupied | Renter-occupied |
| Less than $5,000 | 96 (1.1%) | 348 (5.9%) |
| $5,000 to $9,999 | 65 (0.8%) | 109 (1.9%) |
| $10,000 to $14,999 | 182 (2.2%) | 78 (1.3%) |
| $15,000 to $19,999 | 19 (0.2%) | 228 (3.9%) |
| $20,000 to $24,999 | 97 (1.2%) | 144 (2.5%) |
| $25,000 to $34,999 | 212 (2.5%) | 537 (9.2%) |
| $35,000 to $49,999 | 561 (6.7%) | 1,207 (20.6%) |
| $50,000 to $74,999 | 1,495 (17.8%) | 1,392 (23.8%) |
| $75,000 to $99,999 | 1,650 (19.7%) | 756 (12.9%) |
| $100,000 to $149,999 | 2,581 (30.8%) | 690 (11.8%) |
| $150,000 or more | 1,432 (17.1%) | 360 (6.1%) |
| Total | 8,390 (100.0%) | 5,849 (100.0%) |
Monthly Housing Cost Tiers in Northglenn
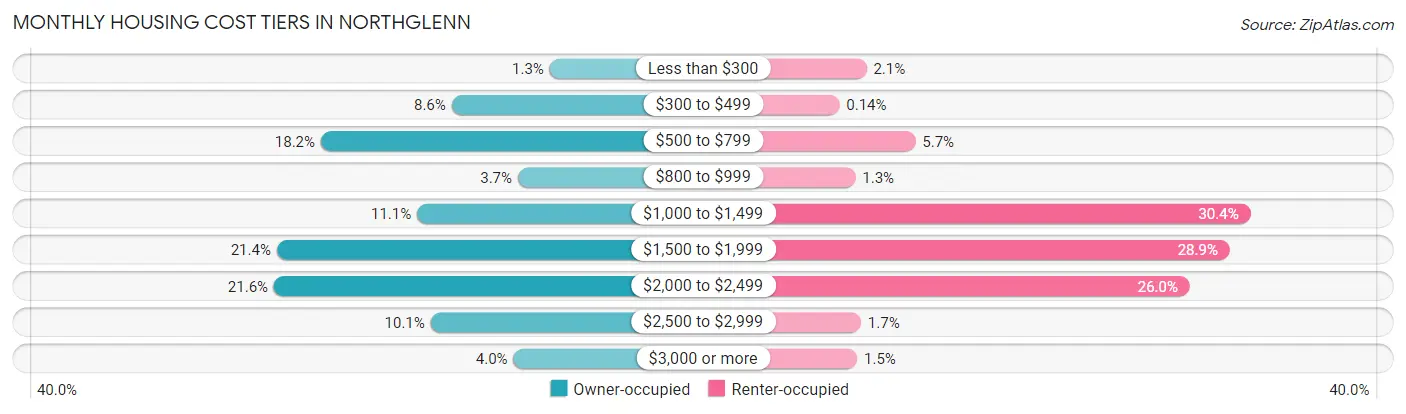
| Monthly Cost | Owner-occupied | Renter-occupied |
| Less than $300 | 112 (1.3%) | 125 (2.1%) |
| $300 to $499 | 717 (8.6%) | 8 (0.1%) |
| $500 to $799 | 1,525 (18.2%) | 336 (5.7%) |
| $800 to $999 | 308 (3.7%) | 77 (1.3%) |
| $1,000 to $1,499 | 931 (11.1%) | 1,779 (30.4%) |
| $1,500 to $1,999 | 1,798 (21.4%) | 1,690 (28.9%) |
| $2,000 to $2,499 | 1,816 (21.6%) | 1,518 (26.0%) |
| $2,500 to $2,999 | 847 (10.1%) | 101 (1.7%) |
| $3,000 or more | 336 (4.0%) | 85 (1.5%) |
| Total | 8,390 (100.0%) | 5,849 (100.0%) |
Physical Housing Characteristics in Northglenn
Housing Structures in Northglenn
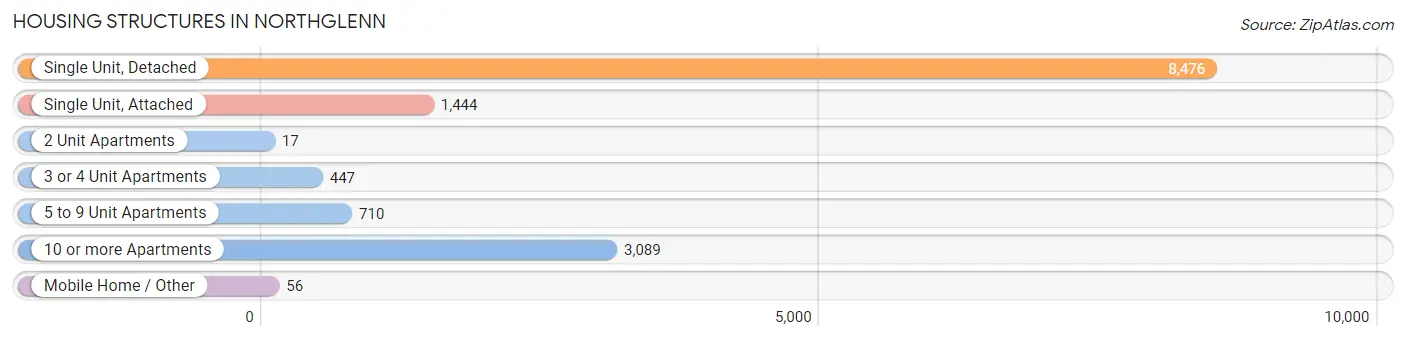
| Structure Type | # Housing Units | % Housing Units |
| Single Unit, Detached | 8,476 | 59.5% |
| Single Unit, Attached | 1,444 | 10.1% |
| 2 Unit Apartments | 17 | 0.1% |
| 3 or 4 Unit Apartments | 447 | 3.1% |
| 5 to 9 Unit Apartments | 710 | 5.0% |
| 10 or more Apartments | 3,089 | 21.7% |
| Mobile Home / Other | 56 | 0.4% |
| Total | 14,239 | 100.0% |
Housing Structures by Occupancy in Northglenn
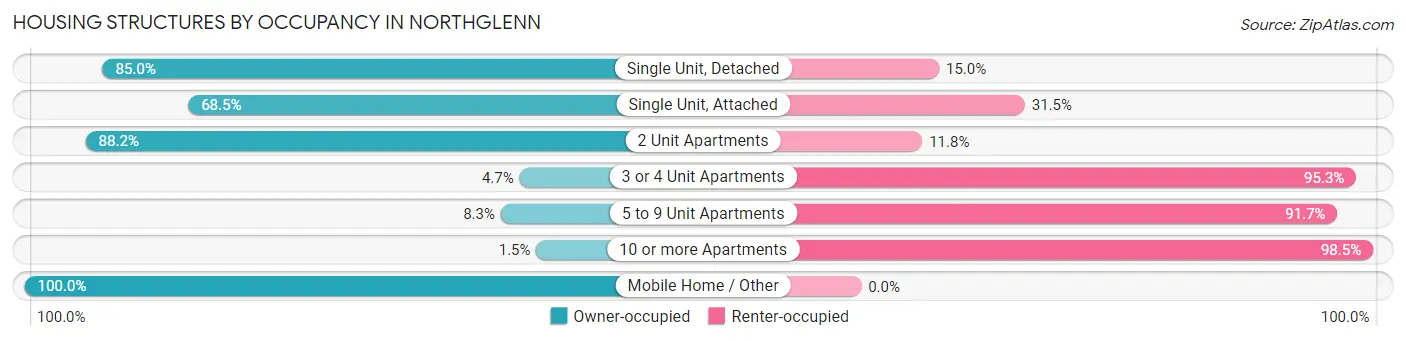
| Structure Type | Owner-occupied | Renter-occupied |
| Single Unit, Detached | 7,205 (85.0%) | 1,271 (15.0%) |
| Single Unit, Attached | 989 (68.5%) | 455 (31.5%) |
| 2 Unit Apartments | 15 (88.2%) | 2 (11.8%) |
| 3 or 4 Unit Apartments | 21 (4.7%) | 426 (95.3%) |
| 5 to 9 Unit Apartments | 59 (8.3%) | 651 (91.7%) |
| 10 or more Apartments | 45 (1.5%) | 3,044 (98.5%) |
| Mobile Home / Other | 56 (100.0%) | 0 (0.0%) |
| Total | 8,390 (58.9%) | 5,849 (41.1%) |
Housing Structures by Number of Rooms in Northglenn
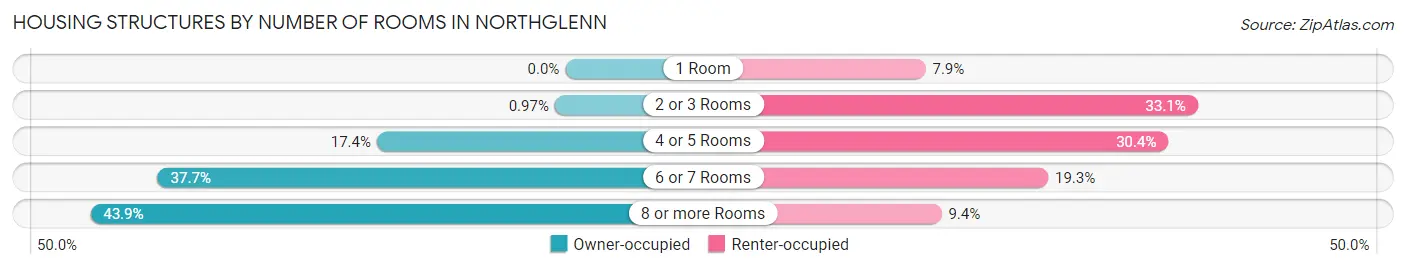
| Number of Rooms | Owner-occupied | Renter-occupied |
| 1 Room | 0 (0.0%) | 463 (7.9%) |
| 2 or 3 Rooms | 81 (1.0%) | 1,935 (33.1%) |
| 4 or 5 Rooms | 1,462 (17.4%) | 1,776 (30.4%) |
| 6 or 7 Rooms | 3,162 (37.7%) | 1,126 (19.3%) |
| 8 or more Rooms | 3,685 (43.9%) | 549 (9.4%) |
| Total | 8,390 (100.0%) | 5,849 (100.0%) |
Housing Structure by Heating Type in Northglenn
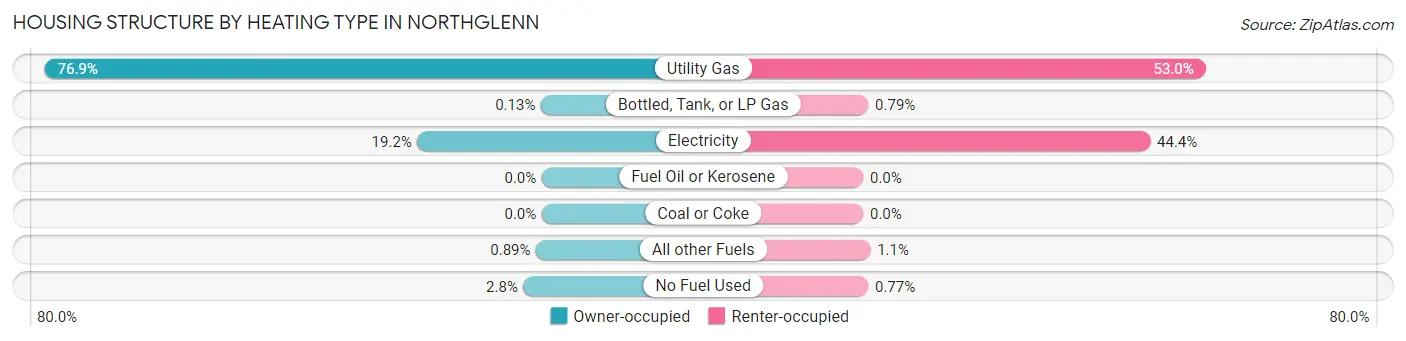
| Heating Type | Owner-occupied | Renter-occupied |
| Utility Gas | 6,452 (76.9%) | 3,097 (52.9%) |
| Bottled, Tank, or LP Gas | 11 (0.1%) | 46 (0.8%) |
| Electricity | 1,614 (19.2%) | 2,596 (44.4%) |
| Fuel Oil or Kerosene | 0 (0.0%) | 0 (0.0%) |
| Coal or Coke | 0 (0.0%) | 0 (0.0%) |
| All other Fuels | 75 (0.9%) | 65 (1.1%) |
| No Fuel Used | 238 (2.8%) | 45 (0.8%) |
| Total | 8,390 (100.0%) | 5,849 (100.0%) |
Household Vehicle Usage in Northglenn
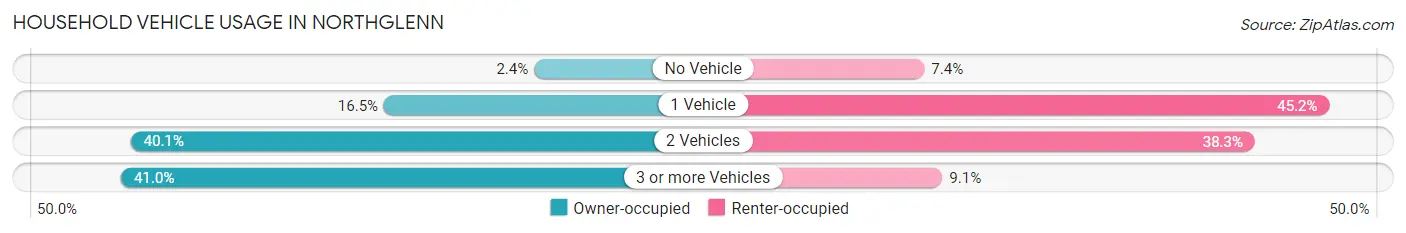
| Vehicles per Household | Owner-occupied | Renter-occupied |
| No Vehicle | 205 (2.4%) | 434 (7.4%) |
| 1 Vehicle | 1,381 (16.5%) | 2,645 (45.2%) |
| 2 Vehicles | 3,364 (40.1%) | 2,238 (38.3%) |
| 3 or more Vehicles | 3,440 (41.0%) | 532 (9.1%) |
| Total | 8,390 (100.0%) | 5,849 (100.0%) |
Real Estate & Mortgages in Northglenn
Real Estate and Mortgage Overview in Northglenn
| Characteristic | Without Mortgage | With Mortgage |
| Housing Units | 2,429 | 5,961 |
| Median Property Value | $384,900 | $405,800 |
| Median Household Income | $80,151 | $1,245 |
| Monthly Housing Costs | $572 | $336 |
| Real Estate Taxes | $2,708 | $111 |
Property Value by Mortgage Status in Northglenn
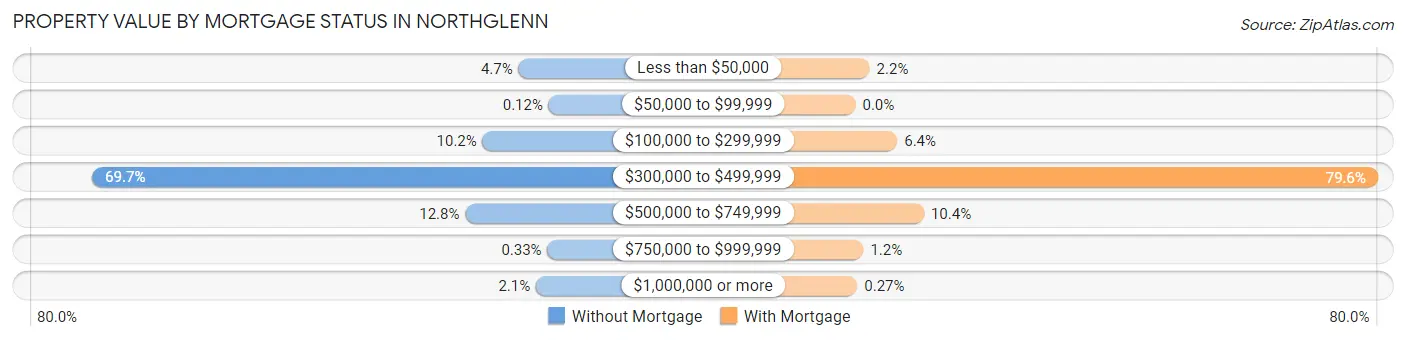
| Property Value | Without Mortgage | With Mortgage |
| Less than $50,000 | 115 (4.7%) | 128 (2.1%) |
| $50,000 to $99,999 | 3 (0.1%) | 0 (0.0%) |
| $100,000 to $299,999 | 248 (10.2%) | 379 (6.4%) |
| $300,000 to $499,999 | 1,693 (69.7%) | 4,744 (79.6%) |
| $500,000 to $749,999 | 312 (12.8%) | 622 (10.4%) |
| $750,000 to $999,999 | 8 (0.3%) | 72 (1.2%) |
| $1,000,000 or more | 50 (2.1%) | 16 (0.3%) |
| Total | 2,429 (100.0%) | 5,961 (100.0%) |
Household Income by Mortgage Status in Northglenn
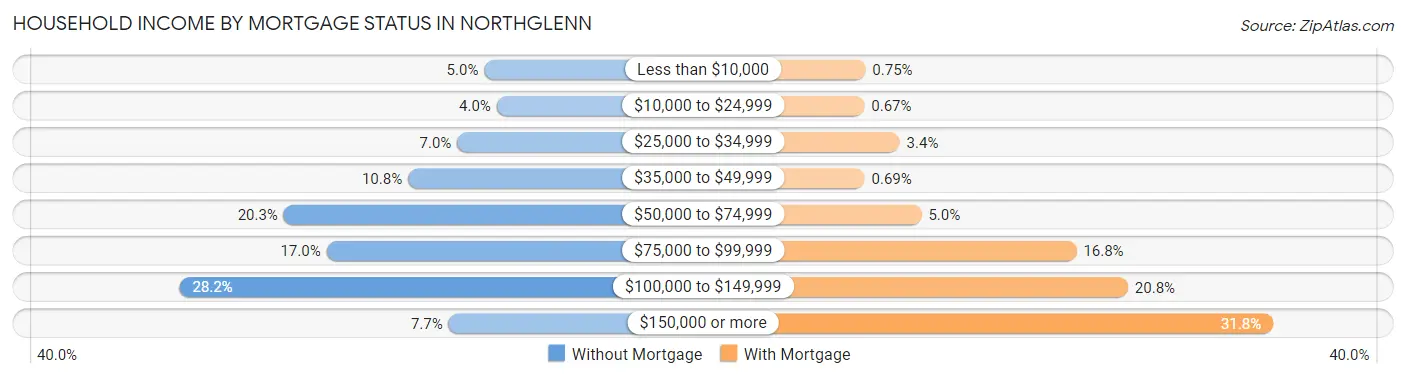
| Household Income | Without Mortgage | With Mortgage |
| Less than $10,000 | 121 (5.0%) | 45 (0.7%) |
| $10,000 to $24,999 | 98 (4.0%) | 40 (0.7%) |
| $25,000 to $34,999 | 171 (7.0%) | 200 (3.4%) |
| $35,000 to $49,999 | 262 (10.8%) | 41 (0.7%) |
| $50,000 to $74,999 | 492 (20.3%) | 299 (5.0%) |
| $75,000 to $99,999 | 413 (17.0%) | 1,003 (16.8%) |
| $100,000 to $149,999 | 685 (28.2%) | 1,237 (20.7%) |
| $150,000 or more | 187 (7.7%) | 1,896 (31.8%) |
| Total | 2,429 (100.0%) | 5,961 (100.0%) |
Property Value to Household Income Ratio in Northglenn
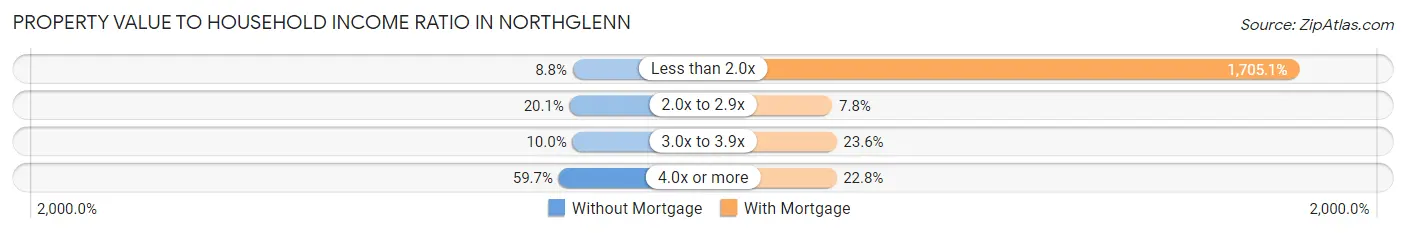
| Value-to-Income Ratio | Without Mortgage | With Mortgage |
| Less than 2.0x | 213 (8.8%) | 101,638 (1,705.0%) |
| 2.0x to 2.9x | 489 (20.1%) | 466 (7.8%) |
| 3.0x to 3.9x | 242 (10.0%) | 1,405 (23.6%) |
| 4.0x or more | 1,451 (59.7%) | 1,360 (22.8%) |
| Total | 2,429 (100.0%) | 5,961 (100.0%) |
Real Estate Taxes by Mortgage Status in Northglenn
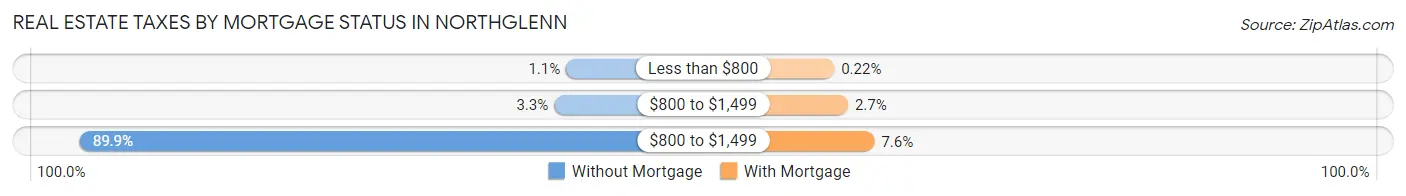
| Property Taxes | Without Mortgage | With Mortgage |
| Less than $800 | 27 (1.1%) | 13 (0.2%) |
| $800 to $1,499 | 80 (3.3%) | 163 (2.7%) |
| $800 to $1,499 | 2,184 (89.9%) | 451 (7.6%) |
| Total | 2,429 (100.0%) | 5,961 (100.0%) |
Health & Disability in Northglenn
Health Insurance Coverage by Age in Northglenn
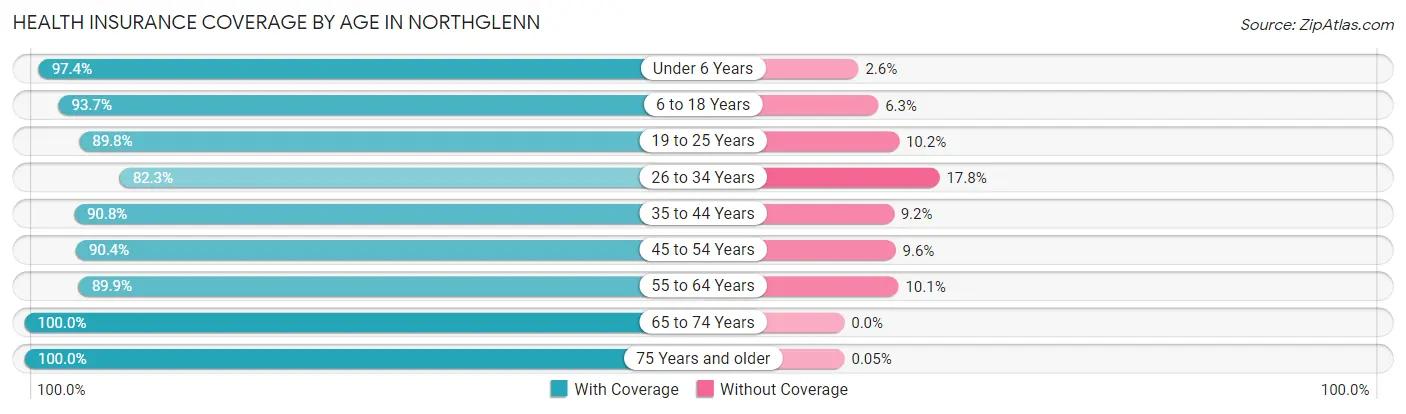
| Age Bracket | With Coverage | Without Coverage |
| Under 6 Years | 2,660 (97.4%) | 72 (2.6%) |
| 6 to 18 Years | 6,056 (93.7%) | 409 (6.3%) |
| 19 to 25 Years | 3,337 (89.8%) | 379 (10.2%) |
| 26 to 34 Years | 5,404 (82.3%) | 1,166 (17.7%) |
| 35 to 44 Years | 4,959 (90.8%) | 503 (9.2%) |
| 45 to 54 Years | 4,073 (90.4%) | 431 (9.6%) |
| 55 to 64 Years | 3,650 (89.9%) | 410 (10.1%) |
| 65 to 74 Years | 2,277 (100.0%) | 0 (0.0%) |
| 75 Years and older | 2,002 (100.0%) | 1 (0.1%) |
| Total | 34,418 (91.1%) | 3,371 (8.9%) |
Health Insurance Coverage by Citizenship Status in Northglenn
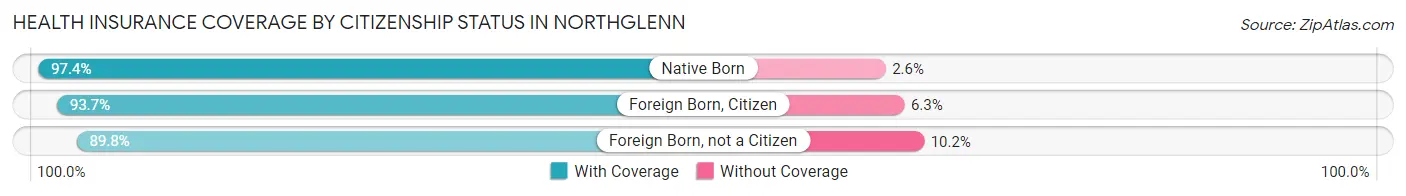
| Citizenship Status | With Coverage | Without Coverage |
| Native Born | 2,660 (97.4%) | 72 (2.6%) |
| Foreign Born, Citizen | 6,056 (93.7%) | 409 (6.3%) |
| Foreign Born, not a Citizen | 3,337 (89.8%) | 379 (10.2%) |
Health Insurance Coverage by Household Income in Northglenn
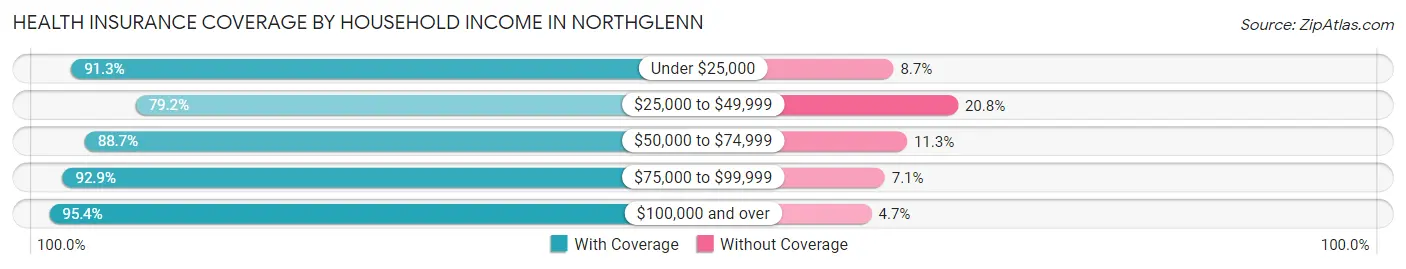
| Household Income | With Coverage | Without Coverage |
| Under $25,000 | 2,557 (91.3%) | 245 (8.7%) |
| $25,000 to $49,999 | 4,318 (79.2%) | 1,136 (20.8%) |
| $50,000 to $74,999 | 6,150 (88.7%) | 782 (11.3%) |
| $75,000 to $99,999 | 5,966 (92.9%) | 457 (7.1%) |
| $100,000 and over | 15,414 (95.4%) | 751 (4.6%) |
Public vs Private Health Insurance Coverage by Age in Northglenn
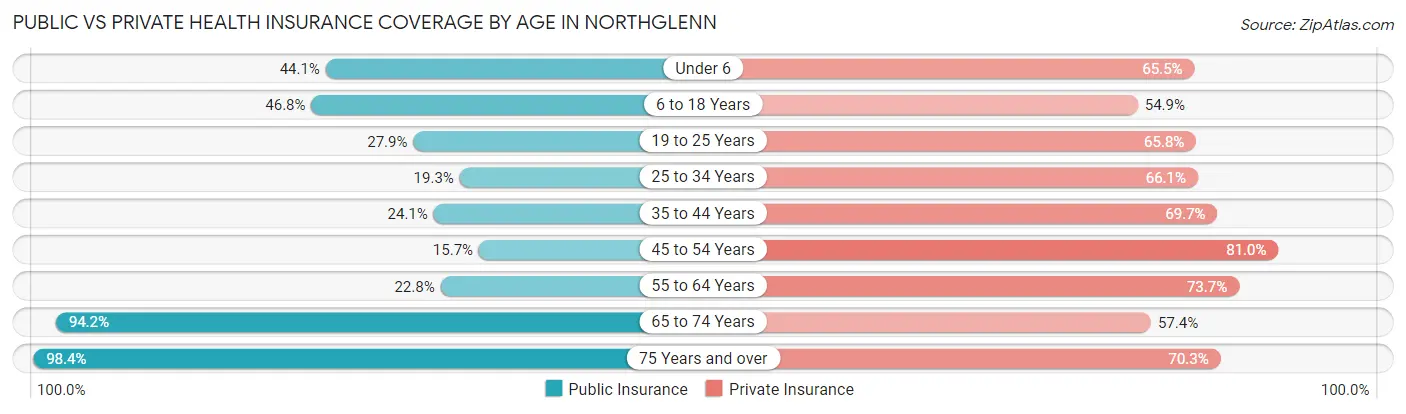
| Age Bracket | Public Insurance | Private Insurance |
| Under 6 | 1,205 (44.1%) | 1,788 (65.4%) |
| 6 to 18 Years | 3,024 (46.8%) | 3,552 (54.9%) |
| 19 to 25 Years | 1,035 (27.9%) | 2,444 (65.8%) |
| 25 to 34 Years | 1,265 (19.3%) | 4,341 (66.1%) |
| 35 to 44 Years | 1,315 (24.1%) | 3,808 (69.7%) |
| 45 to 54 Years | 706 (15.7%) | 3,649 (81.0%) |
| 55 to 64 Years | 926 (22.8%) | 2,993 (73.7%) |
| 65 to 74 Years | 2,145 (94.2%) | 1,307 (57.4%) |
| 75 Years and over | 1,971 (98.4%) | 1,408 (70.3%) |
| Total | 13,592 (36.0%) | 25,290 (66.9%) |
Disability Status by Sex by Age in Northglenn
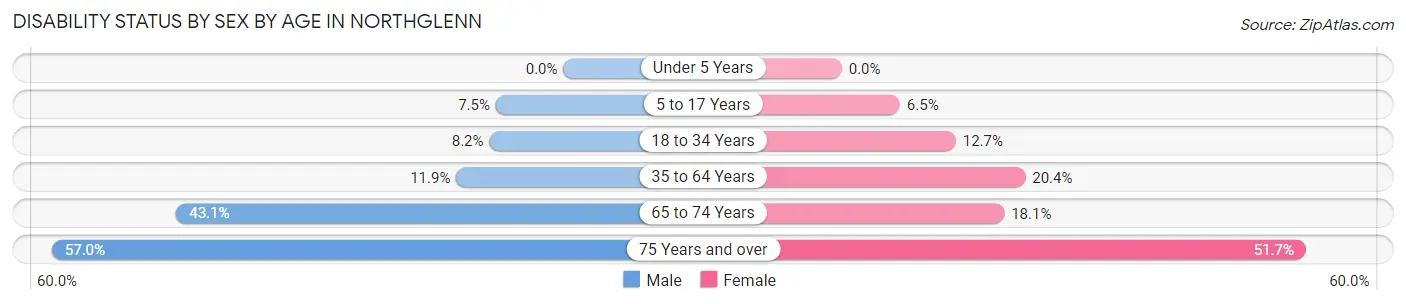
| Age Bracket | Male | Female |
| Under 5 Years | 0 (0.0%) | 0 (0.0%) |
| 5 to 17 Years | 273 (7.5%) | 195 (6.5%) |
| 18 to 34 Years | 432 (8.2%) | 694 (12.7%) |
| 35 to 64 Years | 897 (11.9%) | 1,330 (20.4%) |
| 65 to 74 Years | 462 (43.1%) | 218 (18.1%) |
| 75 Years and over | 442 (57.0%) | 634 (51.7%) |
Disability Class by Sex by Age in Northglenn
Disability Class: Hearing Difficulty
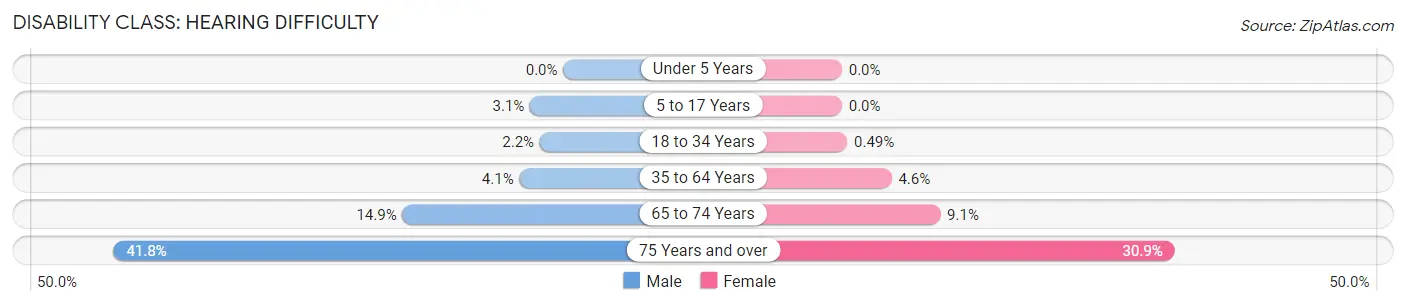
| Age Bracket | Male | Female |
| Under 5 Years | 0 (0.0%) | 0 (0.0%) |
| 5 to 17 Years | 112 (3.1%) | 0 (0.0%) |
| 18 to 34 Years | 114 (2.2%) | 27 (0.5%) |
| 35 to 64 Years | 306 (4.1%) | 300 (4.6%) |
| 65 to 74 Years | 160 (14.9%) | 110 (9.1%) |
| 75 Years and over | 324 (41.7%) | 379 (30.9%) |
Disability Class: Vision Difficulty
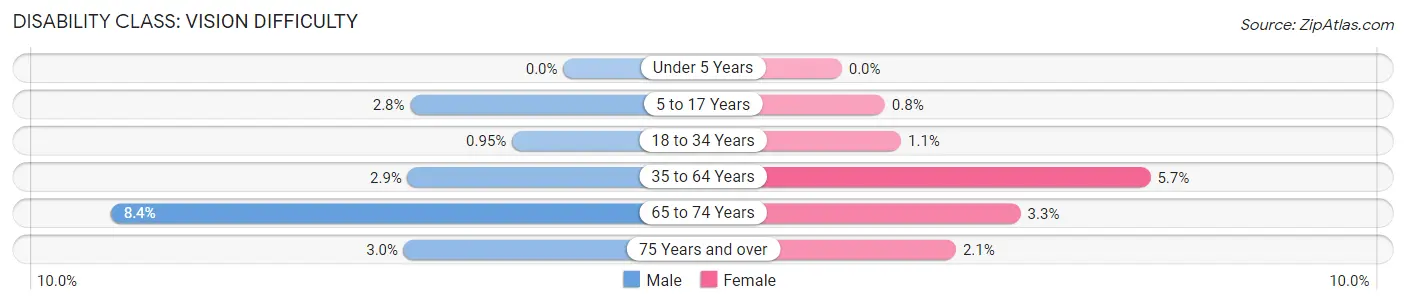
| Age Bracket | Male | Female |
| Under 5 Years | 0 (0.0%) | 0 (0.0%) |
| 5 to 17 Years | 103 (2.8%) | 24 (0.8%) |
| 18 to 34 Years | 50 (0.9%) | 60 (1.1%) |
| 35 to 64 Years | 217 (2.9%) | 373 (5.7%) |
| 65 to 74 Years | 90 (8.4%) | 40 (3.3%) |
| 75 Years and over | 23 (3.0%) | 26 (2.1%) |
Disability Class: Cognitive Difficulty
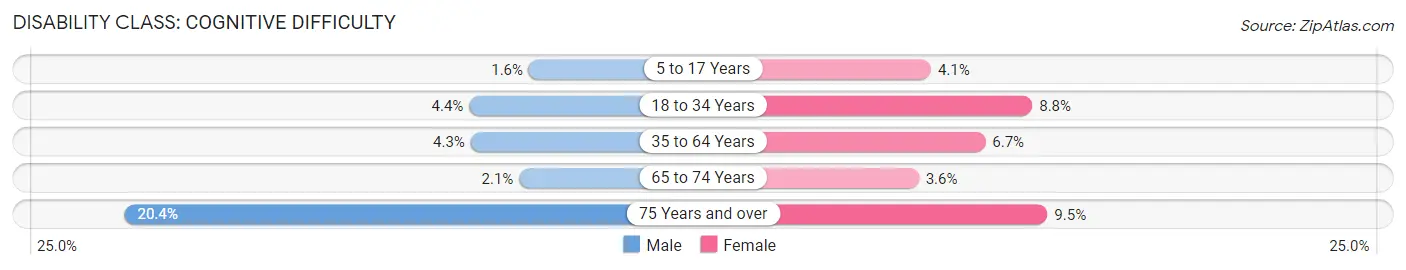
| Age Bracket | Male | Female |
| 5 to 17 Years | 58 (1.6%) | 125 (4.1%) |
| 18 to 34 Years | 229 (4.4%) | 483 (8.8%) |
| 35 to 64 Years | 323 (4.3%) | 433 (6.7%) |
| 65 to 74 Years | 22 (2.1%) | 43 (3.6%) |
| 75 Years and over | 158 (20.4%) | 117 (9.5%) |
Disability Class: Ambulatory Difficulty
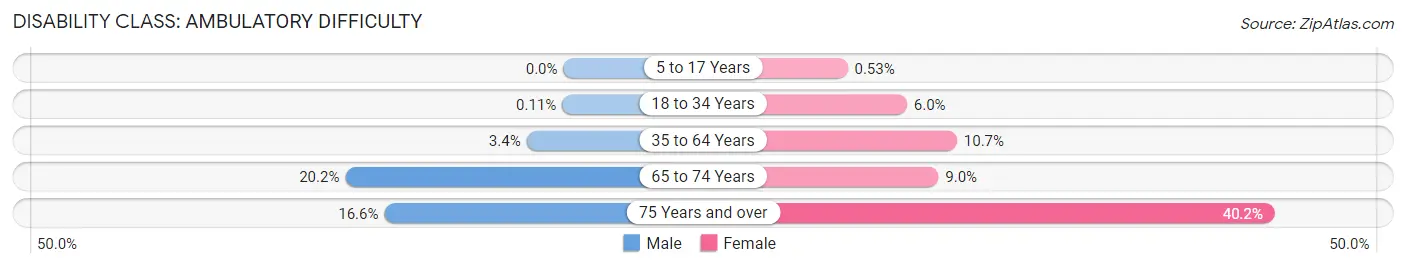
| Age Bracket | Male | Female |
| 5 to 17 Years | 0 (0.0%) | 16 (0.5%) |
| 18 to 34 Years | 6 (0.1%) | 330 (6.0%) |
| 35 to 64 Years | 257 (3.4%) | 695 (10.7%) |
| 65 to 74 Years | 217 (20.2%) | 108 (9.0%) |
| 75 Years and over | 129 (16.6%) | 493 (40.2%) |
Disability Class: Self-Care Difficulty
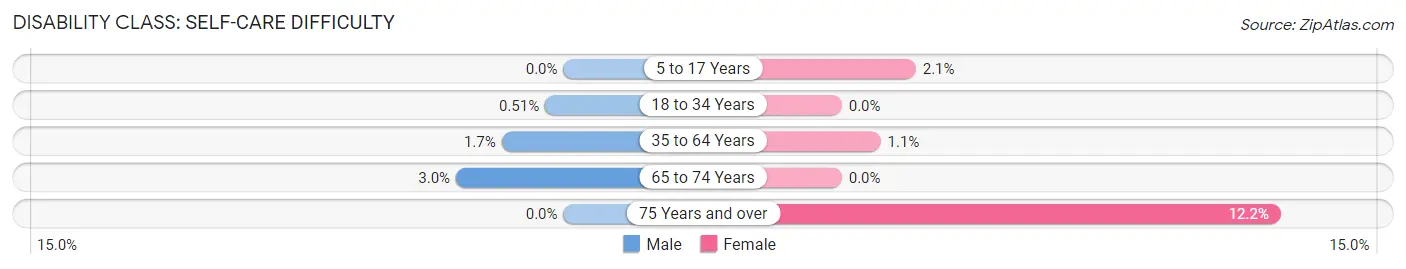
| Age Bracket | Male | Female |
| 5 to 17 Years | 0 (0.0%) | 62 (2.1%) |
| 18 to 34 Years | 27 (0.5%) | 0 (0.0%) |
| 35 to 64 Years | 129 (1.7%) | 70 (1.1%) |
| 65 to 74 Years | 32 (3.0%) | 0 (0.0%) |
| 75 Years and over | 0 (0.0%) | 150 (12.2%) |
Technology Access in Northglenn
Computing Device Access in Northglenn
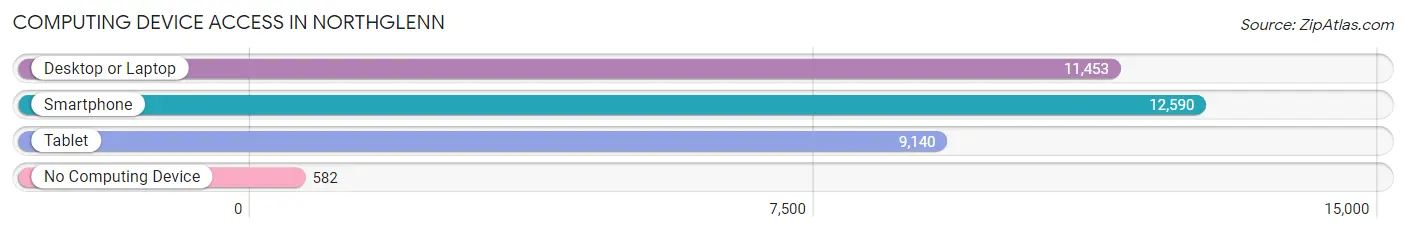
| Device Type | # Households | % Households |
| Desktop or Laptop | 11,453 | 80.4% |
| Smartphone | 12,590 | 88.4% |
| Tablet | 9,140 | 64.2% |
| No Computing Device | 582 | 4.1% |
| Total | 14,239 | 100.0% |
Internet Access in Northglenn
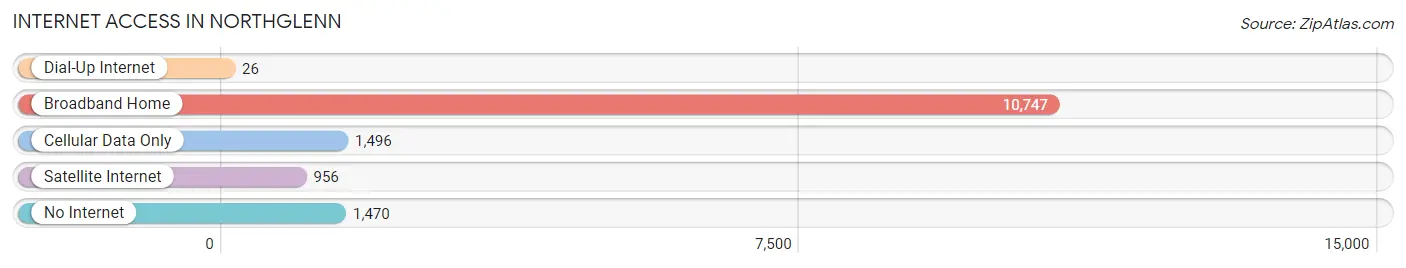
| Internet Type | # Households | % Households |
| Dial-Up Internet | 26 | 0.2% |
| Broadband Home | 10,747 | 75.5% |
| Cellular Data Only | 1,496 | 10.5% |
| Satellite Internet | 956 | 6.7% |
| No Internet | 1,470 | 10.3% |
| Total | 14,239 | 100.0% |
Northglenn Summary
Northglenn is a city located in Adams and Weld counties in the state of Colorado. It is a suburb of Denver and is located approximately 10 miles north of the city. Northglenn was incorporated in 1969 and is the 11th most populous city in the state.
History
Northglenn was originally part of the town of Thornton, which was founded in 1888. In 1959, the area that would become Northglenn was annexed by Thornton. In the 1960s, the area experienced rapid growth due to the construction of Interstate 25 and the development of the Denver-Boulder Turnpike. This growth led to the formation of the Northglenn Civic Association in 1965. The association was formed to advocate for the interests of the residents of the area.
In 1967, the residents of the area voted to incorporate as the City of Northglenn. The city was officially incorporated on August 1, 1969. The city was named after the North Glenn Shopping Center, which was located in the area.
Geography
Northglenn is located in Adams and Weld counties in the state of Colorado. It is located approximately 10 miles north of Denver and is part of the Denver-Aurora-Lakewood Metropolitan Statistical Area. The city has a total area of 8.3 square miles, of which 8.2 square miles is land and 0.1 square miles is water.
The city is located at the intersection of Interstate 25 and U.S. Route 36. It is bordered by Thornton to the south, Westminster to the west, and Broomfield to the north. The city is located in the South Platte River Valley and is surrounded by rolling hills.
Economy
Northglenn is a major economic center in the Denver metropolitan area. The city is home to several major employers, including the Northglenn Mall, the Northglenn Marketplace, and the Northglenn Town Center. The city is also home to several corporate headquarters, including the headquarters of the Colorado Department of Transportation.
The city is also home to several major retail stores, including Walmart, Target, and Home Depot. The city is also home to several restaurants, including Applebee's, Chili's, and Red Robin.
Demographics
As of the 2010 census, the population of Northglenn was 35,789. The racial makeup of the city was 79.2% White, 5.3% African American, 0.7% Native American, 4.2% Asian, 0.1% Pacific Islander, 6.7% from other races, and 3.9% from two or more races. Hispanic or Latino of any race were 18.2% of the population.
The median household income in Northglenn was $60,945 in 2018. The median home value was $346,400 in 2018. The median age of the population was 36.7 years. The city has a population density of 4,323 people per square mile.
Common Questions
What is Per Capita Income in Northglenn?
Per Capita income in Northglenn is $35,595.
What is the Median Family Income in Northglenn?
Median Family Income in Northglenn is $85,144.
What is the Median Household income in Northglenn?
Median Household Income in Northglenn is $77,797.
What is Income or Wage Gap in Northglenn?
Income or Wage Gap in Northglenn is 19.7%.
Women in Northglenn earn 80.3 cents for every dollar earned by a man.
What is Family Income Deficit in Northglenn?
Family Income Deficit in Northglenn is $13,898.
Families that are below poverty line in Northglenn earn $13,898 less on average than the poverty threshold level.
What is Inequality or Gini Index in Northglenn?
Inequality or Gini Index in Northglenn is 0.40.
What is the Total Population of Northglenn?
Total Population of Northglenn is 37,948.
What is the Total Male Population of Northglenn?
Total Male Population of Northglenn is 19,406.
What is the Total Female Population of Northglenn?
Total Female Population of Northglenn is 18,542.
What is the Ratio of Males per 100 Females in Northglenn?
There are 104.66 Males per 100 Females in Northglenn.
What is the Ratio of Females per 100 Males in Northglenn?
There are 95.55 Females per 100 Males in Northglenn.
What is the Median Population Age in Northglenn?
Median Population Age in Northglenn is 34.4 Years.
What is the Average Family Size in Northglenn
Average Family Size in Northglenn is 3.2 People.
What is the Average Household Size in Northglenn
Average Household Size in Northglenn is 2.6 People.
How Large is the Labor Force in Northglenn?
There are 21,459 People in the Labor Forcein in Northglenn.
What is the Percentage of People in the Labor Force in Northglenn?
71.4% of People are in the Labor Force in Northglenn.
What is the Unemployment Rate in Northglenn?
Unemployment Rate in Northglenn is 4.1%.