Parker, CO Map & Demographics
Parker Map
Parker Overview
$52,590
PER CAPITA INCOME
$146,452
AVG FAMILY INCOME
$126,615
AVG HOUSEHOLD INCOME
42.2%
WAGE / INCOME GAP [ % ]
57.8¢/ $1
WAGE / INCOME GAP [ $ ]
$8,169
FAMILY INCOME DEFICIT
0.37
INEQUALITY / GINI INDEX
58,733
TOTAL POPULATION
29,278
MALE POPULATION
29,455
FEMALE POPULATION
99.40
MALES / 100 FEMALES
100.60
FEMALES / 100 MALES
35.7
MEDIAN AGE
3.3
AVG FAMILY SIZE
2.8
AVG HOUSEHOLD SIZE
34,487
LABOR FORCE [ PEOPLE ]
76.5%
PERCENT IN LABOR FORCE
3.2%
UNEMPLOYMENT RATE
Parker Area Codes
Income in Parker
Income Overview in Parker
Per Capita Income in Parker is $52,590, while median incomes of families and households are $146,452 and $126,615 respectively.
| Characteristic | Number | Measure |
| Per Capita Income | 58,733 | $52,590 |
| Median Family Income | 15,697 | $146,452 |
| Mean Family Income | 15,697 | $166,864 |
| Median Household Income | 20,645 | $126,615 |
| Mean Household Income | 20,645 | $147,041 |
| Income Deficit | 15,697 | $8,169 |
| Wage / Income Gap (%) | 58,733 | 42.20% |
| Wage / Income Gap ($) | 58,733 | 57.80¢ per $1 |
| Gini / Inequality Index | 58,733 | 0.37 |
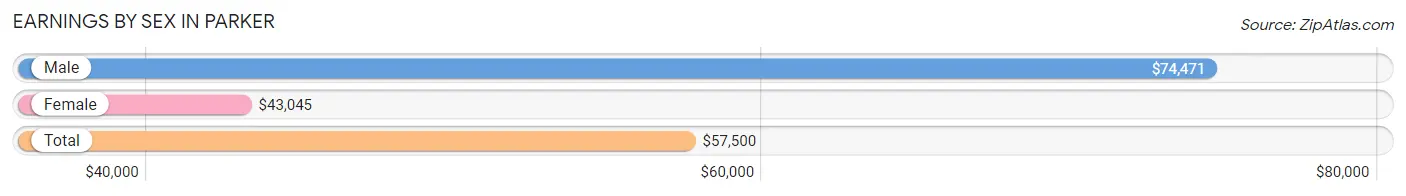
Earnings by Sex in Parker
Average Earnings in Parker are $57,500, $74,471 for men and $43,045 for women, a difference of 42.2%.
| Sex | Number | Average Earnings |
| Male | 19,311 (53.5%) | $74,471 |
| Female | 16,813 (46.5%) | $43,045 |
| Total | 36,124 (100.0%) | $57,500 |
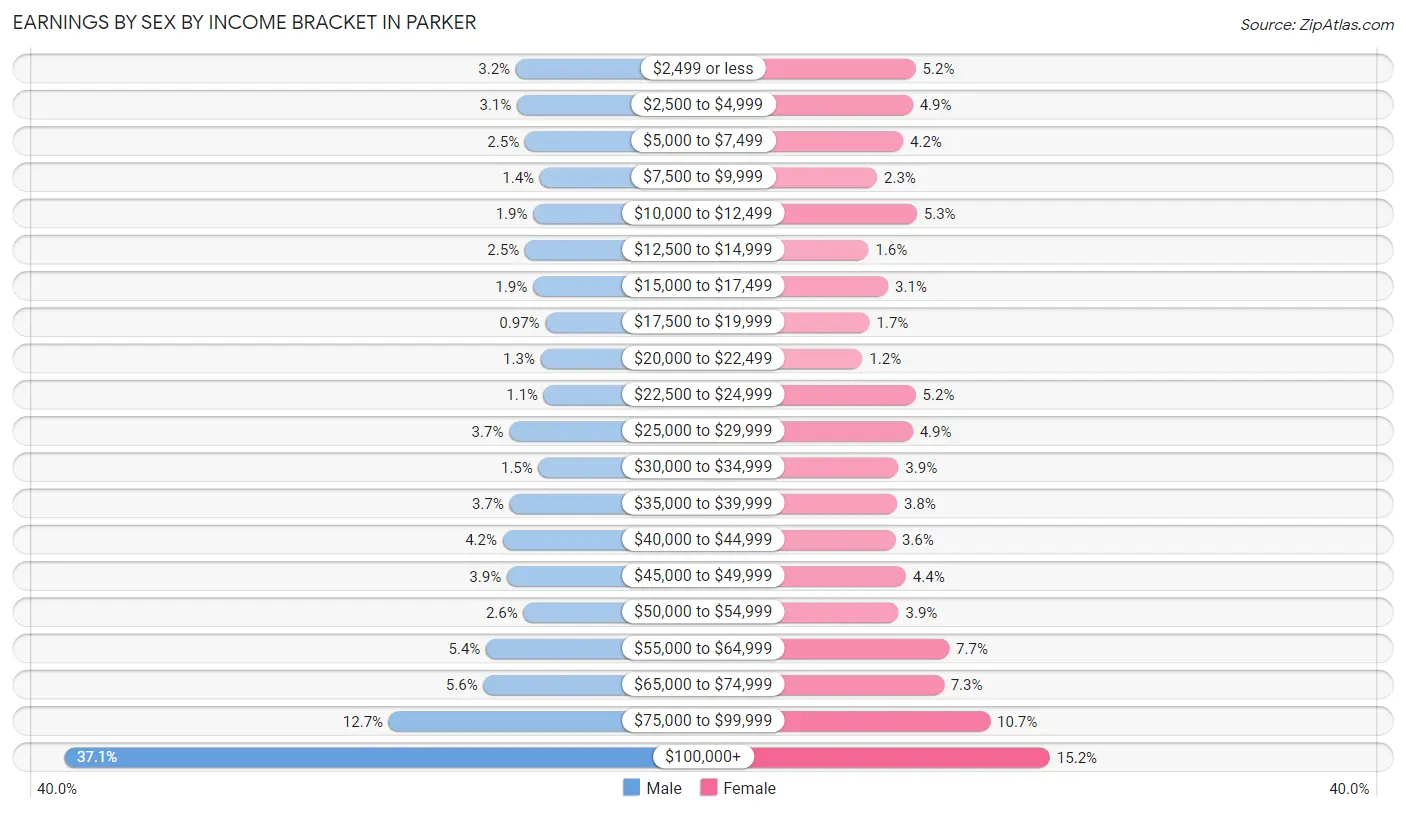
Earnings by Sex by Income Bracket in Parker
The most common earnings brackets in Parker are $100,000+ for men (7,154 | 37.0%) and $100,000+ for women (2,559 | 15.2%).
| Income | Male | Female |
| $2,499 or less | 615 (3.2%) | 867 (5.2%) |
| $2,500 to $4,999 | 597 (3.1%) | 831 (4.9%) |
| $5,000 to $7,499 | 483 (2.5%) | 710 (4.2%) |
| $7,500 to $9,999 | 267 (1.4%) | 382 (2.3%) |
| $10,000 to $12,499 | 364 (1.9%) | 883 (5.2%) |
| $12,500 to $14,999 | 482 (2.5%) | 274 (1.6%) |
| $15,000 to $17,499 | 367 (1.9%) | 521 (3.1%) |
| $17,500 to $19,999 | 187 (1.0%) | 288 (1.7%) |
| $20,000 to $22,499 | 254 (1.3%) | 197 (1.2%) |
| $22,500 to $24,999 | 208 (1.1%) | 868 (5.2%) |
| $25,000 to $29,999 | 710 (3.7%) | 831 (4.9%) |
| $30,000 to $34,999 | 286 (1.5%) | 650 (3.9%) |
| $35,000 to $39,999 | 706 (3.7%) | 632 (3.8%) |
| $40,000 to $44,999 | 803 (4.2%) | 607 (3.6%) |
| $45,000 to $49,999 | 743 (3.8%) | 745 (4.4%) |
| $50,000 to $54,999 | 504 (2.6%) | 653 (3.9%) |
| $55,000 to $64,999 | 1,045 (5.4%) | 1,290 (7.7%) |
| $65,000 to $74,999 | 1,083 (5.6%) | 1,220 (7.3%) |
| $75,000 to $99,999 | 2,453 (12.7%) | 1,805 (10.7%) |
| $100,000+ | 7,154 (37.0%) | 2,559 (15.2%) |
| Total | 19,311 (100.0%) | 16,813 (100.0%) |
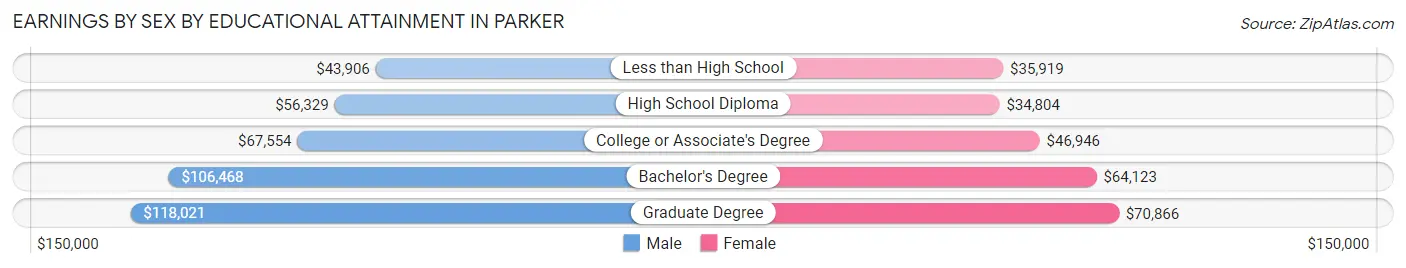
Earnings by Sex by Educational Attainment in Parker
Average earnings in Parker are $89,072 for men and $54,005 for women, a difference of 39.4%. Men with an educational attainment of graduate degree enjoy the highest average annual earnings of $118,021, while those with less than high school education earn the least with $43,906. Women with an educational attainment of graduate degree earn the most with the average annual earnings of $70,866, while those with high school diploma education have the smallest earnings of $34,804.
| Educational Attainment | Male Income | Female Income |
| Less than High School | $43,906 | $35,919 |
| High School Diploma | $56,329 | $34,804 |
| College or Associate's Degree | $67,554 | $46,946 |
| Bachelor's Degree | $106,468 | $64,123 |
| Graduate Degree | $118,021 | $70,866 |
| Total | $89,072 | $54,005 |
Family Income in Parker
Family Income Brackets in Parker
According to the Parker family income data, there are 4,066 families falling into the $200,000+ income range, which is the most common income bracket and makes up 25.9% of all families. Conversely, the $10,000 to $14,999 income bracket is the least frequent group with only 78 families (0.5%) belonging to this category.
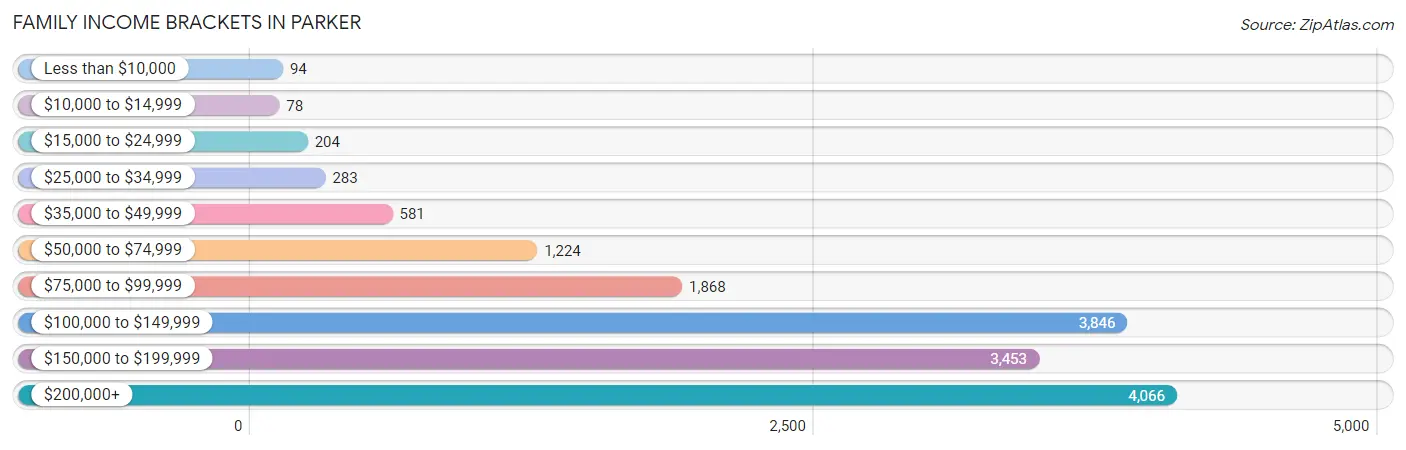
| Income Bracket | # Families | % Families |
| Less than $10,000 | 94 | 0.6% |
| $10,000 to $14,999 | 78 | 0.5% |
| $15,000 to $24,999 | 204 | 1.3% |
| $25,000 to $34,999 | 283 | 1.8% |
| $35,000 to $49,999 | 581 | 3.7% |
| $50,000 to $74,999 | 1,224 | 7.8% |
| $75,000 to $99,999 | 1,868 | 11.9% |
| $100,000 to $149,999 | 3,846 | 24.5% |
| $150,000 to $199,999 | 3,453 | 22.0% |
| $200,000+ | 4,066 | 25.9% |
Family Income by Famaliy Size in Parker
4-person families (3,784 | 24.1%) account for the highest median family income in Parker with $170,417 per family, while 2-person families (5,826 | 37.1%) have the highest median income of $58,882 per family member.
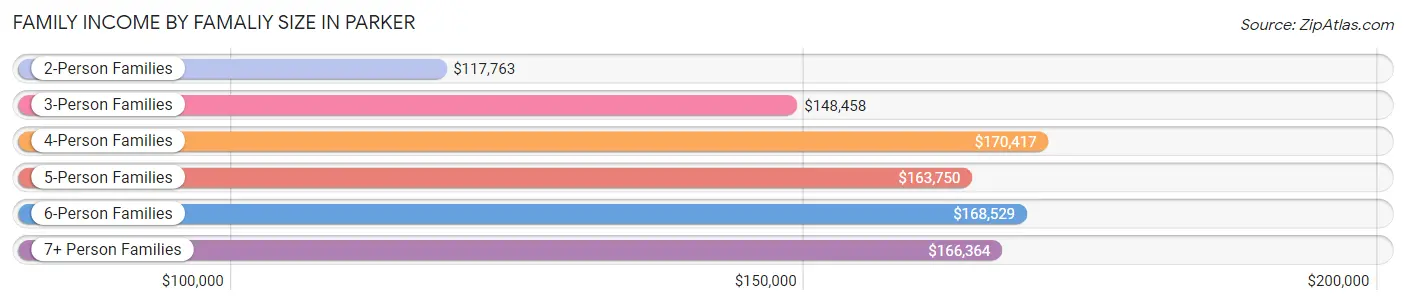
| Income Bracket | # Families | Median Income |
| 2-Person Families | 5,826 (37.1%) | $117,763 |
| 3-Person Families | 3,763 (24.0%) | $148,458 |
| 4-Person Families | 3,784 (24.1%) | $170,417 |
| 5-Person Families | 1,626 (10.4%) | $163,750 |
| 6-Person Families | 498 (3.2%) | $168,529 |
| 7+ Person Families | 200 (1.3%) | $166,364 |
| Total | 15,697 (100.0%) | $146,452 |
Family Income by Number of Earners in Parker
The median family income in Parker is $146,452, with families comprising 3+ earners (2,450) having the highest median family income of $192,421, while families with no earners (1,001) have the lowest median family income of $75,865, accounting for 15.6% and 6.4% of families, respectively.
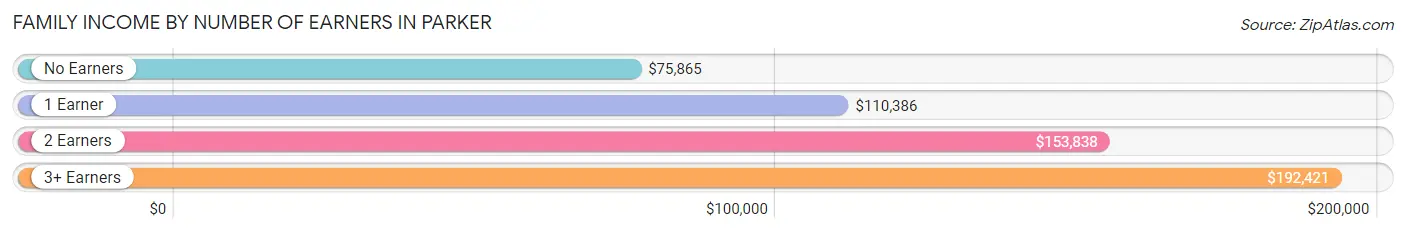
| Number of Earners | # Families | Median Income |
| No Earners | 1,001 (6.4%) | $75,865 |
| 1 Earner | 3,467 (22.1%) | $110,386 |
| 2 Earners | 8,779 (55.9%) | $153,838 |
| 3+ Earners | 2,450 (15.6%) | $192,421 |
| Total | 15,697 (100.0%) | $146,452 |
Household Income in Parker
Household Income Brackets in Parker
With 4,707 households falling in the category, the $100,000 to $149,999 income range is the most frequent in Parker, accounting for 22.8% of all households. In contrast, only 186 households (0.9%) fall into the $10,000 to $14,999 income bracket, making it the least populous group.
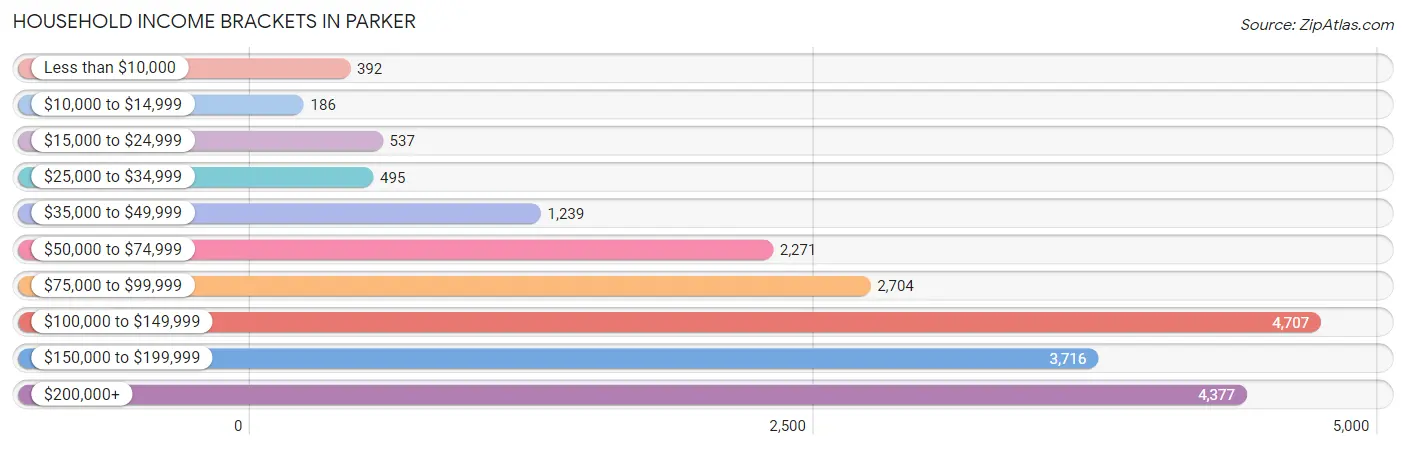
| Income Bracket | # Households | % Households |
| Less than $10,000 | 392 | 1.9% |
| $10,000 to $14,999 | 186 | 0.9% |
| $15,000 to $24,999 | 537 | 2.6% |
| $25,000 to $34,999 | 495 | 2.4% |
| $35,000 to $49,999 | 1,239 | 6.0% |
| $50,000 to $74,999 | 2,271 | 11.0% |
| $75,000 to $99,999 | 2,704 | 13.1% |
| $100,000 to $149,999 | 4,707 | 22.8% |
| $150,000 to $199,999 | 3,716 | 18.0% |
| $200,000+ | 4,377 | 21.2% |
Household Income by Householder Age in Parker
The median household income in Parker is $126,615, with the highest median household income of $149,575 found in the 45 to 64 years age bracket for the primary householder. A total of 8,106 households (39.3%) fall into this category. Meanwhile, the 65+ years age bracket for the primary householder has the lowest median household income of $82,973, with 3,172 households (15.4%) in this group.
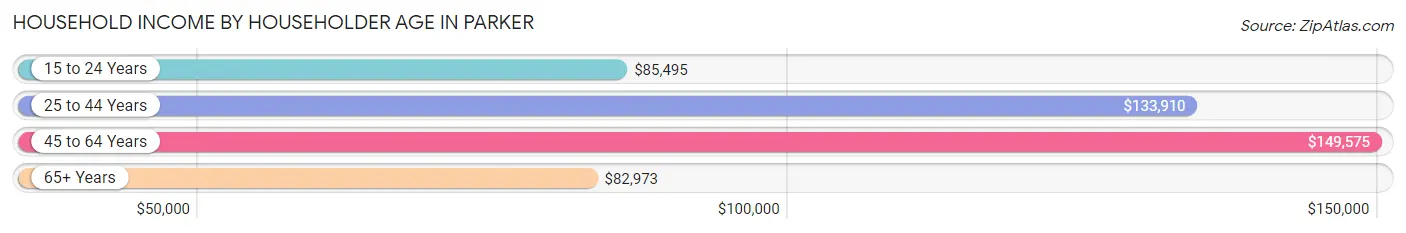
| Income Bracket | # Households | Median Income |
| 15 to 24 Years | 875 (4.2%) | $85,495 |
| 25 to 44 Years | 8,492 (41.1%) | $133,910 |
| 45 to 64 Years | 8,106 (39.3%) | $149,575 |
| 65+ Years | 3,172 (15.4%) | $82,973 |
| Total | 20,645 (100.0%) | $126,615 |
Poverty in Parker
Income Below Poverty by Sex and Age in Parker
With 2.1% poverty level for males and 4.6% for females among the residents of Parker, 55 to 64 year old males and 18 to 24 year old females are the most vulnerable to poverty, with 174 males (5.4%) and 332 females (11.6%) in their respective age groups living below the poverty level.
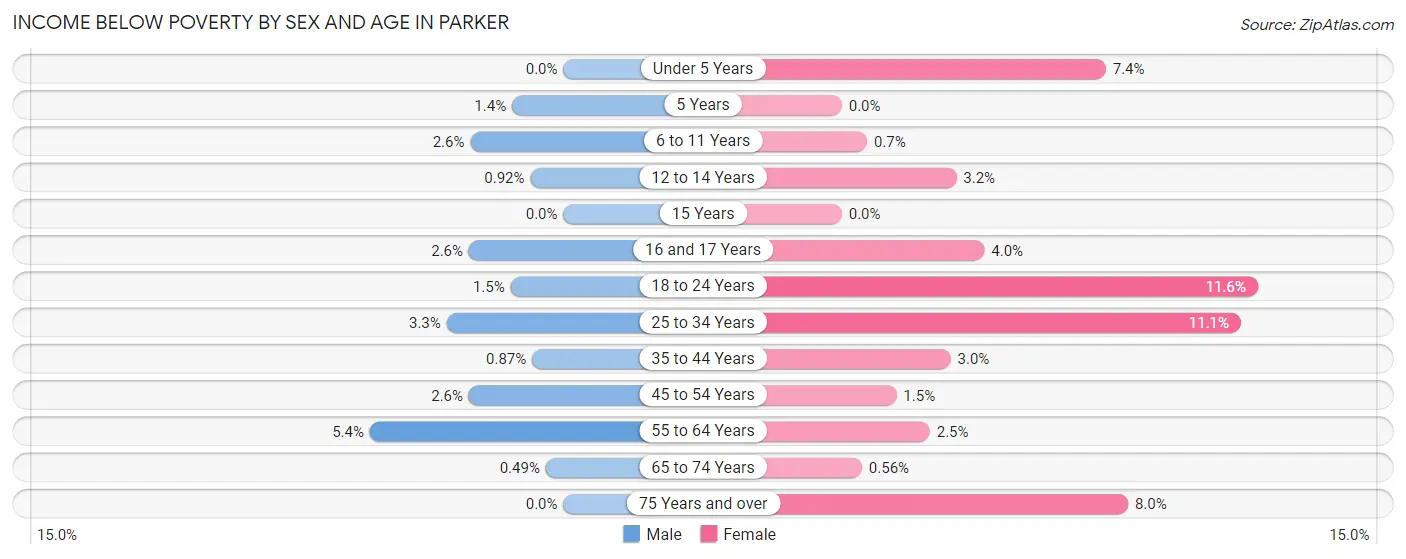
| Age Bracket | Male | Female |
| Under 5 Years | 0 (0.0%) | 149 (7.3%) |
| 5 Years | 7 (1.4%) | 0 (0.0%) |
| 6 to 11 Years | 69 (2.6%) | 16 (0.7%) |
| 12 to 14 Years | 15 (0.9%) | 47 (3.2%) |
| 15 Years | 0 (0.0%) | 0 (0.0%) |
| 16 and 17 Years | 26 (2.6%) | 36 (4.0%) |
| 18 to 24 Years | 41 (1.5%) | 332 (11.6%) |
| 25 to 34 Years | 128 (3.3%) | 398 (11.1%) |
| 35 to 44 Years | 43 (0.9%) | 141 (3.0%) |
| 45 to 54 Years | 106 (2.6%) | 65 (1.5%) |
| 55 to 64 Years | 174 (5.4%) | 77 (2.5%) |
| 65 to 74 Years | 9 (0.5%) | 12 (0.6%) |
| 75 Years and over | 0 (0.0%) | 89 (8.0%) |
| Total | 618 (2.1%) | 1,362 (4.6%) |
Income Above Poverty by Sex and Age in Parker
According to the poverty statistics in Parker, males aged under 5 years and females aged 5 years are the age groups that are most secure financially, with 100.0% of males and 100.0% of females in these age groups living above the poverty line.
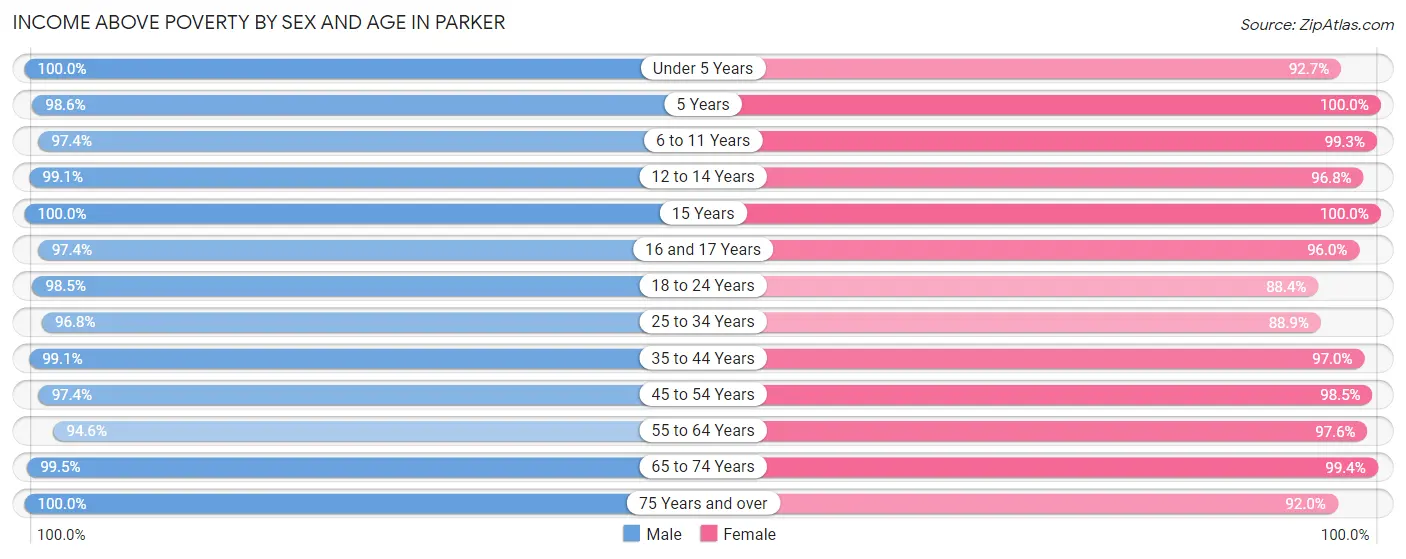
| Age Bracket | Male | Female |
| Under 5 Years | 1,440 (100.0%) | 1,879 (92.6%) |
| 5 Years | 482 (98.6%) | 515 (100.0%) |
| 6 to 11 Years | 2,590 (97.4%) | 2,263 (99.3%) |
| 12 to 14 Years | 1,619 (99.1%) | 1,427 (96.8%) |
| 15 Years | 620 (100.0%) | 473 (100.0%) |
| 16 and 17 Years | 964 (97.4%) | 871 (96.0%) |
| 18 to 24 Years | 2,752 (98.5%) | 2,534 (88.4%) |
| 25 to 34 Years | 3,815 (96.8%) | 3,183 (88.9%) |
| 35 to 44 Years | 4,873 (99.1%) | 4,507 (97.0%) |
| 45 to 54 Years | 3,927 (97.4%) | 4,219 (98.5%) |
| 55 to 64 Years | 3,054 (94.6%) | 3,060 (97.6%) |
| 65 to 74 Years | 1,843 (99.5%) | 2,113 (99.4%) |
| 75 Years and over | 626 (100.0%) | 1,027 (92.0%) |
| Total | 28,605 (97.9%) | 28,071 (95.4%) |
Income Below Poverty Among Married-Couple Families in Parker
The poverty statistics for married-couple families in Parker show that 1.0% or 134 of the total 13,144 families live below the poverty line. Families with 1 or 2 children have the highest poverty rate of 1.2%, comprising of 72 families. On the other hand, families with 3 or 4 children have the lowest poverty rate of 0.0%, which includes 0 families.
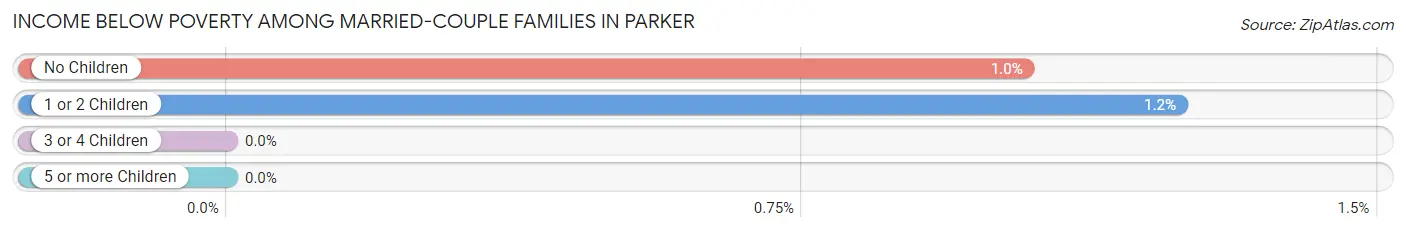
| Children | Above Poverty | Below Poverty |
| No Children | 5,892 (99.0%) | 62 (1.0%) |
| 1 or 2 Children | 5,723 (98.8%) | 72 (1.2%) |
| 3 or 4 Children | 1,351 (100.0%) | 0 (0.0%) |
| 5 or more Children | 44 (100.0%) | 0 (0.0%) |
| Total | 13,010 (99.0%) | 134 (1.0%) |
Income Below Poverty Among Single-Parent Households in Parker
According to the poverty data in Parker, 13.2% or 120 single-father households and 5.5% or 91 single-mother households are living below the poverty line. Among single-father households, those with 3 or 4 children have the highest poverty rate, with 16 households (30.8%) experiencing poverty. Likewise, among single-mother households, those with 3 or 4 children have the highest poverty rate, with 12 households (15.8%) falling below the poverty line.
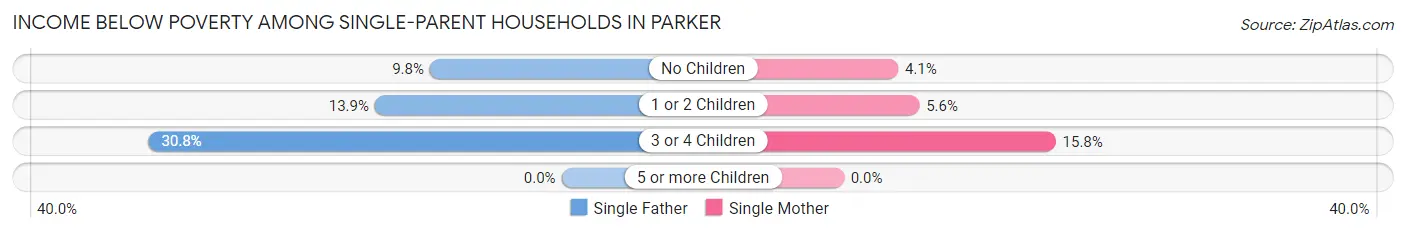
| Children | Single Father | Single Mother |
| No Children | 36 (9.8%) | 24 (4.1%) |
| 1 or 2 Children | 68 (13.9%) | 55 (5.6%) |
| 3 or 4 Children | 16 (30.8%) | 12 (15.8%) |
| 5 or more Children | 0 (0.0%) | 0 (0.0%) |
| Total | 120 (13.2%) | 91 (5.5%) |
Income Below Poverty Among Married-Couple vs Single-Parent Households in Parker
The poverty data for Parker shows that 134 of the married-couple family households (1.0%) and 211 of the single-parent households (8.3%) are living below the poverty level. Within the married-couple family households, those with 1 or 2 children have the highest poverty rate, with 72 households (1.2%) falling below the poverty line. Among the single-parent households, those with 3 or 4 children have the highest poverty rate, with 28 household (21.9%) living below poverty.
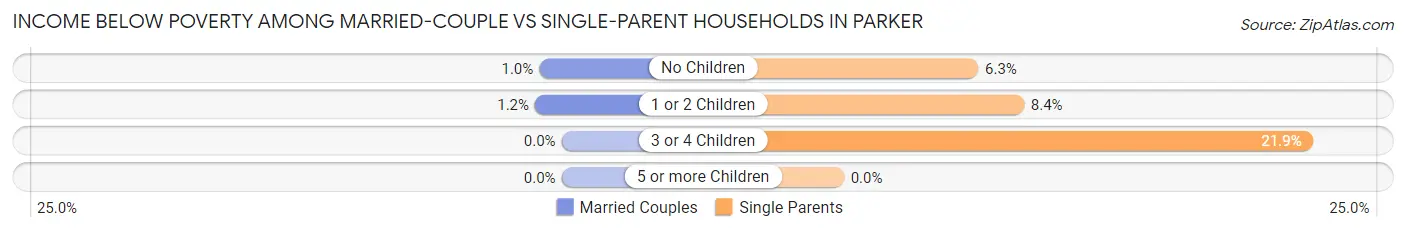
| Children | Married-Couple Families | Single-Parent Households |
| No Children | 62 (1.0%) | 60 (6.3%) |
| 1 or 2 Children | 72 (1.2%) | 123 (8.4%) |
| 3 or 4 Children | 0 (0.0%) | 28 (21.9%) |
| 5 or more Children | 0 (0.0%) | 0 (0.0%) |
| Total | 134 (1.0%) | 211 (8.3%) |
Race in Parker
The most populous races in Parker are White / Caucasian (47,819 | 81.4%), Hispanic or Latino (7,311 | 12.4%), and Two or more Races (5,177 | 8.8%).
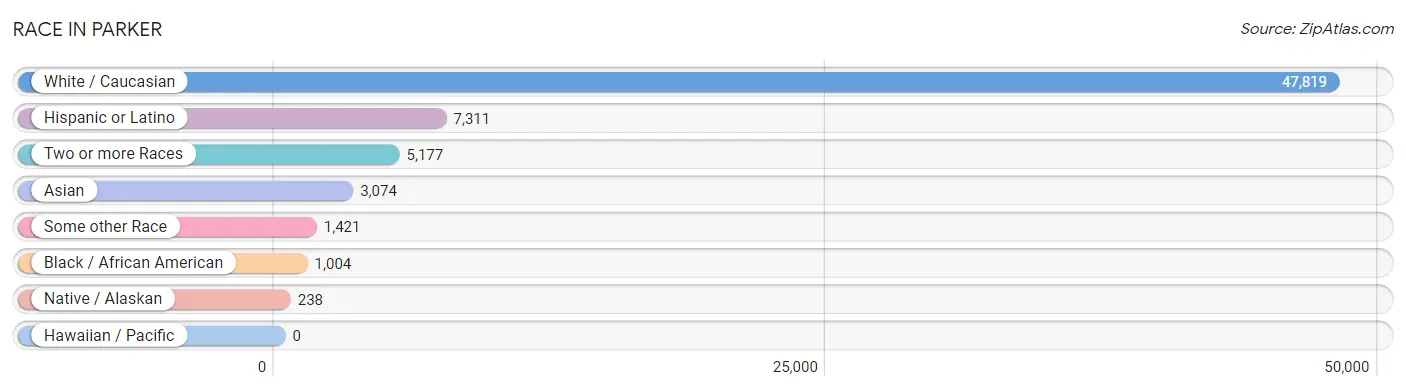
| Race | # Population | % Population |
| Asian | 3,074 | 5.2% |
| Black / African American | 1,004 | 1.7% |
| Hawaiian / Pacific | 0 | 0.0% |
| Hispanic or Latino | 7,311 | 12.4% |
| Native / Alaskan | 238 | 0.4% |
| White / Caucasian | 47,819 | 81.4% |
| Two or more Races | 5,177 | 8.8% |
| Some other Race | 1,421 | 2.4% |
| Total | 58,733 | 100.0% |
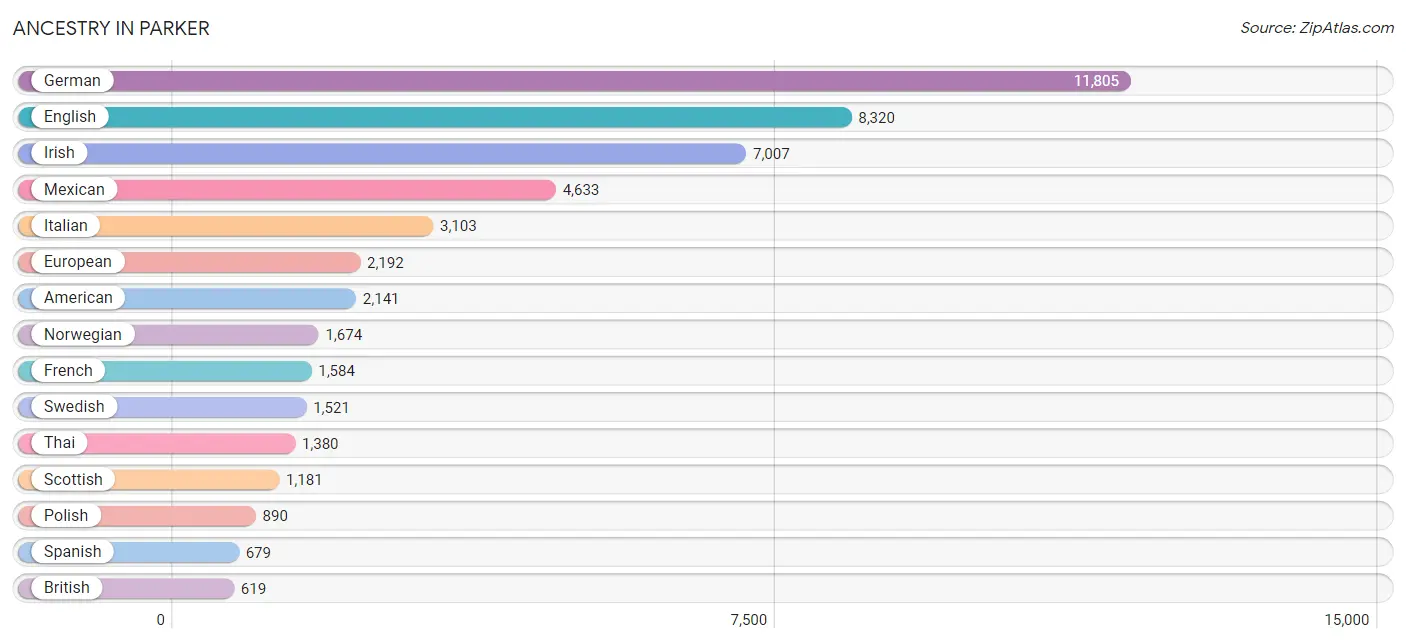
Ancestry in Parker
The most populous ancestries reported in Parker are German (11,805 | 20.1%), English (8,320 | 14.2%), Irish (7,007 | 11.9%), Mexican (4,633 | 7.9%), and Italian (3,103 | 5.3%), together accounting for 59.4% of all Parker residents.
| Ancestry | # Population | % Population |
| Afghan | 147 | 0.3% |
| African | 55 | 0.1% |
| American | 2,141 | 3.6% |
| Apache | 90 | 0.2% |
| Arab | 269 | 0.5% |
| Armenian | 78 | 0.1% |
| Australian | 241 | 0.4% |
| Austrian | 143 | 0.2% |
| Belgian | 29 | 0.1% |
| Bhutanese | 439 | 0.7% |
| Brazilian | 91 | 0.2% |
| British | 619 | 1.1% |
| Bulgarian | 113 | 0.2% |
| Burmese | 364 | 0.6% |
| Cajun | 30 | 0.1% |
| Canadian | 135 | 0.2% |
| Central American | 212 | 0.4% |
| Cherokee | 196 | 0.3% |
| Chickasaw | 60 | 0.1% |
| Chilean | 199 | 0.3% |
| Colombian | 127 | 0.2% |
| Comanche | 8 | 0.0% |
| Costa Rican | 28 | 0.1% |
| Croatian | 22 | 0.0% |
| Cuban | 61 | 0.1% |
| Czech | 307 | 0.5% |
| Czechoslovakian | 136 | 0.2% |
| Danish | 509 | 0.9% |
| Dominican | 38 | 0.1% |
| Dutch | 583 | 1.0% |
| Eastern European | 54 | 0.1% |
| Ecuadorian | 44 | 0.1% |
| Egyptian | 16 | 0.0% |
| English | 8,320 | 14.2% |
| Estonian | 12 | 0.0% |
| European | 2,192 | 3.7% |
| Finnish | 178 | 0.3% |
| French | 1,584 | 2.7% |
| French American Indian | 42 | 0.1% |
| French Canadian | 257 | 0.4% |
| German | 11,805 | 20.1% |
| Greek | 292 | 0.5% |
| Guamanian / Chamorro | 17 | 0.0% |
| Guatemalan | 70 | 0.1% |
| Hungarian | 362 | 0.6% |
| Icelander | 44 | 0.1% |
| Indian (Asian) | 513 | 0.9% |
| Inupiat | 15 | 0.0% |
| Iranian | 233 | 0.4% |
| Irish | 7,007 | 11.9% |
| Iroquois | 14 | 0.0% |
| Israeli | 8 | 0.0% |
| Italian | 3,103 | 5.3% |
| Jamaican | 56 | 0.1% |
| Korean | 399 | 0.7% |
| Lebanese | 41 | 0.1% |
| Lithuanian | 182 | 0.3% |
| Lumbee | 9 | 0.0% |
| Luxembourger | 7 | 0.0% |
| Malaysian | 238 | 0.4% |
| Mexican | 4,633 | 7.9% |
| Mexican American Indian | 78 | 0.1% |
| Moroccan | 64 | 0.1% |
| Native Hawaiian | 63 | 0.1% |
| Navajo | 222 | 0.4% |
| Nigerian | 9 | 0.0% |
| Northern European | 149 | 0.3% |
| Norwegian | 1,674 | 2.9% |
| Pakistani | 77 | 0.1% |
| Palestinian | 45 | 0.1% |
| Panamanian | 41 | 0.1% |
| Peruvian | 66 | 0.1% |
| Polish | 890 | 1.5% |
| Portuguese | 375 | 0.6% |
| Pueblo | 12 | 0.0% |
| Puerto Rican | 423 | 0.7% |
| Romanian | 114 | 0.2% |
| Russian | 520 | 0.9% |
| Salvadoran | 73 | 0.1% |
| Scandinavian | 489 | 0.8% |
| Scotch-Irish | 608 | 1.0% |
| Scottish | 1,181 | 2.0% |
| Serbian | 27 | 0.1% |
| Sioux | 70 | 0.1% |
| Slavic | 154 | 0.3% |
| Slovak | 87 | 0.2% |
| Slovene | 94 | 0.2% |
| South African | 18 | 0.0% |
| South American | 436 | 0.7% |
| Spaniard | 465 | 0.8% |
| Spanish | 679 | 1.2% |
| Sri Lankan | 291 | 0.5% |
| Subsaharan African | 103 | 0.2% |
| Swedish | 1,521 | 2.6% |
| Swiss | 119 | 0.2% |
| Syrian | 72 | 0.1% |
| Thai | 1,380 | 2.4% |
| Turkish | 14 | 0.0% |
| Ukrainian | 172 | 0.3% |
| Welsh | 523 | 0.9% |
| West Indian | 31 | 0.1% |
| Yakama | 20 | 0.0% |
| Yugoslavian | 13 | 0.0% | View All 103 Rows |
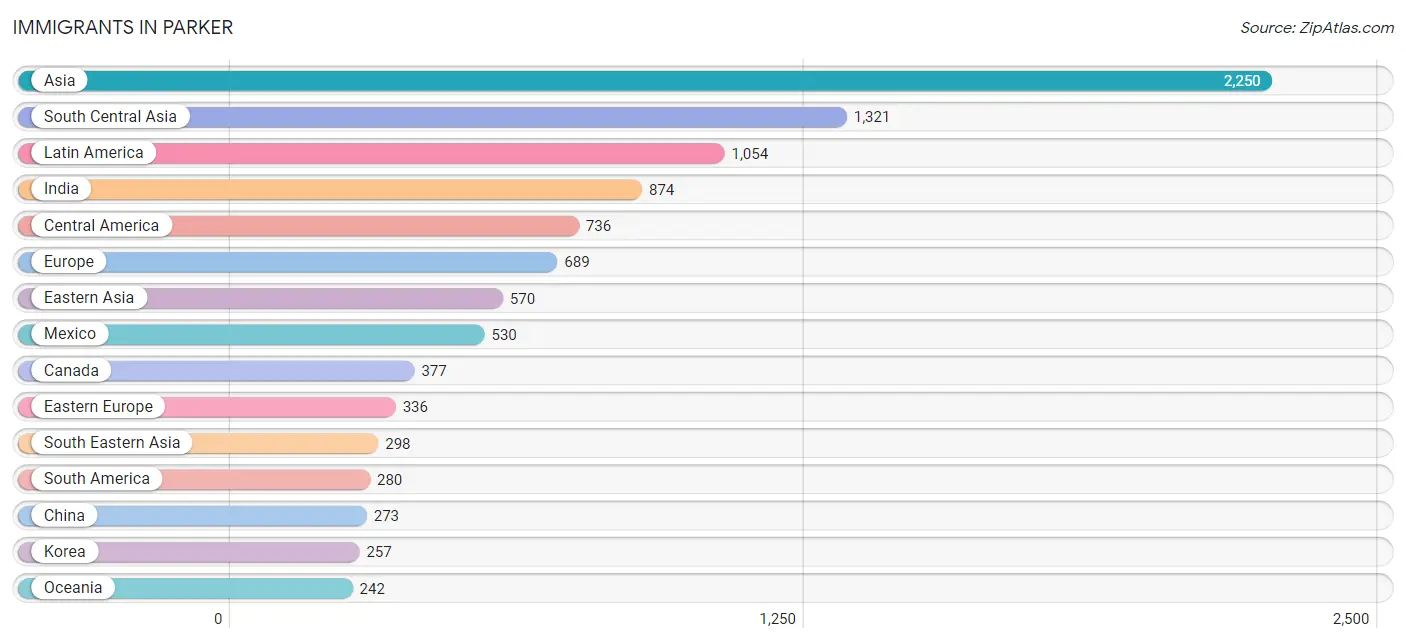
Immigrants in Parker
The most numerous immigrant groups reported in Parker came from Asia (2,250 | 3.8%), South Central Asia (1,321 | 2.2%), Latin America (1,054 | 1.8%), India (874 | 1.5%), and Central America (736 | 1.3%), together accounting for 10.6% of all Parker residents.
| Immigration Origin | # Population | % Population |
| Afghanistan | 147 | 0.3% |
| Africa | 166 | 0.3% |
| Armenia | 8 | 0.0% |
| Asia | 2,250 | 3.8% |
| Australia | 225 | 0.4% |
| Belize | 50 | 0.1% |
| Brazil | 184 | 0.3% |
| Bulgaria | 47 | 0.1% |
| Canada | 377 | 0.6% |
| Caribbean | 38 | 0.1% |
| Central America | 736 | 1.3% |
| Chile | 12 | 0.0% |
| China | 273 | 0.5% |
| Colombia | 32 | 0.1% |
| Costa Rica | 28 | 0.1% |
| Croatia | 10 | 0.0% |
| Cuba | 29 | 0.1% |
| Czechoslovakia | 49 | 0.1% |
| Eastern Asia | 570 | 1.0% |
| Eastern Europe | 336 | 0.6% |
| Ecuador | 10 | 0.0% |
| El Salvador | 17 | 0.0% |
| England | 54 | 0.1% |
| Europe | 689 | 1.2% |
| Germany | 112 | 0.2% |
| Guatemala | 70 | 0.1% |
| Guyana | 18 | 0.0% |
| Hungary | 18 | 0.0% |
| India | 874 | 1.5% |
| Iran | 19 | 0.0% |
| Ireland | 111 | 0.2% |
| Israel | 18 | 0.0% |
| Italy | 13 | 0.0% |
| Jamaica | 9 | 0.0% |
| Japan | 40 | 0.1% |
| Kazakhstan | 8 | 0.0% |
| Korea | 257 | 0.4% |
| Laos | 89 | 0.2% |
| Latin America | 1,054 | 1.8% |
| Mexico | 530 | 0.9% |
| Moldova | 45 | 0.1% |
| Morocco | 79 | 0.1% |
| Nepal | 145 | 0.3% |
| Netherlands | 13 | 0.0% |
| Nigeria | 47 | 0.1% |
| Northern Africa | 79 | 0.1% |
| Northern Europe | 215 | 0.4% |
| Norway | 4 | 0.0% |
| Oceania | 242 | 0.4% |
| Panama | 41 | 0.1% |
| Peru | 24 | 0.0% |
| Philippines | 102 | 0.2% |
| Poland | 25 | 0.0% |
| Romania | 8 | 0.0% |
| Russia | 61 | 0.1% |
| South Africa | 40 | 0.1% |
| South America | 280 | 0.5% |
| South Central Asia | 1,321 | 2.2% |
| South Eastern Asia | 298 | 0.5% |
| Southern Europe | 13 | 0.0% |
| Syria | 21 | 0.0% |
| Taiwan | 9 | 0.0% |
| Thailand | 21 | 0.0% |
| Turkey | 14 | 0.0% |
| Ukraine | 73 | 0.1% |
| Uzbekistan | 128 | 0.2% |
| Vietnam | 86 | 0.2% |
| Western Africa | 47 | 0.1% |
| Western Asia | 61 | 0.1% |
| Western Europe | 125 | 0.2% | View All 70 Rows |
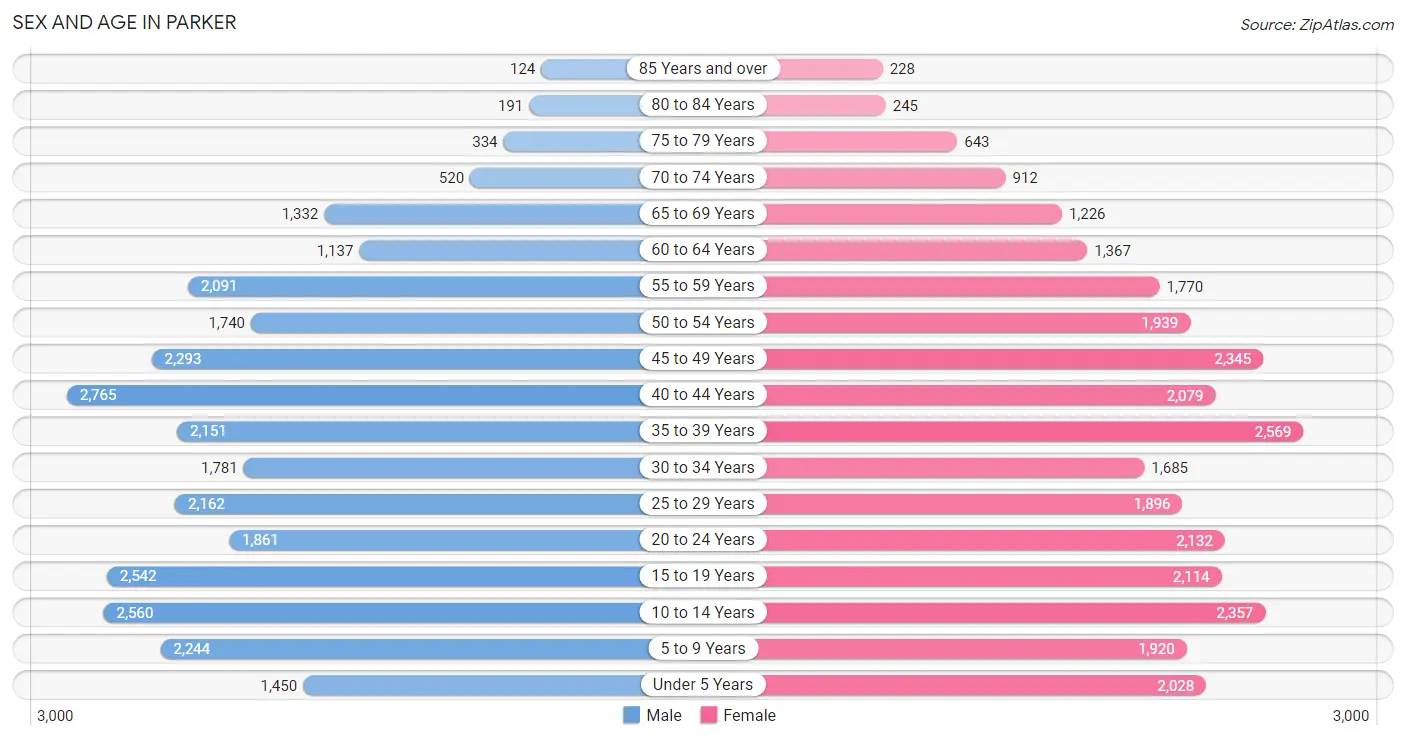
Sex and Age in Parker
Sex and Age in Parker
The most populous age groups in Parker are 40 to 44 Years (2,765 | 9.4%) for men and 35 to 39 Years (2,569 | 8.7%) for women.
| Age Bracket | Male | Female |
| Under 5 Years | 1,450 (5.0%) | 2,028 (6.9%) |
| 5 to 9 Years | 2,244 (7.7%) | 1,920 (6.5%) |
| 10 to 14 Years | 2,560 (8.7%) | 2,357 (8.0%) |
| 15 to 19 Years | 2,542 (8.7%) | 2,114 (7.2%) |
| 20 to 24 Years | 1,861 (6.4%) | 2,132 (7.2%) |
| 25 to 29 Years | 2,162 (7.4%) | 1,896 (6.4%) |
| 30 to 34 Years | 1,781 (6.1%) | 1,685 (5.7%) |
| 35 to 39 Years | 2,151 (7.3%) | 2,569 (8.7%) |
| 40 to 44 Years | 2,765 (9.4%) | 2,079 (7.1%) |
| 45 to 49 Years | 2,293 (7.8%) | 2,345 (8.0%) |
| 50 to 54 Years | 1,740 (5.9%) | 1,939 (6.6%) |
| 55 to 59 Years | 2,091 (7.1%) | 1,770 (6.0%) |
| 60 to 64 Years | 1,137 (3.9%) | 1,367 (4.6%) |
| 65 to 69 Years | 1,332 (4.5%) | 1,226 (4.2%) |
| 70 to 74 Years | 520 (1.8%) | 912 (3.1%) |
| 75 to 79 Years | 334 (1.1%) | 643 (2.2%) |
| 80 to 84 Years | 191 (0.6%) | 245 (0.8%) |
| 85 Years and over | 124 (0.4%) | 228 (0.8%) |
| Total | 29,278 (100.0%) | 29,455 (100.0%) |
Families and Households in Parker
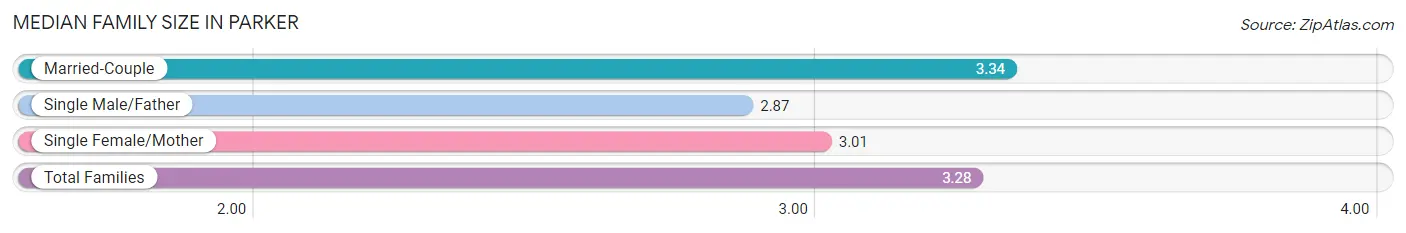
Median Family Size in Parker
The median family size in Parker is 3.28 persons per family, with married-couple families (13,144 | 83.7%) accounting for the largest median family size of 3.34 persons per family. On the other hand, single male/father families (908 | 5.8%) represent the smallest median family size with 2.87 persons per family.
| Family Type | # Families | Family Size |
| Married-Couple | 13,144 (83.7%) | 3.34 |
| Single Male/Father | 908 (5.8%) | 2.87 |
| Single Female/Mother | 1,645 (10.5%) | 3.01 |
| Total Families | 15,697 (100.0%) | 3.28 |
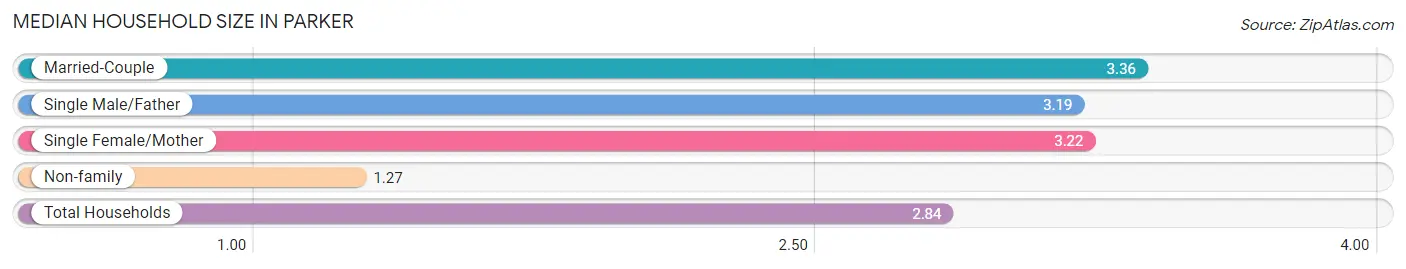
Median Household Size in Parker
The median household size in Parker is 2.84 persons per household, with married-couple households (13,144 | 63.7%) accounting for the largest median household size of 3.36 persons per household. non-family households (4,948 | 24.0%) represent the smallest median household size with 1.27 persons per household.
| Household Type | # Households | Household Size |
| Married-Couple | 13,144 (63.7%) | 3.36 |
| Single Male/Father | 908 (4.4%) | 3.19 |
| Single Female/Mother | 1,645 (8.0%) | 3.22 |
| Non-family | 4,948 (24.0%) | 1.27 |
| Total Households | 20,645 (100.0%) | 2.84 |
Household Size by Marriage Status in Parker
Out of a total of 20,645 households in Parker, 15,697 (76.0%) are family households, while 4,948 (24.0%) are nonfamily households. The most numerous type of family households are 2-person households, comprising 5,584, and the most common type of nonfamily households are 1-person households, comprising 3,801.
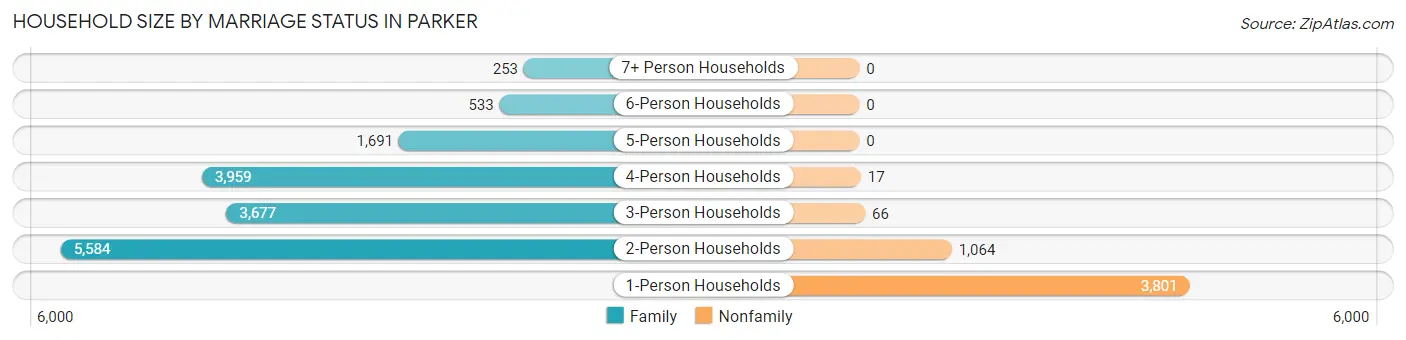
| Household Size | Family Households | Nonfamily Households |
| 1-Person Households | - | 3,801 (18.4%) |
| 2-Person Households | 5,584 (27.1%) | 1,064 (5.1%) |
| 3-Person Households | 3,677 (17.8%) | 66 (0.3%) |
| 4-Person Households | 3,959 (19.2%) | 17 (0.1%) |
| 5-Person Households | 1,691 (8.2%) | 0 (0.0%) |
| 6-Person Households | 533 (2.6%) | 0 (0.0%) |
| 7+ Person Households | 253 (1.2%) | 0 (0.0%) |
| Total | 15,697 (76.0%) | 4,948 (24.0%) |
Female Fertility in Parker
Fertility by Age in Parker
Average fertility rate in Parker is 43.0 births per 1,000 women. Women in the age bracket of 20 to 34 years have the highest fertility rate with 93.0 births per 1,000 women. Women in the age bracket of 20 to 34 years acount for 79.7% of all women with births.
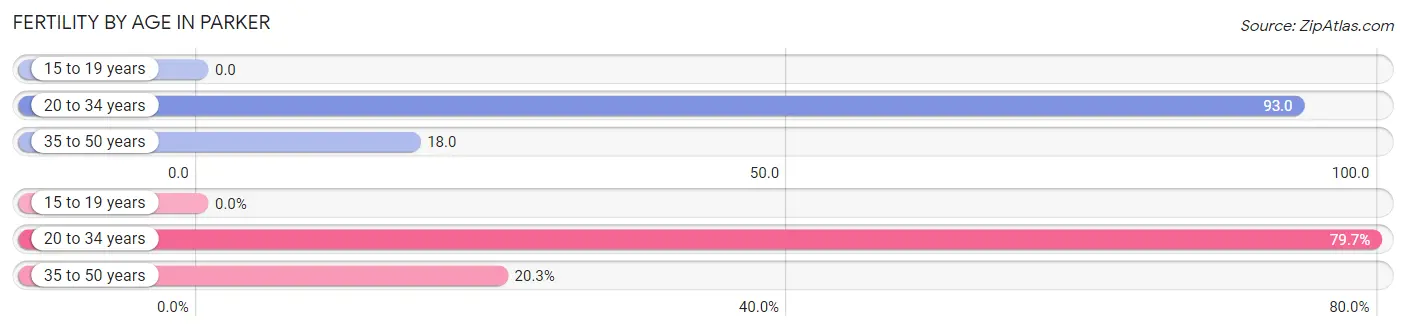
| Age Bracket | Women with Births | Births / 1,000 Women |
| 15 to 19 years | 0 (0.0%) | 0.0 |
| 20 to 34 years | 529 (79.7%) | 93.0 |
| 35 to 50 years | 135 (20.3%) | 18.0 |
| Total | 664 (100.0%) | 43.0 |
Fertility by Age by Marriage Status in Parker
85.2% of women with births (664) in Parker are married. The highest percentage of unmarried women with births falls into 20 to 34 years age bracket with 18.5% of them unmarried at the time of birth, while the lowest percentage of unmarried women with births belong to 35 to 50 years age bracket with 0.0% of them unmarried.
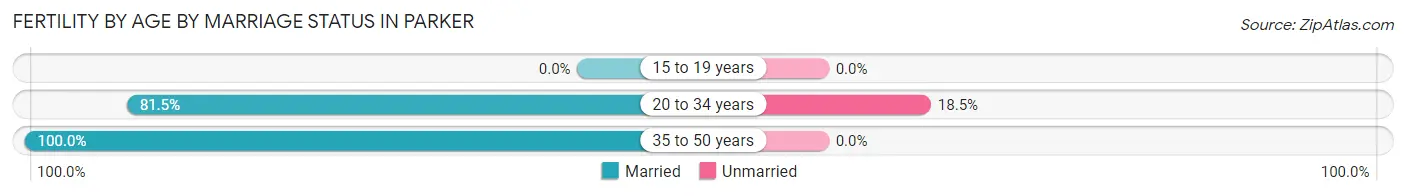
| Age Bracket | Married | Unmarried |
| 15 to 19 years | 0 (0.0%) | 0 (0.0%) |
| 20 to 34 years | 431 (81.5%) | 98 (18.5%) |
| 35 to 50 years | 135 (100.0%) | 0 (0.0%) |
| Total | 566 (85.2%) | 98 (14.8%) |
Fertility by Education in Parker
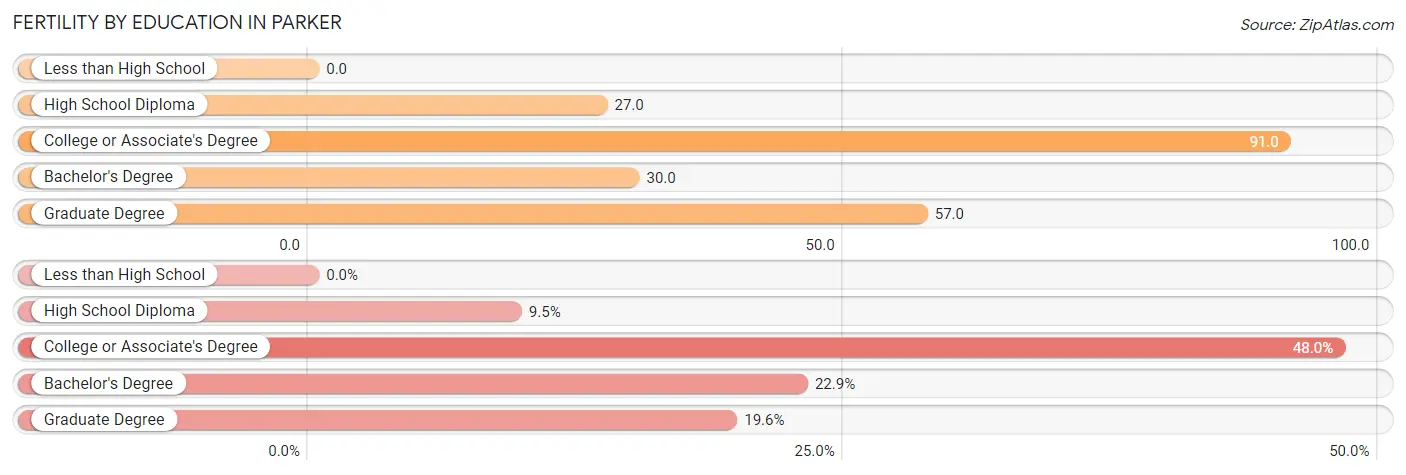
| Educational Attainment | Women with Births | Births / 1,000 Women |
| Less than High School | 0 (0.0%) | 0.0 |
| High School Diploma | 63 (9.5%) | 27.0 |
| College or Associate's Degree | 319 (48.0%) | 91.0 |
| Bachelor's Degree | 152 (22.9%) | 30.0 |
| Graduate Degree | 130 (19.6%) | 57.0 |
| Total | 664 (100.0%) | 43.0 |
Fertility by Education by Marriage Status in Parker
14.8% of women with births in Parker are unmarried. Women with the educational attainment of bachelor's degree are most likely to be married with 100.0% of them married at childbirth, while women with the educational attainment of high school diploma are least likely to be married with 28.6% of them unmarried at childbirth.
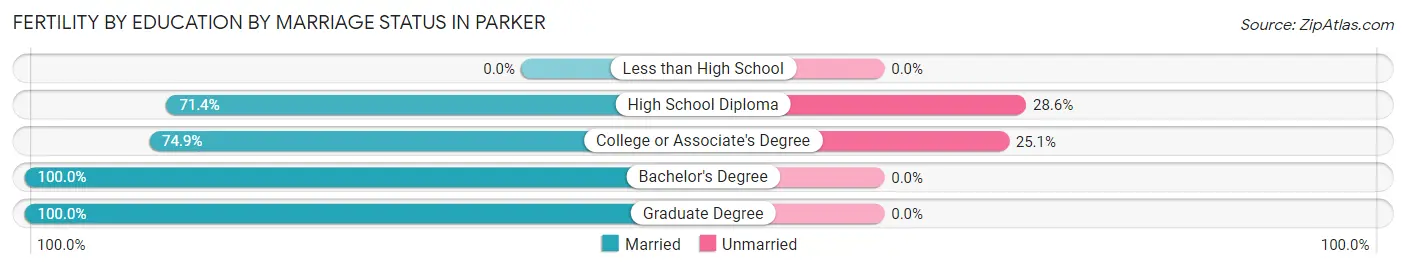
| Educational Attainment | Married | Unmarried |
| Less than High School | 0 (0.0%) | 0 (0.0%) |
| High School Diploma | 45 (71.4%) | 18 (28.6%) |
| College or Associate's Degree | 239 (74.9%) | 80 (25.1%) |
| Bachelor's Degree | 152 (100.0%) | 0 (0.0%) |
| Graduate Degree | 130 (100.0%) | 0 (0.0%) |
| Total | 566 (85.2%) | 98 (14.8%) |
Employment Characteristics in Parker
Employment by Class of Employer in Parker
Among the 32,661 employed individuals in Parker, private company employees (23,188 | 71.0%), local government employees (2,606 | 8.0%), and not-for-profit organizations (2,090 | 6.4%) make up the most common classes of employment.
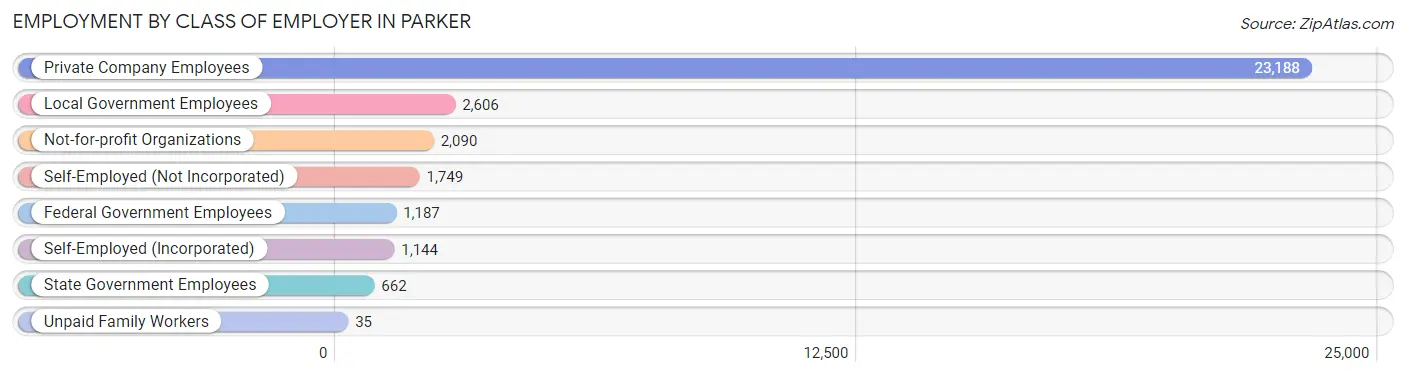
| Employer Class | # Employees | % Employees |
| Private Company Employees | 23,188 | 71.0% |
| Self-Employed (Incorporated) | 1,144 | 3.5% |
| Self-Employed (Not Incorporated) | 1,749 | 5.4% |
| Not-for-profit Organizations | 2,090 | 6.4% |
| Local Government Employees | 2,606 | 8.0% |
| State Government Employees | 662 | 2.0% |
| Federal Government Employees | 1,187 | 3.6% |
| Unpaid Family Workers | 35 | 0.1% |
| Total | 32,661 | 100.0% |
Employment Status by Age in Parker
According to the labor force statistics for Parker, out of the total population over 16 years of age (45,081), 76.5% or 34,487 individuals are in the labor force, with 3.2% or 1,104 of them unemployed. The age group with the highest labor force participation rate is 30 to 34 years, with 91.5% or 3,171 individuals in the labor force. Within the labor force, the 16 to 19 years age range has the highest percentage of unemployed individuals, with 6.8% or 133 of them being unemployed.
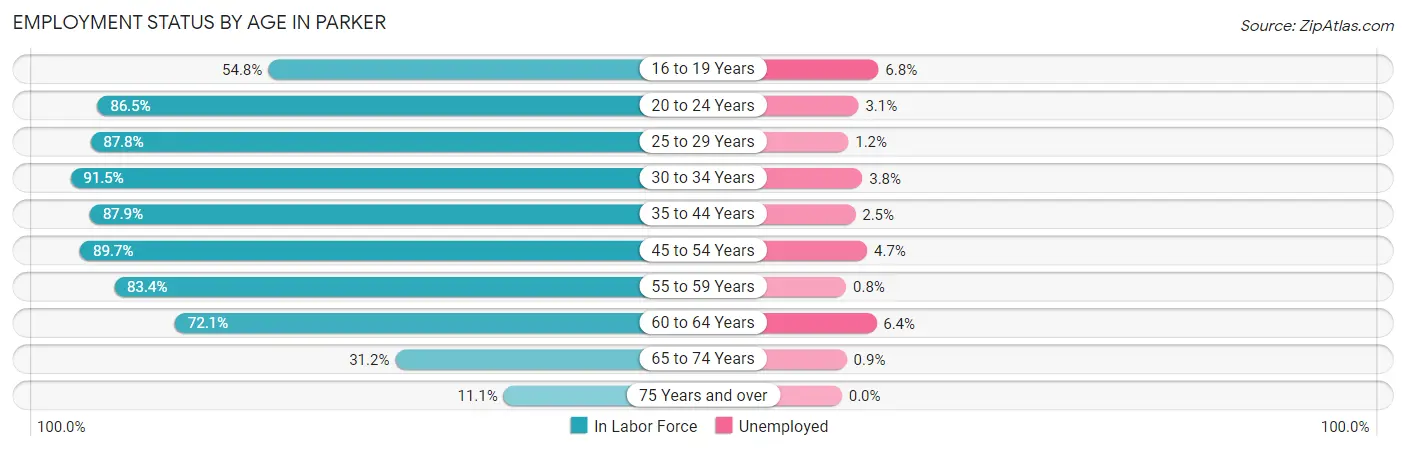
| Age Bracket | In Labor Force | Unemployed |
| 16 to 19 Years | 1,953 (54.8%) | 133 (6.8%) |
| 20 to 24 Years | 3,454 (86.5%) | 107 (3.1%) |
| 25 to 29 Years | 3,563 (87.8%) | 43 (1.2%) |
| 30 to 34 Years | 3,171 (91.5%) | 120 (3.8%) |
| 35 to 44 Years | 8,407 (87.9%) | 210 (2.5%) |
| 45 to 54 Years | 7,460 (89.7%) | 351 (4.7%) |
| 55 to 59 Years | 3,220 (83.4%) | 26 (0.8%) |
| 60 to 64 Years | 1,805 (72.1%) | 116 (6.4%) |
| 65 to 74 Years | 1,245 (31.2%) | 11 (0.9%) |
| 75 Years and over | 196 (11.1%) | 0 (0.0%) |
| Total | 34,487 (76.5%) | 1,104 (3.2%) |
Employment Status by Educational Attainment in Parker
According to labor force statistics for Parker, 86.9% of individuals (27,608) out of the total population between 25 and 64 years of age (31,770) are in the labor force, with 3.1% or 856 of them being unemployed. The group with the highest labor force participation rate are those with the educational attainment of bachelor's degree or higher, with 89.7% or 15,811 individuals in the labor force. Within the labor force, individuals with high school diploma education have the highest percentage of unemployment, with 8.6% or 294 of them being unemployed.
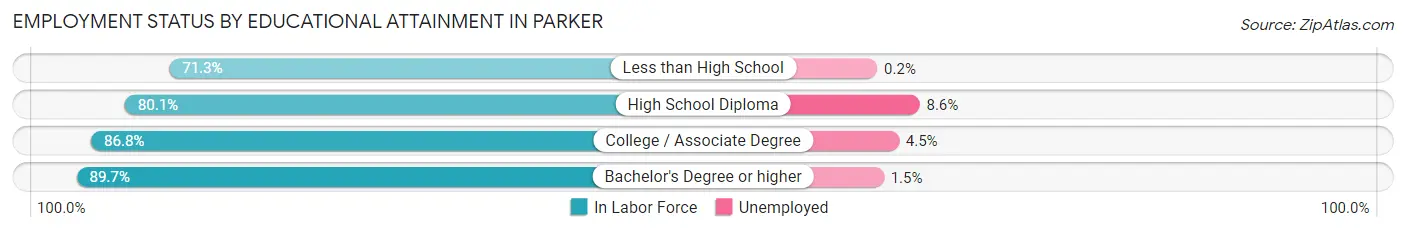
| Educational Attainment | In Labor Force | Unemployed |
| Less than High School | 826 (71.3%) | 2 (0.2%) |
| High School Diploma | 3,418 (80.1%) | 367 (8.6%) |
| College / Associate Degree | 7,566 (86.8%) | 392 (4.5%) |
| Bachelor's Degree or higher | 15,811 (89.7%) | 264 (1.5%) |
| Total | 27,608 (86.9%) | 985 (3.1%) |
Employment Occupations by Sex in Parker
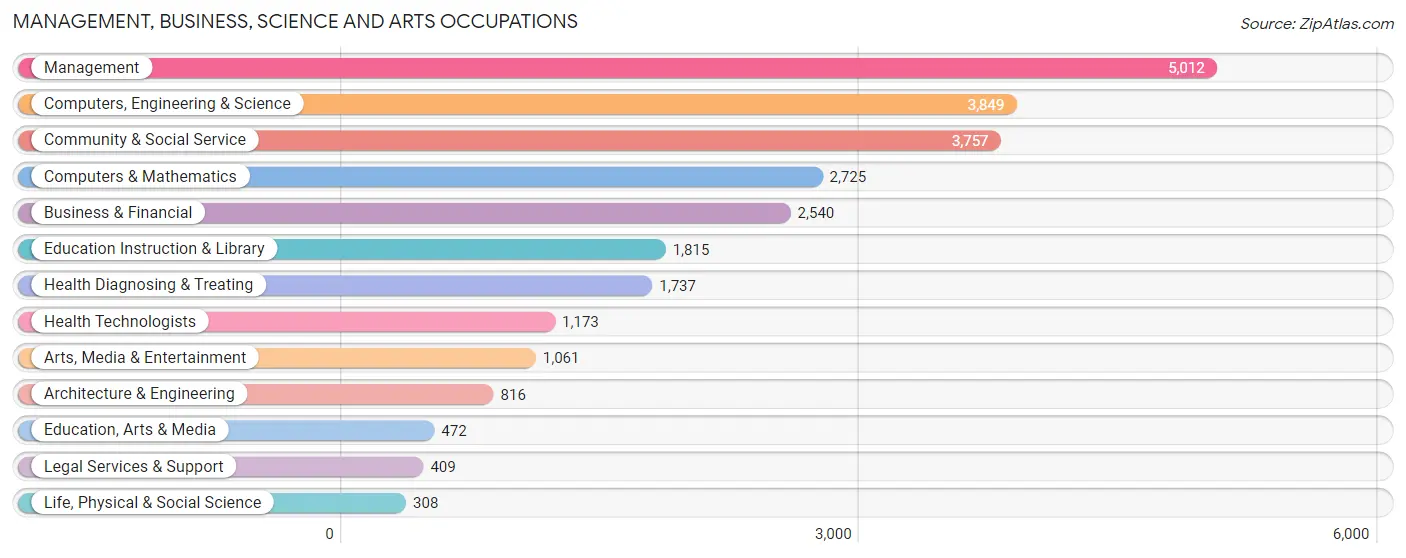
Management, Business, Science and Arts Occupations
The most common Management, Business, Science and Arts occupations in Parker are Management (5,012 | 15.1%), Computers, Engineering & Science (3,849 | 11.6%), Community & Social Service (3,757 | 11.3%), Computers & Mathematics (2,725 | 8.2%), and Business & Financial (2,540 | 7.7%).
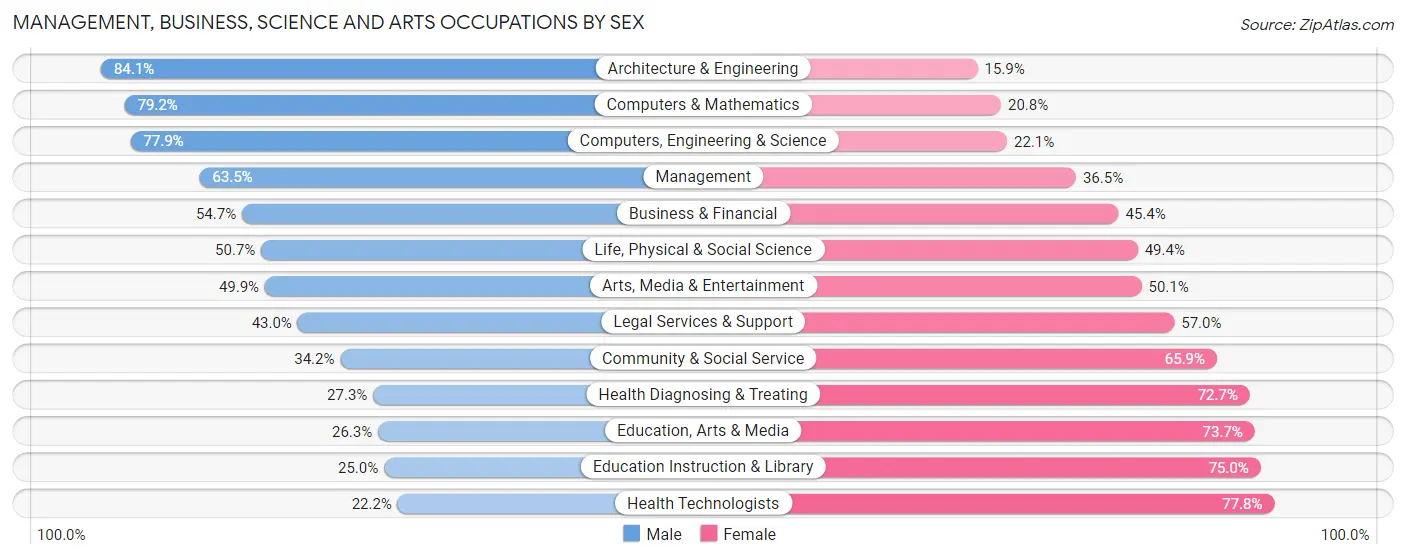
Management, Business, Science and Arts Occupations by Sex
Within the Management, Business, Science and Arts occupations in Parker, the most male-oriented occupations are Architecture & Engineering (84.1%), Computers & Mathematics (79.2%), and Computers, Engineering & Science (77.9%), while the most female-oriented occupations are Health Technologists (77.8%), Education Instruction & Library (75.0%), and Education, Arts & Media (73.7%).
| Occupation | Male | Female |
| Management | 3,184 (63.5%) | 1,828 (36.5%) |
| Business & Financial | 1,388 (54.6%) | 1,152 (45.4%) |
| Computers, Engineering & Science | 2,999 (77.9%) | 850 (22.1%) |
| Computers & Mathematics | 2,157 (79.2%) | 568 (20.8%) |
| Architecture & Engineering | 686 (84.1%) | 130 (15.9%) |
| Life, Physical & Social Science | 156 (50.6%) | 152 (49.3%) |
| Community & Social Service | 1,283 (34.2%) | 2,474 (65.8%) |
| Education, Arts & Media | 124 (26.3%) | 348 (73.7%) |
| Legal Services & Support | 176 (43.0%) | 233 (57.0%) |
| Education Instruction & Library | 454 (25.0%) | 1,361 (75.0%) |
| Arts, Media & Entertainment | 529 (49.9%) | 532 (50.1%) |
| Health Diagnosing & Treating | 474 (27.3%) | 1,263 (72.7%) |
| Health Technologists | 260 (22.2%) | 913 (77.8%) |
| Total (Category) | 9,328 (55.2%) | 7,567 (44.8%) |
| Total (Overall) | 18,029 (54.4%) | 15,127 (45.6%) |
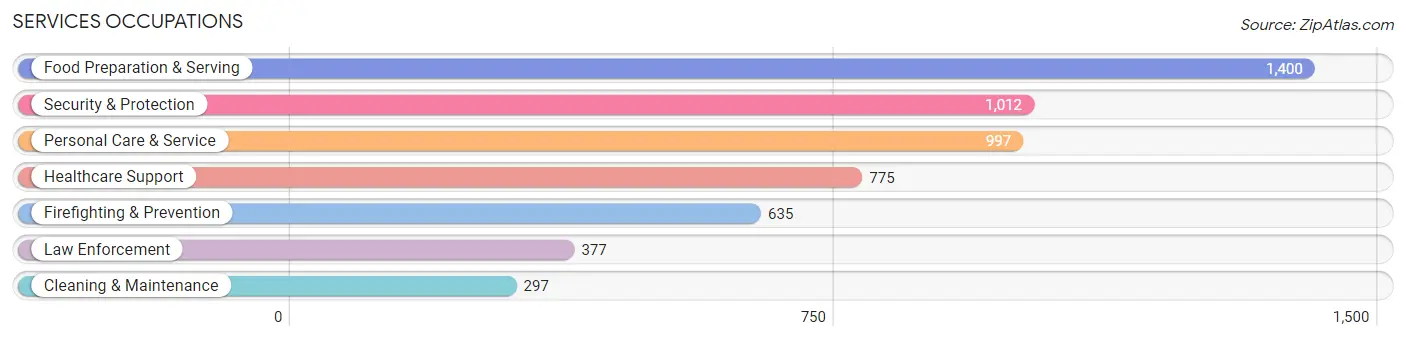
Services Occupations
The most common Services occupations in Parker are Food Preparation & Serving (1,400 | 4.2%), Security & Protection (1,012 | 3.0%), Personal Care & Service (997 | 3.0%), Healthcare Support (775 | 2.3%), and Firefighting & Prevention (635 | 1.9%).
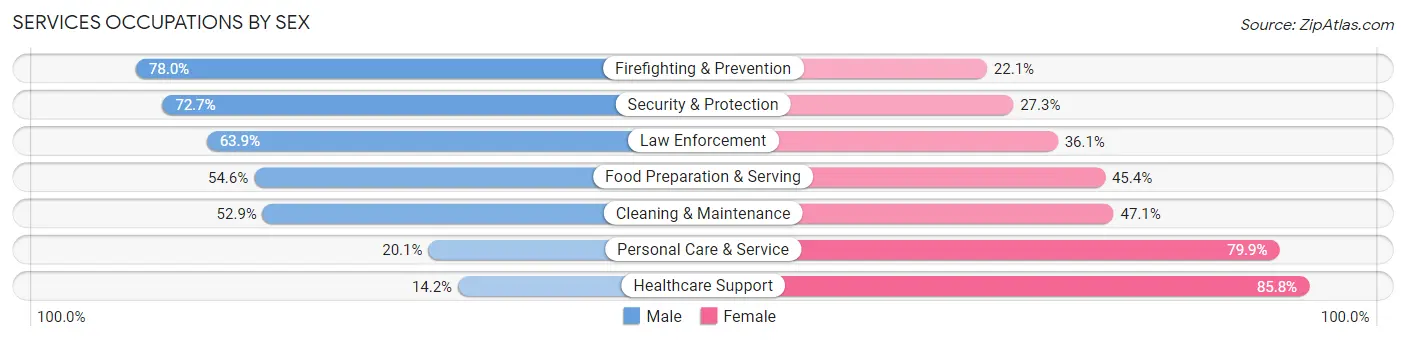
Services Occupations by Sex
Within the Services occupations in Parker, the most male-oriented occupations are Firefighting & Prevention (77.9%), Security & Protection (72.7%), and Law Enforcement (63.9%), while the most female-oriented occupations are Healthcare Support (85.8%), Personal Care & Service (79.9%), and Cleaning & Maintenance (47.1%).
| Occupation | Male | Female |
| Healthcare Support | 110 (14.2%) | 665 (85.8%) |
| Security & Protection | 736 (72.7%) | 276 (27.3%) |
| Firefighting & Prevention | 495 (77.9%) | 140 (22.1%) |
| Law Enforcement | 241 (63.9%) | 136 (36.1%) |
| Food Preparation & Serving | 764 (54.6%) | 636 (45.4%) |
| Cleaning & Maintenance | 157 (52.9%) | 140 (47.1%) |
| Personal Care & Service | 200 (20.1%) | 797 (79.9%) |
| Total (Category) | 1,967 (43.9%) | 2,514 (56.1%) |
| Total (Overall) | 18,029 (54.4%) | 15,127 (45.6%) |
Sales and Office Occupations
The most common Sales and Office occupations in Parker are Office & Administration (3,934 | 11.9%), and Sales & Related (3,599 | 10.8%).

Sales and Office Occupations by Sex
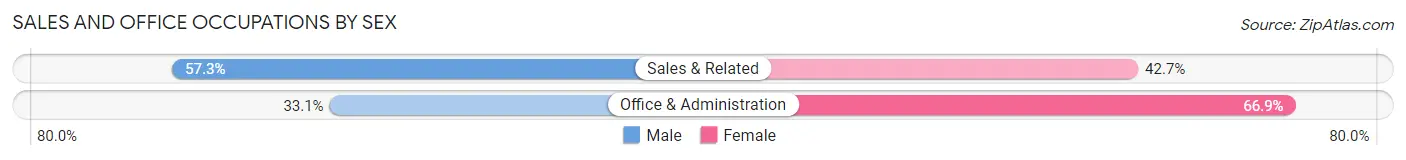
| Occupation | Male | Female |
| Sales & Related | 2,062 (57.3%) | 1,537 (42.7%) |
| Office & Administration | 1,302 (33.1%) | 2,632 (66.9%) |
| Total (Category) | 3,364 (44.7%) | 4,169 (55.3%) |
| Total (Overall) | 18,029 (54.4%) | 15,127 (45.6%) |
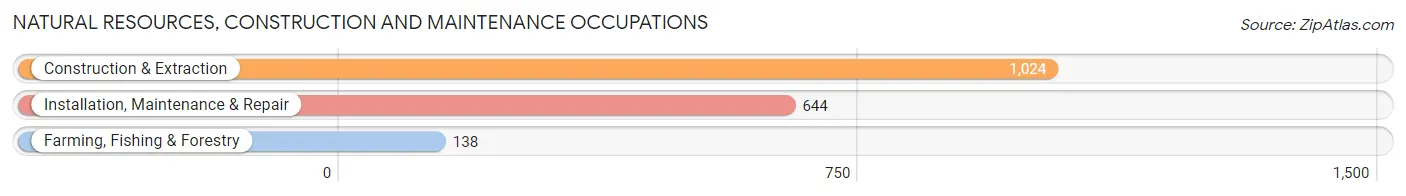
Natural Resources, Construction and Maintenance Occupations
The most common Natural Resources, Construction and Maintenance occupations in Parker are Construction & Extraction (1,024 | 3.1%), Installation, Maintenance & Repair (644 | 1.9%), and Farming, Fishing & Forestry (138 | 0.4%).
Natural Resources, Construction and Maintenance Occupations by Sex
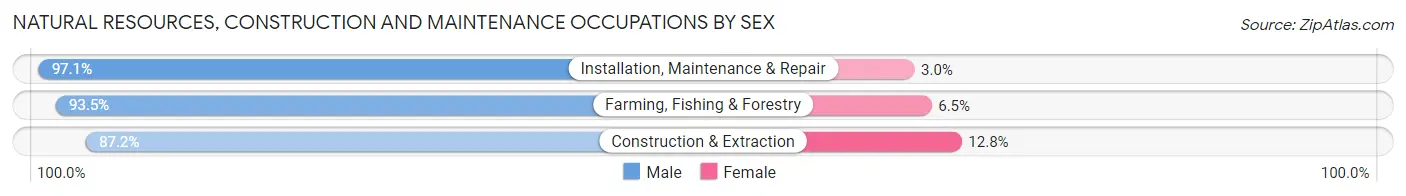
| Occupation | Male | Female |
| Farming, Fishing & Forestry | 129 (93.5%) | 9 (6.5%) |
| Construction & Extraction | 893 (87.2%) | 131 (12.8%) |
| Installation, Maintenance & Repair | 625 (97.1%) | 19 (2.9%) |
| Total (Category) | 1,647 (91.2%) | 159 (8.8%) |
| Total (Overall) | 18,029 (54.4%) | 15,127 (45.6%) |
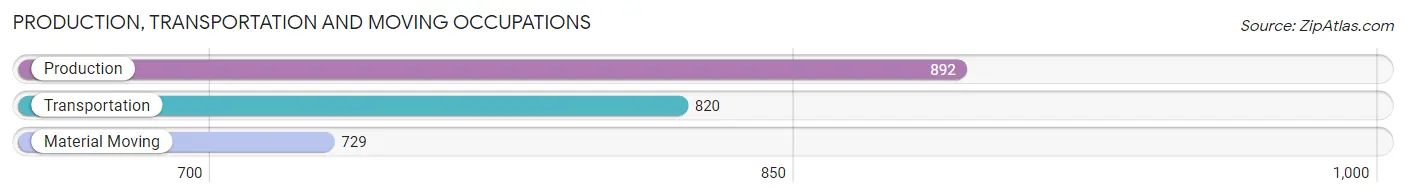
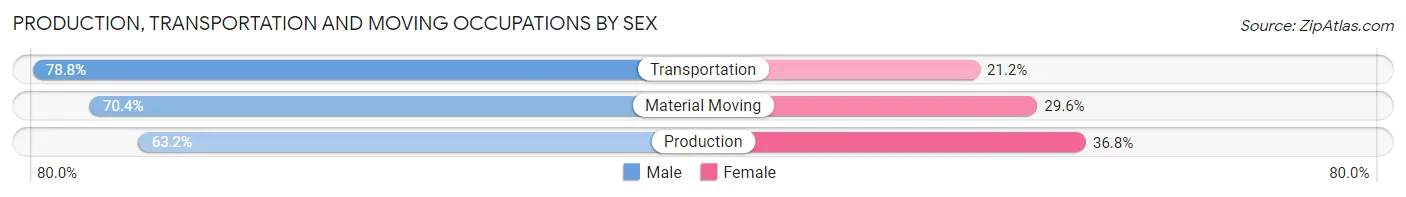
Production, Transportation and Moving Occupations
The most common Production, Transportation and Moving occupations in Parker are Production (892 | 2.7%), Transportation (820 | 2.5%), and Material Moving (729 | 2.2%).
Production, Transportation and Moving Occupations by Sex
| Occupation | Male | Female |
| Production | 564 (63.2%) | 328 (36.8%) |
| Transportation | 646 (78.8%) | 174 (21.2%) |
| Material Moving | 513 (70.4%) | 216 (29.6%) |
| Total (Category) | 1,723 (70.6%) | 718 (29.4%) |
| Total (Overall) | 18,029 (54.4%) | 15,127 (45.6%) |
Employment Industries by Sex in Parker
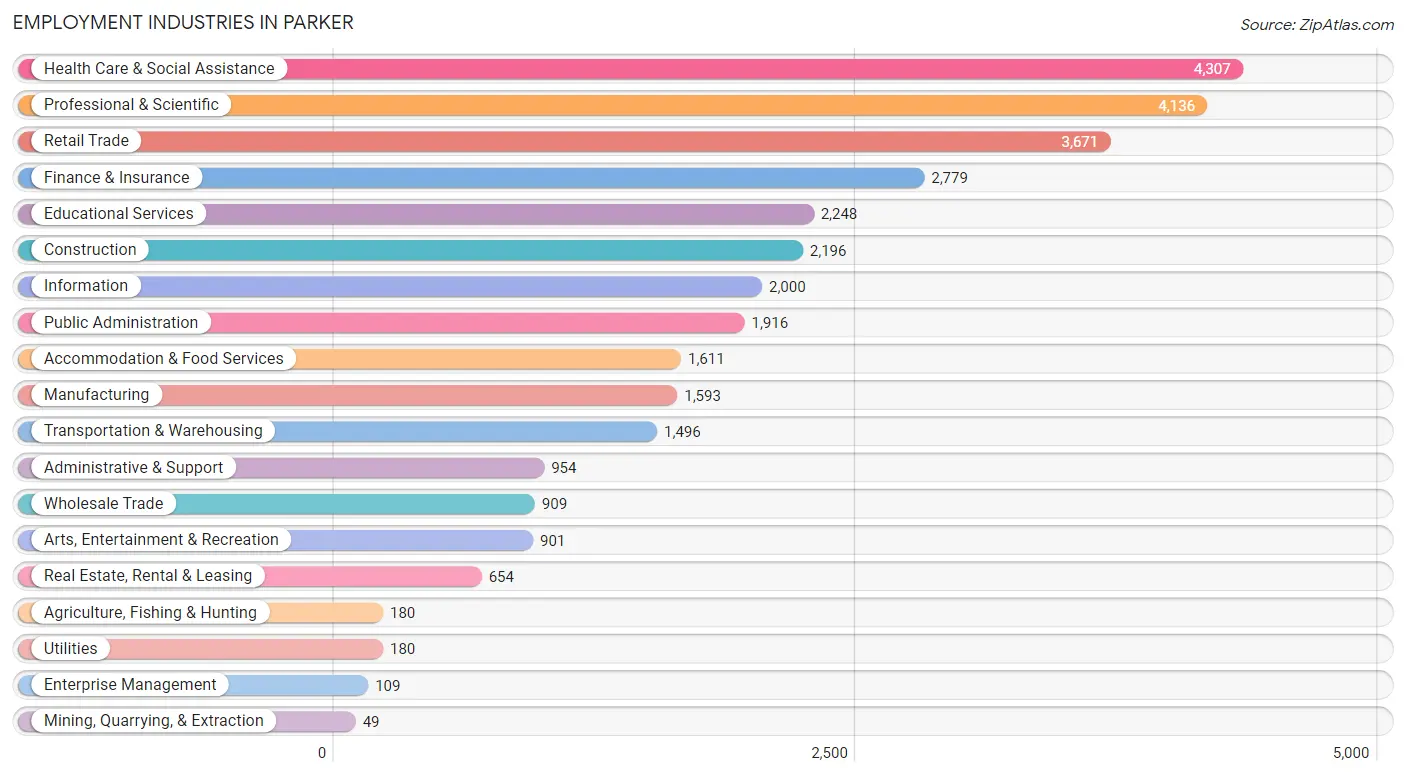
Employment Industries in Parker
The major employment industries in Parker include Health Care & Social Assistance (4,307 | 13.0%), Professional & Scientific (4,136 | 12.5%), Retail Trade (3,671 | 11.1%), Finance & Insurance (2,779 | 8.4%), and Educational Services (2,248 | 6.8%).
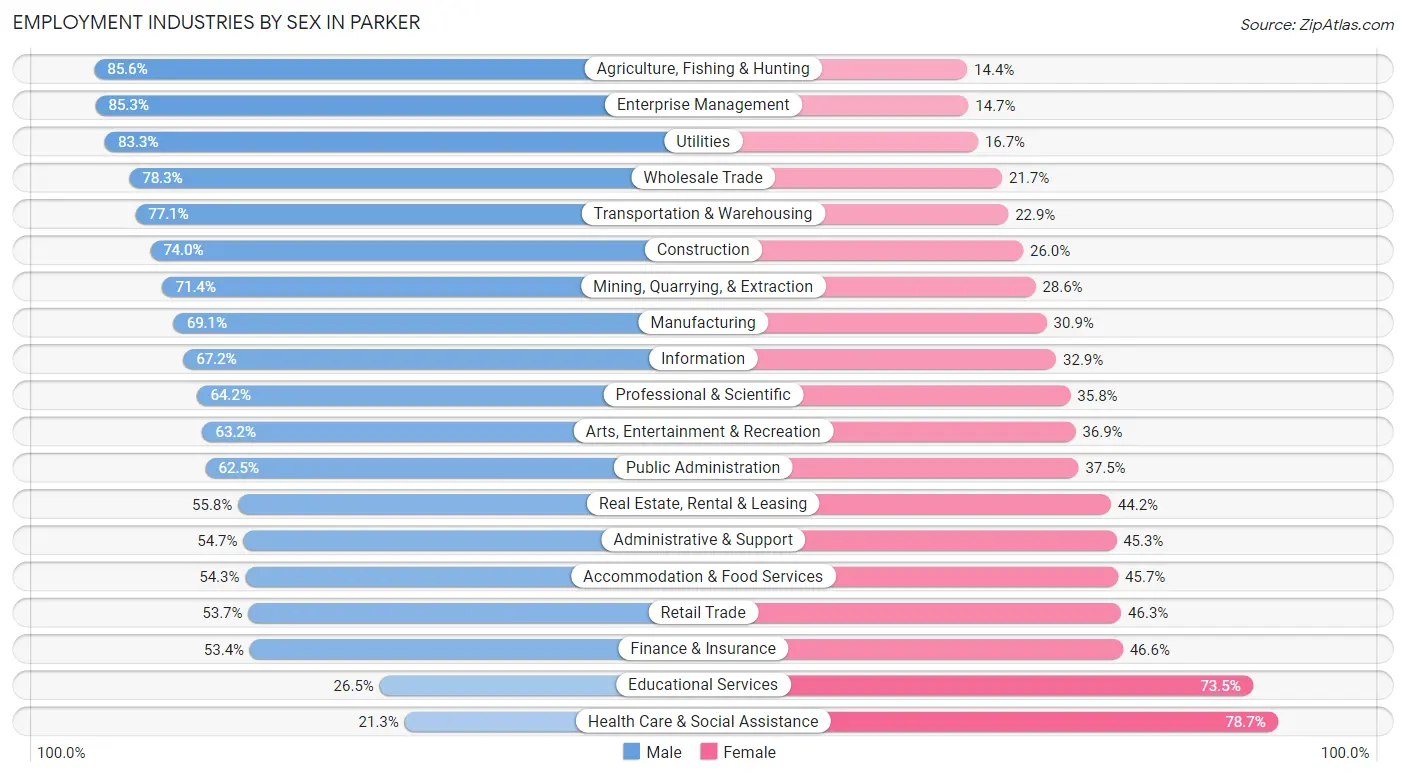
Employment Industries by Sex in Parker
The Parker industries that see more men than women are Agriculture, Fishing & Hunting (85.6%), Enterprise Management (85.3%), and Utilities (83.3%), whereas the industries that tend to have a higher number of women are Health Care & Social Assistance (78.7%), Educational Services (73.5%), and Finance & Insurance (46.6%).
| Industry | Male | Female |
| Agriculture, Fishing & Hunting | 154 (85.6%) | 26 (14.4%) |
| Mining, Quarrying, & Extraction | 35 (71.4%) | 14 (28.6%) |
| Construction | 1,625 (74.0%) | 571 (26.0%) |
| Manufacturing | 1,101 (69.1%) | 492 (30.9%) |
| Wholesale Trade | 712 (78.3%) | 197 (21.7%) |
| Retail Trade | 1,971 (53.7%) | 1,700 (46.3%) |
| Transportation & Warehousing | 1,153 (77.1%) | 343 (22.9%) |
| Utilities | 150 (83.3%) | 30 (16.7%) |
| Information | 1,343 (67.1%) | 657 (32.9%) |
| Finance & Insurance | 1,483 (53.4%) | 1,296 (46.6%) |
| Real Estate, Rental & Leasing | 365 (55.8%) | 289 (44.2%) |
| Professional & Scientific | 2,655 (64.2%) | 1,481 (35.8%) |
| Enterprise Management | 93 (85.3%) | 16 (14.7%) |
| Administrative & Support | 522 (54.7%) | 432 (45.3%) |
| Educational Services | 596 (26.5%) | 1,652 (73.5%) |
| Health Care & Social Assistance | 919 (21.3%) | 3,388 (78.7%) |
| Arts, Entertainment & Recreation | 569 (63.1%) | 332 (36.8%) |
| Accommodation & Food Services | 875 (54.3%) | 736 (45.7%) |
| Public Administration | 1,198 (62.5%) | 718 (37.5%) |
| Total | 18,029 (54.4%) | 15,127 (45.6%) |
Education in Parker
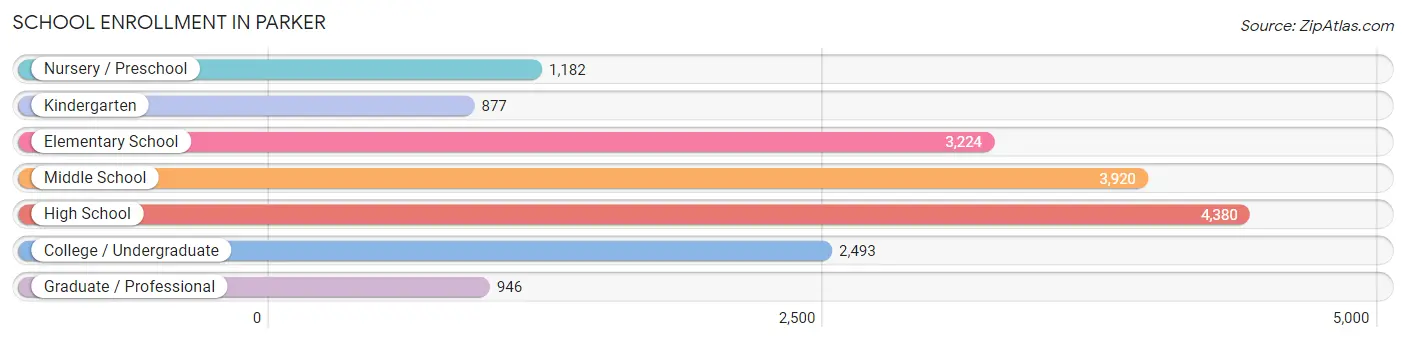
School Enrollment in Parker
The most common levels of schooling among the 17,022 students in Parker are high school (4,380 | 25.7%), middle school (3,920 | 23.0%), and elementary school (3,224 | 18.9%).
| School Level | # Students | % Students |
| Nursery / Preschool | 1,182 | 6.9% |
| Kindergarten | 877 | 5.1% |
| Elementary School | 3,224 | 18.9% |
| Middle School | 3,920 | 23.0% |
| High School | 4,380 | 25.7% |
| College / Undergraduate | 2,493 | 14.6% |
| Graduate / Professional | 946 | 5.6% |
| Total | 17,022 | 100.0% |
School Enrollment by Age by Funding Source in Parker
Out of a total of 17,022 students who are enrolled in schools in Parker, 2,724 (16.0%) attend a private institution, while the remaining 14,298 (84.0%) are enrolled in public schools. The age group of 3 to 4 year olds has the highest likelihood of being enrolled in private schools, with 356 (47.2% in the age bracket) enrolled. Conversely, the age group of 10 to 14 year olds has the lowest likelihood of being enrolled in a private school, with 4,501 (92.3% in the age bracket) attending a public institution.
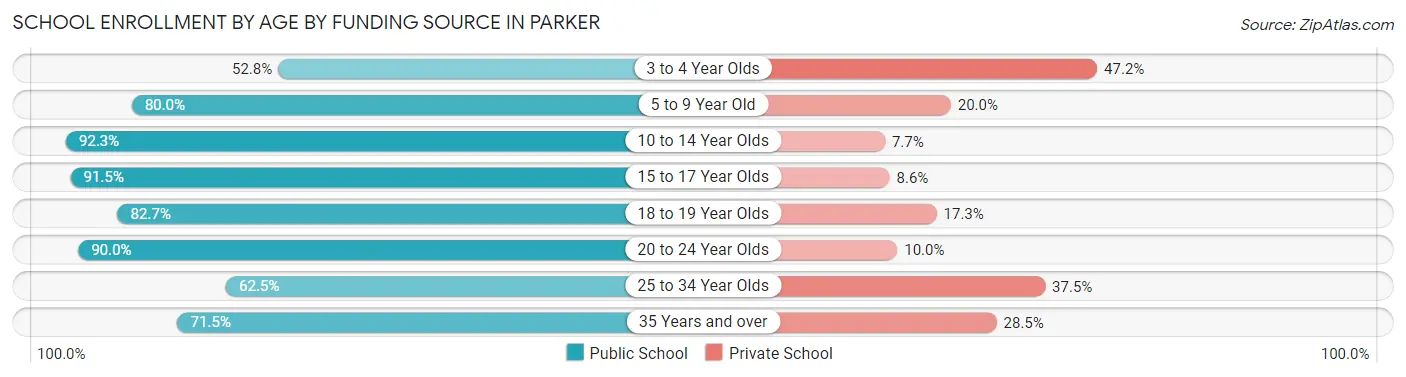
| Age Bracket | Public School | Private School |
| 3 to 4 Year Olds | 398 (52.8%) | 356 (47.2%) |
| 5 to 9 Year Old | 3,256 (80.0%) | 812 (20.0%) |
| 10 to 14 Year Olds | 4,501 (92.3%) | 375 (7.7%) |
| 15 to 17 Year Olds | 2,663 (91.4%) | 249 (8.6%) |
| 18 to 19 Year Olds | 1,170 (82.7%) | 245 (17.3%) |
| 20 to 24 Year Olds | 1,234 (90.0%) | 137 (10.0%) |
| 25 to 34 Year Olds | 586 (62.5%) | 352 (37.5%) |
| 35 Years and over | 492 (71.5%) | 196 (28.5%) |
| Total | 14,298 (84.0%) | 2,724 (16.0%) |
Educational Attainment by Field of Study in Parker
Business (5,233 | 24.3%), engineering (1,816 | 8.5%), bio, nature & agricultural (1,681 | 7.8%), education (1,623 | 7.5%), and social sciences (1,620 | 7.5%) are the most common fields of study among 21,487 individuals in Parker who have obtained a bachelor's degree or higher.
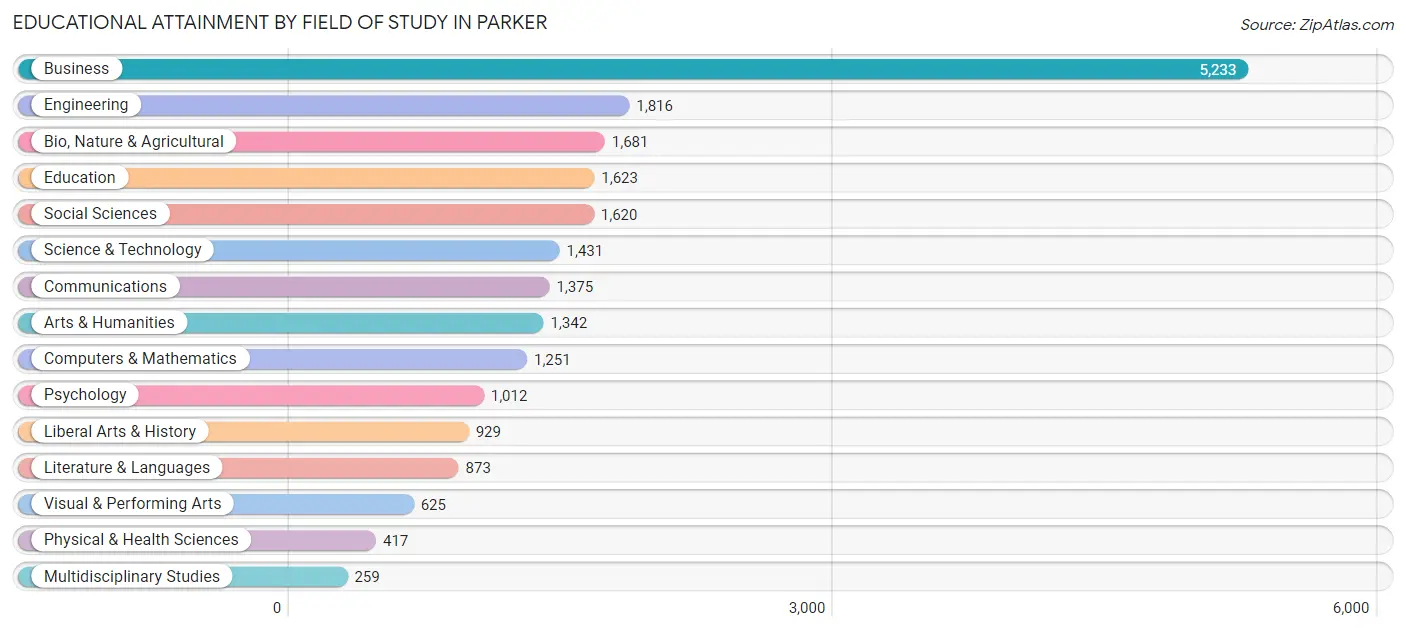
| Field of Study | # Graduates | % Graduates |
| Computers & Mathematics | 1,251 | 5.8% |
| Bio, Nature & Agricultural | 1,681 | 7.8% |
| Physical & Health Sciences | 417 | 1.9% |
| Psychology | 1,012 | 4.7% |
| Social Sciences | 1,620 | 7.5% |
| Engineering | 1,816 | 8.5% |
| Multidisciplinary Studies | 259 | 1.2% |
| Science & Technology | 1,431 | 6.7% |
| Business | 5,233 | 24.3% |
| Education | 1,623 | 7.5% |
| Literature & Languages | 873 | 4.1% |
| Liberal Arts & History | 929 | 4.3% |
| Visual & Performing Arts | 625 | 2.9% |
| Communications | 1,375 | 6.4% |
| Arts & Humanities | 1,342 | 6.2% |
| Total | 21,487 | 100.0% |
Transportation & Commute in Parker
Vehicle Availability by Sex in Parker
The most prevalent vehicle ownership categories in Parker are males with 2 vehicles (8,824, accounting for 49.5%) and females with 2 vehicles (7,121, making up 59.6%).
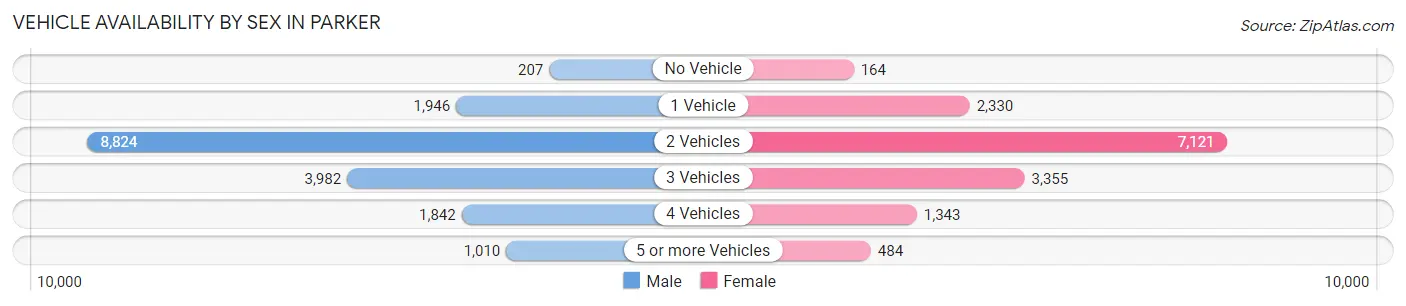
| Vehicles Available | Male | Female |
| No Vehicle | 207 (1.2%) | 164 (1.1%) |
| 1 Vehicle | 1,946 (10.9%) | 2,330 (15.8%) |
| 2 Vehicles | 8,824 (49.5%) | 7,121 (48.1%) |
| 3 Vehicles | 3,982 (22.4%) | 3,355 (22.7%) |
| 4 Vehicles | 1,842 (10.3%) | 1,343 (9.1%) |
| 5 or more Vehicles | 1,010 (5.7%) | 484 (3.3%) |
| Total | 17,811 (100.0%) | 14,797 (100.0%) |
Commute Time in Parker
The most frequently occuring commute durations in Parker are 20 to 24 minutes (4,077 commuters, 16.0%), 10 to 14 minutes (3,811 commuters, 15.0%), and 30 to 34 minutes (3,613 commuters, 14.2%).
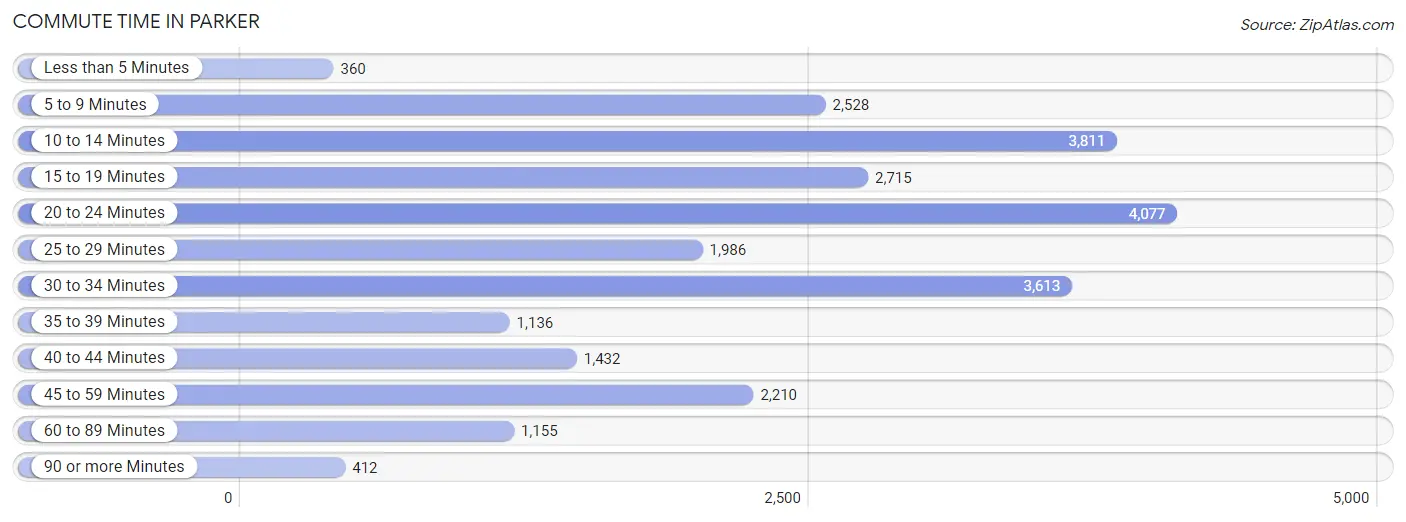
| Commute Time | # Commuters | % Commuters |
| Less than 5 Minutes | 360 | 1.4% |
| 5 to 9 Minutes | 2,528 | 9.9% |
| 10 to 14 Minutes | 3,811 | 15.0% |
| 15 to 19 Minutes | 2,715 | 10.7% |
| 20 to 24 Minutes | 4,077 | 16.0% |
| 25 to 29 Minutes | 1,986 | 7.8% |
| 30 to 34 Minutes | 3,613 | 14.2% |
| 35 to 39 Minutes | 1,136 | 4.5% |
| 40 to 44 Minutes | 1,432 | 5.6% |
| 45 to 59 Minutes | 2,210 | 8.7% |
| 60 to 89 Minutes | 1,155 | 4.5% |
| 90 or more Minutes | 412 | 1.6% |
Commute Time by Sex in Parker
The most common commute times in Parker are 20 to 24 minutes (2,406 commuters, 17.0%) for males and 10 to 14 minutes (2,075 commuters, 18.4%) for females.
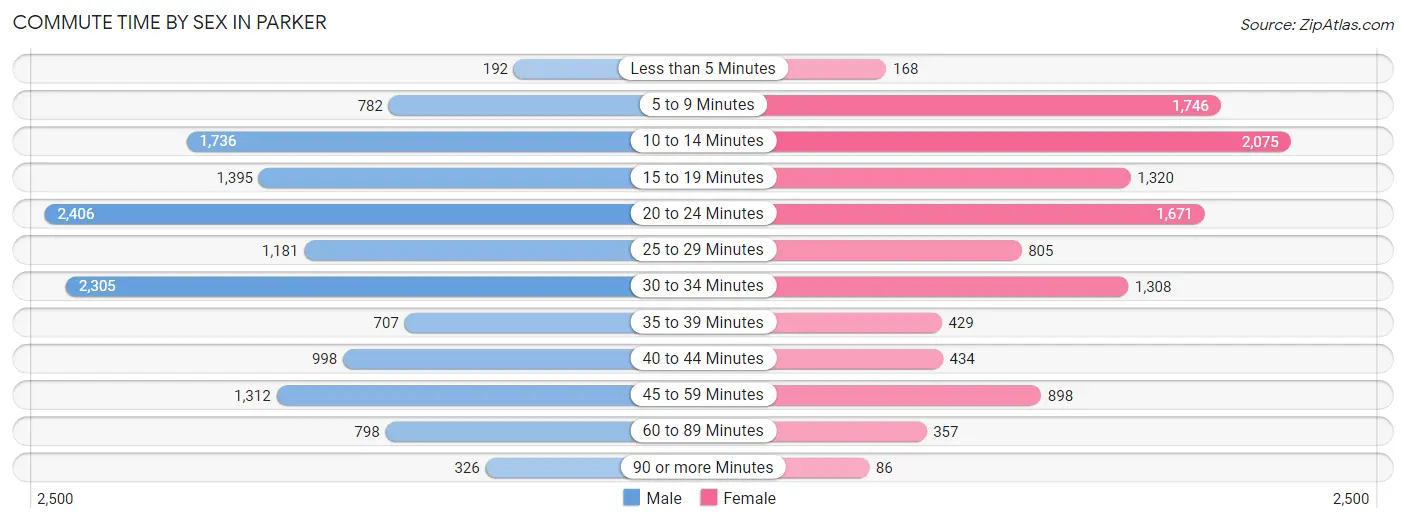
| Commute Time | Male | Female |
| Less than 5 Minutes | 192 (1.4%) | 168 (1.5%) |
| 5 to 9 Minutes | 782 (5.5%) | 1,746 (15.5%) |
| 10 to 14 Minutes | 1,736 (12.3%) | 2,075 (18.4%) |
| 15 to 19 Minutes | 1,395 (9.9%) | 1,320 (11.7%) |
| 20 to 24 Minutes | 2,406 (17.0%) | 1,671 (14.8%) |
| 25 to 29 Minutes | 1,181 (8.4%) | 805 (7.1%) |
| 30 to 34 Minutes | 2,305 (16.3%) | 1,308 (11.6%) |
| 35 to 39 Minutes | 707 (5.0%) | 429 (3.8%) |
| 40 to 44 Minutes | 998 (7.1%) | 434 (3.8%) |
| 45 to 59 Minutes | 1,312 (9.3%) | 898 (8.0%) |
| 60 to 89 Minutes | 798 (5.6%) | 357 (3.2%) |
| 90 or more Minutes | 326 (2.3%) | 86 (0.8%) |
Time of Departure to Work by Sex in Parker
The most frequent times of departure to work in Parker are 7:00 AM to 7:29 AM (2,571, 18.2%) for males and 7:00 AM to 7:29 AM (2,180, 19.3%) for females.
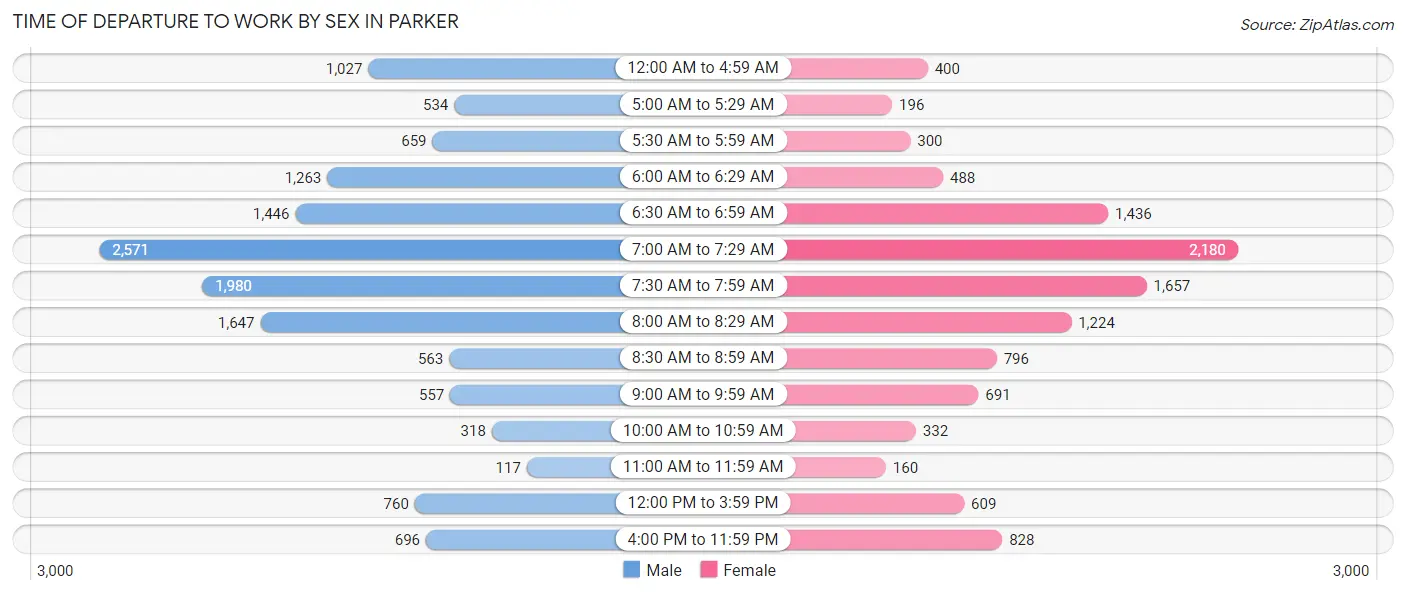
| Time of Departure | Male | Female |
| 12:00 AM to 4:59 AM | 1,027 (7.3%) | 400 (3.5%) |
| 5:00 AM to 5:29 AM | 534 (3.8%) | 196 (1.7%) |
| 5:30 AM to 5:59 AM | 659 (4.7%) | 300 (2.7%) |
| 6:00 AM to 6:29 AM | 1,263 (8.9%) | 488 (4.3%) |
| 6:30 AM to 6:59 AM | 1,446 (10.2%) | 1,436 (12.7%) |
| 7:00 AM to 7:29 AM | 2,571 (18.2%) | 2,180 (19.3%) |
| 7:30 AM to 7:59 AM | 1,980 (14.0%) | 1,657 (14.7%) |
| 8:00 AM to 8:29 AM | 1,647 (11.7%) | 1,224 (10.8%) |
| 8:30 AM to 8:59 AM | 563 (4.0%) | 796 (7.0%) |
| 9:00 AM to 9:59 AM | 557 (3.9%) | 691 (6.1%) |
| 10:00 AM to 10:59 AM | 318 (2.2%) | 332 (2.9%) |
| 11:00 AM to 11:59 AM | 117 (0.8%) | 160 (1.4%) |
| 12:00 PM to 3:59 PM | 760 (5.4%) | 609 (5.4%) |
| 4:00 PM to 11:59 PM | 696 (4.9%) | 828 (7.3%) |
| Total | 14,138 (100.0%) | 11,297 (100.0%) |
Housing Occupancy in Parker
Occupancy by Ownership in Parker
Of the total 20,645 dwellings in Parker, owner-occupied units account for 15,254 (73.9%), while renter-occupied units make up 5,391 (26.1%).
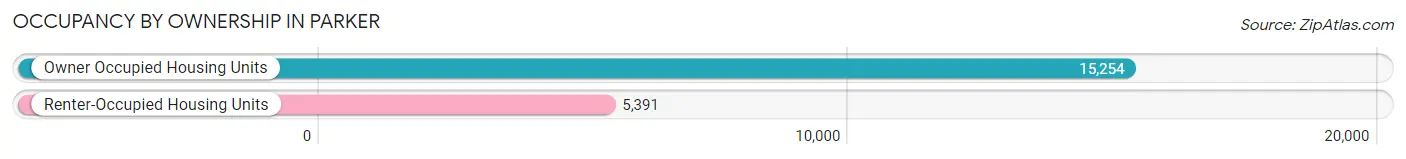
| Occupancy | # Housing Units | % Housing Units |
| Owner Occupied Housing Units | 15,254 | 73.9% |
| Renter-Occupied Housing Units | 5,391 | 26.1% |
| Total Occupied Housing Units | 20,645 | 100.0% |
Occupancy by Household Size in Parker
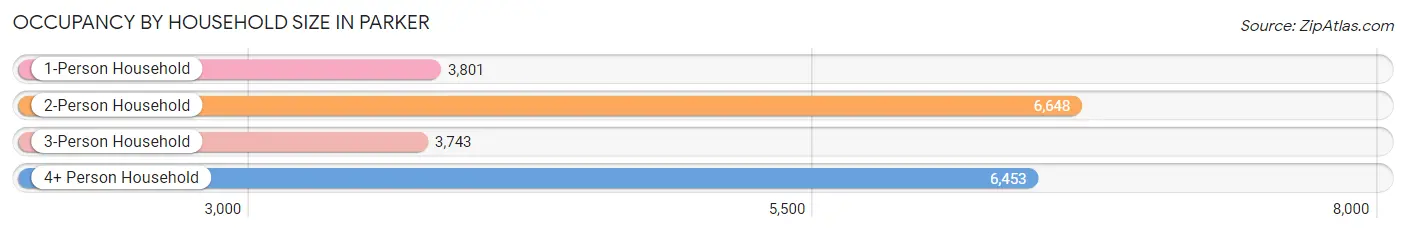
| Household Size | # Housing Units | % Housing Units |
| 1-Person Household | 3,801 | 18.4% |
| 2-Person Household | 6,648 | 32.2% |
| 3-Person Household | 3,743 | 18.1% |
| 4+ Person Household | 6,453 | 31.3% |
| Total Housing Units | 20,645 | 100.0% |
Occupancy by Ownership by Household Size in Parker
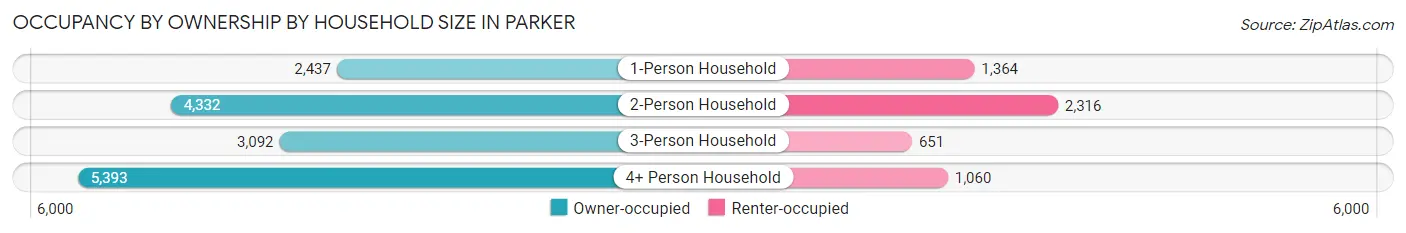
| Household Size | Owner-occupied | Renter-occupied |
| 1-Person Household | 2,437 (64.1%) | 1,364 (35.9%) |
| 2-Person Household | 4,332 (65.2%) | 2,316 (34.8%) |
| 3-Person Household | 3,092 (82.6%) | 651 (17.4%) |
| 4+ Person Household | 5,393 (83.6%) | 1,060 (16.4%) |
| Total Housing Units | 15,254 (73.9%) | 5,391 (26.1%) |
Occupancy by Educational Attainment in Parker
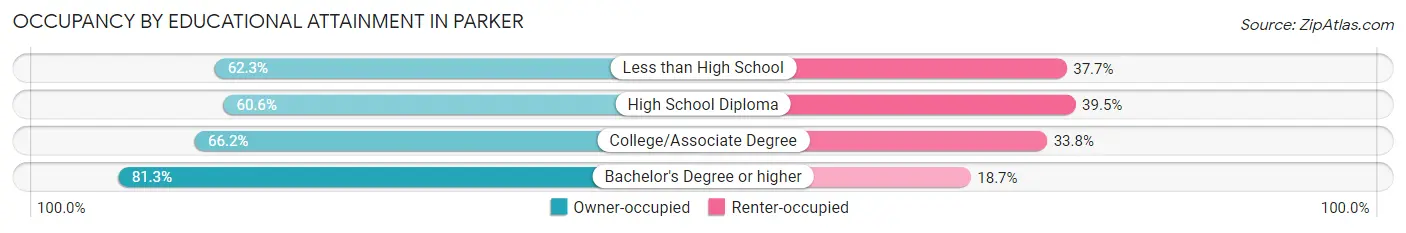
| Household Size | Owner-occupied | Renter-occupied |
| Less than High School | 276 (62.3%) | 167 (37.7%) |
| High School Diploma | 1,532 (60.6%) | 998 (39.5%) |
| College/Associate Degree | 4,045 (66.2%) | 2,067 (33.8%) |
| Bachelor's Degree or higher | 9,401 (81.3%) | 2,159 (18.7%) |
Occupancy by Age of Householder in Parker
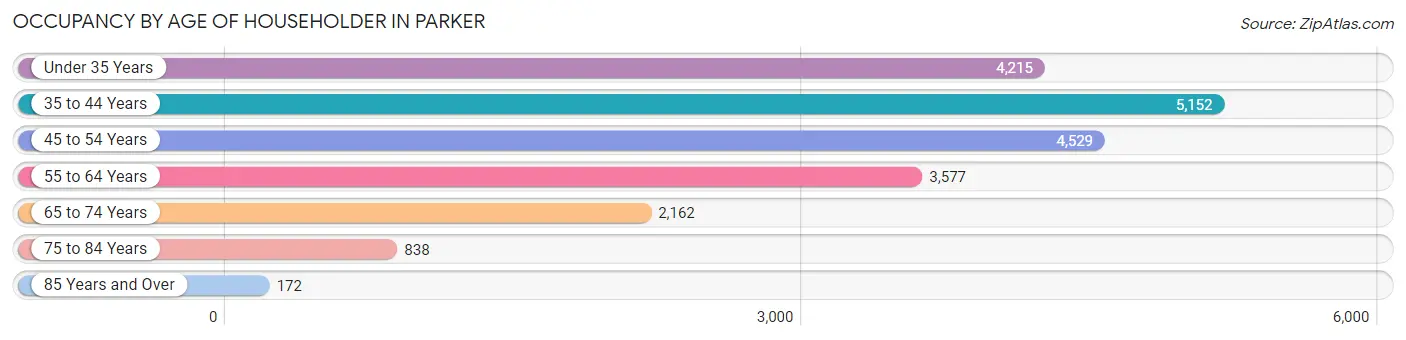
| Age Bracket | # Households | % Households |
| Under 35 Years | 4,215 | 20.4% |
| 35 to 44 Years | 5,152 | 25.0% |
| 45 to 54 Years | 4,529 | 21.9% |
| 55 to 64 Years | 3,577 | 17.3% |
| 65 to 74 Years | 2,162 | 10.5% |
| 75 to 84 Years | 838 | 4.1% |
| 85 Years and Over | 172 | 0.8% |
| Total | 20,645 | 100.0% |
Housing Finances in Parker
Median Income by Occupancy in Parker
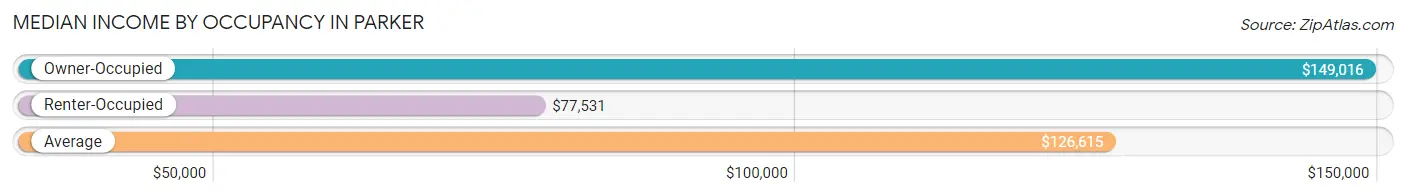
| Occupancy Type | # Households | Median Income |
| Owner-Occupied | 15,254 (73.9%) | $149,016 |
| Renter-Occupied | 5,391 (26.1%) | $77,531 |
| Average | 20,645 (100.0%) | $126,615 |
Occupancy by Householder Income Bracket in Parker
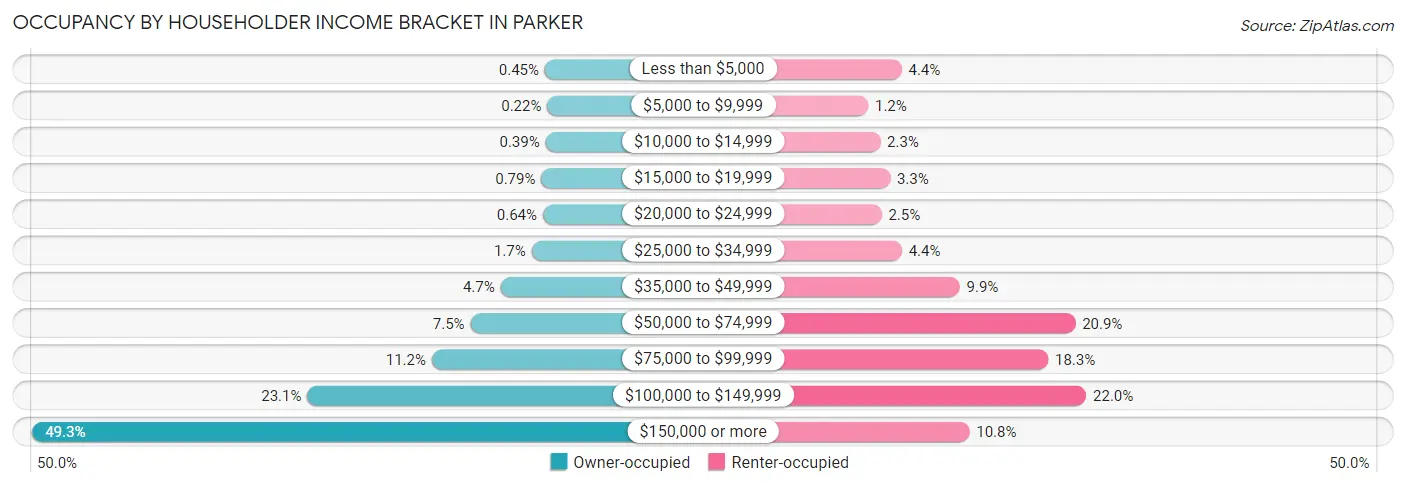
| Income Bracket | Owner-occupied | Renter-occupied |
| Less than $5,000 | 68 (0.4%) | 236 (4.4%) |
| $5,000 to $9,999 | 34 (0.2%) | 64 (1.2%) |
| $10,000 to $14,999 | 60 (0.4%) | 126 (2.3%) |
| $15,000 to $19,999 | 120 (0.8%) | 177 (3.3%) |
| $20,000 to $24,999 | 98 (0.6%) | 133 (2.5%) |
| $25,000 to $34,999 | 263 (1.7%) | 237 (4.4%) |
| $35,000 to $49,999 | 712 (4.7%) | 534 (9.9%) |
| $50,000 to $74,999 | 1,150 (7.5%) | 1,128 (20.9%) |
| $75,000 to $99,999 | 1,712 (11.2%) | 988 (18.3%) |
| $100,000 to $149,999 | 3,521 (23.1%) | 1,184 (22.0%) |
| $150,000 or more | 7,516 (49.3%) | 584 (10.8%) |
| Total | 15,254 (100.0%) | 5,391 (100.0%) |
Monthly Housing Cost Tiers in Parker
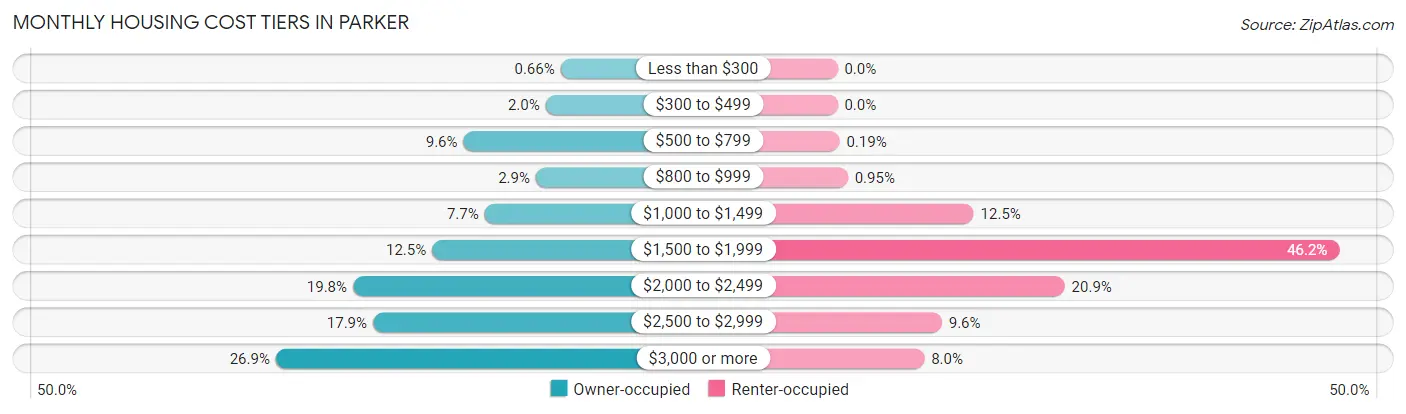
| Monthly Cost | Owner-occupied | Renter-occupied |
| Less than $300 | 101 (0.7%) | 0 (0.0%) |
| $300 to $499 | 311 (2.0%) | 0 (0.0%) |
| $500 to $799 | 1,466 (9.6%) | 10 (0.2%) |
| $800 to $999 | 449 (2.9%) | 51 (0.9%) |
| $1,000 to $1,499 | 1,168 (7.7%) | 676 (12.5%) |
| $1,500 to $1,999 | 1,905 (12.5%) | 2,490 (46.2%) |
| $2,000 to $2,499 | 3,017 (19.8%) | 1,128 (20.9%) |
| $2,500 to $2,999 | 2,736 (17.9%) | 518 (9.6%) |
| $3,000 or more | 4,101 (26.9%) | 431 (8.0%) |
| Total | 15,254 (100.0%) | 5,391 (100.0%) |
Physical Housing Characteristics in Parker
Housing Structures in Parker
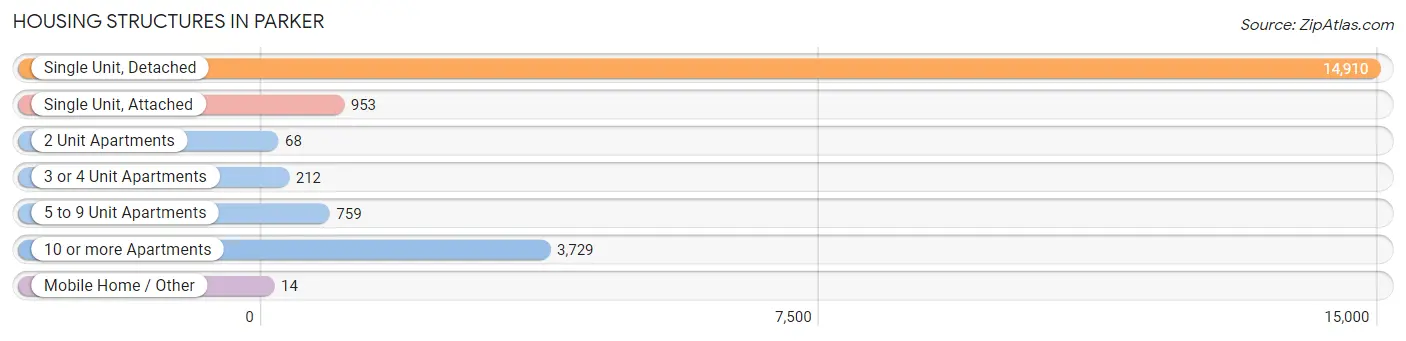
| Structure Type | # Housing Units | % Housing Units |
| Single Unit, Detached | 14,910 | 72.2% |
| Single Unit, Attached | 953 | 4.6% |
| 2 Unit Apartments | 68 | 0.3% |
| 3 or 4 Unit Apartments | 212 | 1.0% |
| 5 to 9 Unit Apartments | 759 | 3.7% |
| 10 or more Apartments | 3,729 | 18.1% |
| Mobile Home / Other | 14 | 0.1% |
| Total | 20,645 | 100.0% |
Housing Structures by Occupancy in Parker
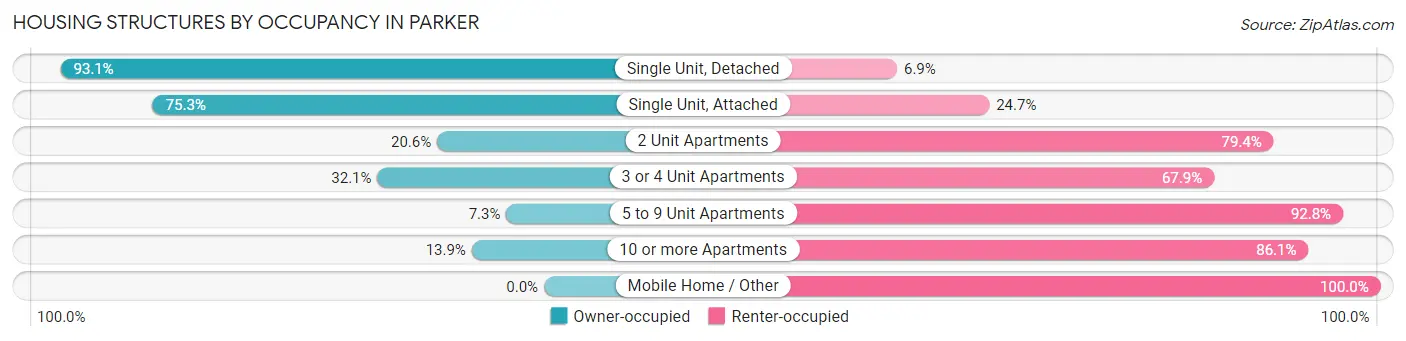
| Structure Type | Owner-occupied | Renter-occupied |
| Single Unit, Detached | 13,880 (93.1%) | 1,030 (6.9%) |
| Single Unit, Attached | 718 (75.3%) | 235 (24.7%) |
| 2 Unit Apartments | 14 (20.6%) | 54 (79.4%) |
| 3 or 4 Unit Apartments | 68 (32.1%) | 144 (67.9%) |
| 5 to 9 Unit Apartments | 55 (7.2%) | 704 (92.7%) |
| 10 or more Apartments | 519 (13.9%) | 3,210 (86.1%) |
| Mobile Home / Other | 0 (0.0%) | 14 (100.0%) |
| Total | 15,254 (73.9%) | 5,391 (26.1%) |
Housing Structures by Number of Rooms in Parker
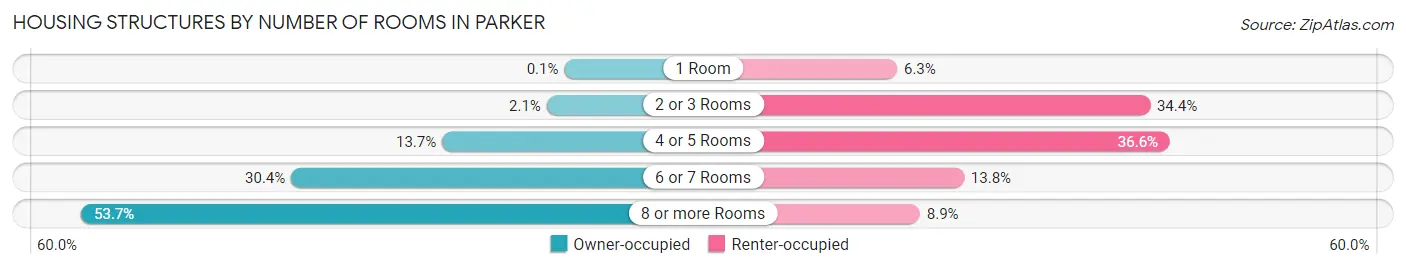
| Number of Rooms | Owner-occupied | Renter-occupied |
| 1 Room | 16 (0.1%) | 342 (6.3%) |
| 2 or 3 Rooms | 314 (2.1%) | 1,855 (34.4%) |
| 4 or 5 Rooms | 2,085 (13.7%) | 1,974 (36.6%) |
| 6 or 7 Rooms | 4,641 (30.4%) | 742 (13.8%) |
| 8 or more Rooms | 8,198 (53.7%) | 478 (8.9%) |
| Total | 15,254 (100.0%) | 5,391 (100.0%) |
Housing Structure by Heating Type in Parker
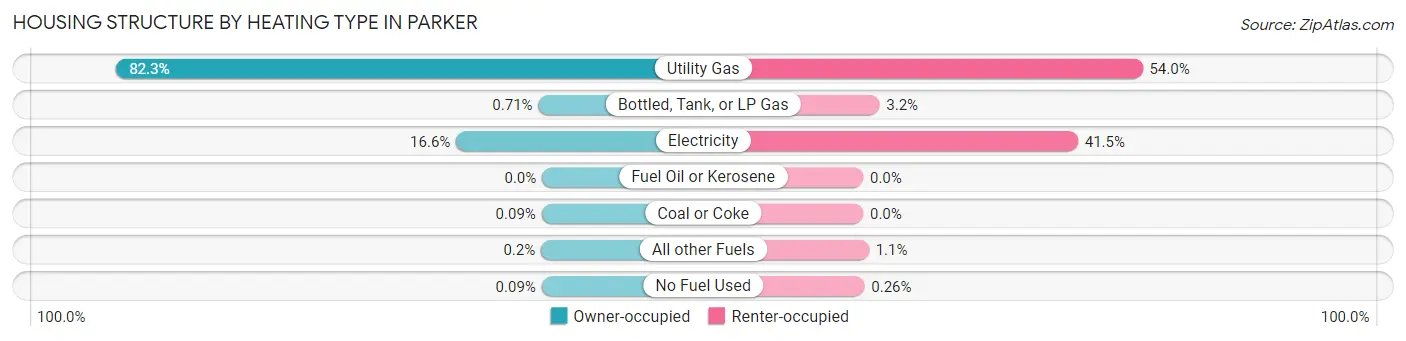
| Heating Type | Owner-occupied | Renter-occupied |
| Utility Gas | 12,553 (82.3%) | 2,911 (54.0%) |
| Bottled, Tank, or LP Gas | 109 (0.7%) | 170 (3.2%) |
| Electricity | 2,534 (16.6%) | 2,237 (41.5%) |
| Fuel Oil or Kerosene | 0 (0.0%) | 0 (0.0%) |
| Coal or Coke | 13 (0.1%) | 0 (0.0%) |
| All other Fuels | 31 (0.2%) | 59 (1.1%) |
| No Fuel Used | 14 (0.1%) | 14 (0.3%) |
| Total | 15,254 (100.0%) | 5,391 (100.0%) |
Household Vehicle Usage in Parker
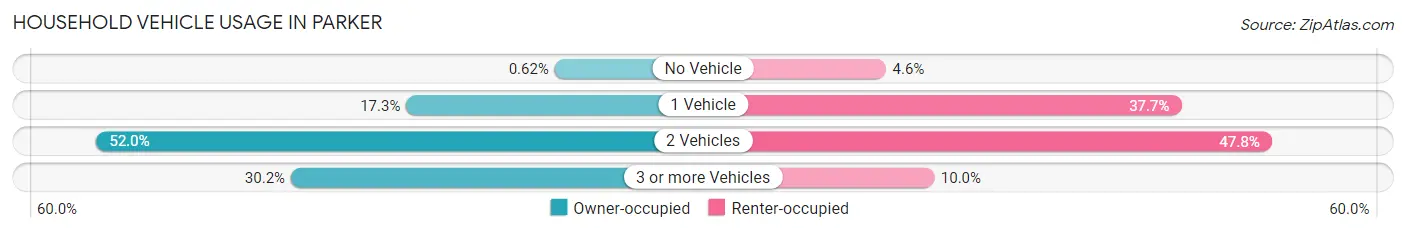
| Vehicles per Household | Owner-occupied | Renter-occupied |
| No Vehicle | 94 (0.6%) | 246 (4.6%) |
| 1 Vehicle | 2,632 (17.2%) | 2,031 (37.7%) |
| 2 Vehicles | 7,926 (52.0%) | 2,577 (47.8%) |
| 3 or more Vehicles | 4,602 (30.2%) | 537 (10.0%) |
| Total | 15,254 (100.0%) | 5,391 (100.0%) |
Real Estate & Mortgages in Parker
Real Estate and Mortgage Overview in Parker
| Characteristic | Without Mortgage | With Mortgage |
| Housing Units | 2,335 | 12,919 |
| Median Property Value | $534,800 | $579,100 |
| Median Household Income | $90,280 | $6,815 |
| Monthly Housing Costs | $682 | $4,101 |
| Real Estate Taxes | $2,808 | $147 |
Property Value by Mortgage Status in Parker
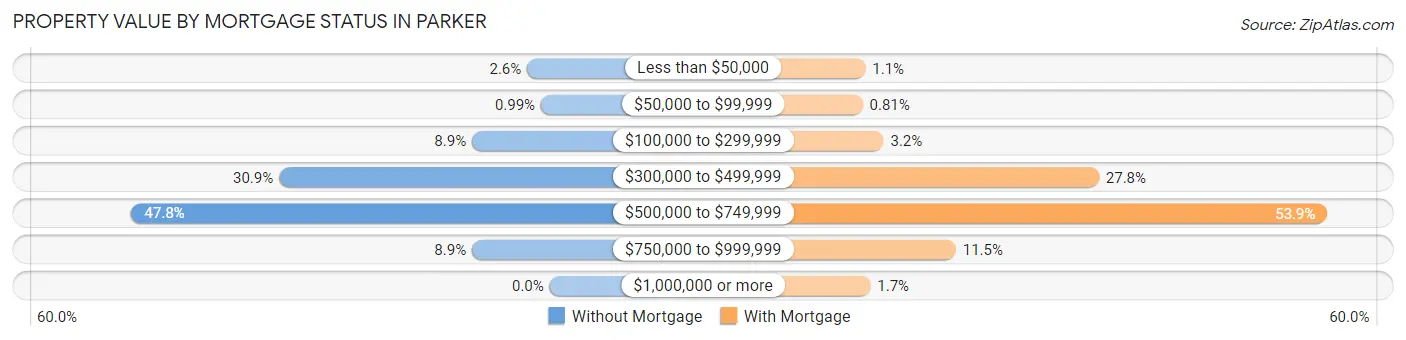
| Property Value | Without Mortgage | With Mortgage |
| Less than $50,000 | 60 (2.6%) | 145 (1.1%) |
| $50,000 to $99,999 | 23 (1.0%) | 105 (0.8%) |
| $100,000 to $299,999 | 207 (8.9%) | 413 (3.2%) |
| $300,000 to $499,999 | 722 (30.9%) | 3,593 (27.8%) |
| $500,000 to $749,999 | 1,116 (47.8%) | 6,965 (53.9%) |
| $750,000 to $999,999 | 207 (8.9%) | 1,480 (11.5%) |
| $1,000,000 or more | 0 (0.0%) | 218 (1.7%) |
| Total | 2,335 (100.0%) | 12,919 (100.0%) |
Household Income by Mortgage Status in Parker
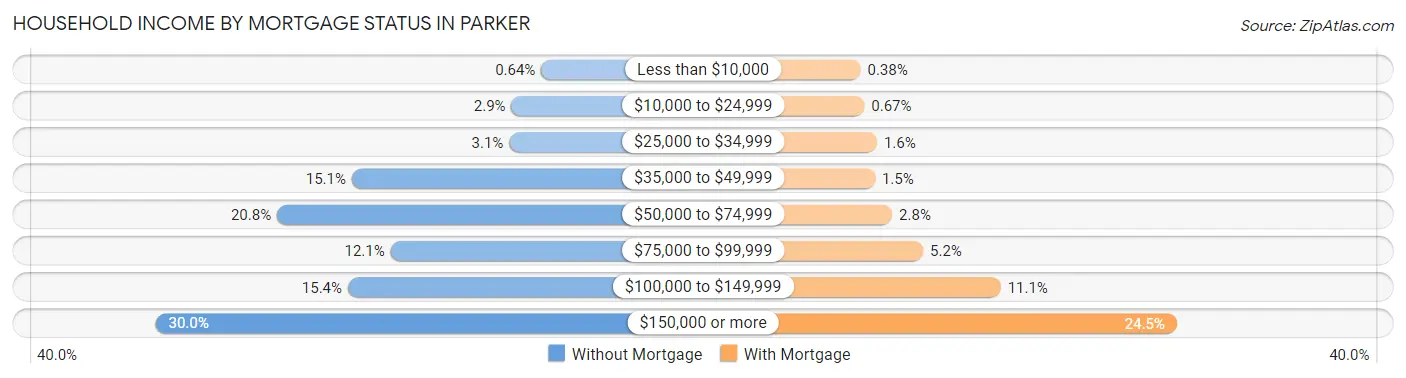
| Household Income | Without Mortgage | With Mortgage |
| Less than $10,000 | 15 (0.6%) | 49 (0.4%) |
| $10,000 to $24,999 | 68 (2.9%) | 87 (0.7%) |
| $25,000 to $34,999 | 72 (3.1%) | 210 (1.6%) |
| $35,000 to $49,999 | 352 (15.1%) | 191 (1.5%) |
| $50,000 to $74,999 | 485 (20.8%) | 360 (2.8%) |
| $75,000 to $99,999 | 283 (12.1%) | 665 (5.1%) |
| $100,000 to $149,999 | 359 (15.4%) | 1,429 (11.1%) |
| $150,000 or more | 701 (30.0%) | 3,162 (24.5%) |
| Total | 2,335 (100.0%) | 12,919 (100.0%) |
Property Value to Household Income Ratio in Parker
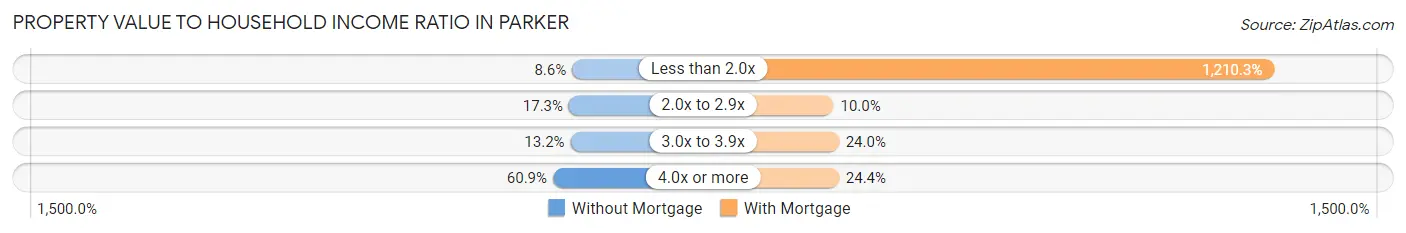
| Value-to-Income Ratio | Without Mortgage | With Mortgage |
| Less than 2.0x | 201 (8.6%) | 156,353 (1,210.3%) |
| 2.0x to 2.9x | 404 (17.3%) | 1,286 (10.0%) |
| 3.0x to 3.9x | 307 (13.2%) | 3,094 (23.9%) |
| 4.0x or more | 1,423 (60.9%) | 3,149 (24.4%) |
| Total | 2,335 (100.0%) | 12,919 (100.0%) |
Real Estate Taxes by Mortgage Status in Parker
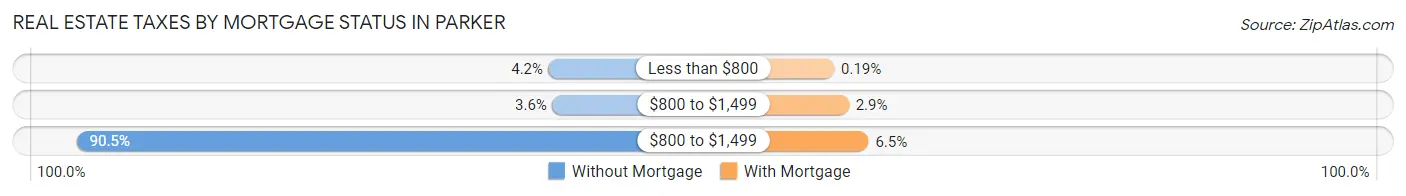
| Property Taxes | Without Mortgage | With Mortgage |
| Less than $800 | 99 (4.2%) | 24 (0.2%) |
| $800 to $1,499 | 83 (3.5%) | 369 (2.9%) |
| $800 to $1,499 | 2,113 (90.5%) | 836 (6.5%) |
| Total | 2,335 (100.0%) | 12,919 (100.0%) |
Health & Disability in Parker
Health Insurance Coverage by Age in Parker
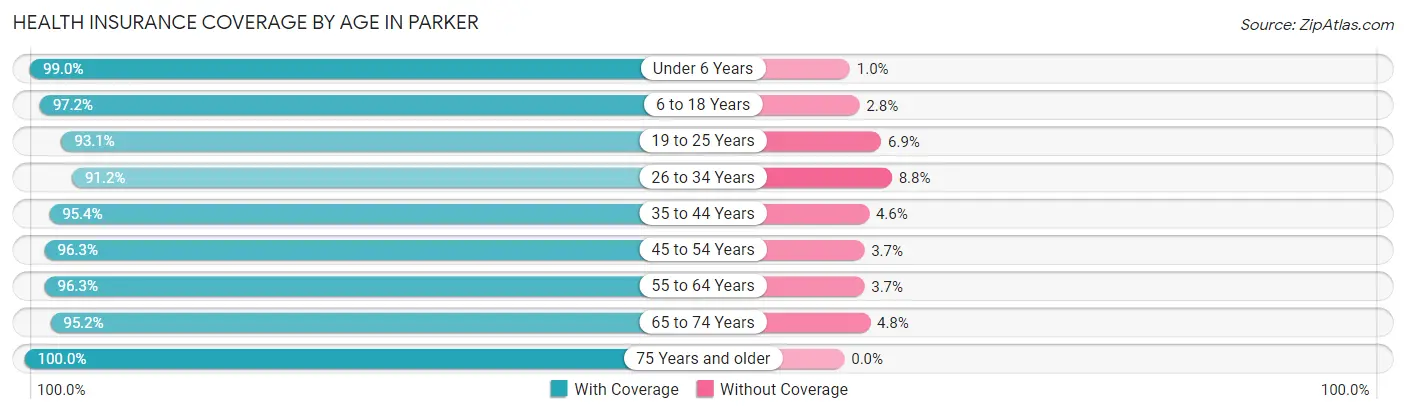
| Age Bracket | With Coverage | Without Coverage |
| Under 6 Years | 4,436 (99.0%) | 46 (1.0%) |
| 6 to 18 Years | 11,769 (97.2%) | 341 (2.8%) |
| 19 to 25 Years | 5,131 (93.1%) | 378 (6.9%) |
| 26 to 34 Years | 5,939 (91.2%) | 576 (8.8%) |
| 35 to 44 Years | 9,053 (95.4%) | 437 (4.6%) |
| 45 to 54 Years | 8,008 (96.3%) | 309 (3.7%) |
| 55 to 64 Years | 6,112 (96.3%) | 237 (3.7%) |
| 65 to 74 Years | 3,786 (95.2%) | 191 (4.8%) |
| 75 Years and older | 1,742 (100.0%) | 0 (0.0%) |
| Total | 55,976 (95.7%) | 2,515 (4.3%) |
Health Insurance Coverage by Citizenship Status in Parker
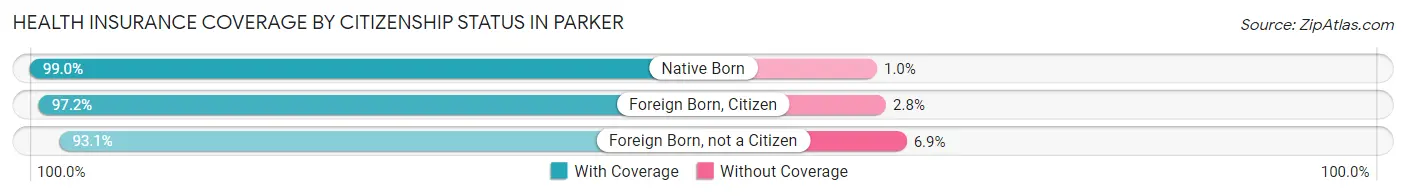
| Citizenship Status | With Coverage | Without Coverage |
| Native Born | 4,436 (99.0%) | 46 (1.0%) |
| Foreign Born, Citizen | 11,769 (97.2%) | 341 (2.8%) |
| Foreign Born, not a Citizen | 5,131 (93.1%) | 378 (6.9%) |
Health Insurance Coverage by Household Income in Parker
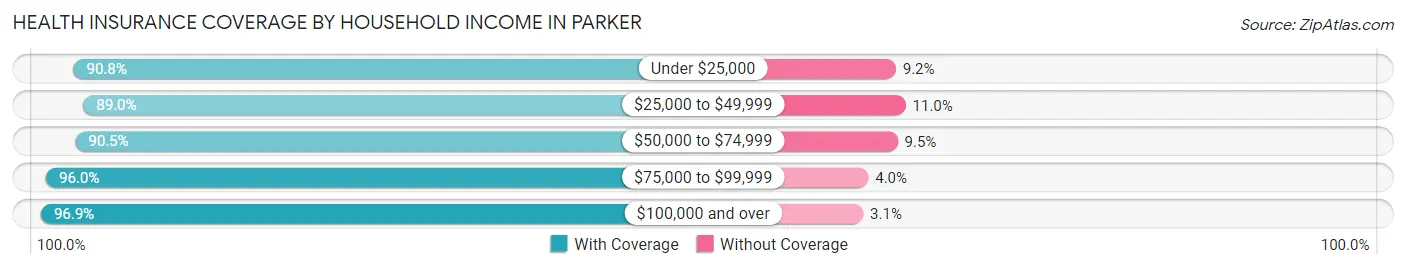
| Household Income | With Coverage | Without Coverage |
| Under $25,000 | 1,771 (90.8%) | 179 (9.2%) |
| $25,000 to $49,999 | 2,736 (89.0%) | 339 (11.0%) |
| $50,000 to $74,999 | 4,117 (90.5%) | 433 (9.5%) |
| $75,000 to $99,999 | 6,461 (96.0%) | 271 (4.0%) |
| $100,000 and over | 40,818 (96.9%) | 1,293 (3.1%) |
Public vs Private Health Insurance Coverage by Age in Parker
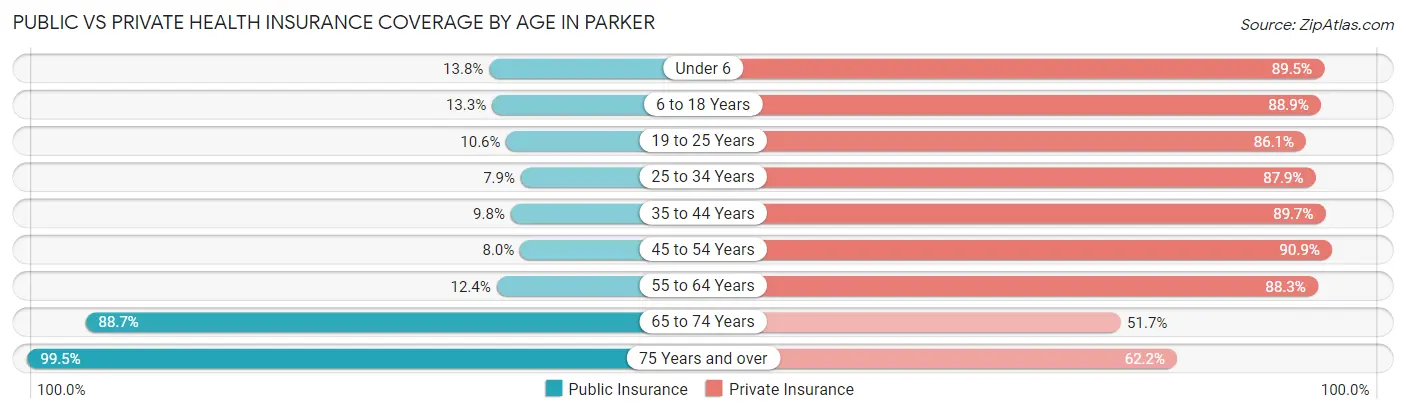
| Age Bracket | Public Insurance | Private Insurance |
| Under 6 | 617 (13.8%) | 4,010 (89.5%) |
| 6 to 18 Years | 1,605 (13.3%) | 10,760 (88.8%) |
| 19 to 25 Years | 583 (10.6%) | 4,745 (86.1%) |
| 25 to 34 Years | 515 (7.9%) | 5,726 (87.9%) |
| 35 to 44 Years | 927 (9.8%) | 8,516 (89.7%) |
| 45 to 54 Years | 668 (8.0%) | 7,562 (90.9%) |
| 55 to 64 Years | 787 (12.4%) | 5,607 (88.3%) |
| 65 to 74 Years | 3,528 (88.7%) | 2,055 (51.7%) |
| 75 Years and over | 1,733 (99.5%) | 1,083 (62.2%) |
| Total | 10,963 (18.7%) | 50,064 (85.6%) |
Disability Status by Sex by Age in Parker
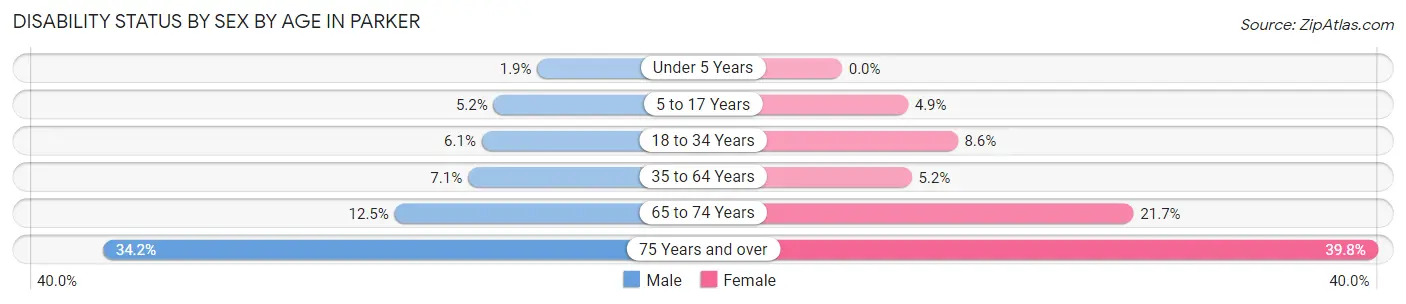
| Age Bracket | Male | Female |
| Under 5 Years | 28 (1.9%) | 0 (0.0%) |
| 5 to 17 Years | 332 (5.2%) | 277 (4.9%) |
| 18 to 34 Years | 402 (6.1%) | 553 (8.6%) |
| 35 to 64 Years | 856 (7.1%) | 624 (5.2%) |
| 65 to 74 Years | 232 (12.5%) | 460 (21.6%) |
| 75 Years and over | 214 (34.2%) | 444 (39.8%) |
Disability Class by Sex by Age in Parker
Disability Class: Hearing Difficulty
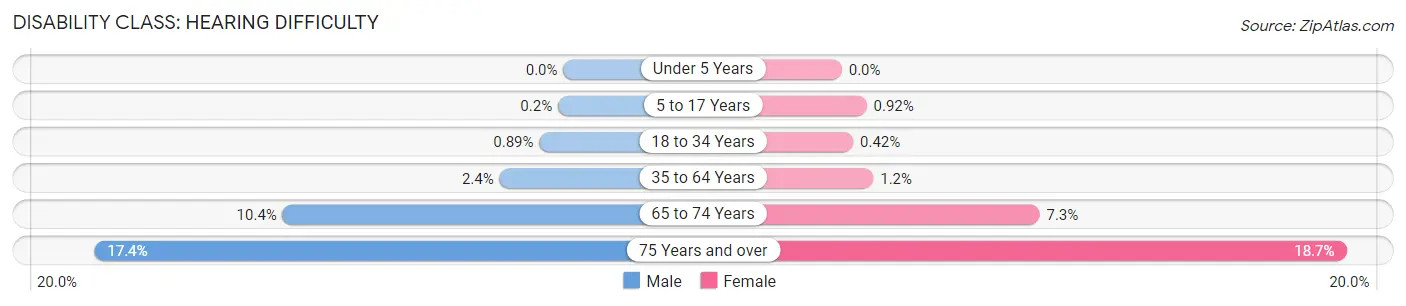
| Age Bracket | Male | Female |
| Under 5 Years | 0 (0.0%) | 0 (0.0%) |
| 5 to 17 Years | 13 (0.2%) | 52 (0.9%) |
| 18 to 34 Years | 59 (0.9%) | 27 (0.4%) |
| 35 to 64 Years | 286 (2.4%) | 141 (1.2%) |
| 65 to 74 Years | 193 (10.4%) | 156 (7.3%) |
| 75 Years and over | 109 (17.4%) | 209 (18.7%) |
Disability Class: Vision Difficulty
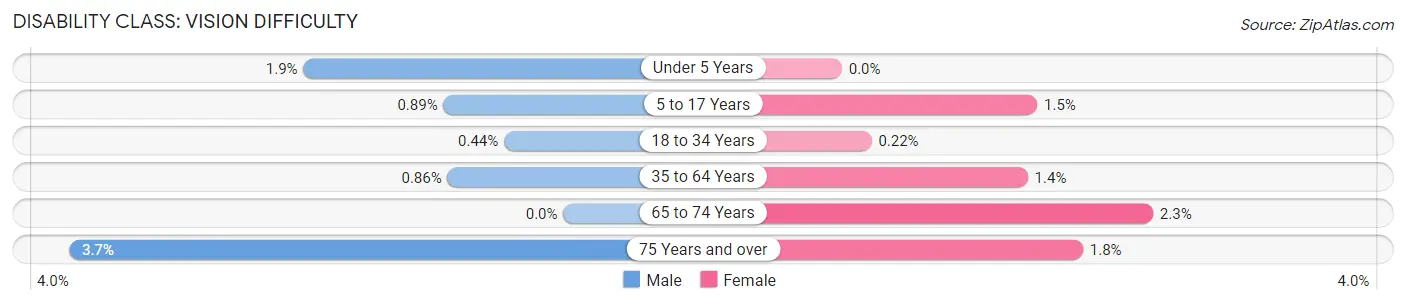
| Age Bracket | Male | Female |
| Under 5 Years | 28 (1.9%) | 0 (0.0%) |
| 5 to 17 Years | 57 (0.9%) | 82 (1.5%) |
| 18 to 34 Years | 29 (0.4%) | 14 (0.2%) |
| 35 to 64 Years | 104 (0.9%) | 166 (1.4%) |
| 65 to 74 Years | 0 (0.0%) | 49 (2.3%) |
| 75 Years and over | 23 (3.7%) | 20 (1.8%) |
Disability Class: Cognitive Difficulty
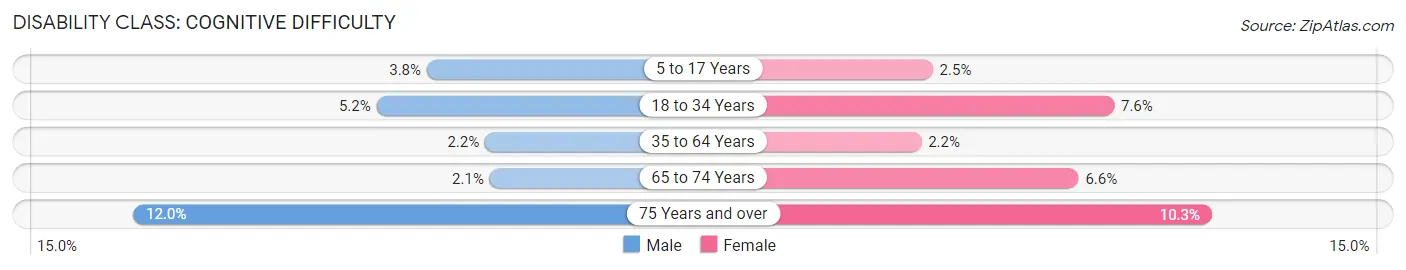
| Age Bracket | Male | Female |
| 5 to 17 Years | 244 (3.8%) | 143 (2.5%) |
| 18 to 34 Years | 345 (5.2%) | 488 (7.6%) |
| 35 to 64 Years | 263 (2.2%) | 267 (2.2%) |
| 65 to 74 Years | 38 (2.1%) | 140 (6.6%) |
| 75 Years and over | 75 (12.0%) | 115 (10.3%) |
Disability Class: Ambulatory Difficulty
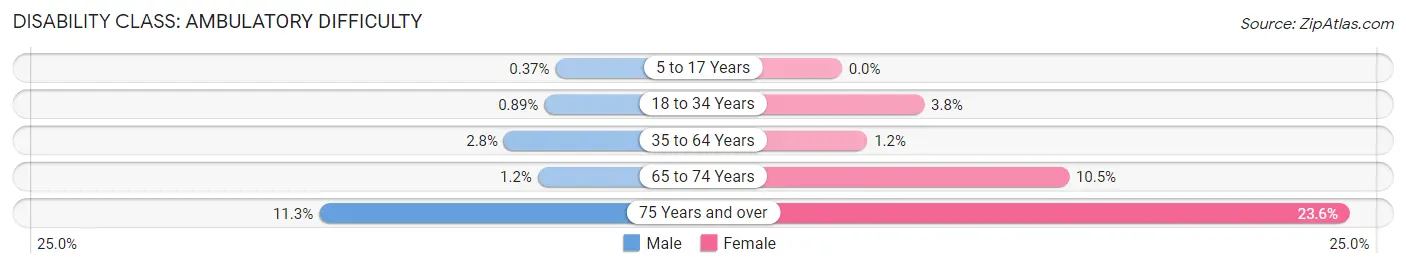
| Age Bracket | Male | Female |
| 5 to 17 Years | 24 (0.4%) | 0 (0.0%) |
| 18 to 34 Years | 59 (0.9%) | 246 (3.8%) |
| 35 to 64 Years | 333 (2.8%) | 143 (1.2%) |
| 65 to 74 Years | 22 (1.2%) | 224 (10.5%) |
| 75 Years and over | 71 (11.3%) | 263 (23.6%) |
Disability Class: Self-Care Difficulty
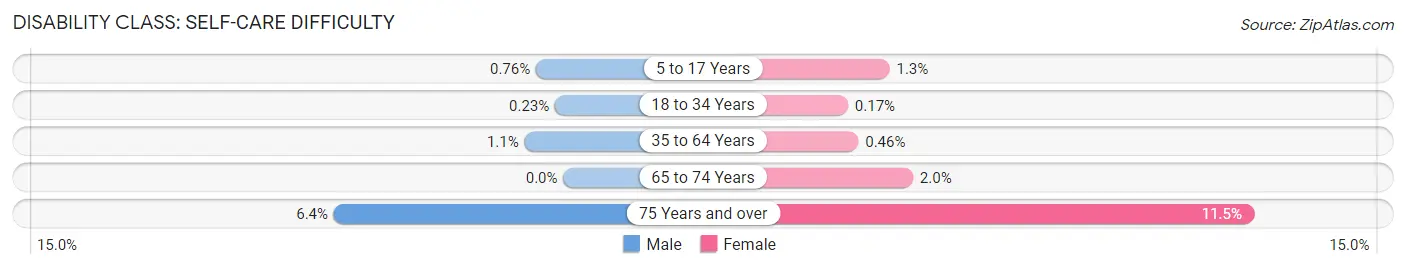
| Age Bracket | Male | Female |
| 5 to 17 Years | 49 (0.8%) | 75 (1.3%) |
| 18 to 34 Years | 15 (0.2%) | 11 (0.2%) |
| 35 to 64 Years | 130 (1.1%) | 55 (0.5%) |
| 65 to 74 Years | 0 (0.0%) | 42 (2.0%) |
| 75 Years and over | 40 (6.4%) | 128 (11.5%) |
Technology Access in Parker
Computing Device Access in Parker
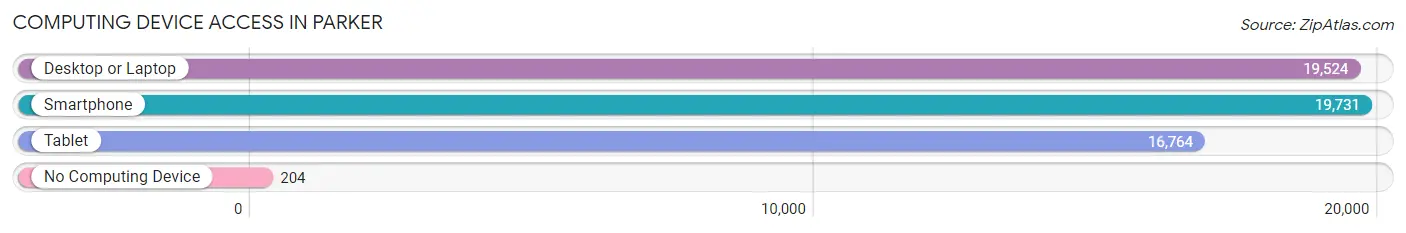
| Device Type | # Households | % Households |
| Desktop or Laptop | 19,524 | 94.6% |
| Smartphone | 19,731 | 95.6% |
| Tablet | 16,764 | 81.2% |
| No Computing Device | 204 | 1.0% |
| Total | 20,645 | 100.0% |
Internet Access in Parker
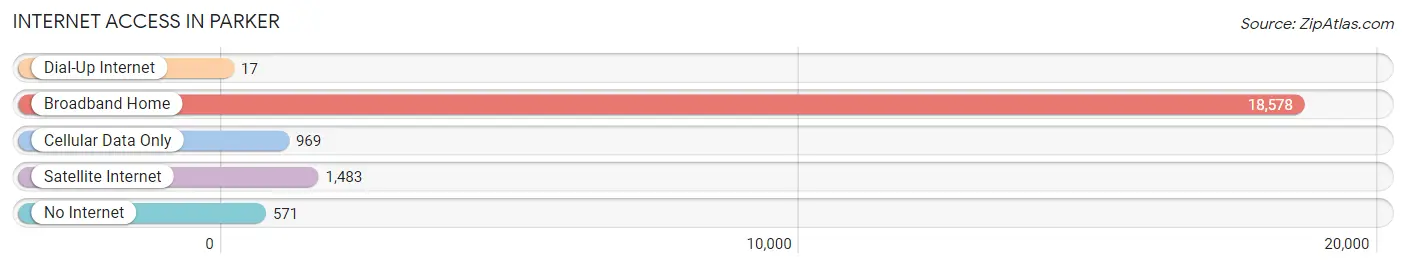
| Internet Type | # Households | % Households |
| Dial-Up Internet | 17 | 0.1% |
| Broadband Home | 18,578 | 90.0% |
| Cellular Data Only | 969 | 4.7% |
| Satellite Internet | 1,483 | 7.2% |
| No Internet | 571 | 2.8% |
| Total | 20,645 | 100.0% |
Parker Summary
Parker, Colorado is a town located in Douglas County, Colorado, United States. It is situated approximately 20 miles south of Denver and is part of the Denver-Aurora-Lakewood Metropolitan Statistical Area. The town was founded in 1864 and incorporated in 1981. As of the 2010 census, the population of Parker was 45,297.
History
Parker was founded in 1864 by John Parker, a veteran of the Civil War. He purchased the land from the U.S. government and established a homestead. The town was originally known as Parker’s Station, and was a stop on the Denver and Rio Grande Railroad. In 1881, the town was renamed Parker in honor of its founder.
In the late 19th century, Parker was a small agricultural community, with a population of just over 200 people. The town was primarily known for its dairy farms and orchards. In the early 20th century, Parker began to grow as a result of the Denver and Rio Grande Railroad. The railroad brought new businesses and people to the area, and the population of Parker began to increase.
In 1981, Parker was officially incorporated as a town. Since then, the town has continued to grow and develop. In the late 1990s, Parker began to experience a population boom, and the population has continued to grow since then.
Geography
Parker is located in Douglas County, Colorado, approximately 20 miles south of Denver. The town is situated at an elevation of 5,908 feet above sea level. The town covers an area of approximately 33.5 square miles, and is bordered by the towns of Castle Rock, Elizabeth, and Franktown.
The town is located in the foothills of the Rocky Mountains, and is surrounded by rolling hills and open plains. The town is located in the South Platte River Valley, and is home to several creeks and streams.
Economy
The economy of Parker is largely based on the service industry. The town is home to several large employers, including the Parker Adventist Hospital, the Parker Water and Sanitation District, and the Parker Fire Protection District. The town is also home to several retail stores, restaurants, and other businesses.
The town is also home to several technology companies, including the software company, Oracle. The town is also home to several manufacturing companies, including the Parker Aerospace Corporation.
Demographics
As of the 2010 census, the population of Parker was 45,297. The population is primarily white (87.3%), with smaller percentages of African American (3.2%), Asian (2.7%), and Hispanic or Latino (7.2%) residents. The median household income in Parker is $97,845, and the median home value is $400,000.
The town is home to several schools, including the Douglas County School District, the Parker Charter School, and the Colorado Christian University. The town is also home to several parks, including the Salisbury Equestrian Park, the Parker Recreation Center, and the Parker Arts, Culture, and Events Center.
Conclusion
Parker, Colorado is a town located in Douglas County, Colorado, United States. It is situated approximately 20 miles south of Denver and is part of the Denver-Aurora-Lakewood Metropolitan Statistical Area. The town was founded in 1864 and incorporated in 1981. As of the 2010 census, the population of Parker was 45,297. The economy of Parker is largely based on the service industry, and the town is home to several large employers, technology companies, and manufacturing companies. The population of Parker is primarily white, with smaller percentages of African American, Asian, and Hispanic or Latino residents. The town is home to several schools, parks, and other amenities.
Common Questions
What is Per Capita Income in Parker?
Per Capita income in Parker is $52,590.
What is the Median Family Income in Parker?
Median Family Income in Parker is $146,452.
What is the Median Household income in Parker?
Median Household Income in Parker is $126,615.
What is Income or Wage Gap in Parker?
Income or Wage Gap in Parker is 42.2%.
Women in Parker earn 57.8 cents for every dollar earned by a man.
What is Family Income Deficit in Parker?
Family Income Deficit in Parker is $8,169.
Families that are below poverty line in Parker earn $8,169 less on average than the poverty threshold level.
What is Inequality or Gini Index in Parker?
Inequality or Gini Index in Parker is 0.37.
What is the Total Population of Parker?
Total Population of Parker is 58,733.
What is the Total Male Population of Parker?
Total Male Population of Parker is 29,278.
What is the Total Female Population of Parker?
Total Female Population of Parker is 29,455.
What is the Ratio of Males per 100 Females in Parker?
There are 99.40 Males per 100 Females in Parker.
What is the Ratio of Females per 100 Males in Parker?
There are 100.60 Females per 100 Males in Parker.
What is the Median Population Age in Parker?
Median Population Age in Parker is 35.7 Years.
What is the Average Family Size in Parker
Average Family Size in Parker is 3.3 People.
What is the Average Household Size in Parker
Average Household Size in Parker is 2.8 People.
How Large is the Labor Force in Parker?
There are 34,487 People in the Labor Forcein in Parker.
What is the Percentage of People in the Labor Force in Parker?
76.5% of People are in the Labor Force in Parker.
What is the Unemployment Rate in Parker?
Unemployment Rate in Parker is 3.2%.