Mesa County, CO Map & Demographics
Mesa County Map
Mesa County Overview
$36,303
PER CAPITA INCOME
$83,034
AVG FAMILY INCOME
$68,077
AVG HOUSEHOLD INCOME
30.0%
WAGE / INCOME GAP [ % ]
70.0¢/ $1
WAGE / INCOME GAP [ $ ]
$10,791
FAMILY INCOME DEFICIT
0.44
INEQUALITY / GINI INDEX
156,131
TOTAL POPULATION
77,615
MALE POPULATION
78,516
FEMALE POPULATION
98.85
MALES / 100 FEMALES
101.16
FEMALES / 100 MALES
40.6
MEDIAN AGE
3.0
AVG FAMILY SIZE
2.4
AVG HOUSEHOLD SIZE
78,422
LABOR FORCE [ PEOPLE ]
61.6%
PERCENT IN LABOR FORCE
5.3%
UNEMPLOYMENT RATE
Mesa County Area Codes
Income in Mesa County
Income Overview in Mesa County
Per Capita Income in Mesa County is $36,303, while median incomes of families and households are $83,034 and $68,077 respectively.
| Characteristic | Number | Measure |
| Per Capita Income | 156,131 | $36,303 |
| Median Family Income | 39,871 | $83,034 |
| Mean Family Income | 39,871 | $104,242 |
| Median Household Income | 63,098 | $68,077 |
| Mean Household Income | 63,098 | $87,457 |
| Income Deficit | 39,871 | $10,791 |
| Wage / Income Gap (%) | 156,131 | 30.02% |
| Wage / Income Gap ($) | 156,131 | 69.98¢ per $1 |
| Gini / Inequality Index | 156,131 | 0.44 |
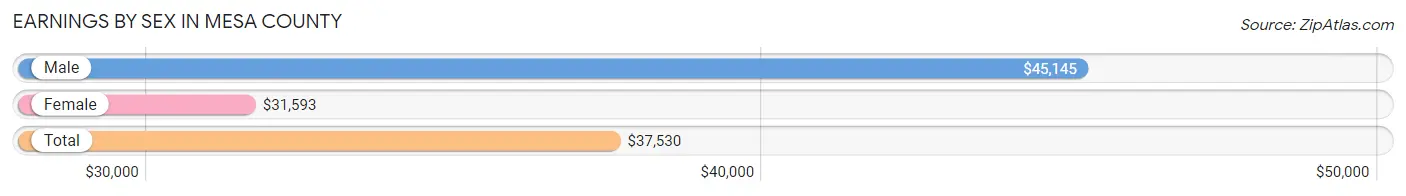
Earnings by Sex in Mesa County
Average Earnings in Mesa County are $37,530, $45,145 for men and $31,593 for women, a difference of 30.0%.
| Sex | Number | Average Earnings |
| Male | 44,008 (53.0%) | $45,145 |
| Female | 39,055 (47.0%) | $31,593 |
| Total | 83,063 (100.0%) | $37,530 |
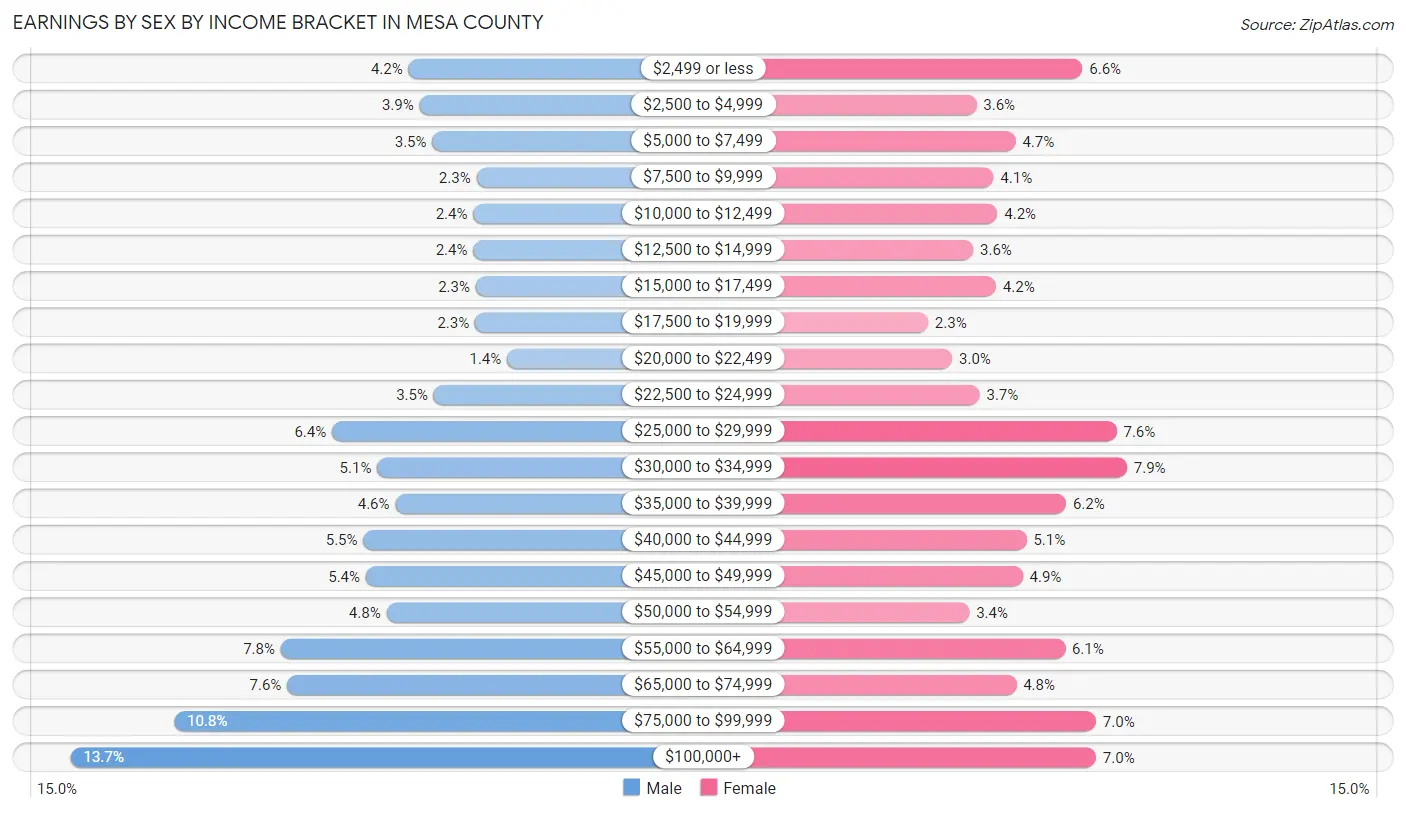
Earnings by Sex by Income Bracket in Mesa County
The most common earnings brackets in Mesa County are $100,000+ for men (6,035 | 13.7%) and $30,000 to $34,999 for women (3,075 | 7.9%).
| Income | Male | Female |
| $2,499 or less | 1,852 (4.2%) | 2,584 (6.6%) |
| $2,500 to $4,999 | 1,715 (3.9%) | 1,420 (3.6%) |
| $5,000 to $7,499 | 1,557 (3.5%) | 1,853 (4.7%) |
| $7,500 to $9,999 | 1,011 (2.3%) | 1,608 (4.1%) |
| $10,000 to $12,499 | 1,050 (2.4%) | 1,652 (4.2%) |
| $12,500 to $14,999 | 1,051 (2.4%) | 1,387 (3.5%) |
| $15,000 to $17,499 | 1,021 (2.3%) | 1,638 (4.2%) |
| $17,500 to $19,999 | 1,029 (2.3%) | 891 (2.3%) |
| $20,000 to $22,499 | 633 (1.4%) | 1,157 (3.0%) |
| $22,500 to $24,999 | 1,539 (3.5%) | 1,458 (3.7%) |
| $25,000 to $29,999 | 2,800 (6.4%) | 2,962 (7.6%) |
| $30,000 to $34,999 | 2,239 (5.1%) | 3,075 (7.9%) |
| $35,000 to $39,999 | 2,017 (4.6%) | 2,406 (6.2%) |
| $40,000 to $44,999 | 2,411 (5.5%) | 1,972 (5.1%) |
| $45,000 to $49,999 | 2,383 (5.4%) | 1,929 (4.9%) |
| $50,000 to $54,999 | 2,127 (4.8%) | 1,343 (3.4%) |
| $55,000 to $64,999 | 3,431 (7.8%) | 2,396 (6.1%) |
| $65,000 to $74,999 | 3,354 (7.6%) | 1,858 (4.8%) |
| $75,000 to $99,999 | 4,753 (10.8%) | 2,734 (7.0%) |
| $100,000+ | 6,035 (13.7%) | 2,732 (7.0%) |
| Total | 44,008 (100.0%) | 39,055 (100.0%) |
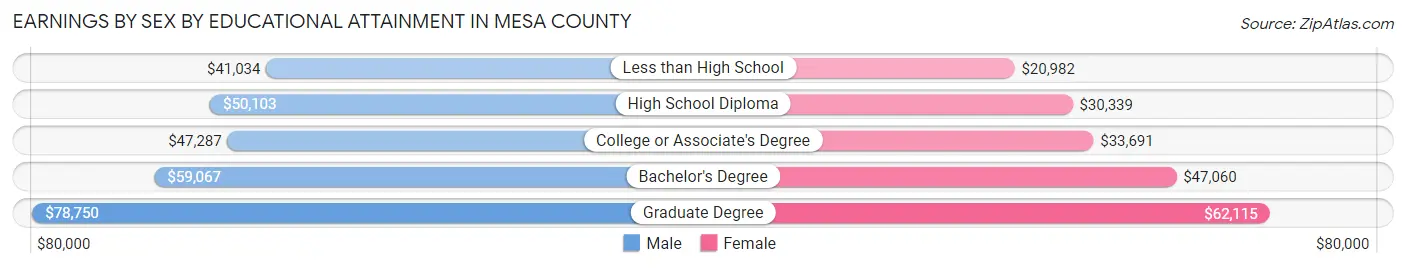
Earnings by Sex by Educational Attainment in Mesa County
Average earnings in Mesa County are $51,192 for men and $36,450 for women, a difference of 28.8%. Men with an educational attainment of graduate degree enjoy the highest average annual earnings of $78,750, while those with less than high school education earn the least with $41,034. Women with an educational attainment of graduate degree earn the most with the average annual earnings of $62,115, while those with less than high school education have the smallest earnings of $20,982.
| Educational Attainment | Male Income | Female Income |
| Less than High School | $41,034 | $20,982 |
| High School Diploma | $50,103 | $30,339 |
| College or Associate's Degree | $47,287 | $33,691 |
| Bachelor's Degree | $59,067 | $47,060 |
| Graduate Degree | $78,750 | $62,115 |
| Total | $51,192 | $36,450 |
Family Income in Mesa County
Family Income Brackets in Mesa County
According to the Mesa County family income data, there are 8,054 families falling into the $50,000 to $74,999 income range, which is the most common income bracket and makes up 20.2% of all families. Conversely, the $10,000 to $14,999 income bracket is the least frequent group with only 598 families (1.5%) belonging to this category.
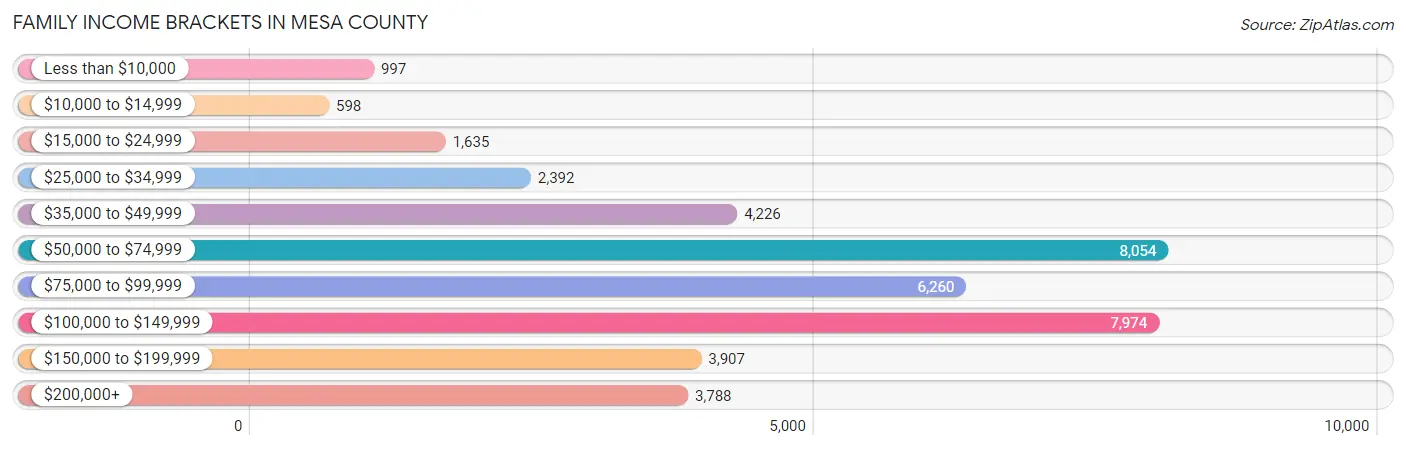
| Income Bracket | # Families | % Families |
| Less than $10,000 | 997 | 2.5% |
| $10,000 to $14,999 | 598 | 1.5% |
| $15,000 to $24,999 | 1,635 | 4.1% |
| $25,000 to $34,999 | 2,392 | 6.0% |
| $35,000 to $49,999 | 4,226 | 10.6% |
| $50,000 to $74,999 | 8,054 | 20.2% |
| $75,000 to $99,999 | 6,260 | 15.7% |
| $100,000 to $149,999 | 7,974 | 20.0% |
| $150,000 to $199,999 | 3,907 | 9.8% |
| $200,000+ | 3,788 | 9.5% |
Family Income by Famaliy Size in Mesa County
7+ person families (658 | 1.7%) account for the highest median family income in Mesa County with $112,560 per family, while 2-person families (21,438 | 53.8%) have the highest median income of $38,382 per family member.
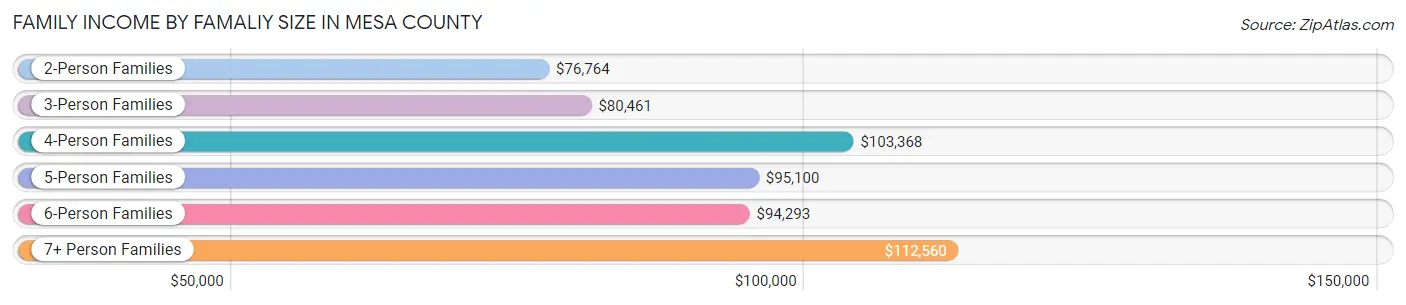
| Income Bracket | # Families | Median Income |
| 2-Person Families | 21,438 (53.8%) | $76,764 |
| 3-Person Families | 7,737 (19.4%) | $80,461 |
| 4-Person Families | 6,023 (15.1%) | $103,368 |
| 5-Person Families | 3,034 (7.6%) | $95,100 |
| 6-Person Families | 981 (2.5%) | $94,293 |
| 7+ Person Families | 658 (1.7%) | $112,560 |
| Total | 39,871 (100.0%) | $83,034 |
Family Income by Number of Earners in Mesa County
The median family income in Mesa County is $83,034, with families comprising 3+ earners (4,164) having the highest median family income of $131,714, while families with no earners (6,148) have the lowest median family income of $52,967, accounting for 10.4% and 15.4% of families, respectively.
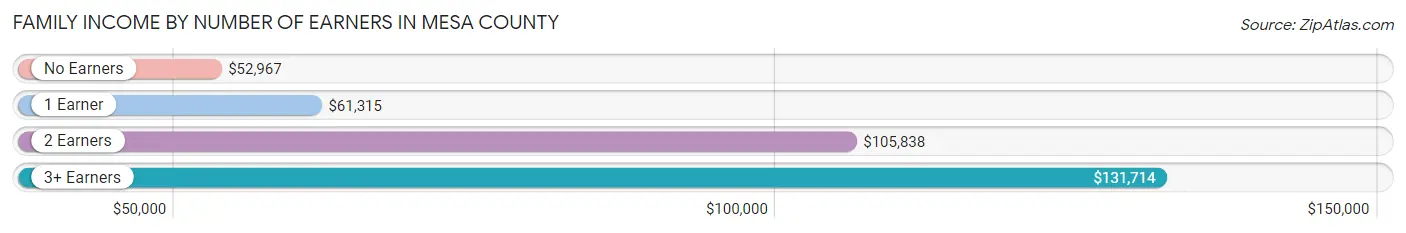
| Number of Earners | # Families | Median Income |
| No Earners | 6,148 (15.4%) | $52,967 |
| 1 Earner | 13,621 (34.2%) | $61,315 |
| 2 Earners | 15,938 (40.0%) | $105,838 |
| 3+ Earners | 4,164 (10.4%) | $131,714 |
| Total | 39,871 (100.0%) | $83,034 |
Household Income in Mesa County
Household Income Brackets in Mesa County
With 12,367 households falling in the category, the $50,000 to $74,999 income range is the most frequent in Mesa County, accounting for 19.6% of all households. In contrast, only 2,019 households (3.2%) fall into the $10,000 to $14,999 income bracket, making it the least populous group.
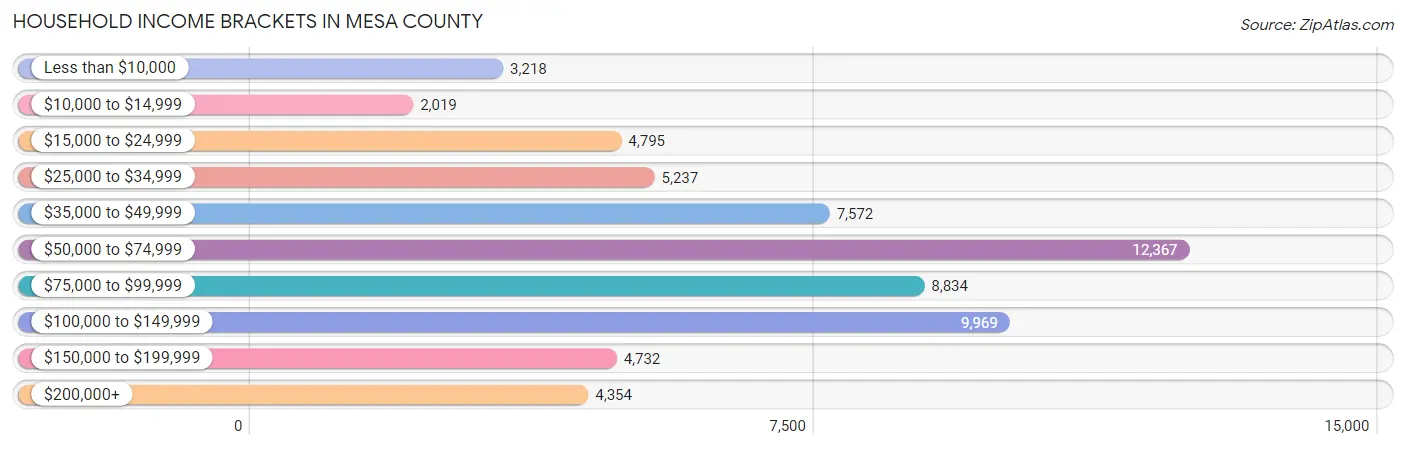
| Income Bracket | # Households | % Households |
| Less than $10,000 | 3,218 | 5.1% |
| $10,000 to $14,999 | 2,019 | 3.2% |
| $15,000 to $24,999 | 4,795 | 7.6% |
| $25,000 to $34,999 | 5,237 | 8.3% |
| $35,000 to $49,999 | 7,572 | 12.0% |
| $50,000 to $74,999 | 12,367 | 19.6% |
| $75,000 to $99,999 | 8,834 | 14.0% |
| $100,000 to $149,999 | 9,969 | 15.8% |
| $150,000 to $199,999 | 4,732 | 7.5% |
| $200,000+ | 4,354 | 6.9% |
Household Income by Householder Age in Mesa County
The median household income in Mesa County is $68,077, with the highest median household income of $81,526 found in the 45 to 64 years age bracket for the primary householder. A total of 21,571 households (34.2%) fall into this category. Meanwhile, the 15 to 24 years age bracket for the primary householder has the lowest median household income of $44,771, with 2,577 households (4.1%) in this group.
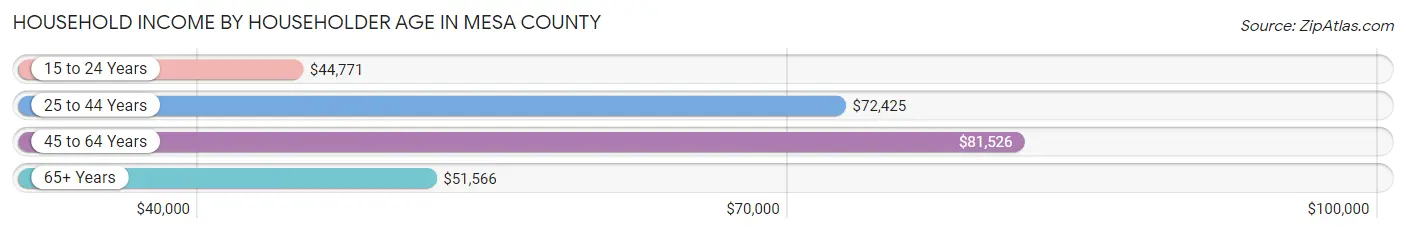
| Income Bracket | # Households | Median Income |
| 15 to 24 Years | 2,577 (4.1%) | $44,771 |
| 25 to 44 Years | 19,077 (30.2%) | $72,425 |
| 45 to 64 Years | 21,571 (34.2%) | $81,526 |
| 65+ Years | 19,873 (31.5%) | $51,566 |
| Total | 63,098 (100.0%) | $68,077 |
Poverty in Mesa County
Income Below Poverty by Sex and Age in Mesa County
With 10.1% poverty level for males and 12.8% for females among the residents of Mesa County, 18 to 24 year old males and under 5 year old females are the most vulnerable to poverty, with 1,437 males (23.3%) and 931 females (23.7%) in their respective age groups living below the poverty level.
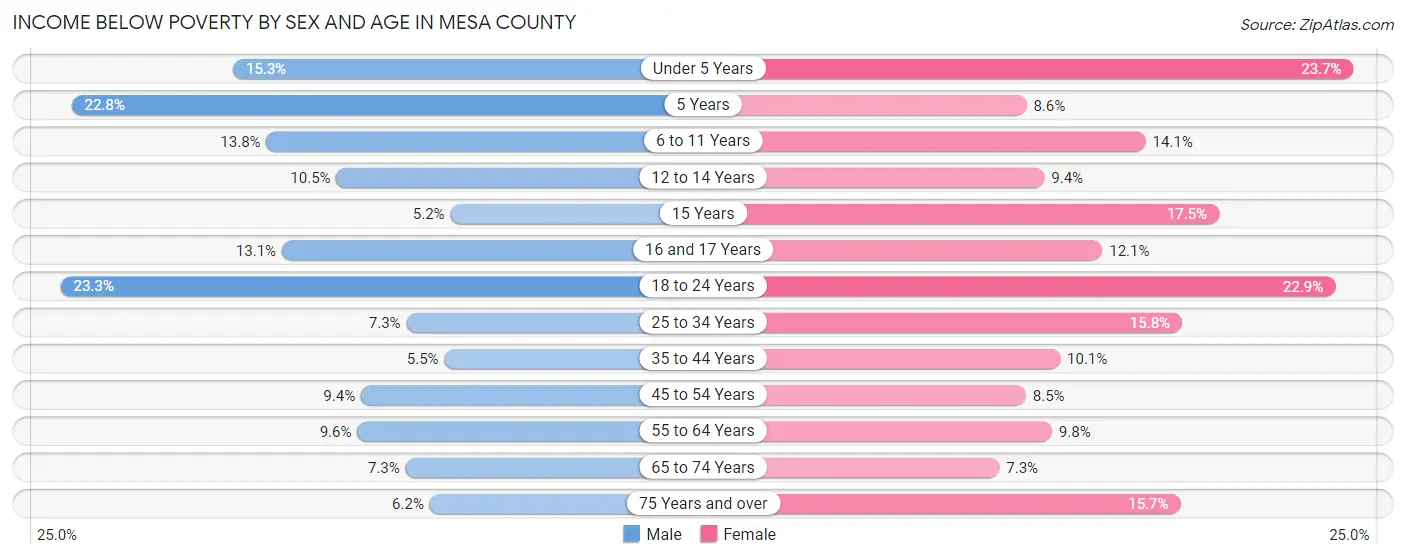
| Age Bracket | Male | Female |
| Under 5 Years | 604 (15.3%) | 931 (23.7%) |
| 5 Years | 139 (22.8%) | 74 (8.6%) |
| 6 to 11 Years | 843 (13.8%) | 761 (14.1%) |
| 12 to 14 Years | 289 (10.5%) | 245 (9.4%) |
| 15 Years | 56 (5.2%) | 129 (17.5%) |
| 16 and 17 Years | 250 (13.1%) | 242 (12.1%) |
| 18 to 24 Years | 1,437 (23.3%) | 1,324 (22.9%) |
| 25 to 34 Years | 749 (7.3%) | 1,537 (15.8%) |
| 35 to 44 Years | 546 (5.5%) | 973 (10.1%) |
| 45 to 54 Years | 805 (9.4%) | 722 (8.5%) |
| 55 to 64 Years | 958 (9.6%) | 1,079 (9.8%) |
| 65 to 74 Years | 658 (7.3%) | 707 (7.3%) |
| 75 Years and over | 334 (6.2%) | 1,054 (15.7%) |
| Total | 7,668 (10.1%) | 9,778 (12.8%) |
Income Above Poverty by Sex and Age in Mesa County
According to the poverty statistics in Mesa County, males aged 15 years and females aged 65 to 74 years are the age groups that are most secure financially, with 94.8% of males and 92.7% of females in these age groups living above the poverty line.
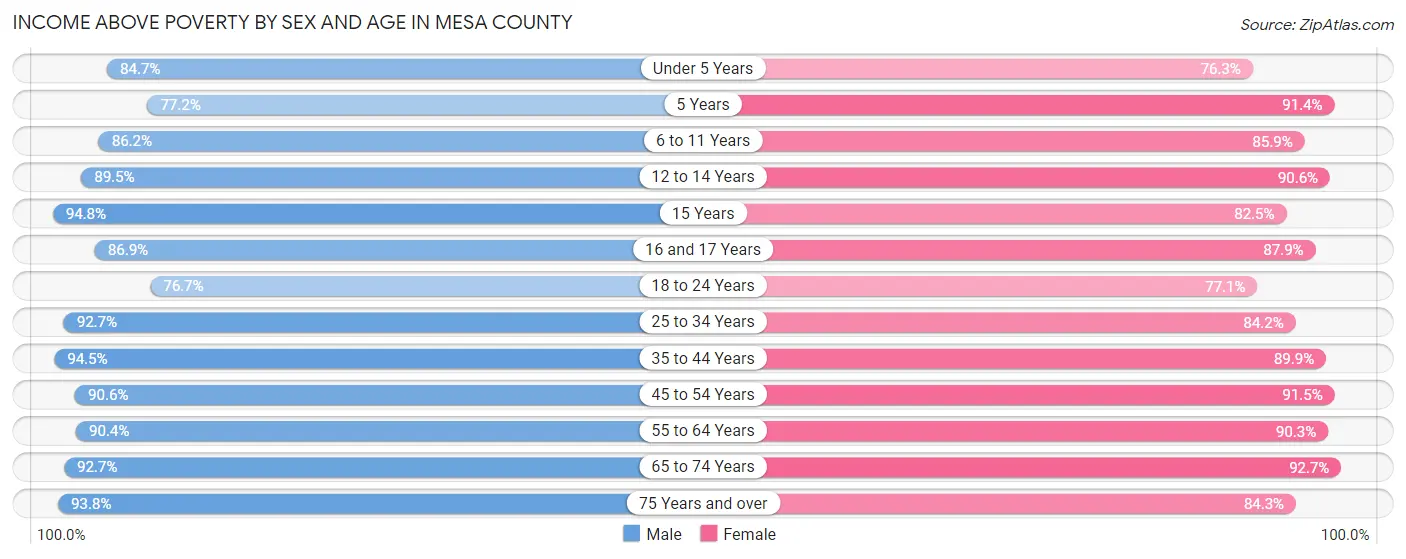
| Age Bracket | Male | Female |
| Under 5 Years | 3,337 (84.7%) | 2,991 (76.3%) |
| 5 Years | 470 (77.2%) | 789 (91.4%) |
| 6 to 11 Years | 5,273 (86.2%) | 4,637 (85.9%) |
| 12 to 14 Years | 2,455 (89.5%) | 2,360 (90.6%) |
| 15 Years | 1,013 (94.8%) | 608 (82.5%) |
| 16 and 17 Years | 1,664 (86.9%) | 1,760 (87.9%) |
| 18 to 24 Years | 4,723 (76.7%) | 4,460 (77.1%) |
| 25 to 34 Years | 9,533 (92.7%) | 8,206 (84.2%) |
| 35 to 44 Years | 9,347 (94.5%) | 8,631 (89.9%) |
| 45 to 54 Years | 7,769 (90.6%) | 7,733 (91.5%) |
| 55 to 64 Years | 9,063 (90.4%) | 9,989 (90.2%) |
| 65 to 74 Years | 8,325 (92.7%) | 8,964 (92.7%) |
| 75 Years and over | 5,055 (93.8%) | 5,654 (84.3%) |
| Total | 68,027 (89.9%) | 66,782 (87.2%) |
Income Below Poverty Among Married-Couple Families in Mesa County
The poverty statistics for married-couple families in Mesa County show that 3.1% or 920 of the total 30,034 families live below the poverty line. Families with 3 or 4 children have the highest poverty rate of 8.1%, comprising of 206 families. On the other hand, families with no children have the lowest poverty rate of 2.4%, which includes 451 families.
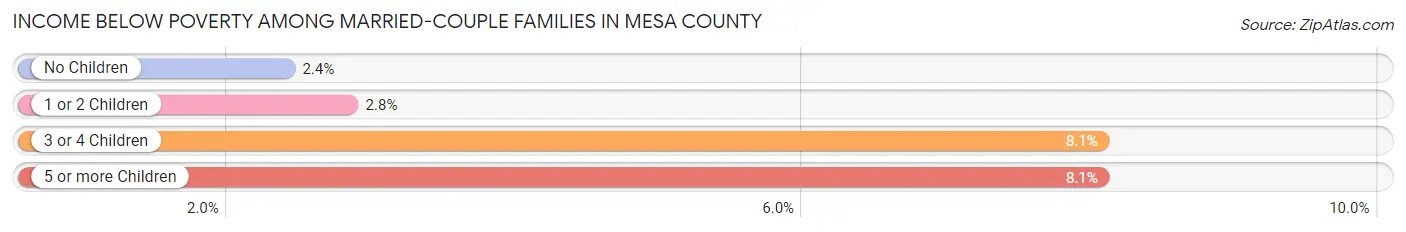
| Children | Above Poverty | Below Poverty |
| No Children | 18,306 (97.6%) | 451 (2.4%) |
| 1 or 2 Children | 8,200 (97.2%) | 240 (2.8%) |
| 3 or 4 Children | 2,346 (91.9%) | 206 (8.1%) |
| 5 or more Children | 262 (91.9%) | 23 (8.1%) |
| Total | 29,114 (96.9%) | 920 (3.1%) |
Income Below Poverty Among Single-Parent Households in Mesa County
According to the poverty data in Mesa County, 10.0% or 325 single-father households and 25.3% or 1,665 single-mother households are living below the poverty line. Among single-father households, those with 3 or 4 children have the highest poverty rate, with 39 households (27.7%) experiencing poverty. Likewise, among single-mother households, those with 5 or more children have the highest poverty rate, with 14 households (100.0%) falling below the poverty line.
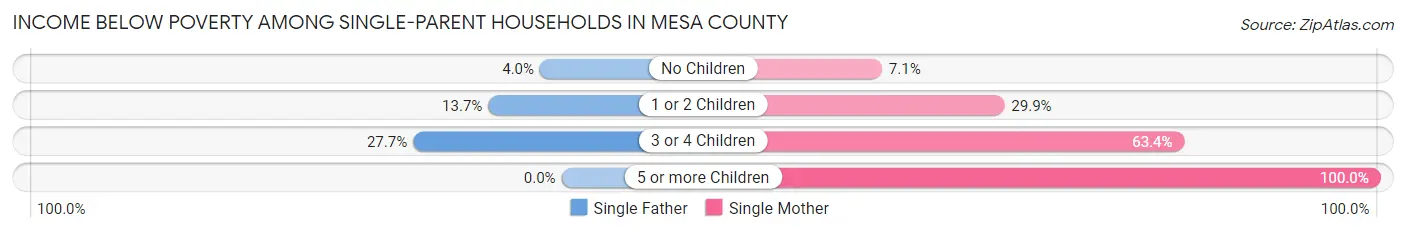
| Children | Single Father | Single Mother |
| No Children | 59 (4.0%) | 174 (7.1%) |
| 1 or 2 Children | 227 (13.7%) | 1,012 (29.9%) |
| 3 or 4 Children | 39 (27.7%) | 465 (63.4%) |
| 5 or more Children | 0 (0.0%) | 14 (100.0%) |
| Total | 325 (10.0%) | 1,665 (25.3%) |
Income Below Poverty Among Married-Couple vs Single-Parent Households in Mesa County
The poverty data for Mesa County shows that 920 of the married-couple family households (3.1%) and 1,990 of the single-parent households (20.2%) are living below the poverty level. Within the married-couple family households, those with 3 or 4 children have the highest poverty rate, with 206 households (8.1%) falling below the poverty line. Among the single-parent households, those with 5 or more children have the highest poverty rate, with 14 household (100.0%) living below poverty.
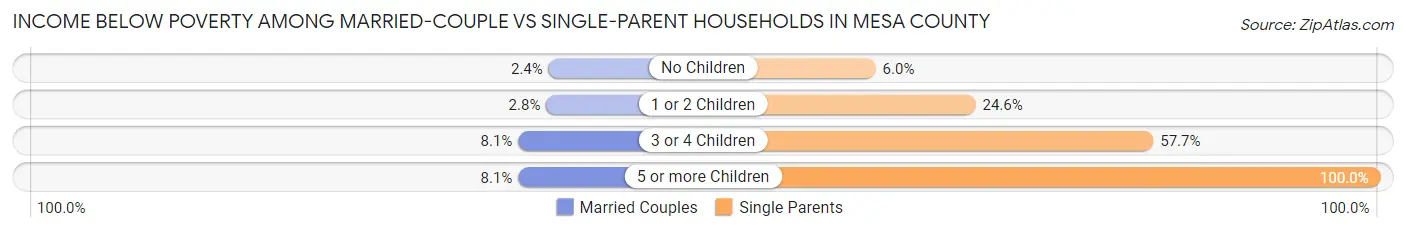
| Children | Married-Couple Families | Single-Parent Households |
| No Children | 451 (2.4%) | 233 (6.0%) |
| 1 or 2 Children | 240 (2.8%) | 1,239 (24.6%) |
| 3 or 4 Children | 206 (8.1%) | 504 (57.7%) |
| 5 or more Children | 23 (8.1%) | 14 (100.0%) |
| Total | 920 (3.1%) | 1,990 (20.2%) |
Race in Mesa County
The most populous races in Mesa County are White / Caucasian (135,709 | 86.9%), Hispanic or Latino (23,635 | 15.1%), and Two or more Races (13,636 | 8.7%).
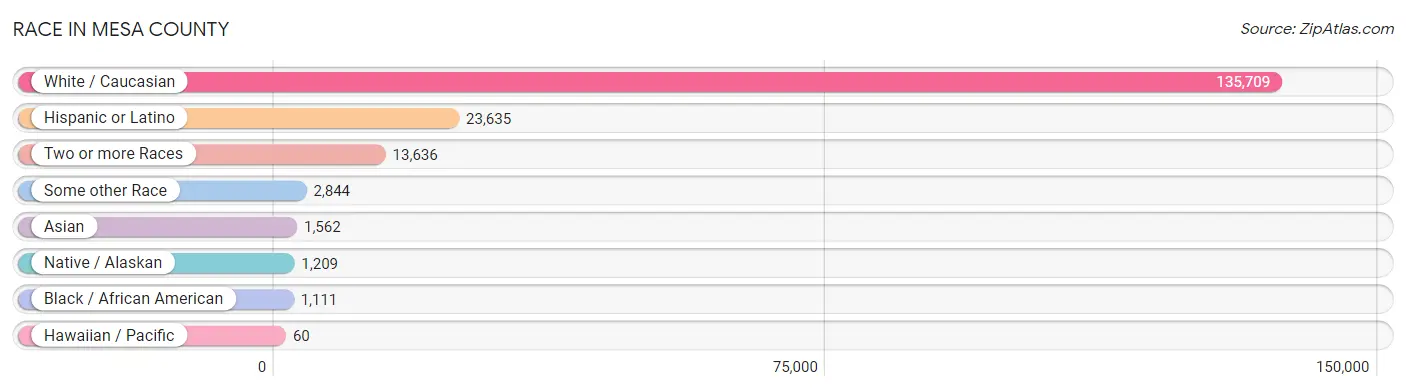
| Race | # Population | % Population |
| Asian | 1,562 | 1.0% |
| Black / African American | 1,111 | 0.7% |
| Hawaiian / Pacific | 60 | 0.0% |
| Hispanic or Latino | 23,635 | 15.1% |
| Native / Alaskan | 1,209 | 0.8% |
| White / Caucasian | 135,709 | 86.9% |
| Two or more Races | 13,636 | 8.7% |
| Some other Race | 2,844 | 1.8% |
| Total | 156,131 | 100.0% |
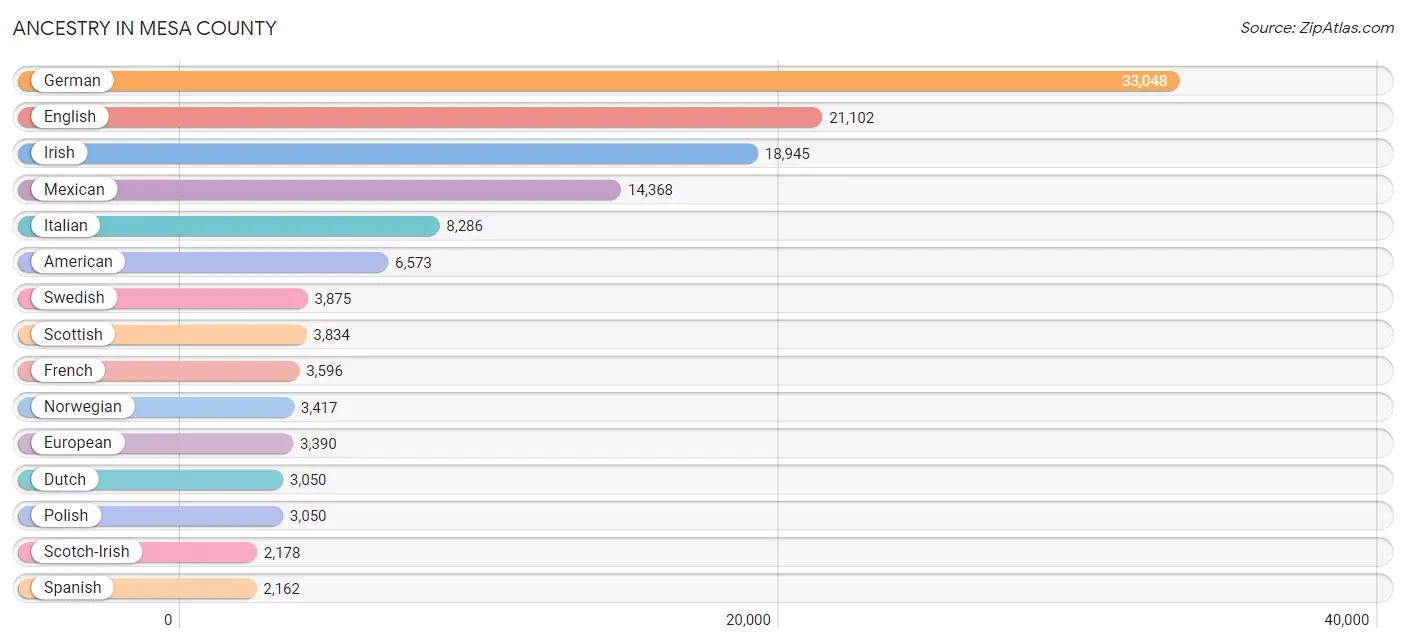
Ancestry in Mesa County
The most populous ancestries reported in Mesa County are German (33,048 | 21.2%), English (21,102 | 13.5%), Irish (18,945 | 12.1%), Mexican (14,368 | 9.2%), and Italian (8,286 | 5.3%), together accounting for 61.3% of all Mesa County residents.
| Ancestry | # Population | % Population |
| Afghan | 15 | 0.0% |
| African | 44 | 0.0% |
| Alaskan Athabascan | 6 | 0.0% |
| Albanian | 18 | 0.0% |
| Aleut | 8 | 0.0% |
| American | 6,573 | 4.2% |
| Apache | 219 | 0.1% |
| Arab | 362 | 0.2% |
| Argentinean | 133 | 0.1% |
| Armenian | 169 | 0.1% |
| Australian | 54 | 0.0% |
| Austrian | 559 | 0.4% |
| Basque | 159 | 0.1% |
| Belgian | 131 | 0.1% |
| Bhutanese | 598 | 0.4% |
| Blackfeet | 58 | 0.0% |
| Bolivian | 30 | 0.0% |
| Brazilian | 45 | 0.0% |
| British | 1,049 | 0.7% |
| Bulgarian | 45 | 0.0% |
| Burmese | 230 | 0.2% |
| Canadian | 210 | 0.1% |
| Celtic | 52 | 0.0% |
| Central American | 399 | 0.3% |
| Cherokee | 716 | 0.5% |
| Cheyenne | 26 | 0.0% |
| Chickasaw | 19 | 0.0% |
| Chilean | 57 | 0.0% |
| Chippewa | 56 | 0.0% |
| Choctaw | 58 | 0.0% |
| Colombian | 23 | 0.0% |
| Comanche | 12 | 0.0% |
| Costa Rican | 48 | 0.0% |
| Cree | 19 | 0.0% |
| Creek | 62 | 0.0% |
| Croatian | 206 | 0.1% |
| Cuban | 194 | 0.1% |
| Czech | 509 | 0.3% |
| Czechoslovakian | 428 | 0.3% |
| Danish | 1,781 | 1.1% |
| Delaware | 58 | 0.0% |
| Dominican | 8 | 0.0% |
| Dutch | 3,050 | 1.9% |
| Dutch West Indian | 13 | 0.0% |
| Eastern European | 201 | 0.1% |
| Egyptian | 23 | 0.0% |
| English | 21,102 | 13.5% |
| Estonian | 1 | 0.0% |
| European | 3,390 | 2.2% |
| Filipino | 68 | 0.0% |
| Finnish | 217 | 0.1% |
| French | 3,596 | 2.3% |
| French Canadian | 598 | 0.4% |
| German | 33,048 | 21.2% |
| German Russian | 12 | 0.0% |
| Ghanaian | 13 | 0.0% |
| Greek | 539 | 0.4% |
| Guamanian / Chamorro | 17 | 0.0% |
| Guatemalan | 34 | 0.0% |
| Guyanese | 23 | 0.0% |
| Honduran | 36 | 0.0% |
| Hopi | 84 | 0.1% |
| Hungarian | 363 | 0.2% |
| Indian (Asian) | 435 | 0.3% |
| Inupiat | 6 | 0.0% |
| Iranian | 34 | 0.0% |
| Irish | 18,945 | 12.1% |
| Iroquois | 7 | 0.0% |
| Israeli | 9 | 0.0% |
| Italian | 8,286 | 5.3% |
| Japanese | 102 | 0.1% |
| Korean | 1,026 | 0.7% |
| Latvian | 74 | 0.1% |
| Lebanese | 73 | 0.1% |
| Lithuanian | 186 | 0.1% |
| Luxembourger | 30 | 0.0% |
| Maltese | 45 | 0.0% |
| Mexican | 14,368 | 9.2% |
| Mexican American Indian | 9 | 0.0% |
| Moroccan | 18 | 0.0% |
| Native Hawaiian | 119 | 0.1% |
| Navajo | 294 | 0.2% |
| New Zealander | 5 | 0.0% |
| Nicaraguan | 56 | 0.0% |
| Northern European | 317 | 0.2% |
| Norwegian | 3,417 | 2.2% |
| Paiute | 12 | 0.0% |
| Panamanian | 107 | 0.1% |
| Paraguayan | 34 | 0.0% |
| Pennsylvania German | 28 | 0.0% |
| Peruvian | 10 | 0.0% |
| Pima | 27 | 0.0% |
| Polish | 3,050 | 1.9% |
| Portuguese | 706 | 0.4% |
| Potawatomi | 132 | 0.1% |
| Pueblo | 99 | 0.1% |
| Puerto Rican | 877 | 0.6% |
| Romanian | 362 | 0.2% |
| Russian | 846 | 0.5% |
| Salvadoran | 105 | 0.1% |
| Samoan | 11 | 0.0% |
| Scandinavian | 1,432 | 0.9% |
| Scotch-Irish | 2,178 | 1.4% |
| Scottish | 3,834 | 2.5% |
| Senegalese | 16 | 0.0% |
| Shoshone | 28 | 0.0% |
| Sioux | 146 | 0.1% |
| Slavic | 35 | 0.0% |
| Slovak | 124 | 0.1% |
| Slovene | 160 | 0.1% |
| South African | 51 | 0.0% |
| South American | 788 | 0.5% |
| Spaniard | 946 | 0.6% |
| Spanish | 2,162 | 1.4% |
| Spanish American | 111 | 0.1% |
| Spanish American Indian | 20 | 0.0% |
| Sri Lankan | 135 | 0.1% |
| Subsaharan African | 148 | 0.1% |
| Swedish | 3,875 | 2.5% |
| Swiss | 673 | 0.4% |
| Syrian | 239 | 0.2% |
| Thai | 133 | 0.1% |
| Tlingit-Haida | 7 | 0.0% |
| Tongan | 11 | 0.0% |
| Turkish | 15 | 0.0% |
| Ukrainian | 261 | 0.2% |
| Ute | 63 | 0.0% |
| Venezuelan | 175 | 0.1% |
| Welsh | 1,829 | 1.2% |
| Yaqui | 53 | 0.0% |
| Yugoslavian | 81 | 0.1% | View All 131 Rows |
Immigrants in Mesa County
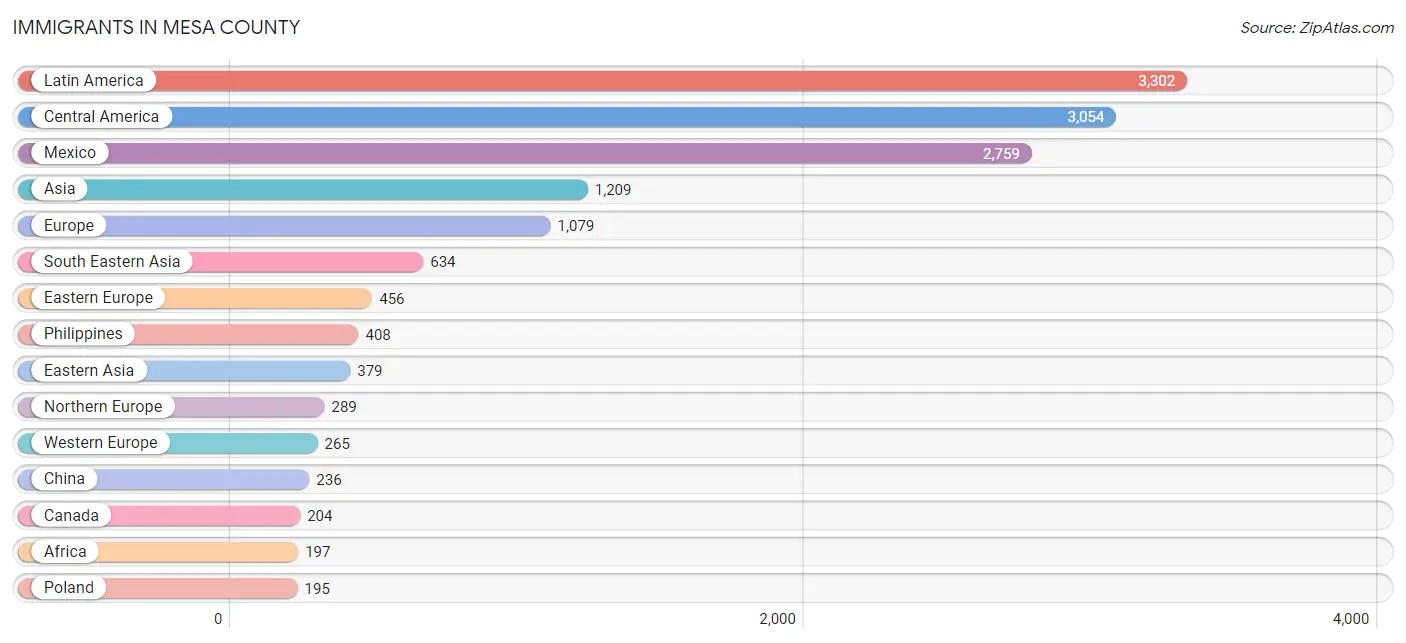
The most numerous immigrant groups reported in Mesa County came from Latin America (3,302 | 2.1%), Central America (3,054 | 2.0%), Mexico (2,759 | 1.8%), Asia (1,209 | 0.8%), and Europe (1,079 | 0.7%), together accounting for 7.3% of all Mesa County residents.
| Immigration Origin | # Population | % Population |
| Afghanistan | 10 | 0.0% |
| Africa | 197 | 0.1% |
| Albania | 13 | 0.0% |
| Asia | 1,209 | 0.8% |
| Australia | 55 | 0.0% |
| Austria | 11 | 0.0% |
| Azores | 6 | 0.0% |
| Bolivia | 11 | 0.0% |
| Bulgaria | 23 | 0.0% |
| Cambodia | 84 | 0.1% |
| Canada | 204 | 0.1% |
| Caribbean | 73 | 0.1% |
| Central America | 3,054 | 2.0% |
| Chile | 42 | 0.0% |
| China | 236 | 0.2% |
| Colombia | 23 | 0.0% |
| Costa Rica | 15 | 0.0% |
| Cuba | 61 | 0.0% |
| Czechoslovakia | 24 | 0.0% |
| Denmark | 63 | 0.0% |
| Eastern Africa | 79 | 0.1% |
| Eastern Asia | 379 | 0.2% |
| Eastern Europe | 456 | 0.3% |
| Egypt | 13 | 0.0% |
| El Salvador | 113 | 0.1% |
| England | 161 | 0.1% |
| Europe | 1,079 | 0.7% |
| France | 29 | 0.0% |
| Germany | 158 | 0.1% |
| Ghana | 13 | 0.0% |
| Guatemala | 7 | 0.0% |
| Guyana | 11 | 0.0% |
| Haiti | 12 | 0.0% |
| Honduras | 115 | 0.1% |
| India | 66 | 0.0% |
| Iran | 24 | 0.0% |
| Ireland | 9 | 0.0% |
| Israel | 33 | 0.0% |
| Italy | 56 | 0.0% |
| Japan | 104 | 0.1% |
| Korea | 39 | 0.0% |
| Latin America | 3,302 | 2.1% |
| Latvia | 22 | 0.0% |
| Liberia | 3 | 0.0% |
| Malaysia | 19 | 0.0% |
| Mexico | 2,759 | 1.8% |
| Micronesia | 39 | 0.0% |
| Middle Africa | 24 | 0.0% |
| Nepal | 22 | 0.0% |
| Netherlands | 13 | 0.0% |
| Nicaragua | 31 | 0.0% |
| Northern Africa | 13 | 0.0% |
| Northern Europe | 289 | 0.2% |
| Oceania | 99 | 0.1% |
| Panama | 14 | 0.0% |
| Philippines | 408 | 0.3% |
| Poland | 195 | 0.1% |
| Portugal | 13 | 0.0% |
| Romania | 70 | 0.0% |
| Russia | 23 | 0.0% |
| South Africa | 65 | 0.0% |
| South America | 175 | 0.1% |
| South Central Asia | 148 | 0.1% |
| South Eastern Asia | 634 | 0.4% |
| Southern Europe | 69 | 0.0% |
| Sweden | 14 | 0.0% |
| Switzerland | 54 | 0.0% |
| Syria | 15 | 0.0% |
| Taiwan | 68 | 0.0% |
| Ukraine | 86 | 0.1% |
| Venezuela | 88 | 0.1% |
| Vietnam | 123 | 0.1% |
| Western Africa | 16 | 0.0% |
| Western Asia | 48 | 0.0% |
| Western Europe | 265 | 0.2% |
| Zaire | 24 | 0.0% |
| Zimbabwe | 79 | 0.1% | View All 77 Rows |
Sex and Age in Mesa County
Sex and Age in Mesa County
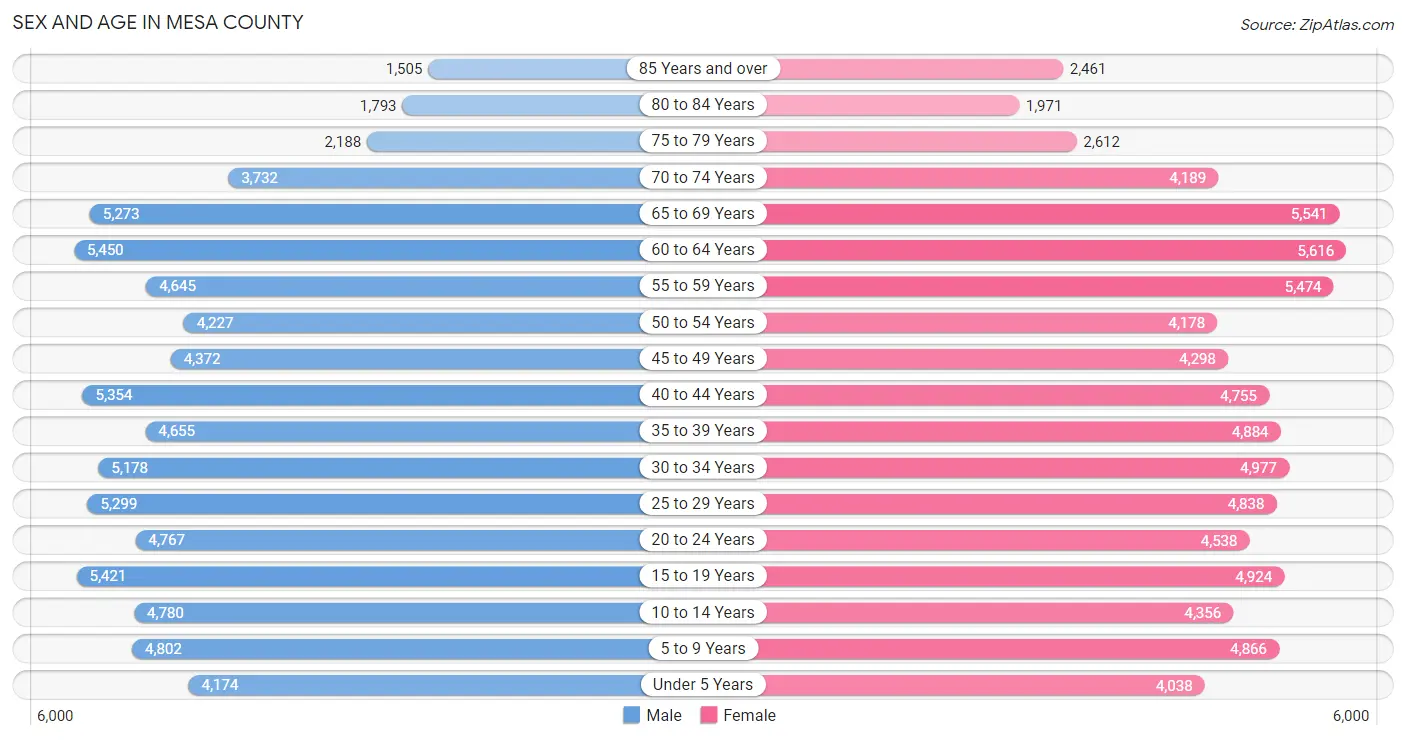
The most populous age groups in Mesa County are 60 to 64 Years (5,450 | 7.0%) for men and 60 to 64 Years (5,616 | 7.1%) for women.
| Age Bracket | Male | Female |
| Under 5 Years | 4,174 (5.4%) | 4,038 (5.1%) |
| 5 to 9 Years | 4,802 (6.2%) | 4,866 (6.2%) |
| 10 to 14 Years | 4,780 (6.2%) | 4,356 (5.6%) |
| 15 to 19 Years | 5,421 (7.0%) | 4,924 (6.3%) |
| 20 to 24 Years | 4,767 (6.1%) | 4,538 (5.8%) |
| 25 to 29 Years | 5,299 (6.8%) | 4,838 (6.2%) |
| 30 to 34 Years | 5,178 (6.7%) | 4,977 (6.3%) |
| 35 to 39 Years | 4,655 (6.0%) | 4,884 (6.2%) |
| 40 to 44 Years | 5,354 (6.9%) | 4,755 (6.1%) |
| 45 to 49 Years | 4,372 (5.6%) | 4,298 (5.5%) |
| 50 to 54 Years | 4,227 (5.4%) | 4,178 (5.3%) |
| 55 to 59 Years | 4,645 (6.0%) | 5,474 (7.0%) |
| 60 to 64 Years | 5,450 (7.0%) | 5,616 (7.1%) |
| 65 to 69 Years | 5,273 (6.8%) | 5,541 (7.1%) |
| 70 to 74 Years | 3,732 (4.8%) | 4,189 (5.3%) |
| 75 to 79 Years | 2,188 (2.8%) | 2,612 (3.3%) |
| 80 to 84 Years | 1,793 (2.3%) | 1,971 (2.5%) |
| 85 Years and over | 1,505 (1.9%) | 2,461 (3.1%) |
| Total | 77,615 (100.0%) | 78,516 (100.0%) |
Families and Households in Mesa County
Median Family Size in Mesa County
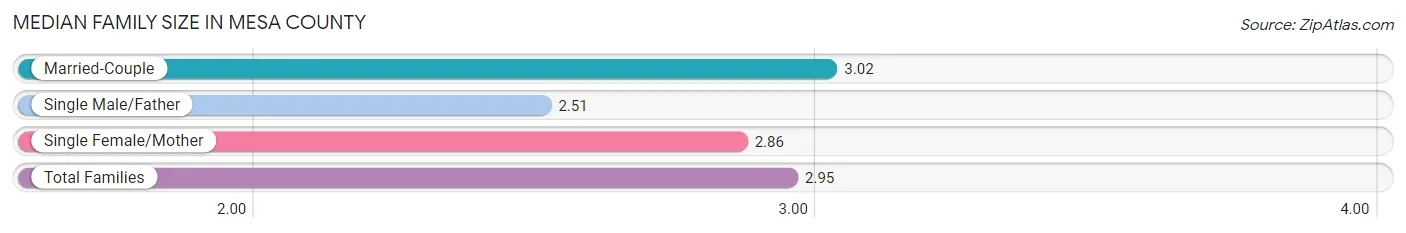
The median family size in Mesa County is 2.95 persons per family, with married-couple families (30,034 | 75.3%) accounting for the largest median family size of 3.02 persons per family. On the other hand, single male/father families (3,267 | 8.2%) represent the smallest median family size with 2.51 persons per family.
| Family Type | # Families | Family Size |
| Married-Couple | 30,034 (75.3%) | 3.02 |
| Single Male/Father | 3,267 (8.2%) | 2.51 |
| Single Female/Mother | 6,570 (16.5%) | 2.86 |
| Total Families | 39,871 (100.0%) | 2.95 |
Median Household Size in Mesa County
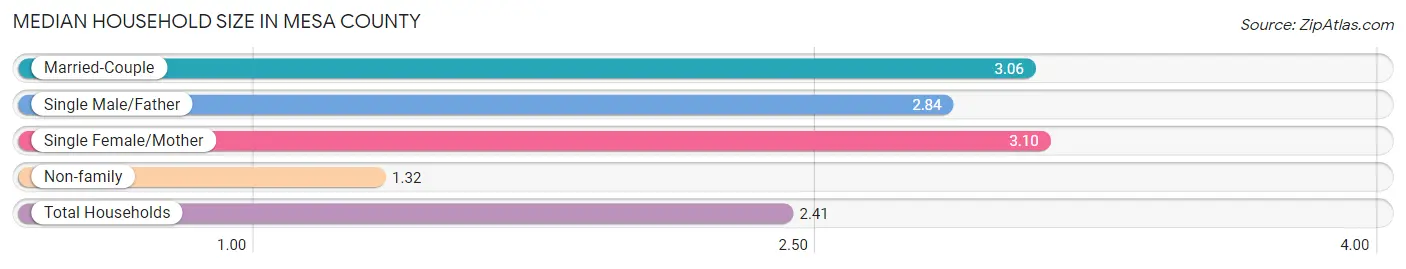
The median household size in Mesa County is 2.41 persons per household, with single female/mother households (6,570 | 10.4%) accounting for the largest median household size of 3.1 persons per household. non-family households (23,227 | 36.8%) represent the smallest median household size with 1.32 persons per household.
| Household Type | # Households | Household Size |
| Married-Couple | 30,034 (47.6%) | 3.06 |
| Single Male/Father | 3,267 (5.2%) | 2.84 |
| Single Female/Mother | 6,570 (10.4%) | 3.10 |
| Non-family | 23,227 (36.8%) | 1.32 |
| Total Households | 63,098 (100.0%) | 2.41 |
Household Size by Marriage Status in Mesa County
Out of a total of 63,098 households in Mesa County, 39,871 (63.2%) are family households, while 23,227 (36.8%) are nonfamily households. The most numerous type of family households are 2-person households, comprising 20,072, and the most common type of nonfamily households are 1-person households, comprising 18,479.
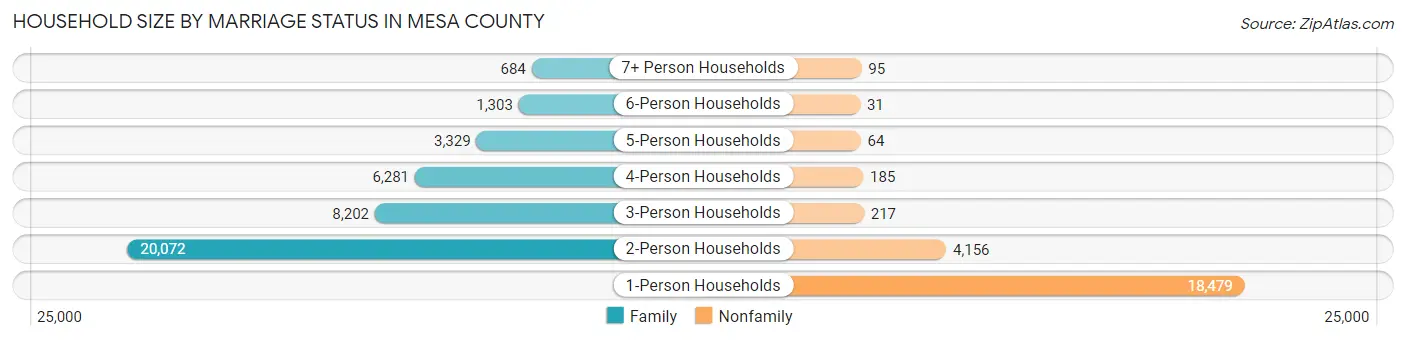
| Household Size | Family Households | Nonfamily Households |
| 1-Person Households | - | 18,479 (29.3%) |
| 2-Person Households | 20,072 (31.8%) | 4,156 (6.6%) |
| 3-Person Households | 8,202 (13.0%) | 217 (0.3%) |
| 4-Person Households | 6,281 (10.0%) | 185 (0.3%) |
| 5-Person Households | 3,329 (5.3%) | 64 (0.1%) |
| 6-Person Households | 1,303 (2.1%) | 31 (0.1%) |
| 7+ Person Households | 684 (1.1%) | 95 (0.2%) |
| Total | 39,871 (63.2%) | 23,227 (36.8%) |
Female Fertility in Mesa County
Fertility by Age in Mesa County
Average fertility rate in Mesa County is 37.0 births per 1,000 women. Women in the age bracket of 20 to 34 years have the highest fertility rate with 61.0 births per 1,000 women. Women in the age bracket of 20 to 34 years acount for 70.8% of all women with births.
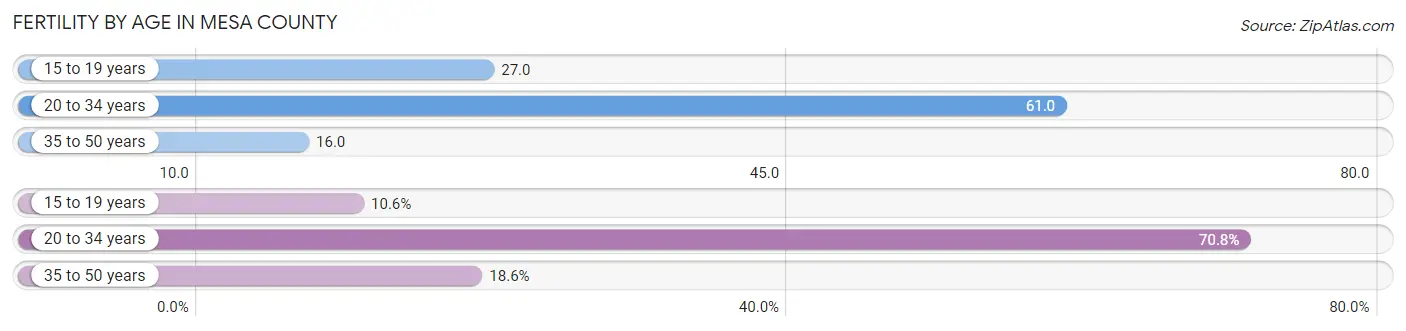
| Age Bracket | Women with Births | Births / 1,000 Women |
| 15 to 19 years | 132 (10.6%) | 27.0 |
| 20 to 34 years | 882 (70.8%) | 61.0 |
| 35 to 50 years | 232 (18.6%) | 16.0 |
| Total | 1,246 (100.0%) | 37.0 |
Fertility by Age by Marriage Status in Mesa County
72.9% of women with births (1,246) in Mesa County are married. The highest percentage of unmarried women with births falls into 15 to 19 years age bracket with 83.3% of them unmarried at the time of birth, while the lowest percentage of unmarried women with births belong to 35 to 50 years age bracket with 7.8% of them unmarried.
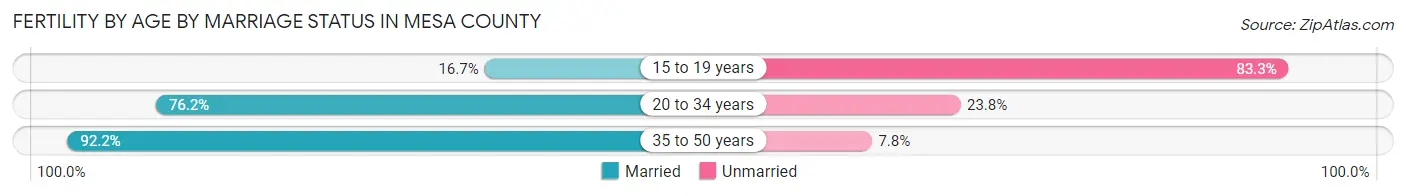
| Age Bracket | Married | Unmarried |
| 15 to 19 years | 22 (16.7%) | 110 (83.3%) |
| 20 to 34 years | 672 (76.2%) | 210 (23.8%) |
| 35 to 50 years | 214 (92.2%) | 18 (7.8%) |
| Total | 908 (72.9%) | 338 (27.1%) |
Fertility by Education in Mesa County
Average fertility rate in Mesa County is 37.0 births per 1,000 women. Women with the education attainment of graduate degree have the highest fertility rate of 52.0 births per 1,000 women, while women with the education attainment of less than high school have the lowest fertility at 22.0 births per 1,000 women. Women with the education attainment of high school diploma represent 27.9% of all women with births.
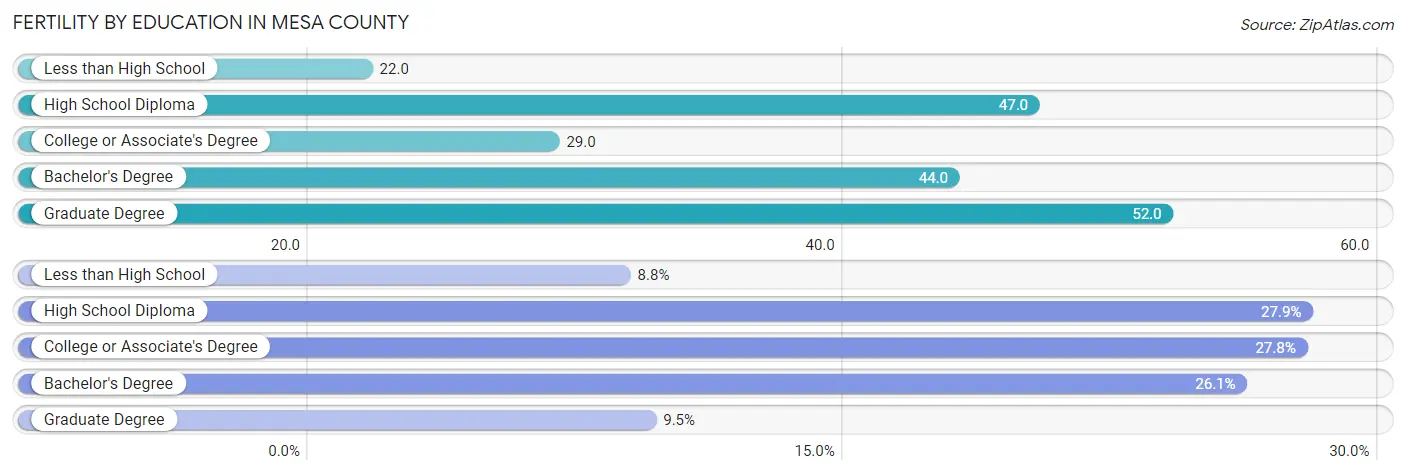
| Educational Attainment | Women with Births | Births / 1,000 Women |
| Less than High School | 109 (8.7%) | 22.0 |
| High School Diploma | 348 (27.9%) | 47.0 |
| College or Associate's Degree | 346 (27.8%) | 29.0 |
| Bachelor's Degree | 325 (26.1%) | 44.0 |
| Graduate Degree | 118 (9.5%) | 52.0 |
| Total | 1,246 (100.0%) | 37.0 |
Fertility by Education by Marriage Status in Mesa County
27.1% of women with births in Mesa County are unmarried. Women with the educational attainment of bachelor's degree are most likely to be married with 100.0% of them married at childbirth, while women with the educational attainment of college or associate's degree are least likely to be married with 52.9% of them unmarried at childbirth.
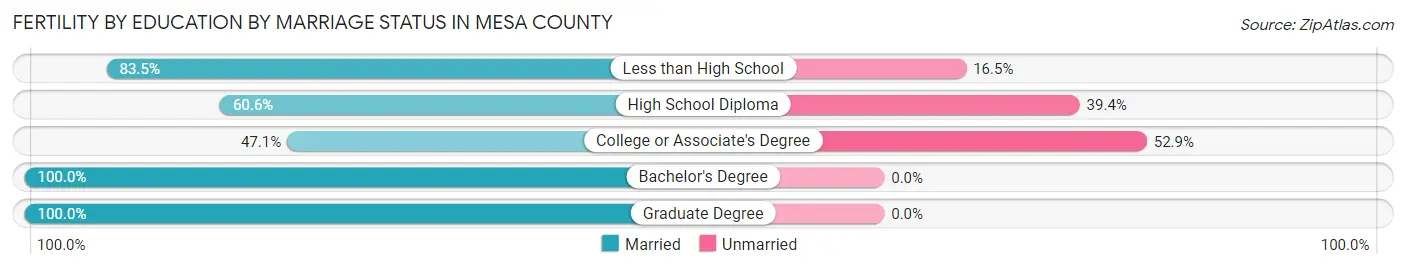
| Educational Attainment | Married | Unmarried |
| Less than High School | 91 (83.5%) | 18 (16.5%) |
| High School Diploma | 211 (60.6%) | 137 (39.4%) |
| College or Associate's Degree | 163 (47.1%) | 183 (52.9%) |
| Bachelor's Degree | 325 (100.0%) | 0 (0.0%) |
| Graduate Degree | 118 (100.0%) | 0 (0.0%) |
| Total | 908 (72.9%) | 338 (27.1%) |
Employment Characteristics in Mesa County
Employment by Class of Employer in Mesa County
Among the 72,651 employed individuals in Mesa County, private company employees (46,057 | 63.4%), not-for-profit organizations (6,445 | 8.9%), and self-employed (not incorporated) (5,961 | 8.2%) make up the most common classes of employment.
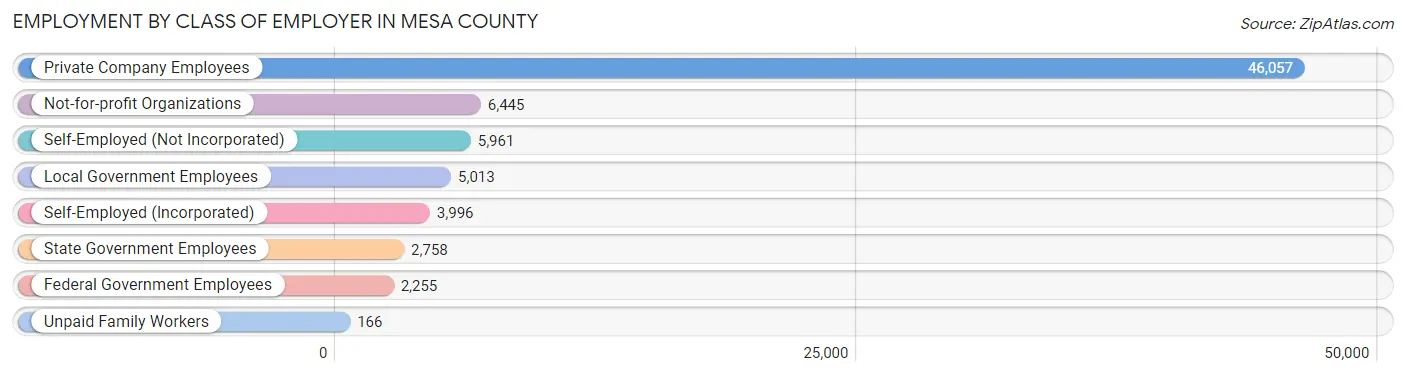
| Employer Class | # Employees | % Employees |
| Private Company Employees | 46,057 | 63.4% |
| Self-Employed (Incorporated) | 3,996 | 5.5% |
| Self-Employed (Not Incorporated) | 5,961 | 8.2% |
| Not-for-profit Organizations | 6,445 | 8.9% |
| Local Government Employees | 5,013 | 6.9% |
| State Government Employees | 2,758 | 3.8% |
| Federal Government Employees | 2,255 | 3.1% |
| Unpaid Family Workers | 166 | 0.2% |
| Total | 72,651 | 100.0% |
Employment Status by Age in Mesa County
According to the labor force statistics for Mesa County, out of the total population over 16 years of age (127,308), 61.6% or 78,422 individuals are in the labor force, with 5.3% or 4,156 of them unemployed. The age group with the highest labor force participation rate is 30 to 34 years, with 85.7% or 8,703 individuals in the labor force. Within the labor force, the 16 to 19 years age range has the highest percentage of unemployed individuals, with 15.5% or 703 of them being unemployed.
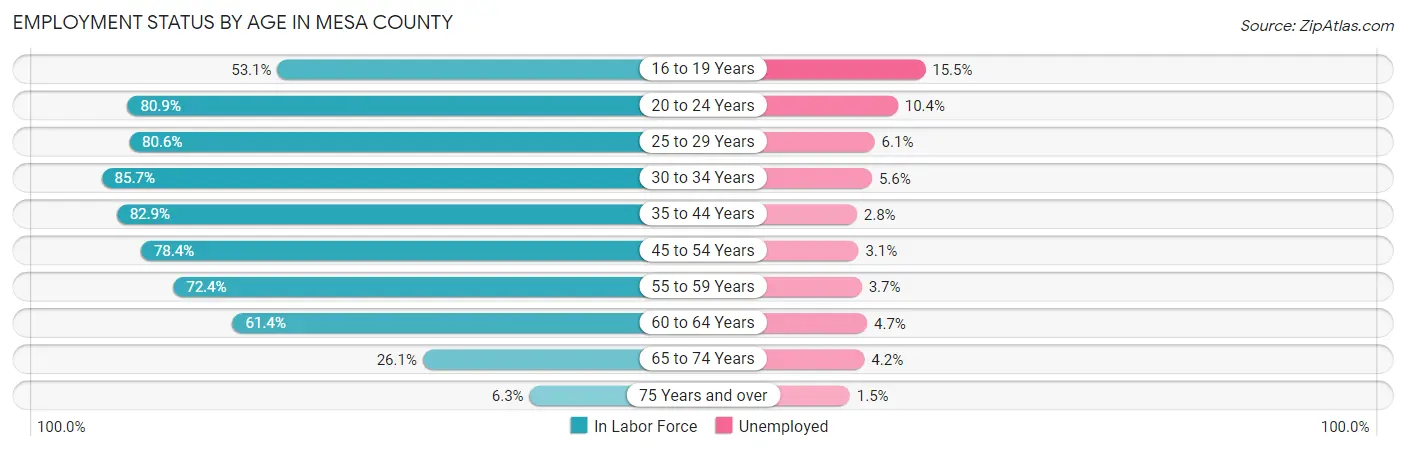
| Age Bracket | In Labor Force | Unemployed |
| 16 to 19 Years | 4,534 (53.1%) | 703 (15.5%) |
| 20 to 24 Years | 7,528 (80.9%) | 783 (10.4%) |
| 25 to 29 Years | 8,170 (80.6%) | 498 (6.1%) |
| 30 to 34 Years | 8,703 (85.7%) | 487 (5.6%) |
| 35 to 44 Years | 16,288 (82.9%) | 456 (2.8%) |
| 45 to 54 Years | 13,387 (78.4%) | 415 (3.1%) |
| 55 to 59 Years | 7,326 (72.4%) | 271 (3.7%) |
| 60 to 64 Years | 6,795 (61.4%) | 319 (4.7%) |
| 65 to 74 Years | 4,890 (26.1%) | 205 (4.2%) |
| 75 Years and over | 789 (6.3%) | 12 (1.5%) |
| Total | 78,422 (61.6%) | 4,156 (5.3%) |
Employment Status by Educational Attainment in Mesa County
According to labor force statistics for Mesa County, 77.6% of individuals (60,683) out of the total population between 25 and 64 years of age (78,200) are in the labor force, with 4.1% or 2,488 of them being unemployed. The group with the highest labor force participation rate are those with the educational attainment of bachelor's degree or higher, with 84.6% or 19,769 individuals in the labor force. Within the labor force, individuals with less than high school education have the highest percentage of unemployment, with 8.1% or 351 of them being unemployed.
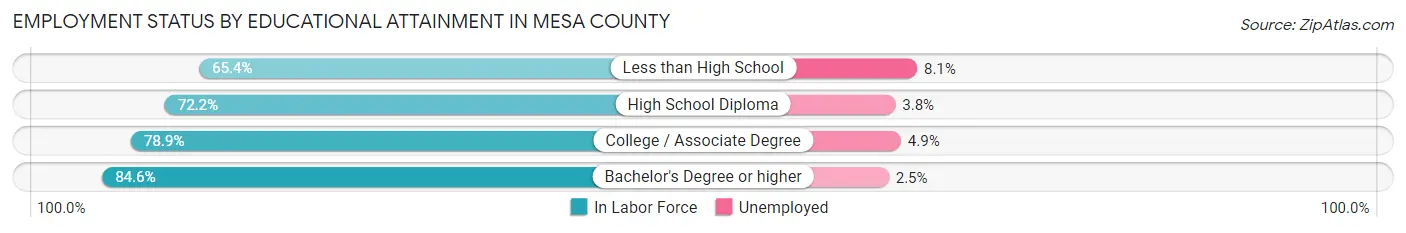
| Educational Attainment | In Labor Force | Unemployed |
| Less than High School | 4,328 (65.4%) | 536 (8.1%) |
| High School Diploma | 16,152 (72.2%) | 850 (3.8%) |
| College / Associate Degree | 20,390 (78.9%) | 1,266 (4.9%) |
| Bachelor's Degree or higher | 19,769 (84.6%) | 584 (2.5%) |
| Total | 60,683 (77.6%) | 3,206 (4.1%) |
Employment Occupations by Sex in Mesa County
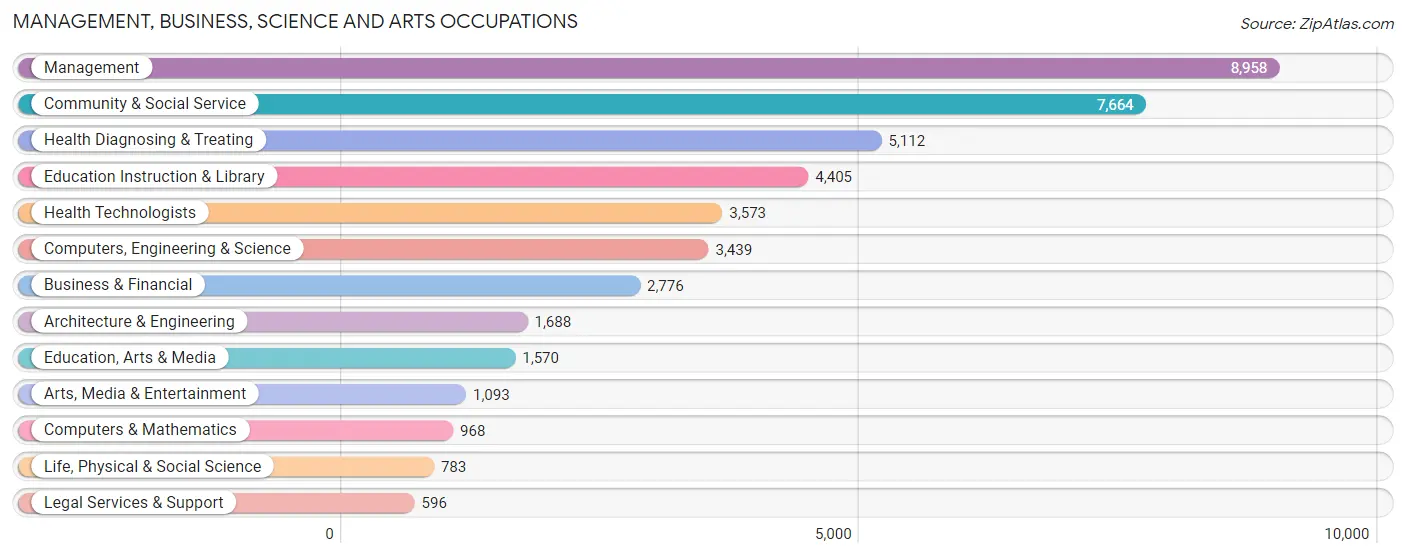
Management, Business, Science and Arts Occupations
The most common Management, Business, Science and Arts occupations in Mesa County are Management (8,958 | 12.1%), Community & Social Service (7,664 | 10.3%), Health Diagnosing & Treating (5,112 | 6.9%), Education Instruction & Library (4,405 | 5.9%), and Health Technologists (3,573 | 4.8%).
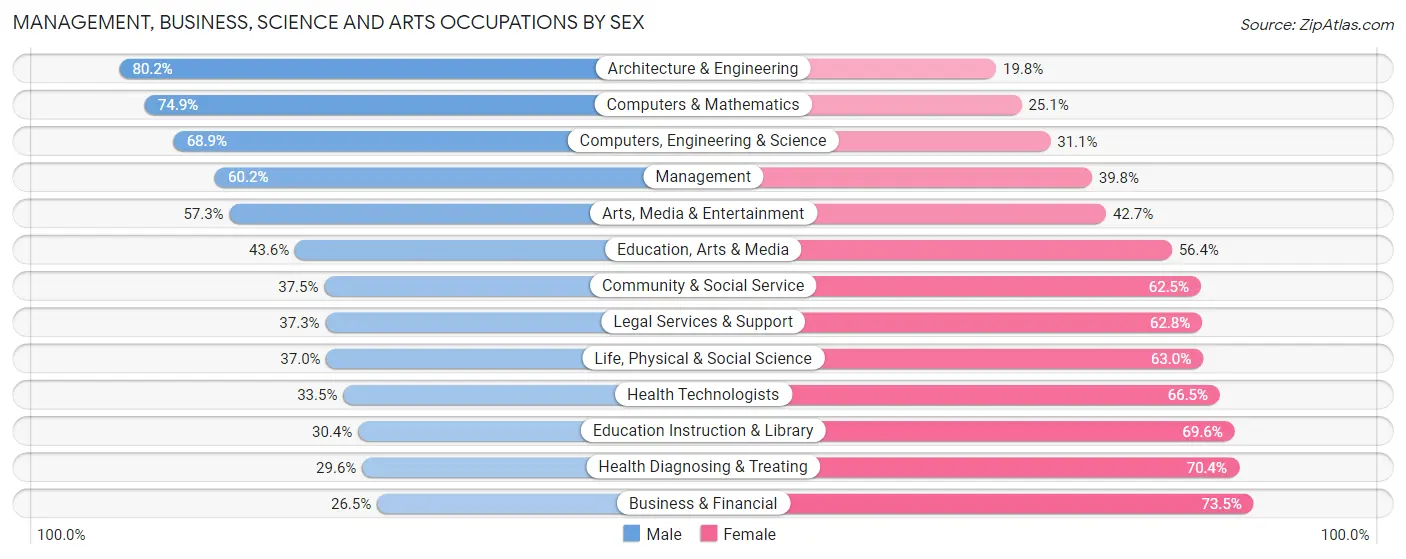
Management, Business, Science and Arts Occupations by Sex
Within the Management, Business, Science and Arts occupations in Mesa County, the most male-oriented occupations are Architecture & Engineering (80.2%), Computers & Mathematics (74.9%), and Computers, Engineering & Science (68.9%), while the most female-oriented occupations are Business & Financial (73.5%), Health Diagnosing & Treating (70.4%), and Education Instruction & Library (69.6%).
| Occupation | Male | Female |
| Management | 5,396 (60.2%) | 3,562 (39.8%) |
| Business & Financial | 735 (26.5%) | 2,041 (73.5%) |
| Computers, Engineering & Science | 2,369 (68.9%) | 1,070 (31.1%) |
| Computers & Mathematics | 725 (74.9%) | 243 (25.1%) |
| Architecture & Engineering | 1,354 (80.2%) | 334 (19.8%) |
| Life, Physical & Social Science | 290 (37.0%) | 493 (63.0%) |
| Community & Social Service | 2,873 (37.5%) | 4,791 (62.5%) |
| Education, Arts & Media | 684 (43.6%) | 886 (56.4%) |
| Legal Services & Support | 222 (37.2%) | 374 (62.7%) |
| Education Instruction & Library | 1,341 (30.4%) | 3,064 (69.6%) |
| Arts, Media & Entertainment | 626 (57.3%) | 467 (42.7%) |
| Health Diagnosing & Treating | 1,512 (29.6%) | 3,600 (70.4%) |
| Health Technologists | 1,198 (33.5%) | 2,375 (66.5%) |
| Total (Category) | 12,885 (46.1%) | 15,064 (53.9%) |
| Total (Overall) | 39,390 (53.1%) | 34,814 (46.9%) |
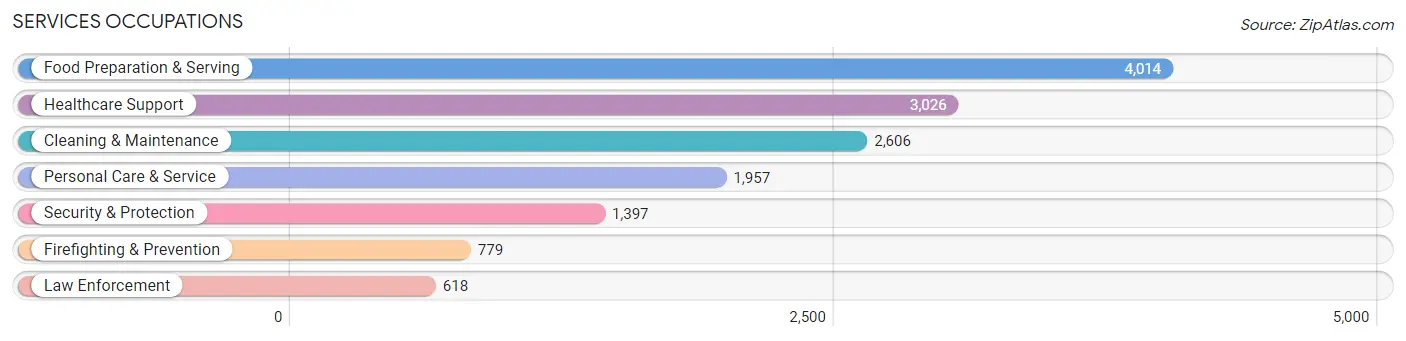
Services Occupations
The most common Services occupations in Mesa County are Food Preparation & Serving (4,014 | 5.4%), Healthcare Support (3,026 | 4.1%), Cleaning & Maintenance (2,606 | 3.5%), Personal Care & Service (1,957 | 2.6%), and Security & Protection (1,397 | 1.9%).
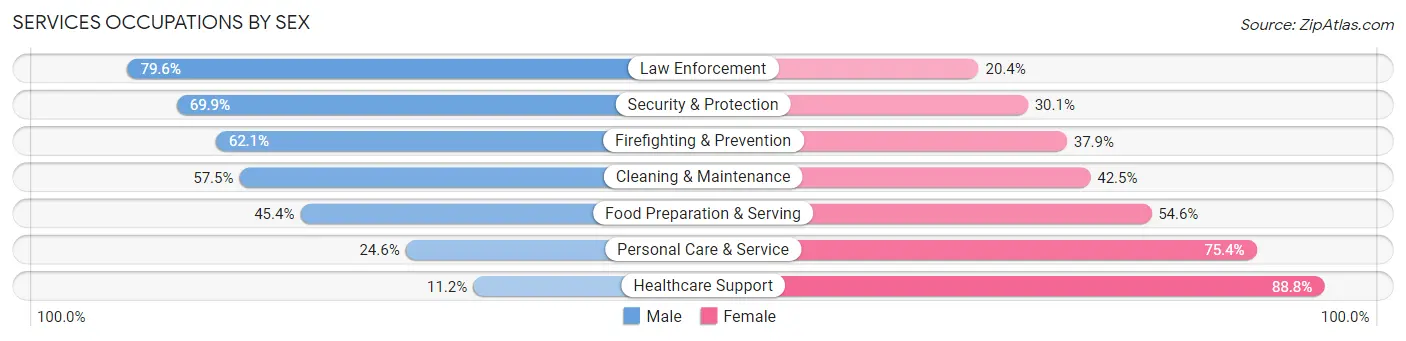
Services Occupations by Sex
Within the Services occupations in Mesa County, the most male-oriented occupations are Law Enforcement (79.6%), Security & Protection (69.9%), and Firefighting & Prevention (62.1%), while the most female-oriented occupations are Healthcare Support (88.8%), Personal Care & Service (75.4%), and Food Preparation & Serving (54.6%).
| Occupation | Male | Female |
| Healthcare Support | 339 (11.2%) | 2,687 (88.8%) |
| Security & Protection | 976 (69.9%) | 421 (30.1%) |
| Firefighting & Prevention | 484 (62.1%) | 295 (37.9%) |
| Law Enforcement | 492 (79.6%) | 126 (20.4%) |
| Food Preparation & Serving | 1,823 (45.4%) | 2,191 (54.6%) |
| Cleaning & Maintenance | 1,498 (57.5%) | 1,108 (42.5%) |
| Personal Care & Service | 481 (24.6%) | 1,476 (75.4%) |
| Total (Category) | 5,117 (39.4%) | 7,883 (60.6%) |
| Total (Overall) | 39,390 (53.1%) | 34,814 (46.9%) |
Sales and Office Occupations
The most common Sales and Office occupations in Mesa County are Office & Administration (7,854 | 10.6%), and Sales & Related (7,162 | 9.7%).
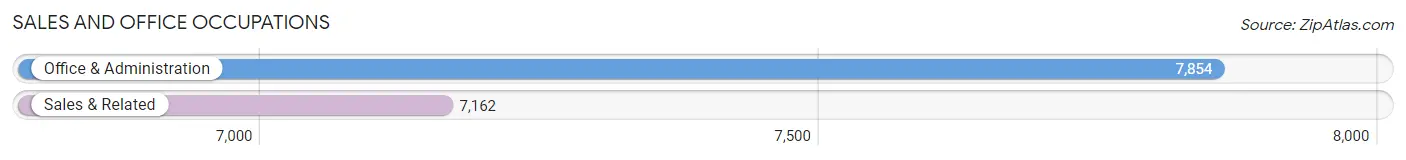
Sales and Office Occupations by Sex
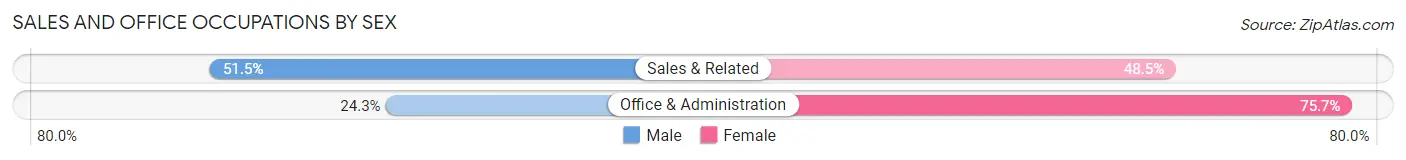
| Occupation | Male | Female |
| Sales & Related | 3,686 (51.5%) | 3,476 (48.5%) |
| Office & Administration | 1,912 (24.3%) | 5,942 (75.7%) |
| Total (Category) | 5,598 (37.3%) | 9,418 (62.7%) |
| Total (Overall) | 39,390 (53.1%) | 34,814 (46.9%) |
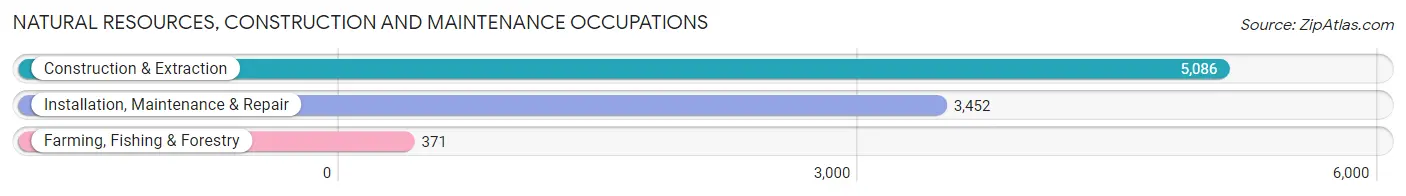
Natural Resources, Construction and Maintenance Occupations
The most common Natural Resources, Construction and Maintenance occupations in Mesa County are Construction & Extraction (5,086 | 6.9%), Installation, Maintenance & Repair (3,452 | 4.6%), and Farming, Fishing & Forestry (371 | 0.5%).
Natural Resources, Construction and Maintenance Occupations by Sex
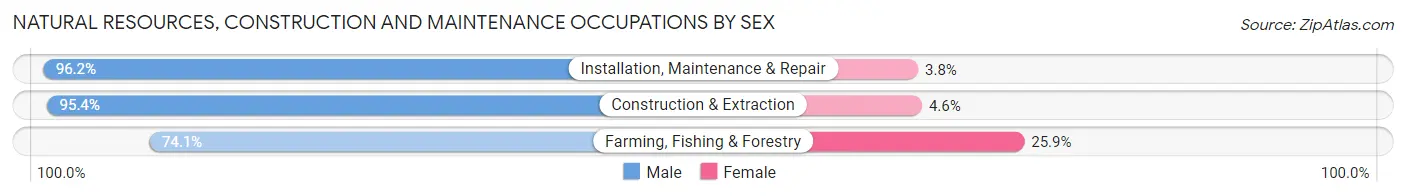
| Occupation | Male | Female |
| Farming, Fishing & Forestry | 275 (74.1%) | 96 (25.9%) |
| Construction & Extraction | 4,853 (95.4%) | 233 (4.6%) |
| Installation, Maintenance & Repair | 3,321 (96.2%) | 131 (3.8%) |
| Total (Category) | 8,449 (94.8%) | 460 (5.2%) |
| Total (Overall) | 39,390 (53.1%) | 34,814 (46.9%) |
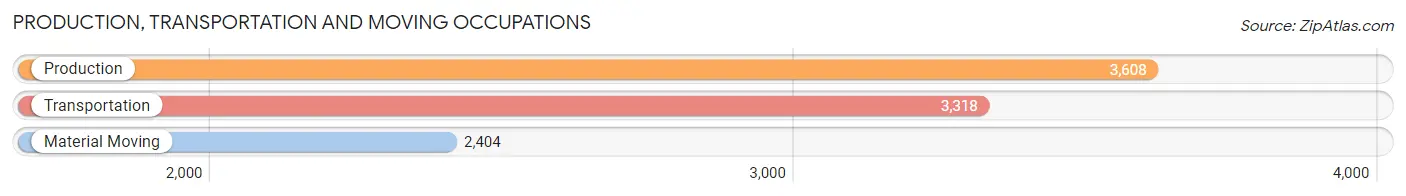
Production, Transportation and Moving Occupations
The most common Production, Transportation and Moving occupations in Mesa County are Production (3,608 | 4.9%), Transportation (3,318 | 4.5%), and Material Moving (2,404 | 3.2%).
Production, Transportation and Moving Occupations by Sex
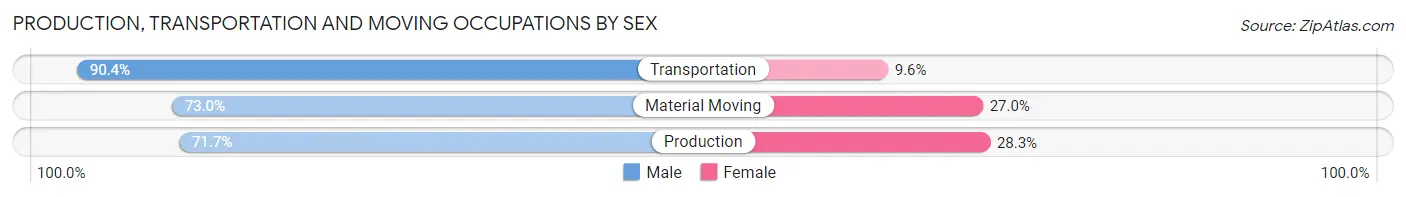
| Occupation | Male | Female |
| Production | 2,586 (71.7%) | 1,022 (28.3%) |
| Transportation | 3,000 (90.4%) | 318 (9.6%) |
| Material Moving | 1,755 (73.0%) | 649 (27.0%) |
| Total (Category) | 7,341 (78.7%) | 1,989 (21.3%) |
| Total (Overall) | 39,390 (53.1%) | 34,814 (46.9%) |
Employment Industries by Sex in Mesa County
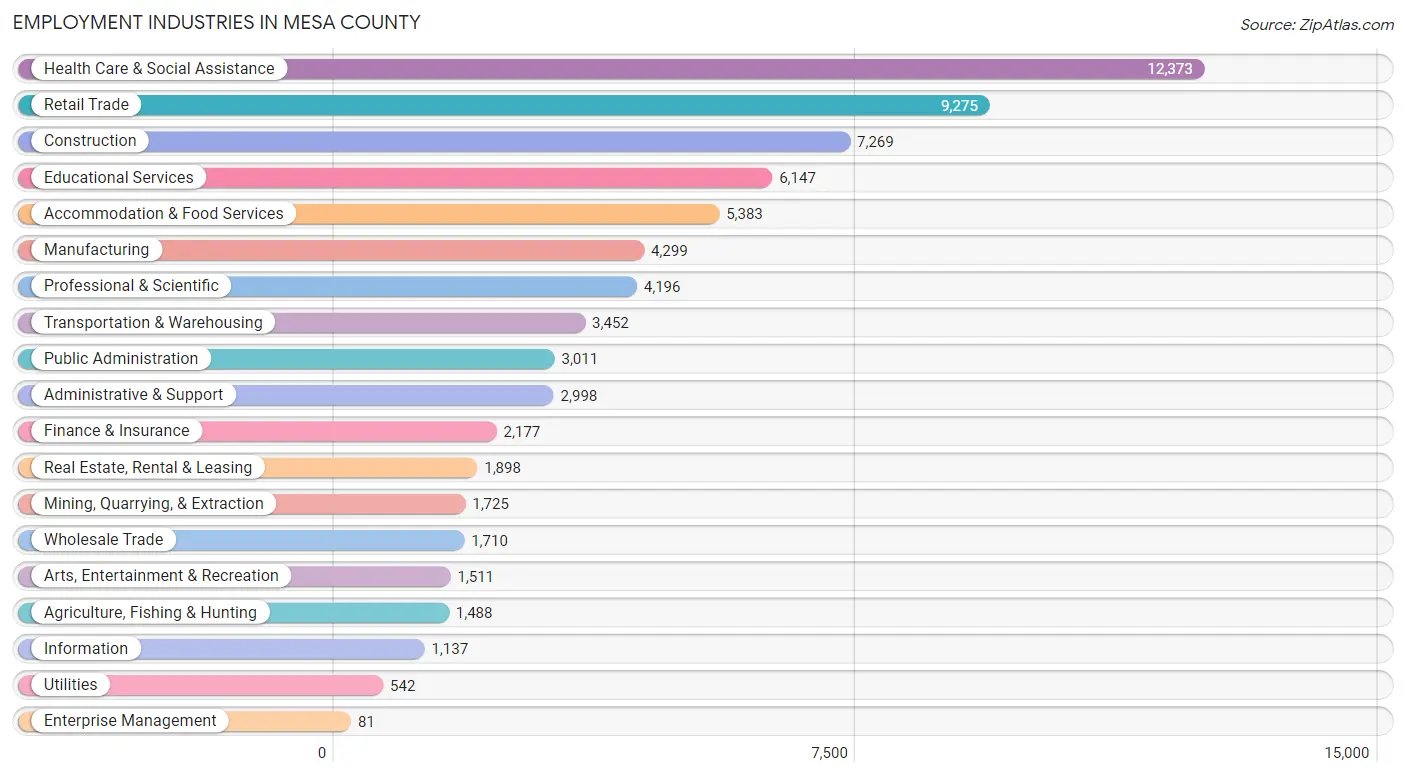
Employment Industries in Mesa County
The major employment industries in Mesa County include Health Care & Social Assistance (12,373 | 16.7%), Retail Trade (9,275 | 12.5%), Construction (7,269 | 9.8%), Educational Services (6,147 | 8.3%), and Accommodation & Food Services (5,383 | 7.2%).
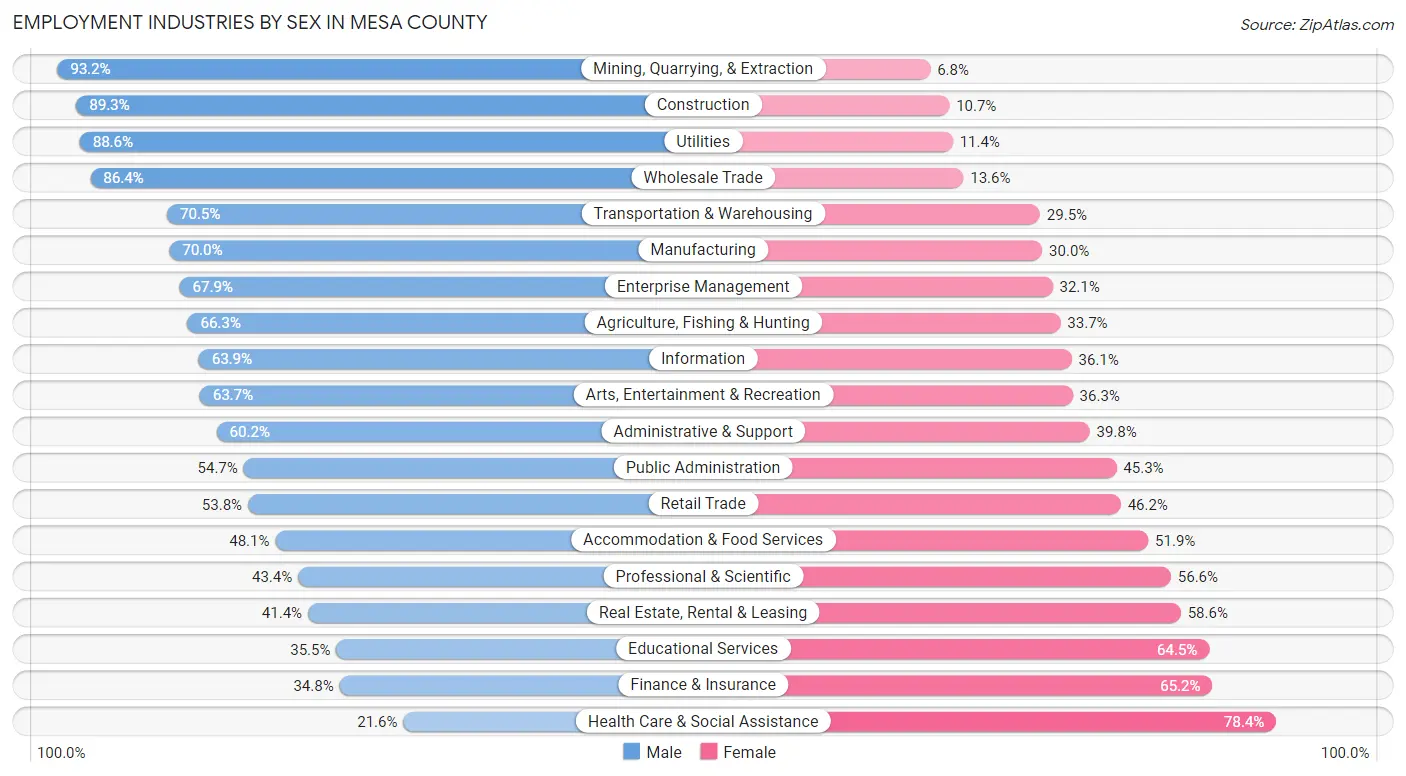
Employment Industries by Sex in Mesa County
The Mesa County industries that see more men than women are Mining, Quarrying, & Extraction (93.2%), Construction (89.3%), and Utilities (88.6%), whereas the industries that tend to have a higher number of women are Health Care & Social Assistance (78.4%), Finance & Insurance (65.2%), and Educational Services (64.5%).
| Industry | Male | Female |
| Agriculture, Fishing & Hunting | 986 (66.3%) | 502 (33.7%) |
| Mining, Quarrying, & Extraction | 1,608 (93.2%) | 117 (6.8%) |
| Construction | 6,490 (89.3%) | 779 (10.7%) |
| Manufacturing | 3,011 (70.0%) | 1,288 (30.0%) |
| Wholesale Trade | 1,477 (86.4%) | 233 (13.6%) |
| Retail Trade | 4,988 (53.8%) | 4,287 (46.2%) |
| Transportation & Warehousing | 2,434 (70.5%) | 1,018 (29.5%) |
| Utilities | 480 (88.6%) | 62 (11.4%) |
| Information | 727 (63.9%) | 410 (36.1%) |
| Finance & Insurance | 758 (34.8%) | 1,419 (65.2%) |
| Real Estate, Rental & Leasing | 785 (41.4%) | 1,113 (58.6%) |
| Professional & Scientific | 1,821 (43.4%) | 2,375 (56.6%) |
| Enterprise Management | 55 (67.9%) | 26 (32.1%) |
| Administrative & Support | 1,806 (60.2%) | 1,192 (39.8%) |
| Educational Services | 2,181 (35.5%) | 3,966 (64.5%) |
| Health Care & Social Assistance | 2,674 (21.6%) | 9,699 (78.4%) |
| Arts, Entertainment & Recreation | 963 (63.7%) | 548 (36.3%) |
| Accommodation & Food Services | 2,589 (48.1%) | 2,794 (51.9%) |
| Public Administration | 1,646 (54.7%) | 1,365 (45.3%) |
| Total | 39,390 (53.1%) | 34,814 (46.9%) |
Education in Mesa County
School Enrollment in Mesa County
The most common levels of schooling among the 35,734 students in Mesa County are college / undergraduate (8,292 | 23.2%), elementary school (8,222 | 23.0%), and high school (7,978 | 22.3%).
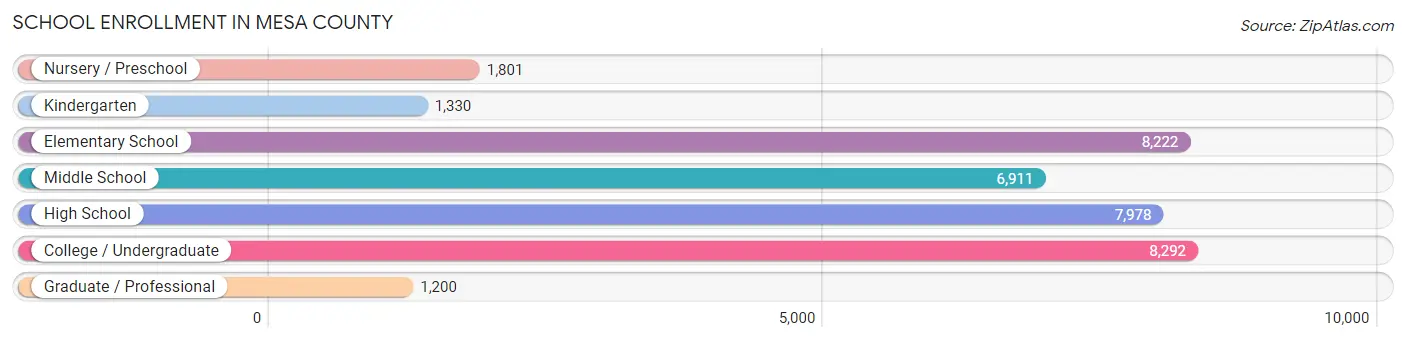
| School Level | # Students | % Students |
| Nursery / Preschool | 1,801 | 5.0% |
| Kindergarten | 1,330 | 3.7% |
| Elementary School | 8,222 | 23.0% |
| Middle School | 6,911 | 19.3% |
| High School | 7,978 | 22.3% |
| College / Undergraduate | 8,292 | 23.2% |
| Graduate / Professional | 1,200 | 3.4% |
| Total | 35,734 | 100.0% |
School Enrollment by Age by Funding Source in Mesa County
Out of a total of 35,734 students who are enrolled in schools in Mesa County, 4,753 (13.3%) attend a private institution, while the remaining 30,981 (86.7%) are enrolled in public schools. The age group of 3 to 4 year olds has the highest likelihood of being enrolled in private schools, with 489 (35.8% in the age bracket) enrolled. Conversely, the age group of 15 to 17 year olds has the lowest likelihood of being enrolled in a private school, with 5,399 (95.4% in the age bracket) attending a public institution.
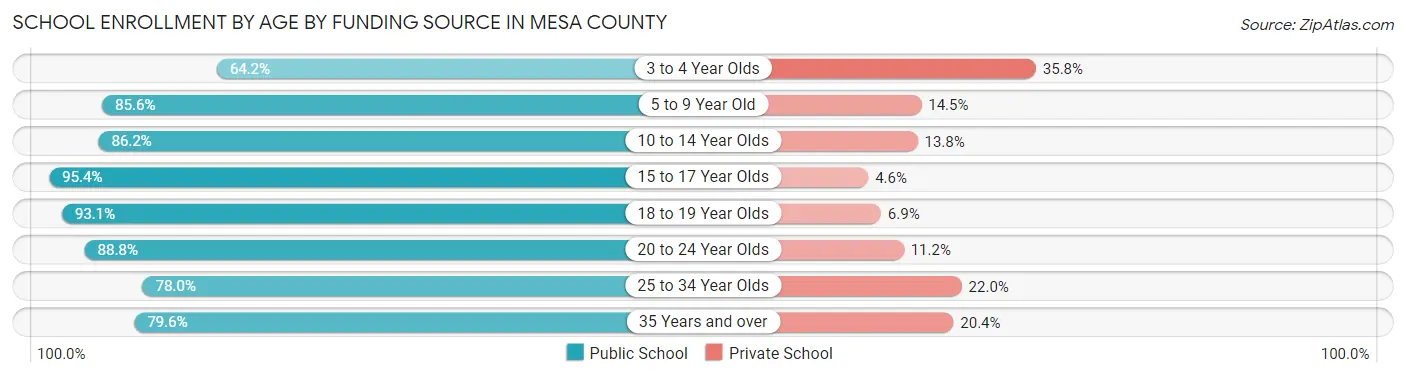
| Age Bracket | Public School | Private School |
| 3 to 4 Year Olds | 877 (64.2%) | 489 (35.8%) |
| 5 to 9 Year Old | 7,696 (85.6%) | 1,300 (14.4%) |
| 10 to 14 Year Olds | 7,817 (86.2%) | 1,247 (13.8%) |
| 15 to 17 Year Olds | 5,399 (95.4%) | 259 (4.6%) |
| 18 to 19 Year Olds | 2,908 (93.1%) | 217 (6.9%) |
| 20 to 24 Year Olds | 3,033 (88.8%) | 382 (11.2%) |
| 25 to 34 Year Olds | 1,725 (78.0%) | 486 (22.0%) |
| 35 Years and over | 1,511 (79.6%) | 388 (20.4%) |
| Total | 30,981 (86.7%) | 4,753 (13.3%) |
Educational Attainment by Field of Study in Mesa County
Business (6,468 | 18.0%), science & technology (4,186 | 11.7%), education (4,081 | 11.4%), bio, nature & agricultural (3,251 | 9.1%), and arts & humanities (2,792 | 7.8%) are the most common fields of study among 35,838 individuals in Mesa County who have obtained a bachelor's degree or higher.
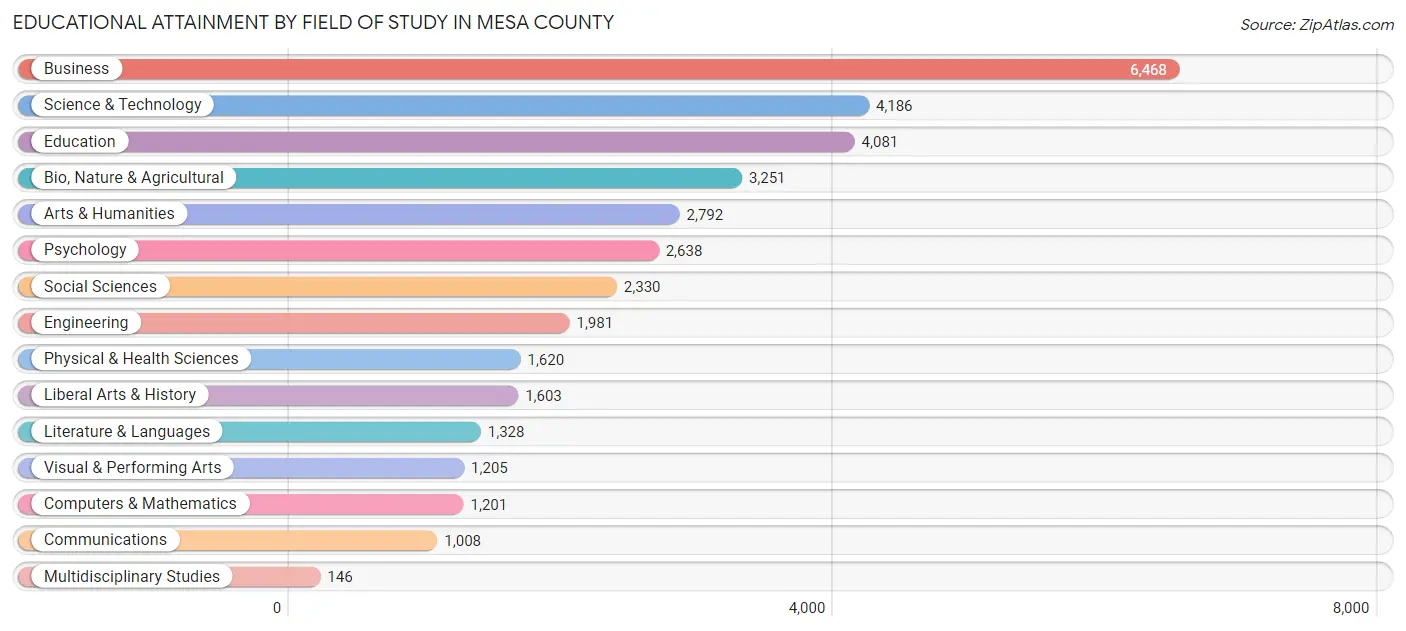
| Field of Study | # Graduates | % Graduates |
| Computers & Mathematics | 1,201 | 3.4% |
| Bio, Nature & Agricultural | 3,251 | 9.1% |
| Physical & Health Sciences | 1,620 | 4.5% |
| Psychology | 2,638 | 7.4% |
| Social Sciences | 2,330 | 6.5% |
| Engineering | 1,981 | 5.5% |
| Multidisciplinary Studies | 146 | 0.4% |
| Science & Technology | 4,186 | 11.7% |
| Business | 6,468 | 18.0% |
| Education | 4,081 | 11.4% |
| Literature & Languages | 1,328 | 3.7% |
| Liberal Arts & History | 1,603 | 4.5% |
| Visual & Performing Arts | 1,205 | 3.4% |
| Communications | 1,008 | 2.8% |
| Arts & Humanities | 2,792 | 7.8% |
| Total | 35,838 | 100.0% |
Transportation & Commute in Mesa County
Vehicle Availability by Sex in Mesa County
The most prevalent vehicle ownership categories in Mesa County are males with 2 vehicles (15,540, accounting for 40.6%) and females with 2 vehicles (13,404, making up 46.6%).
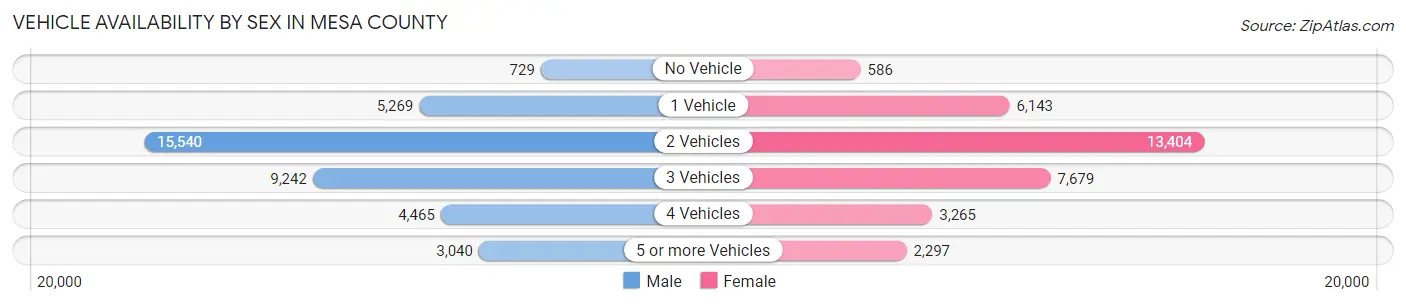
| Vehicles Available | Male | Female |
| No Vehicle | 729 (1.9%) | 586 (1.8%) |
| 1 Vehicle | 5,269 (13.8%) | 6,143 (18.4%) |
| 2 Vehicles | 15,540 (40.6%) | 13,404 (40.2%) |
| 3 Vehicles | 9,242 (24.1%) | 7,679 (23.0%) |
| 4 Vehicles | 4,465 (11.7%) | 3,265 (9.8%) |
| 5 or more Vehicles | 3,040 (7.9%) | 2,297 (6.9%) |
| Total | 38,285 (100.0%) | 33,374 (100.0%) |
Commute Time in Mesa County
The most frequently occuring commute durations in Mesa County are 15 to 19 minutes (15,564 commuters, 24.3%), 10 to 14 minutes (14,416 commuters, 22.5%), and 20 to 24 minutes (11,480 commuters, 17.9%).
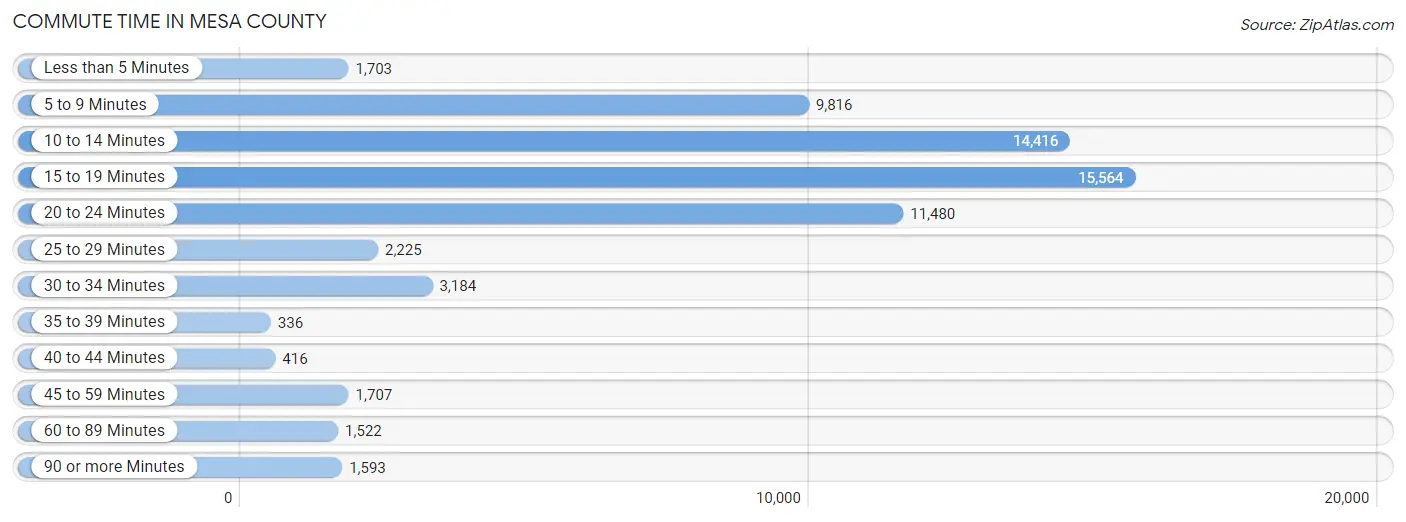
| Commute Time | # Commuters | % Commuters |
| Less than 5 Minutes | 1,703 | 2.7% |
| 5 to 9 Minutes | 9,816 | 15.3% |
| 10 to 14 Minutes | 14,416 | 22.5% |
| 15 to 19 Minutes | 15,564 | 24.3% |
| 20 to 24 Minutes | 11,480 | 17.9% |
| 25 to 29 Minutes | 2,225 | 3.5% |
| 30 to 34 Minutes | 3,184 | 5.0% |
| 35 to 39 Minutes | 336 | 0.5% |
| 40 to 44 Minutes | 416 | 0.6% |
| 45 to 59 Minutes | 1,707 | 2.7% |
| 60 to 89 Minutes | 1,522 | 2.4% |
| 90 or more Minutes | 1,593 | 2.5% |
Commute Time by Sex in Mesa County
The most common commute times in Mesa County are 15 to 19 minutes (8,038 commuters, 23.7%) for males and 15 to 19 minutes (7,526 commuters, 25.0%) for females.
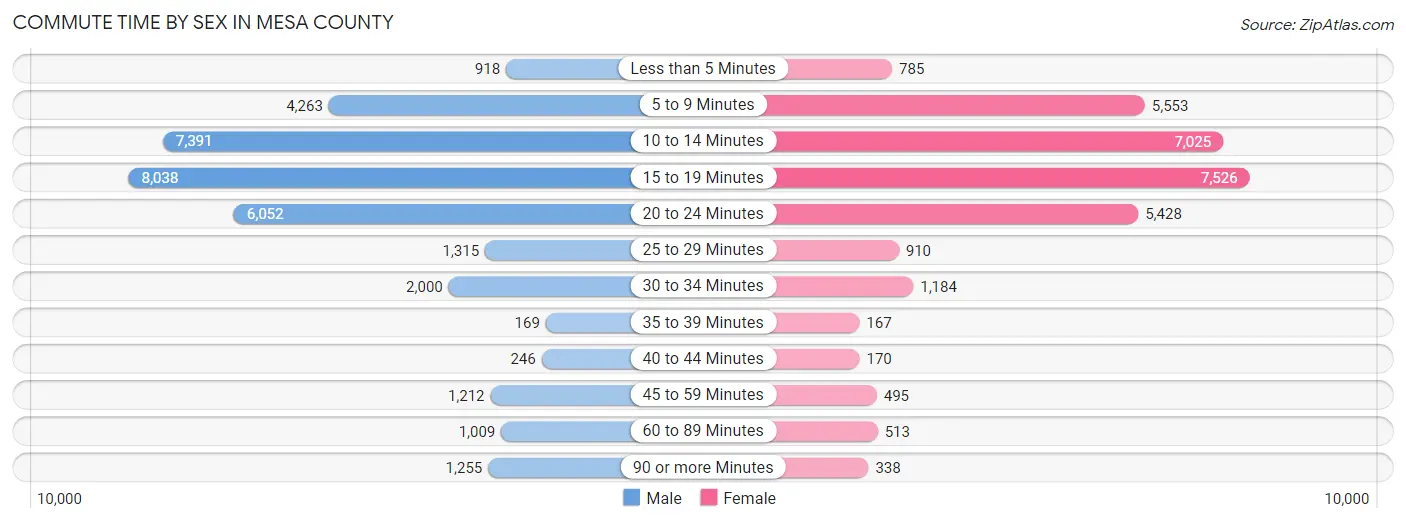
| Commute Time | Male | Female |
| Less than 5 Minutes | 918 (2.7%) | 785 (2.6%) |
| 5 to 9 Minutes | 4,263 (12.6%) | 5,553 (18.4%) |
| 10 to 14 Minutes | 7,391 (21.8%) | 7,025 (23.3%) |
| 15 to 19 Minutes | 8,038 (23.7%) | 7,526 (25.0%) |
| 20 to 24 Minutes | 6,052 (17.9%) | 5,428 (18.0%) |
| 25 to 29 Minutes | 1,315 (3.9%) | 910 (3.0%) |
| 30 to 34 Minutes | 2,000 (5.9%) | 1,184 (3.9%) |
| 35 to 39 Minutes | 169 (0.5%) | 167 (0.5%) |
| 40 to 44 Minutes | 246 (0.7%) | 170 (0.6%) |
| 45 to 59 Minutes | 1,212 (3.6%) | 495 (1.6%) |
| 60 to 89 Minutes | 1,009 (3.0%) | 513 (1.7%) |
| 90 or more Minutes | 1,255 (3.7%) | 338 (1.1%) |
Time of Departure to Work by Sex in Mesa County
The most frequent times of departure to work in Mesa County are 7:00 AM to 7:29 AM (4,870, 14.4%) for males and 7:30 AM to 7:59 AM (6,409, 21.3%) for females.
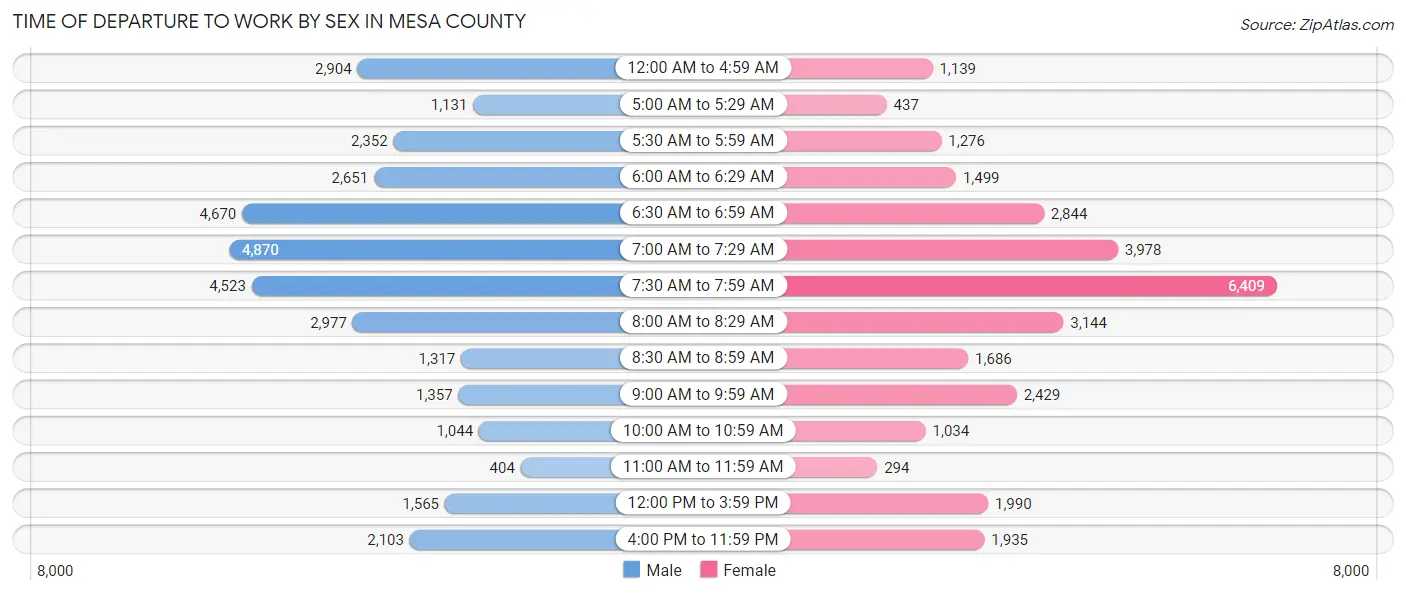
| Time of Departure | Male | Female |
| 12:00 AM to 4:59 AM | 2,904 (8.6%) | 1,139 (3.8%) |
| 5:00 AM to 5:29 AM | 1,131 (3.3%) | 437 (1.5%) |
| 5:30 AM to 5:59 AM | 2,352 (6.9%) | 1,276 (4.2%) |
| 6:00 AM to 6:29 AM | 2,651 (7.8%) | 1,499 (5.0%) |
| 6:30 AM to 6:59 AM | 4,670 (13.8%) | 2,844 (9.5%) |
| 7:00 AM to 7:29 AM | 4,870 (14.4%) | 3,978 (13.2%) |
| 7:30 AM to 7:59 AM | 4,523 (13.4%) | 6,409 (21.3%) |
| 8:00 AM to 8:29 AM | 2,977 (8.8%) | 3,144 (10.4%) |
| 8:30 AM to 8:59 AM | 1,317 (3.9%) | 1,686 (5.6%) |
| 9:00 AM to 9:59 AM | 1,357 (4.0%) | 2,429 (8.1%) |
| 10:00 AM to 10:59 AM | 1,044 (3.1%) | 1,034 (3.4%) |
| 11:00 AM to 11:59 AM | 404 (1.2%) | 294 (1.0%) |
| 12:00 PM to 3:59 PM | 1,565 (4.6%) | 1,990 (6.6%) |
| 4:00 PM to 11:59 PM | 2,103 (6.2%) | 1,935 (6.4%) |
| Total | 33,868 (100.0%) | 30,094 (100.0%) |
Housing Occupancy in Mesa County
Occupancy by Ownership in Mesa County
Of the total 63,098 dwellings in Mesa County, owner-occupied units account for 45,317 (71.8%), while renter-occupied units make up 17,781 (28.2%).
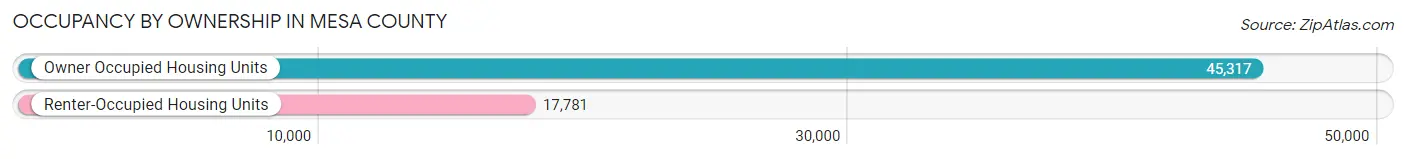
| Occupancy | # Housing Units | % Housing Units |
| Owner Occupied Housing Units | 45,317 | 71.8% |
| Renter-Occupied Housing Units | 17,781 | 28.2% |
| Total Occupied Housing Units | 63,098 | 100.0% |
Occupancy by Household Size in Mesa County
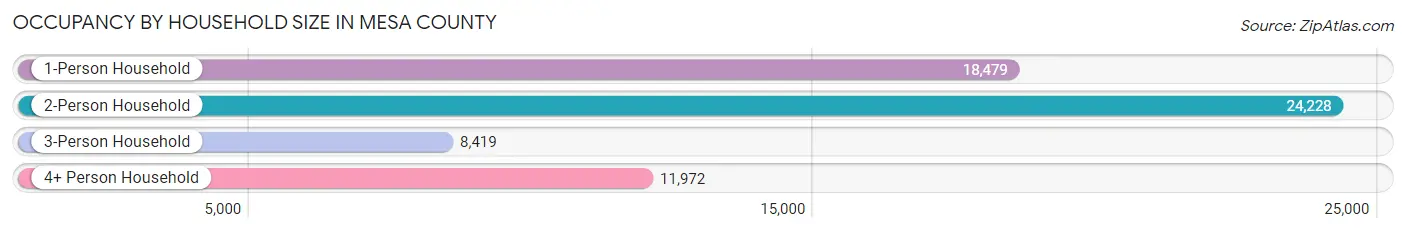
| Household Size | # Housing Units | % Housing Units |
| 1-Person Household | 18,479 | 29.3% |
| 2-Person Household | 24,228 | 38.4% |
| 3-Person Household | 8,419 | 13.3% |
| 4+ Person Household | 11,972 | 19.0% |
| Total Housing Units | 63,098 | 100.0% |
Occupancy by Ownership by Household Size in Mesa County
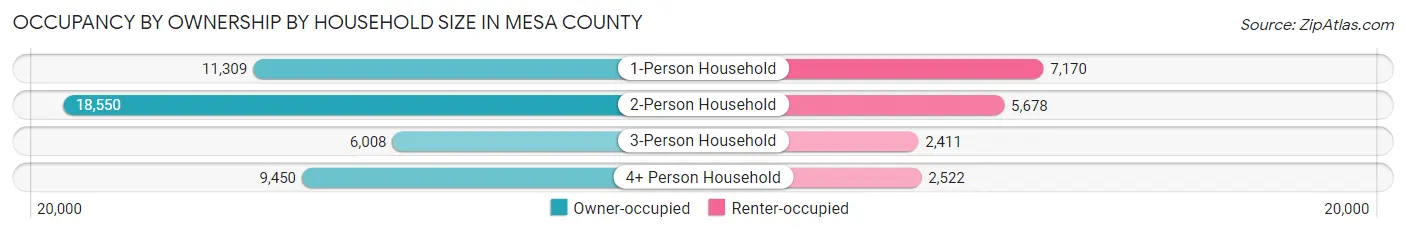
| Household Size | Owner-occupied | Renter-occupied |
| 1-Person Household | 11,309 (61.2%) | 7,170 (38.8%) |
| 2-Person Household | 18,550 (76.6%) | 5,678 (23.4%) |
| 3-Person Household | 6,008 (71.4%) | 2,411 (28.6%) |
| 4+ Person Household | 9,450 (78.9%) | 2,522 (21.1%) |
| Total Housing Units | 45,317 (71.8%) | 17,781 (28.2%) |
Occupancy by Educational Attainment in Mesa County
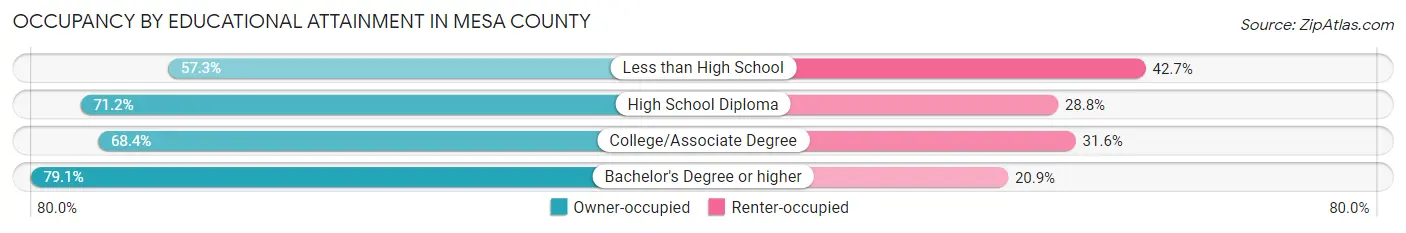
| Household Size | Owner-occupied | Renter-occupied |
| Less than High School | 2,344 (57.3%) | 1,749 (42.7%) |
| High School Diploma | 11,768 (71.2%) | 4,766 (28.8%) |
| College/Associate Degree | 15,203 (68.4%) | 7,037 (31.6%) |
| Bachelor's Degree or higher | 16,002 (79.1%) | 4,229 (20.9%) |
Occupancy by Age of Householder in Mesa County
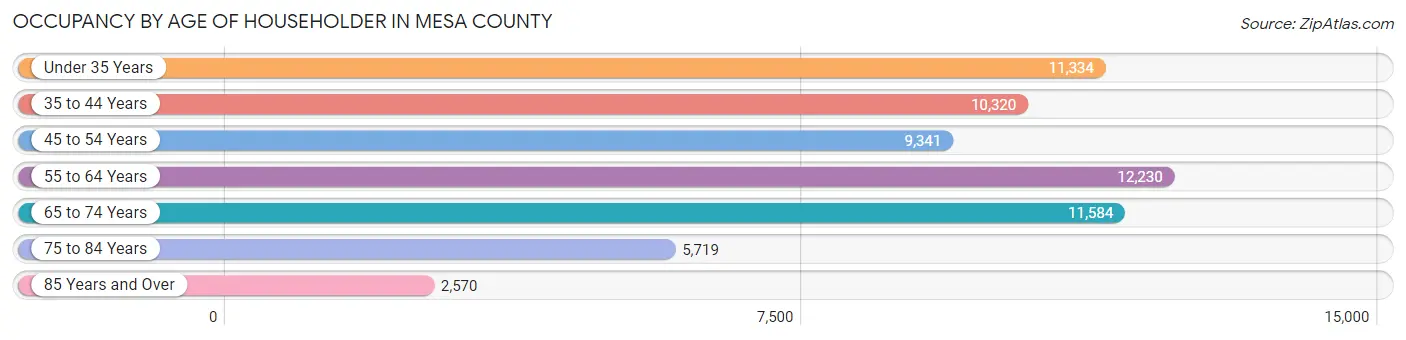
| Age Bracket | # Households | % Households |
| Under 35 Years | 11,334 | 18.0% |
| 35 to 44 Years | 10,320 | 16.4% |
| 45 to 54 Years | 9,341 | 14.8% |
| 55 to 64 Years | 12,230 | 19.4% |
| 65 to 74 Years | 11,584 | 18.4% |
| 75 to 84 Years | 5,719 | 9.1% |
| 85 Years and Over | 2,570 | 4.1% |
| Total | 63,098 | 100.0% |
Housing Finances in Mesa County
Median Income by Occupancy in Mesa County
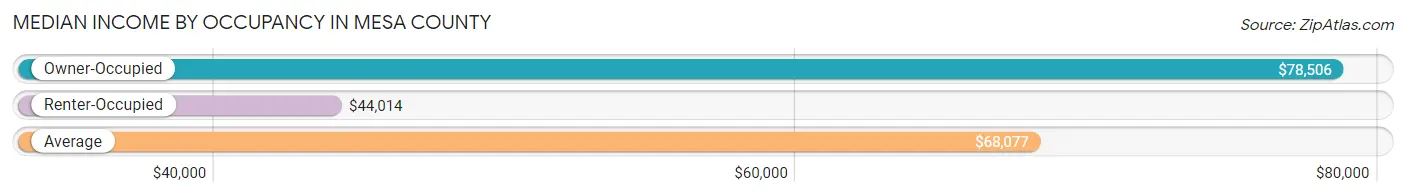
| Occupancy Type | # Households | Median Income |
| Owner-Occupied | 45,317 (71.8%) | $78,506 |
| Renter-Occupied | 17,781 (28.2%) | $44,014 |
| Average | 63,098 (100.0%) | $68,077 |
Occupancy by Householder Income Bracket in Mesa County
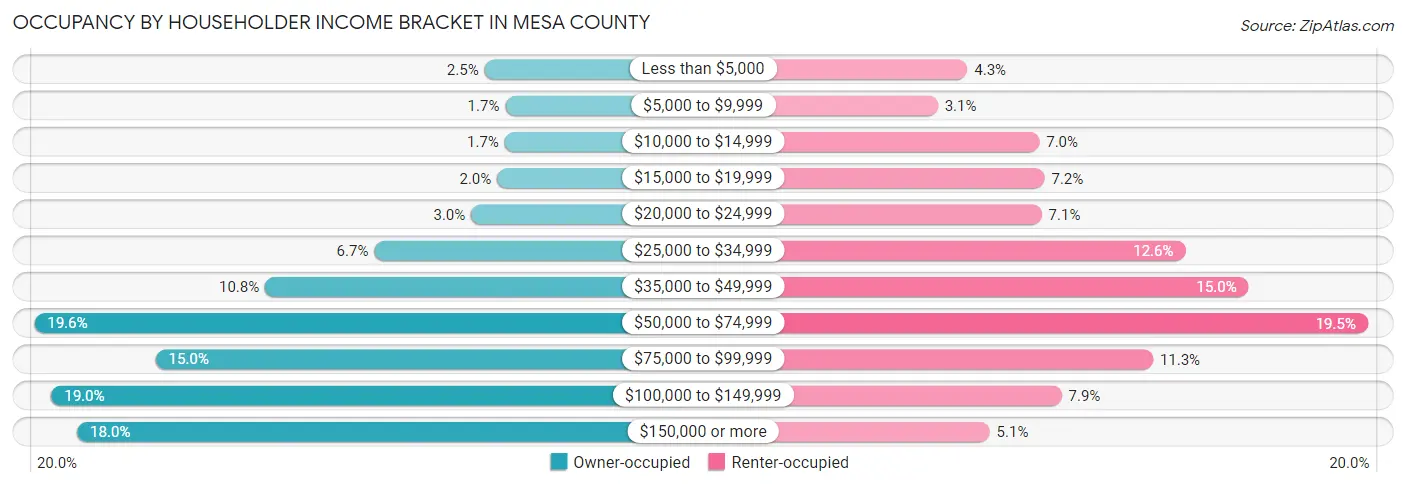
| Income Bracket | Owner-occupied | Renter-occupied |
| Less than $5,000 | 1,124 (2.5%) | 757 (4.3%) |
| $5,000 to $9,999 | 764 (1.7%) | 557 (3.1%) |
| $10,000 to $14,999 | 774 (1.7%) | 1,244 (7.0%) |
| $15,000 to $19,999 | 905 (2.0%) | 1,280 (7.2%) |
| $20,000 to $24,999 | 1,357 (3.0%) | 1,261 (7.1%) |
| $25,000 to $34,999 | 3,025 (6.7%) | 2,234 (12.6%) |
| $35,000 to $49,999 | 4,912 (10.8%) | 2,661 (15.0%) |
| $50,000 to $74,999 | 8,895 (19.6%) | 3,469 (19.5%) |
| $75,000 to $99,999 | 6,803 (15.0%) | 2,015 (11.3%) |
| $100,000 to $149,999 | 8,600 (19.0%) | 1,395 (7.9%) |
| $150,000 or more | 8,158 (18.0%) | 908 (5.1%) |
| Total | 45,317 (100.0%) | 17,781 (100.0%) |
Monthly Housing Cost Tiers in Mesa County
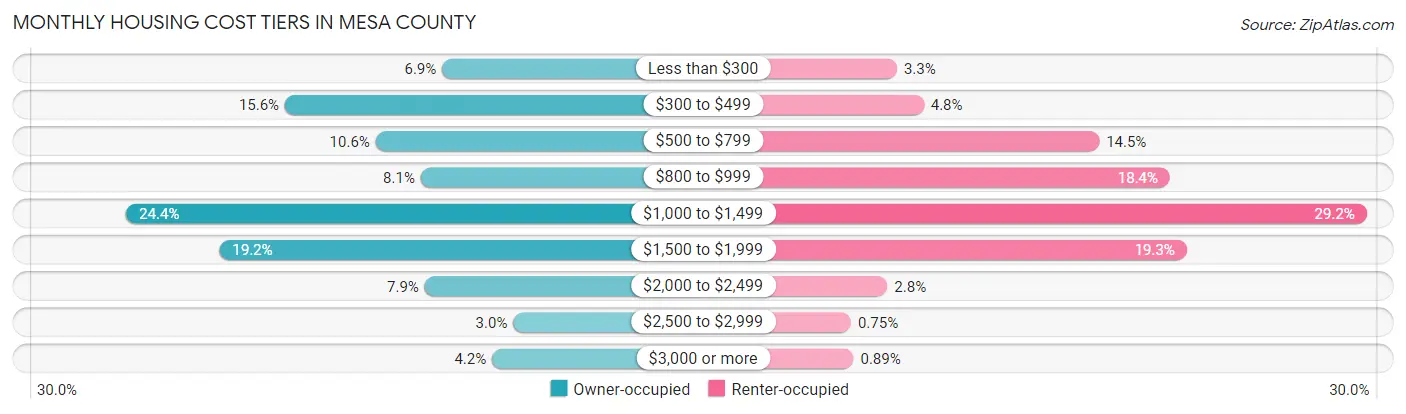
| Monthly Cost | Owner-occupied | Renter-occupied |
| Less than $300 | 3,144 (6.9%) | 585 (3.3%) |
| $300 to $499 | 7,077 (15.6%) | 849 (4.8%) |
| $500 to $799 | 4,806 (10.6%) | 2,571 (14.5%) |
| $800 to $999 | 3,680 (8.1%) | 3,264 (18.4%) |
| $1,000 to $1,499 | 11,051 (24.4%) | 5,197 (29.2%) |
| $1,500 to $1,999 | 8,719 (19.2%) | 3,430 (19.3%) |
| $2,000 to $2,499 | 3,581 (7.9%) | 491 (2.8%) |
| $2,500 to $2,999 | 1,366 (3.0%) | 133 (0.7%) |
| $3,000 or more | 1,893 (4.2%) | 159 (0.9%) |
| Total | 45,317 (100.0%) | 17,781 (100.0%) |
Physical Housing Characteristics in Mesa County
Housing Structures in Mesa County
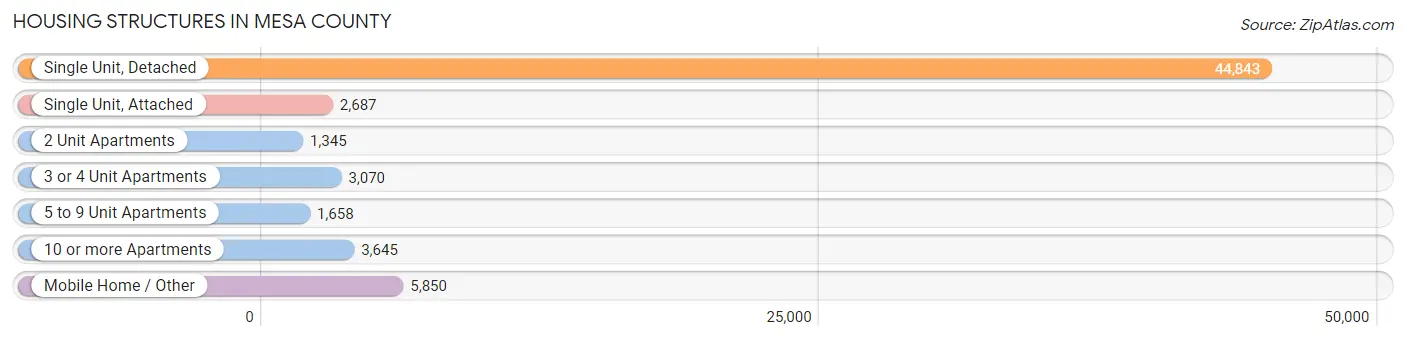
| Structure Type | # Housing Units | % Housing Units |
| Single Unit, Detached | 44,843 | 71.1% |
| Single Unit, Attached | 2,687 | 4.3% |
| 2 Unit Apartments | 1,345 | 2.1% |
| 3 or 4 Unit Apartments | 3,070 | 4.9% |
| 5 to 9 Unit Apartments | 1,658 | 2.6% |
| 10 or more Apartments | 3,645 | 5.8% |
| Mobile Home / Other | 5,850 | 9.3% |
| Total | 63,098 | 100.0% |
Housing Structures by Occupancy in Mesa County
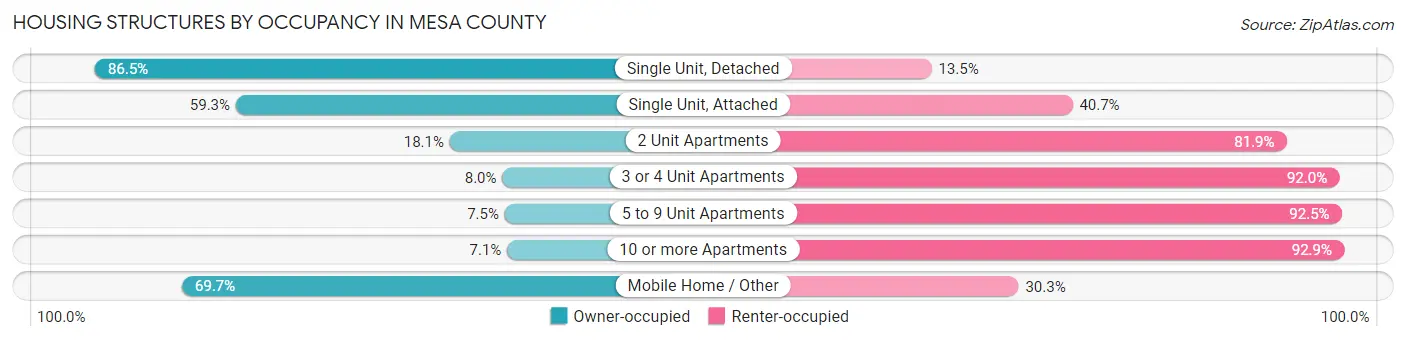
| Structure Type | Owner-occupied | Renter-occupied |
| Single Unit, Detached | 38,772 (86.5%) | 6,071 (13.5%) |
| Single Unit, Attached | 1,594 (59.3%) | 1,093 (40.7%) |
| 2 Unit Apartments | 244 (18.1%) | 1,101 (81.9%) |
| 3 or 4 Unit Apartments | 246 (8.0%) | 2,824 (92.0%) |
| 5 to 9 Unit Apartments | 125 (7.5%) | 1,533 (92.5%) |
| 10 or more Apartments | 258 (7.1%) | 3,387 (92.9%) |
| Mobile Home / Other | 4,078 (69.7%) | 1,772 (30.3%) |
| Total | 45,317 (71.8%) | 17,781 (28.2%) |
Housing Structures by Number of Rooms in Mesa County
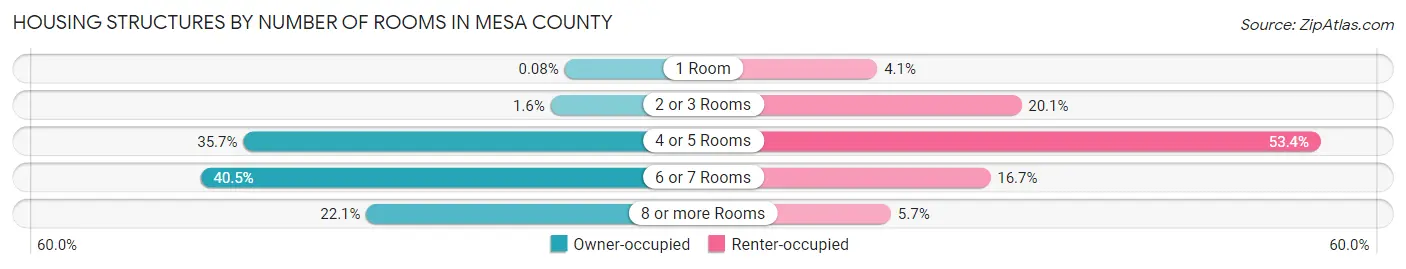
| Number of Rooms | Owner-occupied | Renter-occupied |
| 1 Room | 38 (0.1%) | 737 (4.1%) |
| 2 or 3 Rooms | 739 (1.6%) | 3,580 (20.1%) |
| 4 or 5 Rooms | 16,193 (35.7%) | 9,490 (53.4%) |
| 6 or 7 Rooms | 18,344 (40.5%) | 2,967 (16.7%) |
| 8 or more Rooms | 10,003 (22.1%) | 1,007 (5.7%) |
| Total | 45,317 (100.0%) | 17,781 (100.0%) |
Housing Structure by Heating Type in Mesa County
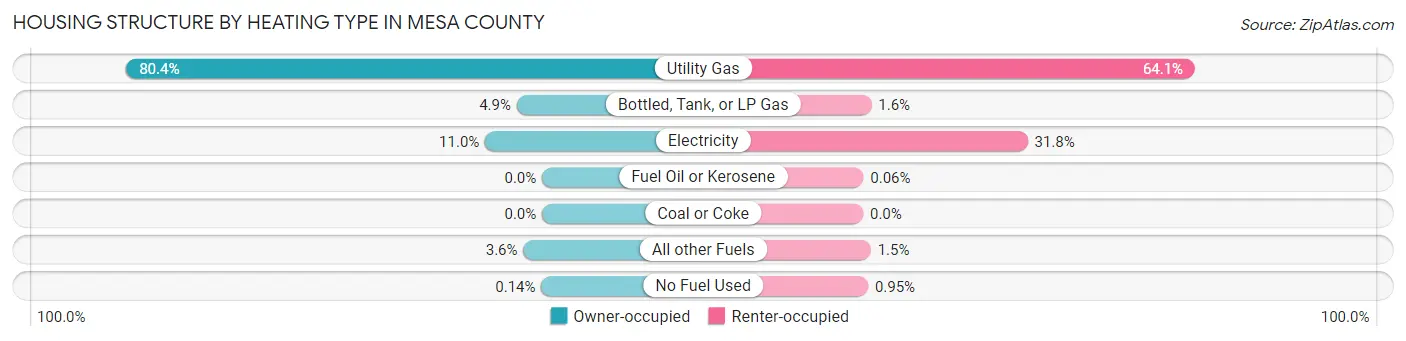
| Heating Type | Owner-occupied | Renter-occupied |
| Utility Gas | 36,413 (80.3%) | 11,403 (64.1%) |
| Bottled, Tank, or LP Gas | 2,215 (4.9%) | 285 (1.6%) |
| Electricity | 4,984 (11.0%) | 5,650 (31.8%) |
| Fuel Oil or Kerosene | 0 (0.0%) | 11 (0.1%) |
| Coal or Coke | 0 (0.0%) | 0 (0.0%) |
| All other Fuels | 1,642 (3.6%) | 263 (1.5%) |
| No Fuel Used | 63 (0.1%) | 169 (0.9%) |
| Total | 45,317 (100.0%) | 17,781 (100.0%) |
Household Vehicle Usage in Mesa County
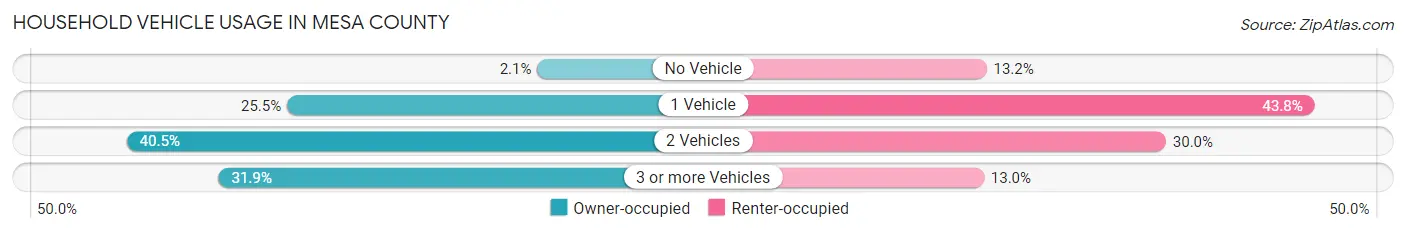
| Vehicles per Household | Owner-occupied | Renter-occupied |
| No Vehicle | 968 (2.1%) | 2,351 (13.2%) |
| 1 Vehicle | 11,557 (25.5%) | 7,796 (43.8%) |
| 2 Vehicles | 18,342 (40.5%) | 5,328 (30.0%) |
| 3 or more Vehicles | 14,450 (31.9%) | 2,306 (13.0%) |
| Total | 45,317 (100.0%) | 17,781 (100.0%) |
Real Estate & Mortgages in Mesa County
Real Estate and Mortgage Overview in Mesa County
| Characteristic | Without Mortgage | With Mortgage |
| Housing Units | 14,454 | 30,863 |
| Median Property Value | $320,500 | $309,700 |
| Median Household Income | $57,714 | $6,466 |
| Monthly Housing Costs | $406 | $1,870 |
| Real Estate Taxes | $1,178 | $486 |
Property Value by Mortgage Status in Mesa County
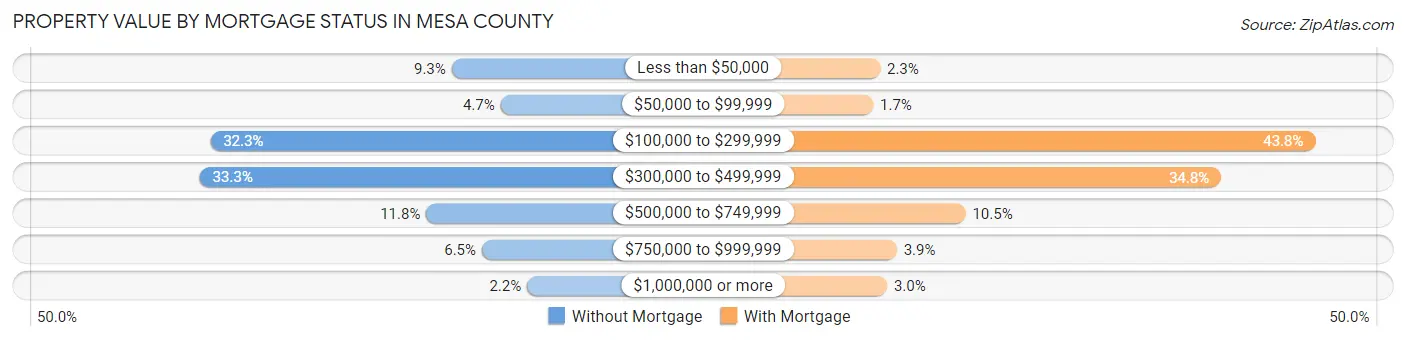
| Property Value | Without Mortgage | With Mortgage |
| Less than $50,000 | 1,348 (9.3%) | 720 (2.3%) |
| $50,000 to $99,999 | 675 (4.7%) | 516 (1.7%) |
| $100,000 to $299,999 | 4,671 (32.3%) | 13,515 (43.8%) |
| $300,000 to $499,999 | 4,819 (33.3%) | 10,748 (34.8%) |
| $500,000 to $749,999 | 1,698 (11.7%) | 3,232 (10.5%) |
| $750,000 to $999,999 | 932 (6.5%) | 1,209 (3.9%) |
| $1,000,000 or more | 311 (2.1%) | 923 (3.0%) |
| Total | 14,454 (100.0%) | 30,863 (100.0%) |
Household Income by Mortgage Status in Mesa County
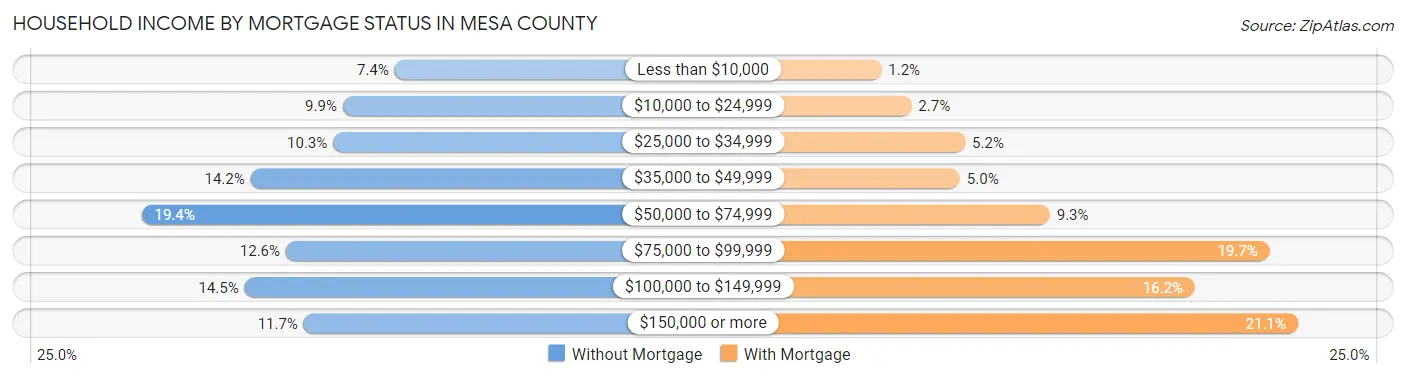
| Household Income | Without Mortgage | With Mortgage |
| Less than $10,000 | 1,067 (7.4%) | 379 (1.2%) |
| $10,000 to $24,999 | 1,424 (9.9%) | 821 (2.7%) |
| $25,000 to $34,999 | 1,490 (10.3%) | 1,612 (5.2%) |
| $35,000 to $49,999 | 2,058 (14.2%) | 1,535 (5.0%) |
| $50,000 to $74,999 | 2,808 (19.4%) | 2,854 (9.2%) |
| $75,000 to $99,999 | 1,815 (12.6%) | 6,087 (19.7%) |
| $100,000 to $149,999 | 2,100 (14.5%) | 4,988 (16.2%) |
| $150,000 or more | 1,692 (11.7%) | 6,500 (21.1%) |
| Total | 14,454 (100.0%) | 30,863 (100.0%) |
Property Value to Household Income Ratio in Mesa County
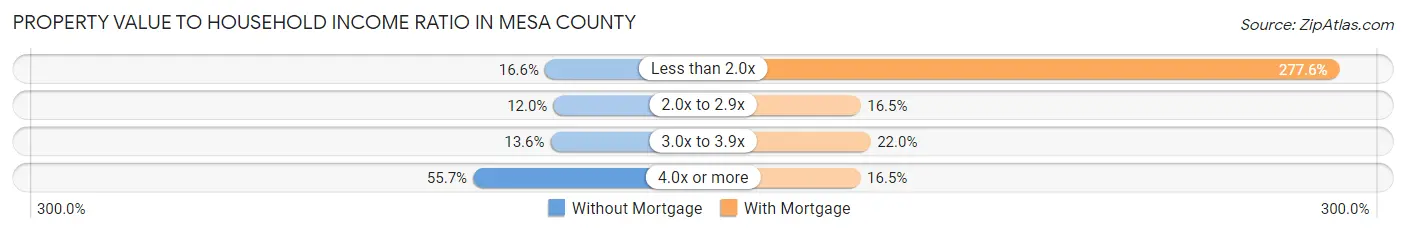
| Value-to-Income Ratio | Without Mortgage | With Mortgage |
| Less than 2.0x | 2,395 (16.6%) | 85,674 (277.6%) |
| 2.0x to 2.9x | 1,736 (12.0%) | 5,101 (16.5%) |
| 3.0x to 3.9x | 1,960 (13.6%) | 6,776 (22.0%) |
| 4.0x or more | 8,057 (55.7%) | 5,082 (16.5%) |
| Total | 14,454 (100.0%) | 30,863 (100.0%) |
Real Estate Taxes by Mortgage Status in Mesa County
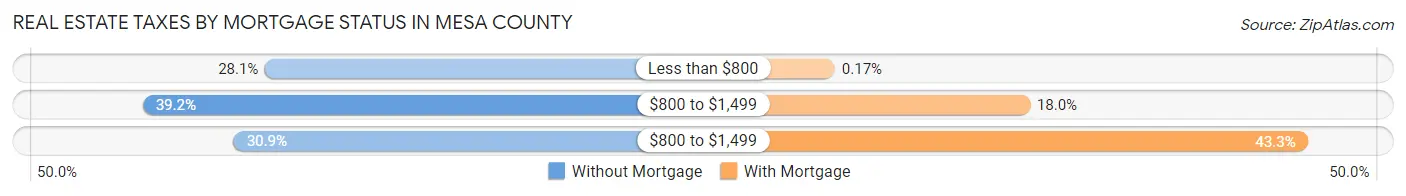
| Property Taxes | Without Mortgage | With Mortgage |
| Less than $800 | 4,064 (28.1%) | 53 (0.2%) |
| $800 to $1,499 | 5,667 (39.2%) | 5,550 (18.0%) |
| $800 to $1,499 | 4,466 (30.9%) | 13,373 (43.3%) |
| Total | 14,454 (100.0%) | 30,863 (100.0%) |
Health & Disability in Mesa County
Health Insurance Coverage by Age in Mesa County
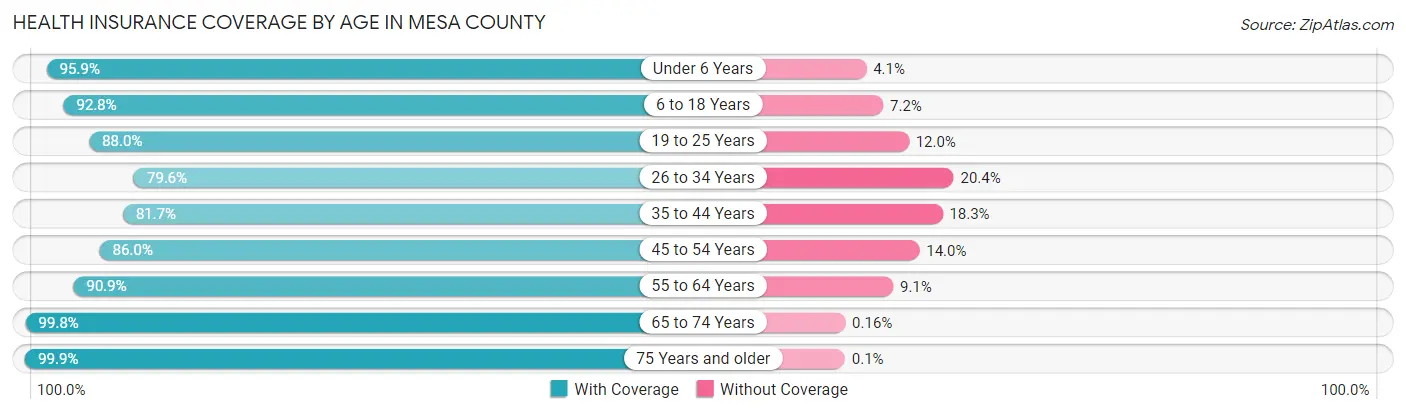
| Age Bracket | With Coverage | Without Coverage |
| Under 6 Years | 9,288 (95.9%) | 396 (4.1%) |
| 6 to 18 Years | 23,372 (92.8%) | 1,823 (7.2%) |
| 19 to 25 Years | 12,311 (88.0%) | 1,680 (12.0%) |
| 26 to 34 Years | 14,082 (79.6%) | 3,604 (20.4%) |
| 35 to 44 Years | 15,897 (81.7%) | 3,561 (18.3%) |
| 45 to 54 Years | 14,648 (86.0%) | 2,381 (14.0%) |
| 55 to 64 Years | 19,171 (90.9%) | 1,918 (9.1%) |
| 65 to 74 Years | 18,625 (99.8%) | 29 (0.2%) |
| 75 Years and older | 12,085 (99.9%) | 12 (0.1%) |
| Total | 139,479 (90.0%) | 15,404 (10.0%) |
Health Insurance Coverage by Citizenship Status in Mesa County
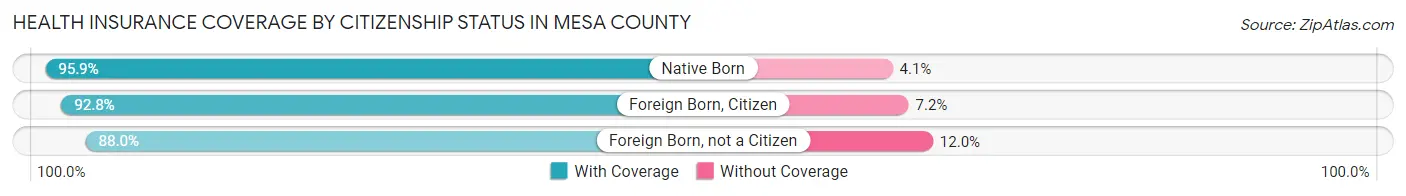
| Citizenship Status | With Coverage | Without Coverage |
| Native Born | 9,288 (95.9%) | 396 (4.1%) |
| Foreign Born, Citizen | 23,372 (92.8%) | 1,823 (7.2%) |
| Foreign Born, not a Citizen | 12,311 (88.0%) | 1,680 (12.0%) |
Health Insurance Coverage by Household Income in Mesa County
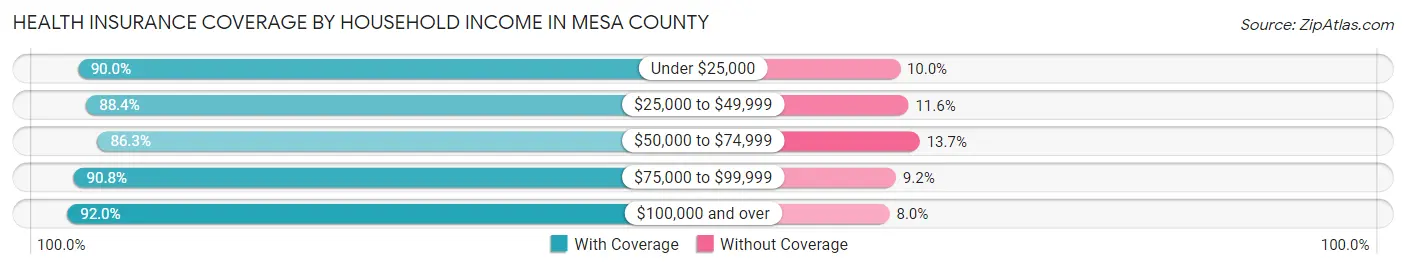
| Household Income | With Coverage | Without Coverage |
| Under $25,000 | 14,181 (90.0%) | 1,568 (10.0%) |
| $25,000 to $49,999 | 21,817 (88.4%) | 2,852 (11.6%) |
| $50,000 to $74,999 | 24,881 (86.3%) | 3,936 (13.7%) |
| $75,000 to $99,999 | 21,380 (90.8%) | 2,166 (9.2%) |
| $100,000 and over | 54,676 (92.0%) | 4,760 (8.0%) |
Public vs Private Health Insurance Coverage by Age in Mesa County
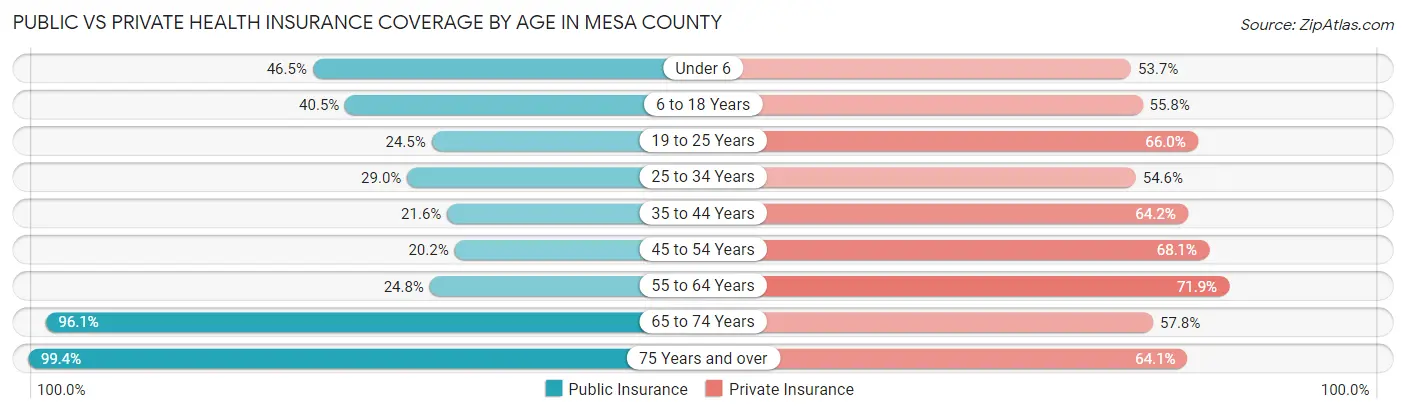
| Age Bracket | Public Insurance | Private Insurance |
| Under 6 | 4,505 (46.5%) | 5,200 (53.7%) |
| 6 to 18 Years | 10,205 (40.5%) | 14,065 (55.8%) |
| 19 to 25 Years | 3,424 (24.5%) | 9,239 (66.0%) |
| 25 to 34 Years | 5,127 (29.0%) | 9,651 (54.6%) |
| 35 to 44 Years | 4,197 (21.6%) | 12,491 (64.2%) |
| 45 to 54 Years | 3,442 (20.2%) | 11,602 (68.1%) |
| 55 to 64 Years | 5,232 (24.8%) | 15,152 (71.9%) |
| 65 to 74 Years | 17,933 (96.1%) | 10,780 (57.8%) |
| 75 Years and over | 12,024 (99.4%) | 7,759 (64.1%) |
| Total | 66,089 (42.7%) | 95,939 (61.9%) |
Disability Status by Sex by Age in Mesa County
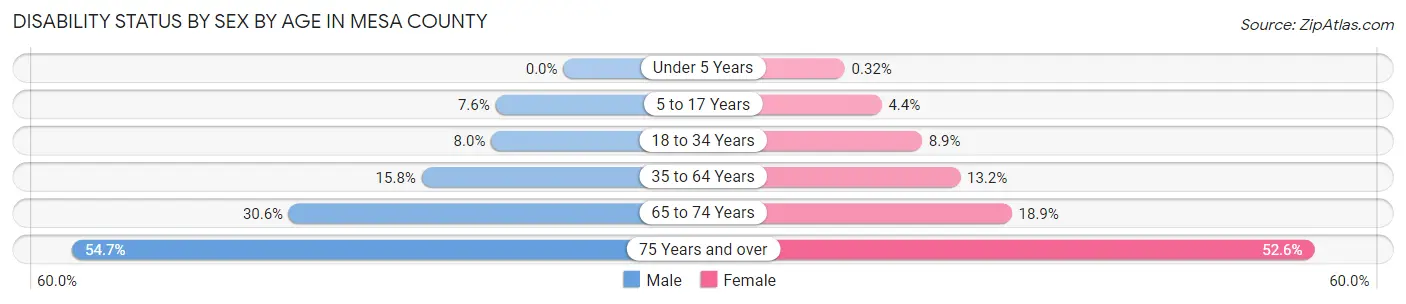
| Age Bracket | Male | Female |
| Under 5 Years | 0 (0.0%) | 13 (0.3%) |
| 5 to 17 Years | 948 (7.5%) | 529 (4.4%) |
| 18 to 34 Years | 1,397 (8.0%) | 1,465 (8.9%) |
| 35 to 64 Years | 4,489 (15.8%) | 3,837 (13.2%) |
| 65 to 74 Years | 2,745 (30.6%) | 1,829 (18.9%) |
| 75 Years and over | 2,948 (54.7%) | 3,530 (52.6%) |
Disability Class by Sex by Age in Mesa County
Disability Class: Hearing Difficulty
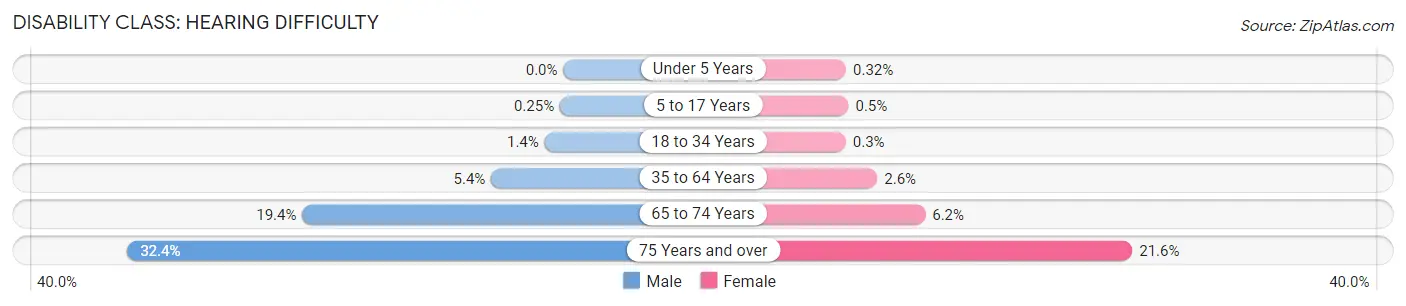
| Age Bracket | Male | Female |
| Under 5 Years | 0 (0.0%) | 13 (0.3%) |
| 5 to 17 Years | 32 (0.3%) | 60 (0.5%) |
| 18 to 34 Years | 242 (1.4%) | 50 (0.3%) |
| 35 to 64 Years | 1,525 (5.4%) | 768 (2.6%) |
| 65 to 74 Years | 1,741 (19.4%) | 600 (6.2%) |
| 75 Years and over | 1,745 (32.4%) | 1,447 (21.6%) |
Disability Class: Vision Difficulty
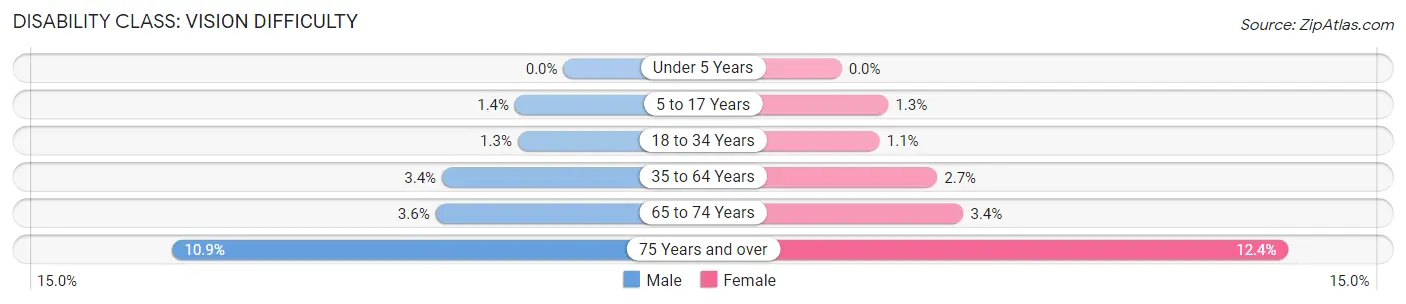
| Age Bracket | Male | Female |
| Under 5 Years | 0 (0.0%) | 0 (0.0%) |
| 5 to 17 Years | 169 (1.3%) | 156 (1.3%) |
| 18 to 34 Years | 220 (1.3%) | 175 (1.1%) |
| 35 to 64 Years | 961 (3.4%) | 776 (2.7%) |
| 65 to 74 Years | 320 (3.6%) | 328 (3.4%) |
| 75 Years and over | 588 (10.9%) | 834 (12.4%) |
Disability Class: Cognitive Difficulty
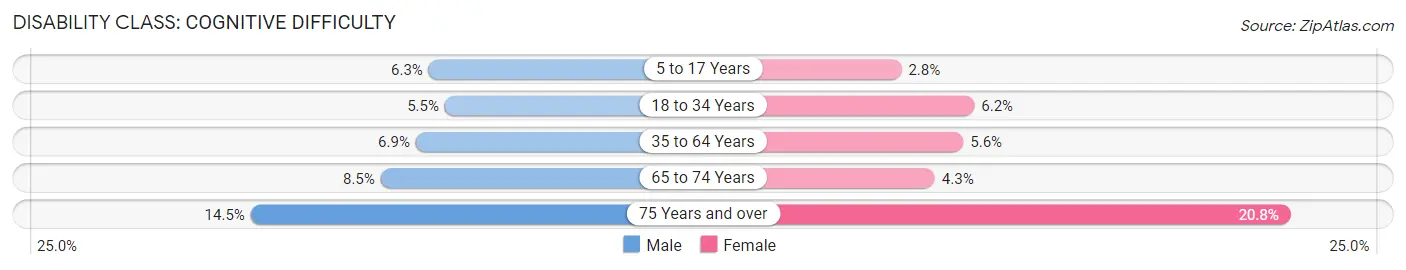
| Age Bracket | Male | Female |
| 5 to 17 Years | 784 (6.2%) | 331 (2.8%) |
| 18 to 34 Years | 956 (5.5%) | 1,012 (6.1%) |
| 35 to 64 Years | 1,950 (6.9%) | 1,642 (5.6%) |
| 65 to 74 Years | 762 (8.5%) | 418 (4.3%) |
| 75 Years and over | 782 (14.5%) | 1,397 (20.8%) |
Disability Class: Ambulatory Difficulty
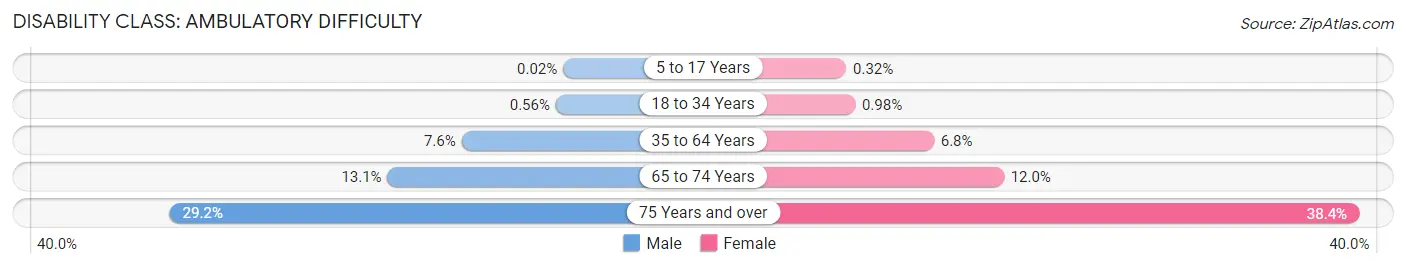
| Age Bracket | Male | Female |
| 5 to 17 Years | 3 (0.0%) | 38 (0.3%) |
| 18 to 34 Years | 97 (0.6%) | 162 (1.0%) |
| 35 to 64 Years | 2,150 (7.6%) | 1,989 (6.8%) |
| 65 to 74 Years | 1,173 (13.1%) | 1,162 (12.0%) |
| 75 Years and over | 1,575 (29.2%) | 2,575 (38.4%) |
Disability Class: Self-Care Difficulty
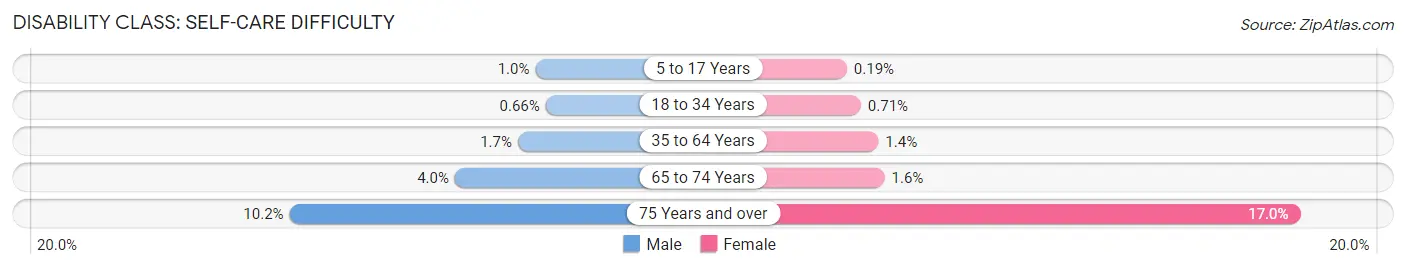
| Age Bracket | Male | Female |
| 5 to 17 Years | 131 (1.0%) | 23 (0.2%) |
| 18 to 34 Years | 114 (0.7%) | 117 (0.7%) |
| 35 to 64 Years | 482 (1.7%) | 395 (1.4%) |
| 65 to 74 Years | 362 (4.0%) | 154 (1.6%) |
| 75 Years and over | 548 (10.2%) | 1,142 (17.0%) |
Technology Access in Mesa County
Computing Device Access in Mesa County
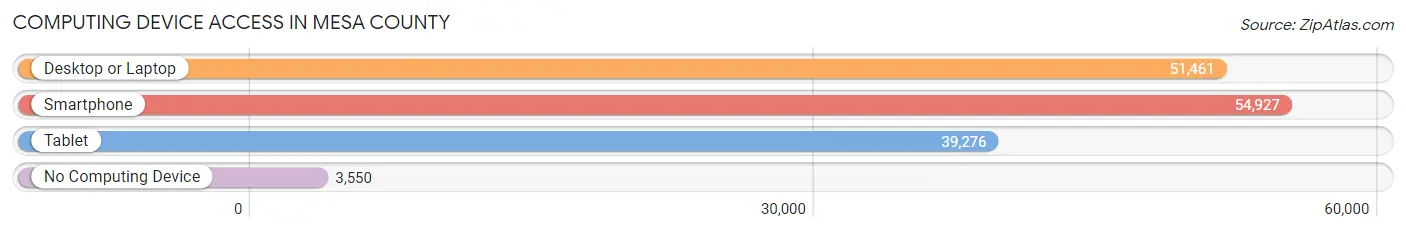
| Device Type | # Households | % Households |
| Desktop or Laptop | 51,461 | 81.6% |
| Smartphone | 54,927 | 87.1% |
| Tablet | 39,276 | 62.3% |
| No Computing Device | 3,550 | 5.6% |
| Total | 63,098 | 100.0% |
Internet Access in Mesa County
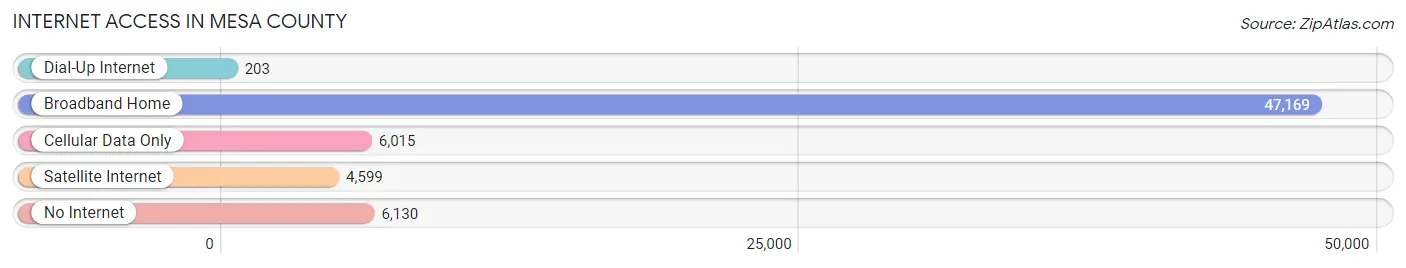
| Internet Type | # Households | % Households |
| Dial-Up Internet | 203 | 0.3% |
| Broadband Home | 47,169 | 74.8% |
| Cellular Data Only | 6,015 | 9.5% |
| Satellite Internet | 4,599 | 7.3% |
| No Internet | 6,130 | 9.7% |
| Total | 63,098 | 100.0% |
Mesa County Summary
Mesa County is located in the western part of the state of Colorado, in the United States. It is the most populous county in the state, with a population of over 150,000 people. The county seat is Grand Junction, which is also the largest city in the county. Mesa County is bordered by Garfield County to the north, Delta County to the east, Montrose County to the south, and the state of Utah to the west.
Geography
Mesa County covers an area of 3,341 square miles, making it the fourth largest county in Colorado. The county is located in the Grand Valley, which is a large, flat valley surrounded by mountains. The Grand Valley is located in the Colorado Plateau, which is a large area of high desert in the western United States. The county is home to several mountain ranges, including the Grand Mesa, the Book Cliffs, and the Uncompahgre Plateau. The county is also home to several rivers, including the Colorado River, the Gunnison River, and the Dolores River.
The climate of Mesa County is semi-arid, with hot summers and cold winters. The average annual temperature is around 50 degrees Fahrenheit, and the average annual precipitation is around 11 inches.
Economy
Mesa County has a diverse economy, with a variety of industries. The county is home to several large employers, including St. Mary's Hospital, the Grand Junction Regional Airport, and the Grand Junction Motor Speedway. The county is also home to several large agricultural operations, including cattle ranches, fruit orchards, and vineyards.
The county is also home to several energy companies, including oil and gas companies, and renewable energy companies. The county is also home to several manufacturing companies, including a large aluminum smelter.
The county is also home to several tourist attractions, including the Colorado National Monument, the Grand Mesa National Forest, and the Dinosaur Journey Museum.
Demographics
As of the 2010 census, the population of Mesa County was 146,723. The population is made up of a variety of ethnic and racial groups, including White (83.3%), Hispanic or Latino (14.2%), Native American (1.2%), Asian (1.1%), and African American (0.7%).
The median household income in Mesa County is $50,867, and the median family income is $60,945. The per capita income is $25,945. The unemployment rate is 5.2%.
The largest cities in Mesa County are Grand Junction (58,566), Fruita (12,646), and Palisade (2,692). The county is also home to several small towns and unincorporated communities.
Conclusion
Mesa County is a large and diverse county located in the western part of Colorado. The county is home to a variety of industries, including agriculture, energy, manufacturing, and tourism. The population of the county is made up of a variety of ethnic and racial groups, and the median household income is slightly above the national average. The county is home to several large cities and small towns, and is a popular tourist destination.
Common Questions
What is Per Capita Income in Mesa County?
Per Capita income in Mesa County is $36,303.
What is the Median Family Income in Mesa County?
Median Family Income in Mesa County is $83,034.
What is the Median Household income in Mesa County?
Median Household Income in Mesa County is $68,077.
What is Income or Wage Gap in Mesa County?
Income or Wage Gap in Mesa County is 30.0%.
Women in Mesa County earn 70.0 cents for every dollar earned by a man.
What is Family Income Deficit in Mesa County?
Family Income Deficit in Mesa County is $10,791.
Families that are below poverty line in Mesa County earn $10,791 less on average than the poverty threshold level.
What is Inequality or Gini Index in Mesa County?
Inequality or Gini Index in Mesa County is 0.44.
What is the Total Population of Mesa County?
Total Population of Mesa County is 156,131.
What is the Total Male Population of Mesa County?
Total Male Population of Mesa County is 77,615.
What is the Total Female Population of Mesa County?
Total Female Population of Mesa County is 78,516.
What is the Ratio of Males per 100 Females in Mesa County?
There are 98.85 Males per 100 Females in Mesa County.
What is the Ratio of Females per 100 Males in Mesa County?
There are 101.16 Females per 100 Males in Mesa County.
What is the Median Population Age in Mesa County?
Median Population Age in Mesa County is 40.6 Years.
What is the Average Family Size in Mesa County
Average Family Size in Mesa County is 3.0 People.
What is the Average Household Size in Mesa County
Average Household Size in Mesa County is 2.4 People.
How Large is the Labor Force in Mesa County?
There are 78,422 People in the Labor Forcein in Mesa County.
What is the Percentage of People in the Labor Force in Mesa County?
61.6% of People are in the Labor Force in Mesa County.
What is the Unemployment Rate in Mesa County?
Unemployment Rate in Mesa County is 5.3%.