Littleton, CO Map & Demographics
Littleton Map
Littleton Overview
$55,197
PER CAPITA INCOME
$121,080
AVG FAMILY INCOME
$90,273
AVG HOUSEHOLD INCOME
22.9%
WAGE / INCOME GAP [ % ]
77.1¢/ $1
WAGE / INCOME GAP [ $ ]
$11,704
FAMILY INCOME DEFICIT
0.46
INEQUALITY / GINI INDEX
45,531
TOTAL POPULATION
22,396
MALE POPULATION
23,135
FEMALE POPULATION
96.81
MALES / 100 FEMALES
103.30
FEMALES / 100 MALES
40.0
MEDIAN AGE
2.9
AVG FAMILY SIZE
2.2
AVG HOUSEHOLD SIZE
26,953
LABOR FORCE [ PEOPLE ]
70.2%
PERCENT IN LABOR FORCE
3.9%
UNEMPLOYMENT RATE
Income in Littleton
Income Overview in Littleton
Per Capita Income in Littleton is $55,197, while median incomes of families and households are $121,080 and $90,273 respectively.
| Characteristic | Number | Measure |
| Per Capita Income | 45,531 | $55,197 |
| Median Family Income | 11,444 | $121,080 |
| Mean Family Income | 11,444 | $152,799 |
| Median Household Income | 20,484 | $90,273 |
| Mean Household Income | 20,484 | $120,112 |
| Income Deficit | 11,444 | $11,704 |
| Wage / Income Gap (%) | 45,531 | 22.92% |
| Wage / Income Gap ($) | 45,531 | 77.08¢ per $1 |
| Gini / Inequality Index | 45,531 | 0.46 |
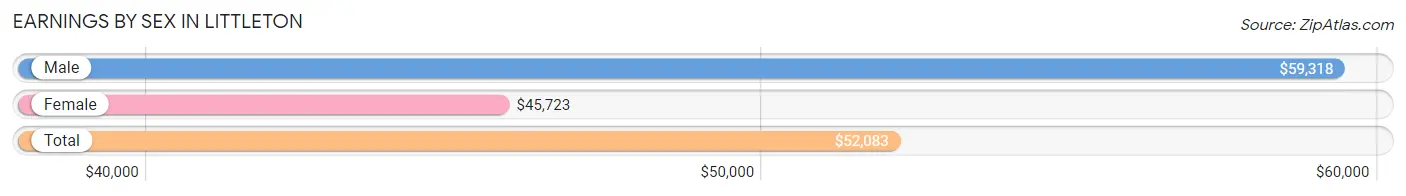
Earnings by Sex in Littleton
Average Earnings in Littleton are $52,083, $59,318 for men and $45,723 for women, a difference of 22.9%.
| Sex | Number | Average Earnings |
| Male | 14,889 (52.9%) | $59,318 |
| Female | 13,241 (47.1%) | $45,723 |
| Total | 28,130 (100.0%) | $52,083 |
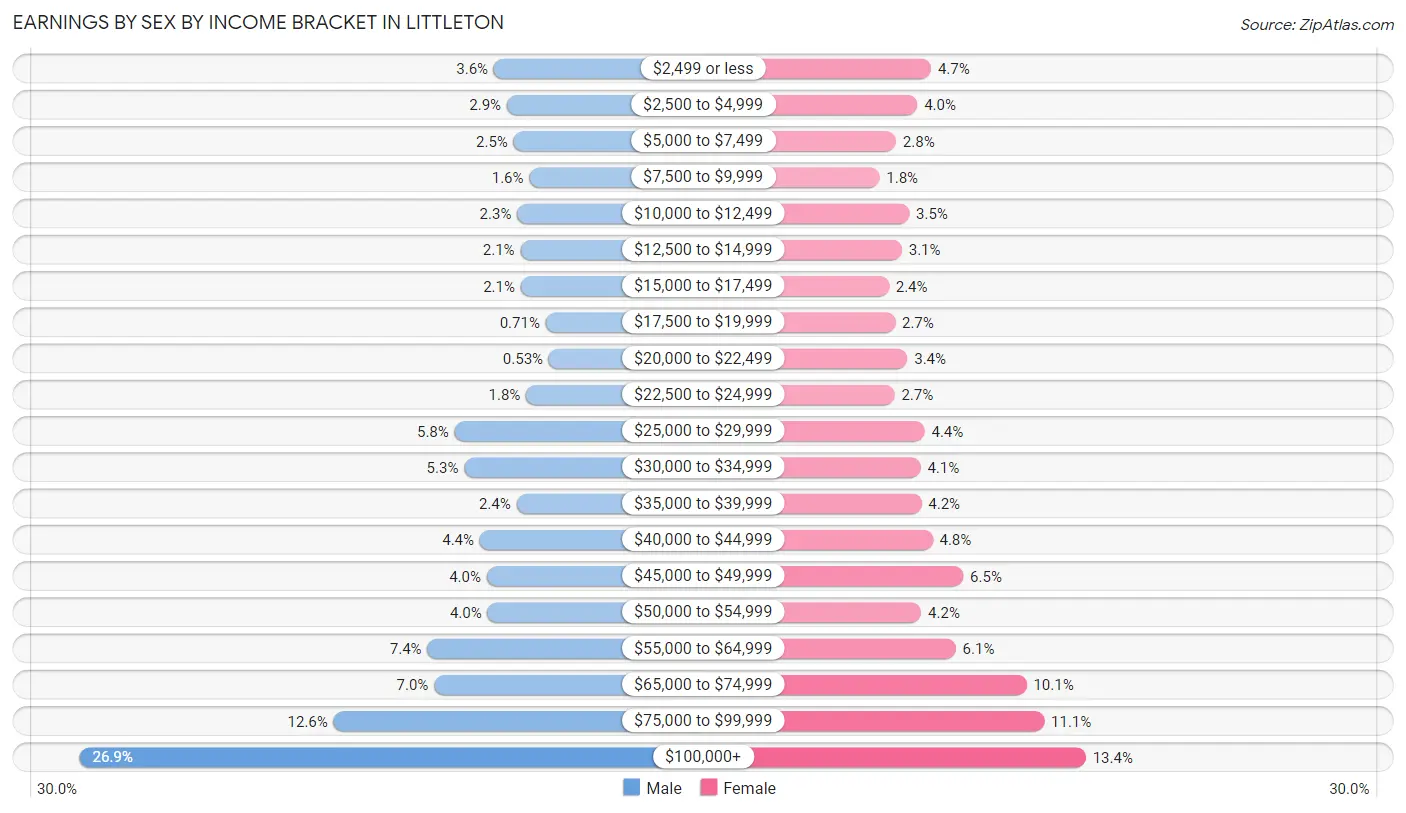
Earnings by Sex by Income Bracket in Littleton
The most common earnings brackets in Littleton are $100,000+ for men (4,007 | 26.9%) and $100,000+ for women (1,778 | 13.4%).
| Income | Male | Female |
| $2,499 or less | 539 (3.6%) | 626 (4.7%) |
| $2,500 to $4,999 | 430 (2.9%) | 524 (4.0%) |
| $5,000 to $7,499 | 374 (2.5%) | 366 (2.8%) |
| $7,500 to $9,999 | 242 (1.6%) | 242 (1.8%) |
| $10,000 to $12,499 | 344 (2.3%) | 463 (3.5%) |
| $12,500 to $14,999 | 317 (2.1%) | 409 (3.1%) |
| $15,000 to $17,499 | 314 (2.1%) | 312 (2.4%) |
| $17,500 to $19,999 | 106 (0.7%) | 359 (2.7%) |
| $20,000 to $22,499 | 79 (0.5%) | 450 (3.4%) |
| $22,500 to $24,999 | 269 (1.8%) | 355 (2.7%) |
| $25,000 to $29,999 | 868 (5.8%) | 579 (4.4%) |
| $30,000 to $34,999 | 787 (5.3%) | 548 (4.1%) |
| $35,000 to $39,999 | 350 (2.4%) | 555 (4.2%) |
| $40,000 to $44,999 | 657 (4.4%) | 638 (4.8%) |
| $45,000 to $49,999 | 598 (4.0%) | 866 (6.5%) |
| $50,000 to $54,999 | 592 (4.0%) | 553 (4.2%) |
| $55,000 to $64,999 | 1,096 (7.4%) | 811 (6.1%) |
| $65,000 to $74,999 | 1,039 (7.0%) | 1,338 (10.1%) |
| $75,000 to $99,999 | 1,881 (12.6%) | 1,469 (11.1%) |
| $100,000+ | 4,007 (26.9%) | 1,778 (13.4%) |
| Total | 14,889 (100.0%) | 13,241 (100.0%) |
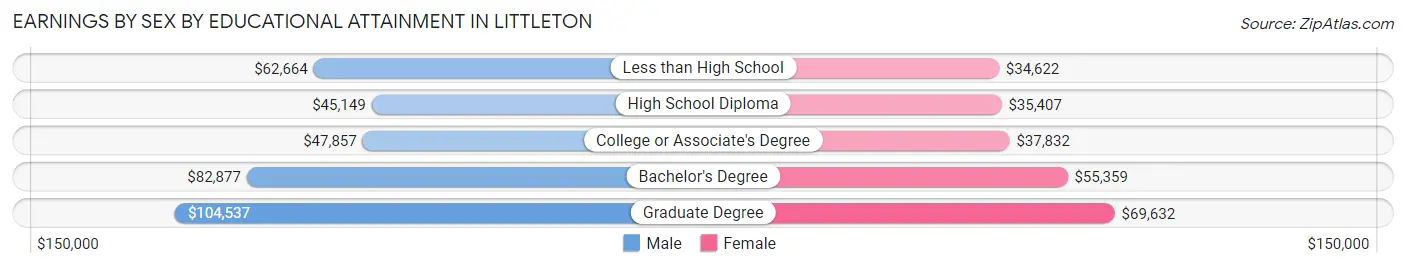
Earnings by Sex by Educational Attainment in Littleton
Average earnings in Littleton are $66,602 for men and $50,207 for women, a difference of 24.6%. Men with an educational attainment of graduate degree enjoy the highest average annual earnings of $104,537, while those with high school diploma education earn the least with $45,149. Women with an educational attainment of graduate degree earn the most with the average annual earnings of $69,632, while those with less than high school education have the smallest earnings of $34,622.
| Educational Attainment | Male Income | Female Income |
| Less than High School | $62,664 | $34,622 |
| High School Diploma | $45,149 | $35,407 |
| College or Associate's Degree | $47,857 | $37,832 |
| Bachelor's Degree | $82,877 | $55,359 |
| Graduate Degree | $104,537 | $69,632 |
| Total | $66,602 | $50,207 |
Family Income in Littleton
Family Income Brackets in Littleton
According to the Littleton family income data, there are 2,907 families falling into the $100,000 to $149,999 income range, which is the most common income bracket and makes up 25.4% of all families. Conversely, the $10,000 to $14,999 income bracket is the least frequent group with only 92 families (0.8%) belonging to this category.
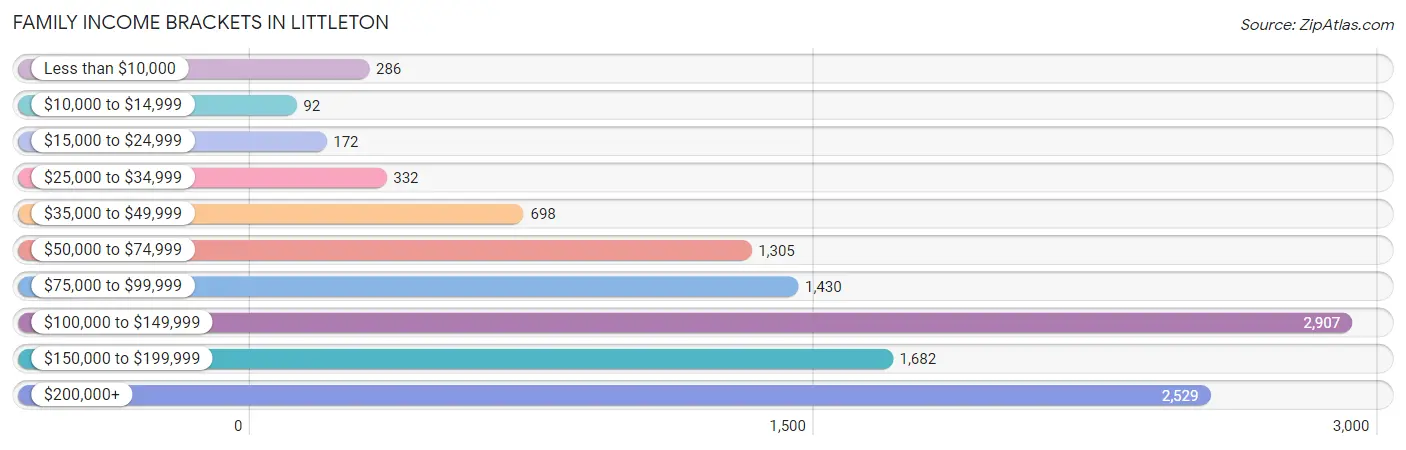
| Income Bracket | # Families | % Families |
| Less than $10,000 | 286 | 2.5% |
| $10,000 to $14,999 | 92 | 0.8% |
| $15,000 to $24,999 | 172 | 1.5% |
| $25,000 to $34,999 | 332 | 2.9% |
| $35,000 to $49,999 | 698 | 6.1% |
| $50,000 to $74,999 | 1,305 | 11.4% |
| $75,000 to $99,999 | 1,430 | 12.5% |
| $100,000 to $149,999 | 2,907 | 25.4% |
| $150,000 to $199,999 | 1,682 | 14.7% |
| $200,000+ | 2,529 | 22.1% |
Family Income by Famaliy Size in Littleton
7+ person families (177 | 1.5%) account for the highest median family income in Littleton with $186,875 per family, while 2-person families (6,441 | 56.3%) have the highest median income of $56,440 per family member.
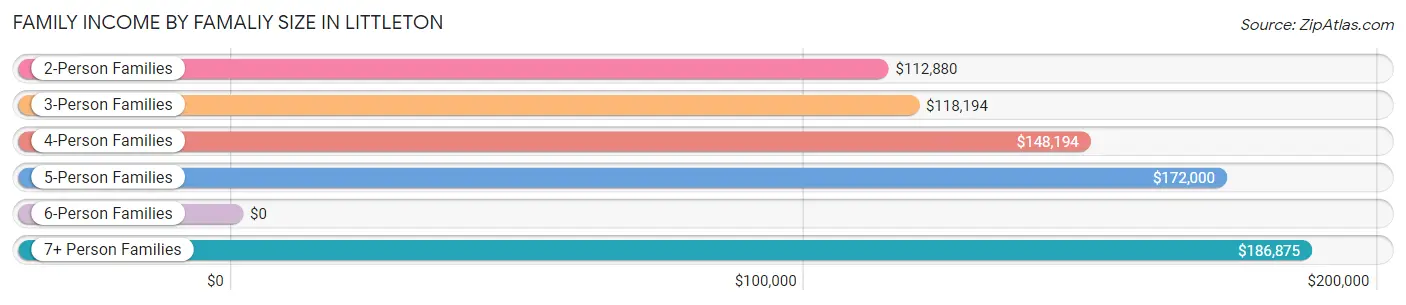
| Income Bracket | # Families | Median Income |
| 2-Person Families | 6,441 (56.3%) | $112,880 |
| 3-Person Families | 2,149 (18.8%) | $118,194 |
| 4-Person Families | 1,862 (16.3%) | $148,194 |
| 5-Person Families | 512 (4.5%) | $172,000 |
| 6-Person Families | 303 (2.6%) | $0 |
| 7+ Person Families | 177 (1.5%) | $186,875 |
| Total | 11,444 (100.0%) | $121,080 |
Family Income by Number of Earners in Littleton
The median family income in Littleton is $121,080, with families comprising 3+ earners (980) having the highest median family income of $186,364, while families with no earners (1,479) have the lowest median family income of $75,417, accounting for 8.6% and 12.9% of families, respectively.
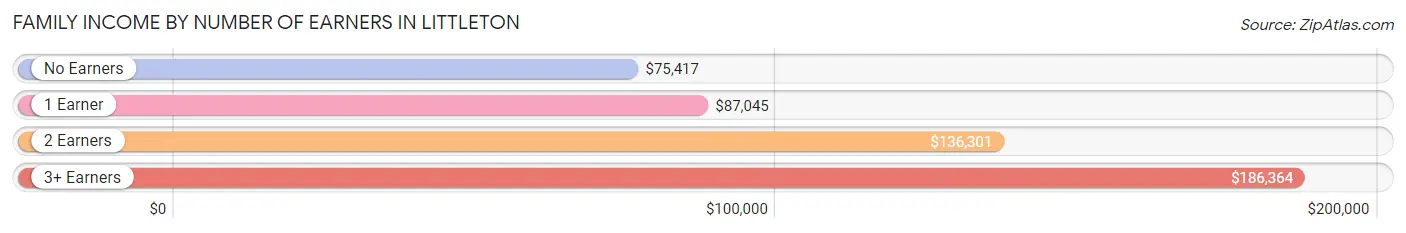
| Number of Earners | # Families | Median Income |
| No Earners | 1,479 (12.9%) | $75,417 |
| 1 Earner | 2,768 (24.2%) | $87,045 |
| 2 Earners | 6,217 (54.3%) | $136,301 |
| 3+ Earners | 980 (8.6%) | $186,364 |
| Total | 11,444 (100.0%) | $121,080 |
Household Income in Littleton
Household Income Brackets in Littleton
With 4,015 households falling in the category, the $100,000 to $149,999 income range is the most frequent in Littleton, accounting for 19.6% of all households. In contrast, only 655 households (3.2%) fall into the $10,000 to $14,999 income bracket, making it the least populous group.
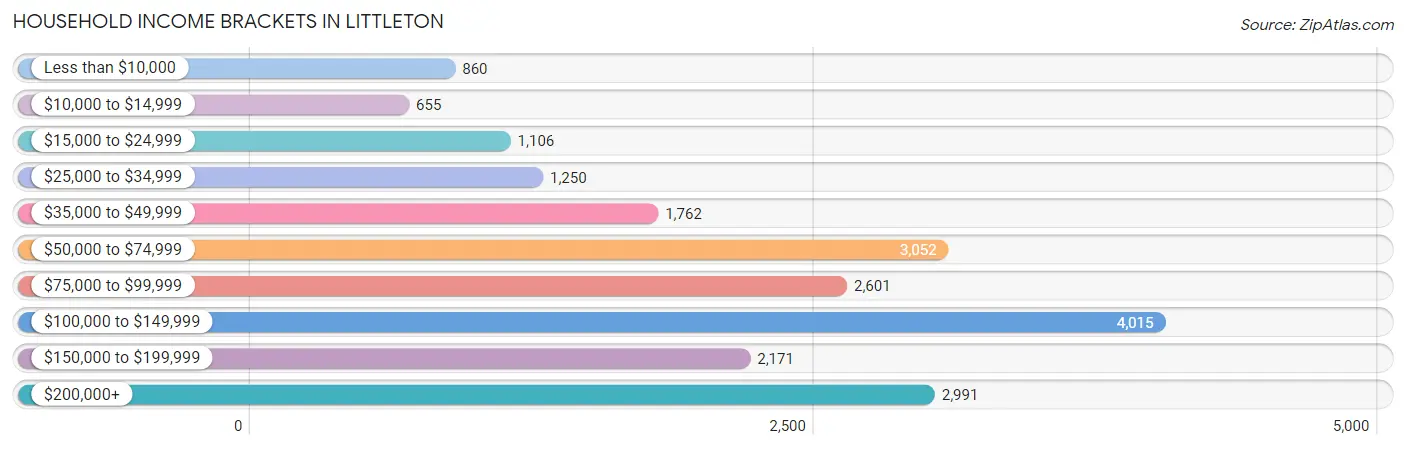
| Income Bracket | # Households | % Households |
| Less than $10,000 | 860 | 4.2% |
| $10,000 to $14,999 | 655 | 3.2% |
| $15,000 to $24,999 | 1,106 | 5.4% |
| $25,000 to $34,999 | 1,250 | 6.1% |
| $35,000 to $49,999 | 1,762 | 8.6% |
| $50,000 to $74,999 | 3,052 | 14.9% |
| $75,000 to $99,999 | 2,601 | 12.7% |
| $100,000 to $149,999 | 4,015 | 19.6% |
| $150,000 to $199,999 | 2,171 | 10.6% |
| $200,000+ | 2,991 | 14.6% |
Household Income by Householder Age in Littleton
The median household income in Littleton is $90,273, with the highest median household income of $116,807 found in the 45 to 64 years age bracket for the primary householder. A total of 6,719 households (32.8%) fall into this category. Meanwhile, the 65+ years age bracket for the primary householder has the lowest median household income of $60,838, with 5,800 households (28.3%) in this group.
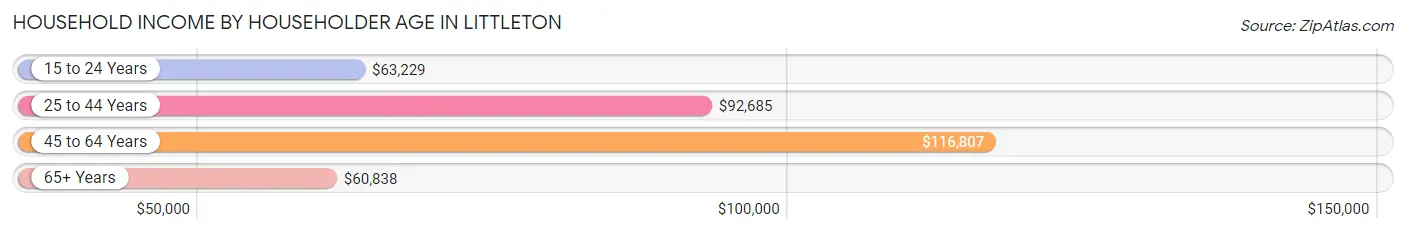
| Income Bracket | # Households | Median Income |
| 15 to 24 Years | 675 (3.3%) | $63,229 |
| 25 to 44 Years | 7,290 (35.6%) | $92,685 |
| 45 to 64 Years | 6,719 (32.8%) | $116,807 |
| 65+ Years | 5,800 (28.3%) | $60,838 |
| Total | 20,484 (100.0%) | $90,273 |
Poverty in Littleton
Income Below Poverty by Sex and Age in Littleton
With 7.3% poverty level for males and 7.9% for females among the residents of Littleton, 18 to 24 year old males and 75 year old and over females are the most vulnerable to poverty, with 252 males (15.8%) and 303 females (14.2%) in their respective age groups living below the poverty level.
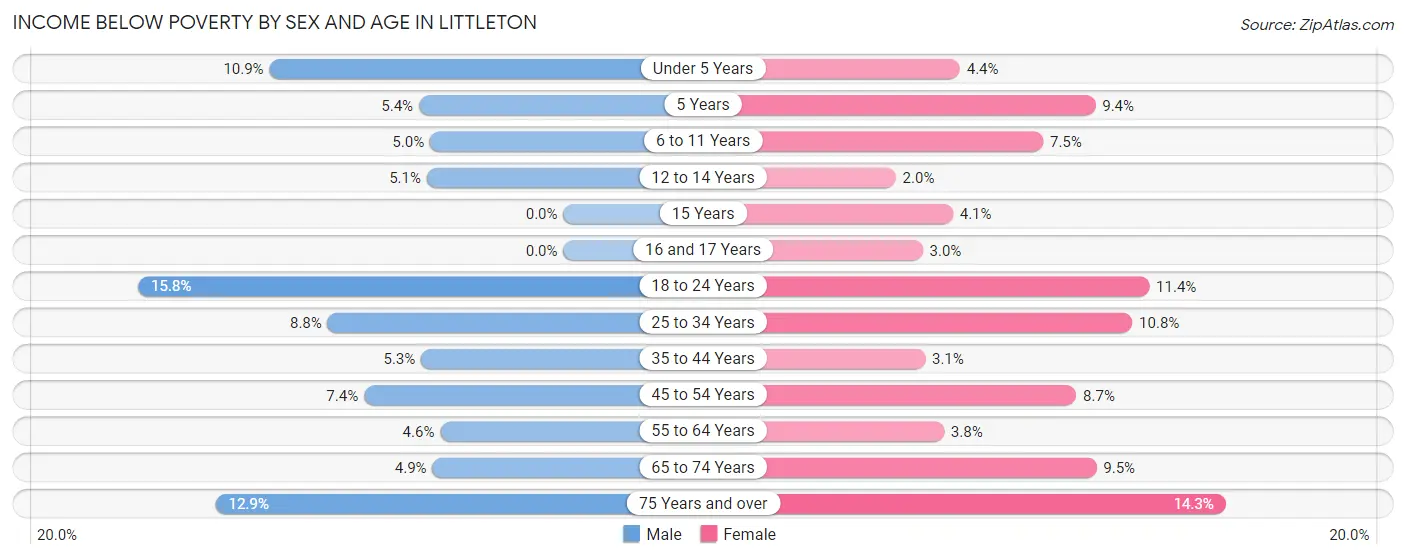
| Age Bracket | Male | Female |
| Under 5 Years | 103 (10.9%) | 42 (4.4%) |
| 5 Years | 12 (5.4%) | 32 (9.4%) |
| 6 to 11 Years | 64 (5.0%) | 122 (7.5%) |
| 12 to 14 Years | 28 (5.1%) | 13 (2.0%) |
| 15 Years | 0 (0.0%) | 11 (4.1%) |
| 16 and 17 Years | 0 (0.0%) | 8 (3.0%) |
| 18 to 24 Years | 252 (15.8%) | 181 (11.4%) |
| 25 to 34 Years | 375 (8.7%) | 431 (10.8%) |
| 35 to 44 Years | 174 (5.3%) | 81 (3.1%) |
| 45 to 54 Years | 175 (7.4%) | 223 (8.7%) |
| 55 to 64 Years | 143 (4.6%) | 123 (3.8%) |
| 65 to 74 Years | 113 (4.9%) | 241 (9.5%) |
| 75 Years and over | 179 (12.9%) | 303 (14.2%) |
| Total | 1,618 (7.3%) | 1,811 (7.9%) |
Income Above Poverty by Sex and Age in Littleton
According to the poverty statistics in Littleton, males aged 15 years and females aged 12 to 14 years are the age groups that are most secure financially, with 100.0% of males and 98.0% of females in these age groups living above the poverty line.
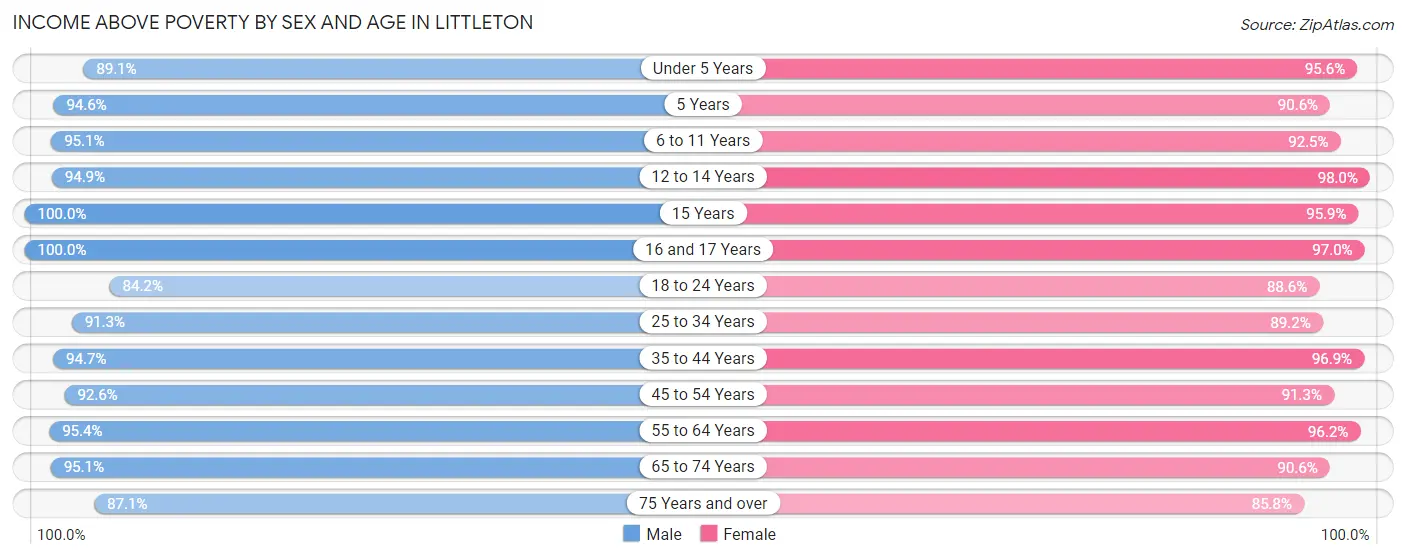
| Age Bracket | Male | Female |
| Under 5 Years | 841 (89.1%) | 918 (95.6%) |
| 5 Years | 212 (94.6%) | 308 (90.6%) |
| 6 to 11 Years | 1,229 (95.1%) | 1,512 (92.5%) |
| 12 to 14 Years | 524 (94.9%) | 636 (98.0%) |
| 15 Years | 235 (100.0%) | 256 (95.9%) |
| 16 and 17 Years | 571 (100.0%) | 259 (97.0%) |
| 18 to 24 Years | 1,344 (84.2%) | 1,406 (88.6%) |
| 25 to 34 Years | 3,912 (91.2%) | 3,569 (89.2%) |
| 35 to 44 Years | 3,121 (94.7%) | 2,538 (96.9%) |
| 45 to 54 Years | 2,189 (92.6%) | 2,340 (91.3%) |
| 55 to 64 Years | 2,988 (95.4%) | 3,124 (96.2%) |
| 65 to 74 Years | 2,214 (95.1%) | 2,308 (90.5%) |
| 75 Years and over | 1,208 (87.1%) | 1,823 (85.8%) |
| Total | 20,588 (92.7%) | 20,997 (92.1%) |
Income Below Poverty Among Married-Couple Families in Littleton
The poverty statistics for married-couple families in Littleton show that 2.1% or 186 of the total 9,048 families live below the poverty line. Families with no children have the highest poverty rate of 2.6%, comprising of 152 families. On the other hand, families with 3 or 4 children have the lowest poverty rate of 0.0%, which includes 0 families.
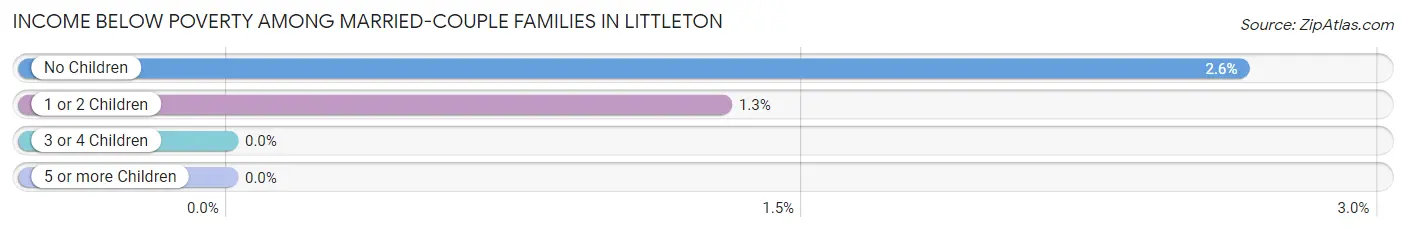
| Children | Above Poverty | Below Poverty |
| No Children | 5,610 (97.4%) | 152 (2.6%) |
| 1 or 2 Children | 2,605 (98.7%) | 34 (1.3%) |
| 3 or 4 Children | 621 (100.0%) | 0 (0.0%) |
| 5 or more Children | 26 (100.0%) | 0 (0.0%) |
| Total | 8,862 (97.9%) | 186 (2.1%) |
Income Below Poverty Among Single-Parent Households in Littleton
According to the poverty data in Littleton, 8.0% or 70 single-father households and 16.9% or 256 single-mother households are living below the poverty line. Among single-father households, those with 3 or 4 children have the highest poverty rate, with 43 households (57.3%) experiencing poverty. Likewise, among single-mother households, those with 3 or 4 children have the highest poverty rate, with 37 households (72.6%) falling below the poverty line.
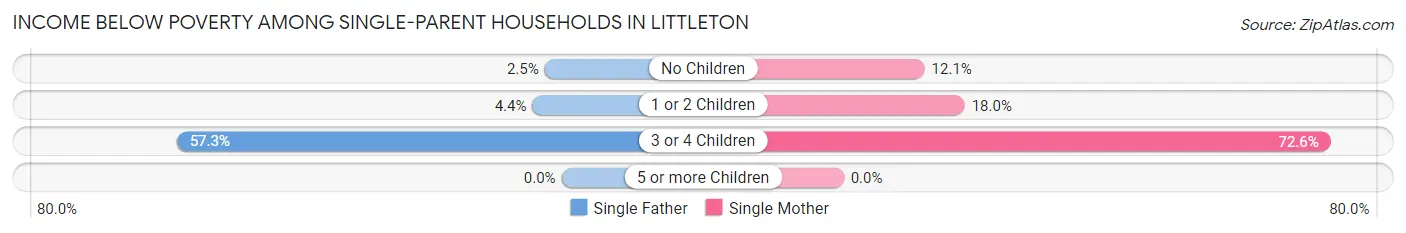
| Children | Single Father | Single Mother |
| No Children | 11 (2.5%) | 92 (12.1%) |
| 1 or 2 Children | 16 (4.3%) | 127 (18.0%) |
| 3 or 4 Children | 43 (57.3%) | 37 (72.6%) |
| 5 or more Children | 0 (0.0%) | 0 (0.0%) |
| Total | 70 (8.0%) | 256 (16.9%) |
Income Below Poverty Among Married-Couple vs Single-Parent Households in Littleton
The poverty data for Littleton shows that 186 of the married-couple family households (2.1%) and 326 of the single-parent households (13.6%) are living below the poverty level. Within the married-couple family households, those with no children have the highest poverty rate, with 152 households (2.6%) falling below the poverty line. Among the single-parent households, those with 3 or 4 children have the highest poverty rate, with 80 household (63.5%) living below poverty.
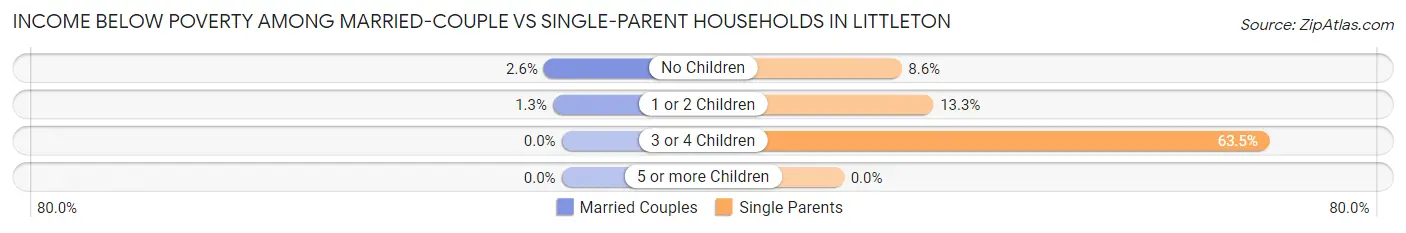
| Children | Married-Couple Families | Single-Parent Households |
| No Children | 152 (2.6%) | 103 (8.6%) |
| 1 or 2 Children | 34 (1.3%) | 143 (13.3%) |
| 3 or 4 Children | 0 (0.0%) | 80 (63.5%) |
| 5 or more Children | 0 (0.0%) | 0 (0.0%) |
| Total | 186 (2.1%) | 326 (13.6%) |
Race in Littleton
The most populous races in Littleton are White / Caucasian (39,147 | 86.0%), Hispanic or Latino (5,577 | 12.2%), and Two or more Races (2,878 | 6.3%).
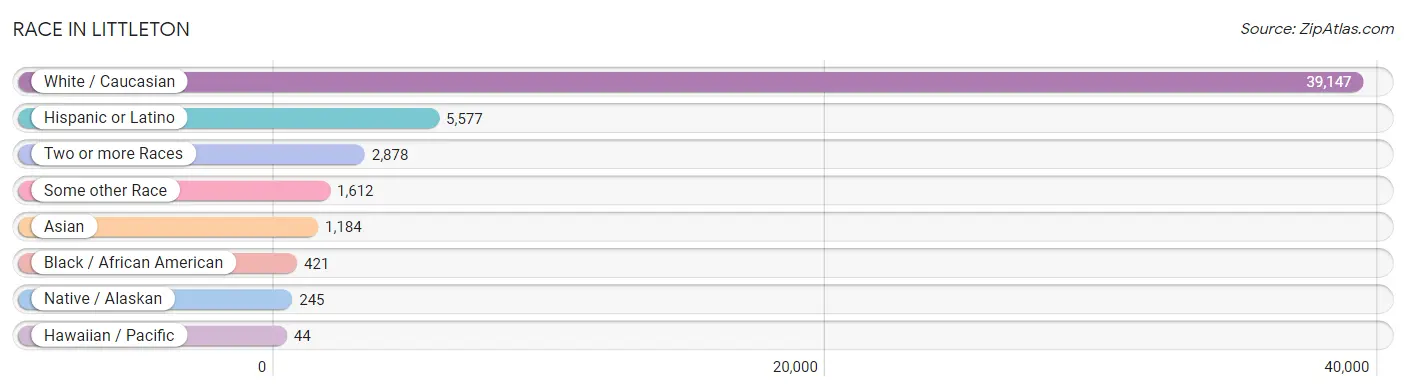
| Race | # Population | % Population |
| Asian | 1,184 | 2.6% |
| Black / African American | 421 | 0.9% |
| Hawaiian / Pacific | 44 | 0.1% |
| Hispanic or Latino | 5,577 | 12.2% |
| Native / Alaskan | 245 | 0.5% |
| White / Caucasian | 39,147 | 86.0% |
| Two or more Races | 2,878 | 6.3% |
| Some other Race | 1,612 | 3.5% |
| Total | 45,531 | 100.0% |
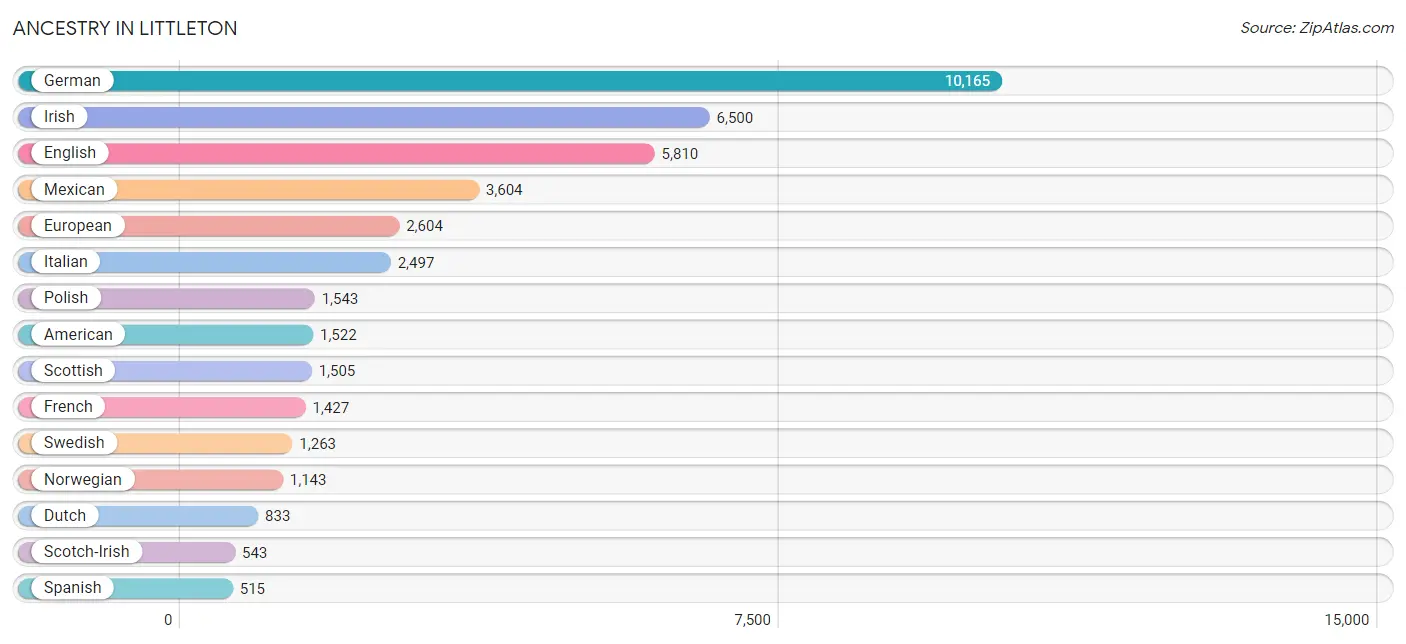
Ancestry in Littleton
The most populous ancestries reported in Littleton are German (10,165 | 22.3%), Irish (6,500 | 14.3%), English (5,810 | 12.8%), Mexican (3,604 | 7.9%), and European (2,604 | 5.7%), together accounting for 63.0% of all Littleton residents.
| Ancestry | # Population | % Population |
| African | 9 | 0.0% |
| Albanian | 141 | 0.3% |
| Alsatian | 7 | 0.0% |
| American | 1,522 | 3.3% |
| Apache | 81 | 0.2% |
| Arab | 204 | 0.4% |
| Arapaho | 36 | 0.1% |
| Argentinean | 28 | 0.1% |
| Armenian | 14 | 0.0% |
| Assyrian / Chaldean / Syriac | 8 | 0.0% |
| Australian | 18 | 0.0% |
| Austrian | 238 | 0.5% |
| Belgian | 67 | 0.2% |
| Bhutanese | 172 | 0.4% |
| British | 434 | 0.9% |
| Burmese | 367 | 0.8% |
| Cajun | 32 | 0.1% |
| Canadian | 95 | 0.2% |
| Central American | 182 | 0.4% |
| Cherokee | 122 | 0.3% |
| Chickasaw | 3 | 0.0% |
| Choctaw | 36 | 0.1% |
| Colombian | 26 | 0.1% |
| Comanche | 9 | 0.0% |
| Costa Rican | 20 | 0.0% |
| Creek | 4 | 0.0% |
| Croatian | 121 | 0.3% |
| Cuban | 105 | 0.2% |
| Czech | 470 | 1.0% |
| Czechoslovakian | 25 | 0.1% |
| Danish | 187 | 0.4% |
| Dutch | 833 | 1.8% |
| Eastern European | 214 | 0.5% |
| Ecuadorian | 16 | 0.0% |
| Egyptian | 10 | 0.0% |
| English | 5,810 | 12.8% |
| Ethiopian | 16 | 0.0% |
| European | 2,604 | 5.7% |
| Filipino | 32 | 0.1% |
| Finnish | 165 | 0.4% |
| French | 1,427 | 3.1% |
| French Canadian | 182 | 0.4% |
| German | 10,165 | 22.3% |
| German Russian | 11 | 0.0% |
| Ghanaian | 25 | 0.1% |
| Greek | 124 | 0.3% |
| Guatemalan | 45 | 0.1% |
| Hungarian | 219 | 0.5% |
| Icelander | 9 | 0.0% |
| Indian (Asian) | 337 | 0.7% |
| Indonesian | 12 | 0.0% |
| Iranian | 24 | 0.1% |
| Irish | 6,500 | 14.3% |
| Iroquois | 28 | 0.1% |
| Israeli | 16 | 0.0% |
| Italian | 2,497 | 5.5% |
| Jamaican | 17 | 0.0% |
| Japanese | 16 | 0.0% |
| Korean | 373 | 0.8% |
| Laotian | 8 | 0.0% |
| Latvian | 6 | 0.0% |
| Lebanese | 71 | 0.2% |
| Liberian | 6 | 0.0% |
| Lithuanian | 271 | 0.6% |
| Luxembourger | 29 | 0.1% |
| Mexican | 3,604 | 7.9% |
| Mexican American Indian | 15 | 0.0% |
| Moroccan | 57 | 0.1% |
| Native Hawaiian | 86 | 0.2% |
| Navajo | 42 | 0.1% |
| Nicaraguan | 72 | 0.2% |
| Northern European | 77 | 0.2% |
| Norwegian | 1,143 | 2.5% |
| Okinawan | 104 | 0.2% |
| Pakistani | 153 | 0.3% |
| Palestinian | 10 | 0.0% |
| Pennsylvania German | 9 | 0.0% |
| Peruvian | 28 | 0.1% |
| Polish | 1,543 | 3.4% |
| Portuguese | 205 | 0.4% |
| Puerto Rican | 92 | 0.2% |
| Romanian | 17 | 0.0% |
| Russian | 492 | 1.1% |
| Salvadoran | 45 | 0.1% |
| Samoan | 9 | 0.0% |
| Scandinavian | 380 | 0.8% |
| Scotch-Irish | 543 | 1.2% |
| Scottish | 1,505 | 3.3% |
| Serbian | 10 | 0.0% |
| Slavic | 54 | 0.1% |
| Slovak | 43 | 0.1% |
| Slovene | 39 | 0.1% |
| Somali | 18 | 0.0% |
| South American | 338 | 0.7% |
| Spaniard | 318 | 0.7% |
| Spanish | 515 | 1.1% |
| Sri Lankan | 203 | 0.4% |
| Subsaharan African | 83 | 0.2% |
| Swedish | 1,263 | 2.8% |
| Swiss | 78 | 0.2% |
| Syrian | 12 | 0.0% |
| Thai | 220 | 0.5% |
| Turkish | 7 | 0.0% |
| Ukrainian | 111 | 0.2% |
| Ute | 8 | 0.0% |
| Venezuelan | 240 | 0.5% |
| Welsh | 458 | 1.0% |
| Yugoslavian | 25 | 0.1% | View All 108 Rows |
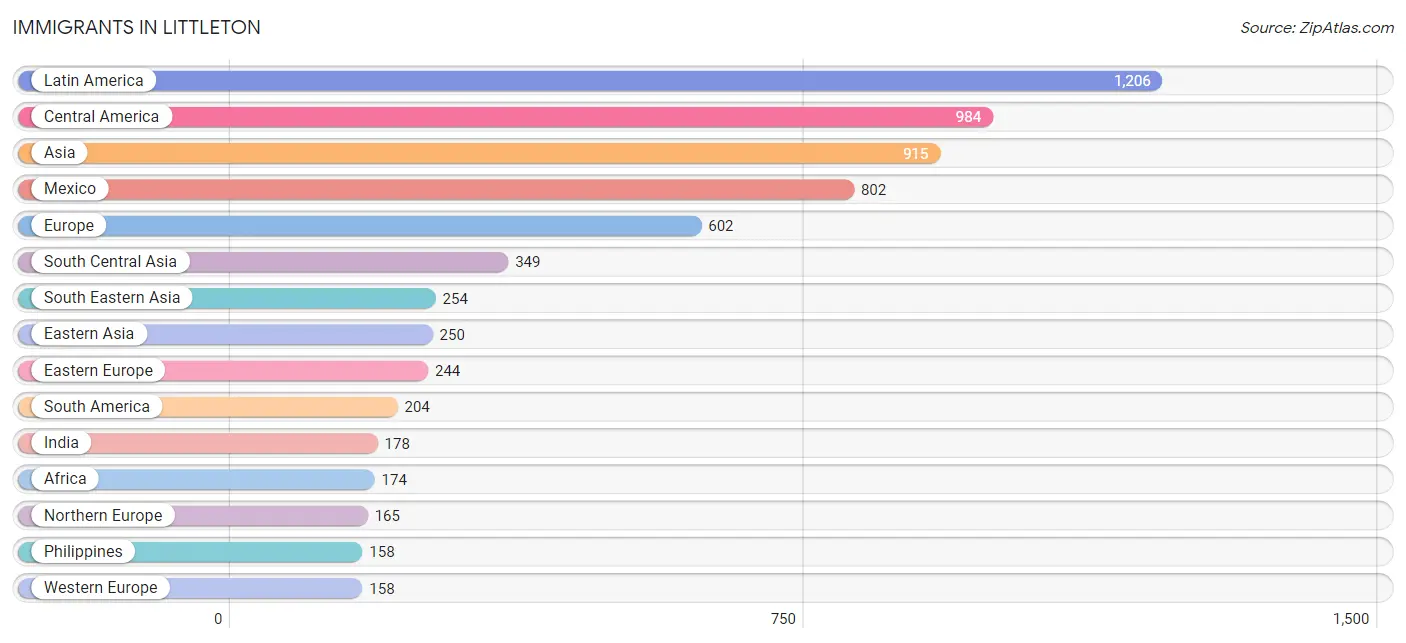
Immigrants in Littleton
The most numerous immigrant groups reported in Littleton came from Latin America (1,206 | 2.6%), Central America (984 | 2.2%), Asia (915 | 2.0%), Mexico (802 | 1.8%), and Europe (602 | 1.3%), together accounting for 9.9% of all Littleton residents.
| Immigration Origin | # Population | % Population |
| Africa | 174 | 0.4% |
| Albania | 13 | 0.0% |
| Argentina | 9 | 0.0% |
| Asia | 915 | 2.0% |
| Australia | 8 | 0.0% |
| Bangladesh | 137 | 0.3% |
| Belarus | 10 | 0.0% |
| Belgium | 8 | 0.0% |
| Bosnia and Herzegovina | 10 | 0.0% |
| Canada | 99 | 0.2% |
| Caribbean | 18 | 0.0% |
| Central America | 984 | 2.2% |
| China | 148 | 0.3% |
| Costa Rica | 8 | 0.0% |
| Cuba | 8 | 0.0% |
| Czechoslovakia | 24 | 0.1% |
| Denmark | 13 | 0.0% |
| Eastern Africa | 31 | 0.1% |
| Eastern Asia | 250 | 0.5% |
| Eastern Europe | 244 | 0.5% |
| Egypt | 10 | 0.0% |
| El Salvador | 62 | 0.1% |
| England | 32 | 0.1% |
| Eritrea | 16 | 0.0% |
| Europe | 602 | 1.3% |
| France | 84 | 0.2% |
| Germany | 66 | 0.1% |
| Ghana | 25 | 0.1% |
| Greece | 10 | 0.0% |
| Guatemala | 51 | 0.1% |
| Hong Kong | 12 | 0.0% |
| India | 178 | 0.4% |
| Iran | 8 | 0.0% |
| Iraq | 35 | 0.1% |
| Israel | 4 | 0.0% |
| Italy | 25 | 0.1% |
| Japan | 25 | 0.1% |
| Kenya | 8 | 0.0% |
| Korea | 77 | 0.2% |
| Latin America | 1,206 | 2.6% |
| Lebanon | 8 | 0.0% |
| Liberia | 6 | 0.0% |
| Mexico | 802 | 1.8% |
| Middle Africa | 9 | 0.0% |
| Moldova | 10 | 0.0% |
| Morocco | 26 | 0.1% |
| Nicaragua | 61 | 0.1% |
| Northern Africa | 36 | 0.1% |
| Northern Europe | 165 | 0.4% |
| Norway | 44 | 0.1% |
| Oceania | 8 | 0.0% |
| Pakistan | 26 | 0.1% |
| Peru | 80 | 0.2% |
| Philippines | 158 | 0.4% |
| Poland | 48 | 0.1% |
| Russia | 61 | 0.1% |
| Somalia | 7 | 0.0% |
| South Africa | 67 | 0.2% |
| South America | 204 | 0.4% |
| South Central Asia | 349 | 0.8% |
| South Eastern Asia | 254 | 0.6% |
| Southern Europe | 35 | 0.1% |
| Taiwan | 23 | 0.1% |
| Turkey | 7 | 0.0% |
| Ukraine | 34 | 0.1% |
| Venezuela | 115 | 0.3% |
| Vietnam | 84 | 0.2% |
| Western Africa | 31 | 0.1% |
| Western Asia | 62 | 0.1% |
| Western Europe | 158 | 0.4% |
| Zaire | 9 | 0.0% | View All 71 Rows |
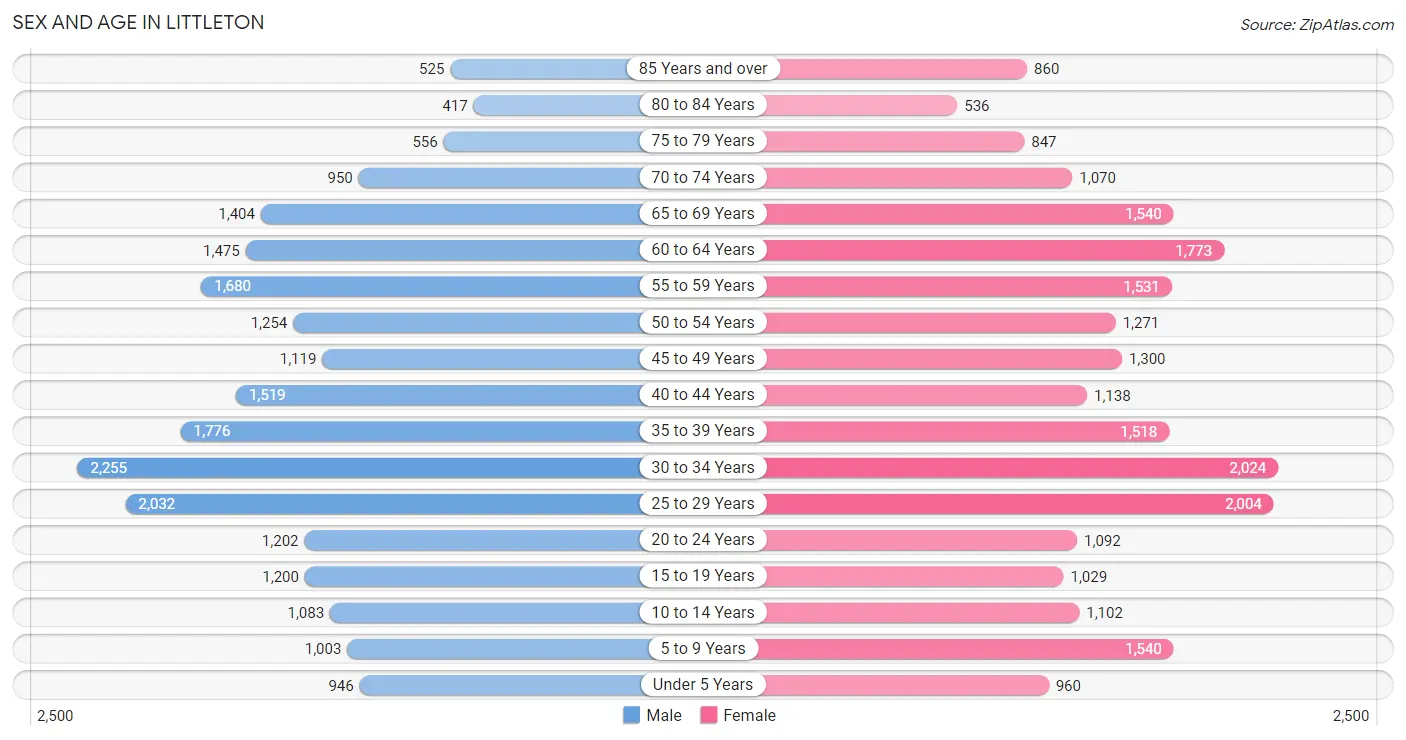
Sex and Age in Littleton
Sex and Age in Littleton
The most populous age groups in Littleton are 30 to 34 Years (2,255 | 10.1%) for men and 30 to 34 Years (2,024 | 8.7%) for women.
| Age Bracket | Male | Female |
| Under 5 Years | 946 (4.2%) | 960 (4.2%) |
| 5 to 9 Years | 1,003 (4.5%) | 1,540 (6.7%) |
| 10 to 14 Years | 1,083 (4.8%) | 1,102 (4.8%) |
| 15 to 19 Years | 1,200 (5.4%) | 1,029 (4.4%) |
| 20 to 24 Years | 1,202 (5.4%) | 1,092 (4.7%) |
| 25 to 29 Years | 2,032 (9.1%) | 2,004 (8.7%) |
| 30 to 34 Years | 2,255 (10.1%) | 2,024 (8.7%) |
| 35 to 39 Years | 1,776 (7.9%) | 1,518 (6.6%) |
| 40 to 44 Years | 1,519 (6.8%) | 1,138 (4.9%) |
| 45 to 49 Years | 1,119 (5.0%) | 1,300 (5.6%) |
| 50 to 54 Years | 1,254 (5.6%) | 1,271 (5.5%) |
| 55 to 59 Years | 1,680 (7.5%) | 1,531 (6.6%) |
| 60 to 64 Years | 1,475 (6.6%) | 1,773 (7.7%) |
| 65 to 69 Years | 1,404 (6.3%) | 1,540 (6.7%) |
| 70 to 74 Years | 950 (4.2%) | 1,070 (4.6%) |
| 75 to 79 Years | 556 (2.5%) | 847 (3.7%) |
| 80 to 84 Years | 417 (1.9%) | 536 (2.3%) |
| 85 Years and over | 525 (2.3%) | 860 (3.7%) |
| Total | 22,396 (100.0%) | 23,135 (100.0%) |
Families and Households in Littleton
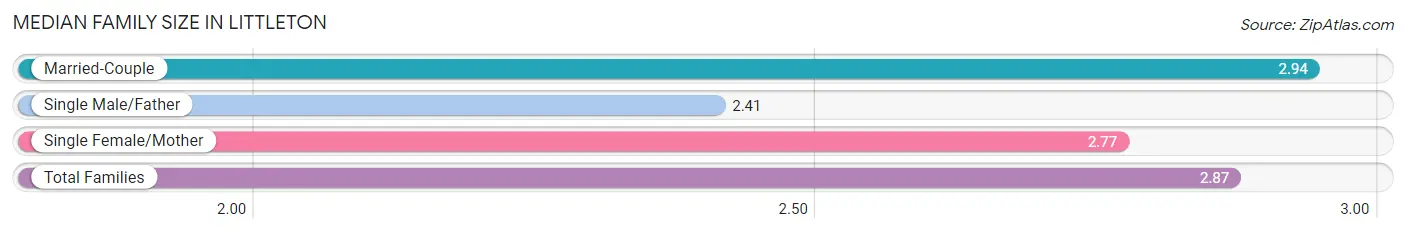
Median Family Size in Littleton
The median family size in Littleton is 2.87 persons per family, with married-couple families (9,048 | 79.1%) accounting for the largest median family size of 2.94 persons per family. On the other hand, single male/father families (879 | 7.7%) represent the smallest median family size with 2.41 persons per family.
| Family Type | # Families | Family Size |
| Married-Couple | 9,048 (79.1%) | 2.94 |
| Single Male/Father | 879 (7.7%) | 2.41 |
| Single Female/Mother | 1,517 (13.3%) | 2.77 |
| Total Families | 11,444 (100.0%) | 2.87 |
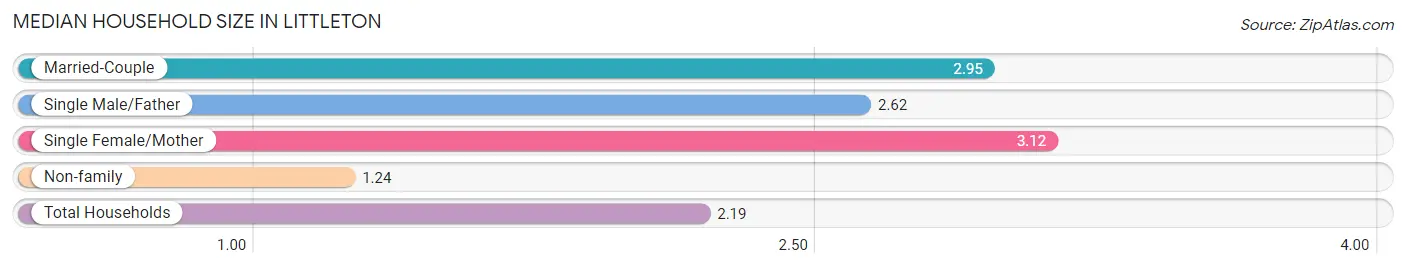
Median Household Size in Littleton
The median household size in Littleton is 2.19 persons per household, with single female/mother households (1,517 | 7.4%) accounting for the largest median household size of 3.12 persons per household. non-family households (9,040 | 44.1%) represent the smallest median household size with 1.24 persons per household.
| Household Type | # Households | Household Size |
| Married-Couple | 9,048 (44.2%) | 2.95 |
| Single Male/Father | 879 (4.3%) | 2.62 |
| Single Female/Mother | 1,517 (7.4%) | 3.12 |
| Non-family | 9,040 (44.1%) | 1.24 |
| Total Households | 20,484 (100.0%) | 2.19 |
Household Size by Marriage Status in Littleton
Out of a total of 20,484 households in Littleton, 11,444 (55.9%) are family households, while 9,040 (44.1%) are nonfamily households. The most numerous type of family households are 2-person households, comprising 6,040, and the most common type of nonfamily households are 1-person households, comprising 7,234.
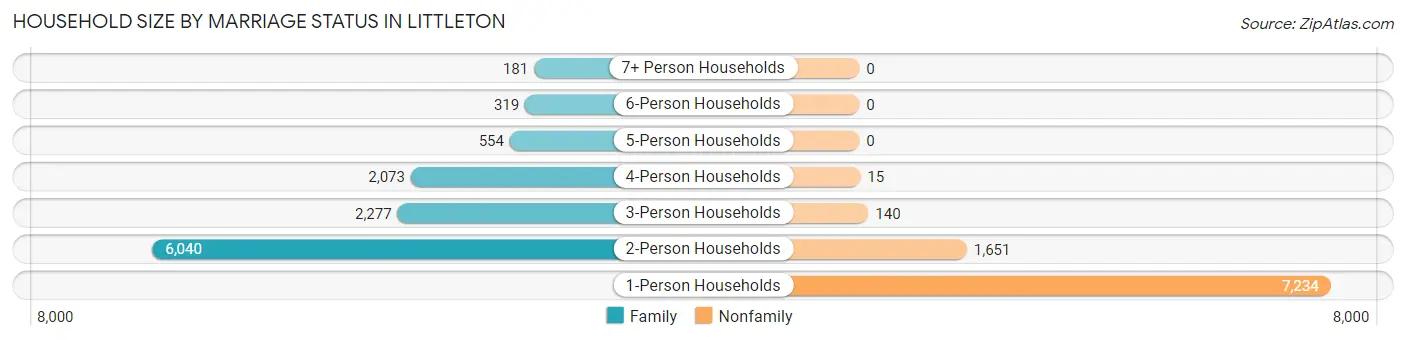
| Household Size | Family Households | Nonfamily Households |
| 1-Person Households | - | 7,234 (35.3%) |
| 2-Person Households | 6,040 (29.5%) | 1,651 (8.1%) |
| 3-Person Households | 2,277 (11.1%) | 140 (0.7%) |
| 4-Person Households | 2,073 (10.1%) | 15 (0.1%) |
| 5-Person Households | 554 (2.7%) | 0 (0.0%) |
| 6-Person Households | 319 (1.6%) | 0 (0.0%) |
| 7+ Person Households | 181 (0.9%) | 0 (0.0%) |
| Total | 11,444 (55.9%) | 9,040 (44.1%) |
Female Fertility in Littleton
Fertility by Age in Littleton
Average fertility rate in Littleton is 60.0 births per 1,000 women. Women in the age bracket of 20 to 34 years have the highest fertility rate with 88.0 births per 1,000 women. Women in the age bracket of 20 to 34 years acount for 72.8% of all women with births.
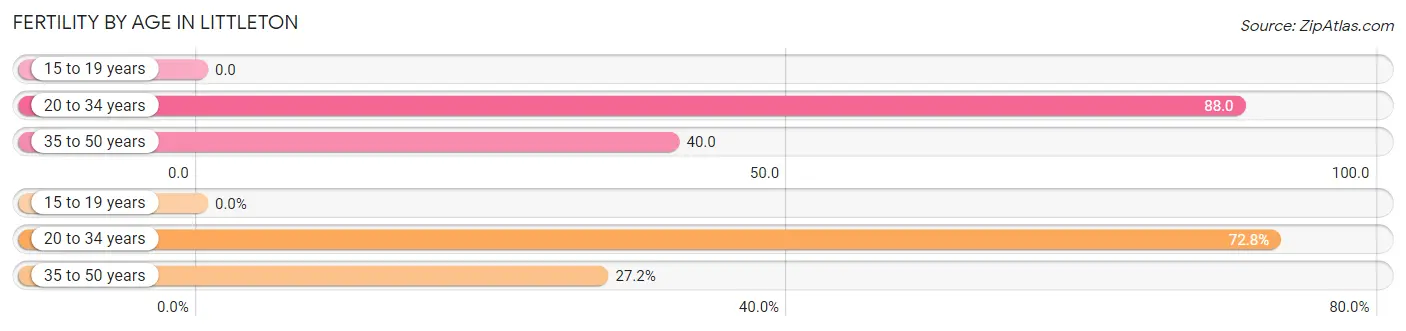
| Age Bracket | Women with Births | Births / 1,000 Women |
| 15 to 19 years | 0 (0.0%) | 0.0 |
| 20 to 34 years | 450 (72.8%) | 88.0 |
| 35 to 50 years | 168 (27.2%) | 40.0 |
| Total | 618 (100.0%) | 60.0 |
Fertility by Age by Marriage Status in Littleton
81.7% of women with births (618) in Littleton are married. The highest percentage of unmarried women with births falls into 20 to 34 years age bracket with 20.0% of them unmarried at the time of birth, while the lowest percentage of unmarried women with births belong to 35 to 50 years age bracket with 13.7% of them unmarried.
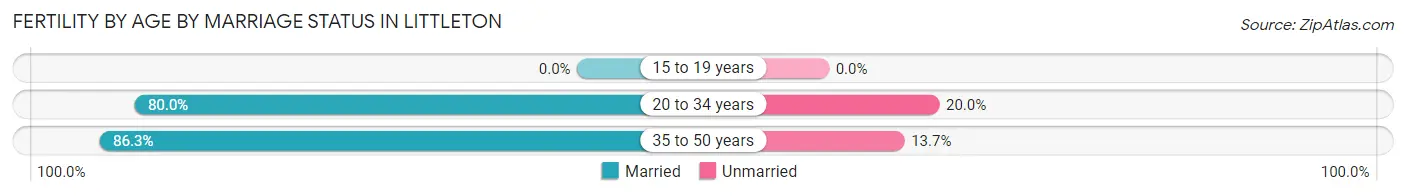
| Age Bracket | Married | Unmarried |
| 15 to 19 years | 0 (0.0%) | 0 (0.0%) |
| 20 to 34 years | 360 (80.0%) | 90 (20.0%) |
| 35 to 50 years | 145 (86.3%) | 23 (13.7%) |
| Total | 505 (81.7%) | 113 (18.3%) |
Fertility by Education in Littleton
Average fertility rate in Littleton is 60.0 births per 1,000 women. Women with the education attainment of high school diploma have the highest fertility rate of 98.0 births per 1,000 women, while women with the education attainment of less than high school have the lowest fertility at 11.0 births per 1,000 women. Women with the education attainment of bachelor's degree represent 41.7% of all women with births.
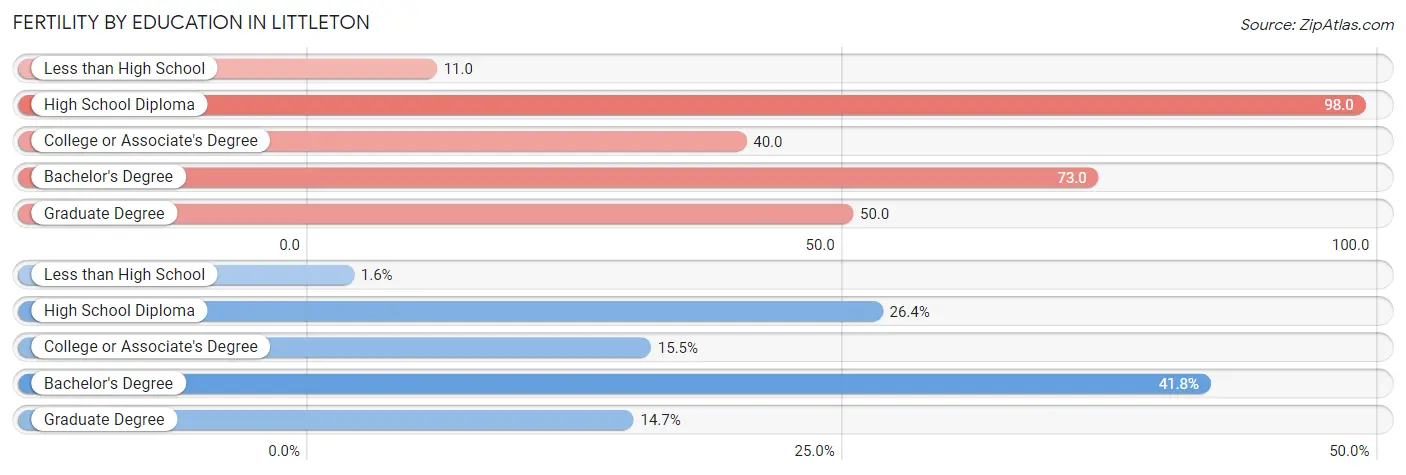
| Educational Attainment | Women with Births | Births / 1,000 Women |
| Less than High School | 10 (1.6%) | 11.0 |
| High School Diploma | 163 (26.4%) | 98.0 |
| College or Associate's Degree | 96 (15.5%) | 40.0 |
| Bachelor's Degree | 258 (41.7%) | 73.0 |
| Graduate Degree | 91 (14.7%) | 50.0 |
| Total | 618 (100.0%) | 60.0 |
Fertility by Education by Marriage Status in Littleton
18.3% of women with births in Littleton are unmarried. Women with the educational attainment of less than high school are most likely to be married with 100.0% of them married at childbirth, while women with the educational attainment of high school diploma are least likely to be married with 65.6% of them unmarried at childbirth.
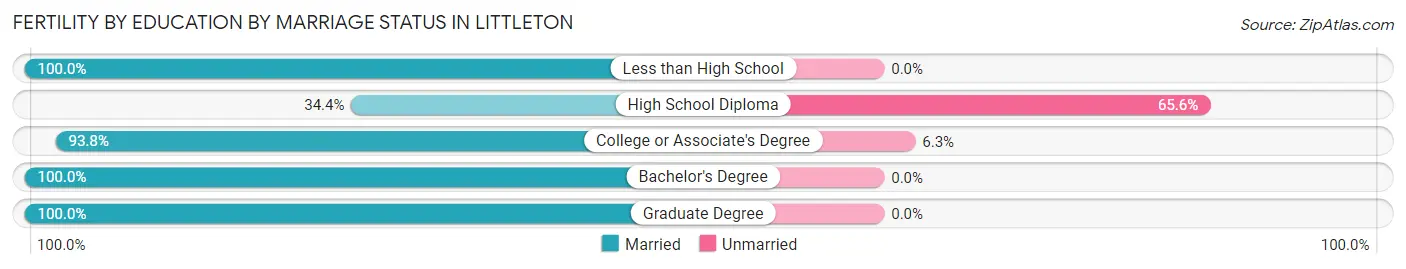
| Educational Attainment | Married | Unmarried |
| Less than High School | 10 (100.0%) | 0 (0.0%) |
| High School Diploma | 56 (34.4%) | 107 (65.6%) |
| College or Associate's Degree | 90 (93.8%) | 6 (6.2%) |
| Bachelor's Degree | 258 (100.0%) | 0 (0.0%) |
| Graduate Degree | 91 (100.0%) | 0 (0.0%) |
| Total | 505 (81.7%) | 113 (18.3%) |
Employment Characteristics in Littleton
Employment by Class of Employer in Littleton
Among the 25,431 employed individuals in Littleton, private company employees (17,302 | 68.0%), not-for-profit organizations (2,296 | 9.0%), and self-employed (not incorporated) (1,646 | 6.5%) make up the most common classes of employment.
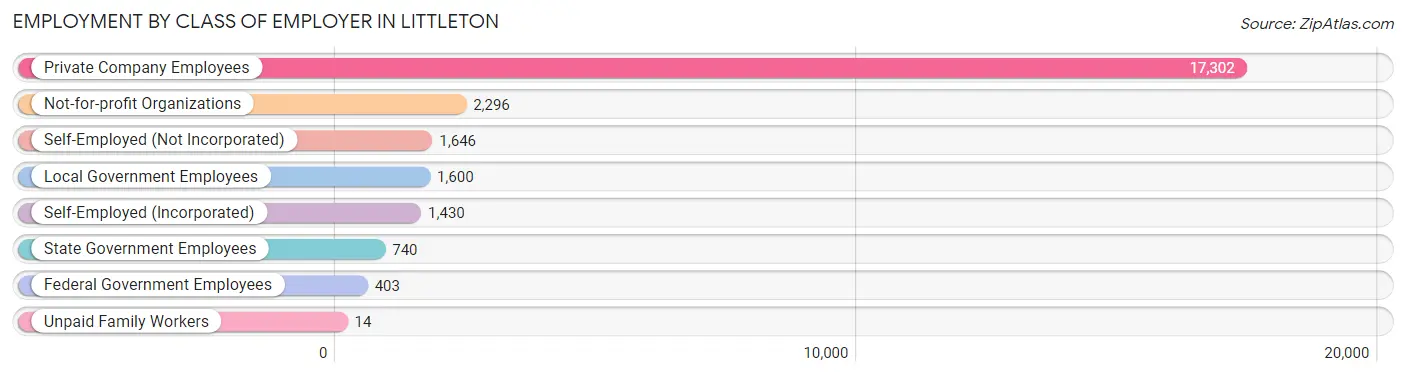
| Employer Class | # Employees | % Employees |
| Private Company Employees | 17,302 | 68.0% |
| Self-Employed (Incorporated) | 1,430 | 5.6% |
| Self-Employed (Not Incorporated) | 1,646 | 6.5% |
| Not-for-profit Organizations | 2,296 | 9.0% |
| Local Government Employees | 1,600 | 6.3% |
| State Government Employees | 740 | 2.9% |
| Federal Government Employees | 403 | 1.6% |
| Unpaid Family Workers | 14 | 0.1% |
| Total | 25,431 | 100.0% |
Employment Status by Age in Littleton
According to the labor force statistics for Littleton, out of the total population over 16 years of age (38,395), 70.2% or 26,953 individuals are in the labor force, with 3.9% or 1,051 of them unemployed. The age group with the highest labor force participation rate is 35 to 44 years, with 92.4% or 5,499 individuals in the labor force. Within the labor force, the 16 to 19 years age range has the highest percentage of unemployed individuals, with 14.7% or 123 of them being unemployed.
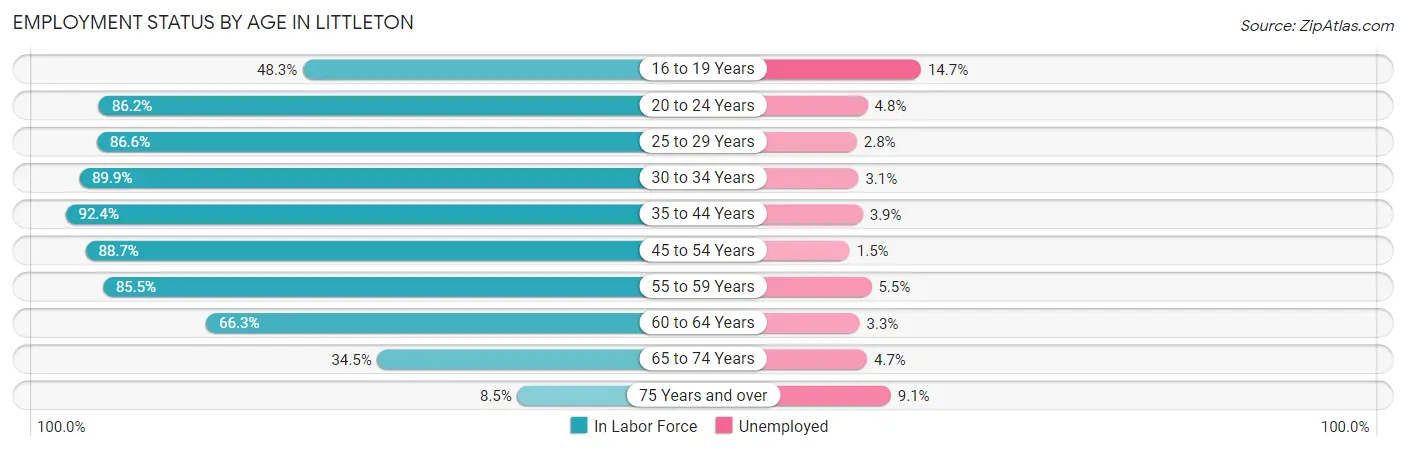
| Age Bracket | In Labor Force | Unemployed |
| 16 to 19 Years | 834 (48.3%) | 123 (14.7%) |
| 20 to 24 Years | 1,977 (86.2%) | 95 (4.8%) |
| 25 to 29 Years | 3,495 (86.6%) | 98 (2.8%) |
| 30 to 34 Years | 3,847 (89.9%) | 119 (3.1%) |
| 35 to 44 Years | 5,499 (92.4%) | 214 (3.9%) |
| 45 to 54 Years | 4,385 (88.7%) | 66 (1.5%) |
| 55 to 59 Years | 2,745 (85.5%) | 151 (5.5%) |
| 60 to 64 Years | 2,153 (66.3%) | 71 (3.3%) |
| 65 to 74 Years | 1,713 (34.5%) | 81 (4.7%) |
| 75 Years and over | 318 (8.5%) | 29 (9.1%) |
| Total | 26,953 (70.2%) | 1,051 (3.9%) |
Employment Status by Educational Attainment in Littleton
According to labor force statistics for Littleton, 86.2% of individuals (22,127) out of the total population between 25 and 64 years of age (25,669) are in the labor force, with 3.3% or 730 of them being unemployed. The group with the highest labor force participation rate are those with the educational attainment of bachelor's degree or higher, with 89.8% or 13,580 individuals in the labor force. Within the labor force, individuals with college / associate degree education have the highest percentage of unemployment, with 5.2% or 248 of them being unemployed.
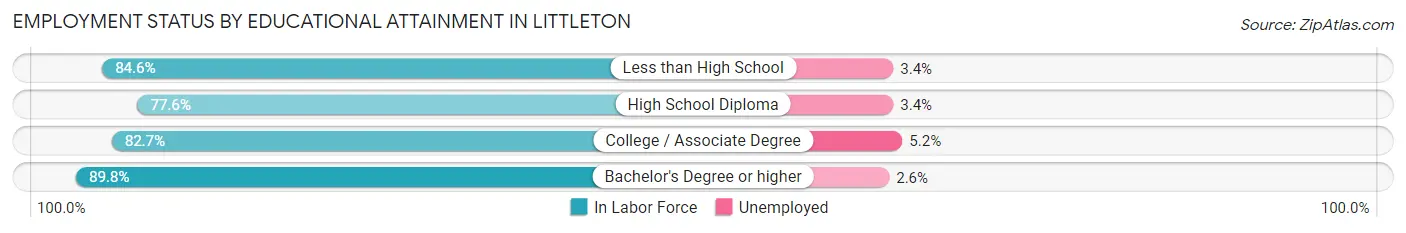
| Educational Attainment | In Labor Force | Unemployed |
| Less than High School | 814 (84.6%) | 33 (3.4%) |
| High School Diploma | 2,969 (77.6%) | 130 (3.4%) |
| College / Associate Degree | 4,762 (82.7%) | 299 (5.2%) |
| Bachelor's Degree or higher | 13,580 (89.8%) | 393 (2.6%) |
| Total | 22,127 (86.2%) | 847 (3.3%) |
Employment Occupations by Sex in Littleton
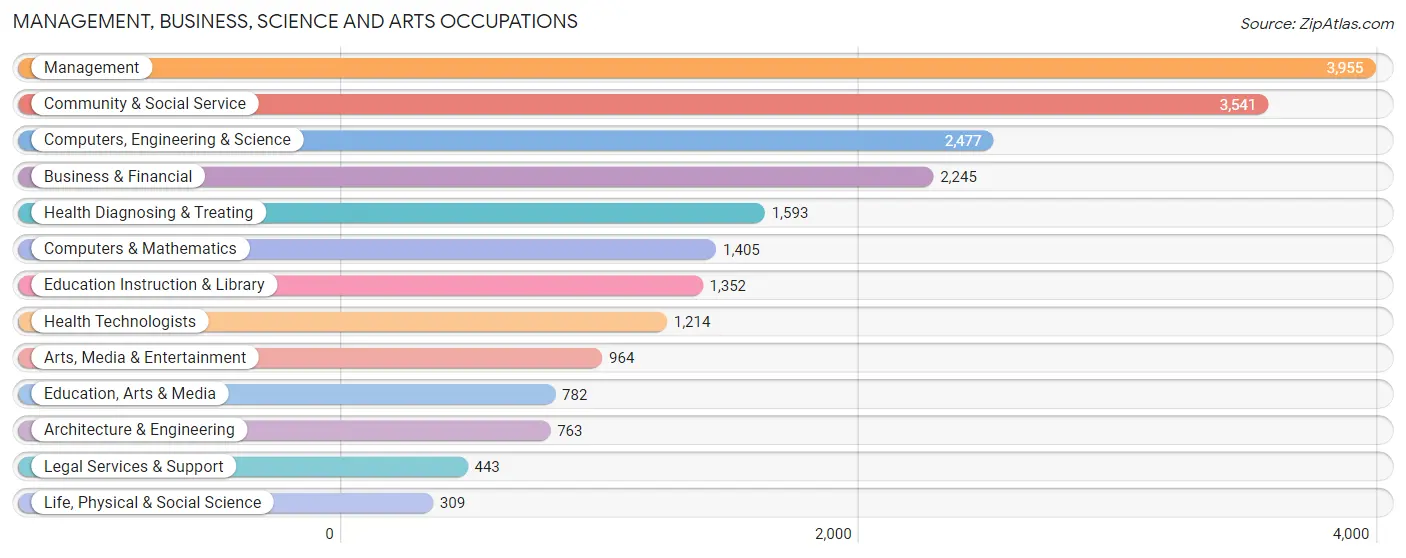
Management, Business, Science and Arts Occupations
The most common Management, Business, Science and Arts occupations in Littleton are Management (3,955 | 15.3%), Community & Social Service (3,541 | 13.7%), Computers, Engineering & Science (2,477 | 9.6%), Business & Financial (2,245 | 8.7%), and Health Diagnosing & Treating (1,593 | 6.2%).
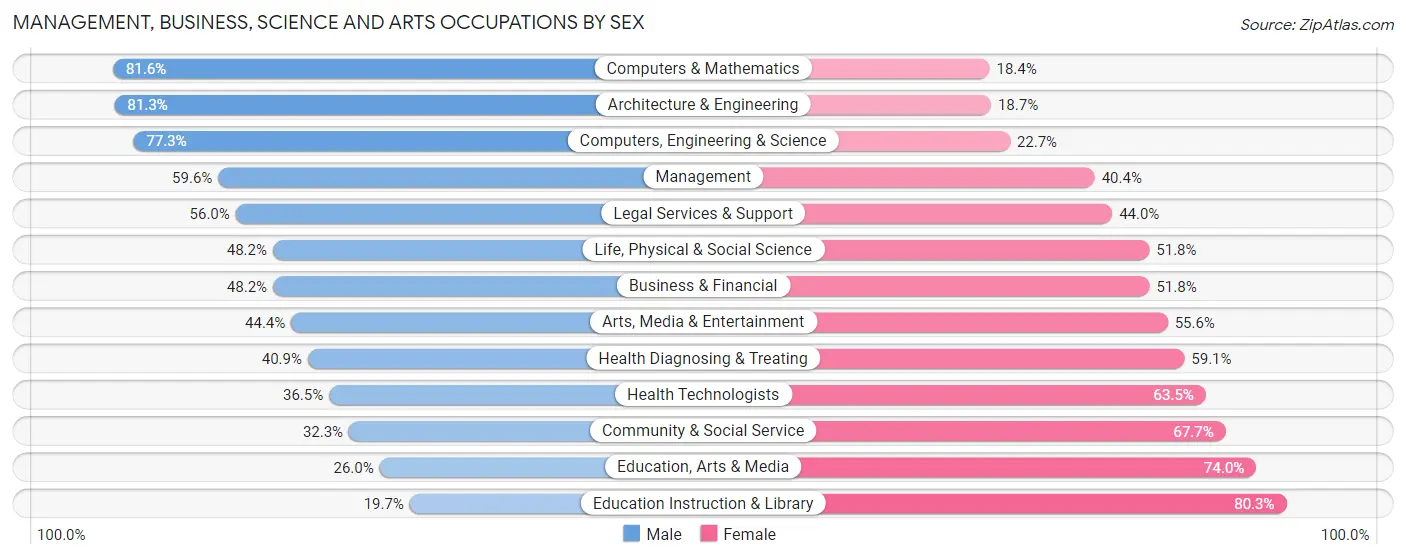
Management, Business, Science and Arts Occupations by Sex
Within the Management, Business, Science and Arts occupations in Littleton, the most male-oriented occupations are Computers & Mathematics (81.6%), Architecture & Engineering (81.3%), and Computers, Engineering & Science (77.3%), while the most female-oriented occupations are Education Instruction & Library (80.3%), Education, Arts & Media (74.0%), and Community & Social Service (67.7%).
| Occupation | Male | Female |
| Management | 2,358 (59.6%) | 1,597 (40.4%) |
| Business & Financial | 1,082 (48.2%) | 1,163 (51.8%) |
| Computers, Engineering & Science | 1,915 (77.3%) | 562 (22.7%) |
| Computers & Mathematics | 1,146 (81.6%) | 259 (18.4%) |
| Architecture & Engineering | 620 (81.3%) | 143 (18.7%) |
| Life, Physical & Social Science | 149 (48.2%) | 160 (51.8%) |
| Community & Social Service | 1,145 (32.3%) | 2,396 (67.7%) |
| Education, Arts & Media | 203 (26.0%) | 579 (74.0%) |
| Legal Services & Support | 248 (56.0%) | 195 (44.0%) |
| Education Instruction & Library | 266 (19.7%) | 1,086 (80.3%) |
| Arts, Media & Entertainment | 428 (44.4%) | 536 (55.6%) |
| Health Diagnosing & Treating | 652 (40.9%) | 941 (59.1%) |
| Health Technologists | 443 (36.5%) | 771 (63.5%) |
| Total (Category) | 7,152 (51.8%) | 6,659 (48.2%) |
| Total (Overall) | 13,829 (53.4%) | 12,048 (46.6%) |
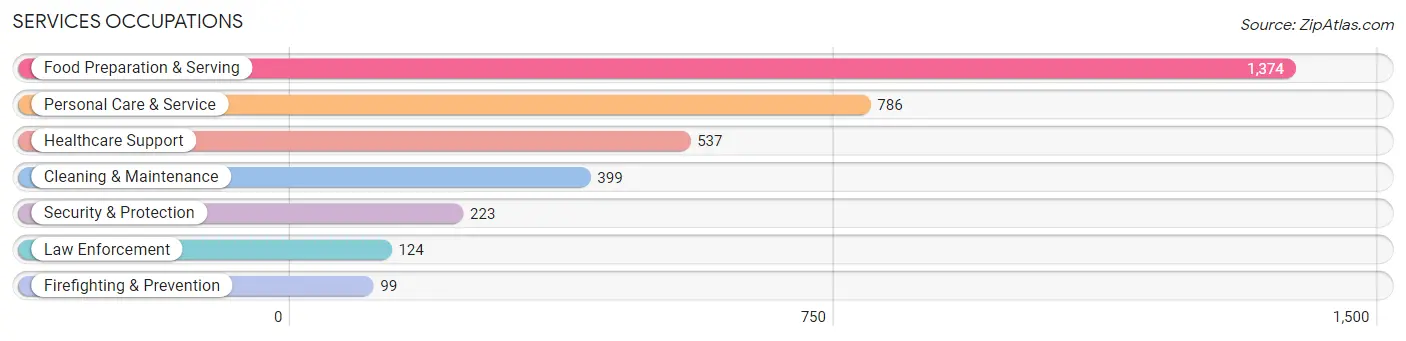
Services Occupations
The most common Services occupations in Littleton are Food Preparation & Serving (1,374 | 5.3%), Personal Care & Service (786 | 3.0%), Healthcare Support (537 | 2.1%), Cleaning & Maintenance (399 | 1.5%), and Security & Protection (223 | 0.9%).
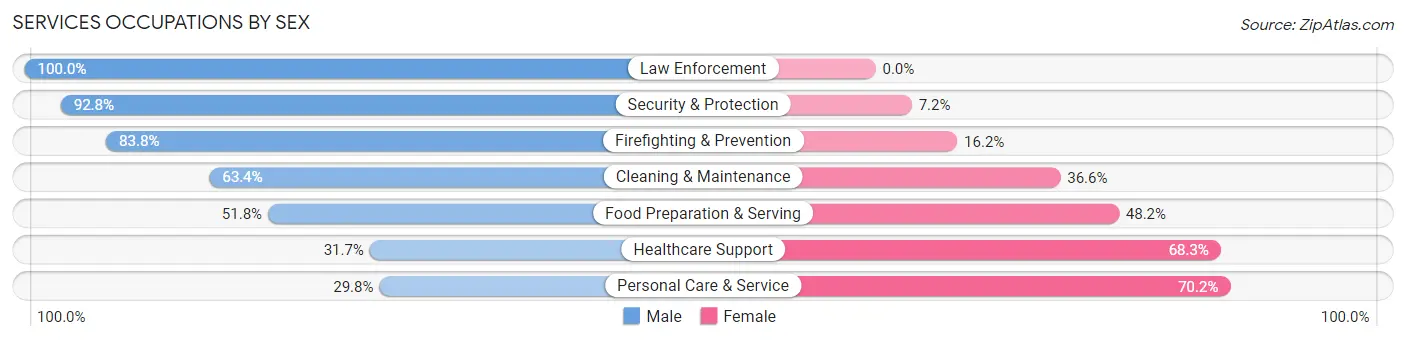
Services Occupations by Sex
Within the Services occupations in Littleton, the most male-oriented occupations are Law Enforcement (100.0%), Security & Protection (92.8%), and Firefighting & Prevention (83.8%), while the most female-oriented occupations are Personal Care & Service (70.2%), Healthcare Support (68.3%), and Food Preparation & Serving (48.2%).
| Occupation | Male | Female |
| Healthcare Support | 170 (31.7%) | 367 (68.3%) |
| Security & Protection | 207 (92.8%) | 16 (7.2%) |
| Firefighting & Prevention | 83 (83.8%) | 16 (16.2%) |
| Law Enforcement | 124 (100.0%) | 0 (0.0%) |
| Food Preparation & Serving | 712 (51.8%) | 662 (48.2%) |
| Cleaning & Maintenance | 253 (63.4%) | 146 (36.6%) |
| Personal Care & Service | 234 (29.8%) | 552 (70.2%) |
| Total (Category) | 1,576 (47.5%) | 1,743 (52.5%) |
| Total (Overall) | 13,829 (53.4%) | 12,048 (46.6%) |
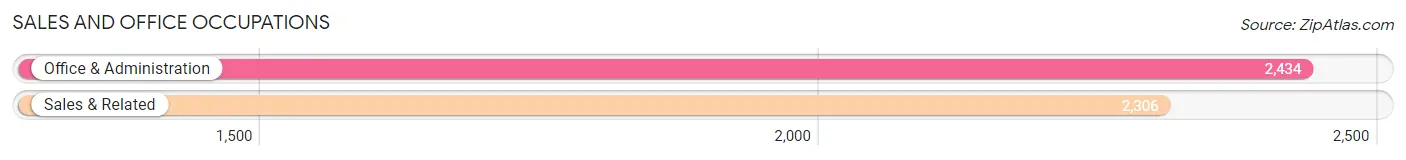
Sales and Office Occupations
The most common Sales and Office occupations in Littleton are Office & Administration (2,434 | 9.4%), and Sales & Related (2,306 | 8.9%).
Sales and Office Occupations by Sex
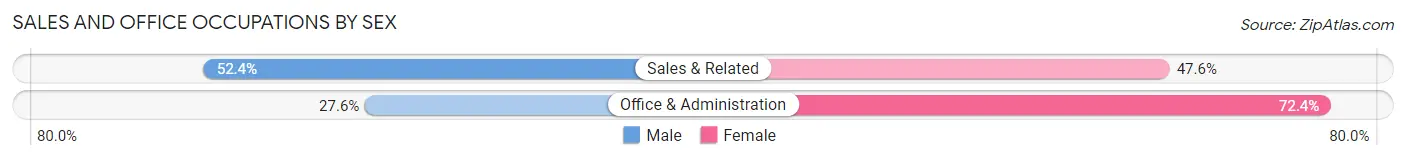
| Occupation | Male | Female |
| Sales & Related | 1,209 (52.4%) | 1,097 (47.6%) |
| Office & Administration | 672 (27.6%) | 1,762 (72.4%) |
| Total (Category) | 1,881 (39.7%) | 2,859 (60.3%) |
| Total (Overall) | 13,829 (53.4%) | 12,048 (46.6%) |
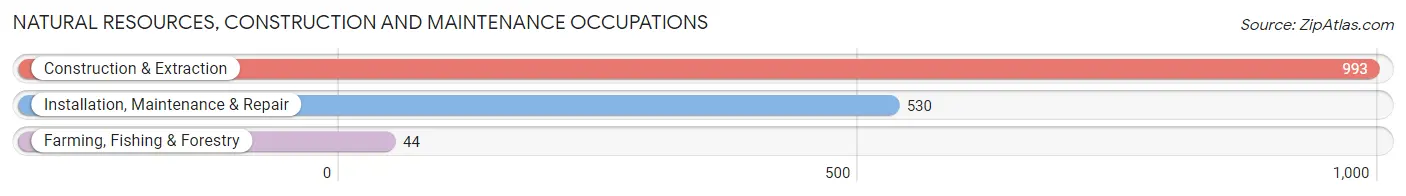
Natural Resources, Construction and Maintenance Occupations
The most common Natural Resources, Construction and Maintenance occupations in Littleton are Construction & Extraction (993 | 3.8%), Installation, Maintenance & Repair (530 | 2.1%), and Farming, Fishing & Forestry (44 | 0.2%).
Natural Resources, Construction and Maintenance Occupations by Sex
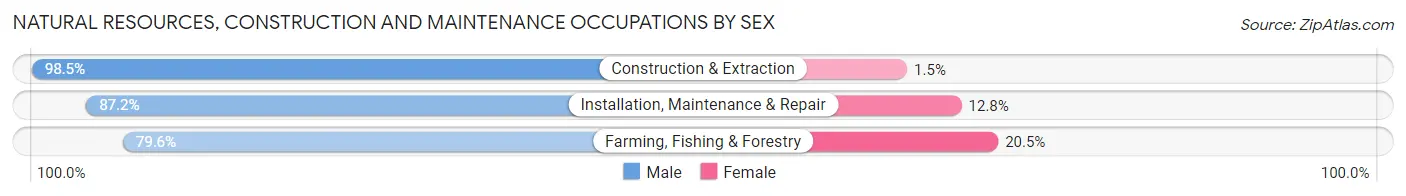
| Occupation | Male | Female |
| Farming, Fishing & Forestry | 35 (79.5%) | 9 (20.4%) |
| Construction & Extraction | 978 (98.5%) | 15 (1.5%) |
| Installation, Maintenance & Repair | 462 (87.2%) | 68 (12.8%) |
| Total (Category) | 1,475 (94.1%) | 92 (5.9%) |
| Total (Overall) | 13,829 (53.4%) | 12,048 (46.6%) |
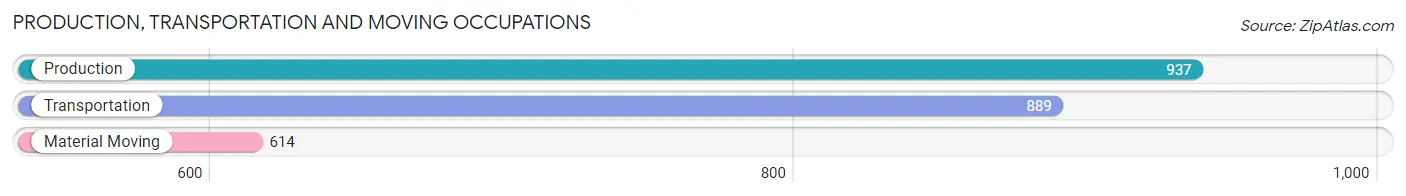
Production, Transportation and Moving Occupations
The most common Production, Transportation and Moving occupations in Littleton are Production (937 | 3.6%), Transportation (889 | 3.4%), and Material Moving (614 | 2.4%).
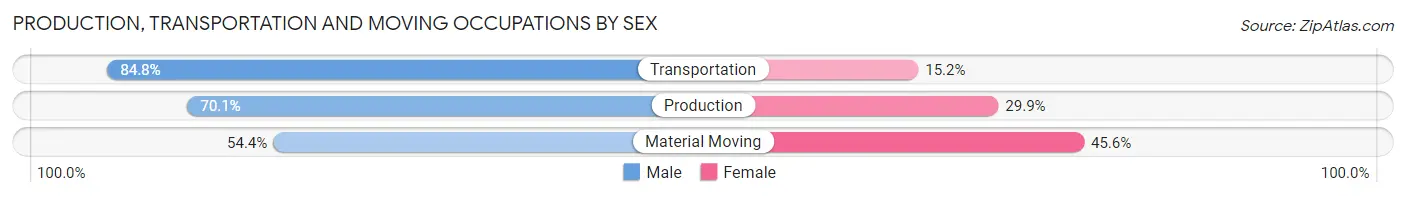
Production, Transportation and Moving Occupations by Sex
| Occupation | Male | Female |
| Production | 657 (70.1%) | 280 (29.9%) |
| Transportation | 754 (84.8%) | 135 (15.2%) |
| Material Moving | 334 (54.4%) | 280 (45.6%) |
| Total (Category) | 1,745 (71.5%) | 695 (28.5%) |
| Total (Overall) | 13,829 (53.4%) | 12,048 (46.6%) |
Employment Industries by Sex in Littleton
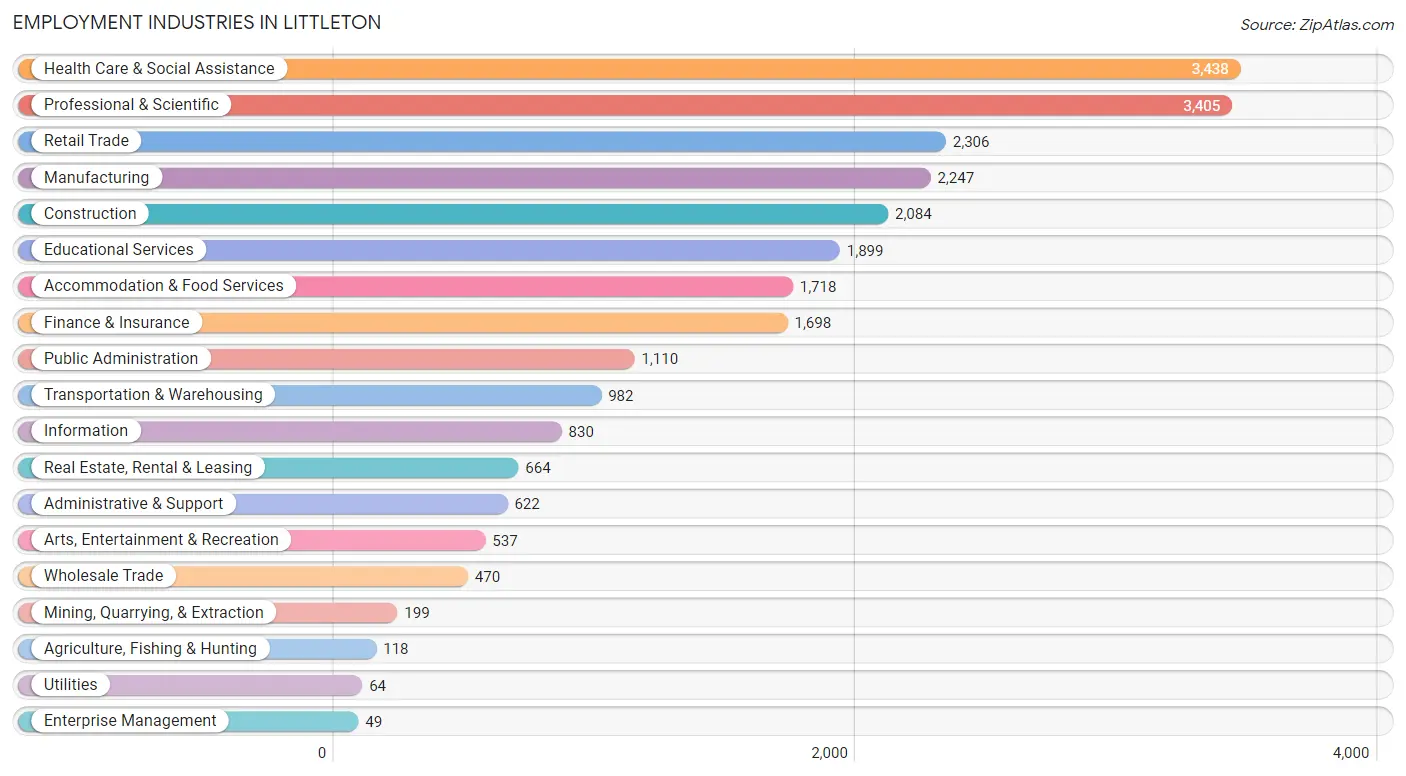
Employment Industries in Littleton
The major employment industries in Littleton include Health Care & Social Assistance (3,438 | 13.3%), Professional & Scientific (3,405 | 13.2%), Retail Trade (2,306 | 8.9%), Manufacturing (2,247 | 8.7%), and Construction (2,084 | 8.1%).
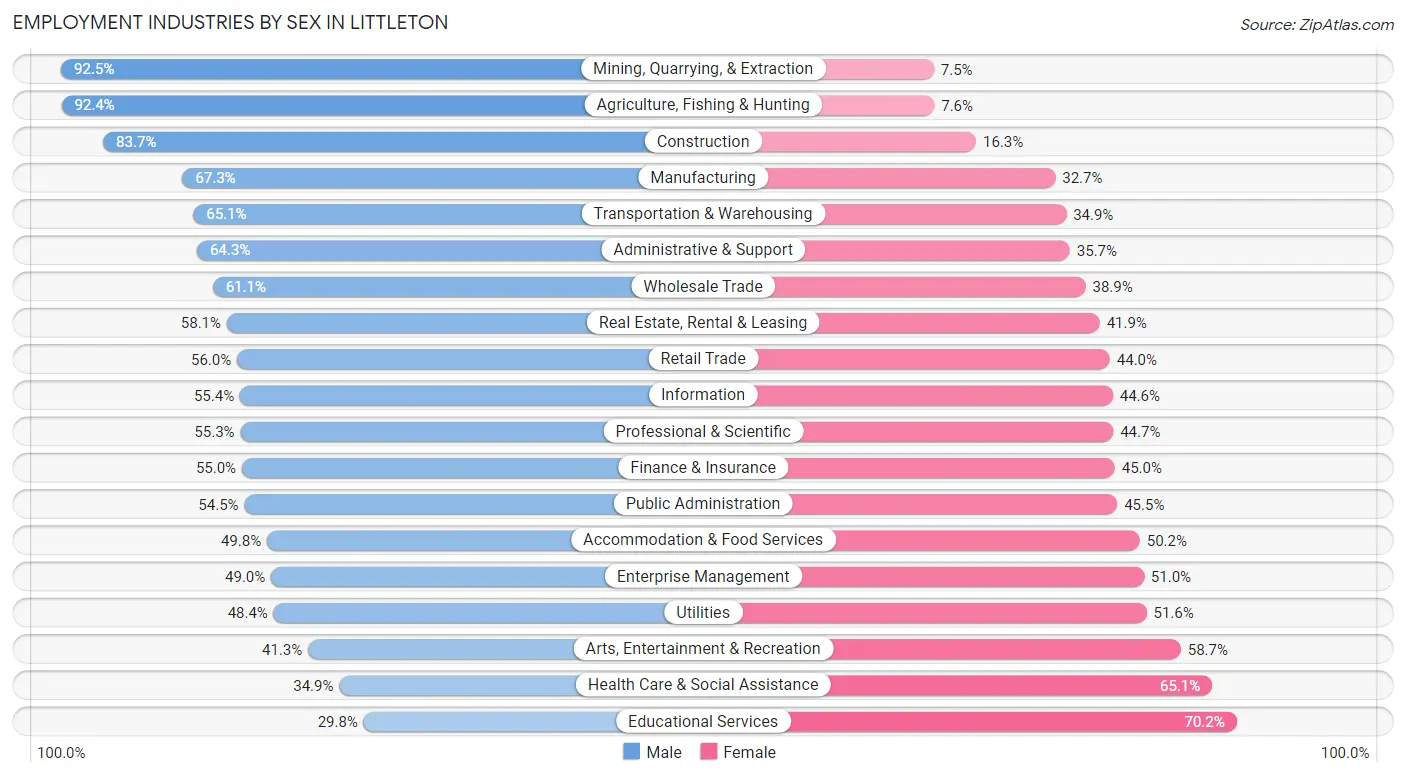
Employment Industries by Sex in Littleton
The Littleton industries that see more men than women are Mining, Quarrying, & Extraction (92.5%), Agriculture, Fishing & Hunting (92.4%), and Construction (83.7%), whereas the industries that tend to have a higher number of women are Educational Services (70.2%), Health Care & Social Assistance (65.1%), and Arts, Entertainment & Recreation (58.7%).
| Industry | Male | Female |
| Agriculture, Fishing & Hunting | 109 (92.4%) | 9 (7.6%) |
| Mining, Quarrying, & Extraction | 184 (92.5%) | 15 (7.5%) |
| Construction | 1,745 (83.7%) | 339 (16.3%) |
| Manufacturing | 1,513 (67.3%) | 734 (32.7%) |
| Wholesale Trade | 287 (61.1%) | 183 (38.9%) |
| Retail Trade | 1,292 (56.0%) | 1,014 (44.0%) |
| Transportation & Warehousing | 639 (65.1%) | 343 (34.9%) |
| Utilities | 31 (48.4%) | 33 (51.6%) |
| Information | 460 (55.4%) | 370 (44.6%) |
| Finance & Insurance | 934 (55.0%) | 764 (45.0%) |
| Real Estate, Rental & Leasing | 386 (58.1%) | 278 (41.9%) |
| Professional & Scientific | 1,884 (55.3%) | 1,521 (44.7%) |
| Enterprise Management | 24 (49.0%) | 25 (51.0%) |
| Administrative & Support | 400 (64.3%) | 222 (35.7%) |
| Educational Services | 566 (29.8%) | 1,333 (70.2%) |
| Health Care & Social Assistance | 1,199 (34.9%) | 2,239 (65.1%) |
| Arts, Entertainment & Recreation | 222 (41.3%) | 315 (58.7%) |
| Accommodation & Food Services | 856 (49.8%) | 862 (50.2%) |
| Public Administration | 605 (54.5%) | 505 (45.5%) |
| Total | 13,829 (53.4%) | 12,048 (46.6%) |
Education in Littleton
School Enrollment in Littleton
The most common levels of schooling among the 8,333 students in Littleton are elementary school (1,962 | 23.5%), high school (1,695 | 20.3%), and middle school (1,516 | 18.2%).
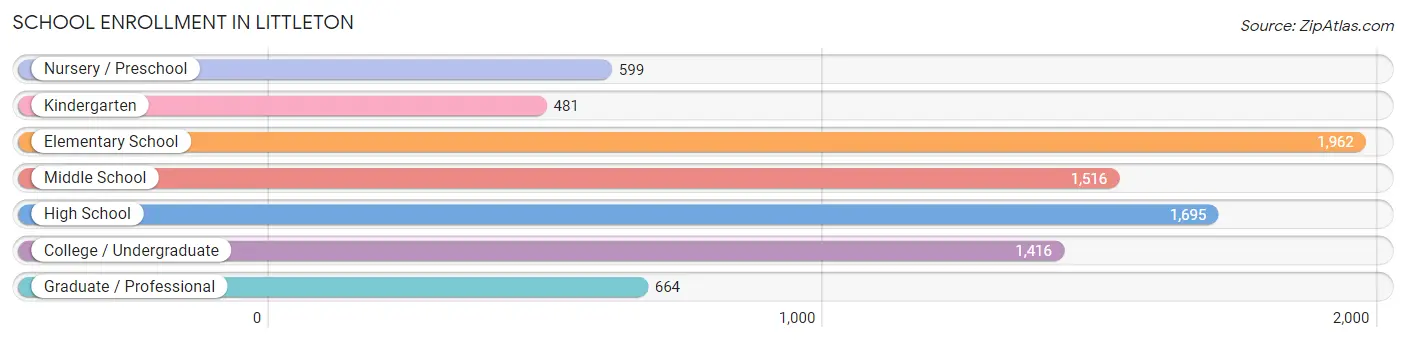
| School Level | # Students | % Students |
| Nursery / Preschool | 599 | 7.2% |
| Kindergarten | 481 | 5.8% |
| Elementary School | 1,962 | 23.5% |
| Middle School | 1,516 | 18.2% |
| High School | 1,695 | 20.3% |
| College / Undergraduate | 1,416 | 17.0% |
| Graduate / Professional | 664 | 8.0% |
| Total | 8,333 | 100.0% |
School Enrollment by Age by Funding Source in Littleton
Out of a total of 8,333 students who are enrolled in schools in Littleton, 1,750 (21.0%) attend a private institution, while the remaining 6,583 (79.0%) are enrolled in public schools. The age group of 3 to 4 year olds has the highest likelihood of being enrolled in private schools, with 177 (44.6% in the age bracket) enrolled. Conversely, the age group of 15 to 17 year olds has the lowest likelihood of being enrolled in a private school, with 1,094 (90.0% in the age bracket) attending a public institution.
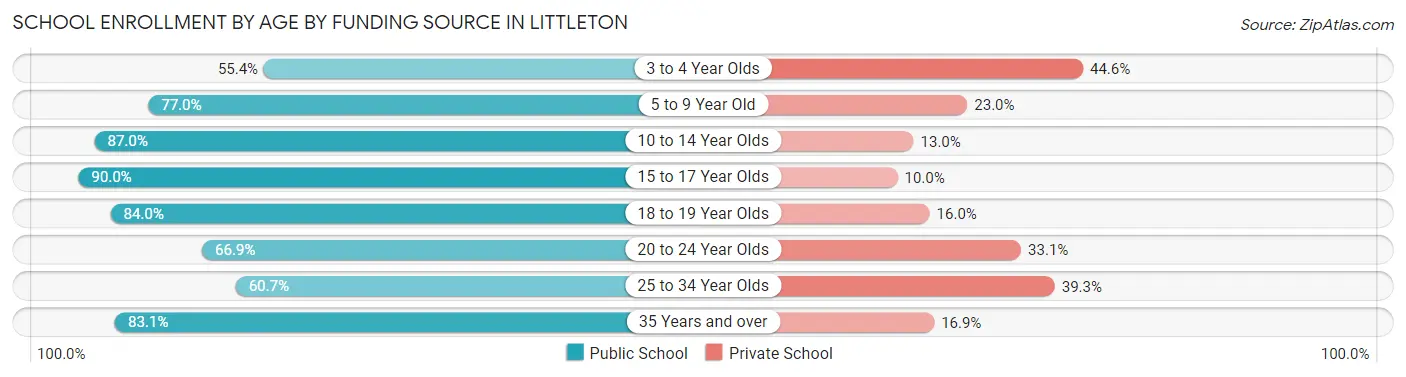
| Age Bracket | Public School | Private School |
| 3 to 4 Year Olds | 220 (55.4%) | 177 (44.6%) |
| 5 to 9 Year Old | 1,824 (77.0%) | 546 (23.0%) |
| 10 to 14 Year Olds | 1,836 (87.0%) | 275 (13.0%) |
| 15 to 17 Year Olds | 1,094 (90.0%) | 122 (10.0%) |
| 18 to 19 Year Olds | 519 (84.0%) | 99 (16.0%) |
| 20 to 24 Year Olds | 330 (66.9%) | 163 (33.1%) |
| 25 to 34 Year Olds | 472 (60.7%) | 306 (39.3%) |
| 35 Years and over | 291 (83.1%) | 59 (16.9%) |
| Total | 6,583 (79.0%) | 1,750 (21.0%) |
Educational Attainment by Field of Study in Littleton
Business (3,619 | 16.9%), engineering (1,919 | 9.0%), social sciences (1,871 | 8.7%), bio, nature & agricultural (1,643 | 7.7%), and science & technology (1,602 | 7.5%) are the most common fields of study among 21,381 individuals in Littleton who have obtained a bachelor's degree or higher.
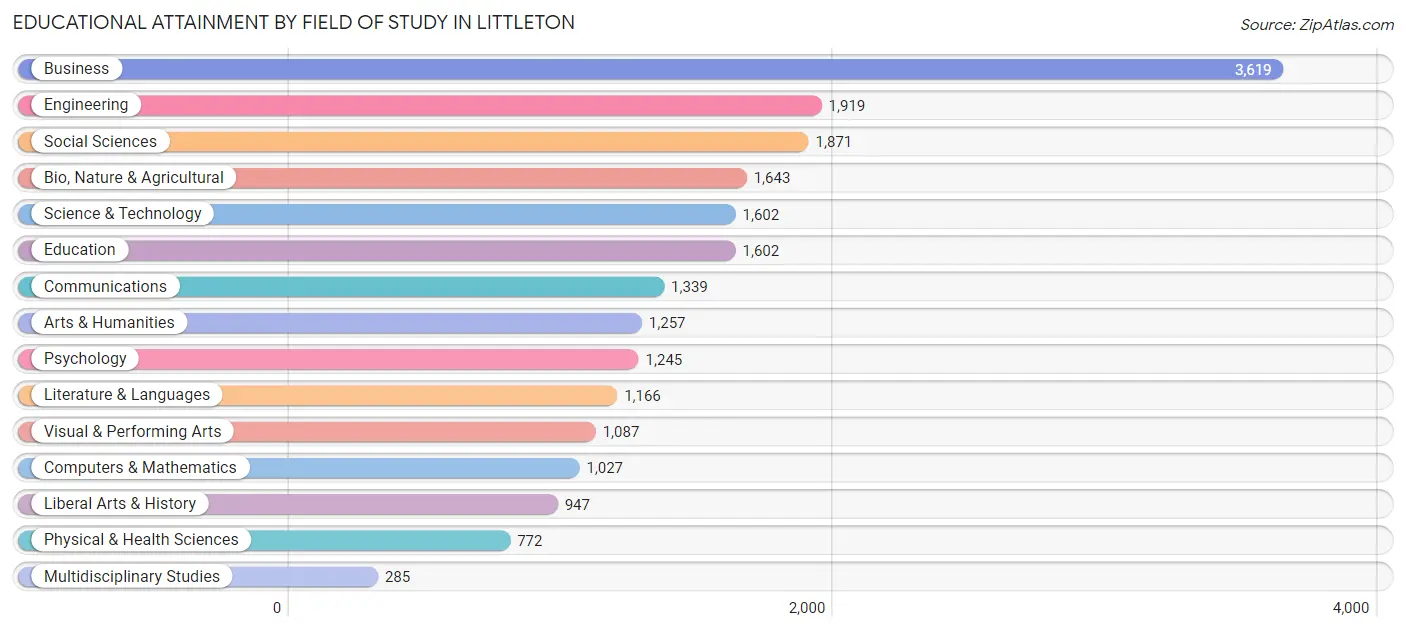
| Field of Study | # Graduates | % Graduates |
| Computers & Mathematics | 1,027 | 4.8% |
| Bio, Nature & Agricultural | 1,643 | 7.7% |
| Physical & Health Sciences | 772 | 3.6% |
| Psychology | 1,245 | 5.8% |
| Social Sciences | 1,871 | 8.7% |
| Engineering | 1,919 | 9.0% |
| Multidisciplinary Studies | 285 | 1.3% |
| Science & Technology | 1,602 | 7.5% |
| Business | 3,619 | 16.9% |
| Education | 1,602 | 7.5% |
| Literature & Languages | 1,166 | 5.4% |
| Liberal Arts & History | 947 | 4.4% |
| Visual & Performing Arts | 1,087 | 5.1% |
| Communications | 1,339 | 6.3% |
| Arts & Humanities | 1,257 | 5.9% |
| Total | 21,381 | 100.0% |
Transportation & Commute in Littleton
Vehicle Availability by Sex in Littleton
The most prevalent vehicle ownership categories in Littleton are males with 2 vehicles (6,150, accounting for 45.4%) and females with 2 vehicles (5,541, making up 51.9%).
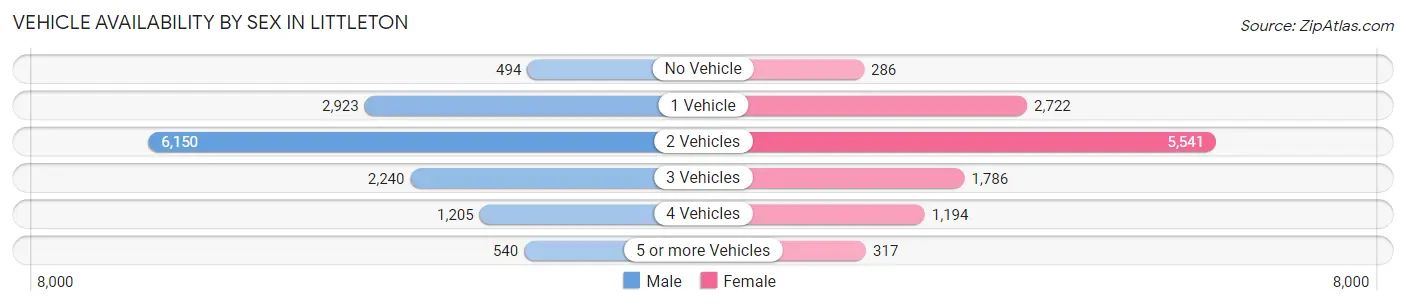
| Vehicles Available | Male | Female |
| No Vehicle | 494 (3.6%) | 286 (2.4%) |
| 1 Vehicle | 2,923 (21.6%) | 2,722 (23.0%) |
| 2 Vehicles | 6,150 (45.4%) | 5,541 (46.8%) |
| 3 Vehicles | 2,240 (16.5%) | 1,786 (15.1%) |
| 4 Vehicles | 1,205 (8.9%) | 1,194 (10.1%) |
| 5 or more Vehicles | 540 (4.0%) | 317 (2.7%) |
| Total | 13,552 (100.0%) | 11,846 (100.0%) |
Commute Time in Littleton
The most frequently occuring commute durations in Littleton are 20 to 24 minutes (3,276 commuters, 15.8%), 30 to 34 minutes (3,120 commuters, 15.1%), and 15 to 19 minutes (2,486 commuters, 12.0%).
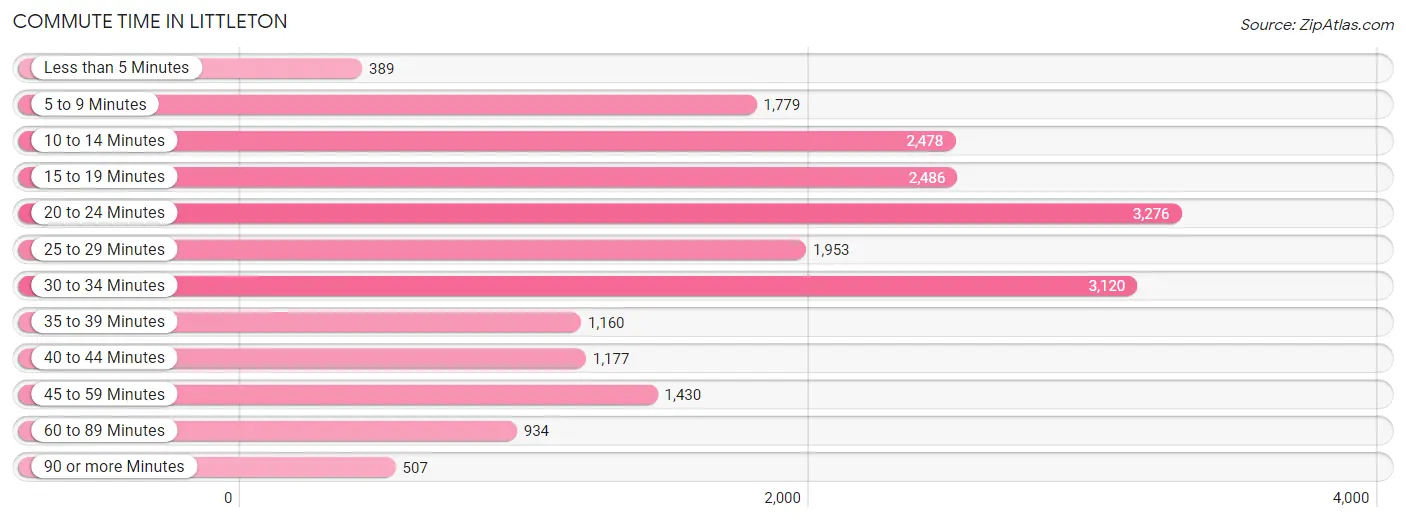
| Commute Time | # Commuters | % Commuters |
| Less than 5 Minutes | 389 | 1.9% |
| 5 to 9 Minutes | 1,779 | 8.6% |
| 10 to 14 Minutes | 2,478 | 12.0% |
| 15 to 19 Minutes | 2,486 | 12.0% |
| 20 to 24 Minutes | 3,276 | 15.8% |
| 25 to 29 Minutes | 1,953 | 9.4% |
| 30 to 34 Minutes | 3,120 | 15.1% |
| 35 to 39 Minutes | 1,160 | 5.6% |
| 40 to 44 Minutes | 1,177 | 5.7% |
| 45 to 59 Minutes | 1,430 | 6.9% |
| 60 to 89 Minutes | 934 | 4.5% |
| 90 or more Minutes | 507 | 2.5% |
Commute Time by Sex in Littleton
The most common commute times in Littleton are 20 to 24 minutes (1,923 commuters, 17.4%) for males and 30 to 34 minutes (1,475 commuters, 15.2%) for females.
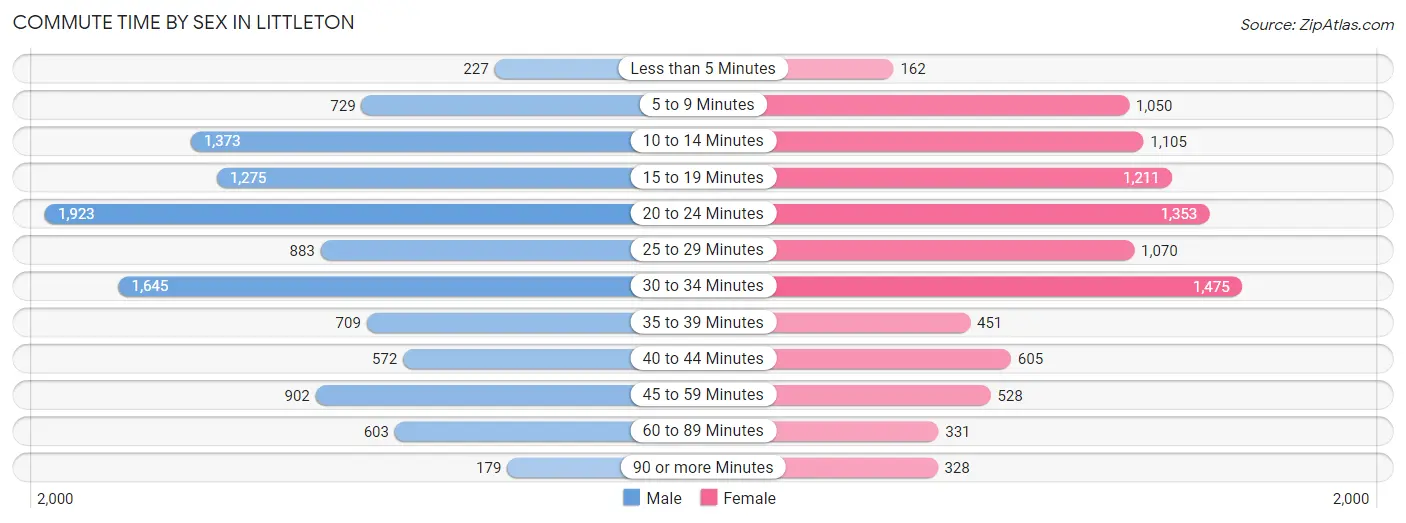
| Commute Time | Male | Female |
| Less than 5 Minutes | 227 (2.1%) | 162 (1.7%) |
| 5 to 9 Minutes | 729 (6.6%) | 1,050 (10.9%) |
| 10 to 14 Minutes | 1,373 (12.5%) | 1,105 (11.4%) |
| 15 to 19 Minutes | 1,275 (11.6%) | 1,211 (12.5%) |
| 20 to 24 Minutes | 1,923 (17.4%) | 1,353 (14.0%) |
| 25 to 29 Minutes | 883 (8.0%) | 1,070 (11.1%) |
| 30 to 34 Minutes | 1,645 (14.9%) | 1,475 (15.2%) |
| 35 to 39 Minutes | 709 (6.4%) | 451 (4.7%) |
| 40 to 44 Minutes | 572 (5.2%) | 605 (6.3%) |
| 45 to 59 Minutes | 902 (8.2%) | 528 (5.5%) |
| 60 to 89 Minutes | 603 (5.5%) | 331 (3.4%) |
| 90 or more Minutes | 179 (1.6%) | 328 (3.4%) |
Time of Departure to Work by Sex in Littleton
The most frequent times of departure to work in Littleton are 7:00 AM to 7:29 AM (1,460, 13.3%) for males and 8:00 AM to 8:29 AM (1,735, 17.9%) for females.
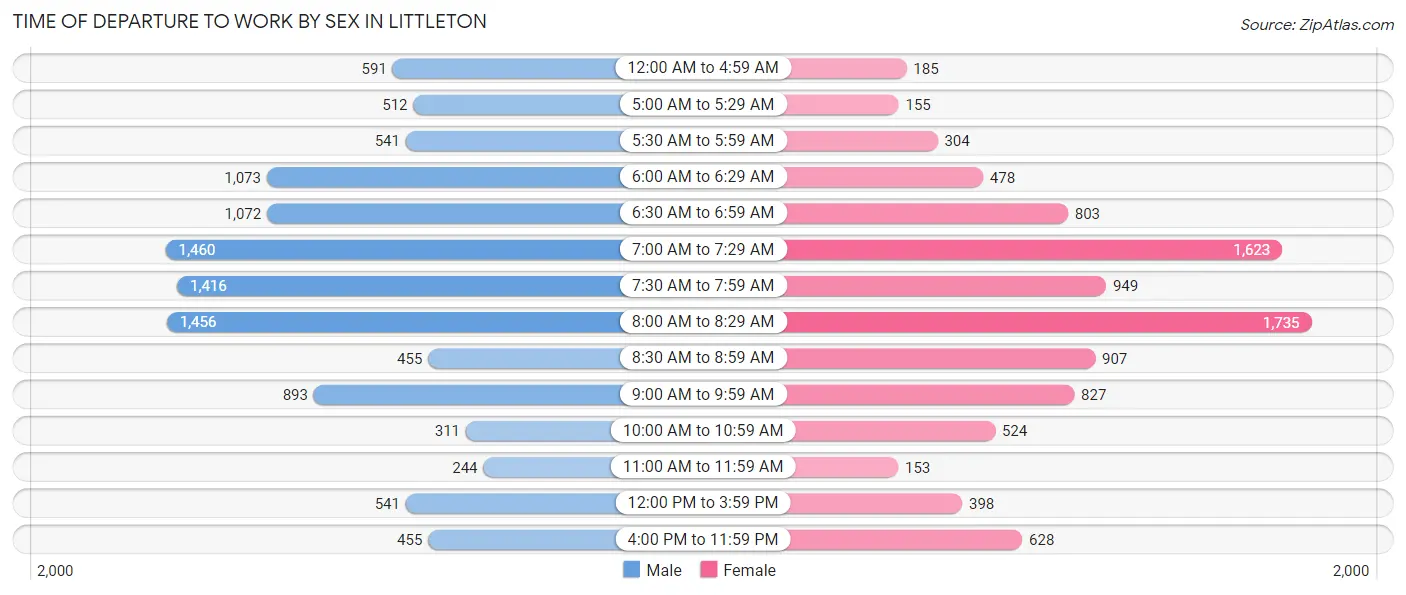
| Time of Departure | Male | Female |
| 12:00 AM to 4:59 AM | 591 (5.4%) | 185 (1.9%) |
| 5:00 AM to 5:29 AM | 512 (4.6%) | 155 (1.6%) |
| 5:30 AM to 5:59 AM | 541 (4.9%) | 304 (3.1%) |
| 6:00 AM to 6:29 AM | 1,073 (9.7%) | 478 (4.9%) |
| 6:30 AM to 6:59 AM | 1,072 (9.7%) | 803 (8.3%) |
| 7:00 AM to 7:29 AM | 1,460 (13.3%) | 1,623 (16.8%) |
| 7:30 AM to 7:59 AM | 1,416 (12.9%) | 949 (9.8%) |
| 8:00 AM to 8:29 AM | 1,456 (13.2%) | 1,735 (17.9%) |
| 8:30 AM to 8:59 AM | 455 (4.1%) | 907 (9.4%) |
| 9:00 AM to 9:59 AM | 893 (8.1%) | 827 (8.6%) |
| 10:00 AM to 10:59 AM | 311 (2.8%) | 524 (5.4%) |
| 11:00 AM to 11:59 AM | 244 (2.2%) | 153 (1.6%) |
| 12:00 PM to 3:59 PM | 541 (4.9%) | 398 (4.1%) |
| 4:00 PM to 11:59 PM | 455 (4.1%) | 628 (6.5%) |
| Total | 11,020 (100.0%) | 9,669 (100.0%) |
Housing Occupancy in Littleton
Occupancy by Ownership in Littleton
Of the total 20,484 dwellings in Littleton, owner-occupied units account for 12,328 (60.2%), while renter-occupied units make up 8,156 (39.8%).
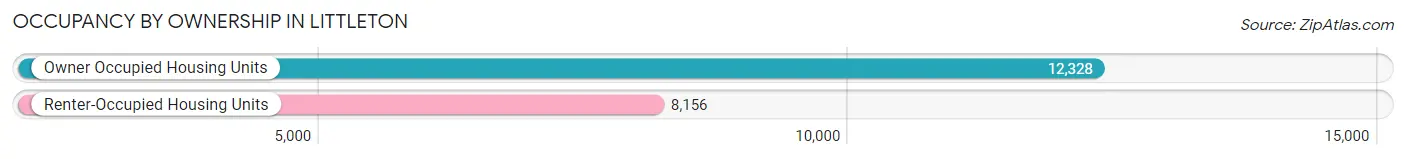
| Occupancy | # Housing Units | % Housing Units |
| Owner Occupied Housing Units | 12,328 | 60.2% |
| Renter-Occupied Housing Units | 8,156 | 39.8% |
| Total Occupied Housing Units | 20,484 | 100.0% |
Occupancy by Household Size in Littleton
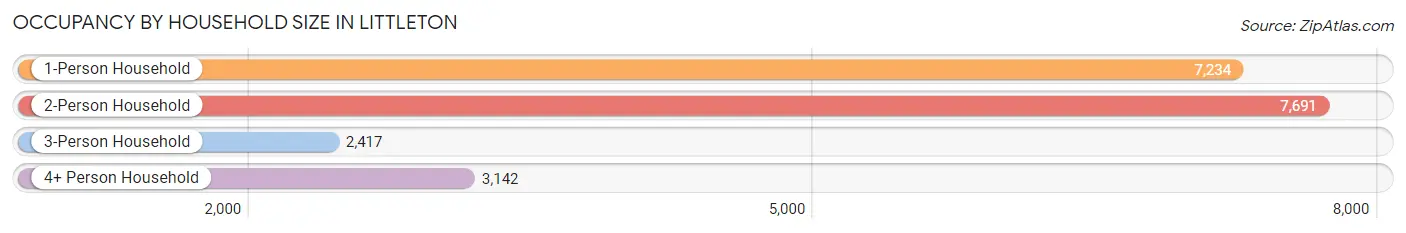
| Household Size | # Housing Units | % Housing Units |
| 1-Person Household | 7,234 | 35.3% |
| 2-Person Household | 7,691 | 37.6% |
| 3-Person Household | 2,417 | 11.8% |
| 4+ Person Household | 3,142 | 15.3% |
| Total Housing Units | 20,484 | 100.0% |
Occupancy by Ownership by Household Size in Littleton
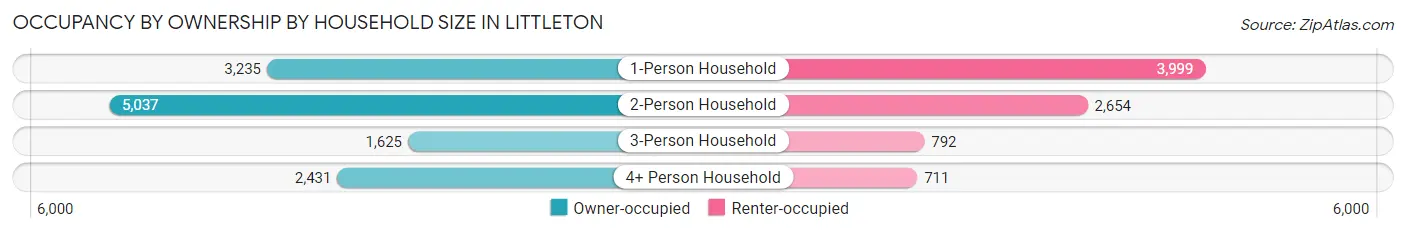
| Household Size | Owner-occupied | Renter-occupied |
| 1-Person Household | 3,235 (44.7%) | 3,999 (55.3%) |
| 2-Person Household | 5,037 (65.5%) | 2,654 (34.5%) |
| 3-Person Household | 1,625 (67.2%) | 792 (32.8%) |
| 4+ Person Household | 2,431 (77.4%) | 711 (22.6%) |
| Total Housing Units | 12,328 (60.2%) | 8,156 (39.8%) |
Occupancy by Educational Attainment in Littleton
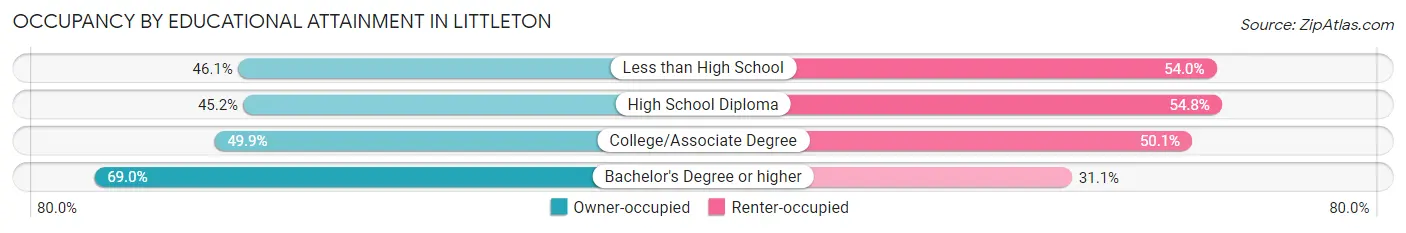
| Household Size | Owner-occupied | Renter-occupied |
| Less than High School | 239 (46.1%) | 280 (53.9%) |
| High School Diploma | 1,147 (45.2%) | 1,390 (54.8%) |
| College/Associate Degree | 2,818 (49.9%) | 2,827 (50.1%) |
| Bachelor's Degree or higher | 8,124 (69.0%) | 3,659 (31.0%) |
Occupancy by Age of Householder in Littleton
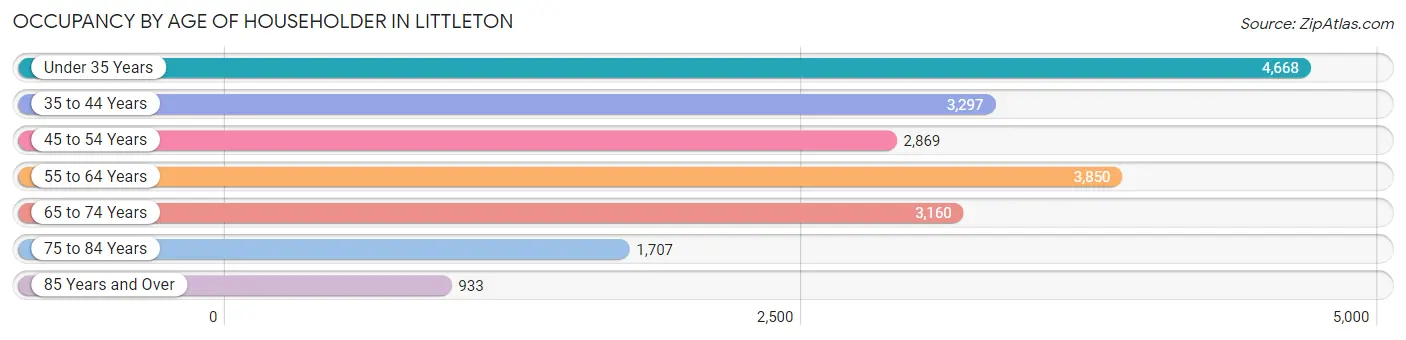
| Age Bracket | # Households | % Households |
| Under 35 Years | 4,668 | 22.8% |
| 35 to 44 Years | 3,297 | 16.1% |
| 45 to 54 Years | 2,869 | 14.0% |
| 55 to 64 Years | 3,850 | 18.8% |
| 65 to 74 Years | 3,160 | 15.4% |
| 75 to 84 Years | 1,707 | 8.3% |
| 85 Years and Over | 933 | 4.5% |
| Total | 20,484 | 100.0% |
Housing Finances in Littleton
Median Income by Occupancy in Littleton
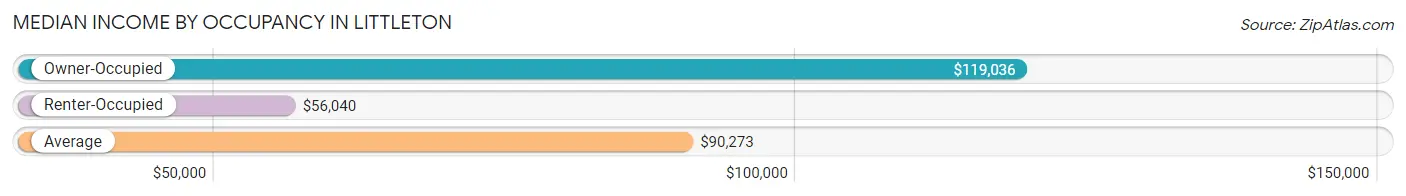
| Occupancy Type | # Households | Median Income |
| Owner-Occupied | 12,328 (60.2%) | $119,036 |
| Renter-Occupied | 8,156 (39.8%) | $56,040 |
| Average | 20,484 (100.0%) | $90,273 |
Occupancy by Householder Income Bracket in Littleton
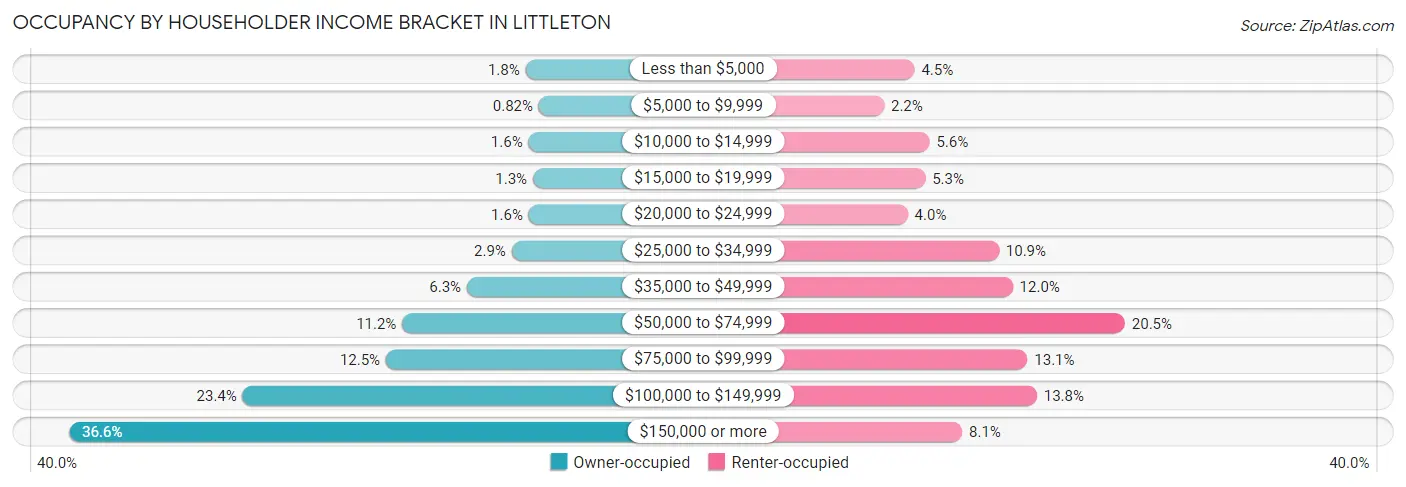
| Income Bracket | Owner-occupied | Renter-occupied |
| Less than $5,000 | 226 (1.8%) | 366 (4.5%) |
| $5,000 to $9,999 | 101 (0.8%) | 177 (2.2%) |
| $10,000 to $14,999 | 199 (1.6%) | 459 (5.6%) |
| $15,000 to $19,999 | 156 (1.3%) | 433 (5.3%) |
| $20,000 to $24,999 | 196 (1.6%) | 324 (4.0%) |
| $25,000 to $34,999 | 356 (2.9%) | 891 (10.9%) |
| $35,000 to $49,999 | 777 (6.3%) | 976 (12.0%) |
| $50,000 to $74,999 | 1,384 (11.2%) | 1,674 (20.5%) |
| $75,000 to $99,999 | 1,537 (12.5%) | 1,068 (13.1%) |
| $100,000 to $149,999 | 2,883 (23.4%) | 1,126 (13.8%) |
| $150,000 or more | 4,513 (36.6%) | 662 (8.1%) |
| Total | 12,328 (100.0%) | 8,156 (100.0%) |
Monthly Housing Cost Tiers in Littleton
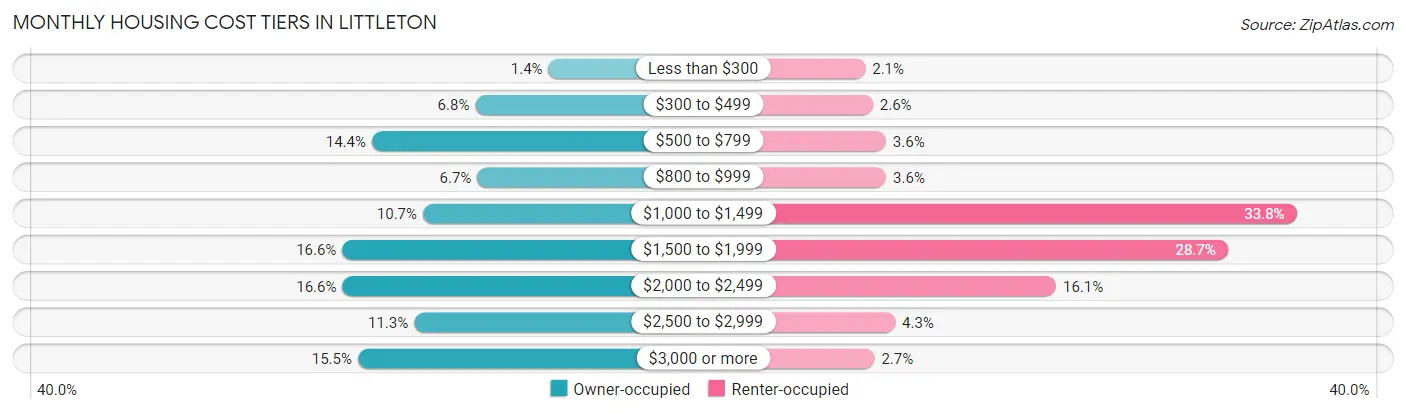
| Monthly Cost | Owner-occupied | Renter-occupied |
| Less than $300 | 175 (1.4%) | 167 (2.1%) |
| $300 to $499 | 840 (6.8%) | 213 (2.6%) |
| $500 to $799 | 1,779 (14.4%) | 291 (3.6%) |
| $800 to $999 | 822 (6.7%) | 293 (3.6%) |
| $1,000 to $1,499 | 1,315 (10.7%) | 2,757 (33.8%) |
| $1,500 to $1,999 | 2,048 (16.6%) | 2,343 (28.7%) |
| $2,000 to $2,499 | 2,047 (16.6%) | 1,313 (16.1%) |
| $2,500 to $2,999 | 1,396 (11.3%) | 347 (4.3%) |
| $3,000 or more | 1,906 (15.5%) | 223 (2.7%) |
| Total | 12,328 (100.0%) | 8,156 (100.0%) |
Physical Housing Characteristics in Littleton
Housing Structures in Littleton
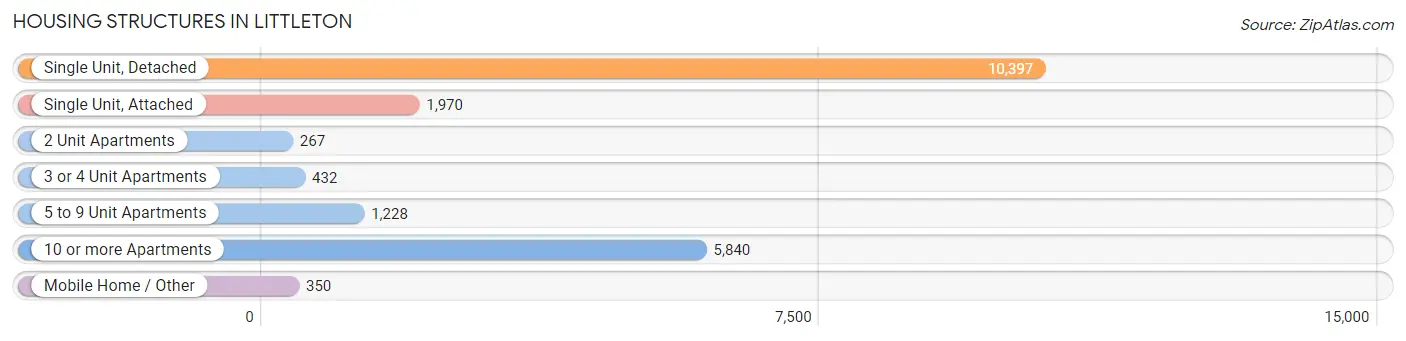
| Structure Type | # Housing Units | % Housing Units |
| Single Unit, Detached | 10,397 | 50.8% |
| Single Unit, Attached | 1,970 | 9.6% |
| 2 Unit Apartments | 267 | 1.3% |
| 3 or 4 Unit Apartments | 432 | 2.1% |
| 5 to 9 Unit Apartments | 1,228 | 6.0% |
| 10 or more Apartments | 5,840 | 28.5% |
| Mobile Home / Other | 350 | 1.7% |
| Total | 20,484 | 100.0% |
Housing Structures by Occupancy in Littleton
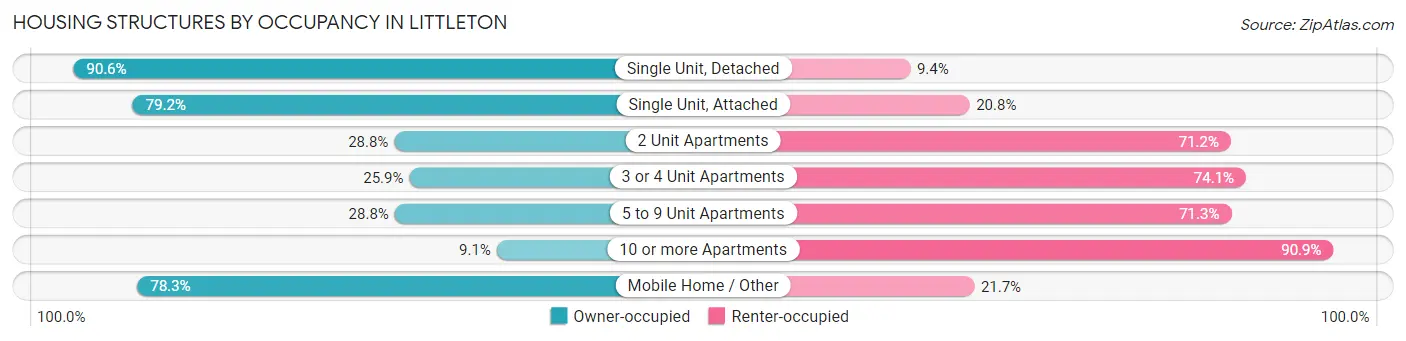
| Structure Type | Owner-occupied | Renter-occupied |
| Single Unit, Detached | 9,420 (90.6%) | 977 (9.4%) |
| Single Unit, Attached | 1,560 (79.2%) | 410 (20.8%) |
| 2 Unit Apartments | 77 (28.8%) | 190 (71.2%) |
| 3 or 4 Unit Apartments | 112 (25.9%) | 320 (74.1%) |
| 5 to 9 Unit Apartments | 353 (28.7%) | 875 (71.3%) |
| 10 or more Apartments | 532 (9.1%) | 5,308 (90.9%) |
| Mobile Home / Other | 274 (78.3%) | 76 (21.7%) |
| Total | 12,328 (60.2%) | 8,156 (39.8%) |
Housing Structures by Number of Rooms in Littleton
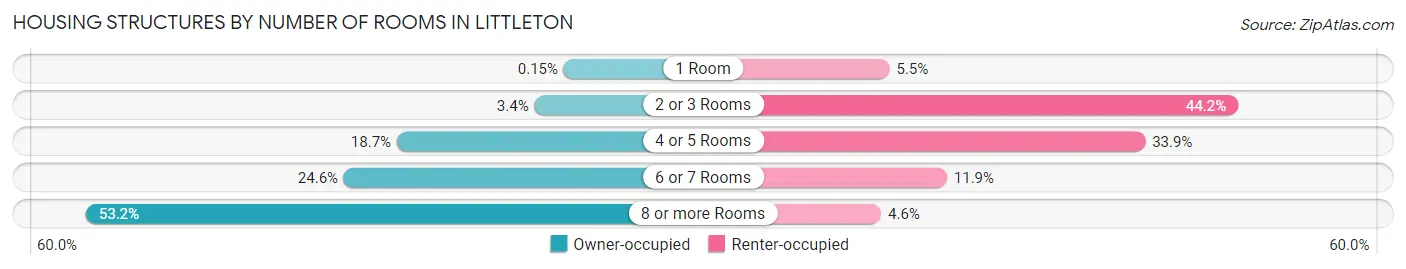
| Number of Rooms | Owner-occupied | Renter-occupied |
| 1 Room | 18 (0.2%) | 449 (5.5%) |
| 2 or 3 Rooms | 420 (3.4%) | 3,603 (44.2%) |
| 4 or 5 Rooms | 2,303 (18.7%) | 2,763 (33.9%) |
| 6 or 7 Rooms | 3,028 (24.6%) | 968 (11.9%) |
| 8 or more Rooms | 6,559 (53.2%) | 373 (4.6%) |
| Total | 12,328 (100.0%) | 8,156 (100.0%) |
Housing Structure by Heating Type in Littleton
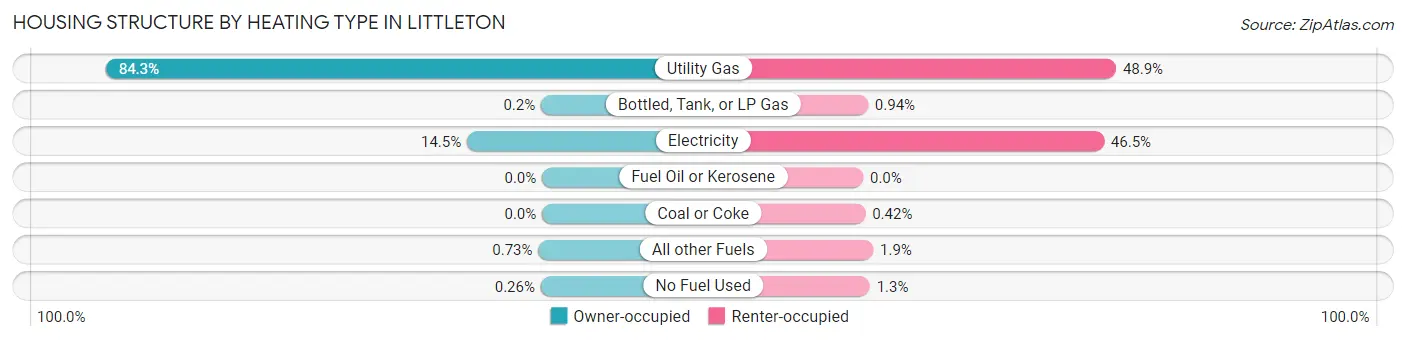
| Heating Type | Owner-occupied | Renter-occupied |
| Utility Gas | 10,393 (84.3%) | 3,986 (48.9%) |
| Bottled, Tank, or LP Gas | 25 (0.2%) | 77 (0.9%) |
| Electricity | 1,788 (14.5%) | 3,796 (46.5%) |
| Fuel Oil or Kerosene | 0 (0.0%) | 0 (0.0%) |
| Coal or Coke | 0 (0.0%) | 34 (0.4%) |
| All other Fuels | 90 (0.7%) | 158 (1.9%) |
| No Fuel Used | 32 (0.3%) | 105 (1.3%) |
| Total | 12,328 (100.0%) | 8,156 (100.0%) |
Household Vehicle Usage in Littleton
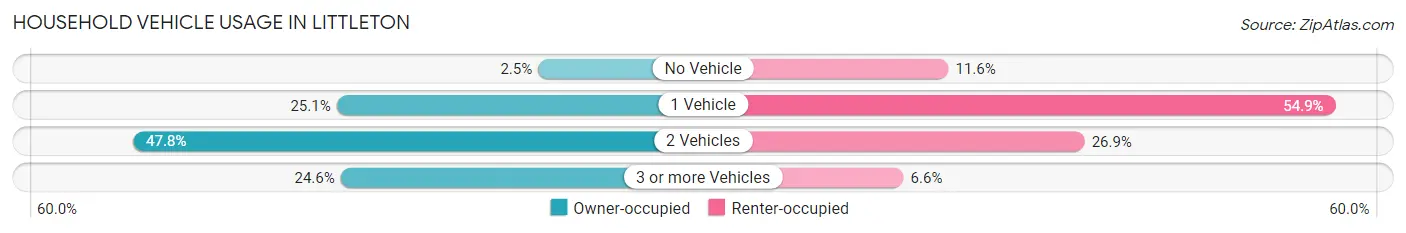
| Vehicles per Household | Owner-occupied | Renter-occupied |
| No Vehicle | 306 (2.5%) | 947 (11.6%) |
| 1 Vehicle | 3,090 (25.1%) | 4,481 (54.9%) |
| 2 Vehicles | 5,898 (47.8%) | 2,191 (26.9%) |
| 3 or more Vehicles | 3,034 (24.6%) | 537 (6.6%) |
| Total | 12,328 (100.0%) | 8,156 (100.0%) |
Real Estate & Mortgages in Littleton
Real Estate and Mortgage Overview in Littleton
| Characteristic | Without Mortgage | With Mortgage |
| Housing Units | 3,729 | 8,599 |
| Median Property Value | $539,600 | $557,000 |
| Median Household Income | $82,250 | $3,711 |
| Monthly Housing Costs | $669 | $1,896 |
| Real Estate Taxes | $2,725 | $135 |
Property Value by Mortgage Status in Littleton
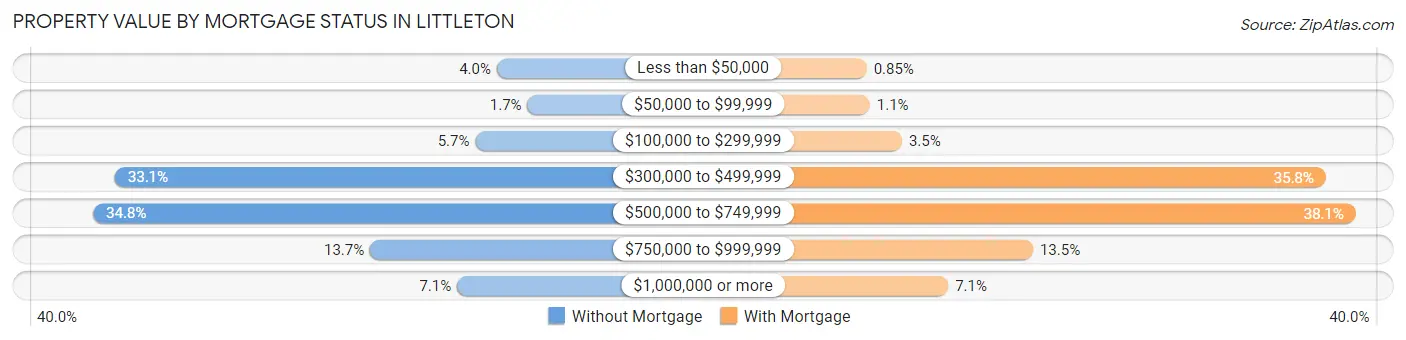
| Property Value | Without Mortgage | With Mortgage |
| Less than $50,000 | 150 (4.0%) | 73 (0.9%) |
| $50,000 to $99,999 | 63 (1.7%) | 94 (1.1%) |
| $100,000 to $299,999 | 211 (5.7%) | 304 (3.5%) |
| $300,000 to $499,999 | 1,235 (33.1%) | 3,081 (35.8%) |
| $500,000 to $749,999 | 1,297 (34.8%) | 3,277 (38.1%) |
| $750,000 to $999,999 | 510 (13.7%) | 1,163 (13.5%) |
| $1,000,000 or more | 263 (7.0%) | 607 (7.1%) |
| Total | 3,729 (100.0%) | 8,599 (100.0%) |
Household Income by Mortgage Status in Littleton
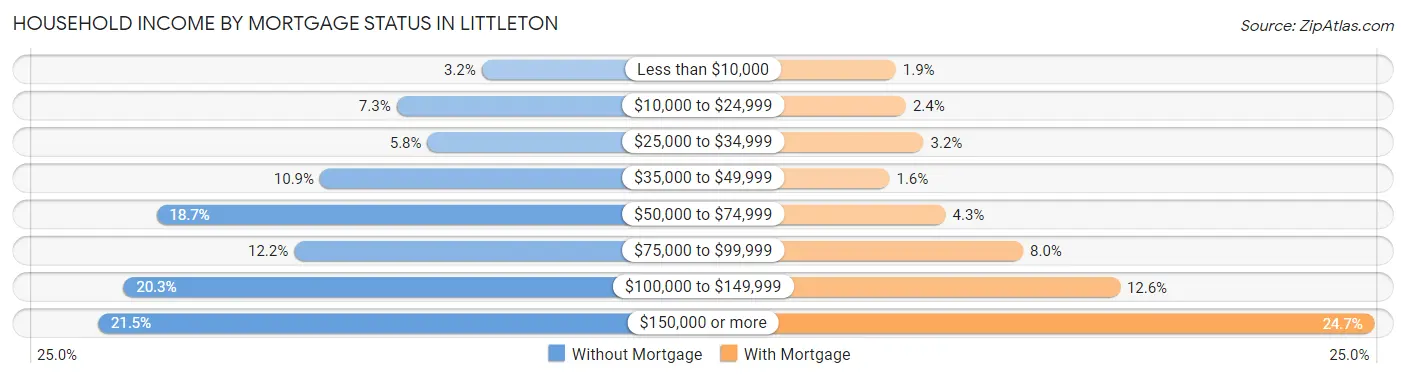
| Household Income | Without Mortgage | With Mortgage |
| Less than $10,000 | 121 (3.2%) | 165 (1.9%) |
| $10,000 to $24,999 | 272 (7.3%) | 206 (2.4%) |
| $25,000 to $34,999 | 217 (5.8%) | 279 (3.2%) |
| $35,000 to $49,999 | 408 (10.9%) | 139 (1.6%) |
| $50,000 to $74,999 | 698 (18.7%) | 369 (4.3%) |
| $75,000 to $99,999 | 454 (12.2%) | 686 (8.0%) |
| $100,000 to $149,999 | 757 (20.3%) | 1,083 (12.6%) |
| $150,000 or more | 802 (21.5%) | 2,126 (24.7%) |
| Total | 3,729 (100.0%) | 8,599 (100.0%) |
Property Value to Household Income Ratio in Littleton
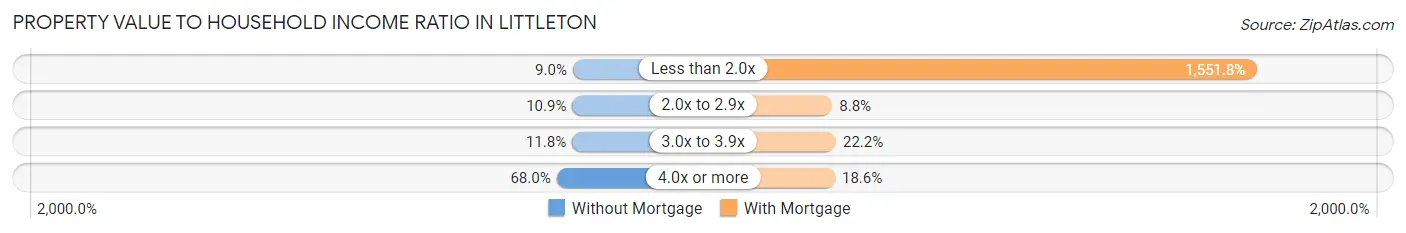
| Value-to-Income Ratio | Without Mortgage | With Mortgage |
| Less than 2.0x | 334 (9.0%) | 133,438 (1,551.8%) |
| 2.0x to 2.9x | 405 (10.9%) | 759 (8.8%) |
| 3.0x to 3.9x | 438 (11.7%) | 1,907 (22.2%) |
| 4.0x or more | 2,535 (68.0%) | 1,603 (18.6%) |
| Total | 3,729 (100.0%) | 8,599 (100.0%) |
Real Estate Taxes by Mortgage Status in Littleton
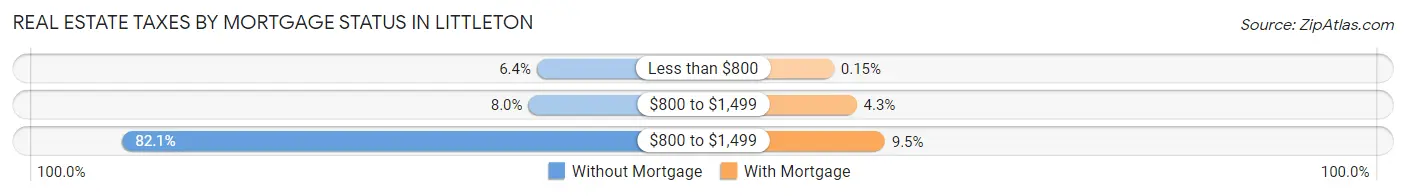
| Property Taxes | Without Mortgage | With Mortgage |
| Less than $800 | 240 (6.4%) | 13 (0.2%) |
| $800 to $1,499 | 298 (8.0%) | 370 (4.3%) |
| $800 to $1,499 | 3,063 (82.1%) | 813 (9.5%) |
| Total | 3,729 (100.0%) | 8,599 (100.0%) |
Health & Disability in Littleton
Health Insurance Coverage by Age in Littleton
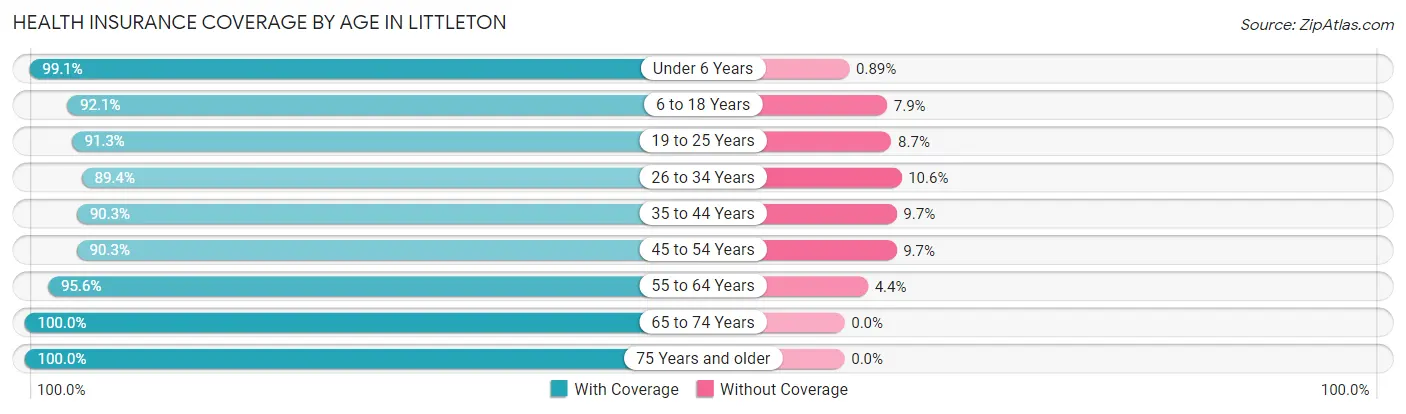
| Age Bracket | With Coverage | Without Coverage |
| Under 6 Years | 2,448 (99.1%) | 22 (0.9%) |
| 6 to 18 Years | 5,378 (92.1%) | 464 (7.9%) |
| 19 to 25 Years | 3,162 (91.3%) | 303 (8.7%) |
| 26 to 34 Years | 6,825 (89.4%) | 811 (10.6%) |
| 35 to 44 Years | 5,325 (90.3%) | 573 (9.7%) |
| 45 to 54 Years | 4,450 (90.3%) | 477 (9.7%) |
| 55 to 64 Years | 6,099 (95.6%) | 279 (4.4%) |
| 65 to 74 Years | 4,876 (100.0%) | 0 (0.0%) |
| 75 Years and older | 3,513 (100.0%) | 0 (0.0%) |
| Total | 42,076 (93.5%) | 2,929 (6.5%) |
Health Insurance Coverage by Citizenship Status in Littleton
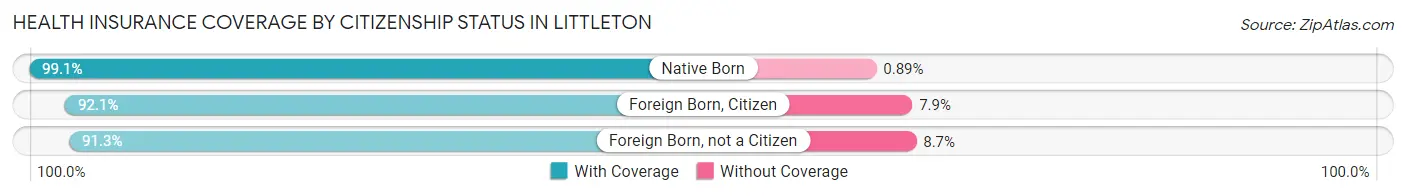
| Citizenship Status | With Coverage | Without Coverage |
| Native Born | 2,448 (99.1%) | 22 (0.9%) |
| Foreign Born, Citizen | 5,378 (92.1%) | 464 (7.9%) |
| Foreign Born, not a Citizen | 3,162 (91.3%) | 303 (8.7%) |
Health Insurance Coverage by Household Income in Littleton
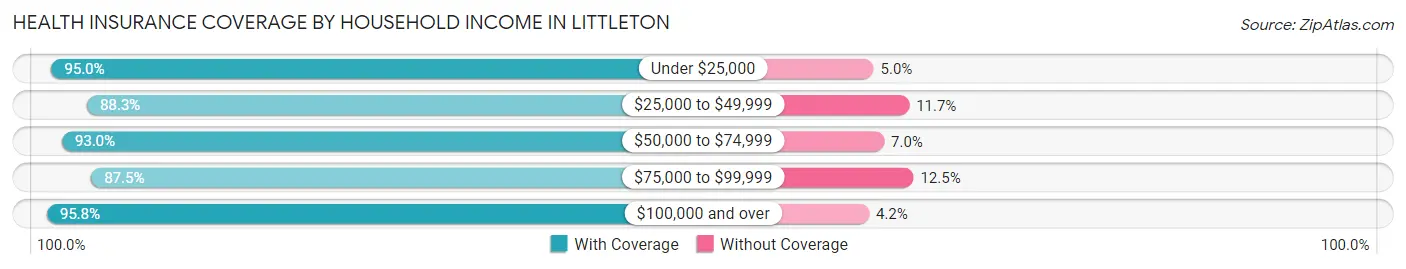
| Household Income | With Coverage | Without Coverage |
| Under $25,000 | 3,390 (95.0%) | 179 (5.0%) |
| $25,000 to $49,999 | 4,199 (88.3%) | 556 (11.7%) |
| $50,000 to $74,999 | 5,284 (93.0%) | 397 (7.0%) |
| $75,000 to $99,999 | 5,340 (87.5%) | 762 (12.5%) |
| $100,000 and over | 23,768 (95.8%) | 1,033 (4.2%) |
Public vs Private Health Insurance Coverage by Age in Littleton
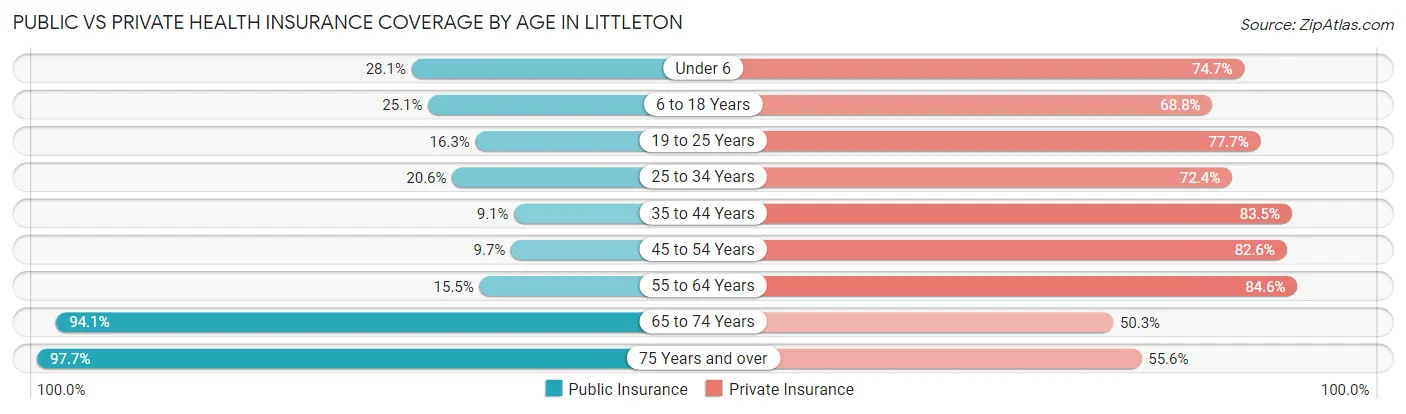
| Age Bracket | Public Insurance | Private Insurance |
| Under 6 | 695 (28.1%) | 1,845 (74.7%) |
| 6 to 18 Years | 1,464 (25.1%) | 4,018 (68.8%) |
| 19 to 25 Years | 564 (16.3%) | 2,693 (77.7%) |
| 25 to 34 Years | 1,573 (20.6%) | 5,531 (72.4%) |
| 35 to 44 Years | 536 (9.1%) | 4,926 (83.5%) |
| 45 to 54 Years | 477 (9.7%) | 4,068 (82.6%) |
| 55 to 64 Years | 991 (15.5%) | 5,394 (84.6%) |
| 65 to 74 Years | 4,589 (94.1%) | 2,454 (50.3%) |
| 75 Years and over | 3,431 (97.7%) | 1,953 (55.6%) |
| Total | 14,320 (31.8%) | 32,882 (73.1%) |
Disability Status by Sex by Age in Littleton
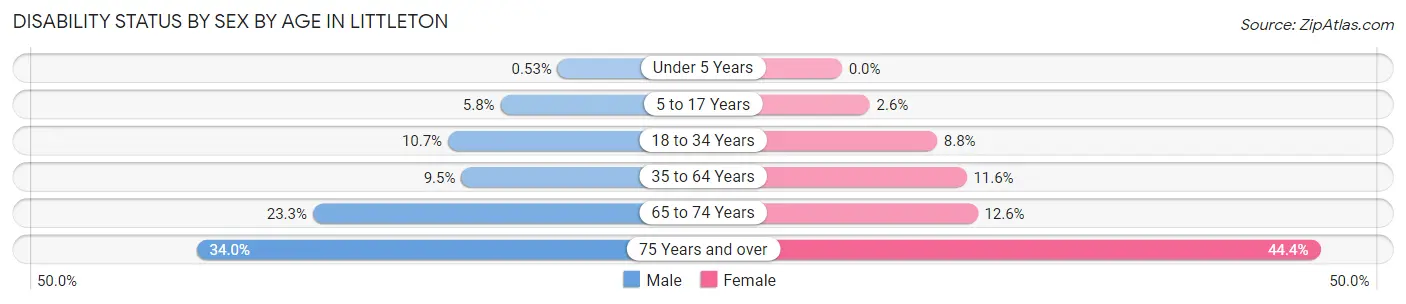
| Age Bracket | Male | Female |
| Under 5 Years | 5 (0.5%) | 0 (0.0%) |
| 5 to 17 Years | 169 (5.8%) | 82 (2.6%) |
| 18 to 34 Years | 628 (10.7%) | 492 (8.8%) |
| 35 to 64 Years | 831 (9.5%) | 975 (11.6%) |
| 65 to 74 Years | 541 (23.3%) | 321 (12.6%) |
| 75 Years and over | 472 (34.0%) | 944 (44.4%) |
Disability Class by Sex by Age in Littleton
Disability Class: Hearing Difficulty
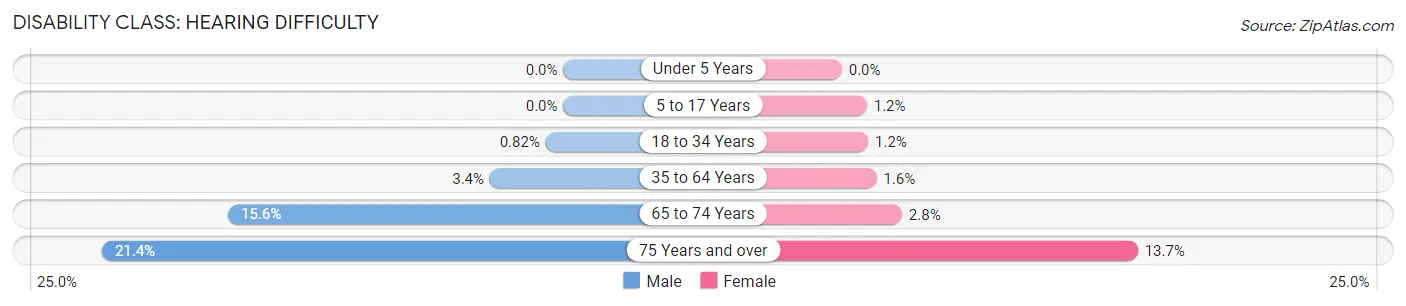
| Age Bracket | Male | Female |
| Under 5 Years | 0 (0.0%) | 0 (0.0%) |
| 5 to 17 Years | 0 (0.0%) | 37 (1.2%) |
| 18 to 34 Years | 48 (0.8%) | 68 (1.2%) |
| 35 to 64 Years | 299 (3.4%) | 136 (1.6%) |
| 65 to 74 Years | 362 (15.6%) | 71 (2.8%) |
| 75 Years and over | 297 (21.4%) | 292 (13.7%) |
Disability Class: Vision Difficulty
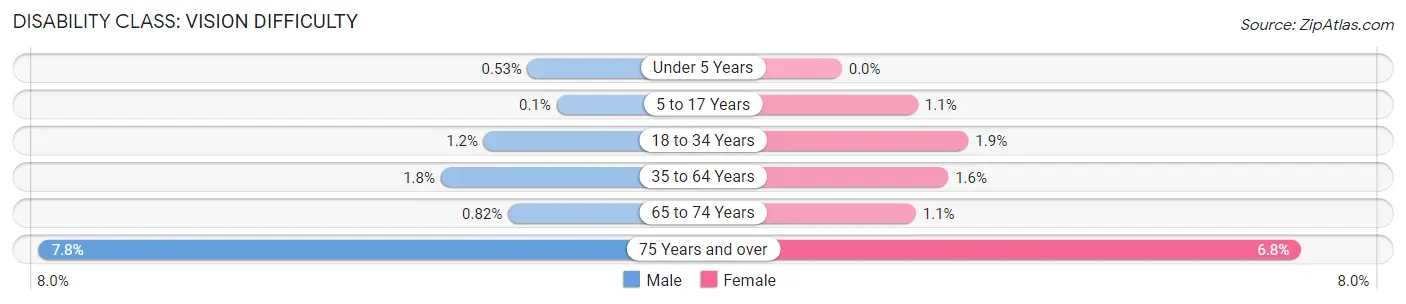
| Age Bracket | Male | Female |
| Under 5 Years | 5 (0.5%) | 0 (0.0%) |
| 5 to 17 Years | 3 (0.1%) | 36 (1.1%) |
| 18 to 34 Years | 69 (1.2%) | 105 (1.9%) |
| 35 to 64 Years | 160 (1.8%) | 133 (1.6%) |
| 65 to 74 Years | 19 (0.8%) | 28 (1.1%) |
| 75 Years and over | 108 (7.8%) | 145 (6.8%) |
Disability Class: Cognitive Difficulty
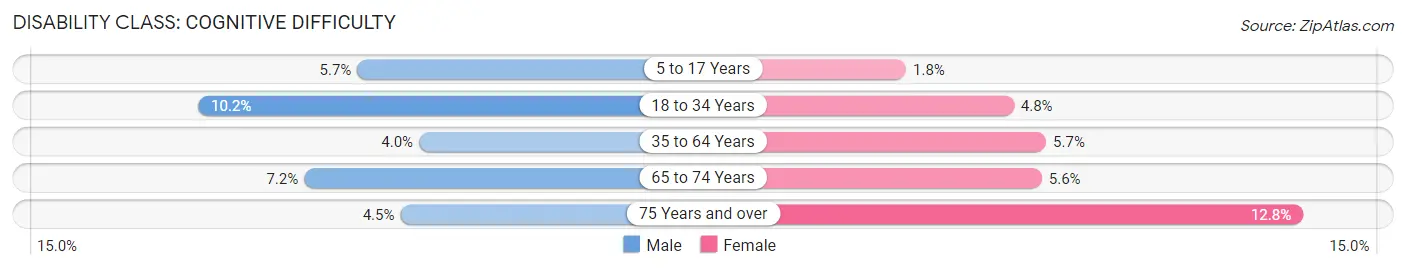
| Age Bracket | Male | Female |
| 5 to 17 Years | 166 (5.7%) | 57 (1.8%) |
| 18 to 34 Years | 596 (10.2%) | 267 (4.8%) |
| 35 to 64 Years | 353 (4.0%) | 480 (5.7%) |
| 65 to 74 Years | 168 (7.2%) | 142 (5.6%) |
| 75 Years and over | 63 (4.5%) | 273 (12.8%) |
Disability Class: Ambulatory Difficulty
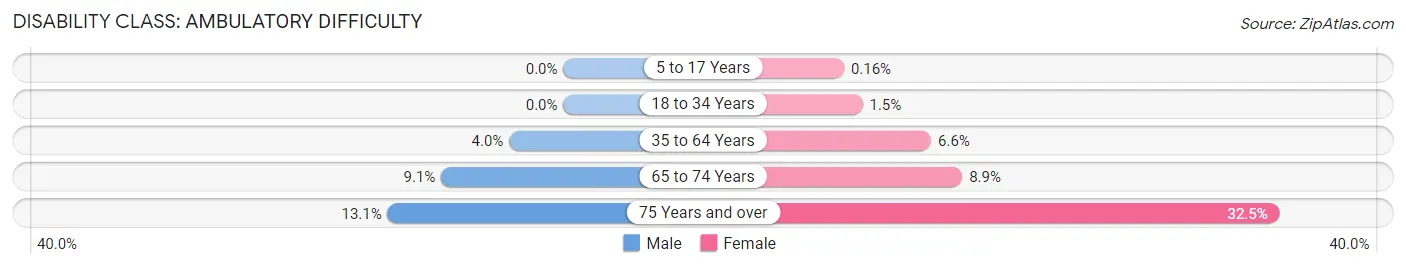
| Age Bracket | Male | Female |
| 5 to 17 Years | 0 (0.0%) | 5 (0.2%) |
| 18 to 34 Years | 0 (0.0%) | 86 (1.5%) |
| 35 to 64 Years | 353 (4.0%) | 559 (6.6%) |
| 65 to 74 Years | 211 (9.1%) | 228 (8.9%) |
| 75 Years and over | 181 (13.1%) | 691 (32.5%) |
Disability Class: Self-Care Difficulty
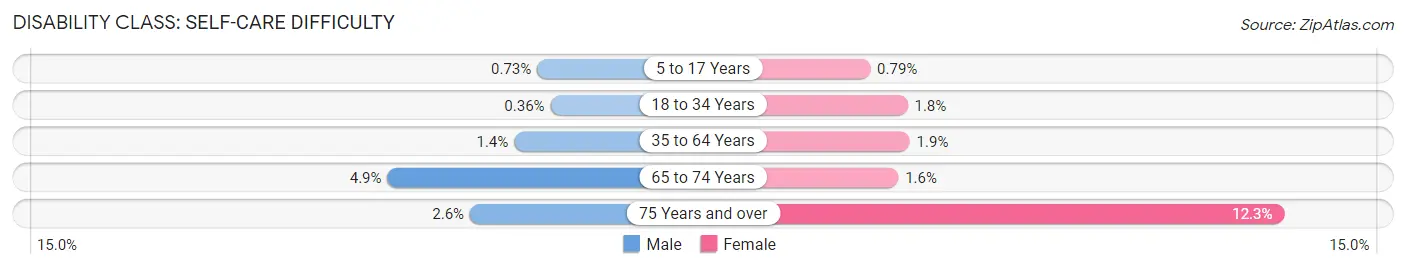
| Age Bracket | Male | Female |
| 5 to 17 Years | 21 (0.7%) | 25 (0.8%) |
| 18 to 34 Years | 21 (0.4%) | 102 (1.8%) |
| 35 to 64 Years | 120 (1.4%) | 159 (1.9%) |
| 65 to 74 Years | 114 (4.9%) | 40 (1.6%) |
| 75 Years and over | 36 (2.6%) | 262 (12.3%) |
Technology Access in Littleton
Computing Device Access in Littleton
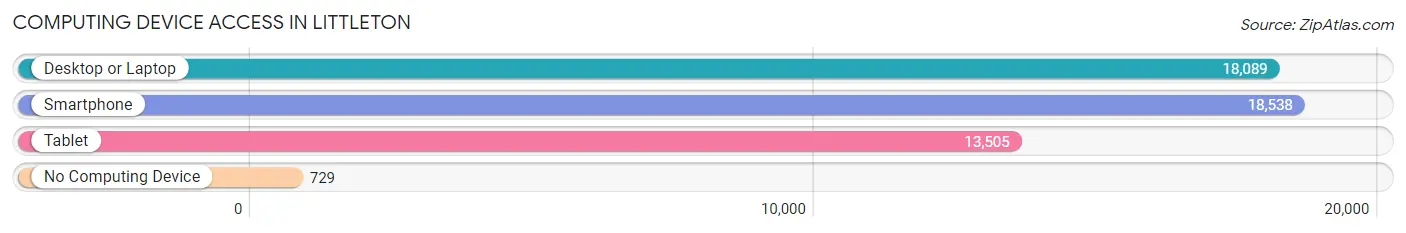
| Device Type | # Households | % Households |
| Desktop or Laptop | 18,089 | 88.3% |
| Smartphone | 18,538 | 90.5% |
| Tablet | 13,505 | 65.9% |
| No Computing Device | 729 | 3.6% |
| Total | 20,484 | 100.0% |
Internet Access in Littleton
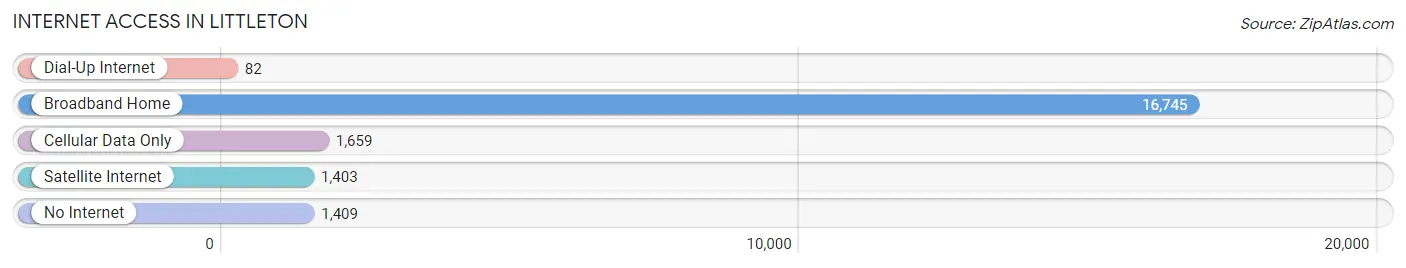
| Internet Type | # Households | % Households |
| Dial-Up Internet | 82 | 0.4% |
| Broadband Home | 16,745 | 81.8% |
| Cellular Data Only | 1,659 | 8.1% |
| Satellite Internet | 1,403 | 6.9% |
| No Internet | 1,409 | 6.9% |
| Total | 20,484 | 100.0% |
Littleton Summary
Littleton, Colorado is a city located in Arapahoe County, Colorado, United States. It is a suburb of Denver and is located approximately 10 miles south of the city. The city is situated in the foothills of the Rocky Mountains and is home to a population of approximately 45,000 people.
History
Littleton was founded in 1890 by Richard Sullivan Little, a real estate developer from Massachusetts. Little had purchased land in the area and began to develop it into a small town. He named the town after himself and it quickly grew in size and population. By the early 1900s, Littleton had become a thriving community with a population of over 1,000 people.
The city continued to grow throughout the 20th century and by the 1950s, it had become a popular suburb of Denver. In the 1970s, Littleton experienced a period of rapid growth and development, as many people moved to the area from other parts of the country. This growth continued into the 1980s and 1990s, and by 2000, the population had grown to over 45,000 people.
Geography
Littleton is located in Arapahoe County, Colorado, approximately 10 miles south of Denver. The city is situated in the foothills of the Rocky Mountains and is surrounded by several mountain ranges, including the Front Range, the Sangre de Cristo Mountains, and the Mosquito Range. The city is located at an elevation of 5,400 feet above sea level.
The city has a total area of 16.2 square miles, of which 16.1 square miles is land and 0.1 square miles is water. The city is located in a semi-arid climate zone, with hot summers and cold winters.
Economy
Littleton’s economy is largely based on the service industry, with many businesses providing services to the local population. The city is home to several large employers, including Lockheed Martin, the University of Colorado Denver, and the Denver Federal Center. The city also has a thriving retail sector, with many stores and restaurants located in the downtown area.
The city is also home to several technology companies, including Oracle, IBM, and Microsoft. The city is also home to several medical facilities, including the Littleton Adventist Hospital and the Littleton Medical Center.
Demographics
As of the 2010 census, the population of Littleton was 45,000 people. The racial makeup of the city was 87.3% White, 4.2% African American, 0.7% Native American, 2.7% Asian, 0.1% Pacific Islander, 2.3% from other races, and 2.9% from two or more races. Hispanic or Latino of any race were 8.2% of the population.
The median income for a household in the city was $60,000, and the median income for a family was $71,000. The per capita income for the city was $30,000. About 8.2% of families and 10.3% of the population were below the poverty line, including 14.2% of those under age 18 and 6.2% of those age 65 or over.
Littleton is a diverse city with a rich history and a vibrant economy. The city is home to a variety of businesses and industries, and its population is growing steadily. Littleton is a great place to live, work, and play, and it is sure to continue to be a great place to call home for many years to come.
Common Questions
What is Per Capita Income in Littleton?
Per Capita income in Littleton is $55,197.
What is the Median Family Income in Littleton?
Median Family Income in Littleton is $121,080.
What is the Median Household income in Littleton?
Median Household Income in Littleton is $90,273.
What is Income or Wage Gap in Littleton?
Income or Wage Gap in Littleton is 22.9%.
Women in Littleton earn 77.1 cents for every dollar earned by a man.
What is Family Income Deficit in Littleton?
Family Income Deficit in Littleton is $11,704.
Families that are below poverty line in Littleton earn $11,704 less on average than the poverty threshold level.
What is Inequality or Gini Index in Littleton?
Inequality or Gini Index in Littleton is 0.46.
What is the Total Population of Littleton?
Total Population of Littleton is 45,531.
What is the Total Male Population of Littleton?
Total Male Population of Littleton is 22,396.
What is the Total Female Population of Littleton?
Total Female Population of Littleton is 23,135.
What is the Ratio of Males per 100 Females in Littleton?
There are 96.81 Males per 100 Females in Littleton.
What is the Ratio of Females per 100 Males in Littleton?
There are 103.30 Females per 100 Males in Littleton.
What is the Median Population Age in Littleton?
Median Population Age in Littleton is 40.0 Years.
What is the Average Family Size in Littleton
Average Family Size in Littleton is 2.9 People.
What is the Average Household Size in Littleton
Average Household Size in Littleton is 2.2 People.
How Large is the Labor Force in Littleton?
There are 26,953 People in the Labor Forcein in Littleton.
What is the Percentage of People in the Labor Force in Littleton?
70.2% of People are in the Labor Force in Littleton.
What is the Unemployment Rate in Littleton?
Unemployment Rate in Littleton is 3.9%.